Article

The Impact of Direct and Indirect COVID-19 Related Demand Shocks on Sectoral CO2 Emissions: Evidence from Major Asia Pacific Countries

by
Muhammad Jawad Sajid
1,* and
Ernesto D. R. Santibanez Gonzalez
2
1
School of Engineering Management, Xuzhou University of Technology, Xuzhou 221000, China
2
Department of Industrial Engineering, CES4.0, Faculty of Engineering, University of Talca, Los Niches Km 1, Curicó 74104, Chile
*
Author to whom correspondence should be addressed.
Sustainability 2021, 13(16), 9312; https://0-doi-org.brum.beds.ac.uk/10.3390/su13169312
Submission received: 30 July 2021 / Revised: 14 August 2021 / Accepted: 18 August 2021 / Published: 19 August 2021

Abstract

:
COVID-19’s demand shocks have a significant impact on global CO2 emissions. However, few studies have estimated the impact of COVID-19’s direct and indirect demand shocks on sectoral CO2 emissions and linkages. This study’s goal is to estimate the impact of COVID-19’s direct and indirect demand shocks on the CO2 emissions of the Asia-Pacific countries of Bangladesh, China, India, Indonesia, and Pakistan (BCIIP). The study, based on the Asian Development Bank’s COVID-19 economic impact scenarios, estimated the impact of direct and indirect demand shocks on CO2 releases using input–output and hypothetical extraction methods. In the no COVID-19 scenario, China emitted the most CO2 (11 billion tons (Bt)), followed by India (2 Bt), Indonesia (0.5 Bt), Pakistan (0.2 Bt), and Bangladesh (0.08 Bt). For BCIIP nations, total demand shocks forced a 1–2% reduction in CO2 emissions under a worst-case scenario. Given BCIIP’s current economic recovery, a best or moderate scenario with a negative impact of less than 1% is more likely in coming years. Direct demand shocks, with a negative 85–63% share, caused most of the CO2 emissions decrease. The downstream indirect demand had only a 15–37% contribution to CO2 emissions reduction. Our study also discusses policy implications.

1. Introduction

On 11 March 2020, the WHO declared the novel COVID-19 a pandemic [1]. Almost a year later, the WHO reports that more than 2.5 million people have died as a result of COVID-19, and approximately 114 million have been diagnosed [2]. Apart from the human cost, the COVID-19 pandemic has a massive economic cost, as lockdowns have halted production and logistics operations, as well as affected demand and supply of various products [3]. Obviously, the COVID-19 pandemic has a negative impact on global CO2 emissions [4]. COVID-19-related lockdowns reduced global CO2 emissions by nearly 7.9%, with an annual reduction of 4–7% expected during the pandemic [5].
Estimating the impact of COVID-19’s direct and indirect demand shocks on CO2 emissions can help us understand how much of a target sector’s direct demand and how much indirect demand for the target sector’s products and services are responsible for COVID-19-related potential CO2 reductions. Given that emissions typically rise following a crisis [6], our estimate can assist policymakers in developing smart demand-side long-term fiscal and monetary policies by accounting for the direct and indirect effects of demand shocks on CO2 emissions from various industries. Several sectors have underlined the positive relationship between sustainability and resilience [7,8]. Thus, extending current emission reduction patterns and avoiding the anticipated increase in CO2 emissions as a result of the pandemic may aid in achieving long-term resilience, even after the CO2 reducing effects of COVID-19-related demand shocks fade in the long run and in the aftermath of the COVID-19 disaster, become more resilient by seizing the opportunity to build a genuine, sustainable resurrection (in terms of CO2 emissions reductions) [9].
A great deal of research has been done on the effects of COVID-19 demand shocks on the environment and CO2 emissions. Conversely, intermediate industrial environmental and carbon linkages have been extensively researched in order to estimate the direct and indirect sources of sectoral environmental and carbon impacts. The decomposition of COVID-19-related total demand shocks into direct and indirect demand shocks, on the other hand, has been rarely reported in the related literature. Domestic intermediate sectoral supply chain disruptions caused by demand shocks in intermediate sectoral linkages, in particular, have been rarely reported in the related literature. The goal of this study is to close these critical research gaps. This study accomplishes these goals by first categorizing intermediate sectoral linkages based on their direct and indirect carbon impact on the final demand of a specific sector. Following that, the study calculates the novel COVID-19-related direct and indirect sectoral demand shocks’ impacts on carbon emissions in key Asia-Pacific economies such as Bangladesh, China, India, Indonesia, and Pakistan (BCIIP). In this case, a target sector is isolated from the rest of the economy using the hypothetical extraction method (HEM) in order to understand the role of COVID-19-related direct and indirect demand shocks on total and sectoral-level CO2 emissions in the BCIIP countries.
The rest of the article is organized as follows: Section 2 delves into the literature on industrial carbon linkages, general COVID-19 demand shock literature, and COVID-19 CO2 emissions impacts. Section 3 introduces the material sources and explains the methodology of our research. Section 4 summarizes the findings. Section 5 discusses the findings in light of previous findings, presents policy implications, and discusses limitations and future research. Finally, Section 6 presents the conclusions of our study.

2. Literature Review

The literature review section presents some of the relevant literature on COVID-19’s economic impacts. Furthermore, this section presents the most recent literature on COVID-19’s impact on CO2 emissions. In addition, this section depicts the literature on the environmental and CO2 linkages conducted using the well-known hypothetical extraction method (HEM). The section does not go over the literature on the classical multiplier method, which is used in some studies to estimate intermediate sectoral linkages. This is because, when compared to HEM, the classical method has been shown in the literature to be a subpar approach.

2.1. COVID-19 Related Supply Chain and Production Activity Distributions

Because of the current COVID-19 pandemic, governments have been forced to restrict not only people’s movement but also economic activity [10]. This has resulted in negative demand shocks, which have had a negative impact on all industrial operations. With the negative economic impact of COVID-19-related human activity restrictions in mind, many studies have concentrated on supply chain and production activity distributions. Chowdhury et al., for example, using a multiple-case-study approach, evaluated the effects of the COVID-19 pandemic on the food and beverage industry. The study estimated both the short-term and medium-to-long-term effects of the pandemic, as well as solutions for mitigating those effects [11]. Marimuthu et al. used a fuzzy-complex proportional assessment technique to quantify the impact of COVID-19 on mining activities in India [12]. Chen et al. calculated the impact of COVID-19-related consumer demand declines on the service industry. Based on a statistical survey of 940 firms in Hangzhou City, China, the authors created a risk factor analysis of business continuity management [13]. Cui et al. used a multi-sectoral computable general equilibrium model to examine the demand and supply-side effects of the COVID-19 pandemic on China’s transportation sectors [14]. Aside from specific sectors, several studies have also focused on the impact of COVID-19 related disruptions on entire supply chains. For instance, Shaheed et al. created a mathematical model to manage COVID-19-related supply chain interruptions in a three-stage supply chain network comprising suppliers, manufacturers, and retailers [15]. Karmaker et al. explored the drivers of a sustainable supply chain to address COVID-19-related supply chain disruptions in such a pandemic in Bangladesh [16]. Chowdhury et al. conducted a comprehensive review of the 74 relevant articles on COVID-19 related supply chain disruptions. As per their findings, the main methodologies used in these 74 articles are as follows; 31 articles based on author’s opinions; 27 articles focused on quantitative methodologies including simulation modelling, game-theoretical modelling, mixed-integer linear modelling, non-linear modelling, stochastic optimization, integrated mathematical and simulation model, principal component analysis and cluster analysis, and one study applied stepwise weight assessment ratio analysis; and 10 articles were focused on literature review.

2.2. COVID-19’s Environmental and CO2 Emissions Impact

Furthermore, numerous studies have been conducted on the various environmental aspects of COVID-19. The effects of COVID-19 on air pollution [17,18,19,20,21], the circular economy [1,9,22], sustainability [4,23,24], waste management [25,26], water use [27], renewable and green energy [28,29], climate change [30], transportation [31], and public awareness [32] have been extensively studied. Several studies, in particular, have estimated the COVID-19 pandemic’s impact on CO2 emission reductions. Turner et al., for example, estimated the observed impact of the COVID-19 lockdown on six counties in the United States’ “San Francisco Bay” region [33]. Based on satellite observations, Zheng et al. calculated China’s CO2 emissions during the COVID-19 pandemic [34]. Han et al. estimated the effect of COVID-19 on China’s CO2 emissions using national economic data [35]. Using real-time activity data, Liu et al. estimated the impact of COVID-19 on global CO2 emissions from various sectors [36]. Quéré et al. estimated the temporary daily reductions in CO2 emissions caused by the COVID-19 pandemic using government policy and activity data [37]. Shan et al. estimated the effect of COVID-19 on global CO2 emissions and supply chains using a multi-regional input–output model [38]. Quéré et al. forecasted post-COVID-19 CO2 emissions from fossil fuels [6].

2.3. Sectoral Environmental and Carbon Linkages

Both classical and more recent HEM have been widely used to estimate intermediate sectoral environmental linkages including water, energy, air pollutant, and CO2 linkages within and across economies. The HEM is generally regarded as the superior option because it allows us to estimate the relative magnitude of an industry’s (sector’s) economic (environmental) impact by removing it from a specific economy [39]. The modified hypothetical extraction method (MHEM) [40] is the most commonly used type of HEM at the moment. Blanco et al. assessed cross-temporal direct and indirect water yield in the Spanish region of Castile and León using the MHEM modeling technique [41]. Deng et al. calculated China’s intermediate sectoral water trade (linkages) using the HEM approach [42]. Duarte et al. estimated the sectoral water linkages in Spain using the MHEM [40]. Guerra and Sancho used the HEM to calculate the sectoral energy links in Spain [43]. He et al. calculated the air pollutant links in China using the MHEM technique [44]. Using the MHEM technique, Wang et al. quantified the air pollutant sectoral linkages in China [45].
The MHEM can assist us in estimating an economy’s various net carbon linkages [46]. Several studies have employed the MHEM approach to estimate the sectoral CO2 linkages for different economies and sectors. For example, Sajid et al. estimated the sectoral CO2 linkages of India from different types of energy and non-energy uses using the original, Cella’s [47], and modified HEM [39]. Sajid et al. used the MHEM to calculate the CO2 linkages of the transport sectors of the EU’s top carbon emitting nations [46]. Using the MHEM, Bai et al. calculated China’s industrial CO2 linkages [48]. Sajid et al. estimated Turkey’s demand and supply-driven CO2 linkages using the original, modified, and hybrid HEM [49]. Zhao et al. estimated China’s inter-regional sectoral CO2 linkages using the HEM [50]. Using the MHEM, Sajid et al. embedded Chinese industrial consumption-induced CO2 emissions into the household final demand [51]. Ali estimated Italy’s sectoral CO2 linkages using the classical multiplier, Cella, and the original HEM approaches [52]. Sajid estimated the drivers of Chinese households’ induced intermediate sectoral CO2 consumption emissions using MHEM in conjunction with structural decomposition and regional sensitivity analyses [53]. Sun et al. estimated China’s weighted backward and forward linkages using the “absolute weighted measurement” technique [54]. Sajid et al. calculated the mining sector carbon linkages of the world’s ten largest economies [55]. Sajid estimated Pakistan’s CO2 linkages and the impact of final demand on sectoral CO2 linkages using the MHEM and hypothetical extraction of final demand (HEOFD) methods [56].

2.4. Research Gaps and Significance

Despite the fact that significant work has been done in general on COVID-19-related impacts on supply chain and production activities, as well as CO2 emissions, much research has focused on sectoral environmental and carbon linkages. However, the following significant research gaps remain in the related literature. (1) The literature on COVID-19-related general economic activities and CO2 emission reductions does not usually divide total demand shocks into direct and indirect demand shocks. (2) The literature on the impact of COVID-19 on economic activities in general, and CO2 reductions in particular, does not typically classify the role of domestic intermediate sectoral supply chain disruptions based on the influence of direct and indirect demand shocks. (3) Traditionally, the literature on sectoral environmental and carbon linkages does not take into account the effects of direct and indirect demand shocks on intermediate sectoral linkages. (4) The case of the majority of BCIIP countries, with the exception of China, under COVID-19-related CO2 reductions has largely gone unstudied in the related literature.
This study addresses the aforementioned research gaps in the following ways. First, our study disaggregates COVID-19-demand-shock-related impacts into direct and indirect demand shock impacts within an economy, which are rarely investigated in the related literature (A sector’s direct CO2 emissions can be further subdivided into internal and forward (downstream) emissions. Current assessments of COVID-19’s impact on CO2 emissions overlook a critical factor: the extent to which indirect demand from other sectors can help a sector reduce its CO2 emissions, particularly when their demand is influenced by unexpected demand shocks such as the ongoing disaster of COVID-19). Second, the study categorizes intermediate sectoral supply chain disruptions based on the direct and indirect effects of sectoral final demand. These are not normally classified in both the general literature on sectoral environmental linkages and the COVID-19 economic and environmental impacts literature (Where a target sector’s internal linkages are driven by their own demand, which means their value is directly dependent on their own final demand value or demand shocks. However, forward, or downstream linkages, are more complicated, as they are not driven by a sector’s own demand but rather by the demand of the sector’s downstream importing sectors. As a result, these forward CO2 linkages depict the effect of indirect industrial demand on a sector’s CO2 emissions). Third, this study modifies the MHEM approach and introduces the impact of COVID-19-related direct and indirect demand shocks on intermediate sectoral linkages. Fourth, this study estimates the impact of COVID-19’s direct and indirect demand shocks on CO2 emissions in the major developing Asian economies of Bangladesh, China, India, Indonesia, and Pakistan (BCIIP) using the single regional input–output model (SRIO) and the Asian Development Bank’s (ADB) COVID-19 economic impact scenarios. COVID-19 has had the greatest impact on developing economies [4]. BCIIP countries are interesting cases not only because they are among the most important developing economies, but also because they are among the most populated, with approximately 45% of the world’s population residing in BCIIP [57], and from an environmental standpoint, they are among the most polluted nations [58].
The estimation of COVID-19 pandemic effects on the world’s most populated and polluted developing region can not only help with this region’s future carbon policy but also serve as a model for other countries. Second, by estimating the effects of demand shocks on inter- and intra-sectoral CO2 linkages, this study advances sectoral linkage estimation methods, particularly the HEM. Third, the study clarifies the concept of direct and indirect demand and demand shocks in the context of a country’s domestic economy. Appendix A Table A1 lists the full names of the sectoral abbreviations used in our study.

3. Materials and Methods

3.1. Materials

The data on the potential economic impact of COVID-19 on the various primary sectors of BCIIP countries were derived from the ADB’s “COVID-19 Economic Impact Assessment Template” [59]. The data, updated on 10 March 2020, contain the most comprehensive information on the expected economic impact of COVID-19 under various scenarios. As a result, the March version was used in this study to estimate COVID-19’s direct and indirect demand shock impact on CO2 emissions in BCIIP nations. In this version, the potential economic and sector-specific demand shock impact of the COVID-19 outbreak is presented in relation to the length of travel restrictions and steep decline in domestic demand. The ADB presents feasible scenarios for the best-case scenario for two months, the moderate case scenario for three months, the worst-case scenario for six months, and the hypothetical worst-case scenario for six months plus a three-month outbreak. The input–output (IO) data required to estimate the intermediate effects of COVID-19-related economic shocks were obtained from the EORA MRIO database’s national IO tables [60]. The most recent year, 2015, tables and related CO2 emissions accounts from EDGAR were used as a proxy for current CO2 emissions. In order to correspond with the ADB’s sectoral classification, the national IO tables were aggregated as shown in Supplementary Tables S1–S5. Other recent research on developing economies’ sectoral CO2 linkages has also preferred the use of the EORA MRIO database [56].

3.2. Methods

3.2.1. Environmentally Extended Input–Output Model

The Wasley W. Leontief input–output model [61] is commonly used as the foundation of the HEM method, which is used in this study to estimate sectoral CO2 linkages. The following is the basic equation for the environmentally extended input–output model.
C N = t N ( I A N ) 1 D N
where C N denotes the CO2 emissions of a specific nation, N . The intensity of the country’s sectoral carbon emissions is denoted by t N . I shows the appropriate size identity matrix. The country’s intermediate technology matrix is represented by A N . The Leontief inverse matrix of the country N is represented by L N = ( I A N ) . And D N is the country’s final demand for sectoral products and services. The t N is simply calculated by dividing country N s total CO2 emissions by country N s . total output.
t r N = C r N X r N
where t r N represents the intensity of CO2 emissions from sector r in the country N . C r N represents the total carbon emissions of sector r from the country N . And X r N is the total output of the country’s sector r .

3.2.2. Decomposition of the National Economy into the Target and Other Sectors

To estimate the sectoral carbon linkages, an economy should be divided into two groups, one representing the target sector r and the other representing the remaining sectors r .
[ C r N C r N ] = [ t r N 0 0 t r N ] [ ( I A r , r N ) 1 ( I A r , r N ) 1 ( I A r , r N ) 1 ( I A r , r N ) 1 ] [ D r N D r N ]     = [ t r N 0 0 t r N ] [ L r , r N L r , r N L r , r N L r , r N ] [ D r N D r N ]
where [ C r N C r N ] represents the total carbon emissions of the country N s target sector r and other sectors r . [ t r N 0 0 t r N ] displays the carbon emission intensity of the country’s target and non-target sectors. [ L r N L r N ] = [ L r , r N L r , r N L r , r N L r , r N ] depicts the Leontief inverse matrix for country N s target and remaining sectors. And [ D r N D r N ] presents the final demand for the country’s target and other sectors.

3.2.3. Decomposition of Direct and Indirect Demand-Induced Emissions

A sector’s direct CO2 emissions are roughly equal to those induced by its internal and forward carbon links. Thus, direct CO2 emissions can be decomposed into intra-sectoral emissions resulting from direct final demand for a sector’s products and services and the forward CO2 emissions embedded in the final demand of downstream purchasing sectors. After reclassifying a country’s economy into target and non-target sectors, we can easily decompose the target sector’s total direct emissions into internal emissions caused by the sector’s own use, which is driven by final demand for its products or services and forward emissions caused by purchases by downstream importers of the sector’s products or services, driven by the respective demands of various downstream importing sectors.
I C r N = t r N ( I A r , r N ) 1 D r N
F C r N = t r N L r , r N D r N
C r N = I C r N + F C r N
where I C r N and F C r N represent the country N s internal and forward carbon linkages, respectively. C r N represents the target sector’s direct CO2 emissions. Forward carbon emissions can be further decomposed into sectoral destinations, i.e., the downstream indirect influencers of target sector CO2 emissions. Assume sector d is one of the sectors in the group representing non-target sectors r . The virtual carbon export from the target sector r to the purchasing sector d can then be represented by the following equation.
F C r N = d = 0 n 1 F C r d N

3.2.4. CO2 Emissions Estimations after Adjusting for Direct and Indirect Demand Shocks

The above-mentioned Equations (4) and (5) can be modified to present the new emissions after adjusting for the potential COVID-19-related sectoral demand shocks on sectoral carbon linkages under various scenarios.
I C r N ¯ = t r N ( I A r , r N ) 1 D r N ¯
F C r N ¯ = t r N L r , r N D r N ¯
where I C r N ¯ and F C r N ¯ represent the new internal and forward carbon linkages, respectively, after adjusting for negative demand shocks in the value of final demand. D r N ¯ and D r N ¯ show the decrease in demand in the target and other sectors as a result of the COVID-19-related lockdown and other measures. The ADB employs the “no-COVID baseline” scenario to estimate the relative decrease in demand in other COVID-19 impact scenarios. The authors used the ADB’s COVID-19 related demand impact indicator for different scenarios to estimate the impact of decreases on the direct and indirect sectoral linkages of the BCIIP countries.

3.2.5. Estimation of the Impact of Direct and Indirect Demand Shocks

The total demand shock’s impact on CO2 emissions can be expressed simply as the difference between the baseline no COVID-19 emissions and the emissions after adjusting for demand shocks under a specific scenario.
Δ C r N = Δ I C r N + Δ F C r N = F C r N F C r N ¯ = ( I C r N I C r N ¯ ) + ( F C r N F C r N ¯ )
The following equations can be used to estimate the percentage contribution of direct and indirect demand shocks to total direct CO2 reductions for a given scenario.
% D D S r = Δ I C r N Δ C r N
% I D S r = Δ F C r N Δ C r N
where % D D S r and % I D S r represent the percentage contribution of direct and indirect demand shocks to total direct CO2 emissions reduction in a given scenario.

4. Results

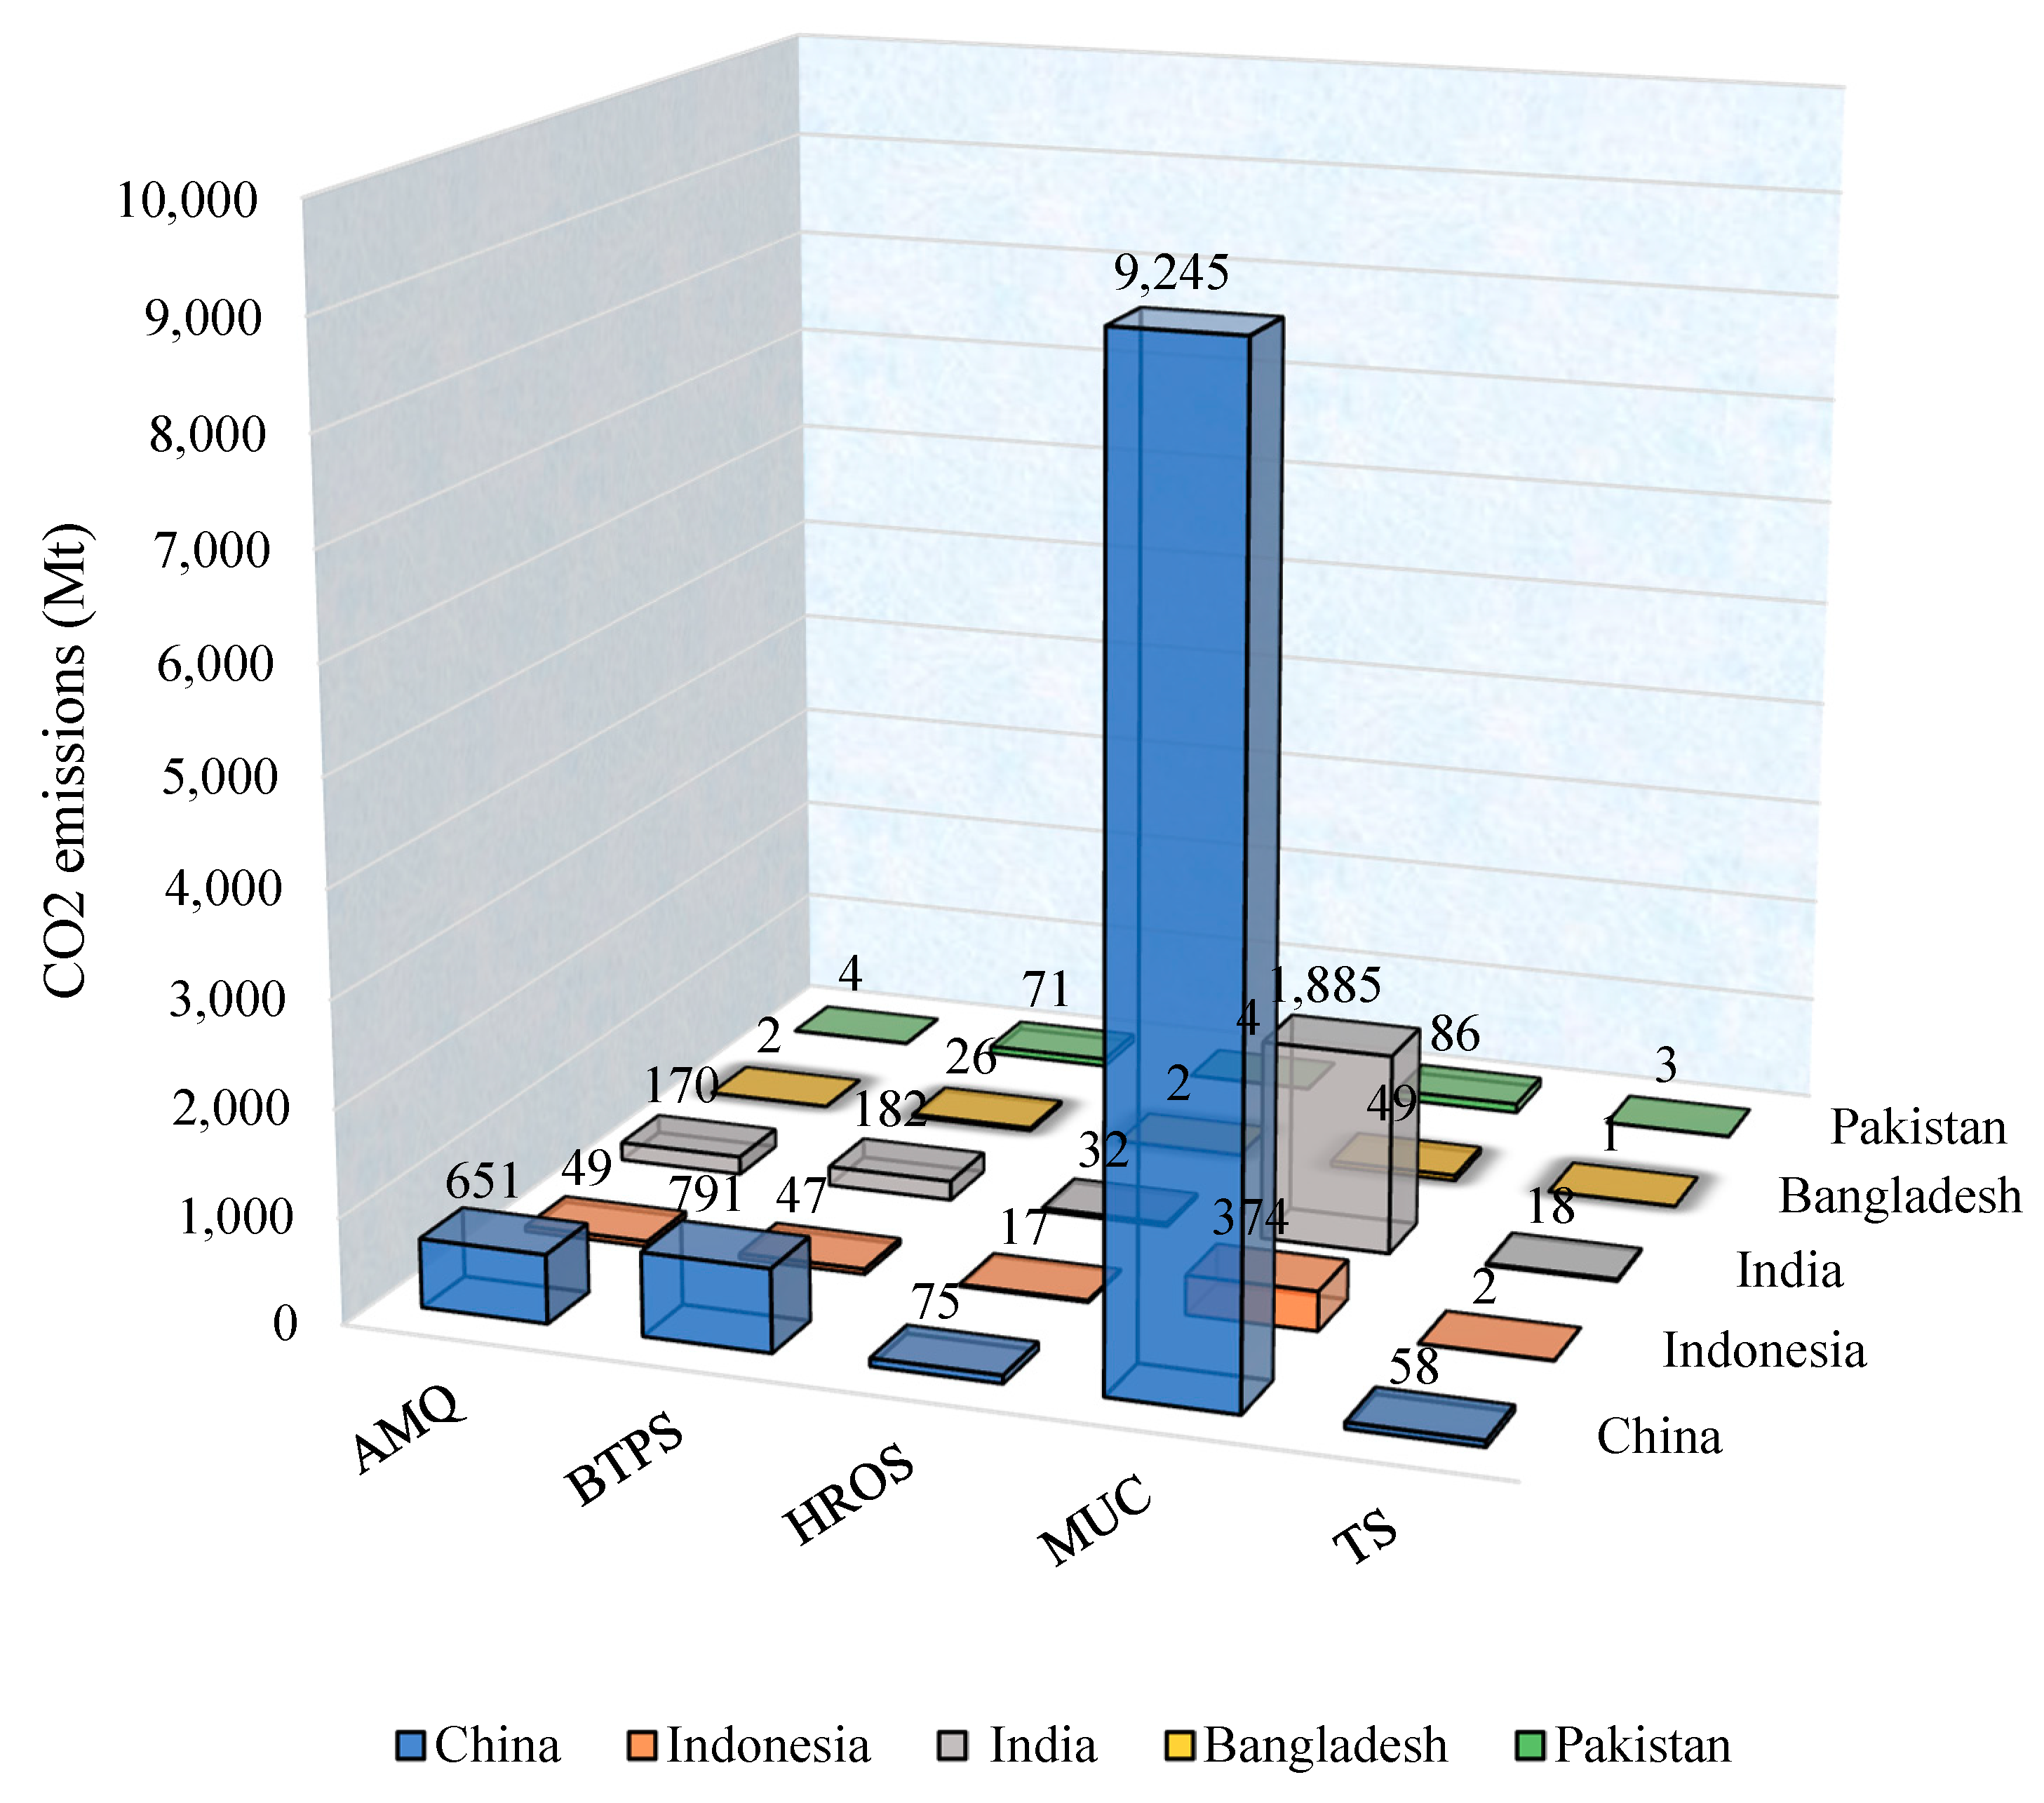
4.1. Direct CO2 Emissions under the Baseline (No COVID-19) Scenario

Figure 1 depicts the direct sectoral CO2 emissions of the respective countries. As illustrated in Figure 1, China had the highest total CO2 emissions of all nations. It was followed by the countries of India, Indonesia, Pakistan, and Bangladesh. The MUC sector contributed the most to total national CO2 emissions in Bangladesh, China, India, Indonesia, and Pakistan, accounting for 61 % ,   85 % ,   82 % ,   76 % , and 51 % , respectively. BTPS accounted for the second highest proportion of national CO2 emissions in Bangladesh, China, India, and Pakistan, accounting for 33 % ,   7 % ,   8 % , and 42 % , respectively. However, Indonesia’s AMQ sector was the second highest emitter, accounting for nearly 10 % of total national emissions.

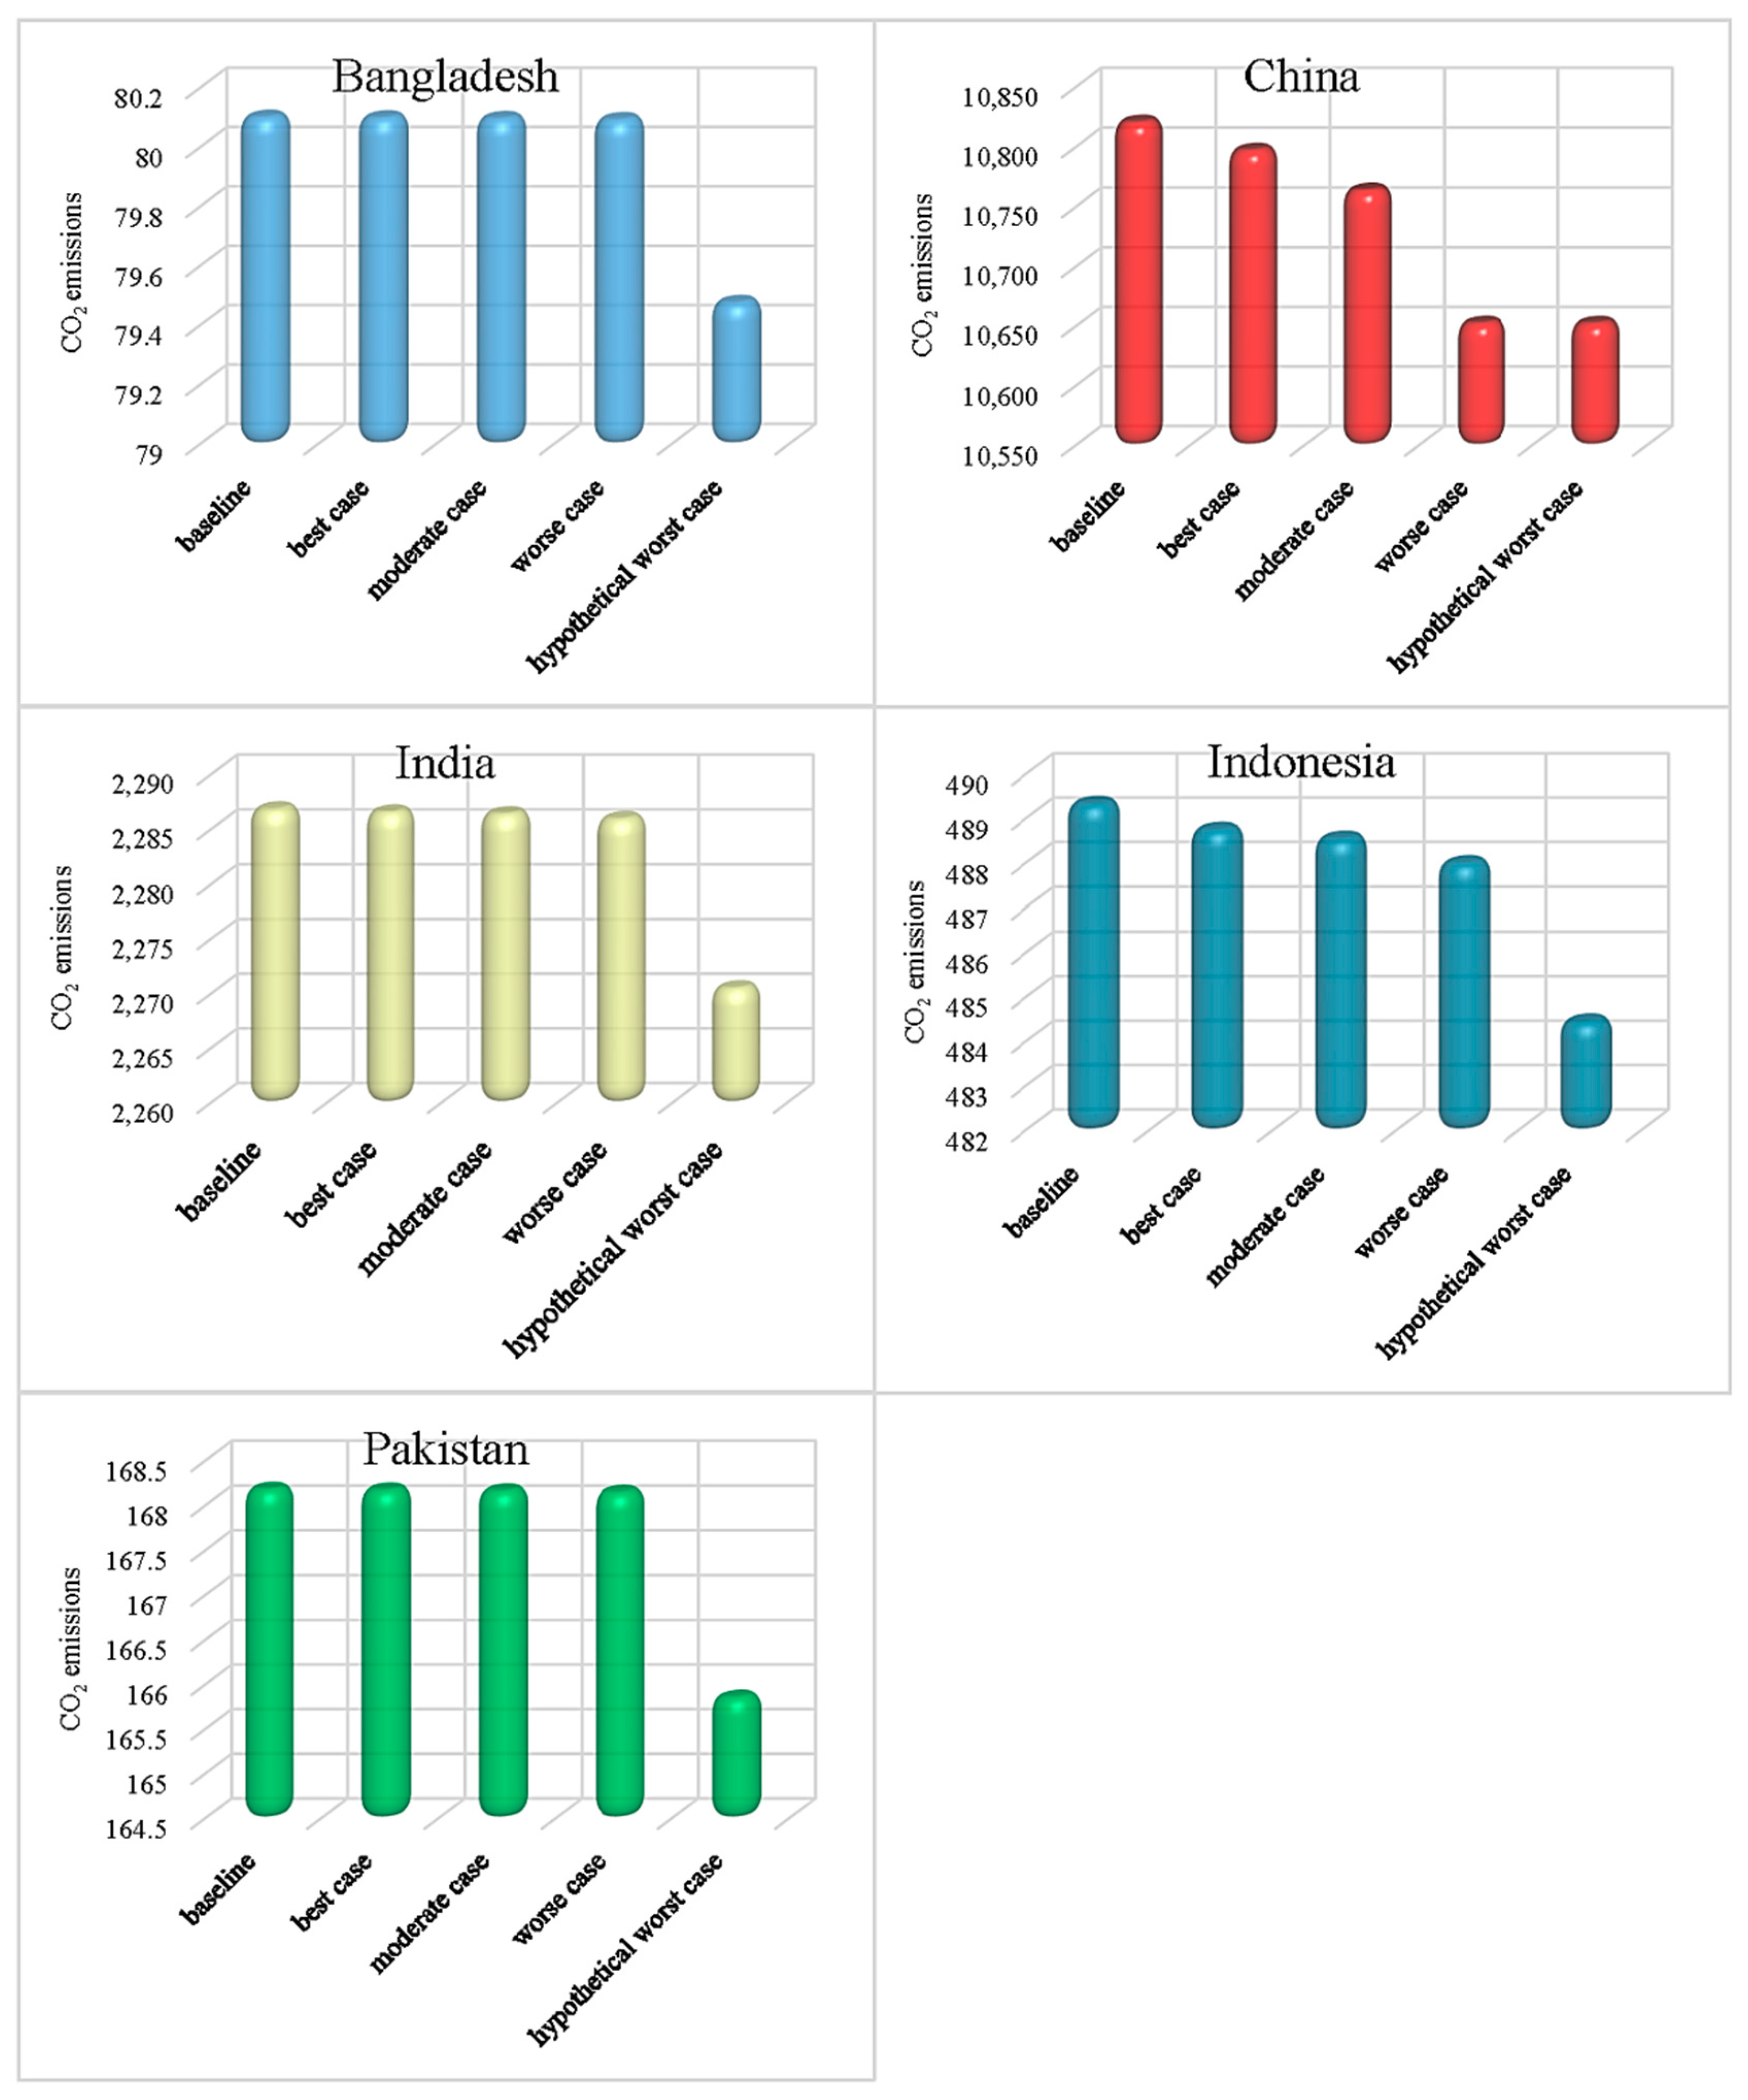
4.2. The Impact of Negative Total Demand Shocks on Country-Wide and Sectoral CO2 Releases

Figure 2 depicts the effects of expected demand shocks on aggregate CO2 emissions by country under various scenarios. Appendix A Table A2 presents the effects of demand shocks on sectoral CO2 emissions under various scenarios. Apart from the worst-case scenario, no other scenario had a significant negative impact on CO2 emissions in Bangladesh, India, or Pakistan, as illustrated in Figure 2. However, when compared with the baseline scenario (no COVID-19), all other scenarios resulted in significant CO2 emission reductions for China and Indonesia. Whereas negative demand shocks had the greatest potential to reduce China’s overall CO2 emissions in the worst-case and hypothetical worst-case scenarios, with an impact of approximately 2 % . However, for Indonesia, the worst-case scenario with a negative demand shock of approximately 1 % had the greatest negative impact on CO2 emission reductions. When compared to the baseline scenario, negative demand shocks had the greatest impact on the BTPS and MUC sectors in Bangladesh and Pakistan. Under various scenarios, negative demand shocks had a significant impact on China and India’s MUC sectors, as well as on Indonesia’s MUC and HROS sectors.

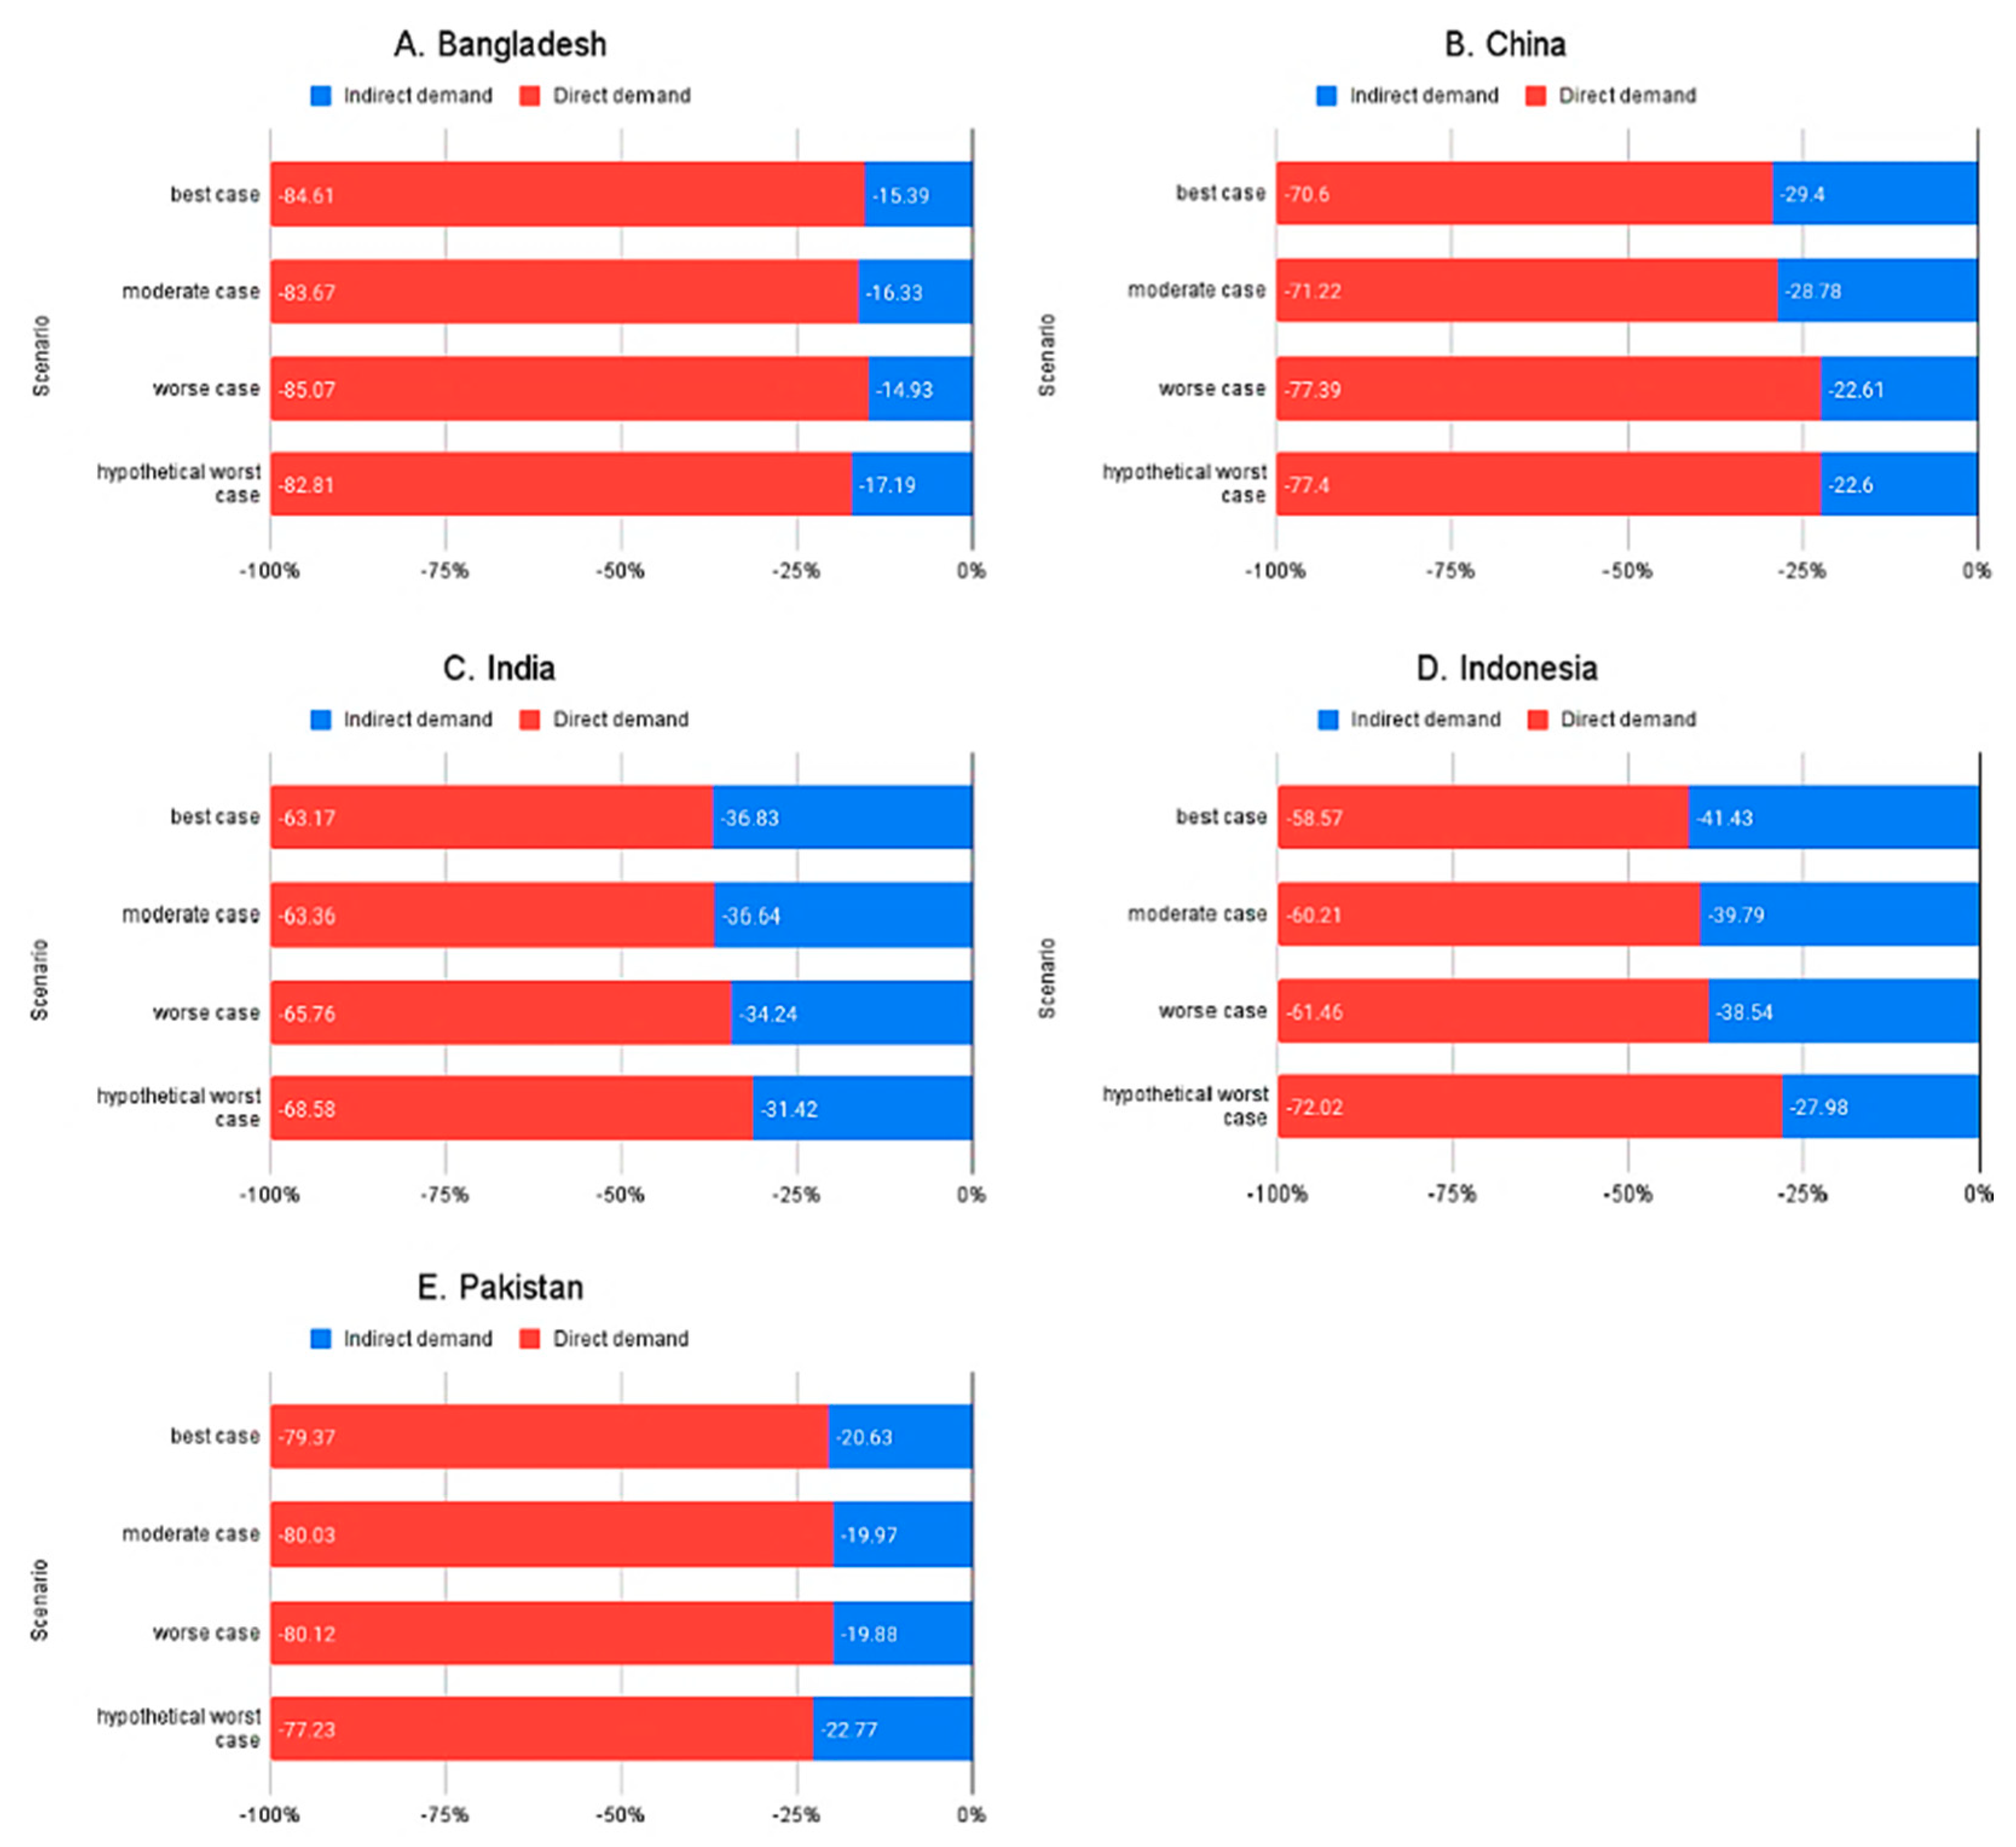
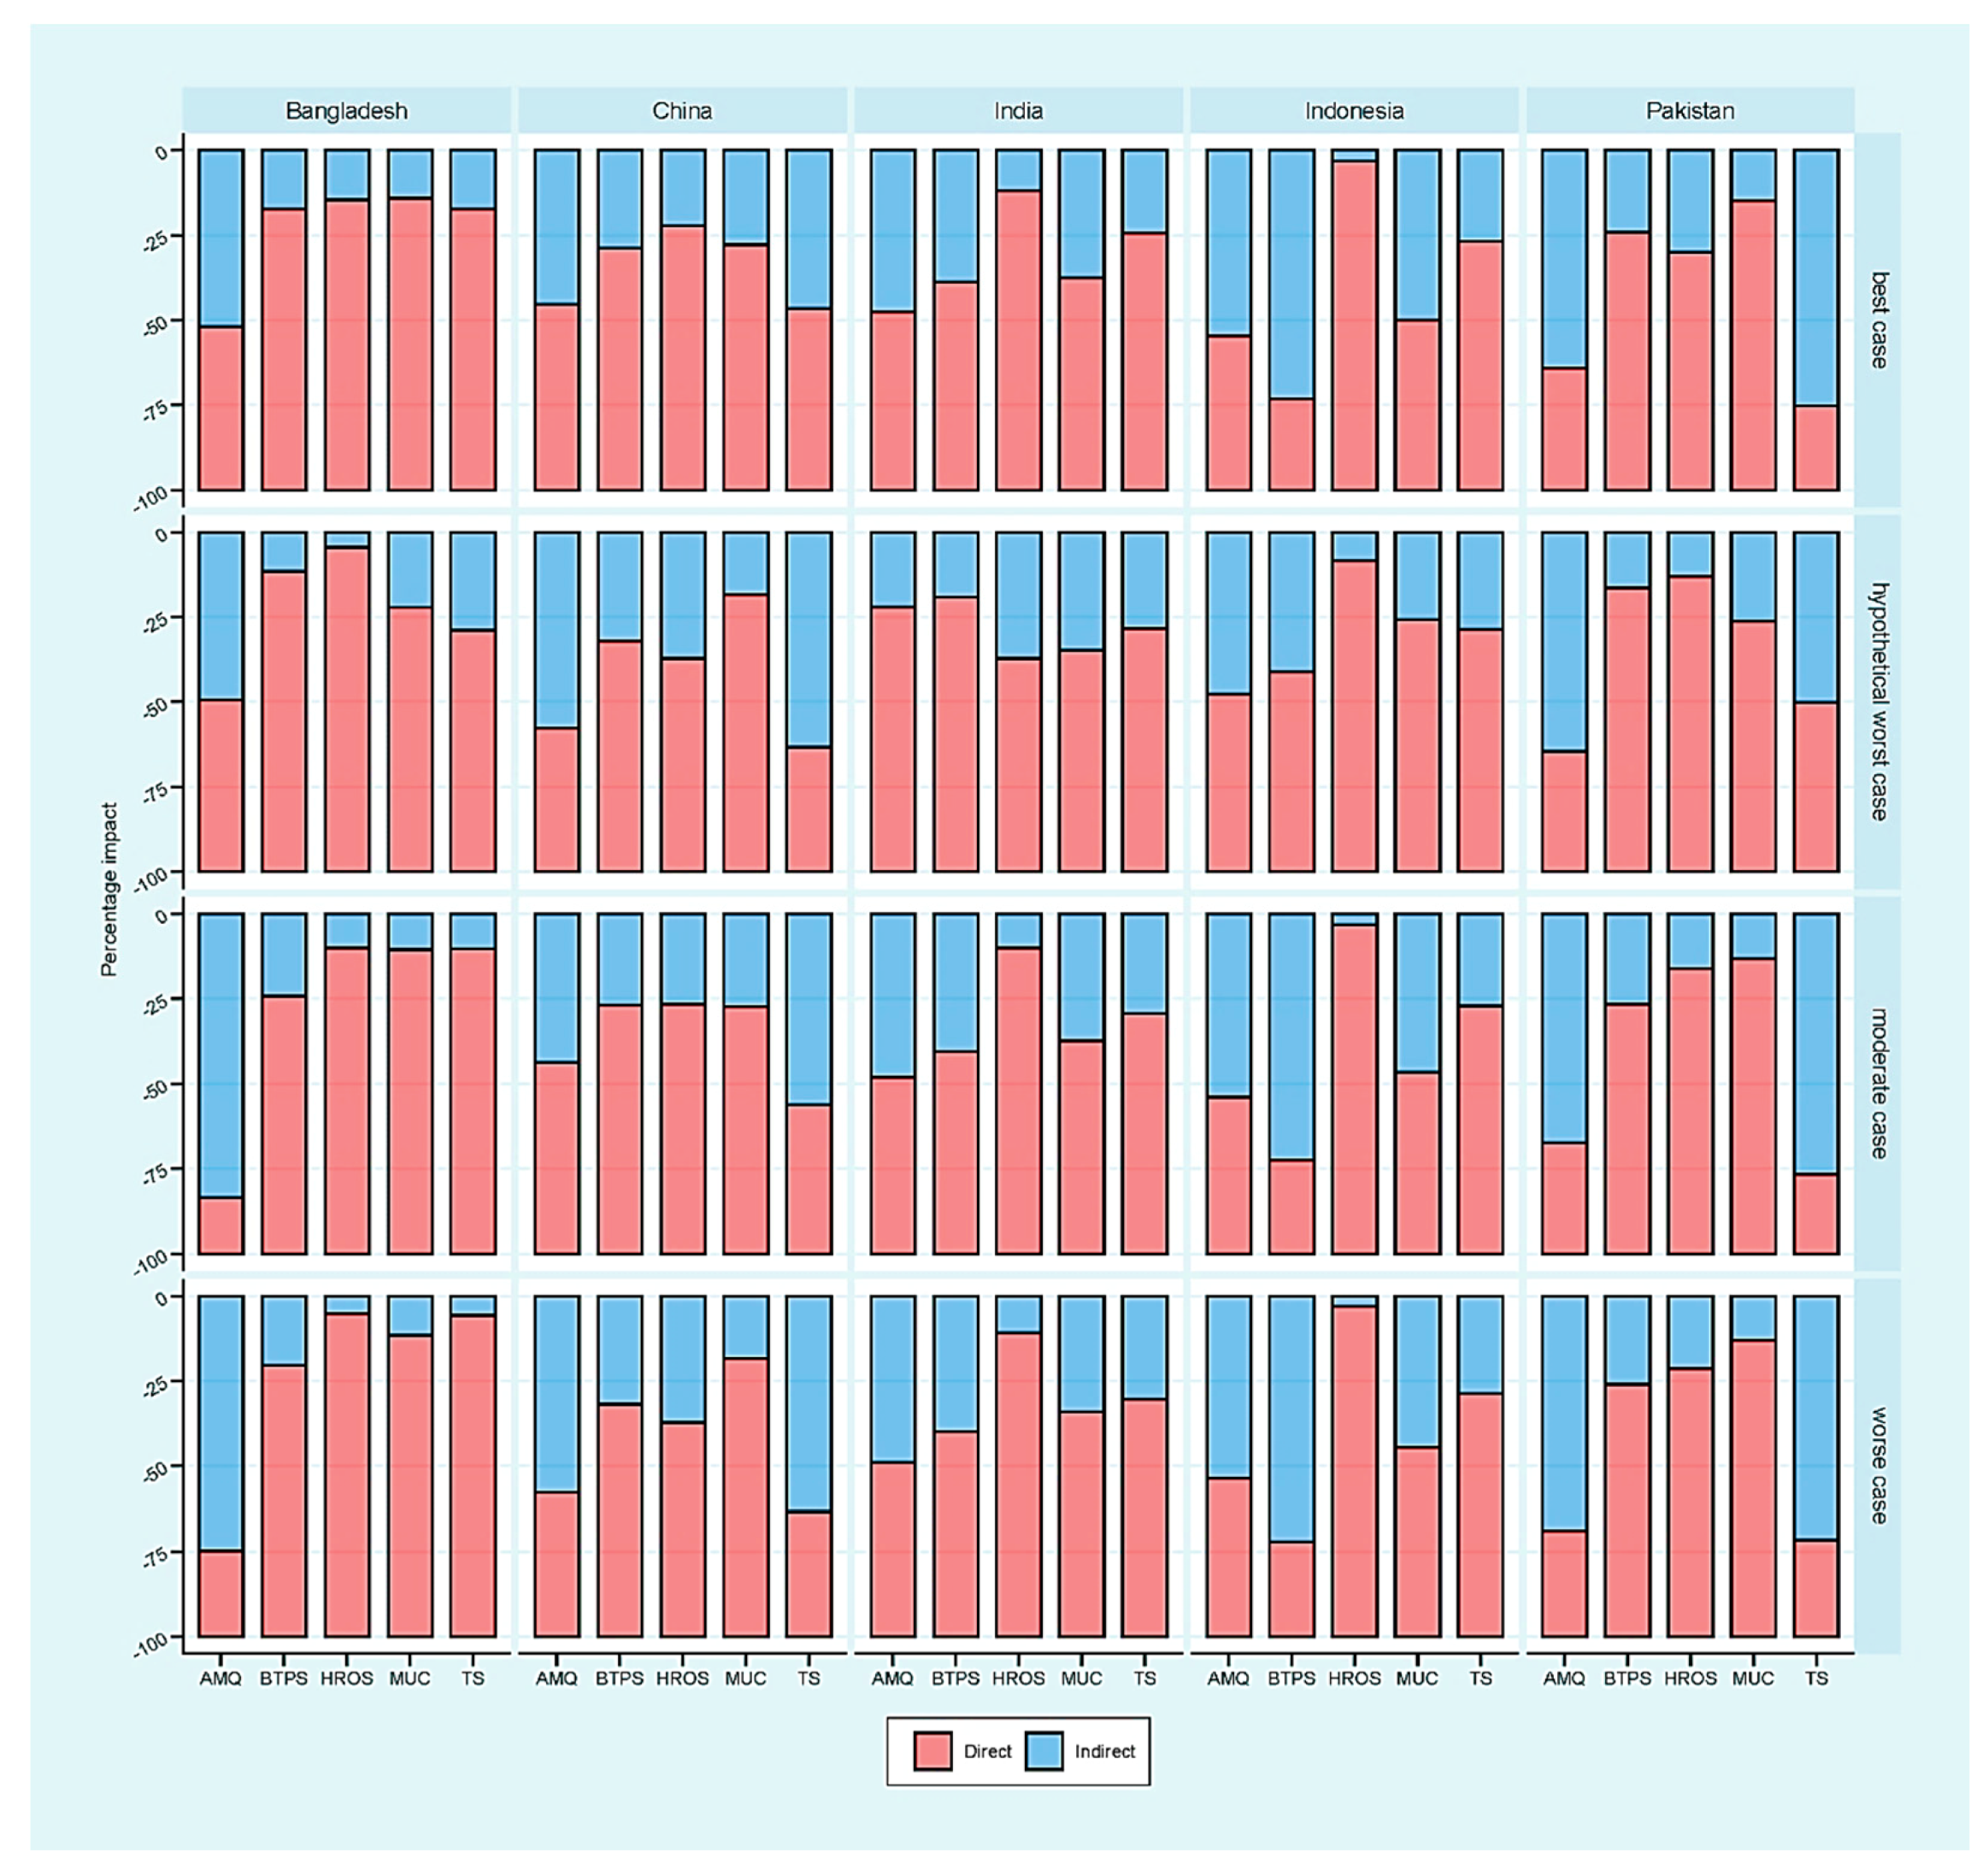
4.3. Decomposition of Impacts from Direct and Indirect Demand Shocks

The impact of COVID-19 demand shocks on CO2 emissions can be further subdivided into direct and indirect demand shocks. The first type is driven by direct demand for a sector’s products, while the second is driven by indirect demand, i.e., demand for a particular sector’s downstream purchaser sector’s products and services. Figure 3 represents the contribution of direct and indirect demand shocks to total CO2 emission reductions under various scenarios. The decomposed direct emissions are presented in the supplementary file. Figure 3 shows that direct demand shocks accounted for a large portion of the total CO2 reductions under various scenarios. For BCIIP countries, the impact of direct demand shocks on total reduction ranged from 85 % to 63 % . Direct demand shocks with range values of 85 83 % and 77 80 % , contributed the most to total CO2 reductions in Bangladesh and Pakistan, respectively. The contribution of indirect demand shocks to direct CO2 reductions ranged from 15 % to 37 % . India and Indonesia had the greatest impact of indirect demand shocks on CO2 reductions, with range values of 31 37 % and 28 41 % , respectively.
Figure 4 shows the sector-specific impact of direct and indirect demand shocks on total CO2 emissions reductions under various scenarios. As shown in Figure 5, the impact of direct demand shocks was greater than the impact of indirect demand shocks in the majority of sectors in BCIIP countries. However, in some sectors in different countries, the contribution of indirect demand shocks was generally greater than the contribution of direct demand shocks under different scenarios. The CO2 emissions reductions for AMQ (range = 49 83 % ) from Bangladesh, TS (range = 47 63 % ) from China, AMQ (range = 48 55 % ) and BTPS (range = 41 73 % ) from Indonesia, and AMQ (range = 64 69 % ) and TS (range = 50 75 % ) from Pakistan, for example, were generally influenced more by indirect than direct demand shocks.

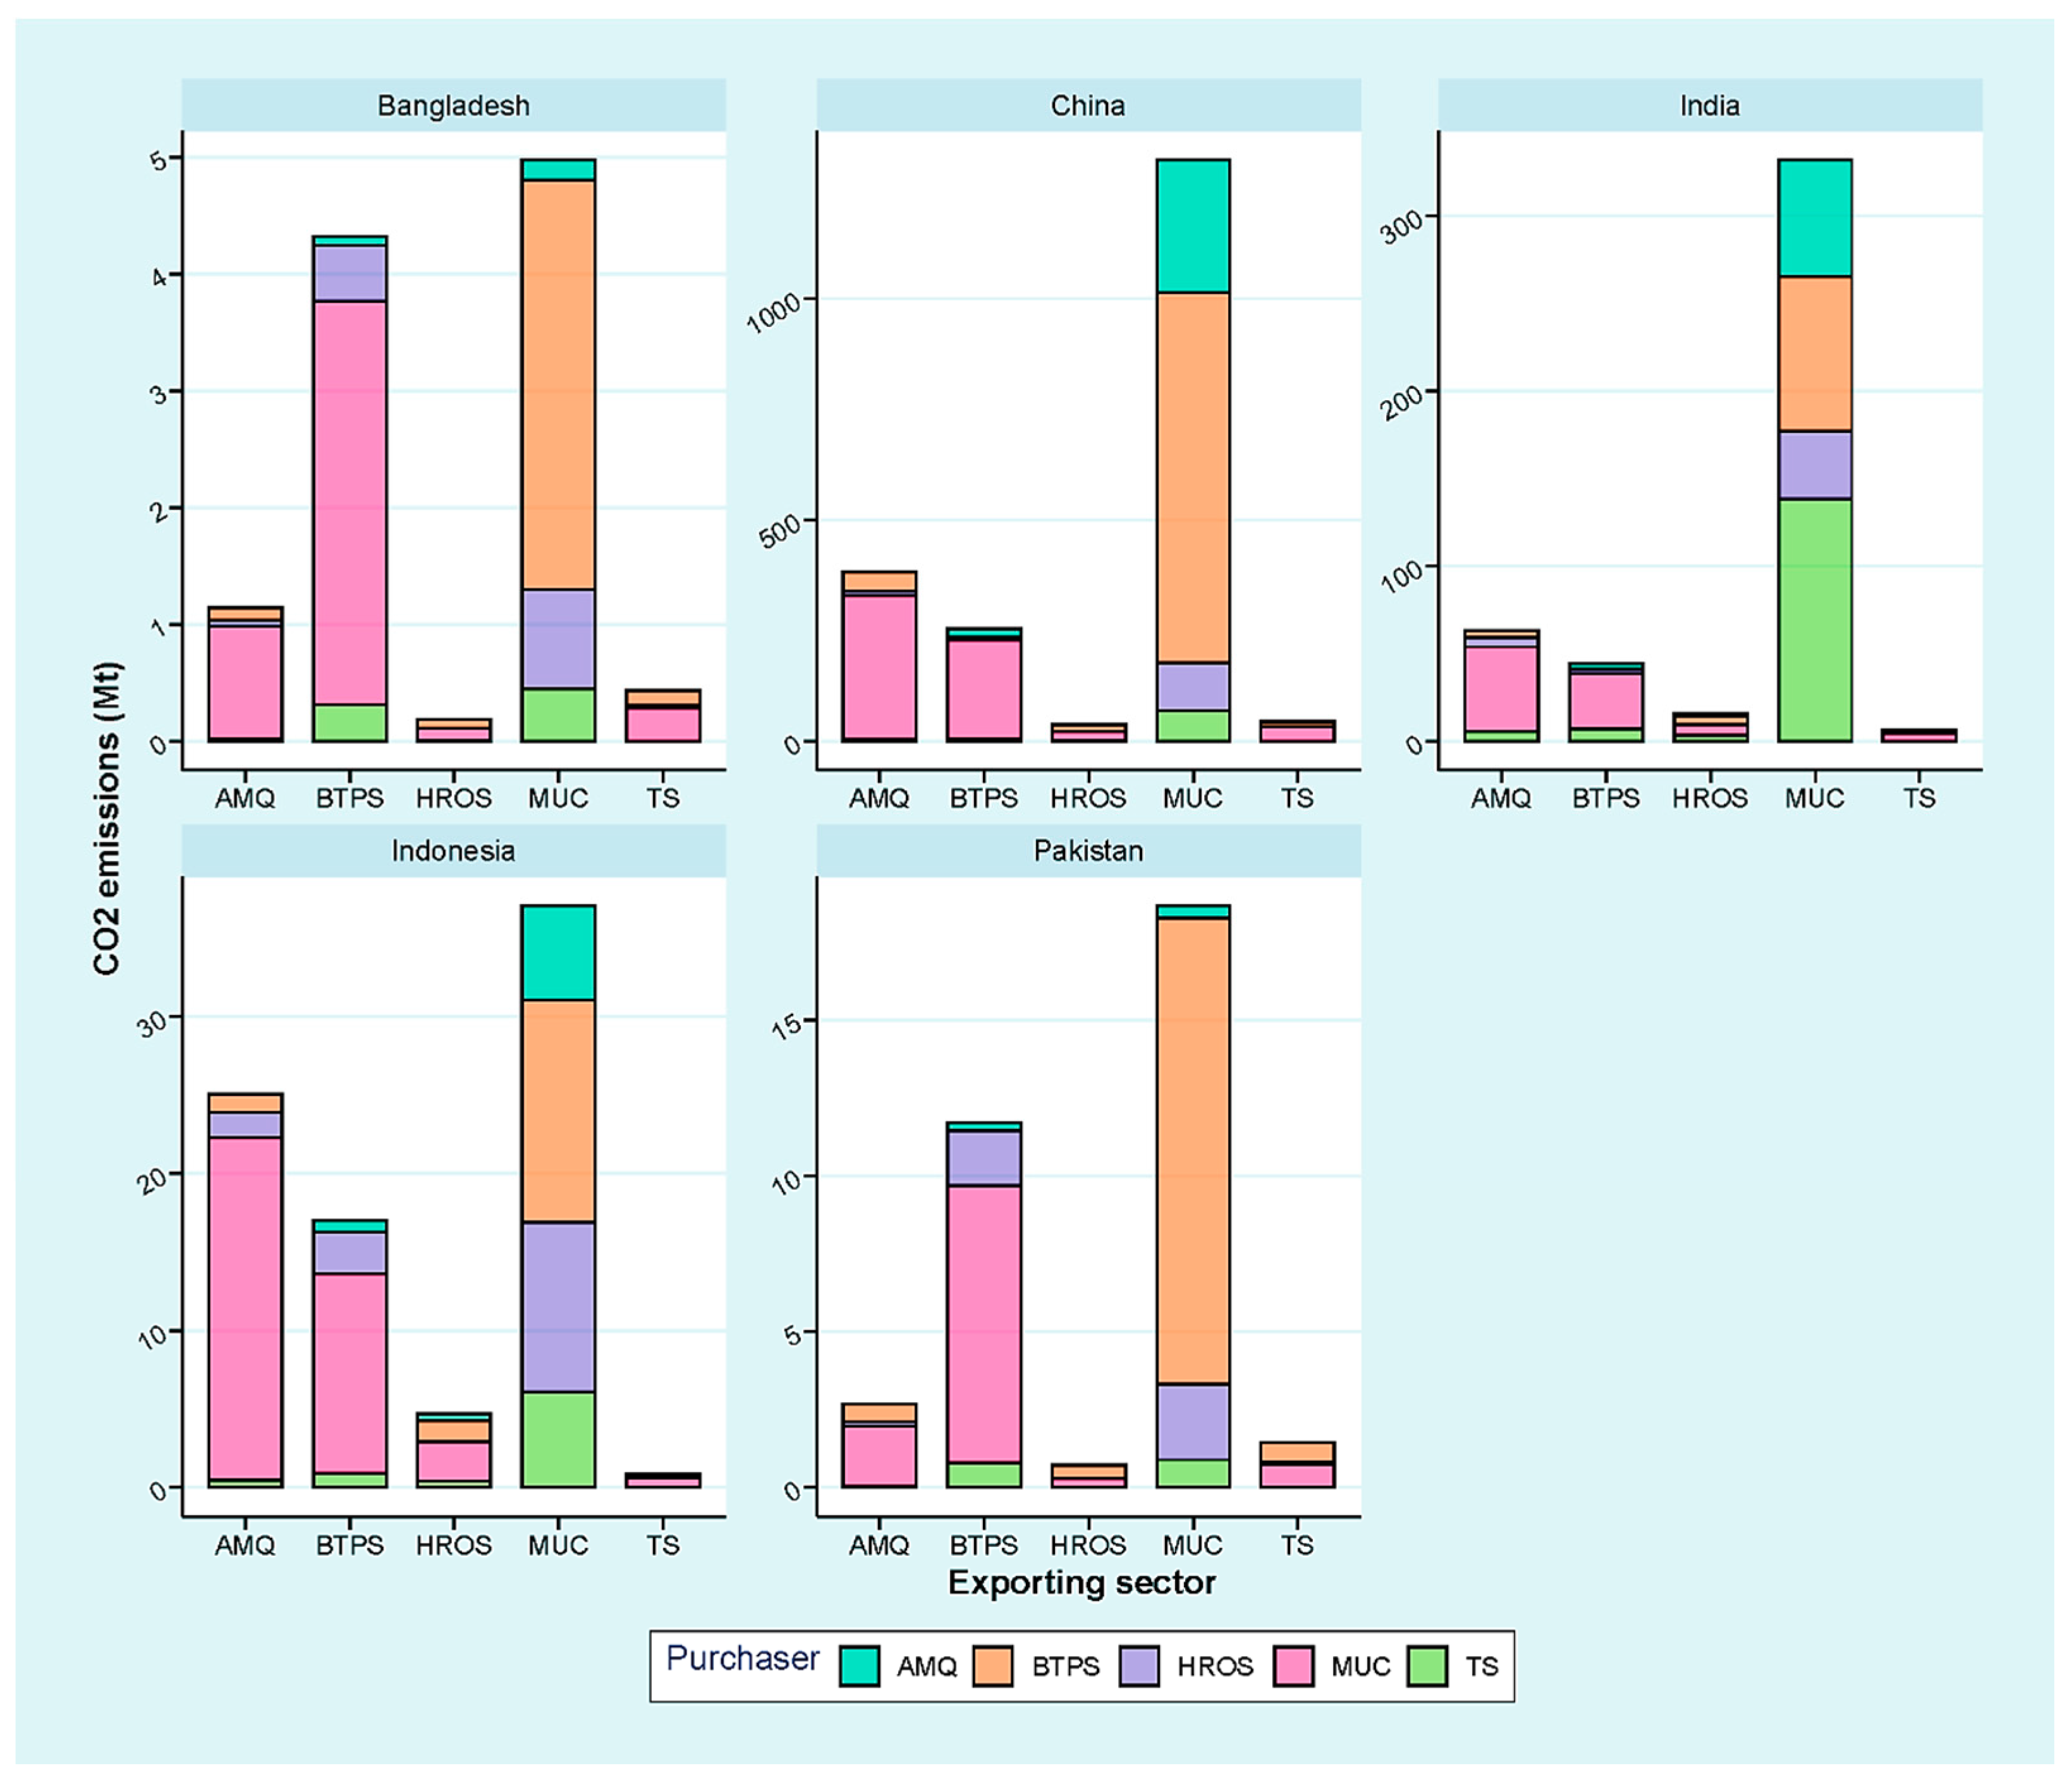
4.4. The Sectoral Sources of Indirect Demand

Although direct demand shocks were more important in reducing CO2 emissions under different scenarios, indirect demand shocks were also important in absolute terms, as shown above. Understanding the major sectoral sources of indirect demand can thus aid in the development of targeted mitigation policies. Figure 5 shows that demand for MUC, which had the highest forward CO2 emissions of all nations, received the majority of its indirect virtual CO2 demand from the AMQ for China, India, and Indonesia. However, BTPS was the source of the majority of MUC’s indirect demand in Bangladesh and Pakistan. Similarly, for AMQ, the MUC sector’s final demand was the largest driver of its downstream emissions in China, India, and Indonesia. While MUC was also the largest source of BTPS forward emissions in Bangladesh and Pakistan.

5. Discussion

5.1. Discussion of the Results

The COVID-19 pandemic has an impact on human activities, including energy consumption and CO2 emissions [10]. Many studies have been conducted on the effects of the novel COVID-19 pandemic on production [11,12,13,14] and supply chain disruptions [15,16]. Several studies have focused on CO2 emission reductions associated with COVID-19-related economic activity disruptions at the same time. Many studies have concentrated on the effects of lockdown-related demand (consumption) reduction on CO2 emissions at the national [35], provincial/regional [33,34], and international levels [36,37,38]. Few studies, however, have quantified the impact of direct and indirect COVID-19-related demand shocks on sectoral production and supply chain disruptions in general, as well as CO2 emissions and linkages in particular. Furthermore, the role of consumer demand from an industry’s downstream importers is an important but often overlooked aspect of the impact of COVID-19 demand shocks on sectoral CO2 emissions. This aspect is largely ignored in the literature on COVID-19’s overall impacts, and particularly in the literature on COVID-19’s effects on carbon and pollutant emissions. In this study, indirect demand shocks are defined as the effect of changes in demand for the target sector’s downstream purchasers on CO2 emissions. This study addressed these research gaps by estimating the impact of direct and indirect demand shocks on BCIIP’s important, densely populated, and polluted Asia-Pacific economies.
The study used MRIO [60] national input–output data and aggregated the input–output tables to correspond to the ADB [59] potential demand shock scenarios. Our findings revealed that the MUC sector was responsible for the greatest amount of emissions in all five countries. Aside from the worst-case scenario, no other scenario had a significant negative impact on CO2 emissions in Bangladesh, India, or Pakistan. However, when compared to the baseline (no COVID-19) scenario, all other scenarios showed a significant reduction in CO2 emissions for China and Indonesia. Direct demand shocks, on average, contributed more to total CO2 emissions reductions than indirect demand shocks. For all nations, the sectors with the highest emissions, such as the MUC, experienced the greatest reductions in emissions under various demand shock scenarios. Not only were these key sectors directly reducing emissions, but they were also indirectly driving a significant portion of other sectors’ emissions through inter-sectoral imports.
The impact of direct and indirect demand shocks on intermediate industrial linkages is rarely estimated in the literature on sectoral carbon linkages. The limited literature either estimates the impact on final demand of intermediate sectoral ties by completely removing them through hypothetical extraction of a sector’s final demand [56] or by embedding intermediate linkage emissions into various types of final demand [51]. The impact of direct and indirect demand shocks from disasters such as COVID-19, on the other hand, has not been considered in the related literature. As a result, the methodological approach used in this study is relatively new in the literature on sectoral (industrial) linkages, and thus it has implications that extend beyond the COVID-19 demand shock scenarios.
The long-term effects of the COVID-19 pandemic on emissions are unknown and are dependent on factors such as the success and rigor of public health programs, economic and human activity recovery, and long-term changes in human behavior [36]. Because of the uncertainties surrounding the duration, severity, and government lockdowns and restrictions associated with the current COVID-19 pandemic, various percentage CO2 emission reductions are presented in the related literature. According to Shan et al., compared to a no-pandemic baseline scenario, CO2 emissions for the 79 countries studied will decrease by 3.9 % to 5.6 % from 2020 to 2024 [38]. The low sensitivity test conducted by Quéré et al. predicted mid-point emissions reductions of 2.6 % ,   6.7 % ,   5.1 % , and 5.2 % for China, the US, Europe (EU27 + UK), and India, respectively. However, their high sensitivity test predicted mid-point emissions reductions of 5.6 % ,   11 % ,   8.5 % , and −8.7% for these nations. Meanwhile, they forecast a 5.7 % decrease in global CO2 emissions by 2020 [37]. COVID-19-related confinement measures, according to Quéré et al., will reduce global emissions by approximately 7 % below 2019 levels by the end of 2020 [6]. According to our findings, in the worst-case scenario, CO2 emissions in Bangladesh, China, India, Indonesia, and Pakistan will be reduced by 1 % ,   2 % ,   1 % ,   1 % , and 1.4 % , respectively, in the coming years. However, given the current global GDP growth rate recovery and particularly significant improvements in GDP growth rates in all BCIIP countries in 2021 [62], it is more likely that COVID-19-related restrictions on global and BCIIP national CO2 emissions will have a minor impact in the future. As a result, the best and moderate case scenarios, which have a less than 1 % impact on total national CO2 emissions reductions in BCIIP countries, are more likely for the coming years.
According to our findings, both direct and indirect negative demand shocks can play a significant role in decreasing direct CO2 emissions from respective sectors. The direct demand impact on CO2 reductions under different scenarios ranged from 85 % to 63 % for all BCIIP nations. While the impact of indirect demand shocks ranged from 15 % to 37 % . As demonstrated in the introduction section, the COVID-19 CO2 emissions literature typically does not disaggregate the effects of direct and indirect demand shocks on national CO2 emissions. However, authors such as Shan et al. have examined the effect of national and global lockdown measures on CO2 emissions, concluding that for the United States of America, the effect of self-lockdown resulted in 76.4 % CO2 emission reductions in 2020, while disruptions in global supply chains resulted in 23.6 % CO2 emission reductions [38]. Our findings also indicate somewhat similar patterns, with direct sectoral demand shocks causing significantly more reductions than indirect demand shocks from the decline in downstream sectoral demand (downstream supply chain). At the sectoral level, the MUC sector, which includes manufacturing, utilities, and construction, is not only the largest emitter in each of the five BCIIP countries but it also had the greatest negative direct and indirect impact on the respective economies’ sectoral CO2 emissions. These findings are consistent with those of other studies. Secondary industries, such as power generation and construction, have been shown to have the highest emissions in various economies [35,49,63]. The MUC sector has also been shown to have the greatest negative impact on direct CO2 emissions in a variety of other countries under various COVID-19 lockdown scenarios [35,38]. Furthermore, direct and indirect demand shocks had significant relative reductions in BTPS, AMQ and HROS total CO2 emissions under different scenarios. The subsequent decomposition of downstream sectoral emissions revealed a strong interdependence between the sectors with the greatest impacts. The downstream indirect demand for AMQ in China, India, and Indonesia (CII) was responsible for the majority of the indirect downstream emissions of MUC. Furthermore, downstream demand for BTPS accounted for the majority of MUC’s forward emissions in Bangladesh and Pakistan (BP). The MUC’s indirect demand accounted for the majority of indirect emissions for AMQ from CII countries and BTPS from BP countries.

5.2. Limitations and Future Research

It should be noted that final demand, or final demand shocks, can be classified into various categories, such as final demand from households, government, international trade, and capital formation. However, it is beyond the scope of this study to investigate the direct and indirect impact of various categories of final demand on the COVID-19 demand shocks associated with CO2 emissions. Furthermore, demand shocks can be studied in relation to various socioeconomic impacts on demand shocks and thus CO2 emissions. Further research into the role of different final demand categories and socioeconomic factors may yield some interesting findings on the direct and indirect effects of final demand shocks on sectoral CO2 emissions.

6. Policy Implications

The understanding of the impact of direct and indirect demand shocks on CO2 emissions in BCIIP countries can help policymakers develop long-term policies that go beyond the negative effects of COVID-19 demand shocks, which are diminishing over time. Policymakers can achieve this by improving key sectors’ direct and indirect demand patterns and levels, as evidenced by the magnitude of their direct and indirect negative impacts under various COVID-19-related demand reduction scenarios. According to the patterns in our findings, for BCIIP countries, a significant portion of the major sector CO2 emissions reductions under different scenarios came from indirect downstream sector demand. As a result, in order to maintain current COVID-19-related reduction patterns, in addition to direct demand from key CO2 producing sectors, indirect demand from downstream industries must be considered. In this case, the intermediate virtual exporters of industrial CO2 emissions, downstream importers, and direct and indirect final demand sources (such as households and government) should be targeted through a mechanism of shared carbon taxes or carbon permits. As a result, a distributed but effective reduction in CO2 emissions can be achieved, with all stakeholders sharing the burden of CO2 mitigation. Numerous previous studies have also argued for the distribution of industrial CO2 emissions through various mechanisms. It has been argued, in particular, that transferring the traditional burden from industrial producers to various other stakeholders is not only just, but may also be more effective, due to the shredded burden of CO2 emissions responsibility [49,56]. Recent evidence suggests that environmental levies (such as carbon taxes) will have a significant long-term impact on carbon emissions reduction. As a result, a fair and effective carbon taxation policy is critical for long-term resilience by sustaining current reduction patterns.
COVID-19 CO2 emission reductions have mostly transitory effects. And, as time passes, these effects will fade. According to studies, when certain countries lift COVID-19-related restrictions, emissions tend to spike [34]. Many studies have predicted that current CO2 emission reductions will be transient, with emissions returning to pre-COVID-19 levels if necessary steps are not taken [35,36]. As a result, capitalizing on the opportunity for long-term recovery would necessitate the adoption of low-carbon production models [9,64]. After the pandemic, the resurgence of both direct and indirect demand for various sectoral products and services to pre-COVID-19 levels, and possibly beyond, could offset any positive gains in sectoral CO2 emissions reductions achieved during the current pandemic. To avert a recession caused by the COVID-19 pandemic, the world’s leading economies and economic blocs have contributed billions of dollars in monetary and fiscal stimulus [65,66]. There is enormous potential for sustaining and improving current CO2 emission reductions if policymakers consider the environment in addition to the economy when developing fiscal and monetary policies. Rather than the restrictions on human activities experienced during the COVID-19 pandemic [36], which are unsustainable in the long run, monetary and fiscal measures may be required to achieve long-run sustainable growth through demand control, which may aid in the reduction of economies’ carbon intensity.
In this case, both long-term monetary and fiscal policies can be tailored to maintain current CO2 reduction trends in key CO2 emitting sectors. Monetary policy may, for example, include provisions for easy bank borrowing by lowering interest rates for industries and final consumers who agree to spend on green practices (such as renewable energy use, improved resource use efficiency, innovations [35,36,38], and investment in green (energy-efficient) infrastructure [6,29,36]). Similarly, long-term fiscal policy in the form of carbon taxes (both for producers and consumers [56]) and other COVID-19 economic recovery-related subsidies such as financial stimuli to sectors based on CO2 reductions, financial support to final consumers based on green behavior, and government investment in green infrastructure can aid in dealing with post-COVID-19 CO2 emissions. Shan et al. concluded that expected fiscal stimuli planned by various governments for economic recovery as a result of COVID-19 will either significantly increase CO2 emissions or help achieve net zero emissions by investing in clean energy sectors [38]. Taking into consideration the world’s expanding energy consumption and the issue of fossil fuel depletion [67]. A favorable monetary and fiscal policy toward green practices will aid in the development of new technologies for energy consumption control and the transition from conventional to biofuels, which are necessary to meet energy demands while limiting CO2 emissions [67].

7. Conclusions

COVID-19 is a worldwide catastrophe of epic proportions. The COVID-19 pandemic has the greatest impact on developing economies. Many studies have been conducted to estimate the effects of COVID-19-related disruptions on production and supply chains in general, as well as on carbon emissions in particular. Many studies, in particular, have been conducted on the impact of related demand shocks on CO2 reductions. The impact of direct and indirect demand shocks on specific economies, on the other hand, has rarely been estimated. Furthermore, the role of domestic intermediate sectoral supply chain disruptions caused by direct and indirect demand shocks has received little attention in the literature. Moreover, in the related literature on both the sectoral linkages and the COVID-19 related impacts, the domestic intermediate sectoral linkages have not been classified based on their direct and indirect demand shocks. Our study filled these critical reset gaps by estimating the CO2 reduction impacts of COVID-19-related intermediate sectoral supply chain disruptions caused by direct and indirect demand shocks. The BCIIP developing economies case was considered due to their significant contribution to the global population and pollution. The study first differentiated a country’s total emissions into those caused by intra-sectoral linkages and those caused by downstream forward sectoral linkages. The impact of total demand shocks was then disaggregated into intra-sectoral CO2 linkage reductions caused by direct demand shocks and inter-sectoral downstream CO2 linkages caused by indirect demand from a target sector’s downstream sectoral importers. According to the findings, China had the highest total CO2 emissions of any nation under the no COVID-19 scenario, followed by India, Indonesia, Pakistan, and Bangladesh. Aside from the worst-case scenario, no other scenario significantly reduced CO2 emissions in Bangladesh, India, or Pakistan. All other scenarios, however, resulted in comparatively significant CO2 emission reductions for China and Indonesia when compared to the baseline scenario (no COVID-19). The impact of direct demand shocks on CO2 reduction was generally greater in BCIIP countries than the impact of indirect demand shocks. The MUC, which had the highest downstream CO2 emissions of any country, received the vast majority of its indirect virtual CO2 demand from the AMQ for China, India, and Indonesia. However, BTPS accounted for the vast majority of MUC indirect demand in Bangladesh and Pakistan. Given the current state of the BCIIP’s economic recovery, a best or moderate scenario with a negative impact of less than 1% is more likely in the coming years. To be resilient in the face of COVID-19, current CO2 emission reductions must be sustained and improved over time. This can be accomplished through the development of a fair and effective carbon taxation policy that accounts for all intermediate sectoral and final demand sources, both direct and indirect. Furthermore, monetary and fiscal policies based on environmental impacts can help maintain or improve the COVID-19-related CO2 reduction pattern in the long run. When estimating the impact of direct and indirect demand shocks, our study did not take into account the distinct roles of different categories of final demand. Furthermore, the impact of various socioeconomic factors was not taken into account. Future research can thus consider both the role of final demand categories and socioeconomic factors in order to shed more light on the topic of CO2 reductions from COVID-19-related direct and indirect demand shocks.

Supplementary Materials

The following are available online at https://0-www-mdpi-com.brum.beds.ac.uk/article/10.3390/su13169312/s1, Table S1. The aggregation of Bangladesh’s national input–output table. Table S2. The aggregation of China’s national input–output table. Table S3. The aggregation of India’s national input–output table. Table S4. The aggregation of Indonesia’s national input–output table. Table S5. The aggregation of Pakistan’s national input–output table. Supplementary File. Decomposition of direct CO2 emissions from direct and indirect demand. Figure S1. The direct CO2 emissions from direct and indirect demand.

Author Contributions

Conceptualization, M.J.S.; methodology, M.J.S.; software, M.J.S.; validation, E.D.R.S.G.; formal analysis, M.J.S.; investigation, M.J.S.; resources, M.J.S. and E.D.R.S.G.; data curation, M.J.S.; writing—original draft preparation, M.J.S.; writing—review and editing, E.D.R.S.G.; visualization, M.J.S.; supervision, E.D.R.S.G.; project administration, E.D.R.S.G. All authors have read and agreed to the published version of the manuscript.

Funding

This research received no external funding.

Institutional Review Board Statement

Not applicable.

Informed Consent Statement

Not applicable.

Data Availability Statement

The data on the demand shocks under different scenarios are available on the Asian Development Bank’s database at https://data.adb.org/dataset/covid-19-economic-impact-assessment-template (accessed on 11 May 2021). The national input–output tables are available from the MRIO database at https://worldmrio.com/countrywise/ (accessed on 1 January 2021). The aggregated input–output tables data and data depicted by the manuscript figures are available and can be provided upon reasonable request from the corresponding author.

Acknowledgments

The authors would like to thank the four anonymous reviewers and the guest editor, Idiano D’Adamo, for their insightful comments.

Conflicts of Interest

The authors declare no conflict of interest.

Appendix A

Table A1. Full names of the sectoral abbreviations used in this study.
Sectoral AbbreviationsFull Names
AMQ“Agriculture, Mining and Quarrying”
BTPS“Business, Trade, Personal, and Public Services”
HROS“Hotel and Restaurants and Other Personal Services”
MUC“Light/Heavy Manufacturing, Utilities, and Construction”
TS“Transport services”
Table A2. Sector-wide reduction in CO2 emissions in Mt compared to the no COVID-19 baseline scenario.
Items aBangladesh bChinaIndiaIndonesiaPakistan
Best case
AMQ−3.18 × 10⁻⁵−2.60−0.02−0.070.00
BTPS−5.85 × 10⁻⁴−2.29−0.02−0.030.00
HROS−2.10 × 10⁻⁴−0.66−0.03−0.240.00
MUC−1.29 × 10⁻³−17.26−0.19−0.24−0.01
TS−1.42 × 10⁻⁵−0.510.00−0.010.00
Total impact−2.13 × 10⁻³−23.31−0.26−0.58−0.01
Moderate case
AMQ−7.22 × 10⁻⁵−6.62−0.04−0.090.00
BTPS−1.15 × 10⁻³−5.91−0.02−0.04−0.01
HROS−3.22 × 10⁻⁴−1.27−0.06−0.300.00
MUC−2.82 × 10⁻³−42.03−0.32−0.35−0.01
TS−2.62 × 10⁻⁵−0.85−0.01−0.010.00
Total impact−4.39 × 10⁻³−56.67−0.44−0.79−0.02
Worse case
AMQ−1.23 × 10⁻⁴−11.17−0.06−0.160.00
BTPS−2.36 × 10⁻³−13.34−0.05−0.07−0.01
HROS−6.41 × 10⁻⁴−2.07−0.10−0.500.00
MUC−5.05 × 10⁻³−139.71−0.66−0.60−0.02
TS−4.87 × 10⁻⁵−1.77−0.01−0.010.00
Total impact−8.22 × 10⁻³−168.06−0.88−1.34−0.04
Hypothetical worst case
AMQ−0.02−11.18−2.75−0.60−0.07
BTPS−0.30−13.34−2.01−0.57−1.04
HROS−0.04−2.07−0.52−0.76−0.08
MUC−0.25−139.82−10.82−2.90−1.09
TS−0.01−1.77−0.22−0.04−0.05
Total impact−0.63−168.18−16.32−4.88−2.33
a Here, the above values in Mt present the difference between the sectoral values under different scenarios and the baseline scenario. b The scientific notation has been used to present the sector-wide impact of Bangladesh’s CO2 emissions under different scenarios as the values are very small, and therefore not suitable for presentation in a normal format.

References

  1. Ibn-Mohammed, T.; Mustapha, K.B.; Godsell, J.; Adamu, Z.; Babatunde, K.A.; Akintade, D.D.; Acquaye, A.; Fujii, H.; Ndiaye, M.M.; Yamoah, F.A.; et al. A critical analysis of the impacts of COVID-19 on the global economy and ecosystems and opportunities for circular economy strategies. Resour. Conserv. Recycl. 2021, 164, 105169. [Google Scholar] [CrossRef]
  2. World Health Organization. WHO Coronavirus Disease (COVID-19) Dashboard (Data Last Updated: 2 March 2021, 6:09 pm CET). Available online: https://covid19.who.int/ (accessed on 3 March 2021).
  3. Singh, S.; Kumar, R.; Panchal, R.; Tiwari, M.K. Impact of COVID-19 on logistics systems and disruptions in food supply chain. Int. J. Prod. Res. 2020, 59, 1–16. [Google Scholar] [CrossRef]
  4. Barbier, E.B.; Burgess, J.C. Sustainability and development after COVID-19. World Dev. 2020, 135, 105082. [Google Scholar] [CrossRef] [PubMed]
  5. Zeng, N.; Han, P.; Liu, D.; Liu, Z.; Oda, T.; Martin, C.; Liu, Z.; Yao, B.; Sun, W.; Wang, P.; et al. Global to local impacts on atmospheric CO2 caused by COVID-19 lockdown. arXiv 2020, arXiv:2010.13025. [Google Scholar]
  6. Quéré, C.L.; Peters, G.P.; Friedlingstein, P.; Andrew, R.M.; Canadell, J.G.; Davis, S.J.; Jackson, R.B.; Jones, M.W. Fossil CO2 emissions in the post-COVID-19 era. Nat. Clim. Chang. 2021, 11, 197–199. [Google Scholar] [CrossRef]
  7. D’adamo, I.; González-Sánchez, R.; Medina-Salgado, M.S.; Settembre-Blundo, D. E-commerce calls for cyber-security and sustainability: How european citizens look for a trusted online environment. Sustainability 2021, 13, 6752. [Google Scholar] [CrossRef]
  8. Acevedo-Duque, Á.; Gonzalez-Diaz, R.; Vargas, E.C.; Paz-Marcano, A.; Muller-Pérez, S.; Salazar-Sepúlveda, G.; Caruso, G.; D’Adamo, I. Resilience, Leadership and Female Entrepreneurship within the Context of SMEs: Evidence from Latin America. Sustainability 2021, 13, 8129. [Google Scholar] [CrossRef]
  9. D’Adamo, I.; Lupi, G. Sustainability and resilience after COVID-19: A circular premium in the fashion industry. Sustainability 2021, 13, 1861. [Google Scholar] [CrossRef]
  10. Amankwah-Amoah, J. Note: Mayday, Mayday, Mayday! Responding to environmental shocks: Insights on global airlines’ responses to COVID-19. Transp. Res. Part E Logist. Transp. Rev. 2020, 143, 102098. [Google Scholar] [CrossRef]
  11. Chowdhury, M.T.; Sarkar, A.; Paul, S.K.; Moktadir, M.A. A case study on strategies to deal with the impacts of COVID-19 pandemic in the food and beverage industry. Oper. Manag. Res. 2020. [Google Scholar] [CrossRef]
  12. Marimuthu, R.; Sankaranarayanan, B.; Ali, S.M.; Karuppiah, K. Green recovery strategies for the mining industry of India: Lessons learned from the COVID-19 pandemic. J. Asia Bus. Stud. 2021. [Google Scholar] [CrossRef]
  13. Chen, J.; Huang, J.; Su, W.; Štreimikienė, D.; Baležentis, T. The challenges of COVID-19 control policies for sustainable development of business: Evidence from service industries. Technol. Soc. 2021, 66, 101643. [Google Scholar] [CrossRef]
  14. Cui, Q.; He, L.; Liu, Y.; Zheng, Y.; Wei, W.; Yang, B.; Zhou, M. The impacts of COVID-19 pandemic on China’s transport sectors based on the CGE model coupled with a decomposition analysis approach. Transp. Policy 2021, 103, 103–115. [Google Scholar] [CrossRef]
  15. Shahed, K.S.; Azeem, A.; Ali, S.M.; Moktadir, M.A. A supply chain disruption risk mitigation model to manage COVID-19 pandemic risk. Environ. Sci. Pollut. Res. 2021. [Google Scholar] [CrossRef]
  16. Karmaker, C.L.; Ahmed, T.; Ahmed, S.; Ali, S.M.; Moktadir, M.A.; Kabir, G. Improving supply chain sustainability in the context of COVID-19 pandemic in an emerging economy: Exploring drivers using an integrated model. Sustain. Prod. Consum. 2021, 26, 411–427. [Google Scholar] [CrossRef] [PubMed]
  17. Wang, P.; Chen, K.; Zhu, S.; Wang, P.; Zhang, H. Severe air pollution events not avoided by reduced anthropogenic activities during COVID-19 outbreak. Resour. Conserv. Recycl. 2020, 158, 104814. [Google Scholar] [CrossRef] [PubMed]
  18. Acharya, P.; Barik, G.; Gayen, B.K.; Bar, S.; Maiti, A.; Sarkar, A.; Ghosh, S.; De, S.K.; Sreekesh, S. Revisiting the levels of Aerosol Optical Depth in south-southeast Asia, Europe and USA amid the COVID-19 pandemic using satellite observations. Environ. Res. 2021, 193, 110514. [Google Scholar] [CrossRef] [PubMed]
  19. Dumka, U.C.; Kaskaoutis, D.G.; Verma, S.; Ningombam, S.S.; Kumar, S.; Ghosh, A. Silver linings in the dark clouds of COVID-19: Improvement of air quality over India and Delhi metropolitan area from measurements and WRF-CHIMERE model simulations. Atmos. Pollut. Res. 2020. [Google Scholar] [CrossRef]
  20. Ranjan, A.K.; Patra, A.K.; Gorai, A.K. Effect of lockdown due to SARS COVID-19 on aerosol optical depth (AOD) over urban and mining regions in India. Sci. Total Environ. 2020, 745, 141024. [Google Scholar] [CrossRef]
  21. Debone, D.; da Costa, M.V.; Miraglia, S.G.E.K. 90 days of COVID-19 social distancing and its impacts on air quality and health in Sao Paulo, Brazil. Sustainability 2020, 12, 7440. [Google Scholar] [CrossRef]
  22. Alonso-Muñoz, S.; González-Sánchez, R.; Siligardi, C.; García-Muiña, F.E. New circular networks in resilient supply chains: An external capital perspective. Sustainability 2021, 13, 6130. [Google Scholar] [CrossRef]
  23. Rume, T.; Didar-UlIslam, S.M. Environmental effects of COVID-19 pandemic and potential strategies of sustainability. Heliyon 2020, 6, e04965. [Google Scholar] [CrossRef] [PubMed]
  24. Zhang, D.; Hao, M.; Morse, S. Is environmental sustainability taking a backseat in china after covid-19? The perspective of business managers. Sustainability 2020, 12, 369. [Google Scholar] [CrossRef]
  25. Sharma, H.B.; Vanapalli, K.R.; Cheela, V.S.; Ranjan, V.P.; Jaglan, A.K.; Dubey, B.; Goel, S.; Bhattacharya, J. Challenges, opportunities, and innovations for effective solid waste management during and post COVID-19 pandemic. Resour. Conserv. Recycl. 2020, 162, 105052. [Google Scholar] [CrossRef]
  26. Vanapalli, K.R.; Sharma, H.B.; Ranjan, V.P.; Samal, B.; Bhattacharya, A.; Dubey, B.K.; Goel, S. Challenges and strategies for effective plastic waste management during and post COVID-19 pandemic. Sci. Total Environ. 2021, 750, 141514. [Google Scholar] [CrossRef]
  27. Kalbusch, A.; Henning, E.; Brikalski, M.P.; de Luca, F.V.; Konrath, A.C. Impact of coronavirus (COVID-19) spread-prevention actions on urban water consumption. Resour. Conserv. Recycl. 2020, 163, 105098. [Google Scholar] [CrossRef] [PubMed]
  28. Khan, M.F.; Pervez, A.; Modibbo, U.M.; Chauhan, J. Flexible Fuzzy Goal Programming Approach in Optimal Mix of Power Generation for Socio-Economic Sustainability: A Case Study. Sustainability 2021, 13, 8256. [Google Scholar] [CrossRef]
  29. D’Adamo, I.; Rosa, P. How do you see infrastructure? Green energy to provide economic growth after COVID-19. Sustainability 2020, 12, 4738. [Google Scholar] [CrossRef]
  30. Forster, P.M.; Forster, H.I.; Evans, M.J.; Gidden, M.J.; Jones, C.D.; Keller, C.A.; Lamboll, R.D.; Quéré, C.L.; Rogelj, J.; Rosen, D.; et al. Current and future global climate impacts resulting from COVID-19. Nat. Clim. Chang. 2020, 10, 913–919. [Google Scholar] [CrossRef]
  31. Arribas-Ibar, M.; Nylund, P.A.; Brem, A. The risk of dissolution of sustainable innovation ecosystems in times of crisis: The electric vehicle during the covid-19 pandemic. Sustainability 2021, 13, 1319. [Google Scholar] [CrossRef]
  32. Rousseau, S.; Deschacht, N. Public Awareness of Nature and the Environment During the COVID-19 Crisis. Environ. Resour. Econ. 2020, 76, 1149–1159. [Google Scholar] [CrossRef]
  33. Turner, A.J.; Kim, J.; Fitzmaurice, H.; Newman, C.; Worthington, K.; Chan, K.; Wooldridge, P.J.; Köehler, P.; Frankenberg, C.; Cohen, R.C. Observed Impacts of COVID-19 on Urban CO2 Emissions. Geophys. Res. Lett. 2020, 47, e2020GL090037. [Google Scholar] [CrossRef]
  34. Zheng, B.; Geng, G.; Ciais, P.; Davis, S.J.; Martin, R.V.; Meng, J.; Wu, N.; Chevallier, F.; Broquet, G.; Boersma, F.; et al. Satellite-based estimates of decline and rebound in China’s CO2 emissions during COVID-19 pandemic. Sci. Adv. 2020, 6, eabd4998. [Google Scholar] [CrossRef]
  35. Han, P.; Cai, Q.; Oda, T.; Zeng, N.; Shan, Y.; Lin, X.; Liu, D. Assessing the recent impact of COVID-19 on carbon emissions from China using domestic economic data. Sci. Total Environ. 2021, 750, 141688. [Google Scholar] [CrossRef] [PubMed]
  36. Liu, Z.; Ciais, P.; Deng, Z.; Lei, R.; Davis, S.J.; Feng, S.; Zheng, B.; Cui, D.; Dou, X.; Zhu, B.; et al. Near-real-time monitoring of global CO2 emissions reveals the effects of the COVID-19 pandemic. Nat. Commun. 2020, 11, 5172. [Google Scholar] [CrossRef] [PubMed]
  37. Quéré, C.L.; Jackson, R.B.; Jones, M.W.; Smith, A.J.P.; Abernethy, S.; Andrew, R.M.; De-Gol, A.J.; Willis, D.R.; Shan, Y.; Canadell, J.G.; et al. Temporary reduction in daily global CO2 emissions during the COVID-19 forced confinement. Nat. Clim. Chang. 2020, 10, 647–653. [Google Scholar] [CrossRef]
  38. Shan, Y.; Ou, J.; Wang, D.; Zeng, Z.; Zhang, S.; Guan, D.; Hubacek, K. Impacts of COVID-19 and fiscal stimuli on global emissions and the Paris Agreement. Nat. Clim. Chang. 2021, 11, 200–206. [Google Scholar] [CrossRef]
  39. Sajid, M.J.; Qingren, C.; Ming, C.; Shuang, L. Sectoral carbon linkages of Indian economy based on hypothetical extraction model. Int. J. Clim. Chang. Strateg. Manag. 2020, 12, 1756–8692. [Google Scholar] [CrossRef]
  40. Duarte, R.; Sa, J.; Bielsa, J. Water use in the Spanish economy: An input-output approach. Ecol. Econ. 2002, 43, 71–85. [Google Scholar] [CrossRef]
  41. Dionisio, C.; Blanco, P.; Thaler, T. An Input-Output Assessment of Water Productivity in the Castile and León Region (Spain). Water 2014, 6, 929–944. [Google Scholar] [CrossRef] [Green Version]
  42. Deng, G.; Wang, L.; Xu, X. Linkage effect of virtual water trade in China’s industrial products—Based on generalized hypothetical extraction method. Ecol. Indic. 2018, 93, 1302–1310. [Google Scholar] [CrossRef]
  43. Guerra, A.I.; Sancho, F. Measuring energy linkages with the hypothetical extraction method: An application to Spain. Energy Econ. 2010, 32, 831–837. [Google Scholar] [CrossRef]
  44. He, W.; Wang, Y.; Zuo, J.; Luo, Y. Sectoral linkage analysis of three main air pollutants in China’s industry: Comparing 2010 with 2002. J. Environ. Manag. 2017, 202, 232–241. [Google Scholar] [CrossRef]
  45. Wang, Y.; Lai, N.; Mao, G.; Zuo, J.; Crittenden, J.; Jin, Y.; Moreno-Cruz, J. Air pollutant emissions from economic sectors in China: A linkage analysis. Ecol. Indic. 2017, 77, 250–260. [Google Scholar] [CrossRef] [Green Version]
  46. Sajid, M.J.; Cao, Q.; Kang, W. Transport sector carbon linkages of EU’s top seven emitters. Transp. Policy 2019, 80, 24–38. [Google Scholar] [CrossRef]
  47. Cella, G. The input-output measurement of interindustry linkages. Oxf. Bull. Econ. Stat. 1984, 46, 73–84. [Google Scholar] [CrossRef]
  48. Bai, H.; Feng, X.; Hou, H.; He, G.; Dong, Y.; Xu, H. Mapping inter-industrial CO2 flows within China. Renew. Sustain. Energy Rev. 2018, 93, 400–408. [Google Scholar] [CrossRef]
  49. Sajid, M.J.; Li, X.; Cao, Q. Demand and supply-side carbon linkages of Turkish economy using hypothetical extraction method. J. Clean. Prod. 2019, 228, 264–275. [Google Scholar] [CrossRef]
  50. Zhao, Y.; Liu, Y.; Wang, S.; Zhang, Z.; Li, J. Inter-regional linkage analysis of industrial CO2 emissions in China: An application of a hypothetical extraction method. Ecol. Indic. 2016, 61, 428–437. [Google Scholar] [CrossRef]
  51. Sajid, M.J.; Qiao, W.; Cao, Q.; Kang, W. Prospects of industrial consumption embedded final emissions: A revision on Chinese household embodied industrial emissions. Sci. Rep. 2020, 10, 1826. [Google Scholar] [CrossRef] [Green Version]
  52. Ali, Y. Measuring CO2 emission linkages with the hypothetical extraction method (HEM). Ecol. Indic. 2015, 54, 171–183. [Google Scholar] [CrossRef]
  53. Sajid, M.J. Structural decomposition and Regional Sensitivity Analysis of industrial consumption embedded emissions from Chinese households. Ecol. Indic. 2021, 122, 107237. [Google Scholar] [CrossRef]
  54. Sun, C.; Chen, L.; Xu, Y. Industrial linkage of embodied CO2 emissions: Evidence based on an absolute weighted measurement method. Resour. Conserv. Recycl. 2020, 160, 104892. [Google Scholar] [CrossRef]
  55. Sajid, M.J.; Shahni, N.; Ali, M. Calculating inter-sectoral carbon flows of a mining sector via hypothetical extraction method. J. Min. Environ. 2019, 10, 853–867. [Google Scholar] [CrossRef]
  56. Sajid, M.J. Inter-sectoral carbon ties and final demand in a high climate risk country: The case of Pakistan. J. Clean. Prod. 2020, 269, 122254. [Google Scholar] [CrossRef]
  57. Worldometer Countries in the World by Population. 2021. Available online: https://www.worldometers.info/world-population/population-by-country/ (accessed on 1 January 2021).
  58. Tiseo, I. Average PM 2.5 Levels in Most Polluted Countries Worldwide. 2019. Available online: https://0-www-statista-com.brum.beds.ac.uk/statistics/1135356/most-polluted-countries-in-the-world/#:~:text=Bangladesh%20had%20an%20average%20PM2,%20second%20most%20polluted%20country%2C%20Pakistan (accessed on 6 March 2021).
  59. Asian Development Bank COVID-19 Economic Impact Assessment Template. Available online: https://data.adb.org/dataset/covid-19-economic-impact-assessment-template (accessed on 11 May 2021).
  60. Eora Global MRIO Eora National IO Tables. Available online: https://worldmrio.com/countrywise/ (accessed on 1 January 2021).
  61. Leontief, W.W. Quantitative Input and Output Relations in the Economic Systems of the United States. Rev. Econ. Stat. 1936, 18, 105–125. [Google Scholar] [CrossRef] [Green Version]
  62. IMF Real GDP Growth. Available online: https://www.imf.org/external/datamapper/NGDP_RPCH@WEO/OEMDC/ADVEC/WEOWORLD/IND/CHN/PAK/BGD/IDN (accessed on 26 July 2021).
  63. Sajid, M.J.; Niu, H.; Xie, J.; Habib, M. Final consumer embedded carbon emissions and externalities: A case of Chinese consumers. Environ. Dev. 2021, 100642. [Google Scholar] [CrossRef]
  64. D’Adamo, I.; Falcone, P.M.; Martin, M.; Rosa, P. A sustainable revolution: Let’s go sustainable to get our globe cleaner. Sustainability 2020, 12, 4387. [Google Scholar] [CrossRef]
  65. Sajid, M.J. Economic consequences of resource trade-offs for special disaster-blessed industries: The case of COVID-19. In Proceedings of the 2020 International Conference on New Energy Technology and Industrial Development (NETID 2020), Dali, China, 18–20 December 2021; Volume 235, p. 02007. [Google Scholar]
  66. MacSwan, A. Factbox: The Economic Remedies for the Coronavirus. Available online: https://www.reuters.com/article/us-health-coronavirus-economy-policy-fac/factbox-the-economic-remedies-for-the-coronavirus-idUSKBN2121C4 (accessed on 3 April 2020).
  67. Štreimikienė, D.; Mikalauskienė, A.; Atkočiūnienė, Z.; Mikalauskas, I. Renewable energy strategies of the Baltic States. Energy Environ. 2019, 30, 363–381. [Google Scholar] [CrossRef]
Figure 1. Direct CO2 emissions under the no COVID-19 baseline scenario. Source: Constructed by the authors.
Sustainability 13 09312 g001
Figure 2. Country-wide aggregated emissions under different scenarios. Here, the base-line scenario presents CO2 emissions under the assumption of no COVID-19 pandemic. Source: Constructed by the authors.
Sustainability 13 09312 g002
Figure 3. The contribution of direct and indirect demand shocks to CO2 emissions reduction under different scenarios. Source: Constructed by the authors.
Sustainability 13 09312 g003
Figure 4. The sector-wide contribution of direct and indirect demand shocks to CO2 emissions reduction under different scenarios. Source: Constructed by the authors.
Sustainability 13 09312 g004
Figure 5. The sectoral sources of indirect emissions for BCIIP countries. Source: Constructed by the authors.
Sustainability 13 09312 g005
Publisher’s Note: MDPI stays neutral with regard to jurisdictional claims in published maps and institutional affiliations.

