Article

Comparing Impact Evaluation Evidence of EU and Local Development Policies with New Urban Agenda Themes: The Agri Valley Case in Basilicata (Italy)

by
Piergiuseppe Pontrandolfi
* and
Priscilla Sofia Dastoli
Department of European and Mediterranean Cultures, Environment, and Cultural Heritage (DICEM), University of Basilicata, 75100 Matera, Italy
*
Author to whom correspondence should be addressed.
Sustainability 2021, 13(16), 9376; https://0-doi-org.brum.beds.ac.uk/10.3390/su13169376
Submission received: 4 June 2021 / Revised: 27 July 2021 / Accepted: 14 August 2021 / Published: 20 August 2021
(This article belongs to the Special Issue Sustainability and Territorial Project Assessment)

Abstract

:
The European Union’s Cohesion Policy is the most important structural policy in terms of financial commitment, geographical size and time frame, aimed at redistributing wealth between regions and countries, to stimulate growth in areas whose development is lagging behind. The reach of the investments prompted the EU Commission to promote an impact evaluation of the European Structural Funds (SF); however, the impact evaluation of EU programs is almost neglected in the Italian regions. This paper is based on the results developed within the RI.P.R.O.VA.RE project and is aimed at defining an impact evaluation of EU SF and other regional funds, based on evidence derived from the analysis of a specific case study in the Agri Valley area (Basilicata, Italy). To develop the impact evaluation process, the euro amounts of all the individual policies organized according to the themes of the New Urban Agenda (NUA), the impact indicators and the trend for the municipalities are considered together, in order to obtain an overall trend for the entire case study area. An important result is achieved above all in the methodological approach to impact evaluation: the municipal territorial scale is taken into account; the maps illustrate the use of resources; regardless of the type of funding source since there is a comparison between the priority axes of the funds with the NUA issues; and indicators are developed with open data available at a national level. This experiment makes it possible to detect that, even in the face of significant investments, some substantial aspects that are part of the policy objectives remain unchanged or even worsen.

1. Introduction

In Europe, the debate on Cohesion Policy for the 2021–2027 programming cycle is beginning to feed in. Cohesion Policy is financed by the Cohesion Fund (FC) which has almost 46.7 billion euros; the European Regional Development Fund (ERDF), for which 226.3 billion euros are allocated, and the European Social Fund+ (FSE+), for which 101 billion is allocated [1]. For Italy, we are seeing a substantial increase in resources: in the period 2021–2027, the funds amount to about 43.5 billion euros, an increase of 29%, due to the updating of the criteria for the allocation of resources between the Member States.
The European Commission proposes a series of important changes with goals of simplicity, flexibility and efficiency; in particular, the 11 thematic objectives of the period 2014–2020 are replaced by five broader objectives: a smarter Europe, a greener and low-carbon Europe, a more connected Europe, a more social Europe and a Europe closer to citizens [2].
The role of the European Union is also fundamental as a response to the pandemic crisis [3] with the Next Generation EU (NGEU) [4,5]. It is a program of unprecedented scope and ambition, involving investment and reforms to accelerate the ecological and digital transition; improving the training of workers; and achieving greater gender, territorial and generational equity. For Italy, the NGEU represents a remarkable opportunity for development, investment and reform [6], which also provides for special interventions for territorial cohesion and the strengthening of the National Inland Areas Strategy (SNAI) [7,8,9].
The connection between EU Cohesion Policies and aspects related to evaluation was clearly stated by Barca [10], who in 2009 identified the principles of an EU Cohesion Policy and formulated recommendations for a broad reform based on ten “pillars”, in which there are two fundamental aspects: attention to results and the place-based approach [11].
The article deals with a topic of extreme importance in the implementation of EU regional policies, whose monitoring and evaluation methods are often more focused on the actual spending power than on their effects in terms of general increase in well-being, employment and environmental performance.
The document is interesting because it highlights the gaps in the impact evaluation of programs in the Italian regions and tries to put this issue back at the center of attention, trying to implement an impact evaluation—of urban development policies at a regional and local scale—with the tools available.
The originality of the research lies in comparing the investment priorities of the policies with the themes of the New Urban Agenda, to consider the social dimension of sustainable growth [12,13] and to make this methodology replicable in other locations; furthermore, it should be noted that indicators available at national level were used for the impact evaluation.
This research has developed in the framework of the project “Re-inhabiting countries. Operational Strategies for the Enhancement and Resilience of inland areas” (RI. P.R.O.VA. RE); the research project was funded by the “Call to promote research projects to support the implementation of the National Strategy for Sustainable Development (SNAI)” in the theme “Resilience of communities and territories”; the call was encouraged in 2019 by the current Ministry of Ecological Transition (MiTE). The project is structured around three research objectives: 1. Redesigning the geography of inland areas, 2. Understanding the Resilience of inland areas, and 3. Defining strategies for sustainable and resilient development; the latter objective includes this activity aimed at carrying out an analysis and evaluation of ongoing policies, as a knowledge phase for the third objective. The RI.P.R.O.VA.RE project focuses on two regions in southern Italy: Campania and Basilicata. Following the results of the objective 1 activity, three areas of experimentation were identified in the two regions: Matese and Ufita in Campania Region and Agri Valley in Basilicata Region, for a total of 58 municipalities in the inland areas.
The departments involved in the RIPROVARE project are the Department of Architecture and Industrial Design of the University of Campania Luigi Vanvitelli, the Department of Civil Engineering of the University of Salerno and the Department of European and Mediterranean Cultures, University of Basilicata (UniBas).
The UniBas research unit deals with the Agri Valley, which is located in the southwestern quadrant of Basilicata, between the Tyrrhenian and Ionian coasts. The research program covers territorial development investments, concerning EU instruments and a specific program active in the context of the Agri Valley called the Agri Valley Operational Program (POV). The POV is an impressive program of actions, inspired by regional economic planning lines and covering an enlarged territorial area, which activates the operation of all administrative levels, from regional to municipal. The Program is active in the regional territory affected by oil extraction, to invest the compensatory funds of royalties in a series of actions aimed at economic development and industrial growth. Previous studies investigated the conflicts in current development strategies running in this area highlighting structural weaknesses of the planning process [14,15,16,17].
The analysis and impact evaluation activities of territorial development policies are oriented to understand the Resilience of the inland areas [18], to deliver planning tools able to define strategies for sustainable and resilient development. To be clear, the Partnership Agreement on the National Strategy for Inland Areas (SNAI) [7] defines the inland areas as the sum of the Intermediate Areas (20′ < t < 40′), of the Peripheral Areas (40′ < t < 75′), and Ultra Peripheral Areas (t > 75′), based on the level of “periphery” from essential services.
The project’s choice to focus on the inland areas is also functional to explore the usefulness of the concept of “Resilience” [19], which is still the subject of different interpretations, in the triggering of processes of the revitalization of the inland areas [20,21]. Within SNAI, this concept has been identified as one of the four key keywords for triggering a development process based on the activation of local communities:
  • “Maintenance” of the territory and its natural resources;
  • “Prevention” of damage caused by natural hazard factors;
  • “Resilience”, a function of the wealth of natural, cultural resources but also of artefacts and the potential for use available to these territories;
  • “Adaptation”, with particular but not exclusive reference to the changing and difficult to predict climate change scenarios.
The SNAI argues that the “territorial capital” available to inland areas can be a factor of resilience, emphasizing that “inland areas—rich in environmental resources, knowledge, artefacts, potential for use—are reservoirs of resilience that can be used in the future in the evolution of relations with less resilient areas” [7]. The theoretical reference model to articulate the concept of Resilience in the RI.P.R.O.VA.RE project comes from the Gunderson and Holling studies [22] on the resilience of socio-ecological systems, of which territorial systems are clearly an expression. The authors point out that socioecological systems tend to develop according to evolutionary cycles structured in four phases: exploitation, conservation, release, and reorganization, which leads to the triggering of a new evolutionary cycle, characterized by new configurations of the system. The transition phase of the system—from decline to reorganization—requires high potential and high resilience [20].
A backward design approach has been adopted to identify critical development issues affecting local policies implementation the case study area: the Agri Valley in Basilicata region (Italy), as a precondition to stimulate a process of innovation and to develop a strategic perspective coherent with the principles of the New Urban Agenda (NUA) [23].
This research is divided into three sections:
  • the first contains a brief review of the main European Structural Funds and the local policies, followed by a study of the impact evaluation issues and the literature on the subject of the NUA;
  • the second describes the materials and methods used to assess the impact in a territory of experimentation in the Basilicata region, thanks to the organization of impact indicators within the priority themes of the NUA, to consider the social dimension of sustainable growth;
  • the third contains the first results of the experiment with the formulation of a hypothesis concerning the application of the principles of the NUA in the impact evaluation of Community and local policies.

2. Territorial Resilience and Development Policies’ Impact Evaluation

2.1. European and Local Policies: Connections and Conflicts

This study discusses the results of the ongoing policy analysis and evaluation in a specific case study area: the Agri Valley (see Figure 1). The scope includes twenty municipalities that, according to the SNAI classification, all fall within the inland areas (3 classified as Peripheral and 17 as Ultra Peripheral).
The Agri Valley is a remarkable inland area where multiple development policies are implemented; it means that local administrations consider different tools supporting local development strategies. In particular, we focus on Structural Funds (ERDF, FSE), the national fund (FSC) and local instrument (POV).
The first operation was to identify policies active in the areas of experimentation: the European Structural Funds and policies at a national level played a decisive role.
The Structural Funds that have been taken into consideration, for the 2014–2027 programming cycle, are the European Social Fund (FSE) and the European Regional Development Fund (ERDF). The FSE aims to improve training and employment opportunities throughout the European Union and to benefit people in conditions of greater vulnerability and at risk of poverty. It has the objective of consolidating the economic and social cohesion of the European Union by correcting the imbalances between regions, with particular attention to sustainable urban development (innovation and research, low-carbon economy). The FEASR fund was not taken into account because the data are not currently available, although agriculture represents a key aspect in some inland areas, such as the Agri Valley. The Development and Cohesion Fund (FSC) is, together with the European Structural Funds, the main financial instrument of the Italian Government through which policies for the development of economic, social and territorial cohesion and the removal of economic and social imbalances are implemented [24].
At the local level, the L.E.A.D.E.R., an acronym for Liaison Entre Actions de Développement de l’Economie Rurale, is an instrument of Community policies for the integrated and sustainable local development of rural areas. This instrument is based on the so-called bottom-up approach and focuses on local action groups (GALs) developing a multisectoral and integrated development strategy [25]. The Agri Valley is part of the GAL Leader Lucania Interiore that, despite being started in 2016, is in a state of standstill. In addition to the Leader GALs, specific intermunicipal programs sometimes insist, as in the case of the Agri Valley testing area in Basilicata, where the Agri Valley Operational Program (POV) was approved in 2003; the POV covers 35 municipalities and aims to strengthen the development of the territory affected by oil extraction. The goals that the POV wants to pursue are channeled into four lines of action:
A.
Safeguard and improvement the context of environmental livability, through the safeguarding of the balance environmental protection, the protection of architecture landscaping and the decor of the urban centers;
B.
Enhancement of the envelope of essential infrastructures;
C.
Improvement of the equipment of service for the elevation of quality of life;
D.
Increase in conditions and opportunities for lasting employability and sustainability through support to production activities, aimed at systems development and in coherence with the start of the Agri Valley National Park [26].
The outlined vision pursues a local development based on the strengthening and networking of local opportunities and existing services, in the logic of the city-district.

2.2. Key Issues Related to Impact Evaluation

The literature on public policy evaluation is very extensive [27,28,29,30,31,32]; the original meaning of the term evaluation has a very broad meaning, used in various contexts, which therefore needs to be framed within the limits of the analysis of the effects of public policies. A definition of evaluation encompasses the salient concepts of “effects of action”, and “analytical activity” is as follows: “Evaluation is a multidisciplinary analytical activity that uses the methods of the social sciences to judge the effects produced by the implementation of public action” [33]. It is also necessary to understand what the meaning of the implementation of the evaluation activity is. The evaluation is useful in two areas: on the one hand, to produce information that can help improve the program, and on the other, to measure the impact of the program on the target groups. In a more formalized way, Las Casas and Scorza [34] proposed a definition of the evaluation phases related to the project cycle [35]. Regulation No 1303/2013 [36] lays down general rules for the operation of Community funding and programs; the regulation in article 54 specifies “evaluations shall be carried out to improve the quality of the design and execution of programs and to assess their effectiveness, efficiency and impact.”
The impact evaluation is part of the ex post evaluation but focuses only on the impacts, i.e., the (nonimmediate) changes caused by the interaction of cluster projects on the territorial system affected by the interventions. The impact evaluation should try to answer the question “What is the impact or effect of the interventions carried out on the condition of the target groups or territories?” [37].
The information brochure prepared by the European Commission [38] for the period 2014–2020 states that “Managing authorities, together with project beneficiaries, must show the citizens of the region, as well as the media and politicians at all levels, the results of the investments made, while EU taxpayers have the right to know how their money is spent.”
In Italy, the management of the Structural Funds improved for the 2014–2020 programming cycle with the introduction of information and communication rules to address the critical issues that had arisen in previous cycles. In particular, there was difficulty in finding and comparing data and information on beneficiaries and the interventions financed, but there was also a largely insufficient knowledge of the results of the interventions both in terms of output (projects implemented) and outcomes (short- and long-term impacts) [39]. The Agency for Territorial Cohesion has remedied some of these critical issues with the creation of the OpenCoesione portal (it is a portal of the Agency for Territorial Cohesion created in 2012 and dedicated to information on the implementation of cohesion policy interventions). The information is released in an open-data format, allowing the possibility of reuse by citizens and researchers, and the data on the projects are published with considerable informative detail: thematic areas, locations, responsible parties and payments made for each intervention. Monitoring systems of this type are useful for constructing indicators that refer to the quantitative data of interventions, bringing out problems such as the dispersion of expenditure, in which Italy shows the highest degree of dispersion (almost 25% of the funds are allocated to headings such as technical assistance, tourism and culture).
In addition to the communication and information aspects, local managers of European policies are obliged to draw up evaluation documents during the implementation phases of EU programs to establish the effectiveness, efficiency and impact of the measures implemented. Evaluation documents are generally drawn up by regional offices because the regions and autonomous provinces represent the decentralized managing authorities of Community resources. It is a question of identifying a set of result and output indicators for each axis of the Structural Funds, entering the data at the beginning of the implementation of the program and establishing intermediate and final targets that must be achieved based on the funding allocated to each axis. The evaluation takes place according to the degree of achievement of the objectives, comparing the deviation of the values from the initial data.
Impact indicators are rarely included and calculated in evaluation documents, despite the extensive literature on the subject of impact evaluation by the European Community under the Structural Funds [39,40,41]. The impact evaluation of EU programs in evaluation documents of the Italian regions is almost neglected; this statement comes from a research on some evaluation documents of EU funds (in the regions: Basilicata, Calabria, Campania and Bolzano) and from a general research. In particular, interviews were carried out with the heads of the evaluation units of the European funds in some of the regions already mentioned, and it was discovered that they are not yet involved in carrying out the impact evaluation.
A large set of result and output indicators is present in the database of territorial indicators for development policies. Its construction represents one of the products provided for the Convention concluded between the National Statistical Institute (ISTAT) and the PON Management Authority “Governance and Institutional Capacity 2014–2020”, relating to the implementation of the Territorial and Sectorial Statistical Information Project for cohesion policies 2014–2020. The database contains 327 indicators (258 + 56 gender) available at a regional and provincial level, for macroarea and the target areas of the different development policy cycles, to have updated spatial data and indicators to observe the results gradually achieved by policies in the territories and support any reprogramming of resources [42]. Again, impact indicators are not included.
Currently, therefore, the evaluation of Community policies is only possible based on the result and output indicators, without being able to monitor the effects of the same policies. In addition, this type of monitoring is normally aggregated to the scale of the entire region, so that one cannot know the spending capacity or the margin for improvement of a part of the territory, such as inland areas or industrial areas. These are homogeneous data for the entire region that do not consider the inland dynamics of the same region, even for subregional areas already prepared for other policies.
The impact evaluation has little application because—to understand the real effects on the territory—suitable and differentiated evaluation tools for subregional areas would have to be implemented, starting from the information of the municipal level. Suffice to say, the Italian municipal administrations, with 4060 projects, are the beneficiaries who, after private individuals, manage the most significant amount of resources of the ERDF 2014–2020 program, equal to 3.2 billion euros out of a total of over 20 billion [40].
So far, extensive studies have been produced focused on understanding the dynamics of innovation, growth and employment in the regions. Much less effort has been made by researchers to analyze the effects of policies. Only recently has an emerging international scientific research on cohesion policy [42,43] offered new evaluation evidence produced in a counterfactual perspective [44]. Theoretically, according to this approach, the effect is defined as the difference between what happened after the implementation of a policy (factual situation) and what would have happened if that same policy had not been implemented (counterfactual situation); this definition is based on all the evaluation of the effects with the counterfactual approach [45].
Most of the background studies consider policy for the regions of Europe as a whole and therefore concern the aggregate functioning of cohesion policy in Europe. These studies concluded that the impact of cohesion policy in Europe is positive [44]. Becker et al. 2010 and 2013 [41] and Pellegrini et al. 2013 [46] took care to prove it for economic growth and employment; Ferrara et al. 2016 [47] for innovation and transport infrastructure. The impact was also investigated with respect to various aspects of heterogeneity, such as the quality of local governments (Accetturo et al. 2014) [48], the intensity of the expenditure financed (Cerqua and Pellegrini 2018) [49], the conditions of the regional context (Bachtrögler et al. 2017) [43] and the sectoral structure of the local economy (Percoco 2017) [50].
Another group of works, again based on counterfactual methods, has estimated the impact of EU cohesion policy in individual countries.
Mitze et al. (2012) examined the effect of regional subsidies on labor productivity growth in Germany and concluded that they are only effective up to a certain maximum treatment intensity. Bondonio and Greenbaum (2014) [51] focused on the effects of the policy on companies in Italy, demonstrating that here the effects of the programs are greater, the higher the economic value of the incentives. Barone et al. (2016) [52] examined the case of Abruzzo (Italy) to study the long-term effects of the policy, concluding that it fails to ensure a long-term growth path for the regions treated. Giua (2017) [53] focused on Southern Italy by estimating positive effects on regional employment in the sectors most encouraged (manufacturing, construction, tourism and commerce).
Studies that consider the minimum administrative unit coinciding with the municipal territory are still rare. We argue that the unit to be considered for the impact evaluation is the municipal one because it is closer to the citizens, it also takes into account the dynamics within the regions, and it is possible to act to improve the current conditions in a specific way.

2.3. The New Urban Agenda (NUA) Perspective

The New Urban Agenda was adopted in Quito (Ecuador), during the conference “Habitat III”, held from 17 to 20 October 2016. The overall objective that is to be achieved is that of the ‘right to the city’, which means ensuring acceptable requirements in terms of equity, accessibility, security, healthiness, resilience and sustainability [54]. The 175 points are structured in three parts: sustainable urban development, tools for effective implementation, modalities for monitoring and revising the action plan.
The NUA identifies 12 priority themes, which were considered for this paper: 1. Integration of migrants and refugees, 2. Air quality, 3. Housing, 4. Urban poverty, 5. Circular economy, 6. Climate Adaptation, 7. Energy transition, 8. Urban mobility, 9. Digital transition, 10. Public procurement, 11. Jobs and skills in the local economy, and 12. Sustainable use of land and nature-based solutions. The 12 themes of the Agenda are mainly aimed at cities, where 65% of global energy is consumed, and 70% of CO2 emissions are produced. However, in a country such as Italy, where 85% of municipalities have fewer than 10,000 inhabitants—mainly located in the inland areas—it is also necessary to pay attention to the policies and strategies of small municipalities and to the objectives that must be achieved by the “citizens” who live there [55,56]. The study, therefore, proposes a consideration on the investment priorities of the funds of a small inland area compared with themes of the NUA and on the coherence between former programs objectives and the future perspective of urban development policies.
Cohesion policy, particularly in the ERDF, also supports measures to ensure sustainable urban development, which represents the part that interests us; it is important to stress that all investments would have a different path if the social dimension of sustainable growth were put at the center, shifting our gaze to the citizen’s side [57]. This is where the perspective of the New Urban Agenda comes into play: all the countries involved have to commit to the improvement of urbanization through the “three-legged approach”: local fiscal systems, urban planning, basic services and infrastructure. The NUA also represents a commitment to a democratic development of countries and a driver for social enhancement in the respect of environment and urbanization. It claims themes such as equity, safety and resilience, as the prior focuses mainly on developing countries and in urban areas [58,59].

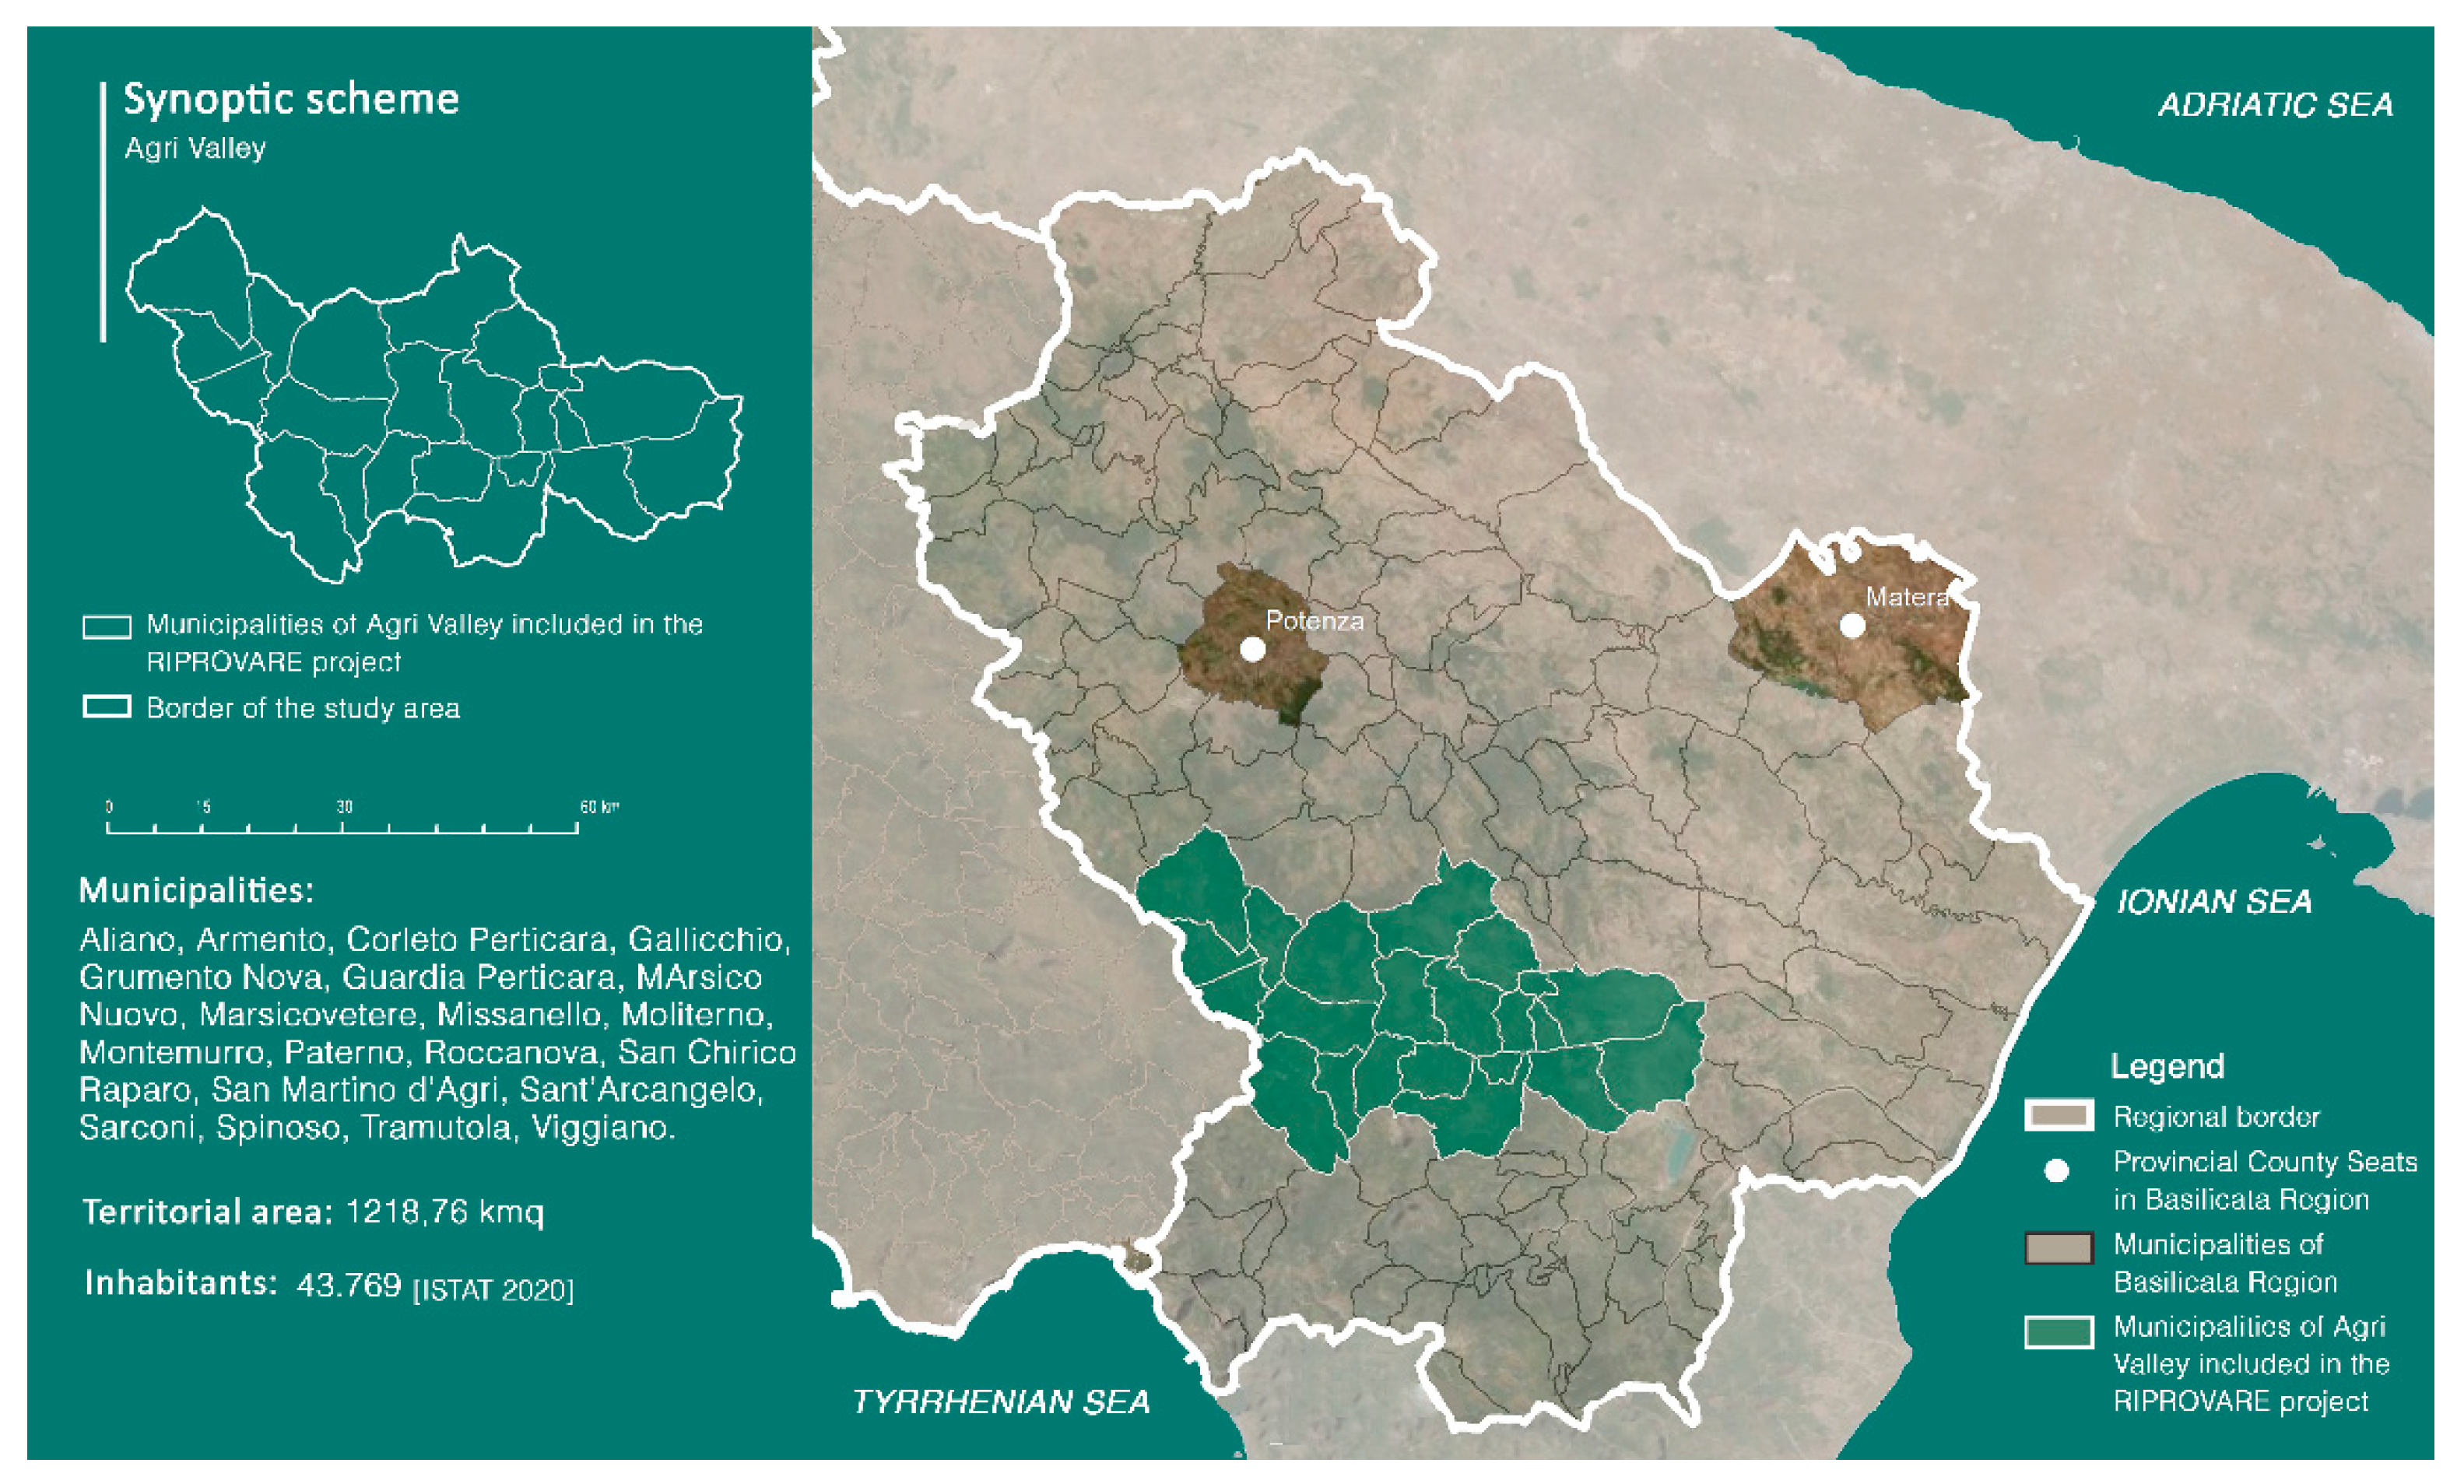
3. A Case Study from the Basilicata Region

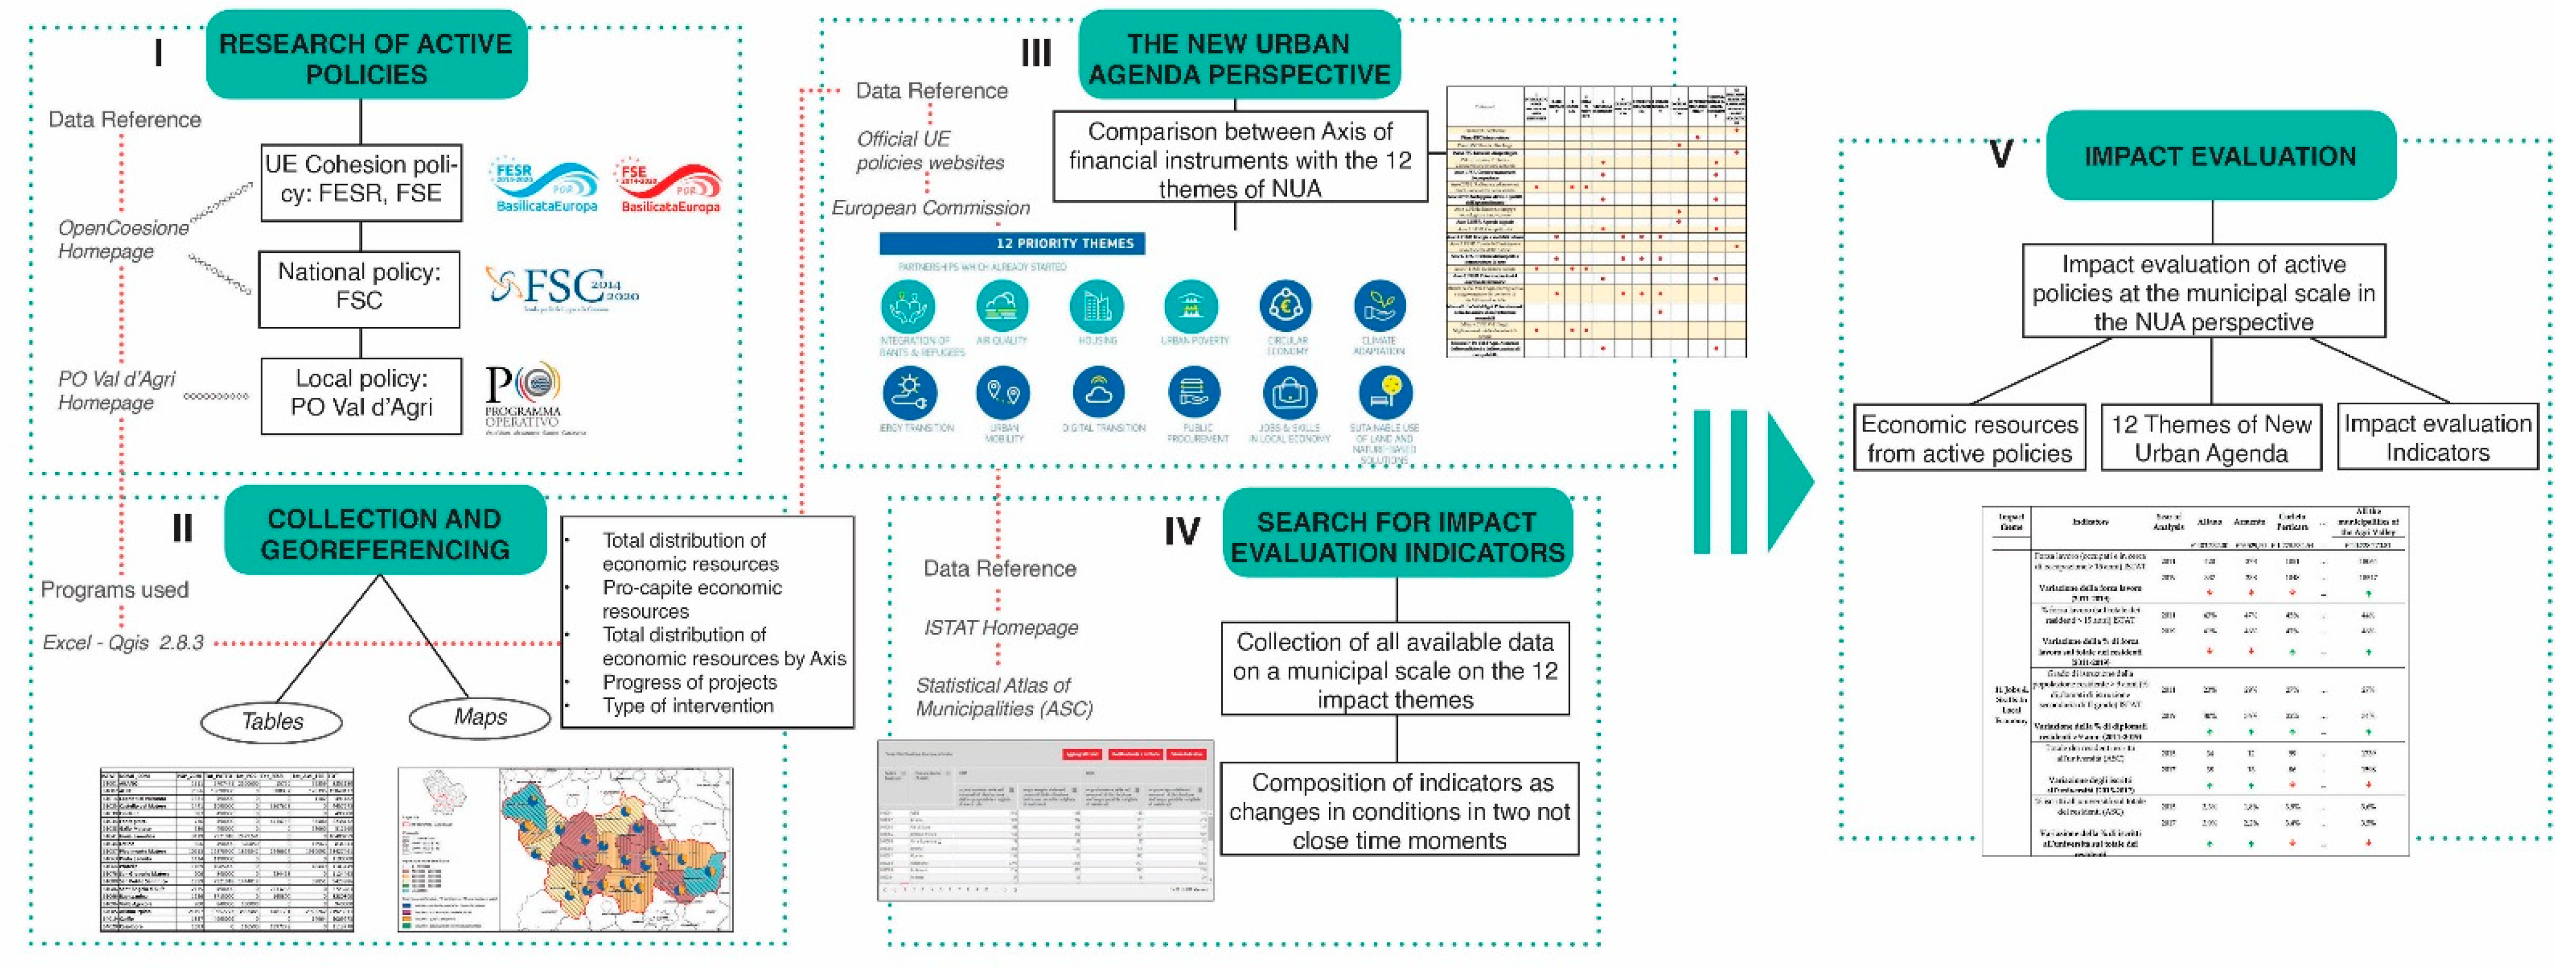
3.1. Materials and Methods

The collection of data on policies affecting the territory of Agri Valley was carried out on the official OpenCoesione website—concerning information on Community and national policies at the municipal level—and on the website of the Agri Valley Operational Program (POV) for information on local policy. On the OpenCoesione website, it is possible to download projects (projects.csv/metadata.xls) grouped both for each municipality and for the entire region of interest. The information that has been acquired for each project of the municipalities of Agri Valley [60,61,62,63] is as follows: public cost, payments made, the progress of the project, nature (type of operation), theme, program, and axis. On the POV website, on the other hand, local policy data are available, organized within annual reports on the activities carried out by all implementing actors.
Figure 2 shows a flowchart of the research process, highlighting input data sources, the procedural approach and the analytical phases leading to the conclusions.
The first operation (Action I) was to identify policies active in the areas of experimentation: the European Structural Funds, the national and local policies.
Then, there was the verification of the availability of data at the municipal level, which was followed by a phase of collection in a spreadsheet and georeferencing of the same in the GIS environment (Action II). All data were collected in a comma-separated values (.csv) table and join with the resident population data as of 1 January 2020 from ISTAT to be able to perform basic statistics identifying per capita impacts.
The collection phase is fundamental for building maps, which serve to understand the trend in the use of Community resources throughout the area, making a comparison between municipalities and between different types of funds. Maps are the basis for starting to reflect on the impact evaluation and spending capacity of small municipalities in an inland area.
In Action III “the new urban Agenda perspective”, each axis of financing instruments has been compared with the 12 themes of the NUA, to understand in what aspects the economic resources of the policies concerned affect; the comparison made it possible to find a table of correspondence (see Table 1).
It is important to stress that this step makes it possible to disregard policies affecting a specific area and to frame the analysis within the framework of the Sustainable Urban Development Goals.
In some cases, the themes have been grouped to constitute a single area of impact; this is the case of social inclusion in which they have merged: 1. Integration of migrants and refugees, 3. Housing, and 4. Urban Poverty. Each area of impact, or thematic, corresponds to the share of economic resources of the relevant axes.
After processing this initial information, the next step was to carry out an impact evaluation of Community and local policies on the whole territory of interest (Actions IV–V).
The approach used for impact evaluation is based on the composition of indicators that can assess the effects on the community and the environment for each theme. For each impact area, one or more indicators have been composed, based on the possibility of acquiring statistical data on the subject. Here, too, there is a gap on the part of the institutions: i) Municipal statistics in the public domain on issues related to the implementation of development policies, both Community and local, are lacking; and ii) ISTAT produces a lot of statistical data, but they are mostly aggregated by region or province, sometimes by provincial capital.
Facilitation is given by the Statistical Atlas of Municipalities (ASC), a dynamic web-tool which collects only ISTAT data at a municipal level. The indicators, therefore, were built on the available municipal statistical data, which must be acquired in two distant time moments, to see a change. One of the main reference years, if we consider above all ISTAT data, is 2011; the other reference year varies but generally relies on the permanent population census 2018–2019. In the data acquisition phase, the ideal condition occurs when considering time moments coinciding with the extremes of programming cycles (i.e., 2014 and 2020), but since the absence of data represents a gap in the evaluation of the impact on territories, the first experiment was put in place with the available data.

3.2. Results

The results are divided into two sections. The first is based on the production of maps that highlight the spatial distribution of the data, as a result of the phases of research of current policies and collection and georeferencing of data. The second section returns the impact evaluation through socioeconomic indicators and presents the comparison between the financial instrument axes and the 12 NUA themes.

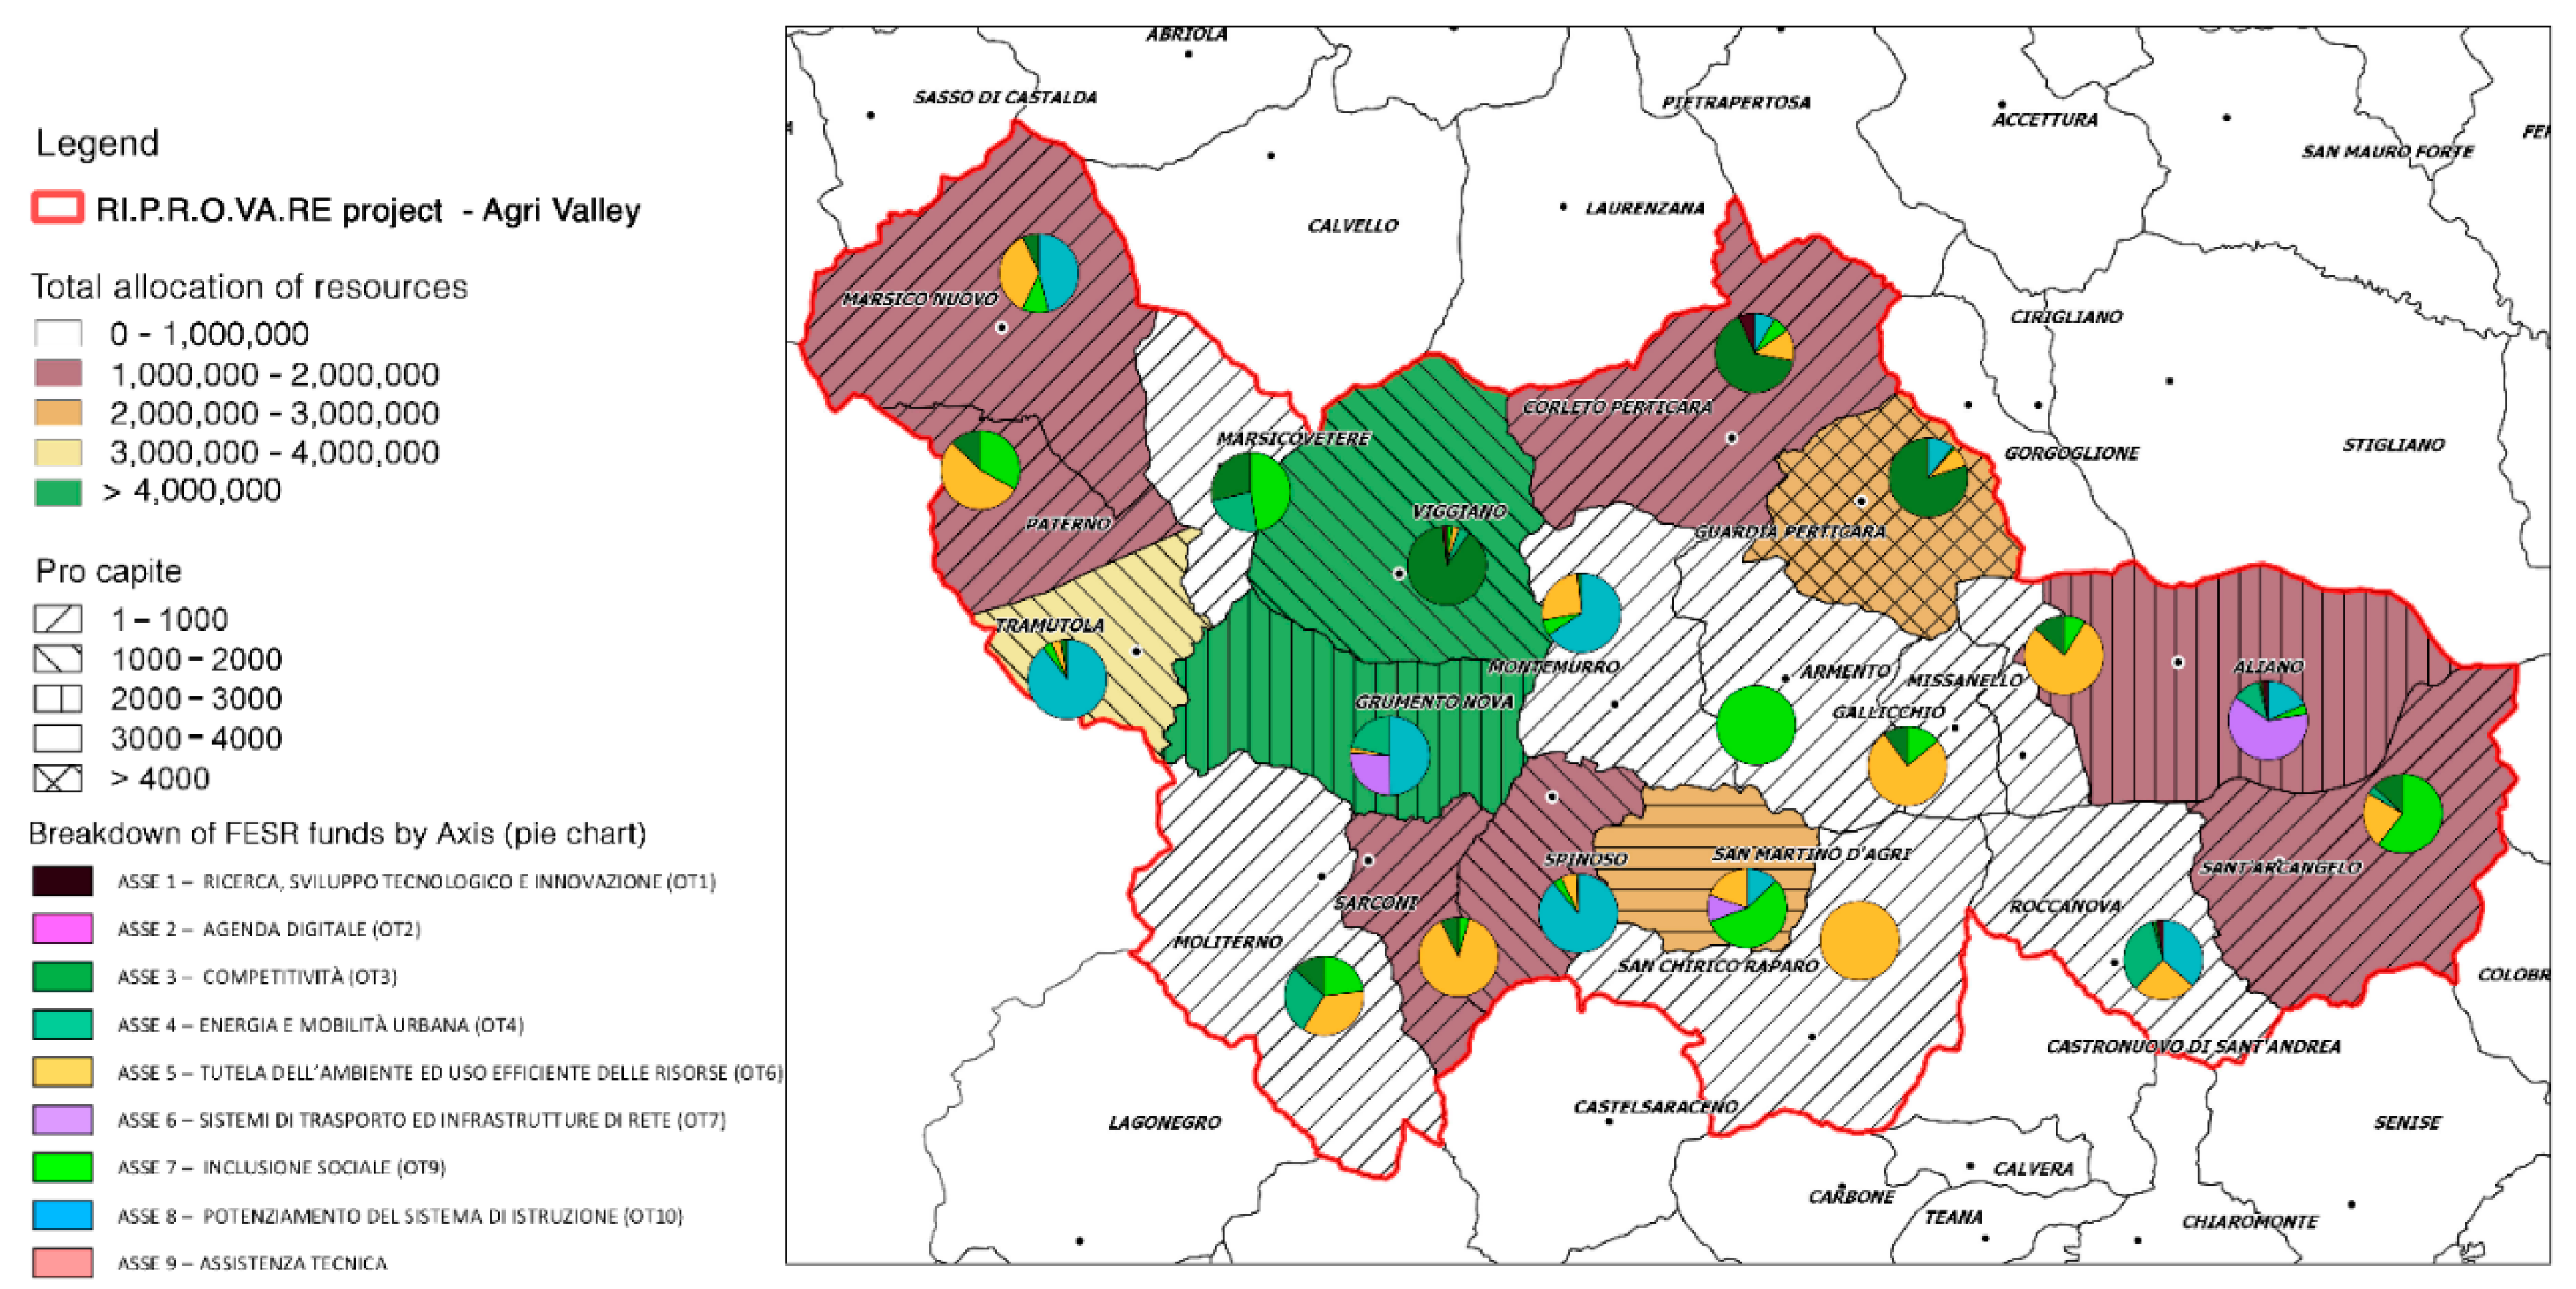
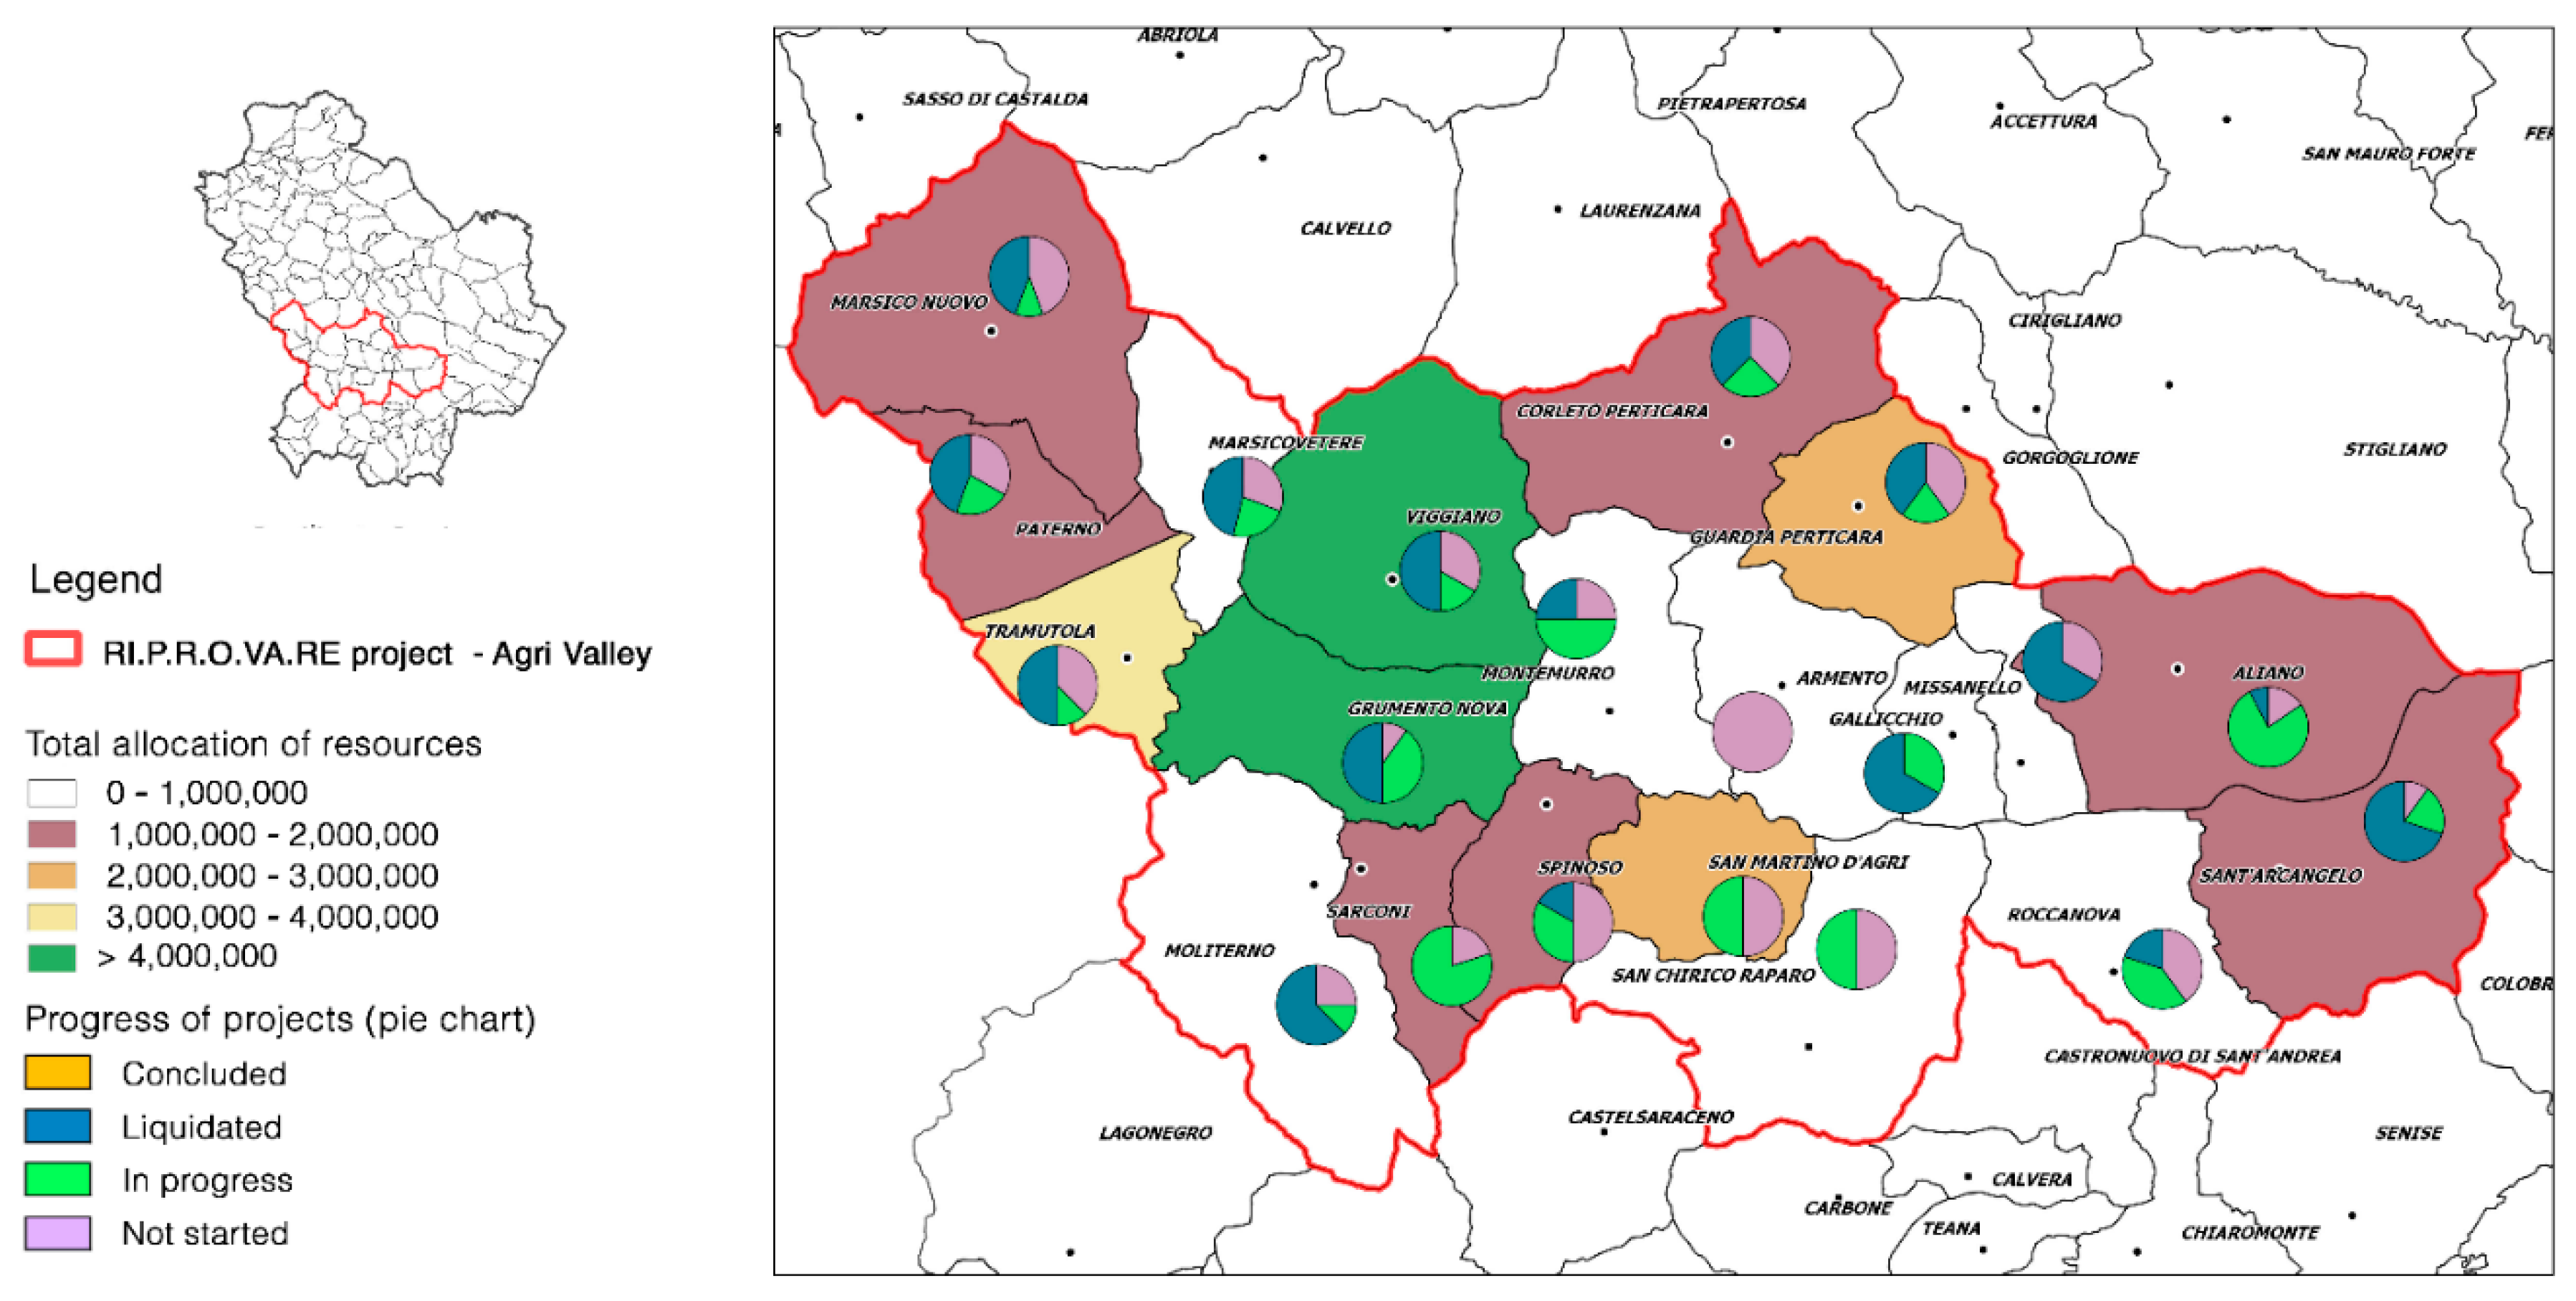
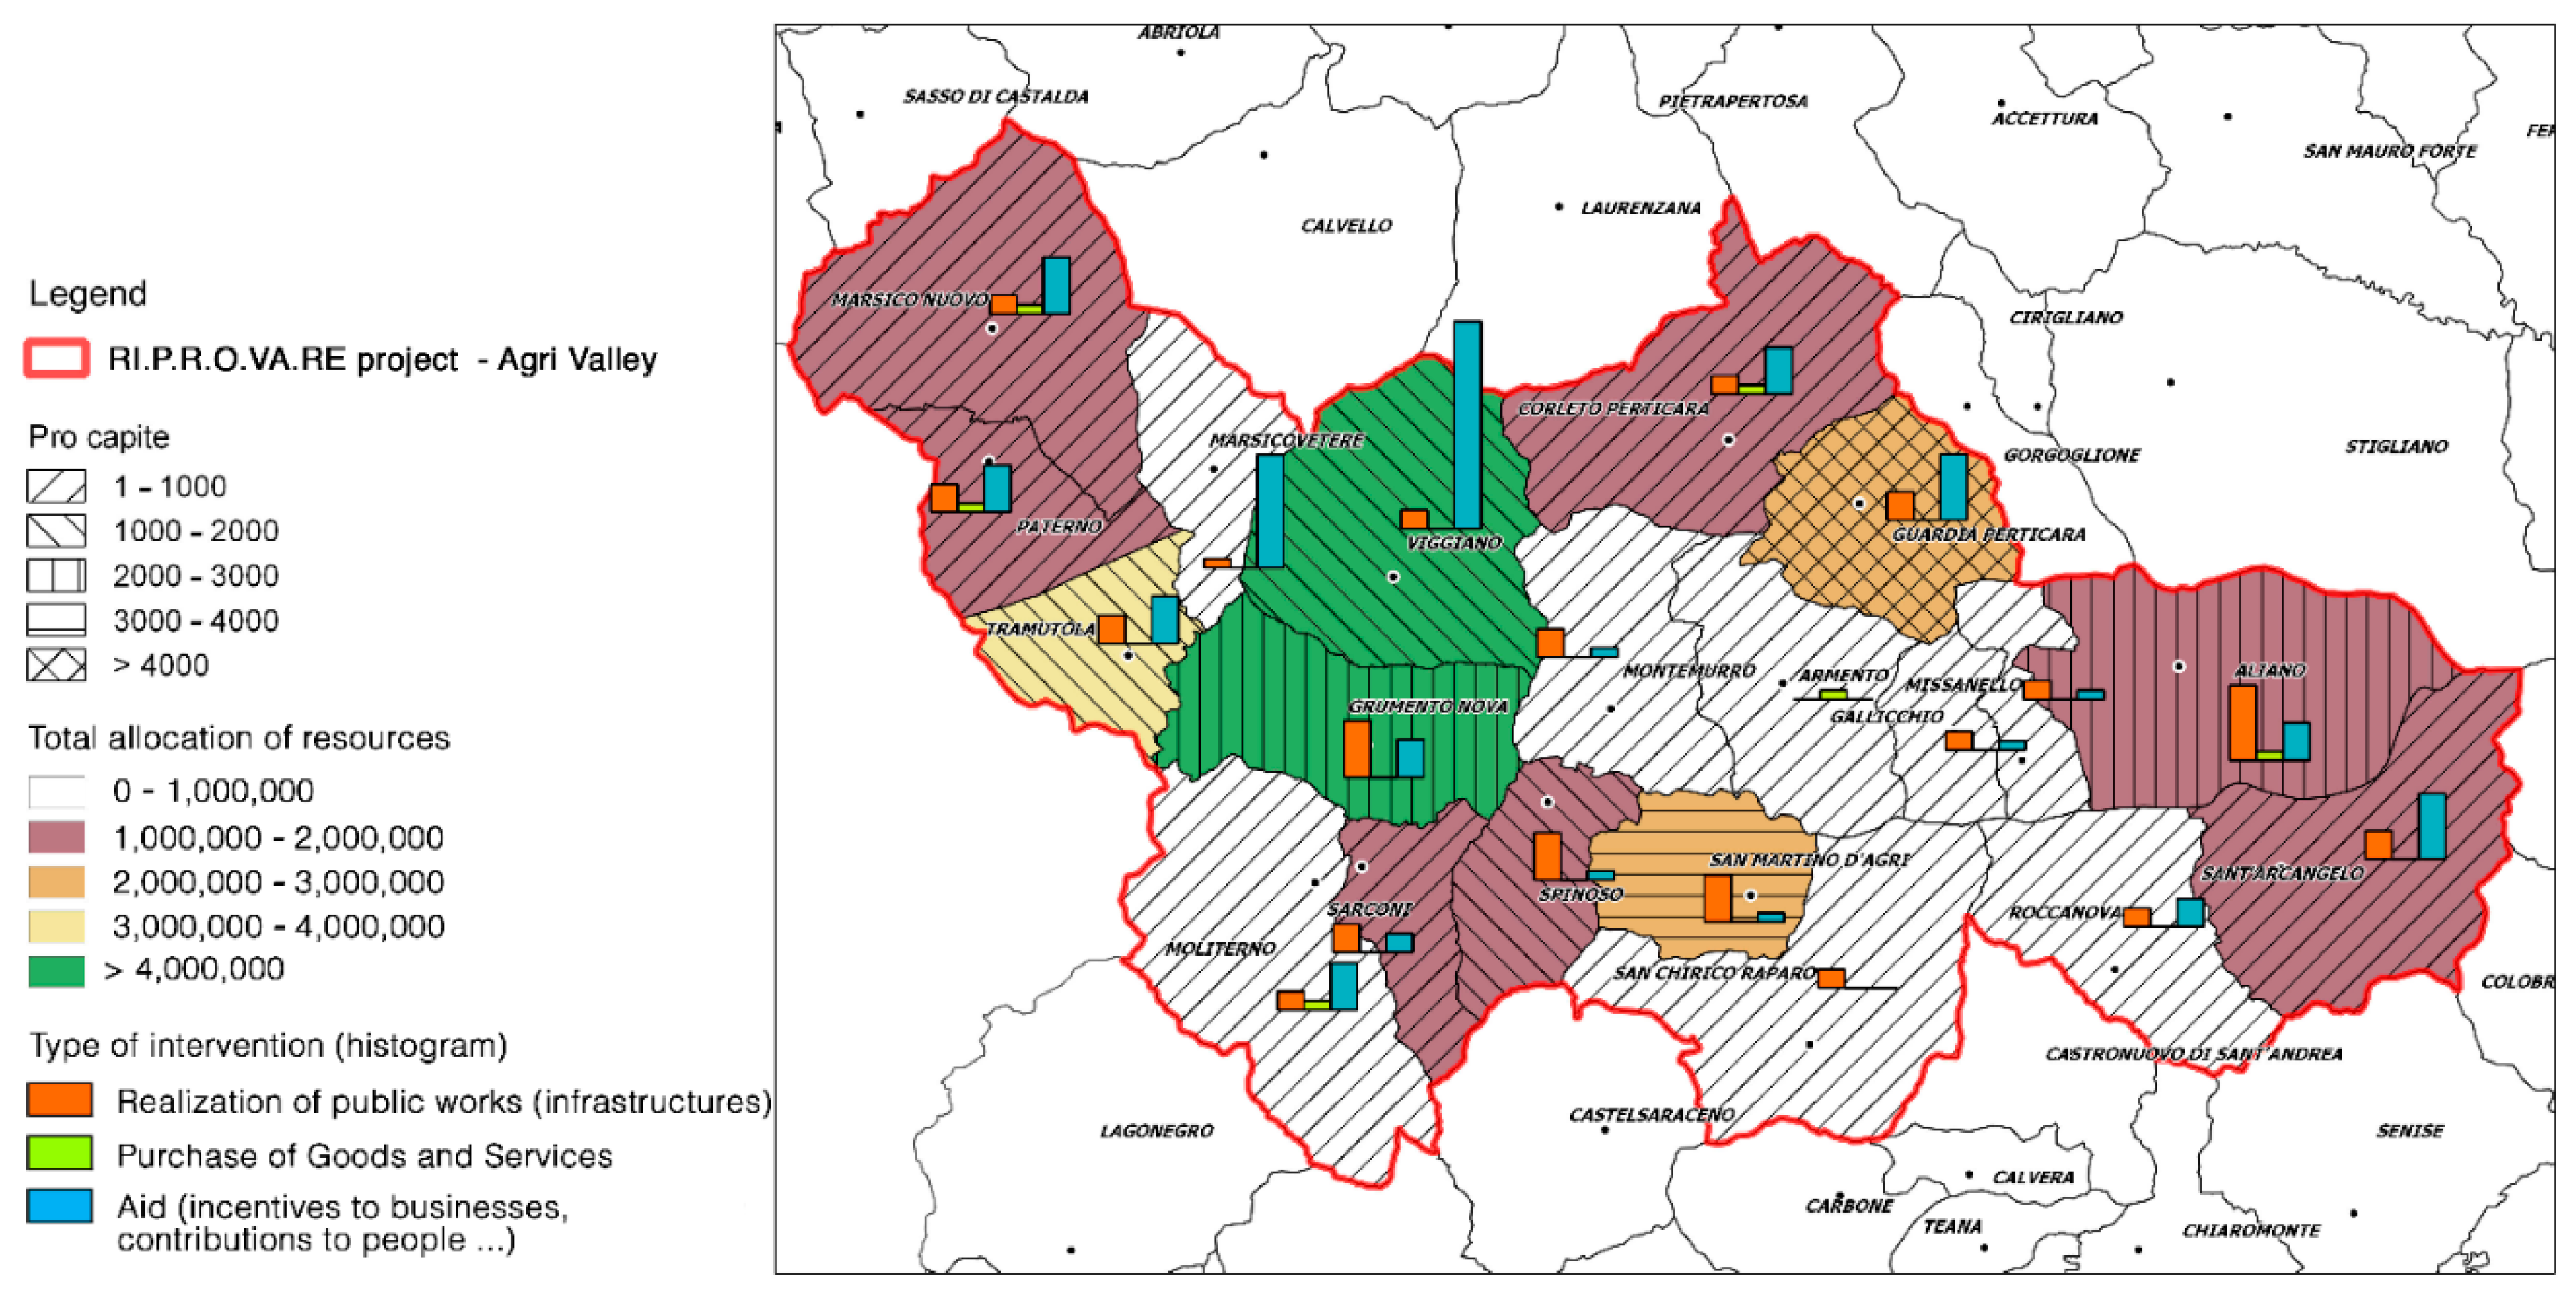
3.2.1. Localization of Active Policy Resources

The information acquired for each municipality allowed us to quantify the total public investments—planned and spent—divided in: the funding typologies, the total resources divided according to the priority axes of funds, the quantity of planned and implemented interventions, the number of interventions based on type (infrastructure, purchase of goods and services, and aid).
The results of data collection and location for the ERDF fund 2014–2020 in Agri Valley are reported in the following maps (see Figure 3, Figure 4 and Figure 5).
The map in Figure 3 shows the total resources activated by the ERDF Fund 2014–2020 and used in Agri Valley are approximately EUR 32 million; the largest resources were mobilized in the municipalities of Viggiano (5.8 million euros), Grumento Nova (4.2 million euros) and Tramutola (3.2 million euros). Instead, the municipalities that have benefited the least are Armento (25 thousand euros), San Chirico Raparo (200 thousand euros), Missanello (255 thousand euros) and Gallicchio (260 thousand euros).
The ratio of total resources to resident population per municipality, i.e., per capita value, is a basic indicator that allows comparing investment intensity with resident population. The range varies between 43 €/inhabitant and 4430 €/inhabitant. It is greater for the municipalities of Guardia Perticara (4430 €/inhabitant), San Martino d’Agri (3240 €/inhabitant), Grumento Nova (2560 €/inhabitant) and Aliano (2195 €/inhabitant); instead, it is lower for the municipalities of Armento (43 €/inhabitant) and Marsicovetere (95 €/inhabitant). There is great variability that describes a different ability of single municipalities to attract investments; this is partly true because many infrastructural investments have a value that is distributed throughout the area.
The pie chart in the map (see Figure 3) shows the breakdown of resources by the nine axes of the ERDF Basilicata. It should be said that Axis 2 (Digital Agenda) and Axis 9 (Technical Assistance) have had central management; therefore, there are no data at the municipal level. The axes with the most resources are Axis 3—Competitiveness (9 million) and Axis 8—Strengthening the education system (8.9 million), followed by Axis 5—Environmental protection and efficient use of resources (5.4 million) and Axis 7—Social inclusion (3.8 million); Axis 1—Research, technological development and innovation is the one that has had the least mobilization of resources (265 thousand). To these considerations are added those relating to the greater participation on the municipal territory by axis, which shows that for Axes 3, 5 and 7, there has been greater participation, so that only in 3–4 municipalities out of 20 have there been no projects. On the other hand, the projects related to Axis 6 and Axis 1 were those with the least participation on a municipal scale, respectively three municipalities and four municipalities.
Another fact is related to the diversification of projects per ERDF Axis: some municipalities developed projects only in one axis, while other groups of municipalities submitted projects on multiple axes of the program achieving a higher level of integration for the territorial investment (diversification of objectives). In the municipality of Aliano, there has been greater diversification (6/7), followed by Roccanova (5/7), Viggiano (5/7) and Corleto Perticara (5/7); instead, the municipalities where there was a use of monothematic resources were San Chirico Raparo (1/7) on Axis 5 and Armento (1/7) on Axis 7.
The second map (see Figure 4) shows that, of the 157 projects monitored in the Agri valley, 31% of which have not yet started, 30% are in progress and 39% have been liquidated, reporting a better state of progress than that of the regional scale, despite no project being completed. The municipalities with the most encouraging data are Gallicchio, Sant’Arcangelo and Moliterno; instead, the municipalities where the projects are still in an initial state are Armento, San Chirico Raparo, San Martino d’Agri and Sarconi.
In the third map (see Figure 5) by type of intervention, we mean:
  • Construction of public works (infrastructure),
  • Acquisition of goods and services,
  • Aid (incentives to enterprises, contributions to persons and capital contributions).
Of the 157 projects monitored in Agri Valley, 38% falls into the type of infrastructure (59 projects), 4% falls into the type related to purchases of goods and services, and the remaining 58% falls into the type of aid (92 projects); the data are clearly apparent from the graphic representation (b).
The municipalities in which the most infrastructure projects have been planned are Aliano (8 projects) and Grumento Nova (6 projects); in the aid typology, there were several interventions in the municipalities of Viggiano (22 projects) and Marsicovetere (12 projects).
More information results from the interpretation of the types of intervention; in particular, public action prevails in infrastructure and the most virtuous municipal administrations—Aliano, Grumento Nova, Spinoso and San Martino d’Agri—have focused on Social Inclusion, Education and Roads. As far as the type of aid, on the other hand, private action prevails, which emphasizes both an ability for the initiative and the presence of service poles, as in the case of Marsicovetere and Sant’Arcangelo, but also of entrepreneurs linked to the oil industry, as in the case of Viggiano and Guardia Perticara.
The previous map (Figure 5) shows not only the distribution by type of intervention but also the quantification of interventions in proportion to the municipal area. The municipalities where there have been a total of several interventions are Viggiano (24 projects), Marsicovetere and Aliano (13 projects); instead, the municipalities where the fewest interventions have been implemented are Armento (one project) and San Chirico Raparo (two projects).
The following map (see Figure 6) shows the total resources that have been planned and spent for each municipality, considering all the funds; the pie chart shows the incidence of each fund on the total of considered resources.
The final account of all funding instruments is summarized in this map (Figure 6), which also returns important information for future actions that will be implemented. The first aspect is that the municipalities that used the most of economic resources were Marsico Nuovo and Sant’Arcangelo, which exceeded the threshold of 10 million euros (for a detailed reading of the figures, see Table 2). The municipalities where there has been a lower use of resources are mostly neighboring and are also those with a smaller share of resident population, which is in sharp decrease; these municipalities are located in the center of the area under consideration. The local policy of the PO Agri Valley has had a strong impact compared to other sources of funding: as a percentage, the resources of the POV usually exceed half of the total, with few exceptions (Viggiano, Grumento Nova, Spinoso and Guardia Perticara). However, it must be said that the POV has been in place since 2003; therefore, many actions and projects are already consolidated, including management and implementation. For the remaining funds, on the other hand, the situation is very heterogeneous: there are the municipalities that have mainly benefited from the FSC (Marsico Nuovo, Moliterno and San Chirico) and the municipalities that have benefited mainly from the ERDF (Tramutola, Grumento Nova, Viggiano, Guardia Perticara and San Martino d’Agri). The FSE is the least successful fund in this area; only the municipality of Marsicovetere finds a noteworthy value.
Indicators presented in the previous maps are not sufficient for measuring investment performance and the ability to attract European resources in a specific territory, but the imbalance between municipalities is the expression of a weak territorial subsystem that is unable to participate in these development processes. This weakness represents a structural deficit and requires systemic actions as a precondition for the effective use of resources. Making a comparison of all the previous maps, it can be said that the resources invested and programmed in this area are limited, compared to the total resources available at the regional level. Municipalities that have spent less have not been able to attract community resources. However, their greatest income is linked to the resources of local policies because the POV has, over time, created a resource management structure very close to the communities, accompanying them toward the design and implementation of the works.
Small internal municipalities need more attention because they do not have the structures and staff suitable for supporting the bureaucratic aspects related to EU funds. Therefore, specific clauses must be foreseen in order to have more qualified personnel and to promote collaboration between more municipalities.

3.2.2. Impact Evaluation

The approach used for impact evaluation is based on the construction of indicators that can assess the effects on the community and the environment for each theme. The impact evaluation for the theme “11. Jobs and skills in the local economy” is reported as an example (see Table 1), which is connected to the topic of employment in the strict sense and to the educational system for entry into the world of work. The main questions for assessing the impacts of EU and local policies are as follows: What impact have they had on employment and skills in the local economy? What impact have they had on strengthening the education system?
The indicators that could be constructed are:
  • Change in the workforce (2011–2019),
  • Change in the % of the workforce in the total number of residents (2011–2019),
  • Change in the % of graduates residing >9 years (2011–2019),
  • Change in the % of graduates residing >9 years (2011–2019),
  • Change in university enrollees (2015–2017),
  • Change in the % of university enrollees in the total number of residents (2015–2017).
The data were acquired for each municipality, and the indicators were calculated. In the Table 3, a symbol indicating the trend (red and green arrows) was included. The complete table is included as an annex to this paper (see Appendix A); here, only data from three municipalities and the whole study area are presented. The sum of the statistical data for the twenty municipalities made it possible to understand what the trend was also for the entire area of the Val d’Agri, relative to that theme.
At the same time, the economic resources that have been invested by the policies taken into account have been indicated for each municipality and each theme. At this point, you can realistically answer the initial question: what is the impact or effect of the interventions carried out on the condition of the target groups or territories? For the theme “11. Jobs and skills in the local economy”, community and local policies, against an investment of more than 20.7 million euros, had a positive effect on the theme of work, with an increase of about 500 units corresponding to 2% of the workforce on the total number of residents. The results show that around EUR 42,000 was spent on each new person employed, if we consider the entire investment only on employment; it is neither a little nor a lot, but it clearly shows that there is still a strong disparity between the municipalities of the examined area. The impact of policies on education, on the other hand, shows that the level of education of the resident population has increased; however, the number of university enrollees fell by 141, but this corresponds to only 1% of residents. To limit the risk of using only quantitative data and to understand what the trends really are, it is necessary to support qualitative analyses.

4. Discussion

This contribution is the first experiment on the theme of impact evaluation which, despite its brevity, achieves preliminary results. It can be said that in Italy the debate on data, on their impact, and on how the results of development policies must be achieved—according to the specific territorial characteristics—is not at the top of the agenda of decision makers and regional management authorities. Concern is expressed about the evidence emerging from the evaluations conducted in this research: the attention of operators (including beneficiaries) and institutions has often focused only on the use of resources rather than working to network procedures, regulations and best practices, which could favor both a concrete evaluation of the impacts on territories and institutional models of management of the same most useful resources.
Secondly, there is a lack of monitoring and production of data and indicators at the municipal level, which is the basic level from which to launch an impact evaluation on territorial areas that do not coincide with the regional border, such as the Agri testing area. A level of local monitoring should already be provided in the Community Resource Evaluation Plans, in which the effects can be assessed through statistical data and indicators built specifically for that territorial scale. There is a lack of municipal statistical data on agriculture (Utilized Agricultural Area (UAA), digital divide (households with internet access from home) and energy transition (% of hybrid or electric vehicles on total means of transport).
The experimentation in the Agri Valley has revealed that the policy theme “11. Jobs and skills in the local economy” showed a very positive impact; however, the result was not the same for all issues. Furthermore, compared to over 109 million euros spent in last twenty years, there was also no positive impact on the depopulation trend.
Some indicators have been taken into consideration, which is expressive of the effects that development policies aim to generate in the territories (increase in job opportunities, etc.), and their evolution has been followed over time, over a period that is compatible with that of planning and within which we have to measure the first effects. In Table 3, these aspects emerge, and some variations, positive or negative, are observed.
To avoid absolutizing the value and objectivity of these data, in order for these first elements that come out to lead to more advanced conclusions, it is necessary to use qualitative analyses (interviews, questionnaires, etc.), which is part of the next actions foreseen within the project, i.e., a direct and qualitative verification with the main stakeholders of the area. The next actions of the project are aimed precisely at imagining participation activities in schools and in some municipalities, also through thematic Living Labs, aimed at verifying the evidence found in the impact evaluation.
There is no strict consistency between investments and effects on these variables. Probably, because there are few variables or these variables are not able to describe the expected effects, but since there are no significant variations on these aspects, there is a weakness in the overall strategy in this territory, which as a whole fails to generate concrete results and actual changes.

5. Conclusions

This paper comes from an activity developed within the RI. P.R.O.VA. RE project and experimented with the impact evaluation based on evidence derived from the analysis of the specific case study of Agri Valley, where the policies in progress have provided public investments for local sustainable development.
The results of the maps seem to confirm what emerged from studies at European level [41], i.e., when the institutional quality is higher at the local level in a broad sense—which includes both political and economic aspects, as well as formal and informal aspects—cohesion policy is more effective. In this case, the population also influences the institutional quality, since the number of municipal employees depends on the demographic class.
The effective use of resources depends on numerous variables; already in an internal area such as the Agri Valley, there is a significant imbalance which is the expression of a weak territorial subsystem that is unable to participate in these development processes. For this reason, it is essential to arrange structural accompanying actions in the weakest territories that can be identified only after having evaluated the effects, based on integrated and effective management of municipal data collection, monitoring of results and evaluation of effects on the territory.
It is argued that European policies and POV resources have influenced the neutral evolution of the socioeconomic system because the amount of resources is very significant and is not comparable with other ordinary loans, which nevertheless exist. Our impact evaluation proposal can be read in this way: in the face of a share of funding in a specific theme, has it then had a positive effect? In some cases, yes, it means affirming that the structure and organization of that specific axis has led to results; otherwise, if the trend continues to be negative, changes must be made in the management and structure of that axis because it is not causing any positive effect, despite the substantial share of resources. To avoid the risk of producing absolute results, the intention is to prepare an accurate qualitative analysis (interviews, questionnaires, Living Labs, participation activities, etc.) that can confirm or discredit our evaluation.
The impact evaluation based on the 12 themes of the New Urban Agenda can be a new model for monitoring the effects of EU policies on sustainable development issues and for improving the implementation of the program for the next programming cycle, stressing that a planning approach can address integrated sustainable, people-centered and inclusive urban and regional development issues.

Author Contributions

Conceptualization, P.P. and P.S.D.; methodology, P.P.; software, P.S.D.; validation, P.P. and P.S.D.; investigation, P.P. and P.S.D.; resources, P.P.; data curation, P.S.D.; writing—original draft preparation, P.S.D.; writing—review and editing, P.P. All authors have read and agreed to the published version of the manuscript.

Funding

This research received no external funding.

Institutional Review Board Statement

Not applicable.

Informed Consent Statement

Not applicable.

Data Availability Statement

Not applicable.

Conflicts of Interest

The authors declare no conflict of interest.

Appendix A

Table A1. The table exemplifies the evaluation process that considers the amounts in euros of all policies for the issues of the 11 NUA theme, the impact indicators and the trend for municipalities: improvement (green arrow), worsening (red arrow), stability (yellow arrows), in order to find an overall trend for the entire area.
Impact ThemeIndicatorsYear of AnalysisAlianoArmentoCorleto PerticaraGallicchioGrumento NovaGuardia Perticara
€ 403,232.00€ 9,529.50€ 12,78,534.54€ 105,760.00€ 2,125,550.00€ 2,349,556.19
11 Jobs and Skills In Local EconomyWorkforce (employed and job seekers > 15 years) ISTAT20114202781051340752212
20193372381048346694209
Change in the workforce (2011–2019)🡳🡳🡳🡱🡳🡳
% workforce (out of total residents > 15 years) ISTAT201143%47%45%43%49%41%
201941%46%47%46%48%42%
Change in % of the workforce on total residents (2011–2019)🡳🡳🡱🡱🡳🡱
Degree of education of the resident population > 9 years (% secondary school graduates) ISTAT201123%29%27%25%31%24%
201930%36%32%33%37%32%
Change in % of graduates resident > 9 years (2011–2019)🡱🡱🡱🡱🡱🡱
The total number of residents enrolled in the university (ASC)2015341299465019
2017381386485713
Change in university enrollments (2015–2017) 🡱🡱🡳🡱🡱🡳
% university enrolled on total residents (ASC)20153.3%1.8%3.9%5.2%2.9%3.4%
20173.9%2.2%3.4%5.4%3.4%2.4%
Variation in the % of university students on the total number of residents🡱🡱🡳🡱🡱🡳
Table A2. The table exemplifies the evaluation process that considers the amounts in euros of all policies for the issues of the 11 NUA theme, the impact indicators and the trend for municipalities: improvement (green arrow), worsening (red arrow), stability (yellow arrows), in order to find an overall trend for the entire area.
Impact
Theme
IndicatorsYear of AnalysisMarsico NuovoMarsicovetereMissanelloMoliternoMontemurroPaternoRoccanovaSan Chirico Raparo
€ 1,125,748.84€ 680,194.96€ 45,750.00€ 270,234.01€ 540,867.20€ 292,554.46€ 280,961.50€ 30,080.00
11 Jobs and Skills InLocal EconomyWorkforce (employed and job seekers > 15 years) ISTAT20111594231117217005291208565404
20191612261419916044871333549337
Change in the workforce (2011–2019) 🡱🡱🡱🡳🡳🡱🡳🡳
% workforce (out of total residents > 15 years) ISTAT201141%51%35%45%45%41%39%39%
201945%56%41%48%46%47%43%38%
Change in % of the workforce on total residents (2011–2019) 🡱🡱🡱🡱🡱🡱🡱🡳
Degree of education of the resident population > 9 years (% secondary school graduates) ISTAT201128%32%25%32%25%26%22%25%
201933%37%32%36%31%33%31%31%
Change in % of graduates resident > 9 years (2011–2019) 🡱🡱🡱🡱🡱🡱🡱🡱
The total number of residents enrolled in the university (ASC)201521725522141451014929
20171822332312347844435
Change in university enrollments (2015–2017) 🡳🡳🡱🡳🡱🡳🡳🡱
% university enrolled on total residents (ASC)20155.2%4.6%3.8%3.4%3.6%3.0%3.1%2.7%
20174.5%4.2%4.1%3.1%3.9%2.5%3.0%3.4%
Variation in the % of university students on the total number of residents 🡳🡳🡱🡳🡱🡳🡳🡱
Table A3. The table exemplifies the evaluation process that considers the amounts in euros of all policies for the issues of the 11 NUA theme, the impact indicators and the trend for municipalities: improvement (green arrow), worsening (red arrow), stability (yellow arrows), in order to find an overall trend for the entire area.
Impact ThemeIndicatorsYear of AnalysisSan Martino D’agriSant’ArcangeloSarconiSpinosoTramutolaViggianoAll The Municipalities of The Agri Valley
€ 305,110.00€ 566,260.20€ 123,272€ 1,409,374€ 3,268,382€ 5,517,317€ 20,728,270.81
11 Jobs and Skills In Local EconomyWorkforce (employed and job seekers > 15 years) ISTAT201125325075415741260139318064
201925326235975681307159218547
Change in the workforce (2011–2019)🡰🡲🡱🡱🡳🡱🡱🡱
% workforce (out of total residents > 15 years) ISTAT201135%45%45%42%47%52%44%
201939%48%48%45%50%56%46%
Change in % of the workforce on total residents (2011–2019)🡱🡱🡱🡱🡱🡱🡱
Degree of education of the resident population > 9 years (% secondary school graduates) ISTAT201121%25%29%29%29%30%27%
201929%32%37%36%35%38%34%
Change in % of graduates resident > 9 years (2011–2019)🡱🡱🡱🡱🡱🡱🡱
The total number of residents enrolled in the university (ASC)2015312425349151941739
20172721441561341001598
Change in university enrollments (2015–2017)🡳🡳🡳🡱🡳🡱🡳
% university enrolled on total residents (ASC)20153.8%3.7%3.8%3.3%4.9%2.9%3.6%
20173.6%3.3%2.9%3.9%4.4%3.0%3.5%
Variation in the % of university students on the total number of residents🡳🡳🡳🡱🡳🡱🡳

References

  1. European Commission EU Budget for the future Cohesion Policy 2021-27. Torino, Italy, 28 June 2018; pp. 2–4. Available online: http://www.cittametropolitana.torino.it/cms/risorse/europa/CP_2021-27_Torino_28.6.18.pdf (accessed on 17 May 2021).
  2. Reppel, K. Future Cohesion Policy Objective 1: A Smarter Europe-Innovative & Smart Economic Transformation. Available online: https://ec.europa.eu/regional_policy/sources/policy/communication/regional_offices/0512_smarter_eu.pdf (accessed on 17 May 2021).
  3. Murgante, B.; Borruso, G.; Balletto, G.; Castiglia, P.; Dettori, M. Why Italy first? Health, geographical and planning aspects of the COVID-19 outbreak. Sustainability 2020, 12, 5064. [Google Scholar] [CrossRef]
  4. De la Porte, C.; Jensen, M.D. The next generation EU: An analysis of the dimensions of conflict behind the deal. Soc. Policy Adm. 2021, 55, 388–402. [Google Scholar] [CrossRef]
  5. Ladi, S.; Tsarouhas, D. EU economic governance and Covid-19: Policy learning and windows of opportunity. J. Eur. Integr. 2020, 42, 1041–1056. [Google Scholar] [CrossRef]
  6. Camera Dei Deputati Homepage-Piano Nazionale Di Ripresa E Resilienza. Available online: https://www.governo.it/sites/governo.it/files/PNRR.pdf (accessed on 17 May 2021).
  7. Accordo di Partenariato 2014–2020,Strategia Nazionale per le Aree Interne: Definizione, Obiettivi, Strumenti e Governance. Available online: https://www.miur.gov.it/documents/20182/890263/strategia_nazionale_aree_interne.pdf/d10fc111-65c0-4acd-b253-63efae626b19 (accessed on 17 May 2021).
  8. Di Giusy, P.; Laura, S. Toward an Italian National Strategy for Inner Areas 2.0, as an opportunity of institutional learning. Lessons from an action-research process. Archivio di Studi Urbani e Regionali 2020, 47–70. [Google Scholar] [CrossRef]
  9. Agriregionieuropa. Il Ruolo Dei Comuni Ed Il Requisito Associativo Nella Strategia Nazionale “Aree Interne” (Snai). Available online: https://agriregionieuropa.univpm.it/it/content/article/31/45/il-ruolo-dei-comuni-ed-il-requisito-associativo-nella-strategia-nazionale-aree (accessed on 17 May 2021).
  10. An Agenda for a Reformed Cohesion Policy: A Place-Based Approach To Meeting European Union Challenges And Expectations. Available online: https://ec.europa.eu/regional_policy/archive/policy/future/pdf/report_barca_v0306.pdf (accessed on 17 May 2021).
  11. Las Casas, G.; Scorza, F. Un approccio “contex based” e “valutazione integrata” per il futuro della programmazione operativa regionale in Europa. In Lo Sviluppo Territoriale Nell’economia Della Conoscenza; Bramanti, A., Salone, C., Eds.; FrancoAngeli: MIlano, Italy, 2009; pp. 253–274. [Google Scholar]
  12. Pan, H.; Page, J.; Cong, C.; Barthel, S.; Kalantari, Z. How ecosystems services drive urban growth: Integrating nature-based solutions. Anthropocene 2021, 35, 100297. [Google Scholar] [CrossRef]
  13. Munda, G. Social multi-criteria evaluation for urban sustainability policies. Land Use Policy 2006, 23, 86–94. [Google Scholar] [CrossRef]
  14. Las Casas, G.; Scorza, F.; Murgante, B. Conflicts and Sustainable Planning: Peculiar Instances Coming from Val D’agri Structural Inter-municipal Plan. In Smart Planning: Sustainability and Mobility in the Age of Change; Papa, R., Fistola, R., Gargiulo, C., Eds.; Springer: Berlin/Heidelberg, Germany, 2018; pp. 163–177. [Google Scholar]
  15. Las Casas, G.; Scorza, F. Discrete spatial assessment of multi-parameter phenomena in low density region: The Val d’agri case. In Proceedings of the International Conference on Computational Science and Its Applications– ICCSA 2015, Banff, AB, Canada, 22–25 June 2015; Springer: Berlin/Heidelberg, Germany, 2015; pp. 813–824. [Google Scholar]
  16. Las Casas, G.; Murgante, B.; Scorza, F. Regional local development strategies benefiting from open data and open tools and an outlook on the renewable energy sources contribution. In Smart Energy in the Smart City; Springer International Publishing: Basel, Switzerland, 2016; pp. 275–290. [Google Scholar]
  17. Las Casas, G.; Scorza, F.; Murgante, B. Razionalità a-priori: Una proposta verso una pianificazione antifragile. Sci. Reg. 2019, 18, 329–338. [Google Scholar] [CrossRef]
  18. Dastoli, P.S.; Pontrandolfi, P. Strategic guidelines to increase the resilience of inland areas: The case of the Alta Val d’Agri (Basilicata-Italy). In Proceedings of the the 21st International Conference on Computational Science and Applications (ICCSA 2021), Cagliari, Italy, 13–16 September 2021. [Google Scholar]
  19. Zuniga-Teran, A.A.; Gerlak, A.K.; Mayer, B.; Evans, T.P.; Lansey, K.E. Urban resilience and green infrastructure systems: Towards a multidimensional evaluation. Curr. Opin. Environ. Sustain. 2020, 44, 42–47. [Google Scholar] [CrossRef]
  20. Galderisi, A.; Fiore, P.; Pontrandolfi, P. Strategie Operative per la valorizzazione e la resilienza delle Aree Interne: Il progetto RI.P.R.O.VA.RE. BDC Boll. Del Cent. Calza Bini 2020, 20, 297–316. [Google Scholar] [CrossRef]
  21. Dastoli, P.S.; Pontrandolfi, P. Security and resilience in small centres of inland areas. In Proceedings of the The 21st International Conference on Computational Science and Applications (ICCSA 2021), Cagliari, Italy, 13–16 September 2021. [Google Scholar]
  22. Holling, C.; Gunderson, L.H. Resilience and adaptive cycles. Panarchy Underst. Transform. Hum. Nat. Syst. 2002, 25–62. Available online: http://www.loisellelab.org/wp-content/uploads/2015/08/Holling-Gundersen-2002-Resilience-and-Adaptive-Cycles.pdf (accessed on 5 May 2021).
  23. European Commission. Urban Agenda for the EU. Pact of Amsterdam; European Commission: Amsterdam, The Netherlands, 2016; Available online: https://ec.europa.eu/regional_policy/sources/policy/themes/urban-development/agenda/pact-of-amsterdam.pdf (accessed on 14 May 2021).
  24. Camera dei Deputati Homepage-Il Fondo Per Lo Sviluppo e La Coesione 2014-2020: Le Risorse Aggiuntive Nazionali. Available online: https://temi.camera.it/leg17/temi/la_programmazione_e_l_utilizzo_delle_risorse_del_fondo_per_lo_sviluppo_e_la_coesione_2014_2020_d_d (accessed on 5 May 2021).
  25. Leader 2014–2020 Homepage -Il Leader in Italia. Available online: https://www.reterurale.it/flex/cm/pages/ServeBLOB.php/L/IT/IDPagina/16938 (accessed on 5 May 2021).
  26. Programma Operativo Val d’Agri- Melandro-Sauro-Camastra Homepage. Available online: http://www.povaldagri.basilicata.it/ (accessed on 5 May 2021).
  27. Dziekan, K.; Riedel, V.; Müller, S.; Abraham, M.; Kettner, S.; Daubitz, S. Evaluation Matters. A Practitioners’ Guide to Sound Evaluation for Urban Mobility Measures; Waxmann, Ed.; Tesinska Tiskarna, A.S.: Münster, Germany, 2013; ISBN 978-3-8309-2881-2. Available online: https://www.researchgate.net/publication/304538182_Evaluation_matters_A_practitioners'_guide_to_sound_evaluation_for_urban_mobility_measures (accessed on 5 May 2021).
  28. Rossi, P.H.; Lipsey, M.W.; Henry, G.T. Evaluation: A Systematic Approach; SAGE Publications: Thousand Oaks, CA, USA, 2018; ISBN 9781506307893. [Google Scholar]
  29. European Commission. EVALSED: The Resource for the Evaluation of Socio-Economic Development. 2008. Available online: https://www.adcoesao.pt/sites/default/files/avaliacao/evalsed_the_resource_for_the_evaluation_of_socio-economic_development.pdf (accessed on 5 May 2021). [CrossRef]
  30. Weiss, C.H. The interface between evaluation and public policy. Evaluation 1999, 5, 468–486. [Google Scholar] [CrossRef]
  31. Weiss, C.H. Theory-based evaluation: Past, present, and future. New Dir. Eval. 1997, 1997, 41–55. [Google Scholar] [CrossRef]
  32. Mistretta, P.; Garau, C. Città e Sfide. Conflitti e Utopie. Strategie di Impresa e Politiche del Territorio Successi e criticità dei Modelli di Governance; CUEC editrice: Cagliari, Italy, 2013; ISBN 978-88-8467-832-4. [Google Scholar]
  33. Martini, A. Cinque modi di interpretare la “valutazione.” In Valutare gli Effetti delle Politiche Pubbliche. Metodi e Applicazioni al Caso Italiano; Stampa Tipograf srl: Roma, Italy, 2006; pp. 19–32. [Google Scholar]
  34. Las Casas, G.B.; Scorza, F. Comprehensive Evaluation: A renewed approach for the future of European Regional Convergence Policies. In Proceedings of the European Society Biennal Conference “Building for the Future: Evaluation in Governance, Development and Progress”, Lisbon, Portugal, 1–3 October 2008. [Google Scholar]
  35. Las Casas, G.B. La valutazione dei piani. In Mezzogiorno e Scienze Regionali: L’analisi e la Programmazione; Franco Angeli: MIlano, Italy, 1992. [Google Scholar]
  36. Rete Rurale Nazionale 2014–2020 Homepage-Regolamento n. 1303/2013. Available online: https://www.reterurale.it/flex/cm/pages/ServeBLOB.php/L/IT/IDPagina/14733 (accessed on 6 May 2021).
  37. Di Napoli, R.; Ricci, C. Vademecum. La Valutazione di Leader a Livello Locale; CREA-Centro Politiche e Bioeconomia: Roma, Italy, 2019; ISBN 978-88-9959-554-8. Available online: http://www.galsibaritide.it/wp-content/uploads/2017/11/Vademecum-LEADER-Misura-19.pdf (accessed on 3 May 2021).
  38. European Commission. Ensuring the Visibility of Cohesion Policy: Information and Communication Rules 2014–2020; Cohesion Policy: March 2014; 20 March; p. 2. Available online: https://ec.europa.eu/regional_policy/sources/docgener/informat/2014/visibitily_en.pdf (accessed on 7 May 2021). [CrossRef]
  39. Di Rienzo, M. La Trasparenza Nell’uso dei Fondi Strutturali. Il Ruolo Delle Pubbliche Amministrazioni Beneficiarie. Available online: http://eventipa.formez.it/sites/default/files/allegati_eventi/DI_Rienzo.pdf (accessed on 6 May 2021).
  40. 41 La Repubblica Homepage. 2019. Available online: https://www.repubblica.it/dossier/esteri/fondi-strutturali-europei-progetti-italia/2019/12/31/news/l_europa_in_comune_quando_i_fondi_strutturali_aiutano_il_sindaco-244709880/ (accessed on 21 May 2021).
  41. Becker, S.O.; Egger, P.H.; Von Ehrlich, M. Absorptive Capacity and the Growth and Investment Effects of Regional Transfers: A Regression Discontinuity Design with Hetero_geneous Treatment Effects. Am. Econ. J. 2013, 5, 29–77. [Google Scholar] [CrossRef] [Green Version]
  42. 40 ISTAT Homepage. Available online: https://www.istat.it/it/archivio/16777 (accessed on 7 May 2021).
  43. Bachtrögler, J.; Fratesi, U.; Perucca, G. The Influence of the Local Context on the Implementation and Impact of EU Cohesion Policy. Regional Stud. 2017, 54, 21–34. [Google Scholar] [CrossRef] [Green Version]
  44. Crescenzi, R.; Guia, S. Politica di coesione in Europa: A quali Paesi conviene? Un confronto di evidenze controfattuali per Germania, Italia, Regno Unito e Spagna. In L’impatto della Politica di Coesione in Europa e in Italia; Senato della Repubblica Italiana: Roma, Italy, 2018; pp. 57–66. [Google Scholar]
  45. Strada, G.; Martini, A. L’approccio controfattuale alla valutazione degli effetti delle politiche pubbliche. Mater. UVAL 2011, 22, 28–45. [Google Scholar]
  46. Pellegrini, G.; Busillo, F.; Muccigrosso, T.; Tarola, O.; Terribile, F. Measuring the Impact of the European Regional Policy on Economic Growth: A Regression Discontinuity Design Approach. Pap. Reg. Sci. 2013, 92, 217–233. [Google Scholar] [CrossRef]
  47. Ferrara, A.R.; McCann, P.; Pellegrini, G.; Stelder, D.; Terribile, F. Assessing the im_pacts of Cohesion Policy on EU regions: A non-parametric analysis on interventions pro_moting research and innovation and transport accessibility. Pap. Reg. Sci. 2016, 96, 817–841. [Google Scholar]
  48. Accetturo, A.; De Blasio, G.; Ricci, L. A Tale of an Unwanted Outcome: Transfers and Local Endowments of Trust and Cooperation. J. Econ. Behav. Organ. 2014, 102, 74–89. [Google Scholar] [CrossRef]
  49. Cerqua, A.; Pellegrini, G. Are we spending too much to grow? The case of Structural Funds. J. Reg. Sci. 2018, 58, 535–563. [Google Scholar] [CrossRef]
  50. Percoco, M. Impact of European Cohesion Policy on regional growth: Does local economic structure matter? Reg. Stud. 2017, 51, 833–843. [Google Scholar] [CrossRef]
  51. Bondonio, D.; Greenbaum, R. Revitalizing regional economies through enterprise support policies: An impact evaluation of multiple instruments. Eur. Urban Reg. Stud. 2014, 21, 79–103. [Google Scholar] [CrossRef]
  52. Barone, G.; David, F.; De Blasio, G. Boulevard of broken dreams. The end of EU funding. Reg. Sci. Urban Econ. 1997, 60, 31–38. [Google Scholar] [CrossRef] [Green Version]
  53. Giua, M. Spatial discontinuity for the impact assessment of the EU Regional policy. The case of the Italian Objective 1 regions. J. Reg. Sci. 2017, 57, 19–131. [Google Scholar] [CrossRef] [Green Version]
  54. Caprotti, F.; Cowley, R.; Datta, A.; Broto, V.C.; Gao, E.; Georgeson, L.; Herrick, C.; Odendaal, N.; Joss, S. The New Urban Agenda: Key opportunities and challenges for policy and practice. Urban Res. Pract. 2017, 10, 367–378. [Google Scholar] [CrossRef] [Green Version]
  55. Las Casas, G.; Scorza, F. From the UN new urban agenda to the local experiences of urban development: The case of Potenza. In Proceedings of the Lecture Notes in Computer Science LNCS (including subseries Lecture Notes in Artificial Intelligence and Lecture Notes in Bioinformatics); Springer: Cham, Switzerland, 2018; Volume 10964, pp. 734–743. [Google Scholar]
  56. Santopietro, L.; Scorza, F. The Italian Experience of the Covenant of Mayors: A Territorial Evaluation. Sustainability 2021, 13, 1289. [Google Scholar] [CrossRef]
  57. Las Casas, G.; Scorza, F.; Murgante, B. New Urban Agenda and Open Challenges for Urban and Regional Planning. In New Metropolitan Perspectives. ISHT 2018; Calabrò, F., Della Spina, L., Bevilacqua, C., Eds.; Springer: Cham, Switzerland, 2019; Volume 100, ISBN 9783319920986. [Google Scholar]
  58. Acierno, A. Reading the New Urban Agenda in a Gender Perspective. Verso Habitat 2016, 16. [Google Scholar] [CrossRef]
  59. Scorza, F. Training Decision-Makers: GEODESIGN Workshop Paving the Way for New Urban Agenda. In Proceedings of the Lecture Notes in Computer Science LNCS (including Subseries Lecture Notes in Artificial Intelligence and Lecture Notes in Bioinformatics); Springer Science and Business Media Deutschland GmbH: Berlin, Germany, 2020; Volume 12252, pp. 310–316. [Google Scholar]
  60. Izzi, F.; La Scaleia, G.; Dello Buono, D.; Scorza, F.; Las Casas, G. Enhancing the spatial dimensions of open data: Geocoding open PA information using geo platform fusion to support planning process. In Proceedings of the Lecture Notes in Computer Science LNCS (including Subseries Lecture Notes in Artificial Intelligence and Lecture Notes in Bioinformatics), Ho Chi Minh City, Vietnam, 24–27 June 2013; Springer: Berlin, Germany, 2013; Volume 7973, pp. 622–629. [Google Scholar]
  61. Scorza, F.; Las Casas, G.B.; Murgante, B. Spatializing Open Data for the Assessment and the Improvement of territorial and social cohesion. In Proceedings of the ISPRS Annals of the Photogrammetry, Remote Sensing and Spatial Information Sciences, Prague, Czech Republic, 12–19 July 2016; Copernicus GmbH: Göttingen, Germany, 2016; Volume 4, pp. 145–151. [Google Scholar]
  62. Carbone, R.; Fortunato, G.; Pace, G.; Pastore, E.; Pietragalla, L.; Postiglione, L.; Scorza, F. Using open data and open tools in defining strategies for the enhancement of basilicata region. In Proceedings of the Lecture Notes in Computer Science LNCS (including Subseries Lecture Notes in Artificial Intelligence and Lecture Notes in Bioinformatics), Melbourne, VIC, Australia, 2–5 July 201; Springer: Berlin, Germany, 2018; Volume 10964, pp. 725–733. [Google Scholar]
  63. Scorza, F.; Las Casas, G.; Murgante, B. Overcoming interoperability weaknesses in e-government processes: Organizing and sharing knowledge in regional development programs using ontologies. In Proceedings of the Communications in Computer and Information Science, São José dos Campos, Brazil, 23–27 August 2010. [Google Scholar]
Figure 1. Framing of the Agri Valley in the Basilicata Region (Italy).
Sustainability 13 09376 g001
Figure 2. A flowchart summarizing the research process into five actions.
Sustainability 13 09376 g002
Figure 3. The total resources activated by the ERDF Fund 2014–2020 in Agri Valley.
Sustainability 13 09376 g003
Figure 4. Progress of ERDF 2014–2020 projects in Agri Valley.
Sustainability 13 09376 g004
Figure 5. The number of ERDF projects by type of intervention (histogram).
Sustainability 13 09376 g005
Figure 6. The total resources that have been planned and spent for each municipality and comparison (pie chart) between the total resources of each source of funding (FSC, FSE, ERDF and POV).
Sustainability 13 09376 g006
Table 1. Investment priorities at the Community and local levels compared with the themes of the New Urban Agenda.
New Urban
Agenda Themes
1 Integration of Migrants and Refugees 2 Air Quality3 Housing4 Urban Poverty5 Circular Economy6 Climate Adaptation7 Energy Transition8 Urban Mobility9 Digital Transition10 Public Procurement 11 Jobs and Skills in Local Economy12 Sustainable Use of Land and Nature-Based Solutions
Investments Priorities
Plan FSC—Environment
Plan FSC—Infrastructure
Plan FSC—Ultra-broadband
Plan FSC—Hydrogeological instability
FSC—Tourism, Culture and Natural Resources Enhancement
Axis 1 FSE. Create and maintain employment
Axis 2 FSE. Strengthen and innovate active inclusion in society
Axis 3 FSE. Develop learning rights and quality and support smart innovation in key sectors
Axis 1. ERDF: Research, technological development and innovation
Axis 2.ERDF: Digital agenda
Axis 3. ERDF: Competitiveness
Axis 4. ERDF: Energy and urban mobility
Axis 5. ERDF: Environmental protection and efficient use of resources
Axis 6. ERDF: Transport systems and network infrastructures
Axis 7. ERDF: Social inclusion
Axis 8. ERDF: Strengthening the education system
Measure A. POV: Safeguarding and improving the context of environmental livability
Measure B. POV: Strengthening of the supply of essential infrastructures
Measure C. POV: Improvement of the provision of services for the enhancement of the quality of life
Measure D. POV: Increase in the conditions and opportunities for lasting and sustainable employability
Table 2. The table shows the economic amounts for each municipality and the total by each fund; the data in this table were used to build the map in Figure 6.
Istat CodeMunicipality NamePopulation 2020Total FSCTotal FSETotal ERDFTotal PO Agri ValleyTotal Funds
77002Aliano904€ 432,727.12€ 11,540.00€ 1,983,587.81€ 2,637,074.02€ 5,064,928.95
76005Armento578€ 250,000.00€ 9,529.50€ 24,881.06€ 1,273,407.74€ 1,557,818.30
76029Corleto Perticara2451€ 611,162.13€ 148,950.59€ 1,533,255.07€ 3,238,026.56€ 5,531,394.35
76035Gallicchio842€ 289,480.49€ 79,660.00€ 262,559.37€ 2,167,374.57€ 2,799,074.43
76037Grumento Nova1640€ 97,022.30€ 25,550.00€ 4,208,333.00€ 1,869,012.74€ 6,199,918.04
76038Guardia Perticara532€ 40,071.50€ 214,056.06€ 2,356,684.67€ 1,424,829.64€ 4,035,641.87
76045Marsico Nuovo4010€ 4,600,000.00€ 322,088.79€ 1,519,041.07€ 5,629,973.23€ 12,071,103.09
76046Marsicovetere5575€ 0.00€ 688,544.54€ 525,123.72€ 3,659,247.94€ 4,872,916.20
76049Missanello538€ 118,335.91€ 12,000.00€ 256,742.40€ 1,386,141.44€ 1,773,219.75
76050Moliterno3754€ 3,800,000.00€ 177,520.08€ 699,922.84€ 3,970,252.59€ 8,647,695.51
76052Montemurro1157€ 101,755.92€ 26,872.40€ 763,551.62€ 2,406,110.82€ 3,298,290.76
76100Paterno3202€ 1,250,000.00€ 105,026.99€ 1,477,787.50€ 2,497,543.06€ 5,330,357.55
76069Roccanova1415€ 291,731.92€ 16,150.00€ 685,669.65€ 1,730,330.31€ 2,723,881.88
76074San Chirico Raparo956€ 2,094,745.85€ 30,080.00€ 200,000.00€ 2,607,741.20€ 4,932,567.05
76077San Martino d’Agri705€ 202,053.10€ 12,180.00€ 2,283,892.70€ 2,267,476.10€ 4,765,601.90
76080Sant’Arcangelo6246€ 3,443,433.20€ 396,998.31€ 1,312,906.10€ 6,382,751.08€ 11,536,088.69
76081Sarconi1413€ 40,000.00€ 23,940.00€ 1,357,511.82€ 2,926,818.96€ 4,348,270.78
76086Spinoso1402€ 1,514,832.42€ 33,580.00€ 1,534,342.49€ 1,236,961.20€ 4,319,716.11
76091Tramutola2981€ 293,869.67€ 238,170.02€ 3,283,896.29€ 3,605,676.73€ 7,421,612.71
76098Viggiano3353€ 290,000.00€ 381,008.00€ 5,794,121.14€ 1,881,693.68€ 8,346,822.82
Total€ 43,654.00€ 19,761,221.53€ 2,953,445.28€ 32,063,810.32€ 54,798,443.61€ 109,576,920.74
Table 3. The following table exemplifies the evaluation process that considers the amounts in euros of all separate policies for the issues of the NUA, the impact indicators and the trend for three municipalities, in order to find an overall trend for the entire area (See Appendix A, with Table A3, that is complete for the twenty municipalities).
Impact ThemeIndicatorsYear of AnalysisAlianoArmentoCorleto PerticaraAll the Municipalities of the Agri Valley
€ 403,232.00€ 9,529.50€ 1,278,534.54€ 20,728,270.81
11 Jobs and Skills In Local EconomyWorkforce (employed and job seekers > 15 years) ISTAT2011420278105118,064
2019337238104818,547
Change in the workforce (2011–2019)🡳🡳🡳🡱
% workforce (out of total residents > 15 years) ISTAT201143%47%45%44%
201941%46%47%46%
Change in % of the workforce on total residents (2011–2019)🡳🡳🡱🡱
Degree of education of the resident population > 9 years (% secondary school graduates)ISTAT201123%29%27%27%
201930%36%32%34%
Change in % of graduates resident > 9 years (2011–2019)🡱🡱🡱🡱
The total number of residents enrolled in the university (ASC)20153412991739
20173813861598
Change in university enrollments (2015–2017)🡱🡱🡳🡳
% university enrolled on total residents (ASC)20153.3%1.8%3.9%3.6%
20173.9%2.2%3.4%3.5%
Variation in the % of university students on the total number of residents🡱🡱🡳🡳
Publisher’s Note: MDPI stays neutral with regard to jurisdictional claims in published maps and institutional affiliations.

