
Drivers of Proactive Environmental Strategies: Evidence from the Pharmaceutical Industry of Asian Economies

 ,
,  ,
,  and
and 
Abstract
:1. Introduction
1.1. The Novelty and Significance of the Research Study
1.2. The Objectives of the Research Study
1.3. Research Questions of the Undertaken Study
2. Theoretical Framework and Hypotheses Development
2.1. Theory Underpinning—Resource-Based View Theory
2.2. Proactive Environmental Strategy and Organizational Performance
2.3. Determinants of Proactive Environmental Strategy and Organizational Performance
2.4. Inter-Reliant on Firm’s Performance
2.5. Eco-Innovation as a Mediator
2.6. Technological Advances as a Moderator
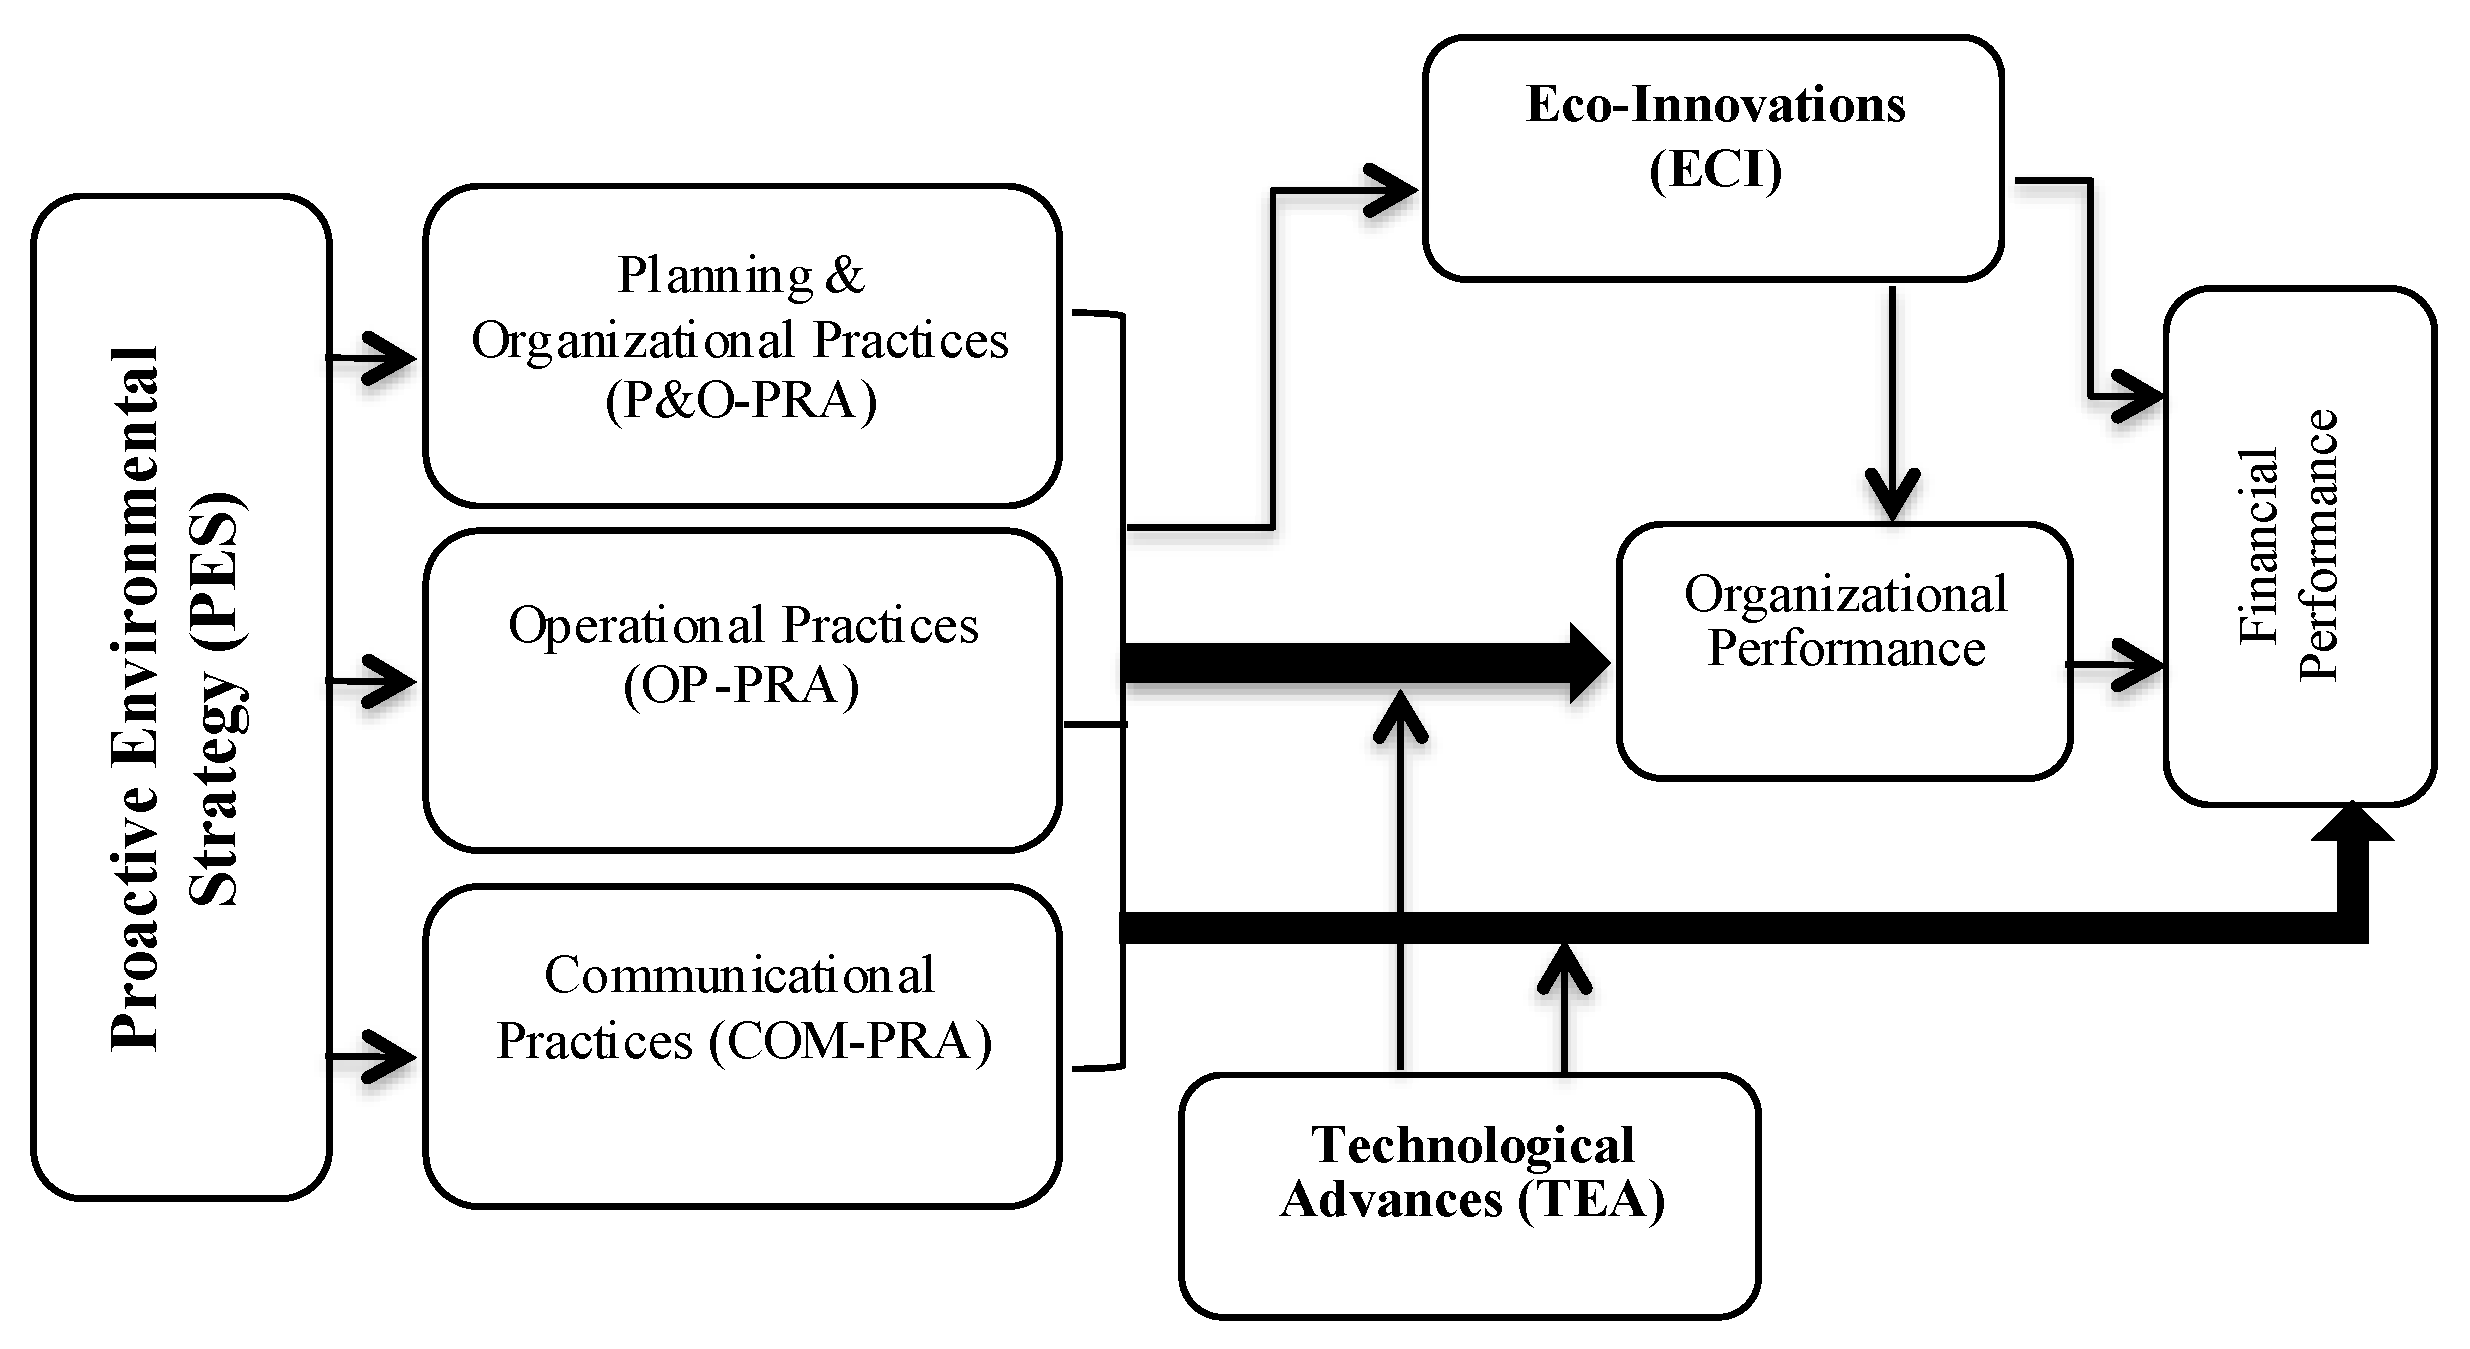
2.7. Theoretical and Conceptual Framework
3. Methodology
3.1. Measurement Scales and Research Design
3.2. Data Collection and Sampling Strategy
3.3. Estimation Techniques for Data Analyses
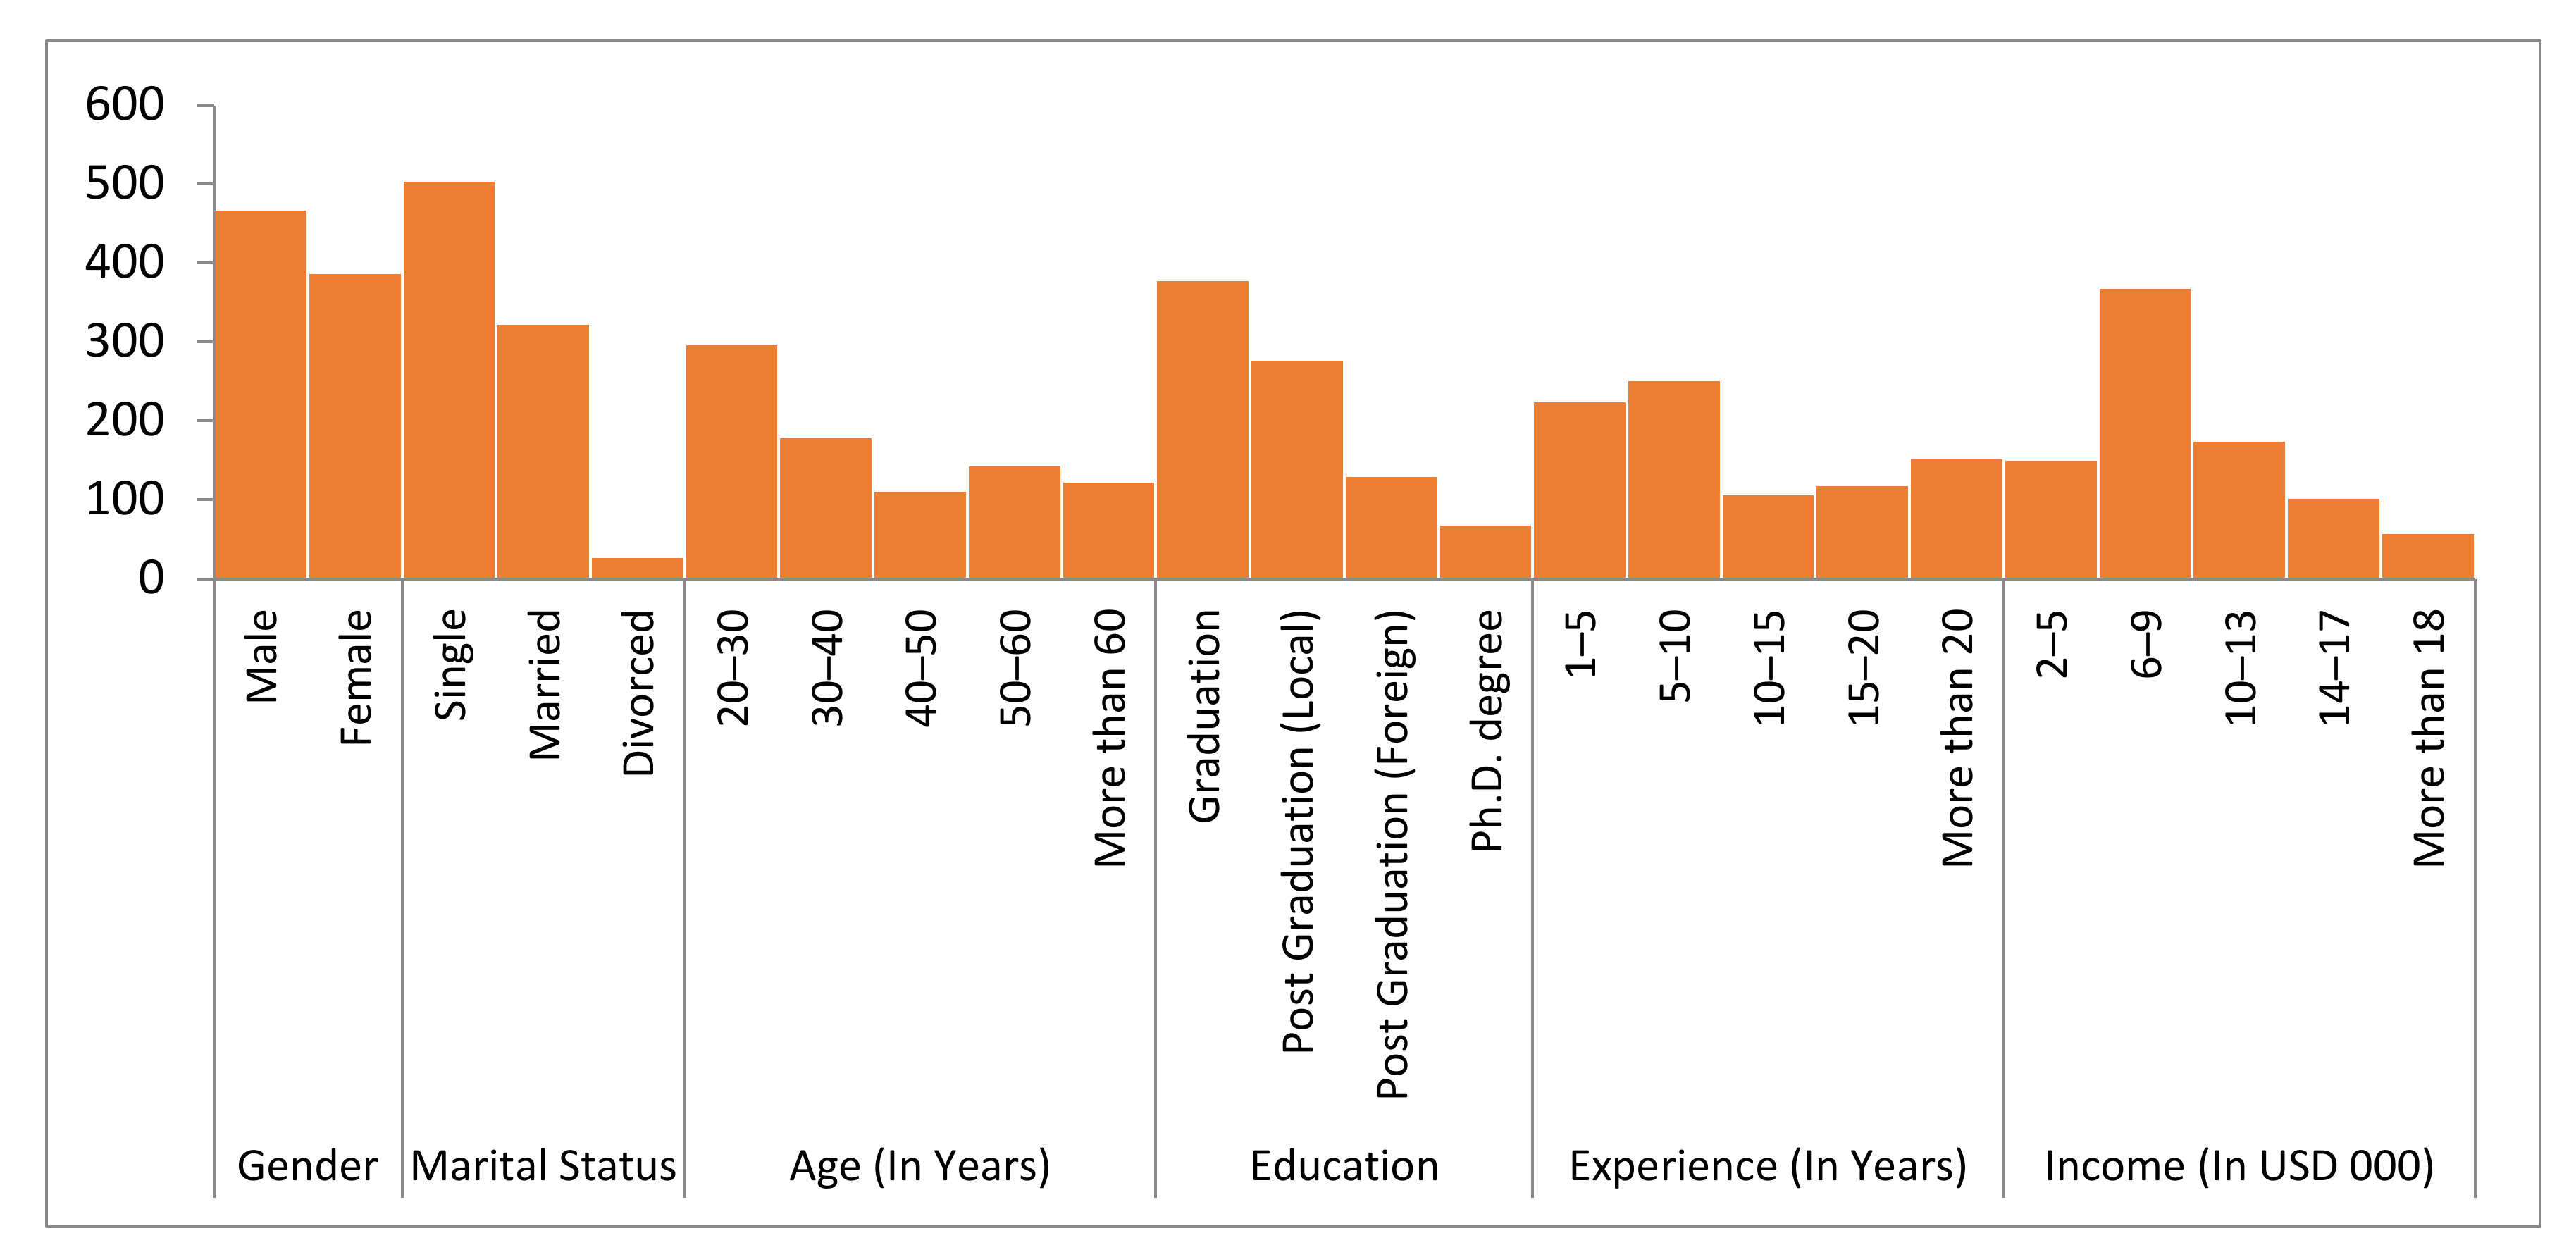
3.4. Demographic Profile of Respondents
4. Findings and Data Analyses
4.1. Common Method Bias
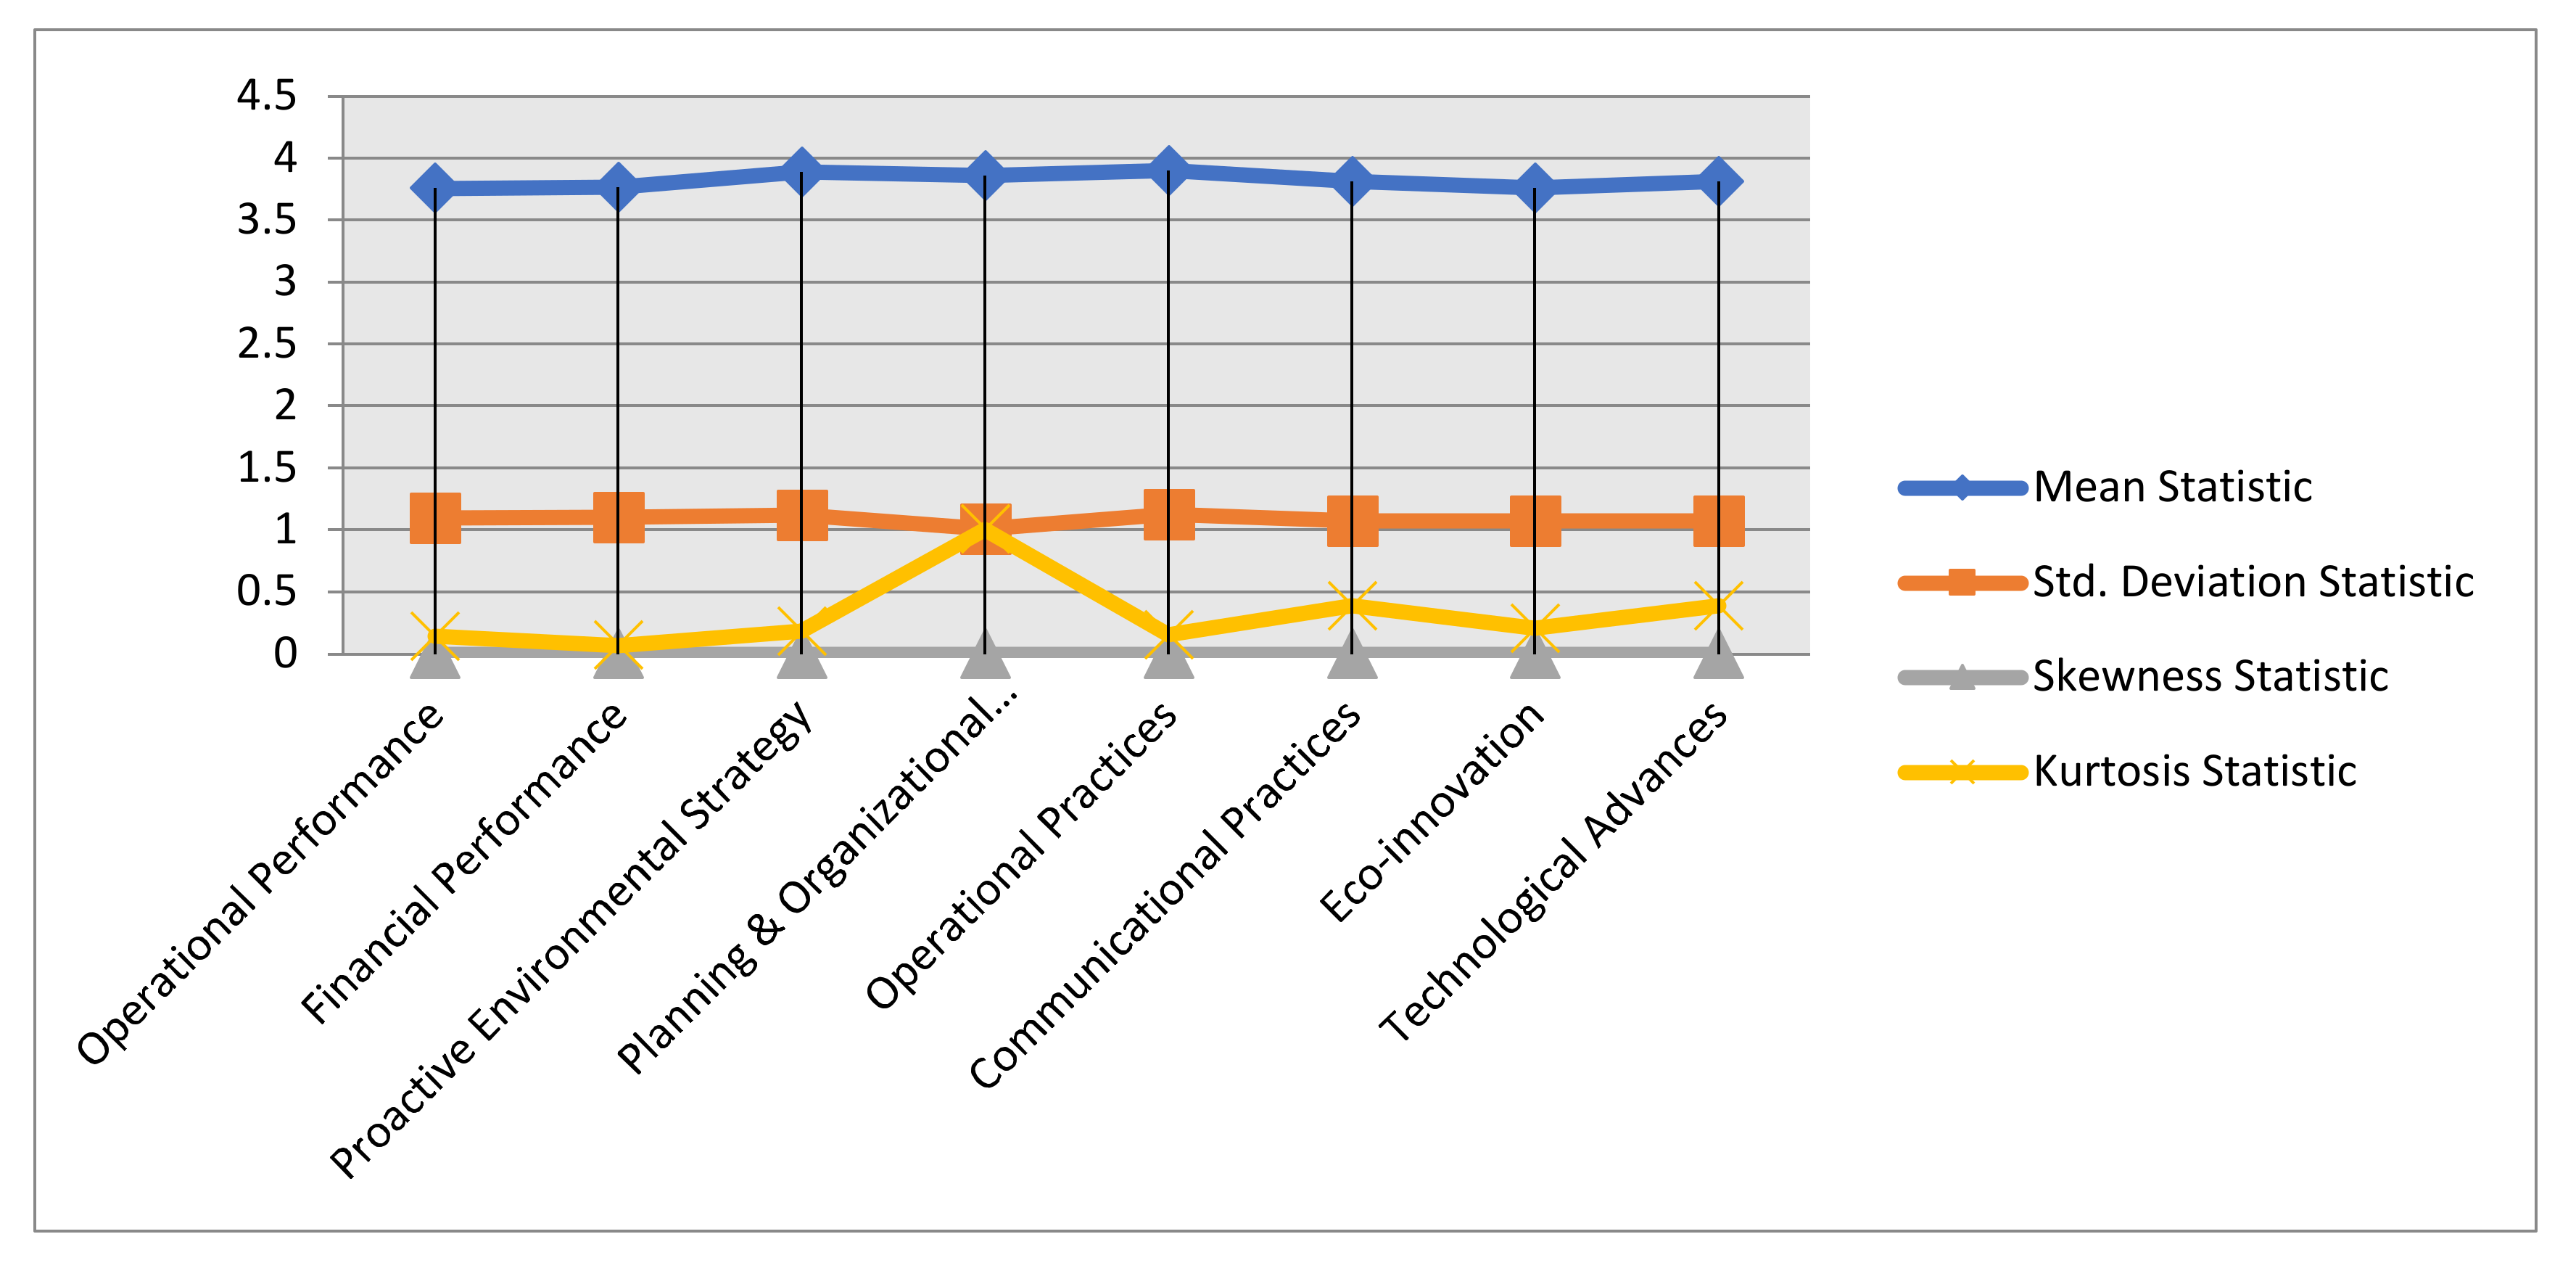
4.2. Descriptive Analyses
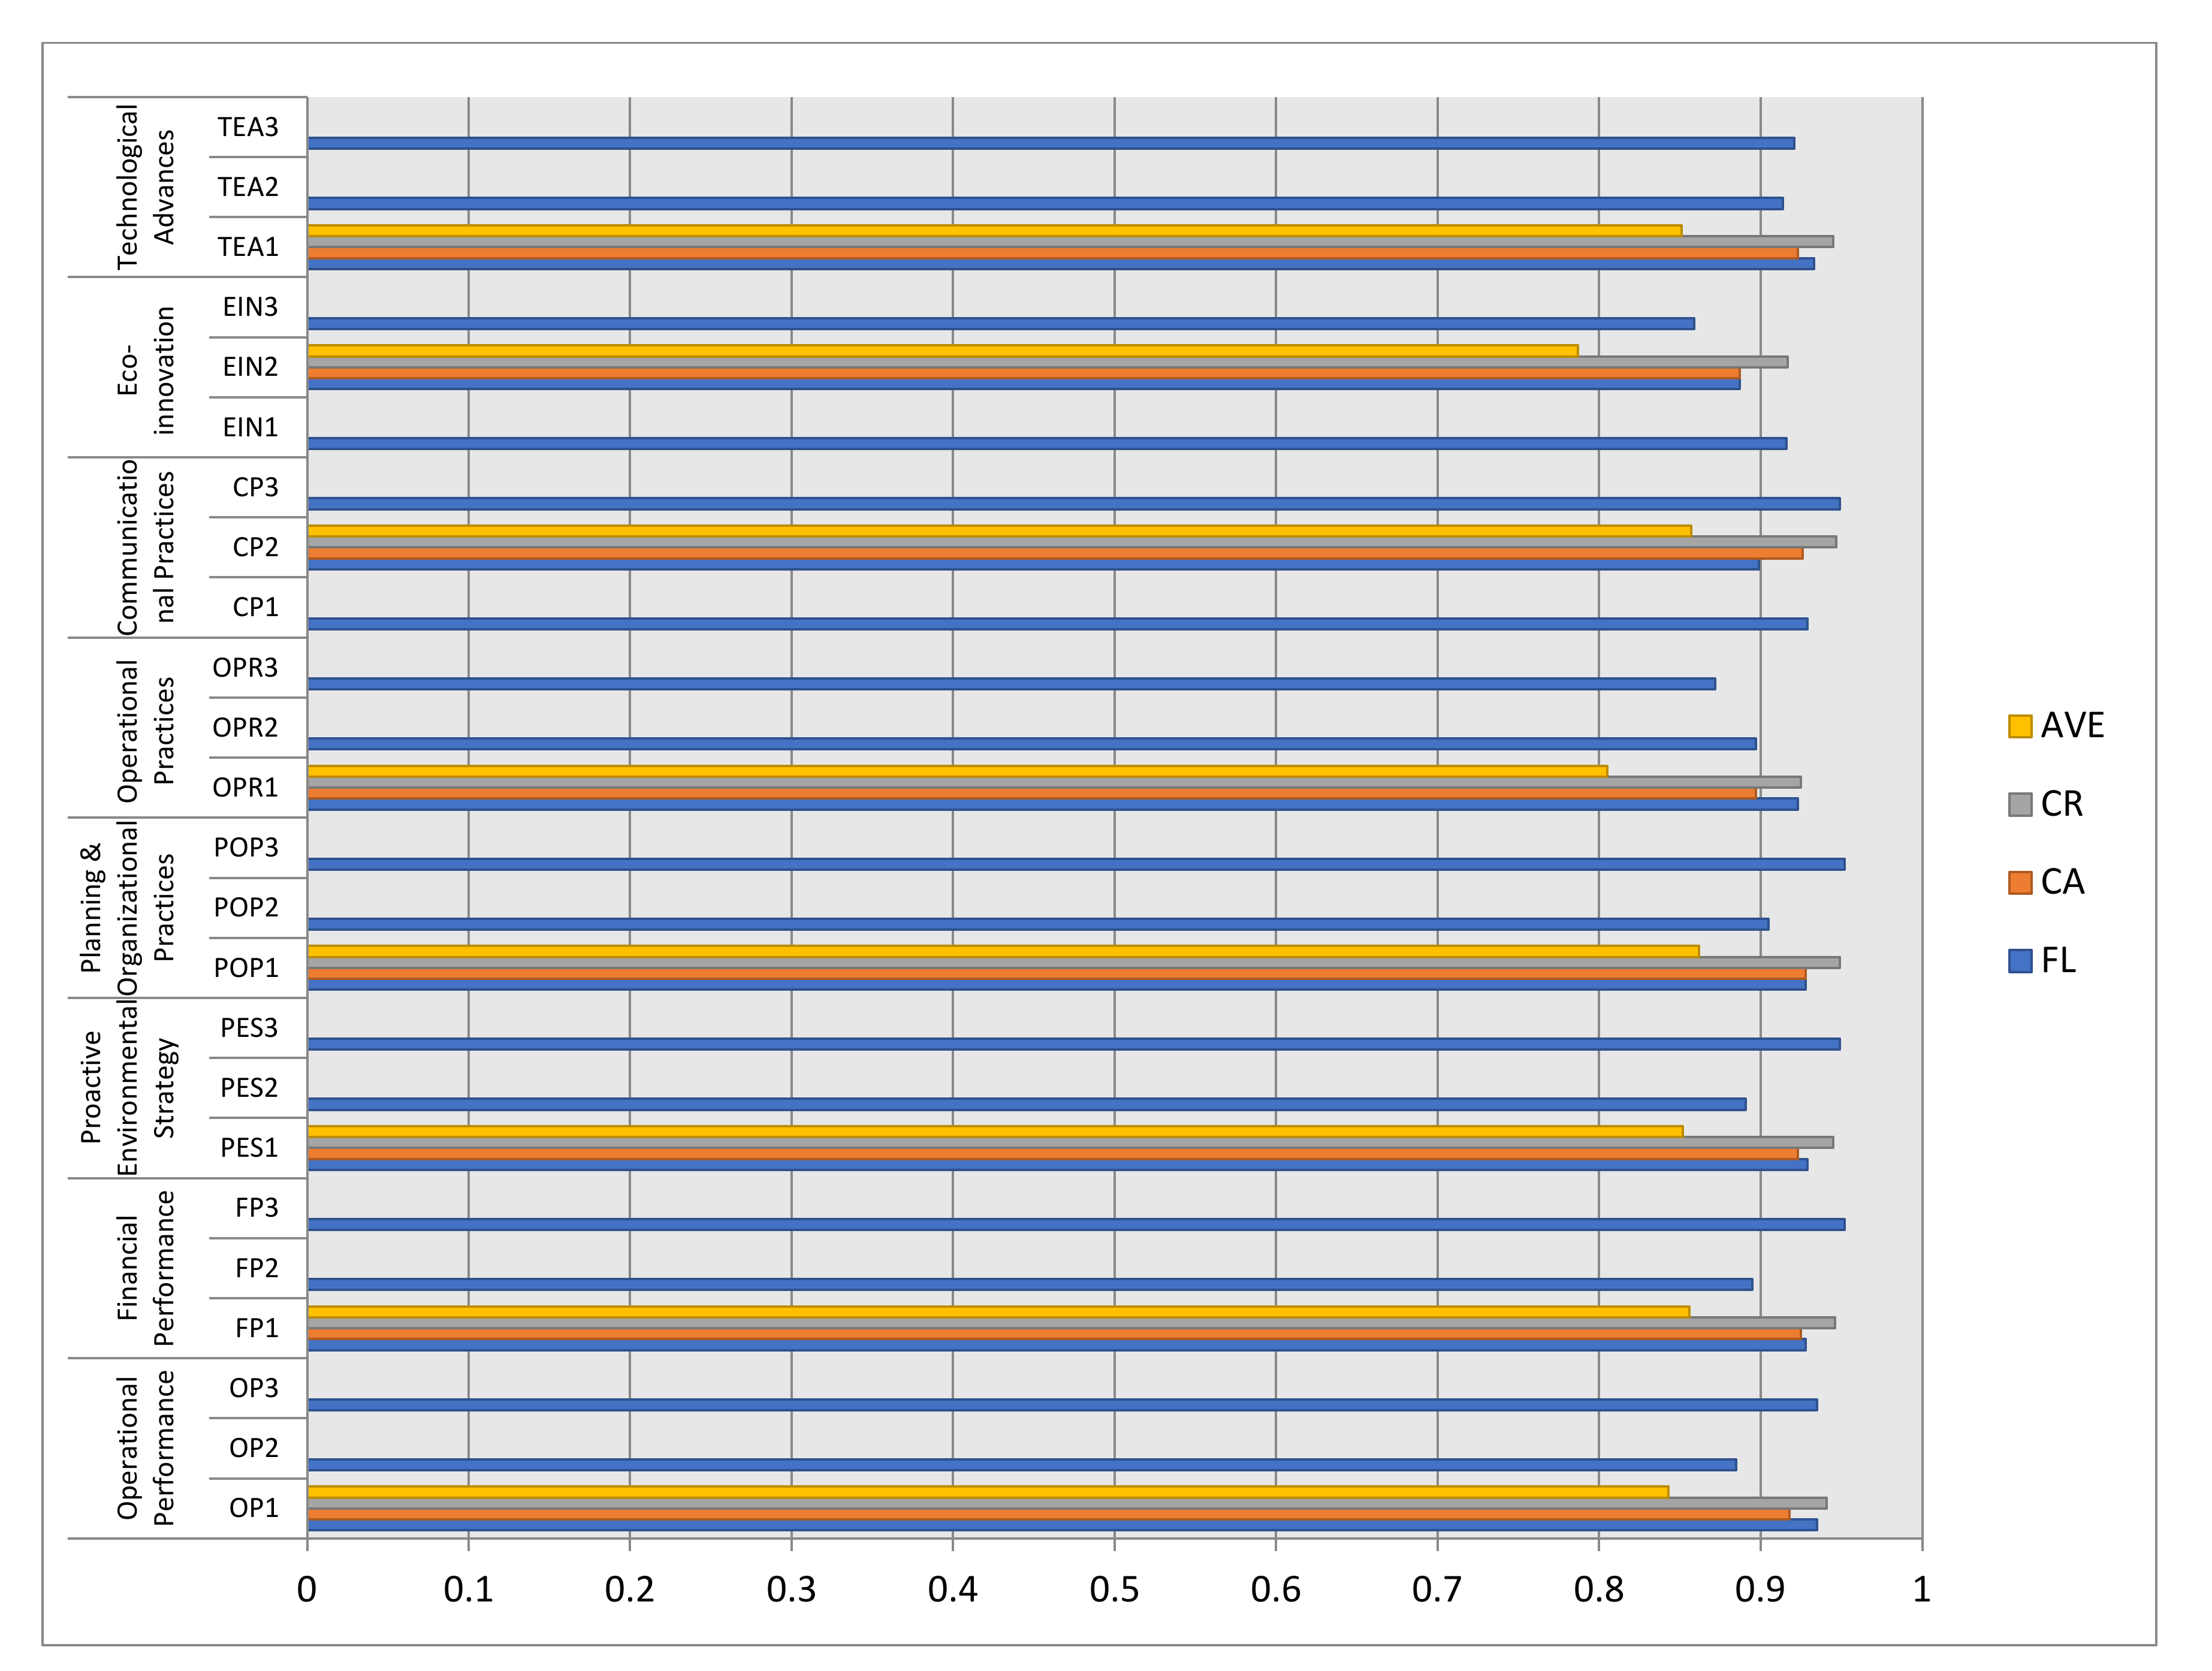
4.3. Reliabilities and Validities
4.4. Exploratory Factor Analysis—EFA
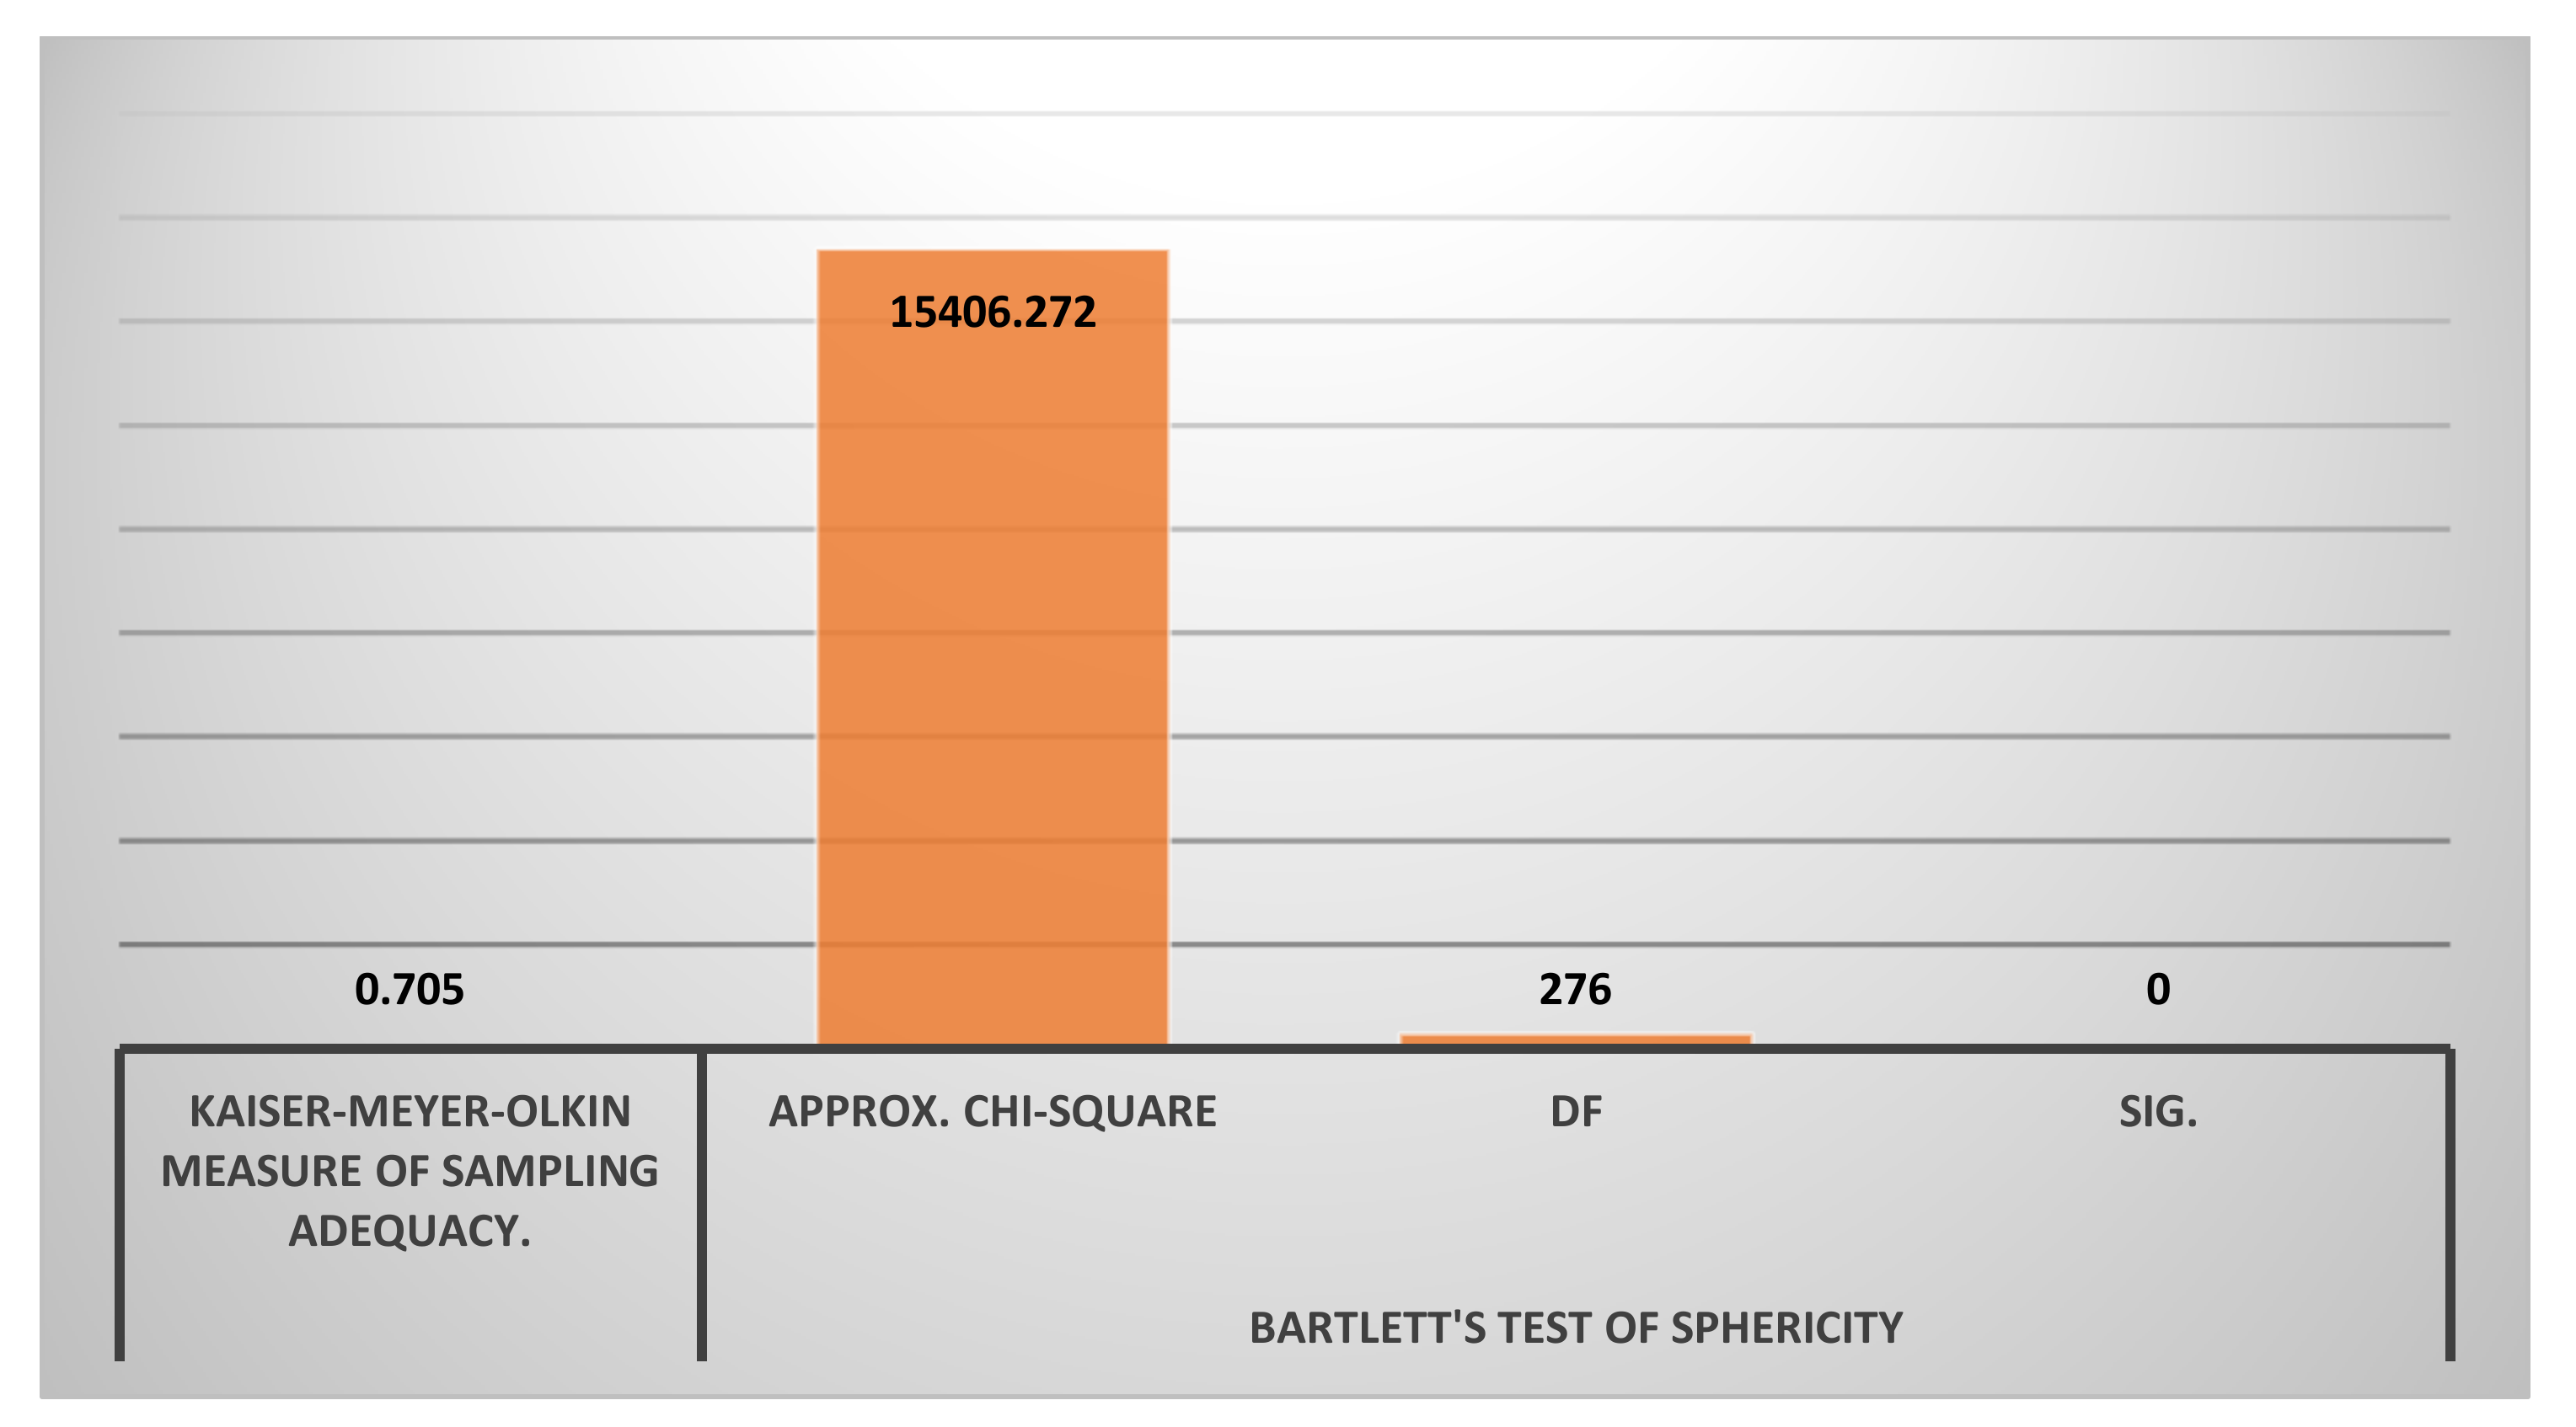
4.5. Kaiser–Meyers–Olkin, Bartlett’s, and Total Variance Explained Analyses
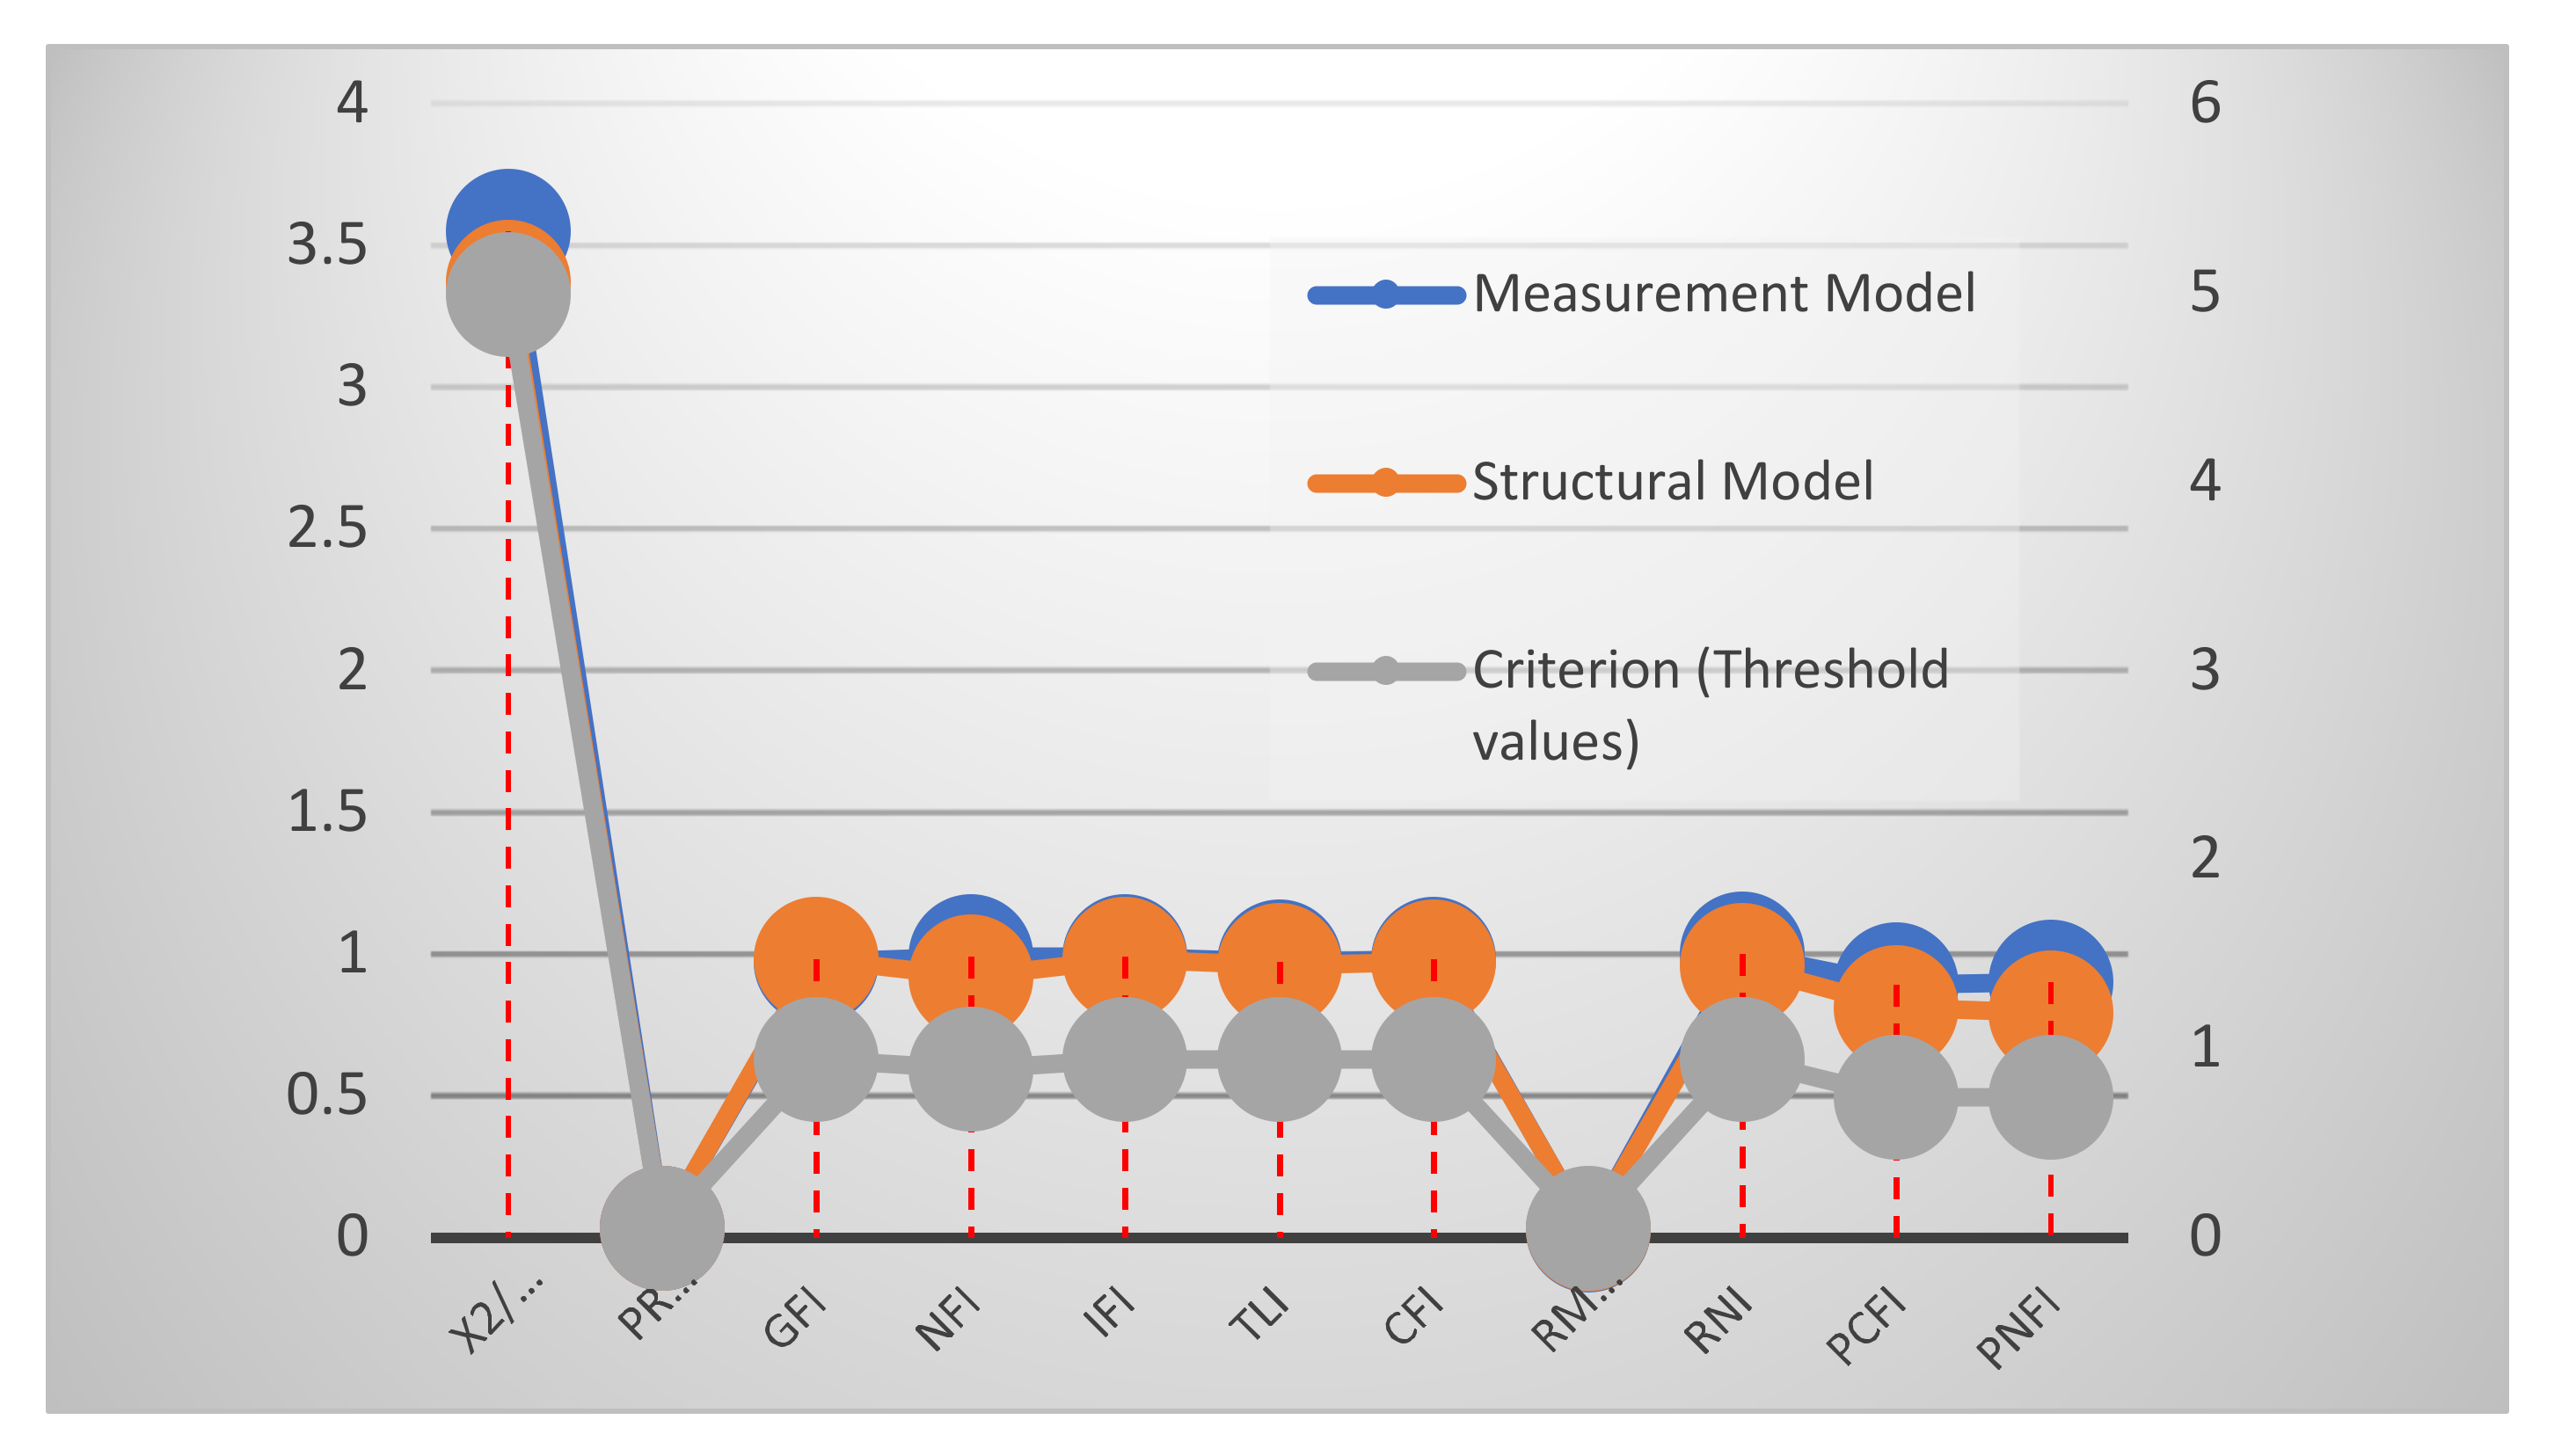
4.6. Confirmatory Factor Analysis—CFA
4.7. Structural Equation Modeling—SEM
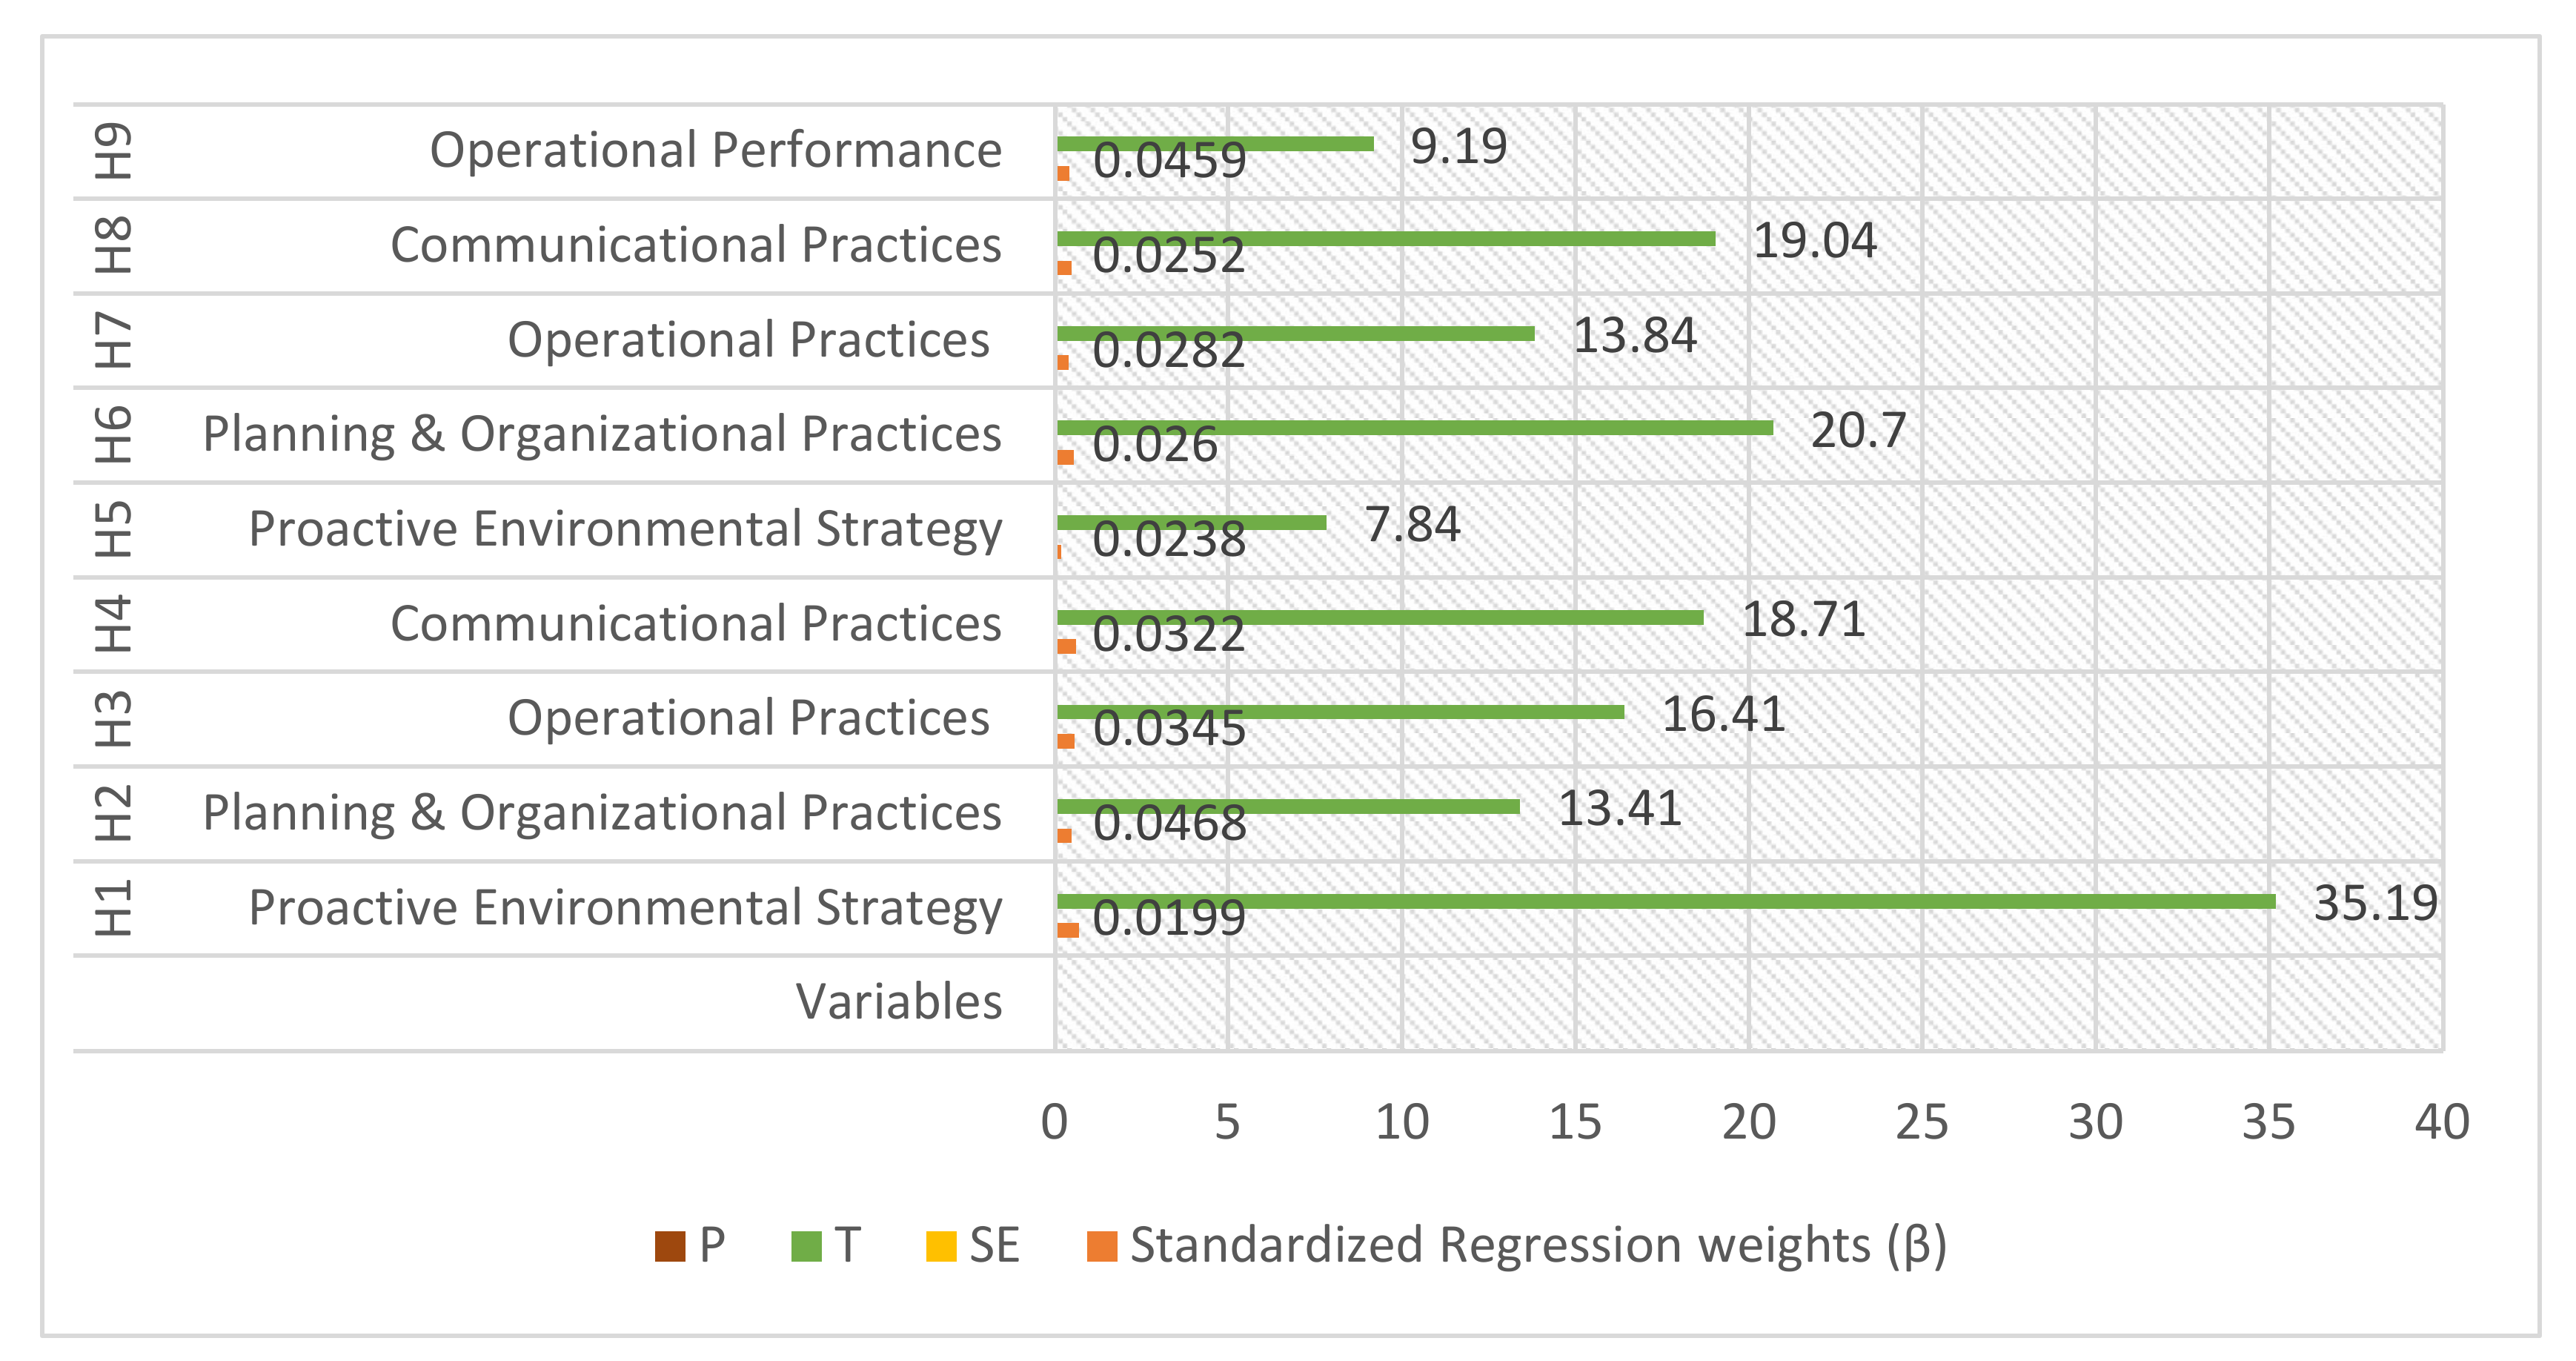
4.8. Postulated Direct Association
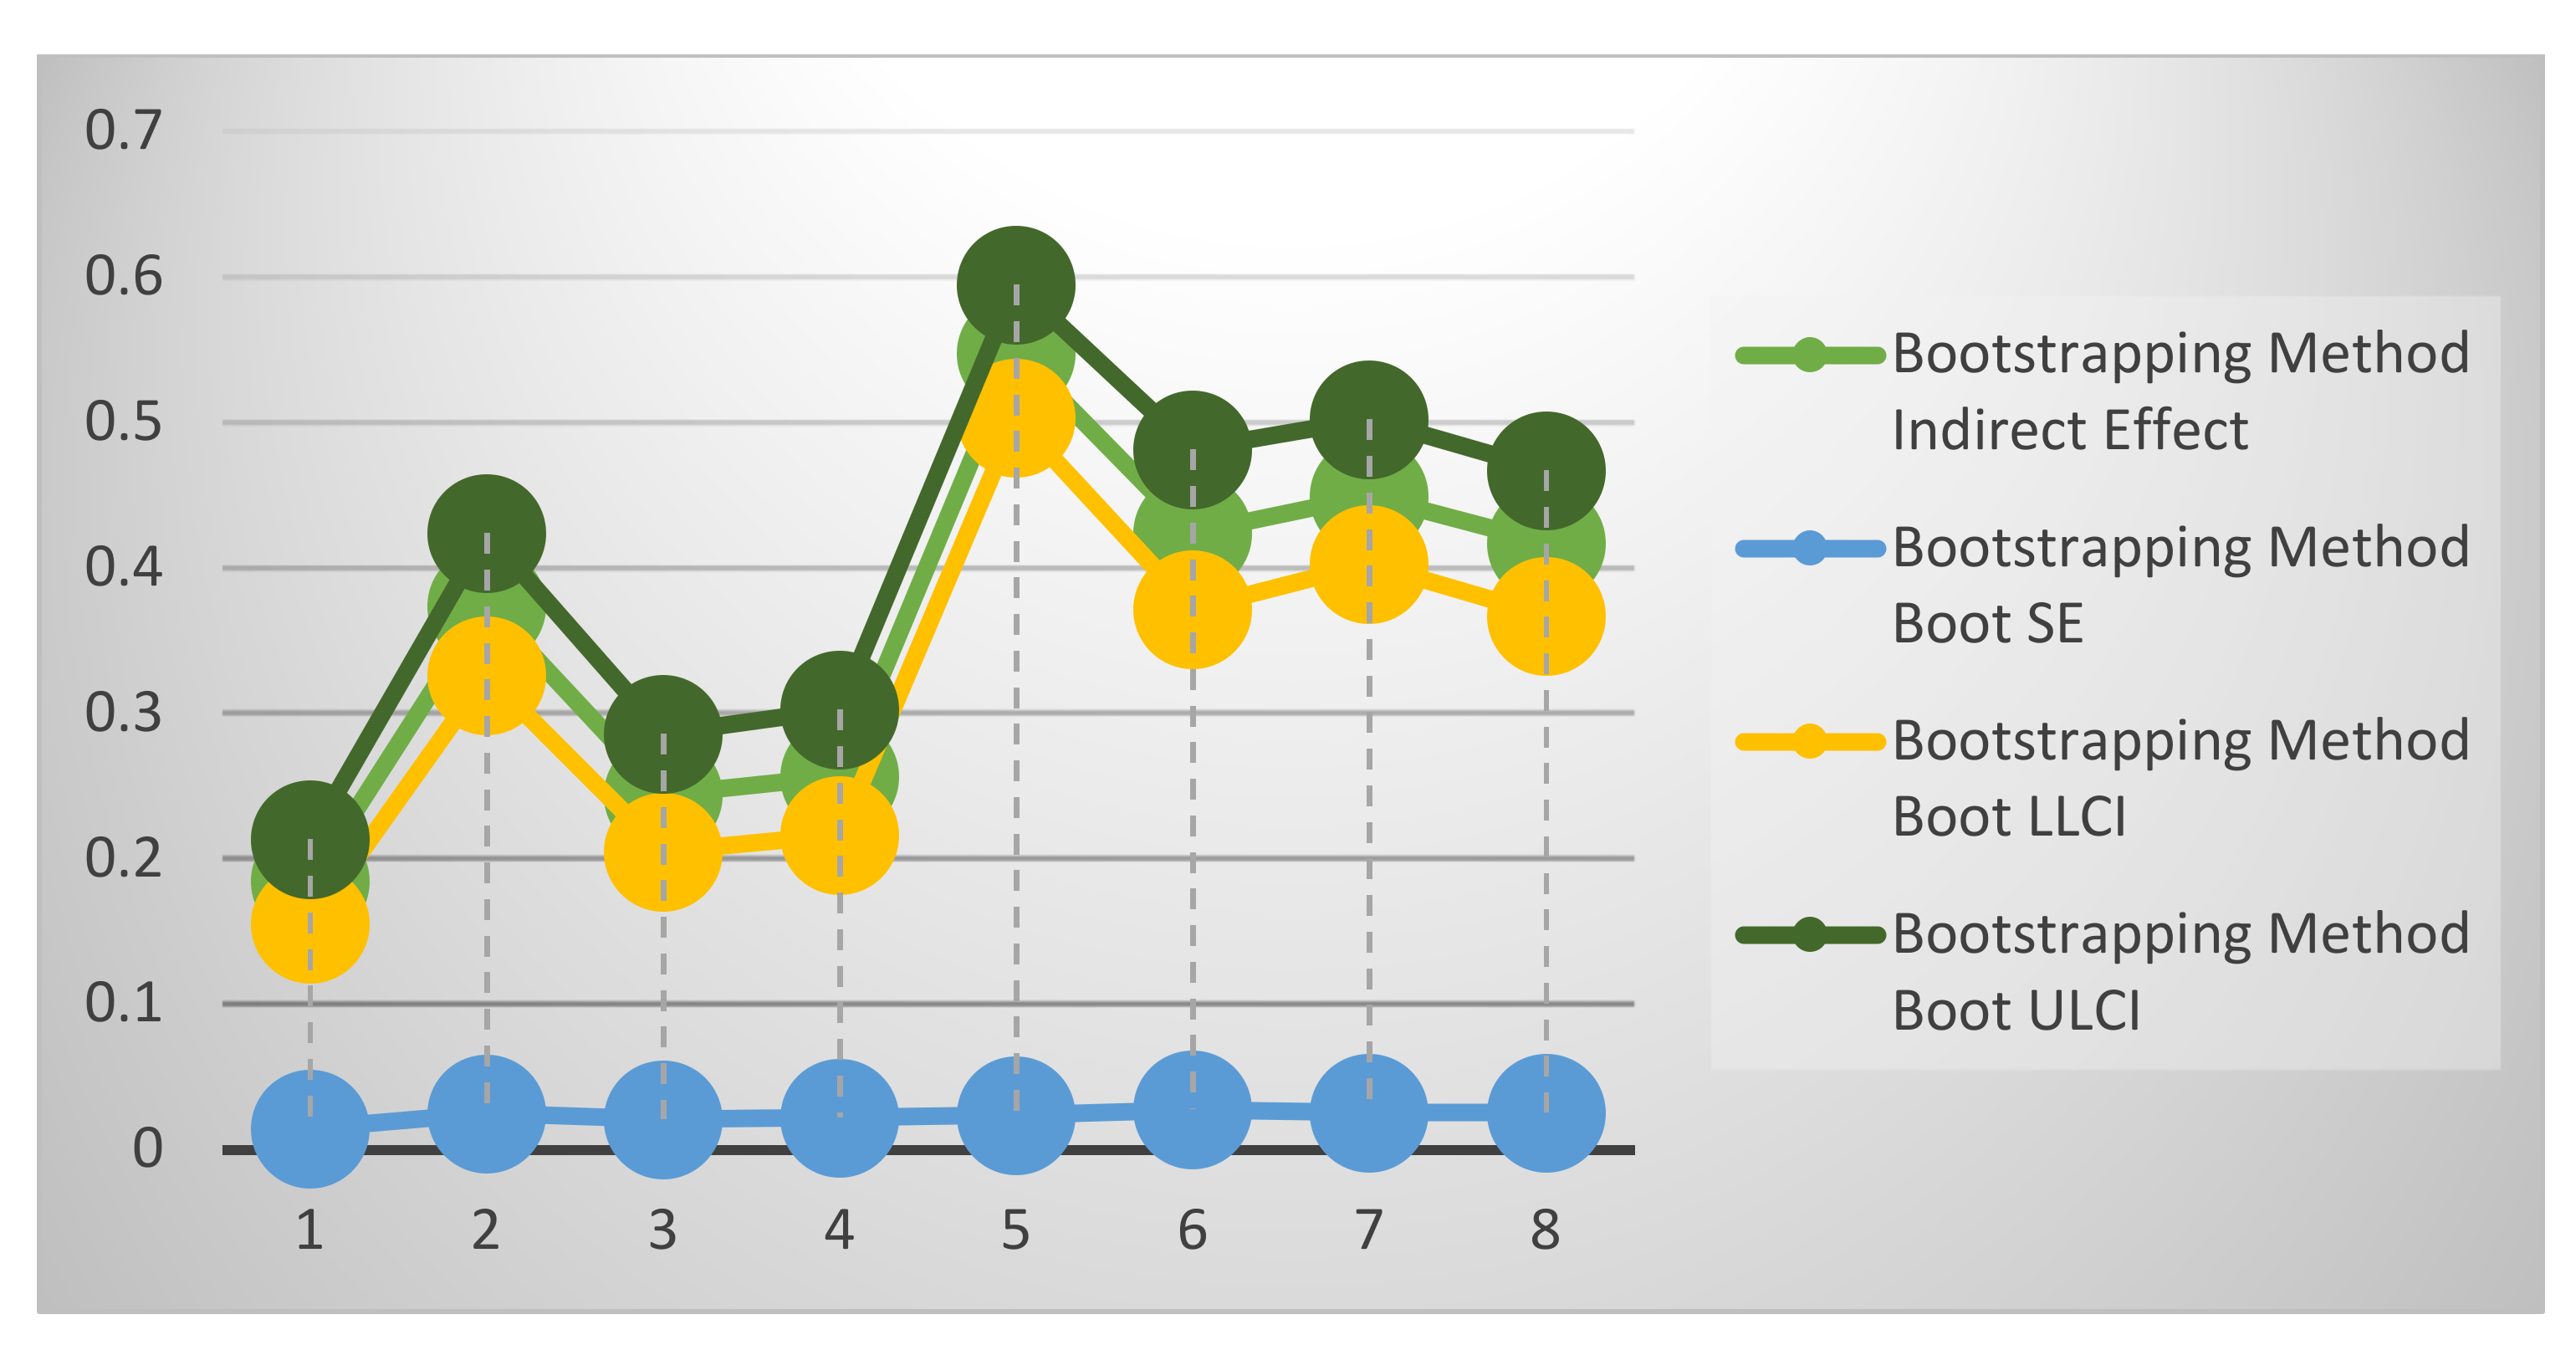
4.9. Mediation Analyses
4.10. Moderation Analyses
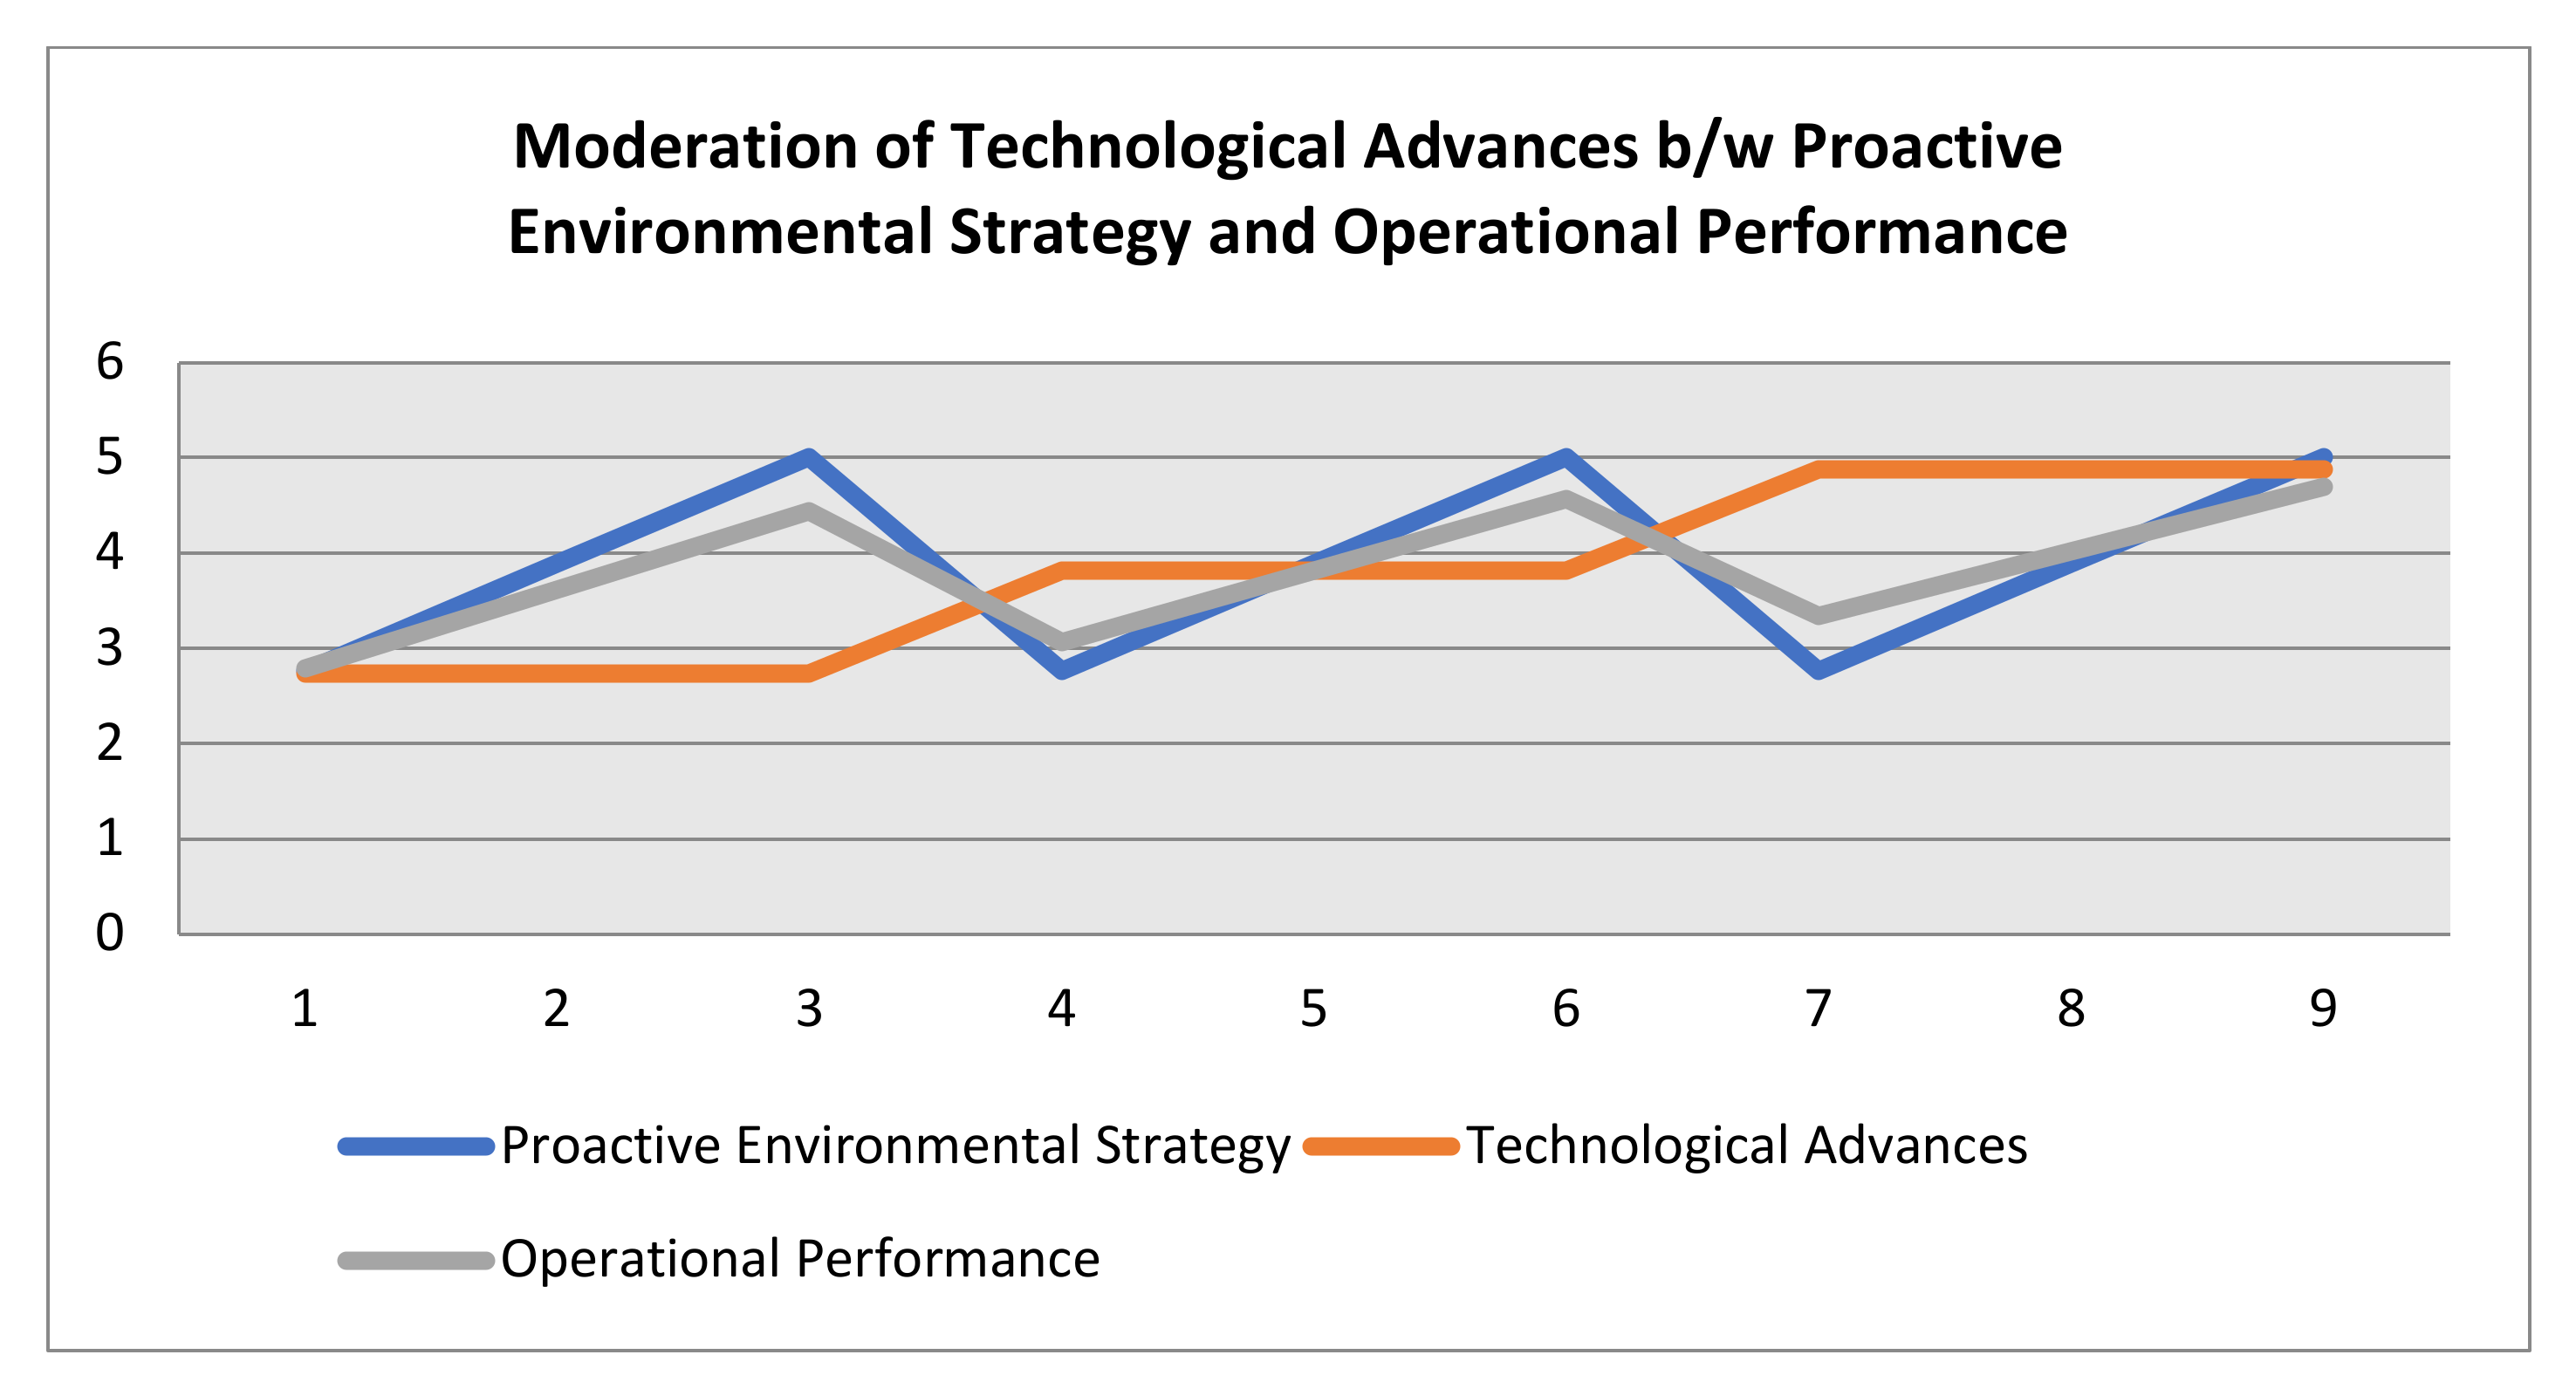
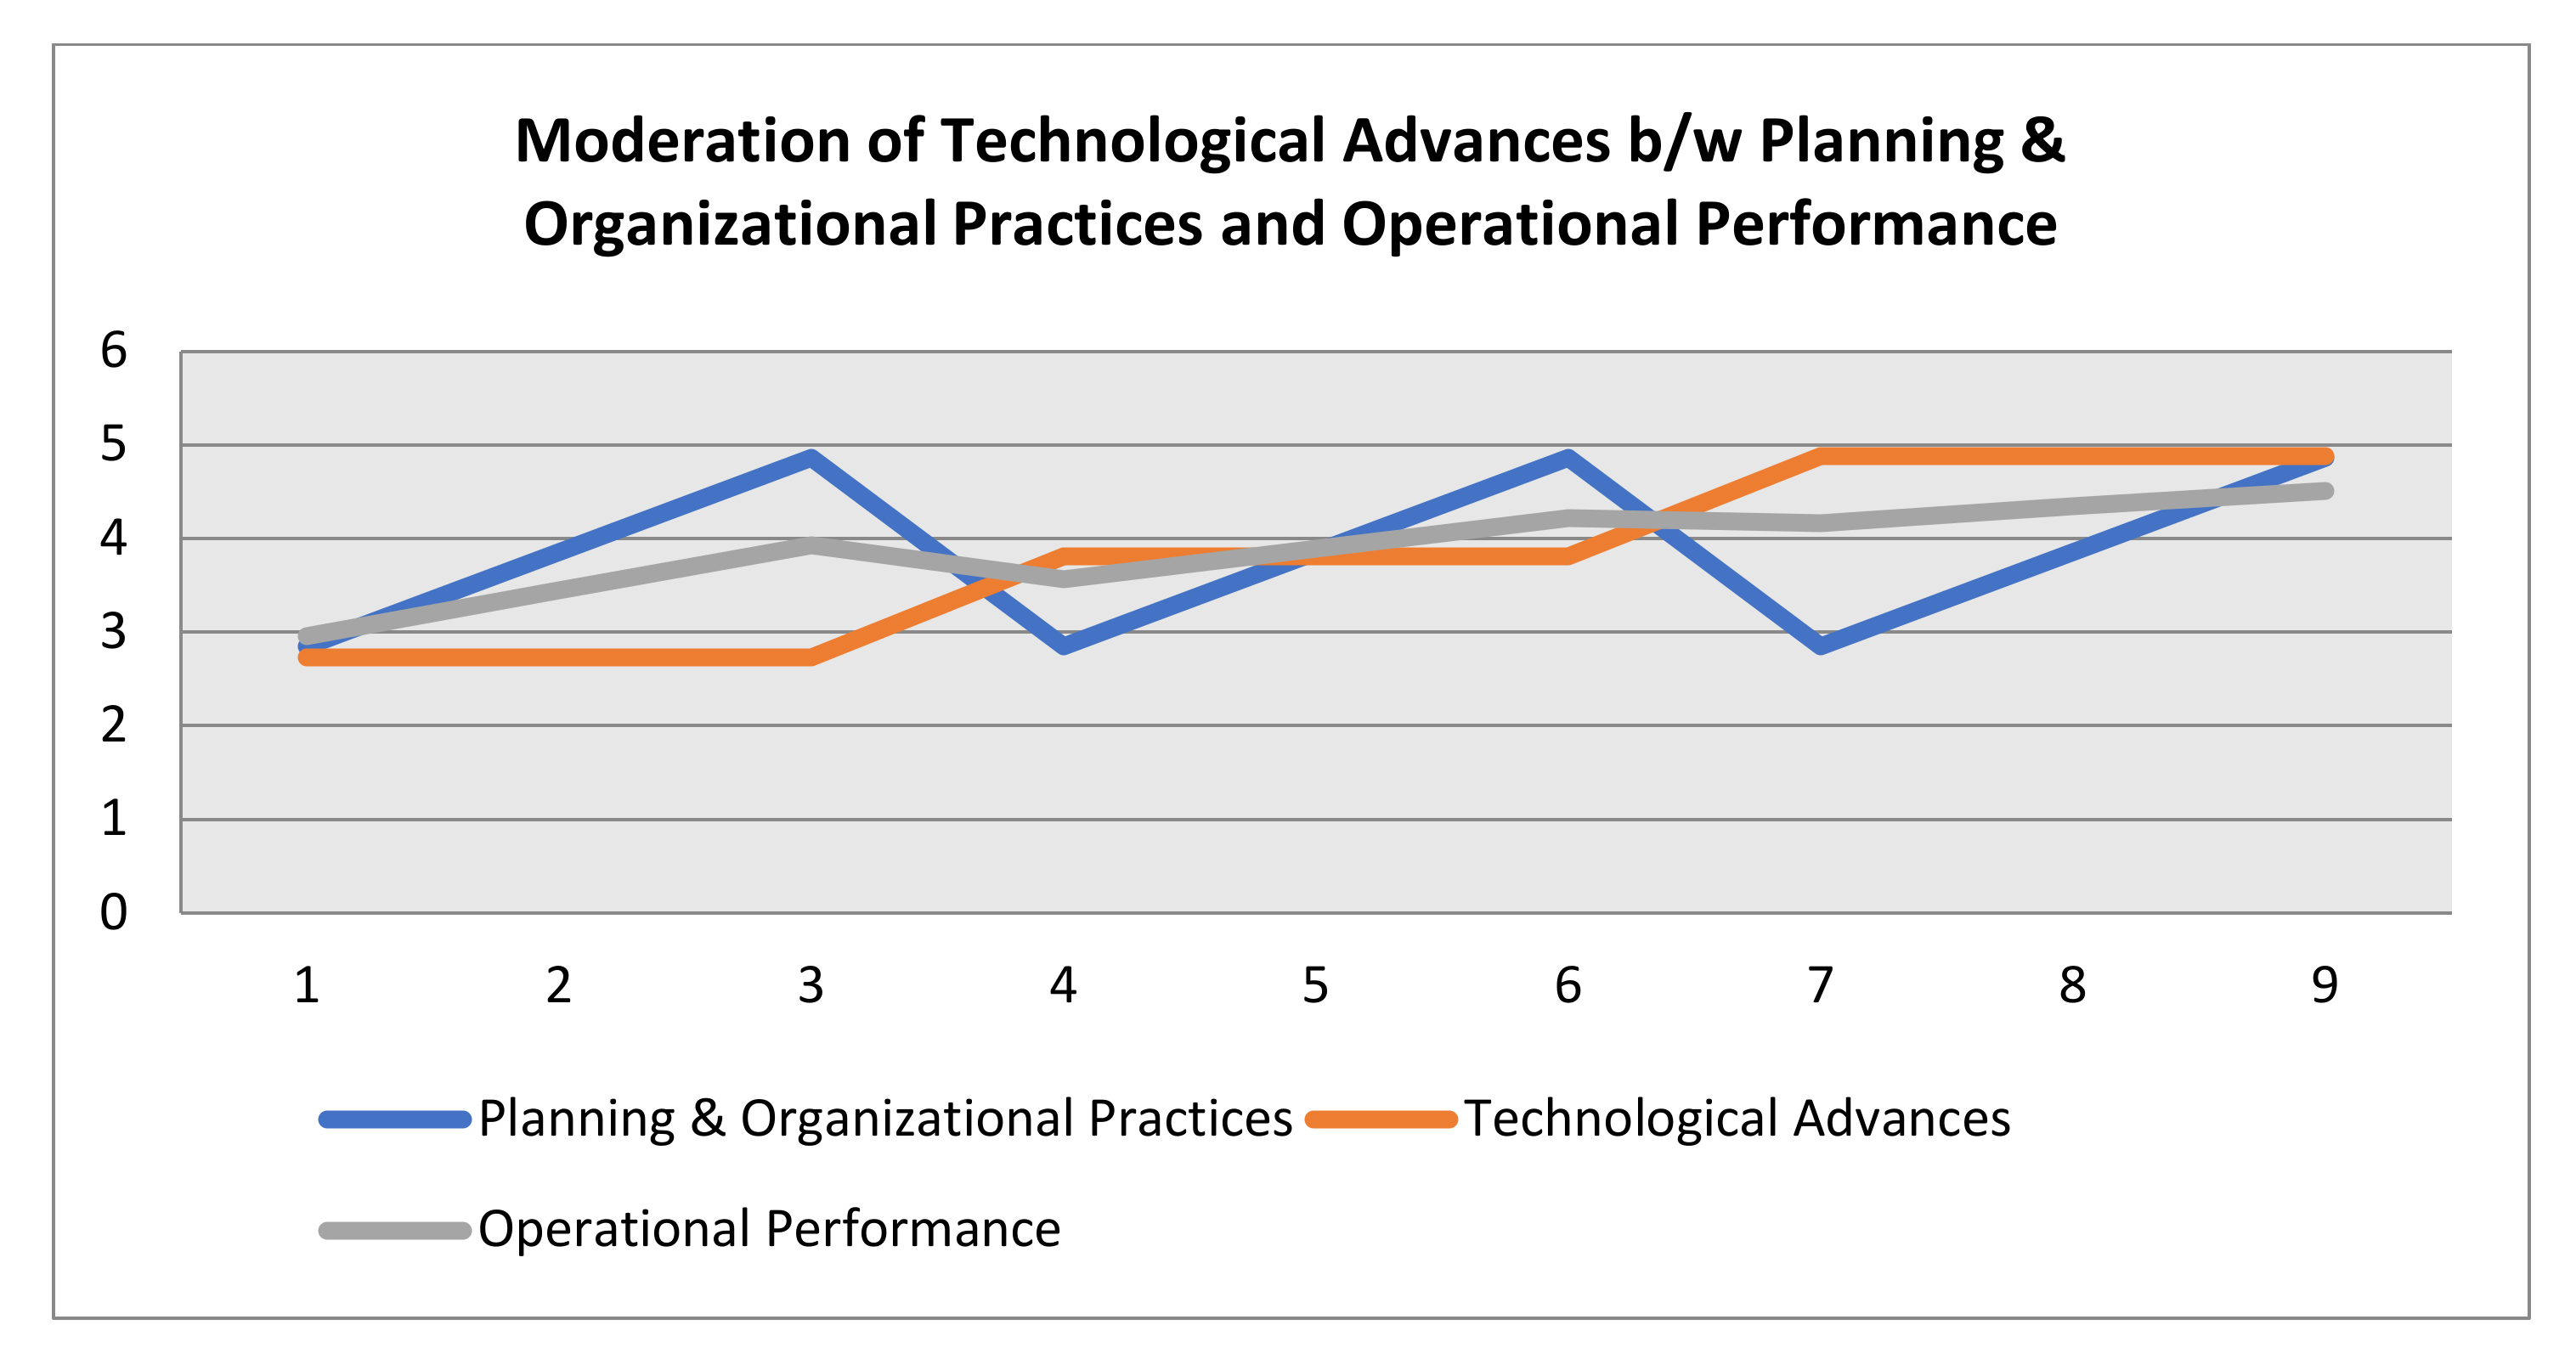
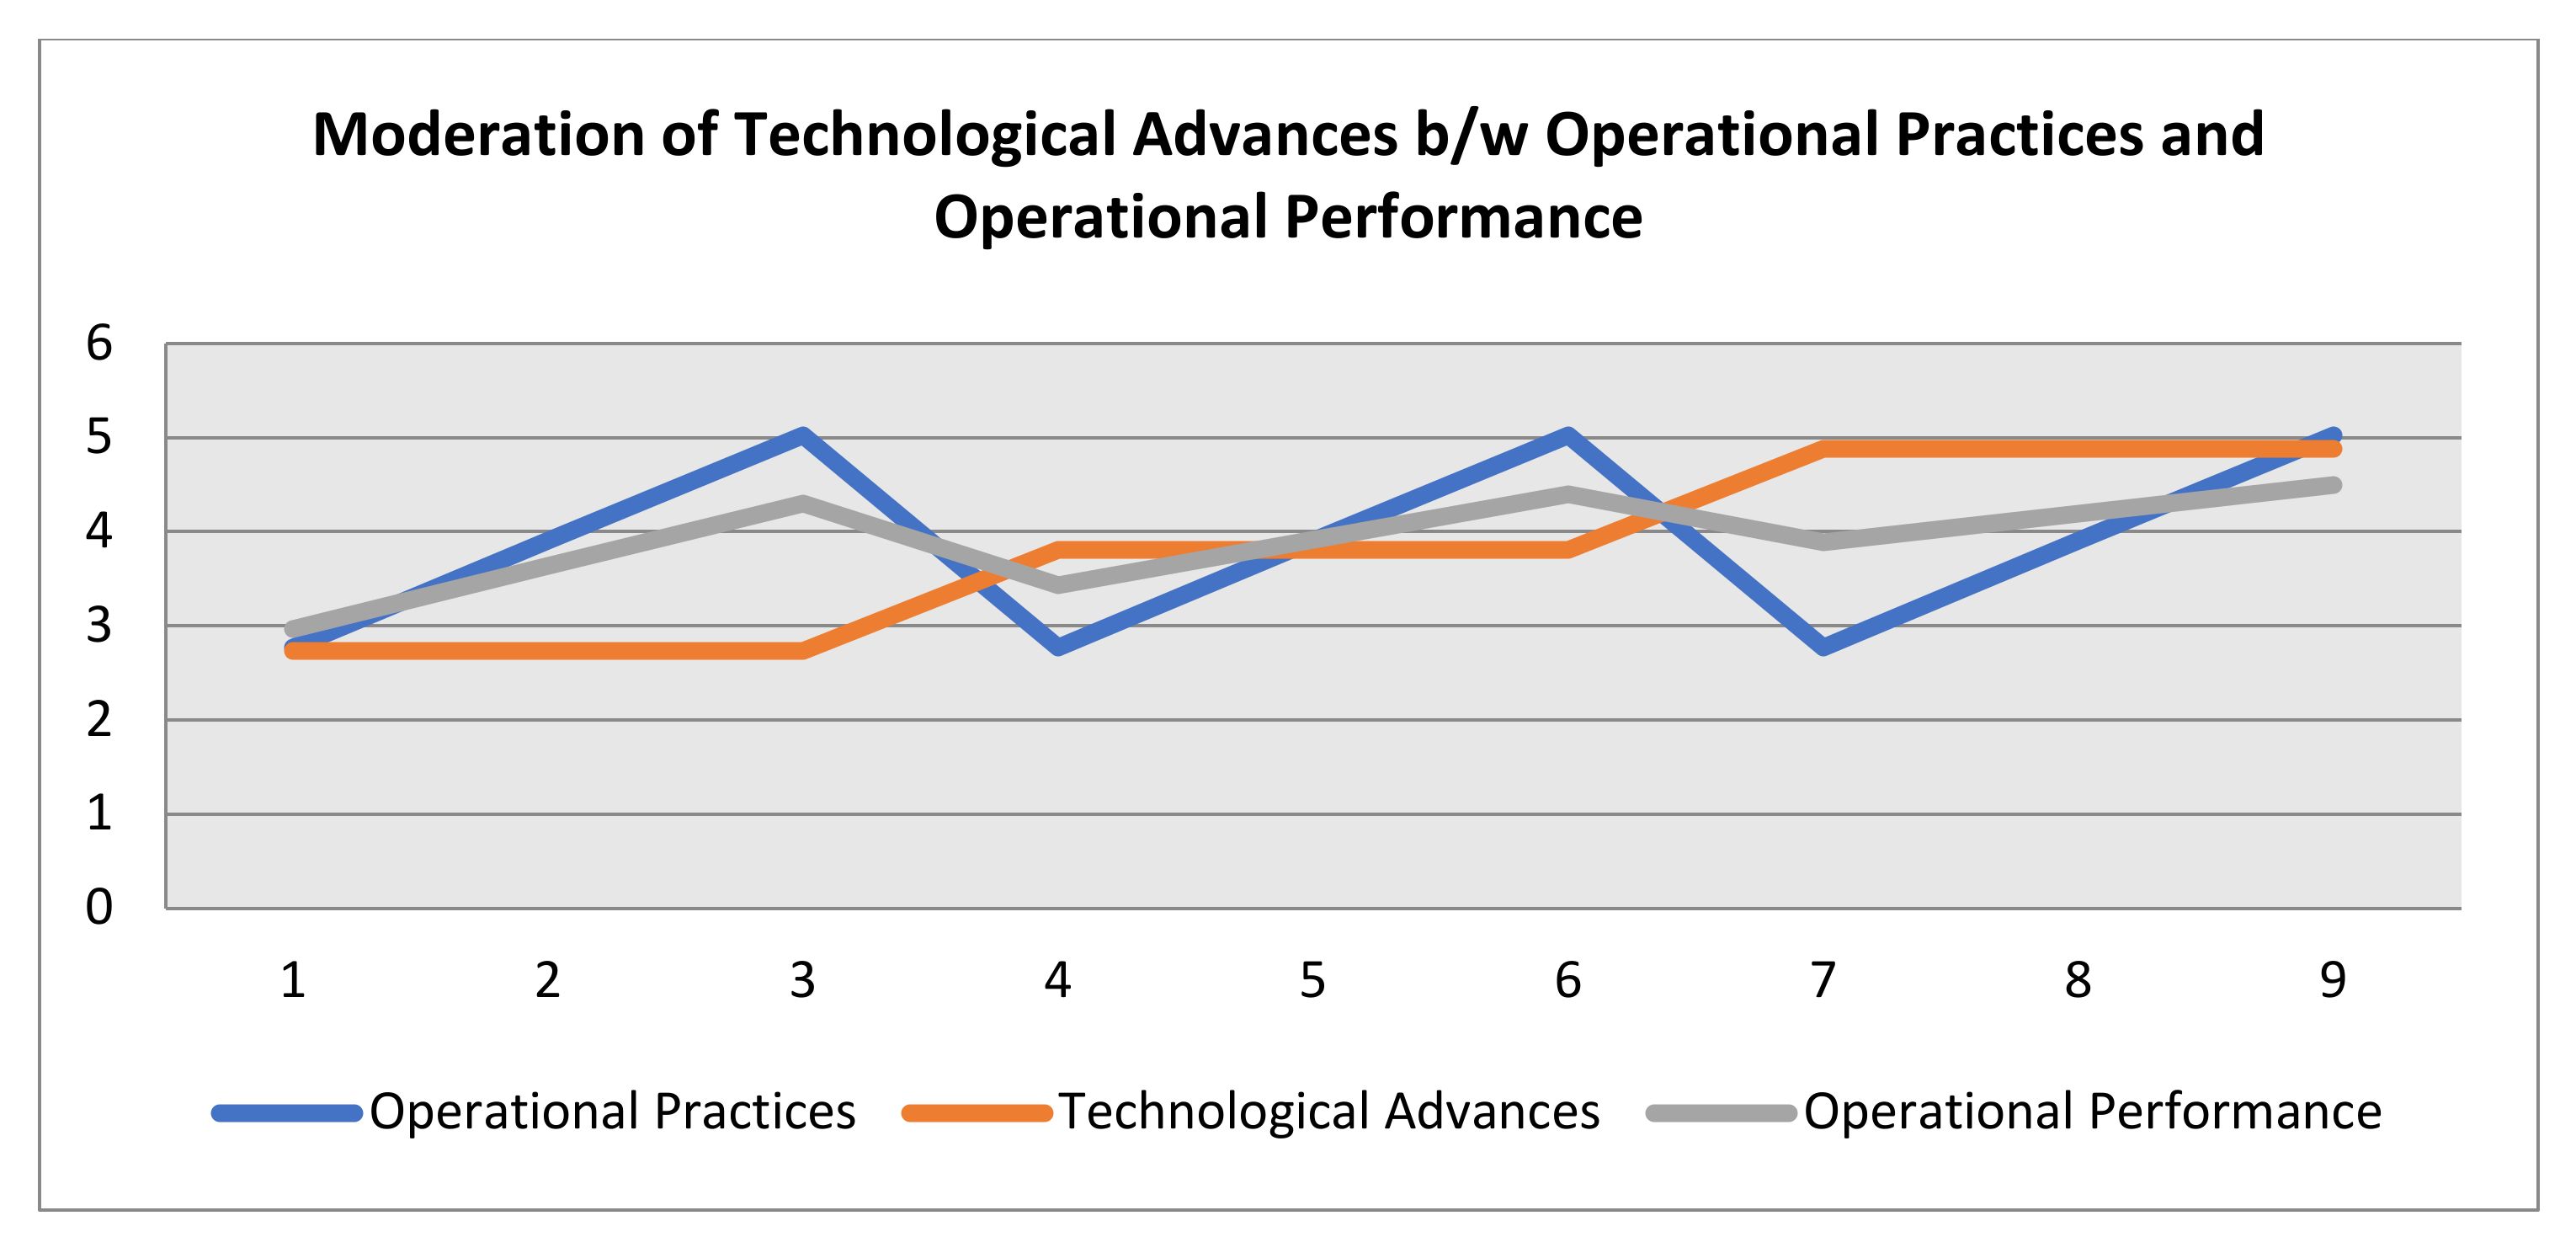
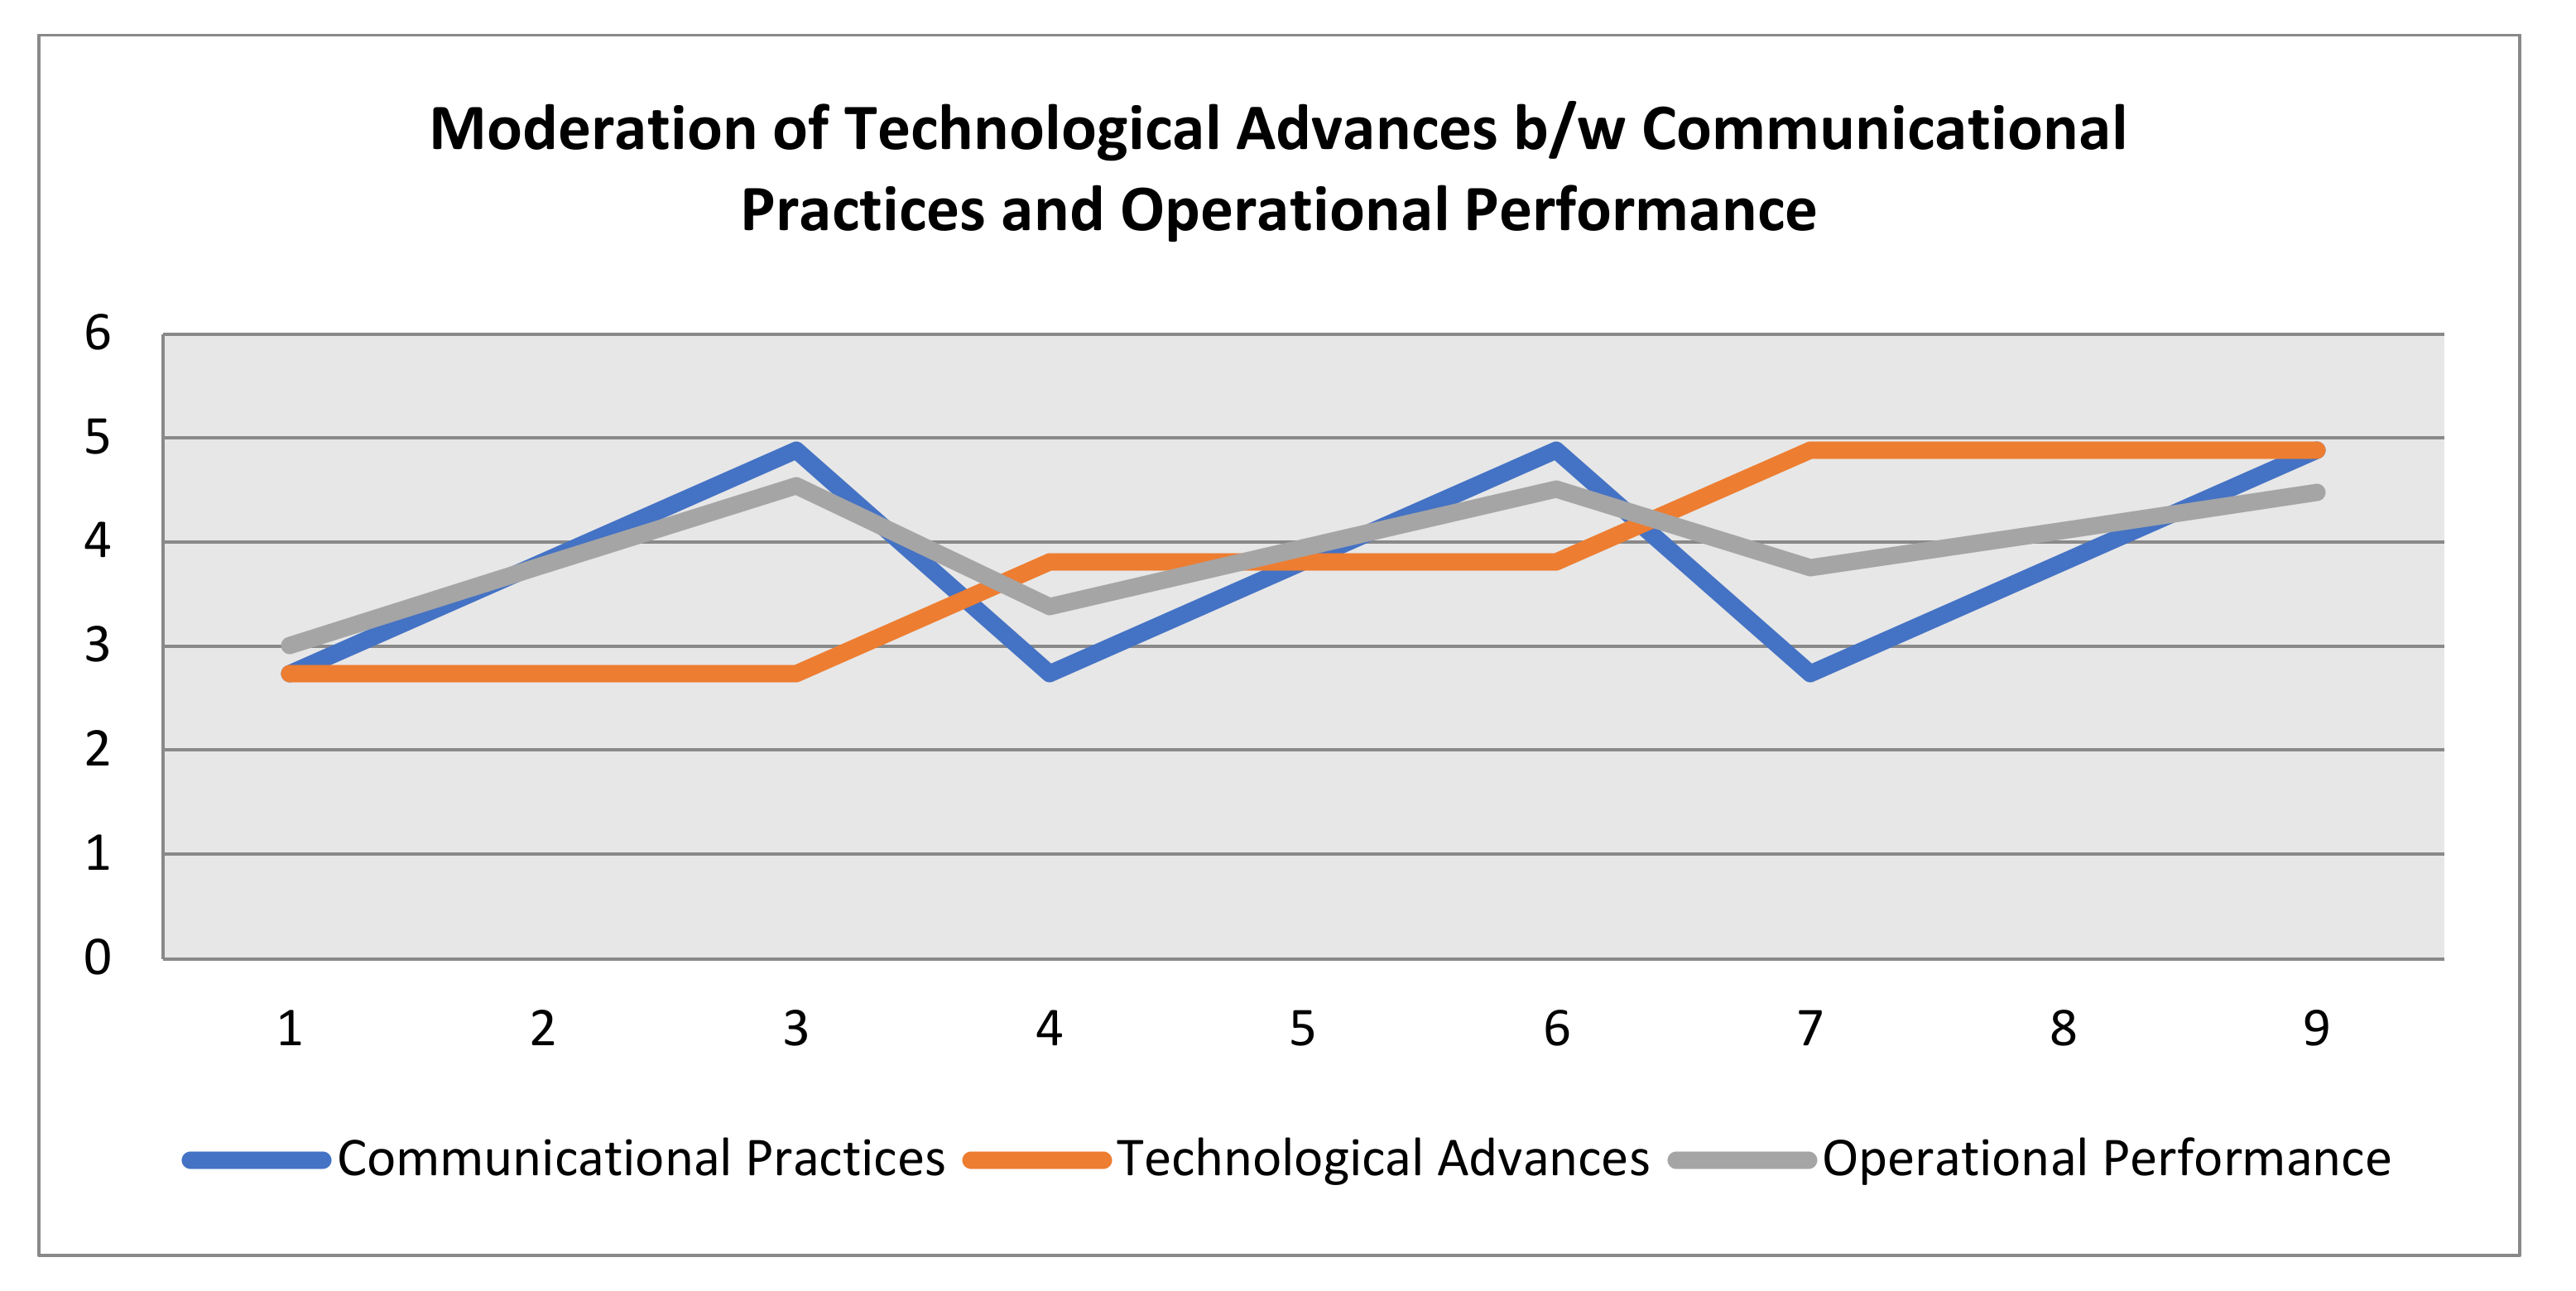
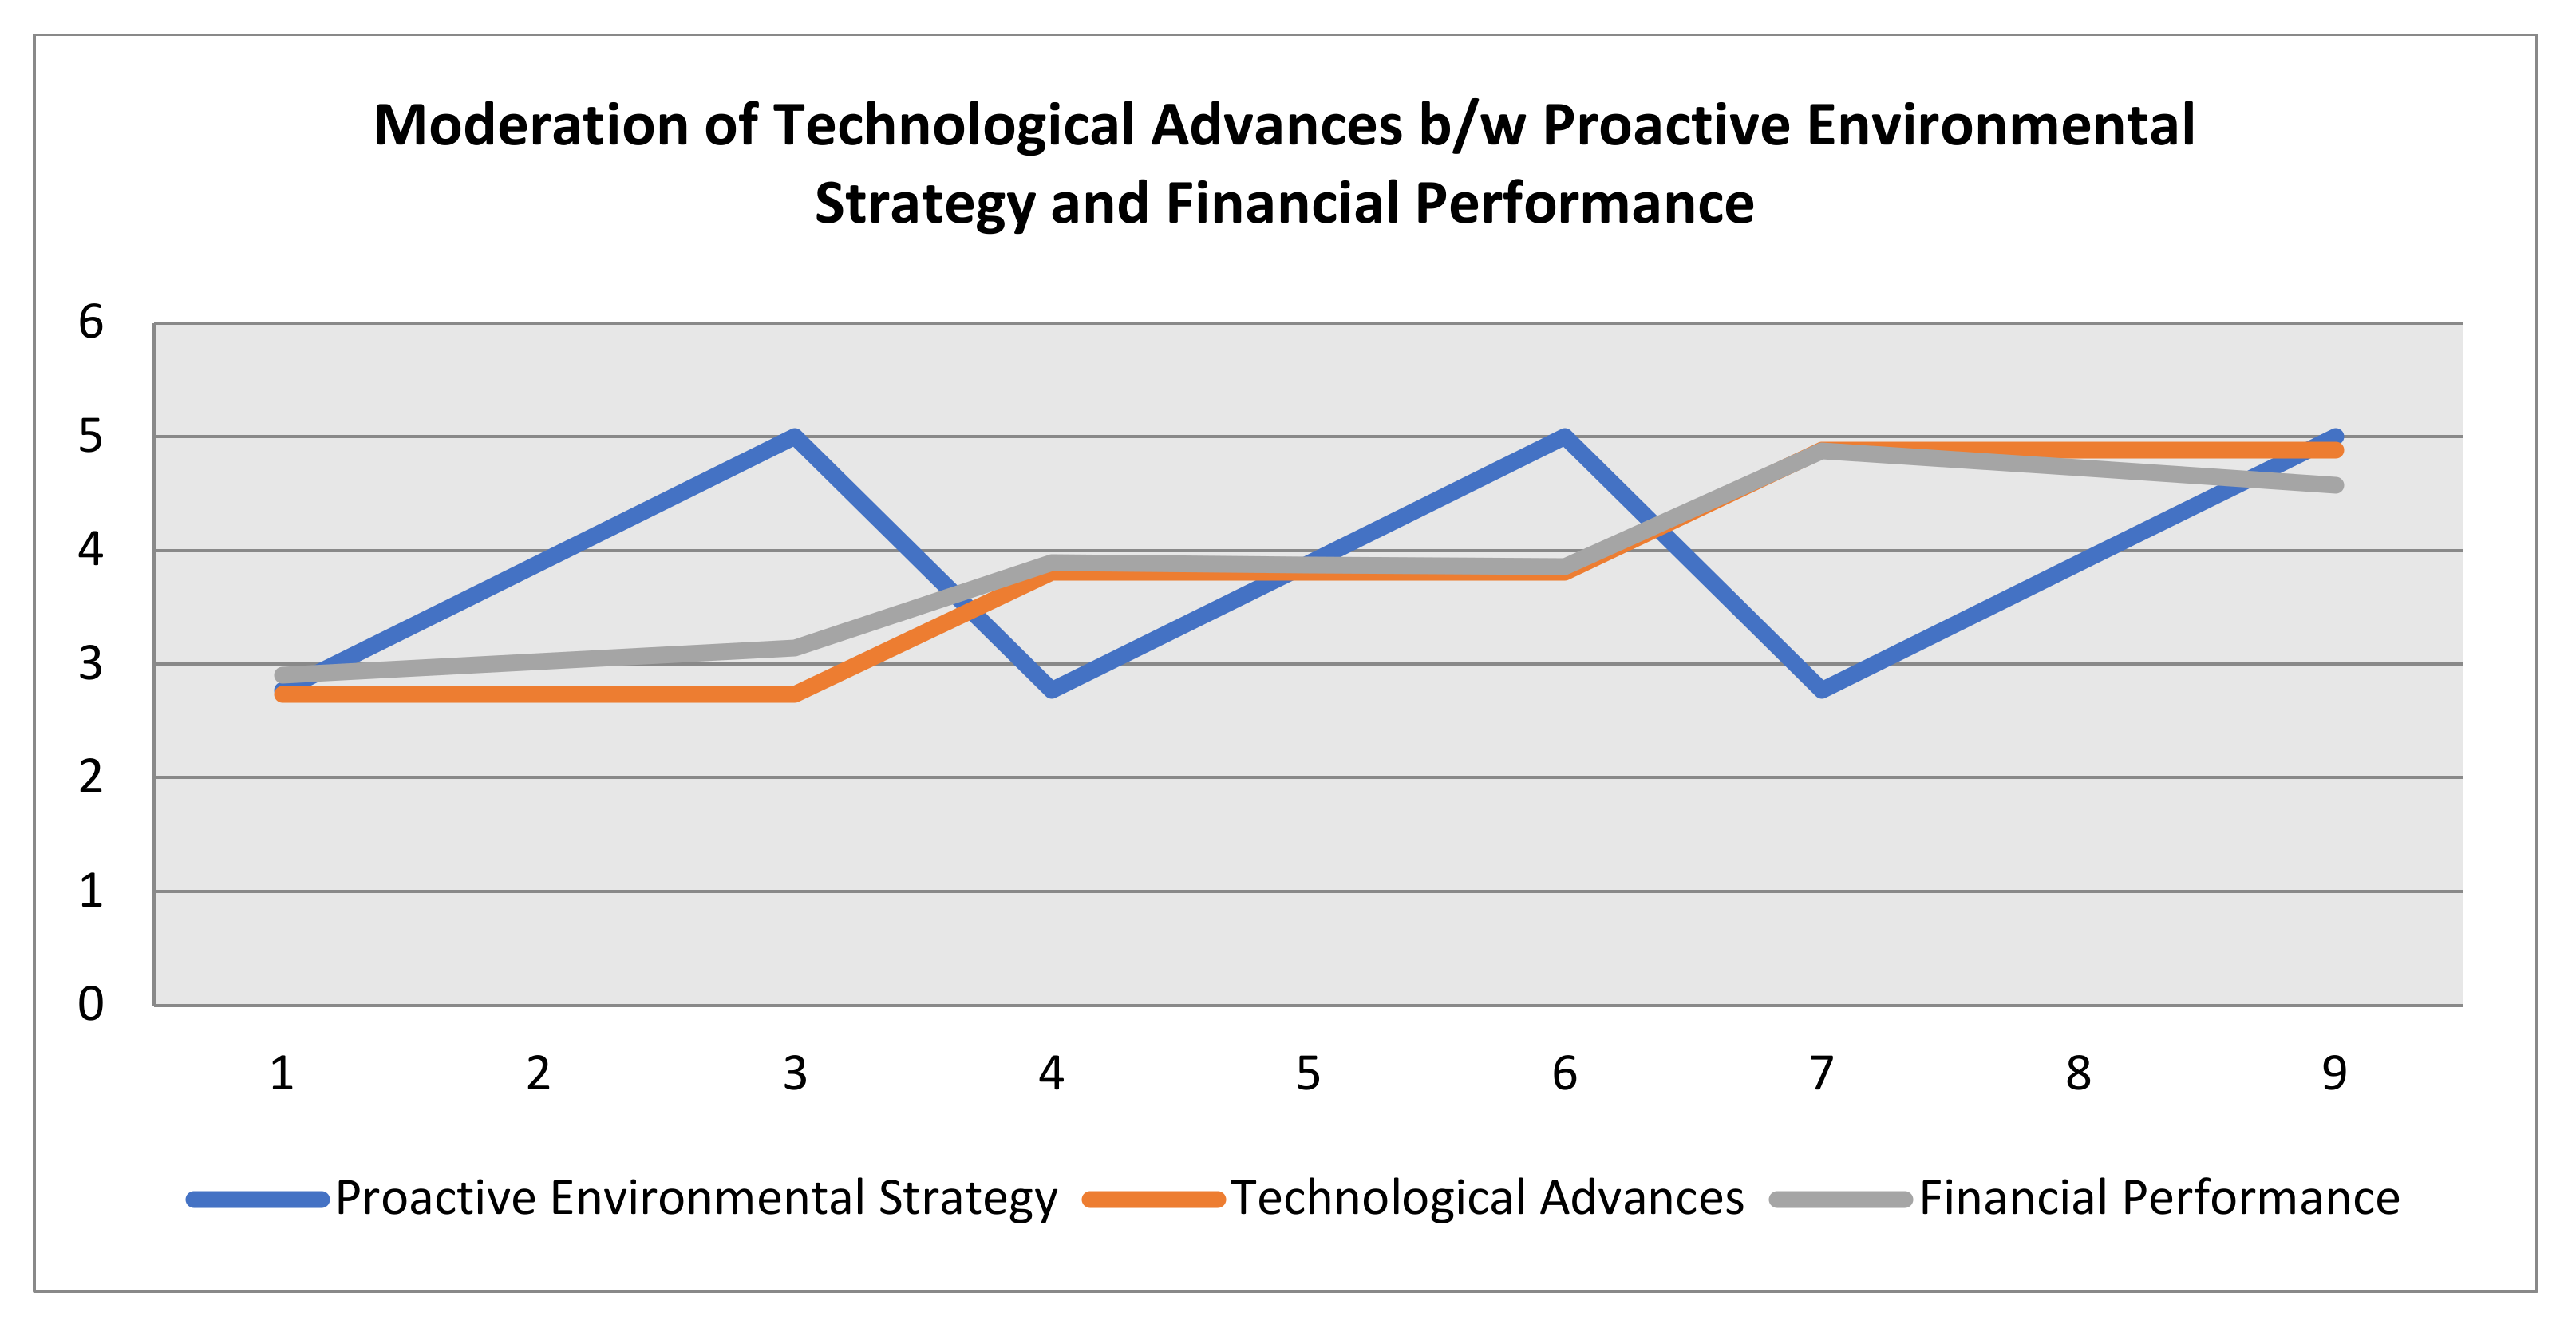
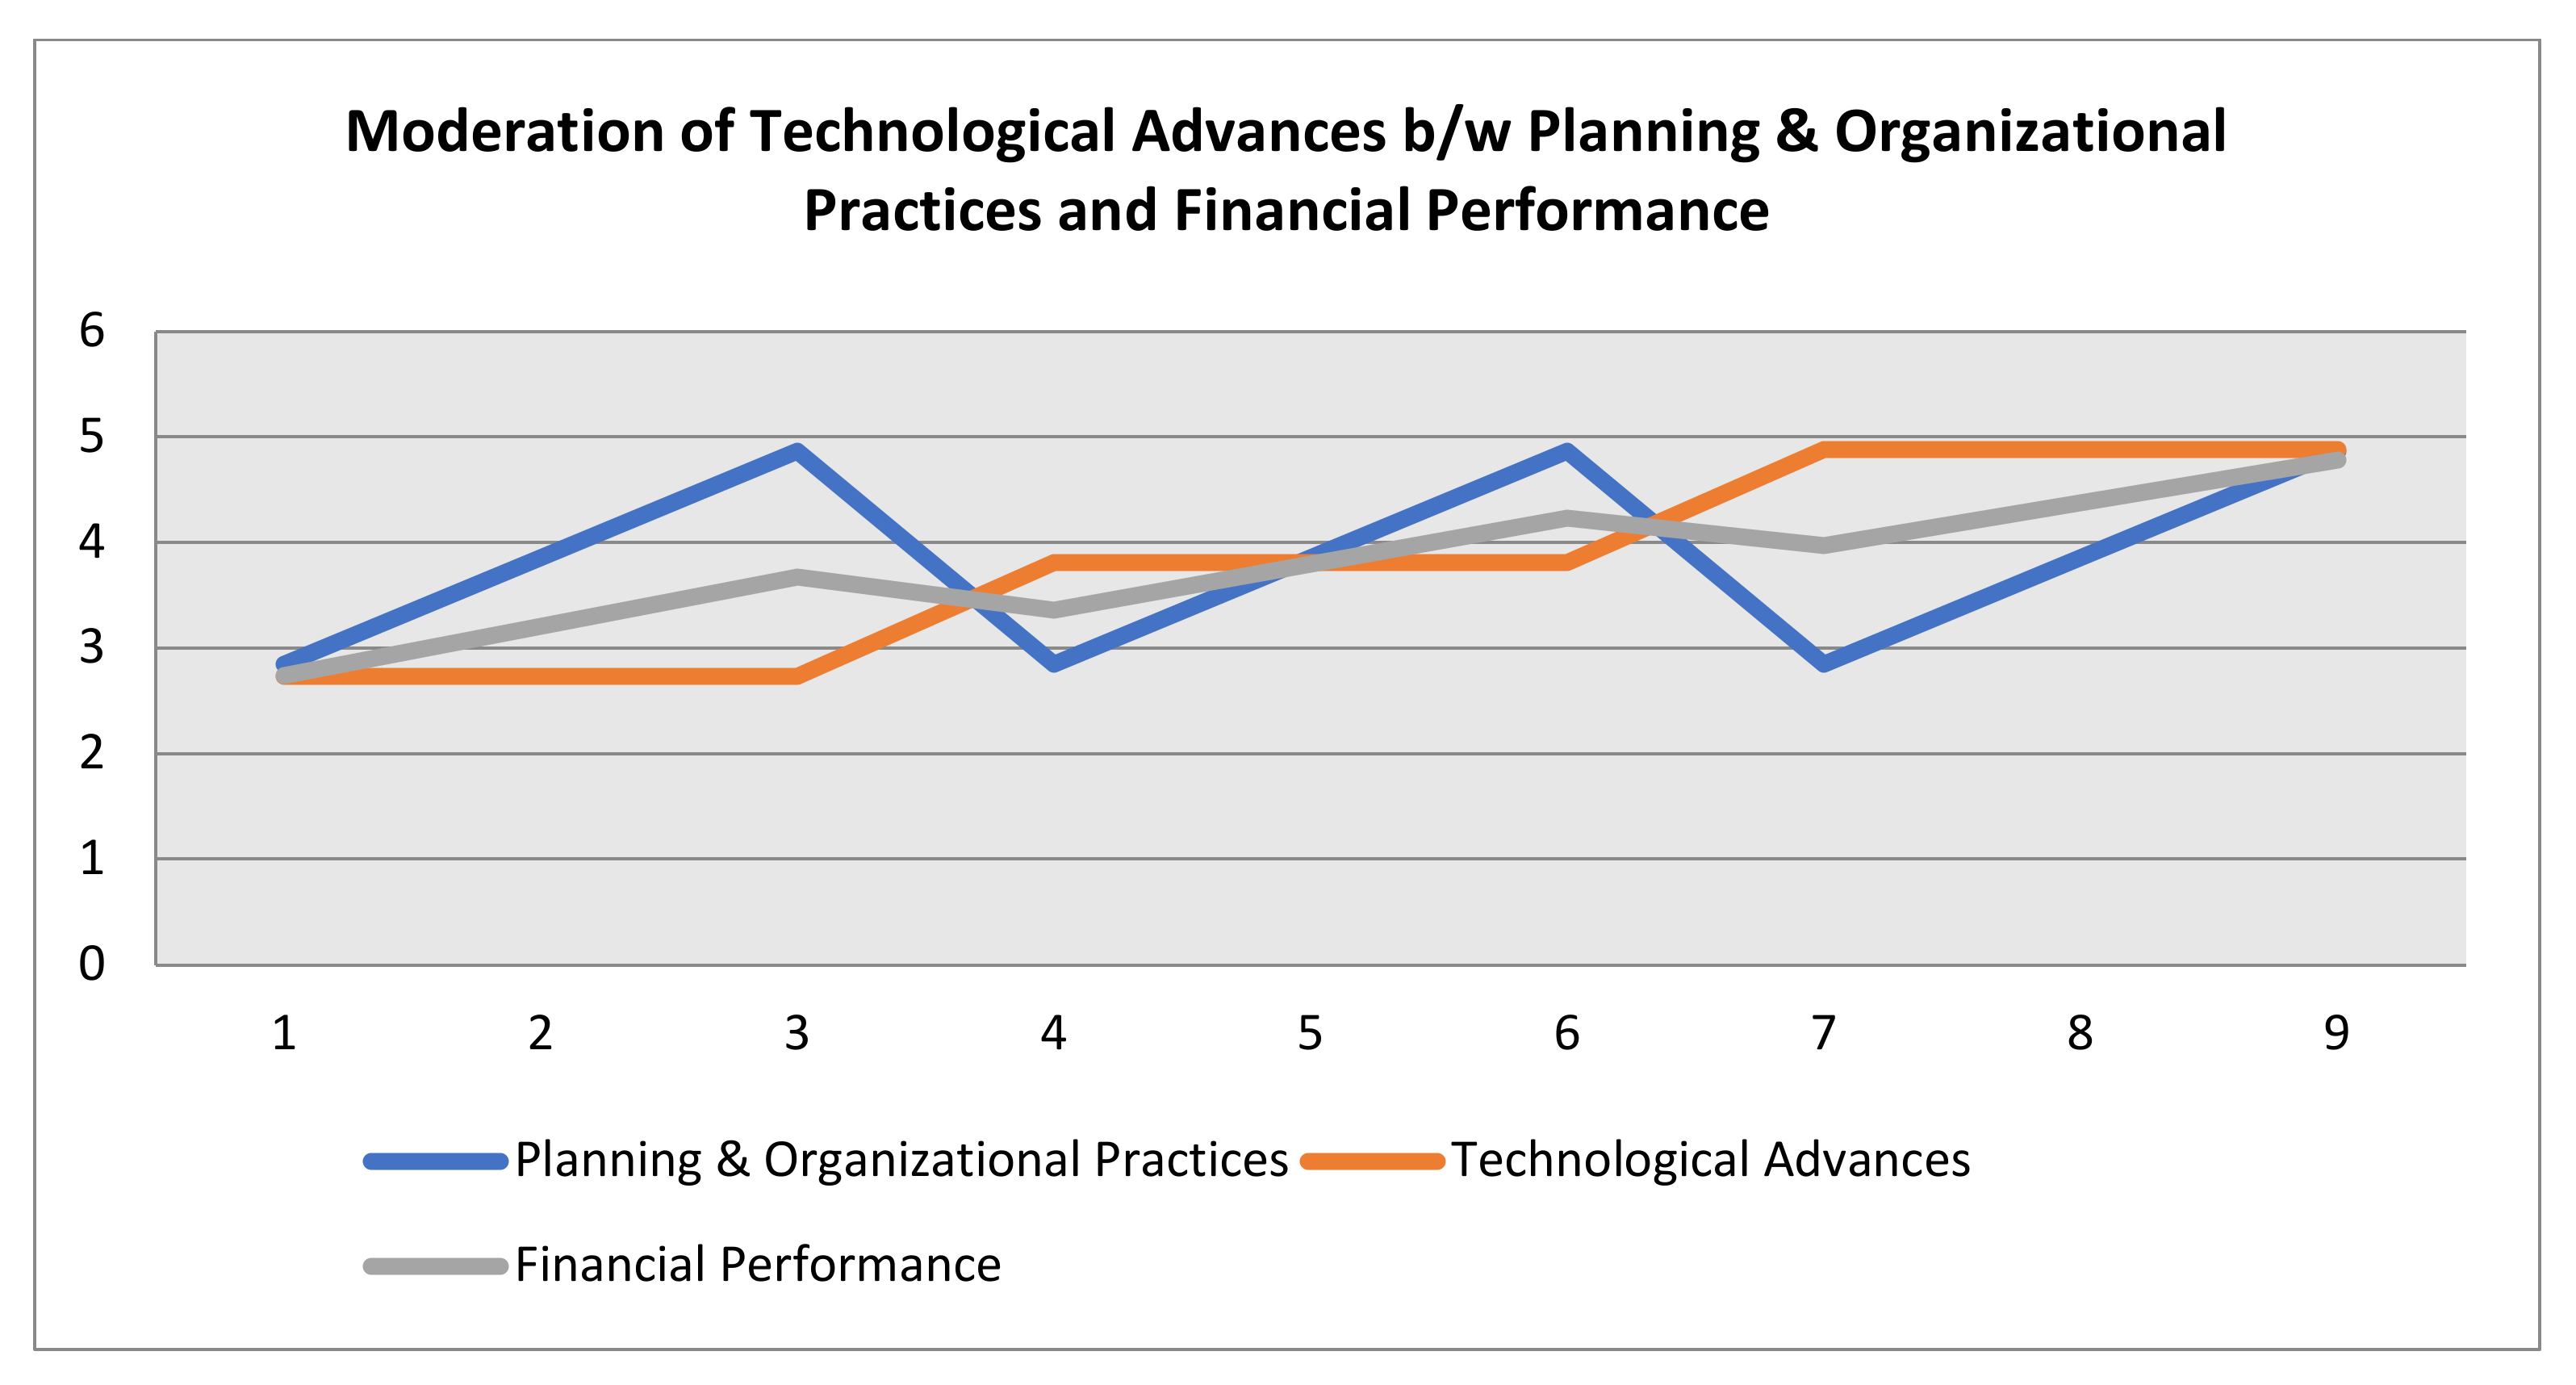
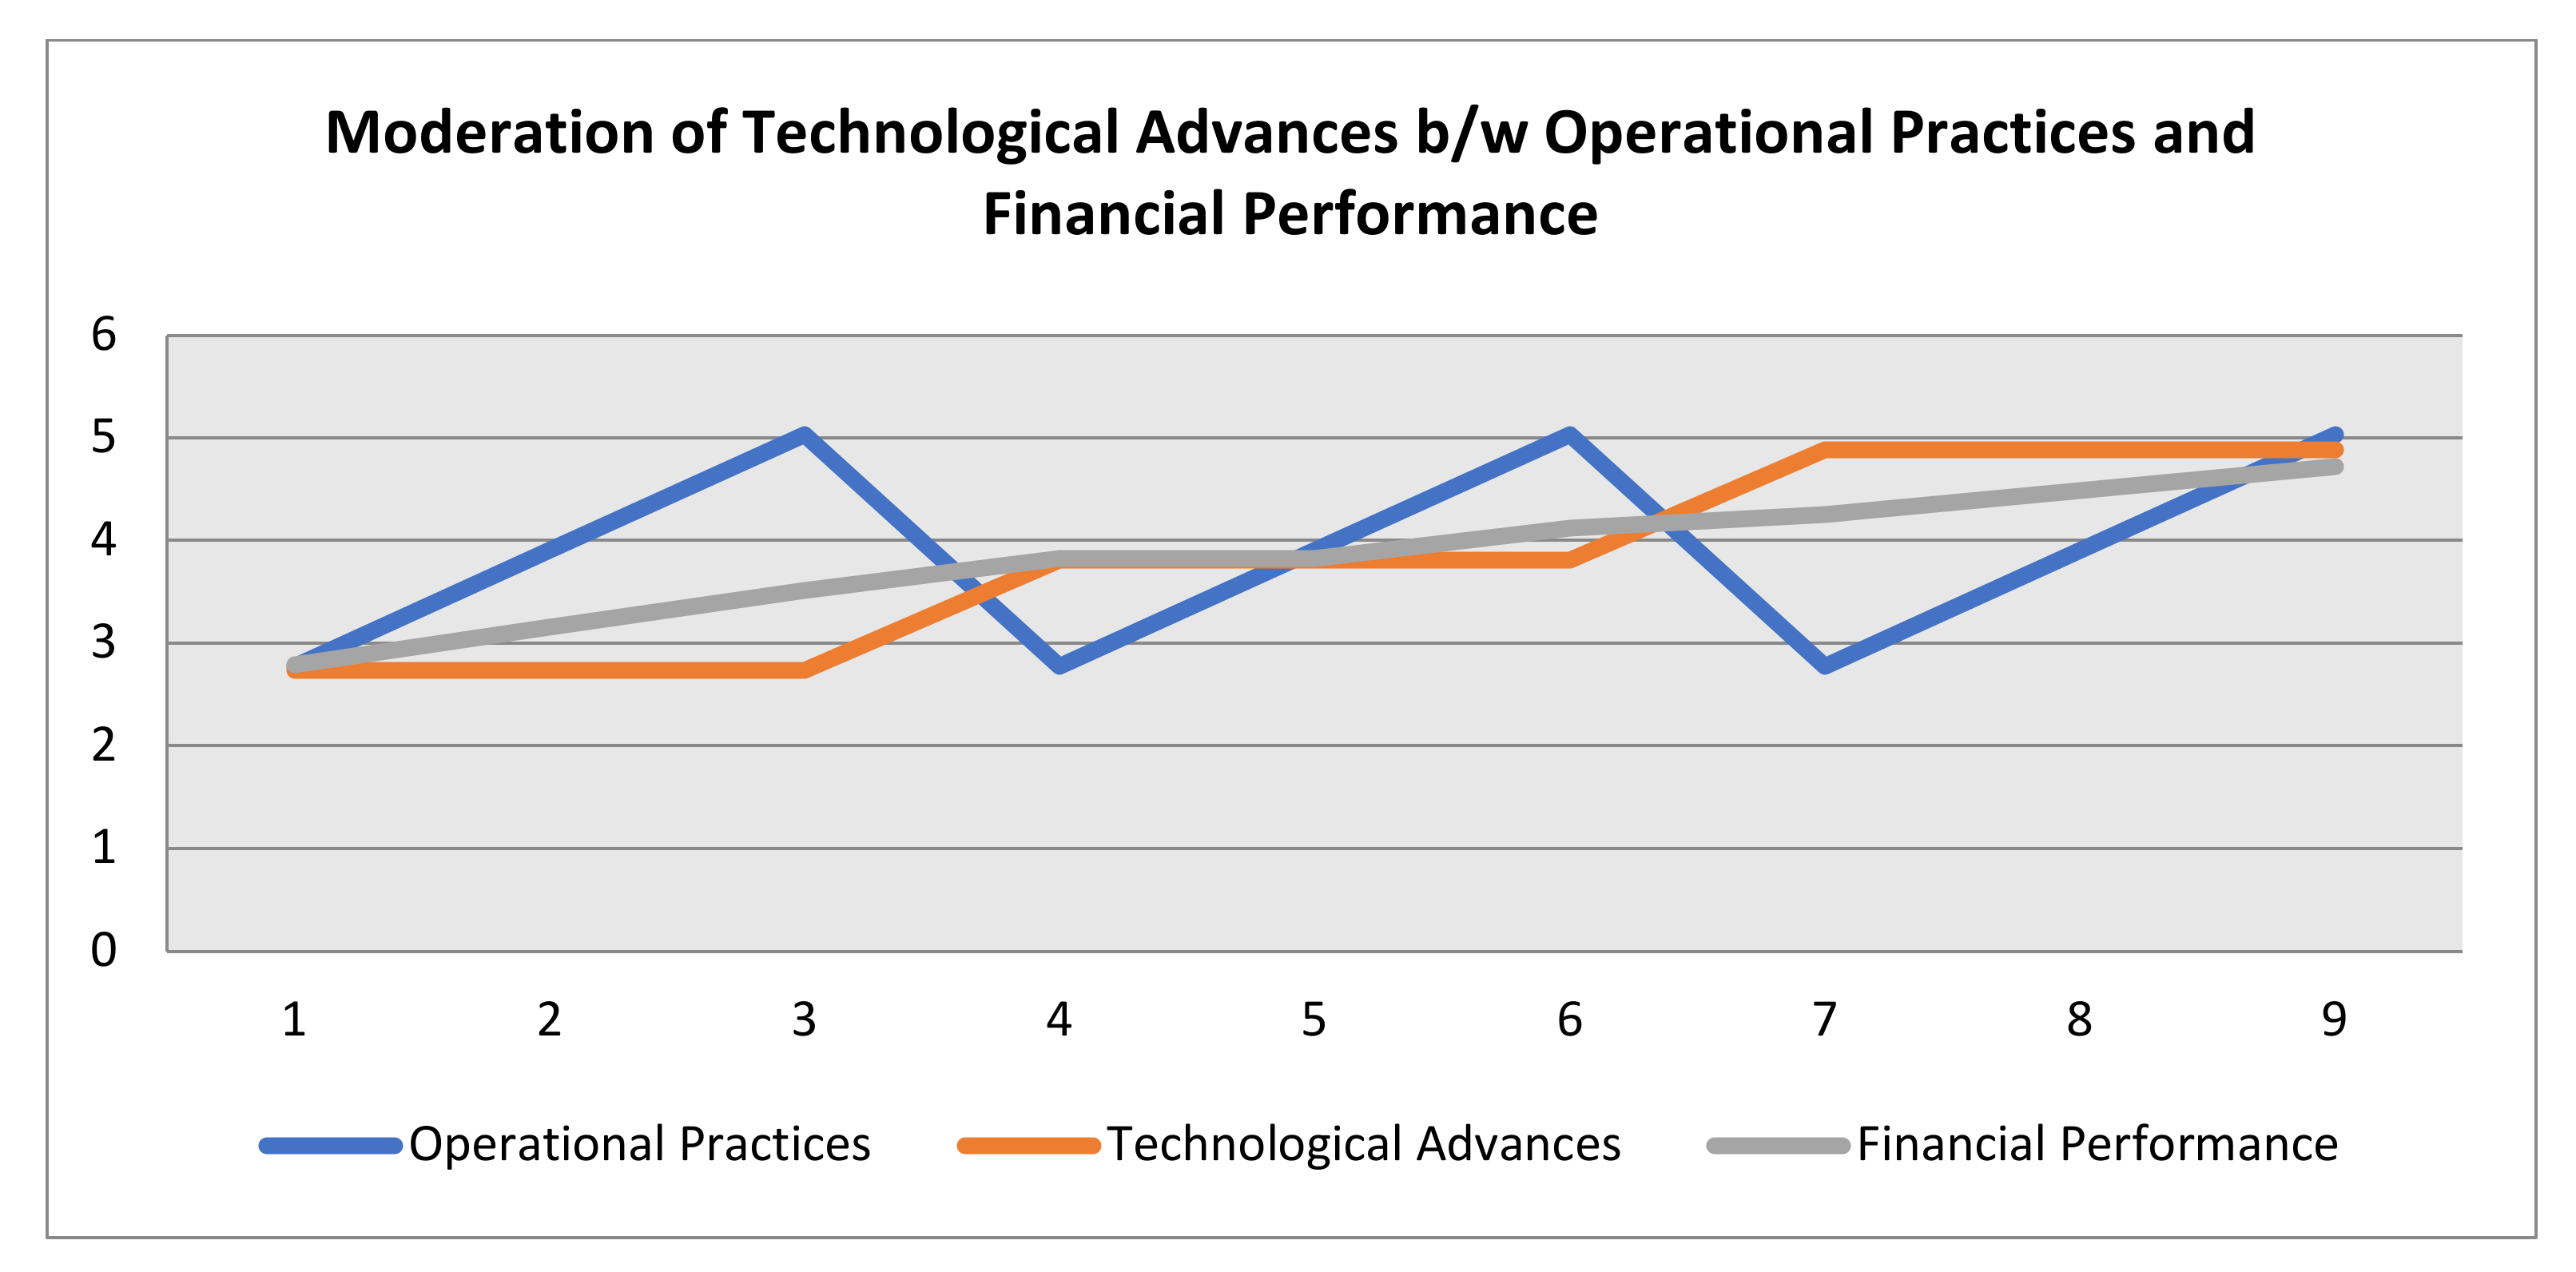
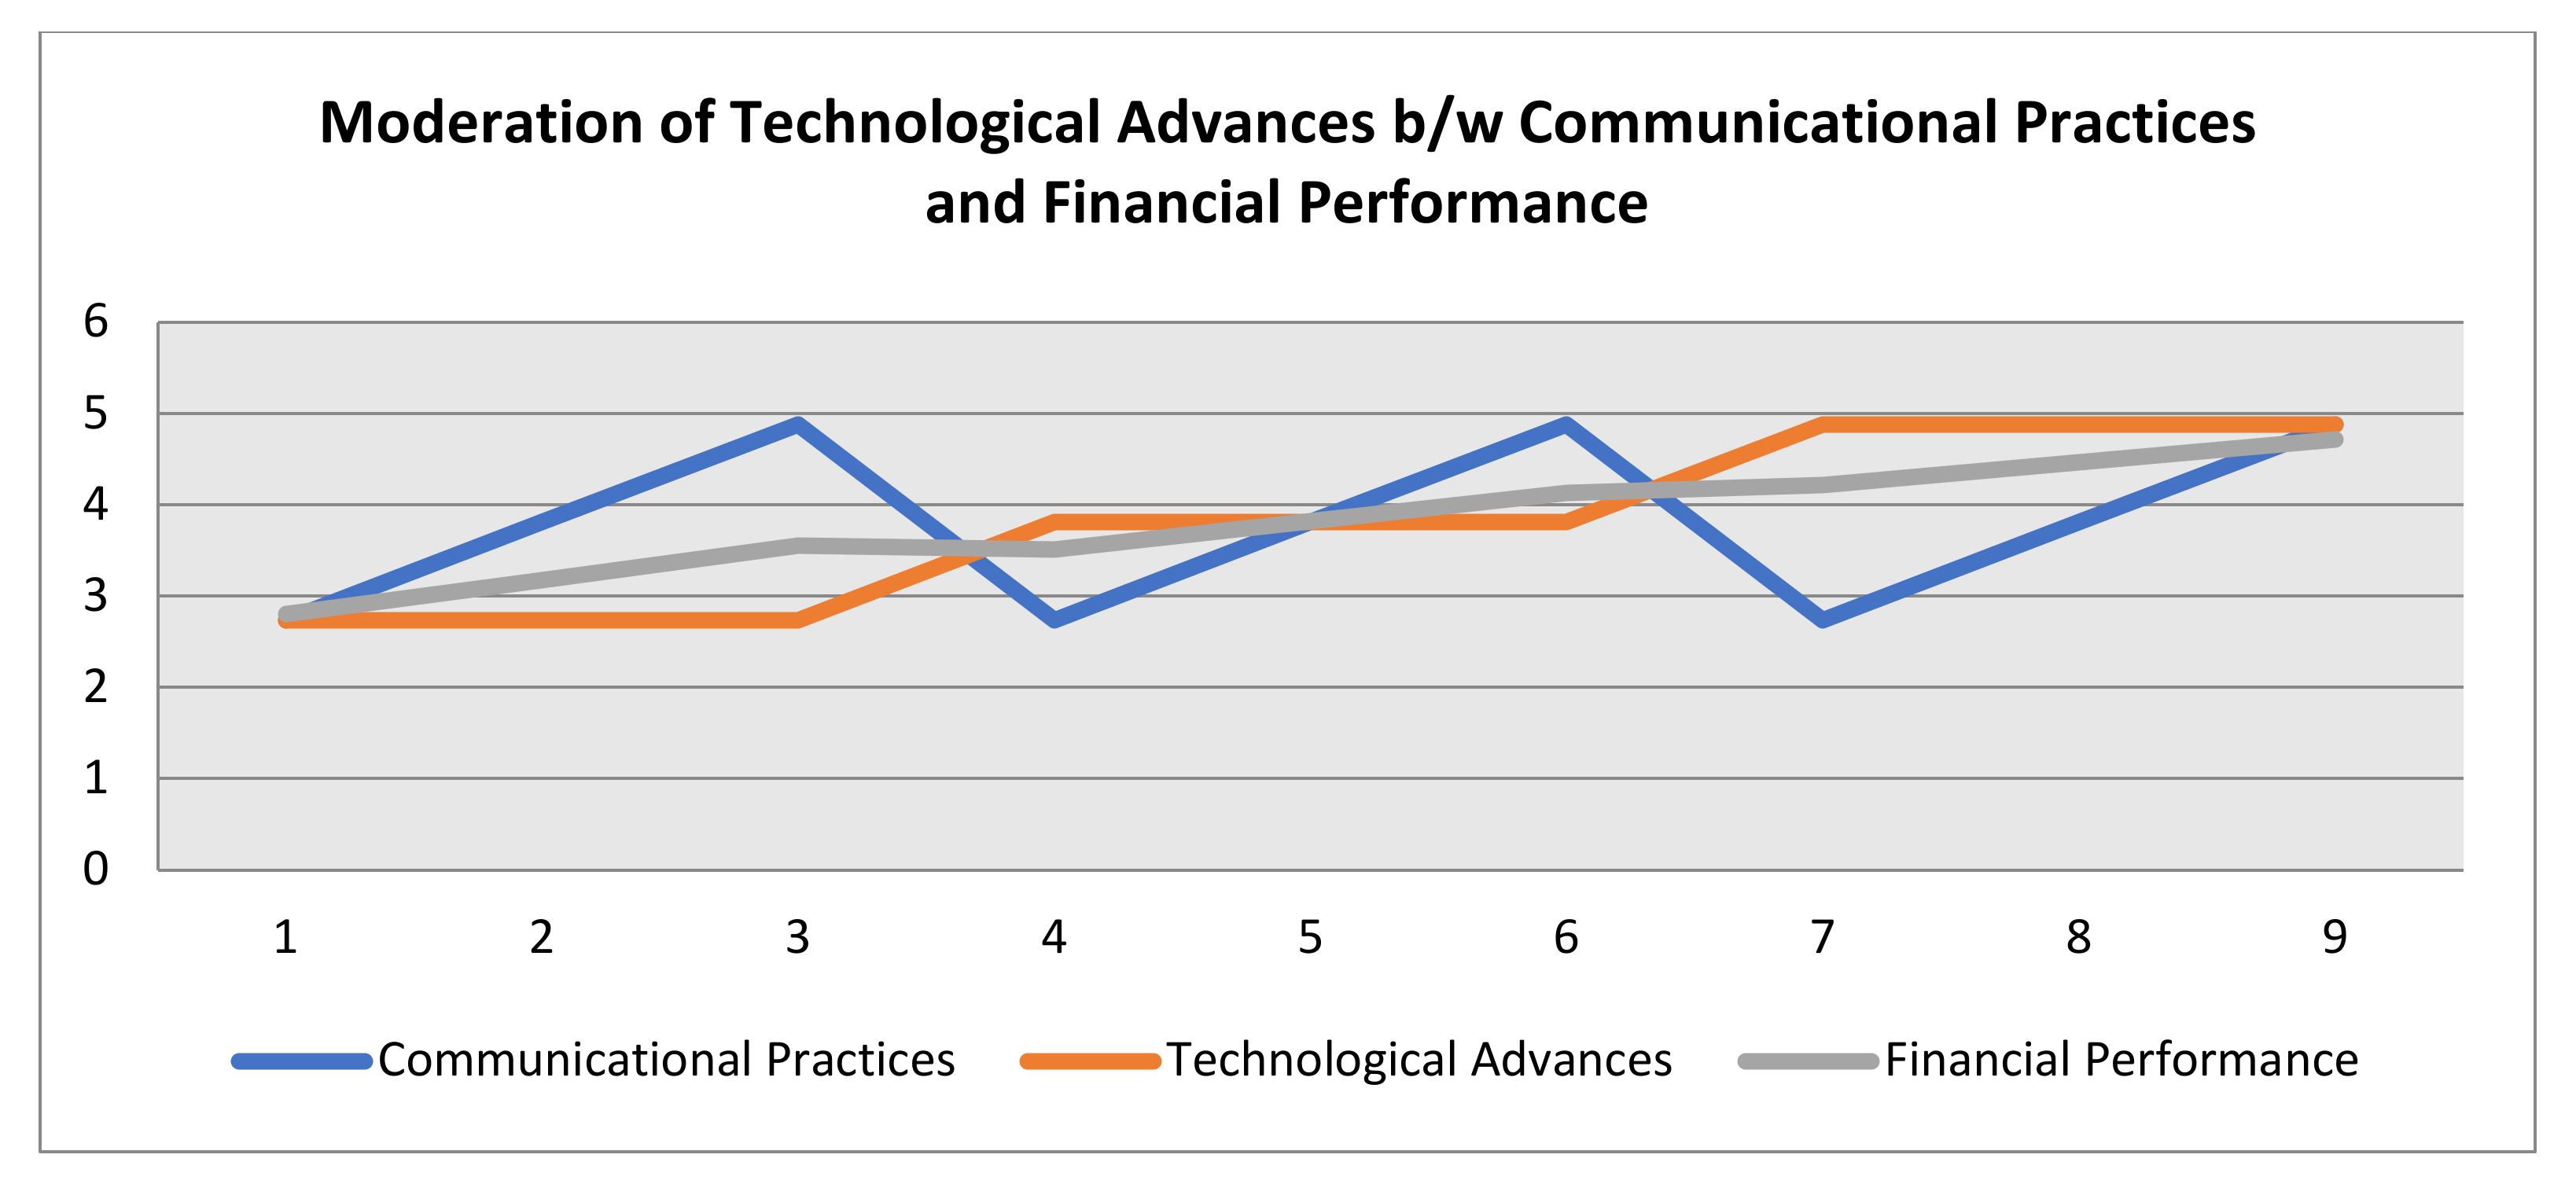
4.11. Conditional Graphical Display of Moderation
5. Discussion
6. Conclusions
6.1. Theoretical and Managerial Implications
6.2. Limitations and Potential Areas of Future Studies
Supplementary Materials
Author Contributions
Funding
Institutional Review Board Statement
Informed Consent Statement
Data Availability Statement
Conflicts of Interest
References
- Bluemling, B.; Tai, H.-S.; Choe, H. Boundaries, limits, landscapes, and flows: An analytical framework for boundaries in natural resource management. J. Environ. Manag. 2021, 285, 112129. [Google Scholar] [CrossRef]
- Lu, J.; Ren, L.; Zhang, C.; Rong, D.; Ahmed, R.R.; Streimikis, J. Modified Carroll’s Pyramid of Corporate Social Responsibility to Enhance Organizational Performance of SMEs Industry. J. Clean. Prod. 2020, 271, 1–18. [Google Scholar] [CrossRef]
- Wolf, J. Improving the sustainable development of firms: The role of employees. Bus. Strategy Environ. 2013, 22, 92–108. [Google Scholar] [CrossRef]
- Forés, B. Beyond Gathering the ‘Low-Hanging Fruit’ of Green Technology for Improved Environmental Performance: An Empirical Examination of the Moderating Effects of Proactive Environmental Management and Business Strategies. Sustainability 2019, 11, 6299. [Google Scholar] [CrossRef] [Green Version]
- Hunt, C.B.; Auster, E.R. Proactive environmental management: Avoiding the toxic trap. MIT Sloan Manag. Rev. 1990, 31, 7–18. [Google Scholar]
- Genç, E.; Benedetto, A.D. A comparison of proactive and reactive environmental strategies in green product innovation. Int. J. Innovat. Sustain. Dev. 2019, 13, 431. [Google Scholar] [CrossRef]
- Hart, S.L.; Ahuja, G. Does it pay to be green? An empirical examination of the relationship between emission reduction and firm performance. Bus. Strateg. Environ. 1996, 5, 48–75. [Google Scholar] [CrossRef]
- Vithessonthi, C. Corporate ecological sustainability strategy decisions: The role of attitude towards sustainable development. J. Organ. Transform. Soc. Chang. 2009, 6, 49–64. [Google Scholar] [CrossRef]
- Quazi, H.A.; Khoo, Y.K.; Tan, C.M.; Wong, P.S. Motivation for ISO 14000 certification: Development of a predictive model. Omega 2001, 29, 525–542. [Google Scholar] [CrossRef]
- Wahyudin, D.; Malik, R.S. Teaching Environmental Education for Sustainable Development: Strategies and Challenges. Int. J. Sustain. High. Educ. 2019, 3, 51. [Google Scholar] [CrossRef]
- Carballo-Penela, A.; Doménech, J. Managing the carbon footprint of products: The contribution of the method composed of financial statements (MC3). Int. J. Life Cycle Assess. 2010, 15, 962–969. [Google Scholar] [CrossRef]
- Wahba, H. Does the market value corporate environmental responsibility? An empirical examination. Corp. Soc. Resp. Env. Manag. 2008, 15, 89–99. [Google Scholar] [CrossRef]
- Aragón-Correa, J.A.; Sharma, S. A contingent resource-based view of proactive corporate environmental strategy. Acad. Manag. Rev. 2003, 28, 71–88. [Google Scholar] [CrossRef] [Green Version]
- Seroka-Stolka, O.; Fijorek, K. Enhancing corporate sustainable development: Proactive environmental strategy, stakeholder pressure and the moderating effect of firm size. Bus. Strategy Environ. 2020, 29, 2338–2354. [Google Scholar] [CrossRef]
- Min, B.H.; Oh, Y. How Do Performance Gaps Affect Improvement in Organizational Performance? Exploring the Mediating Roles of Proactive Activities. Public Perform. Manag. Rev. 2020, 43, 766–789. [Google Scholar] [CrossRef]
- Seid, M. The Veer from Frontier Economics to Eco-Development Paradigm: Approaches, Policies and Strategies of Sustainable Development—The Case of Environmental Governance in Ethiopia. J. Environ. Chem. 2019, 4, 21. [Google Scholar] [CrossRef] [Green Version]
- Sharma, P.; Sharma, S. Drivers of proactive environmental strategy in family firms. Bus. Ethics. Q. 2011, 21, 309–334. [Google Scholar] [CrossRef] [Green Version]
- Lince, Y.A. Determinants of Environmental Performance with the Carbon Management Strategy as an Intervening Variable. J. Eco. Sustain. Dev. 2019, 10, 60–71. [Google Scholar]
- Sharma, S. Managerial interpretations and organizational context as predictors of corporate choice of environmental strategy. Acad. Manag. J. 2000, 43, 681–697. [Google Scholar] [CrossRef]
- Buysse, K.; Verbeke, A. Proactive environmental strategies: A stakeholder management perspective. Strateg. Manag. J. 2003, 24, 453–470. [Google Scholar] [CrossRef]
- Henriques, I.; Sadorsky, P. The relationship between environmental commitment and managerial perceptions of stakeholder importance. Acad. Manag. J. 1999, 42, 87–99. [Google Scholar] [CrossRef]
- Lucas, M.T. Understanding environmental management practices: Integrating views from strategic management and ecological economics. Bus. Strateg. Environ. 2000, 19, 543–556. [Google Scholar] [CrossRef]
- González-Benito, J.; González-Benito, O. Environmental proactivity and business performance: An empirical analysis. Omega 2005, 33, 1–15. [Google Scholar] [CrossRef]
- González-Benito, J.; González-Benito, Ó. A review of determinant factors of environmental proactivity. Bus. Strateg. Environ. 2006, 15, 87–102. [Google Scholar] [CrossRef]
- Koirala, B.S.; Pradhan, G. Determinants of sustainable development: Evidence from 12 Asian countries. Sustain. Dev. 2020, 28, 39–45. [Google Scholar] [CrossRef]
- Sangle, S. Empirical analysis of determinants of adoption of proactive environmental strategies in India. Bus. Strategy Environ. 2010, 19, 51–63. [Google Scholar] [CrossRef]
- Aldieri, L.; Bruno, B.; Senatore, L.; Vinci, C.P. The future of pharmaceuticals industry within the triad: The role of knowledge spillovers in innovation process. Futures 2020, 122, 102600. [Google Scholar] [CrossRef]
- Liu, J.; Shu, C. Proactive Environmental Strategy, Corporate Venturing, and Firm Performance. Acad. Manag. Proc. 2020, 1, 19394. [Google Scholar] [CrossRef]
- Molina-Azorín, J.F.; Claver-Cortés, E.; López-Gamero, M.D.; Tarí, J.J. Green management and financial performance: A literature review. Manag. Decis. 2009, 47, 1080–1100. [Google Scholar] [CrossRef]
- Blanco, E.; Rey-Maquieira, J.; Lozano, J. Economic incentives for tourism firms to undertake voluntary environmental management. Tour. Manag. 2009, 30, 112–122. [Google Scholar] [CrossRef]
- Son, D.-J.; Kim, C.-S.; Park, J.-W.; Lee, S.-H.; Chung, H.-M.; Jeong, D.-H. Spatial variation of pharmaceuticals in the unit processes of full-scale municipal wastewater treatment plants in Korea. J. Environ. Manag. 2021, 286, 112150. [Google Scholar] [CrossRef]
- Delmas, M.; Hoffman, V.H.; Kuss, M. Under the tip of the iceberg: Absorptive capacity, environmental strategy and competitive advantage. Bus. Soc. 2011, 50, 116–154. [Google Scholar] [CrossRef] [Green Version]
- Do, B.; Nguyen, N. The Links between Proactive Environmental Strategy, Competitive Advantages and Firm Performance: An Empirical Study in Vietnam. Sustainability 2020, 12, 4962. [Google Scholar] [CrossRef]
- Hoang, T.C.; Black, M.C.; Knuteson, S.L.; Roberts, A.P. Environmental Pollution, Management, and Sustainable Development: Strategies for Vietnam and Other Developing Countries. Environ. Manag. 2019, 63, 433–436. [Google Scholar] [CrossRef] [PubMed] [Green Version]
- Cheng, C.C.J.; Yang, C.L.; Sheu, C. The link between eco-innovation and business performance: A Taiwanese industry context. J. Clean. Prod. 2014, 64, 81–90. [Google Scholar] [CrossRef] [Green Version]
- Hsiao, C.-H.; Wang, F.-J. Proactive personality and job performance of athletic coaches: Organizational citizenship behavior as mediator. Palgrave Commun. 2020, 6, 1–8. [Google Scholar] [CrossRef] [Green Version]
- Carballo-Penela, A.; Castromán-Diz, J.L. Environmental Policies for Sustainable Development: An Analysis of the Drivers of Proactive Environmental Strategies in the Service Sector. Bus. Strateg. Environ. 2015, 24, 802–818. [Google Scholar] [CrossRef]
- Deutz, P.; Ioppolo, G. From Theory to Practice: Enhancing the Potential Policy Impact of Industrial Ecology. Sustainability 2015, 7, 2259–2273. [Google Scholar] [CrossRef] [Green Version]
- Bansal, P.; Roth, K. Why companies go green: A model of ecological responsiveness. Acad. Manag. J. 2000, 43, 717–736. [Google Scholar] [CrossRef]
- Ogueke, N.V.; Emekwuru, N. Regulation of Nanorefrigerant Use: A Proactive Measure Against Possible Undesirable Health and Environmental Implications. Eur. J. Sustain. Dev. Res. 2017, 1, 1–13. [Google Scholar] [CrossRef]
- Hart, S.L.; Dowell, G. Invited editorial: A natural-resource-based view of the firm fifteen years after. J. Manag. 2011, 37, 1464–1479. [Google Scholar] [CrossRef]
- Hart, S.L. Natural-resource-based view of the firm. Acad. Manag. Rev. 1995, 20, 986–1014. [Google Scholar] [CrossRef] [Green Version]
- Oltra, V. Environmental Innovation and Industrial Dynamics: The Contributions of Evolutionary Economics. Working Papers of GREThA, (28). 2008. Available online: http://ideas.repec.org/p/grt/wpegrt/2008–28.html (accessed on 10 October 2020).
- Rennings, K. Redefining innovation—Eco-innovation research and the contribution from ecological economics. Ecol. Econ. 2000, 32, 319–332. [Google Scholar] [CrossRef]
- Rehfeld, K.M.; Rennings, K.; Ziegler, A. Integrated product policy and environmental product innovations: An empirical analysis. Ecol. Econ. 2007, 61, 91–100. [Google Scholar] [CrossRef] [Green Version]
- Horbach, J. Determinants of environmental innovation—New evidence from German panel data sources. Res. Policy 2008, 37, 163–173. [Google Scholar] [CrossRef] [Green Version]
- Triguero, A.; Moreno-Mondéjar, L.; Davia, M.A. Drivers of different types of eco-innovation in European SMEs. Ecol. Econ. 2013, 92, 25–33. [Google Scholar] [CrossRef]
- Weng, H.H.R.; Chen, J.S.; Chen, P.C. Effects of Green Innovation on Environmental and Corporate Performance: A Stakeholder Perspective. Sustainability 2015, 7, 4997–5026. [Google Scholar] [CrossRef] [Green Version]
- Li, Y. Environmental innovation practices and performance: Moderating effect of resource commitment. J. Clean. Prod. 2014, 66, 450–458. [Google Scholar] [CrossRef]
- De Marchi, V. Environmental innovation and RandD cooperation: Empirical evidence from Spanish manufacturing firms. Res. Policy 2012, 41, 614–623. [Google Scholar] [CrossRef]
- Chen, Y.S. The driver of green innovation and green image—Green core competence. J. Bus. Ethics 2008, 81, 531–543. [Google Scholar] [CrossRef]
- Del Río, P.; Peñasco, C.; Romero-Jordán, R. What drives eco-innovators? A critical review of the empirical literature based on econometric methods. J. Clean. Prod. 2016, 112, 2158–2170. [Google Scholar] [CrossRef]
- Sturiale, L.; Scuderi, A.; Timpanaro, G.; Matarazzo, B. Sustainable Use and Conservation of the Environmental Resources of the Etna Park (UNESCO Heritage): Evaluation Model Supporting Sustainable Local Development Strategies. Sustainability 2020, 12, 1453. [Google Scholar] [CrossRef] [Green Version]
- Yarahmadi, M.; Higgins, P.G. Motivations towards environmental innovation: A conceptual framework for multiparty cooperation. Eur. J. Innov. Manag. 2012, 15, 400–420. [Google Scholar] [CrossRef]
- Deng, W. Sustainable development: Impacts of consumers’ risk aversion on remanufacturing model selection and environmental performance. Sustain. Dev. 2020, 28, 1564–1574. [Google Scholar] [CrossRef]
- Menguc, B.; Ozanne, L.K. Challenges of the “green imperative”: A natural resource-based approach to the environmental orientation-business performance relationship. J. Bus. Res. 2005, 58, 430–438. [Google Scholar] [CrossRef]
- Clarkson, P.; Li, Y.; Richardson, G.; Vasvari, F. Does it really pay to be green? Determinants and consequences of proactive environmental strategies. J. Account. Public Policy 2011, 30, 122–144. [Google Scholar] [CrossRef]
- Ghisetti, C.; Rennings, K. Environmental innovations and profitability: How does it pay to be green? An empirical analysis on the German innovation survey. J. Clean. Prod. 2014, 75, 106–117. [Google Scholar] [CrossRef] [Green Version]
- Roome, N. Developing environmental management systems. Bus. Strategy Environ. 1992, 1, 11–24. [Google Scholar] [CrossRef]
- Chi, C.G.; Gursoy, D. Employee satisfaction, customer satisfaction, and financial performance: An empirical examination. Int. J. Hosp. Manag. 2009, 28, 245–253. [Google Scholar] [CrossRef]
- Fussler, C.; James, P. Driving Eco-Innovation: A Breakthrough Discipline for Innovation and Sustainability; Pitman Publishing: London, UK, 1996. [Google Scholar]
- Ciasullo, M.V.; Manna, R.; Cavallone, M.; Palumbo, R. Envisioning the future of health systems: Exploratory insights from European countries. Futures 2020, 121, 102585. [Google Scholar] [CrossRef]
- Kemp, R.; Pearson, P. Final Report MEI Project about Measuring Eco-Innovation, Maastricht. 2008. Available online: http://www.oecd.org/env/consumption-innovation/43960830.pdf (accessed on 5 October 2020).
- European Commission. Communication from the Commission to the European Parliament, the Council, the European Economic and Social Committee and the Committee of the Regions. Innovation for a Sustainable Future—The Eco-Innovation Action Plan (Eco-AP). 2011. Available online: http://eur-lex.europa.eu/legal-content/EN/TXT/?uri=CELEX%3A52011DC0899 (accessed on 25 September 2020).
- Wagner, M. How to reconcile environmental and economic performance to improve corporate sustainability: Corporate environmental strategies in the European paper industry. J. Environ. Manag. 2005, 76, 105–118. [Google Scholar] [CrossRef] [Green Version]
- OECD. Sustainable Manufacturing and Eco-Innovation. Framework, Practices and Measurement. 2009. Available online: http://www.oecd.org/innovation/inno/43423689.pdf (accessed on 20 October 2020).
- Ioppolo, G.; Cucurachi, S.; Salomone, R.; Saija, G.; Ciraolo, L. Industrial ecology and environmental lean management: Lights and shadows. Sustainability 2014, 6, 6362–6376. [Google Scholar] [CrossRef] [Green Version]
- Ziegler, A.; Nogareda, J.S. Environmental management systems and technological environmental innovations: Exploring the causal relationship. Res. Policy 2009, 38, 885–893. [Google Scholar] [CrossRef] [Green Version]
- Watson, K.; Klingenberg, B.; Polito, T.; Geurts, T. Impact of environmental management system implementation on financial performance. Manag. Environ. Qual. 2004, 15, 622–628. [Google Scholar] [CrossRef] [Green Version]
- Liu, X.; Liu, B.; Shishime, T.; Yu, Q.; Bi, J.; Fujitsuka, T. An empirical study on the driving mechanism of proactive corporate environmental management in China. J. Environ. Manag. 2010, 91, 1707–1717. [Google Scholar] [CrossRef] [PubMed]
- Li, Y.; Wang, L.; Liu, Y. Organisational learning, product quality and performance: The moderating effect of social ties in Chinese cross-border outsourcing. Int. J. Prod. Res. 2011, 49, 159–182. [Google Scholar] [CrossRef]
- Salvadó, J.A.; de Castro, G.M.; López, J.E.N.; Verde, M.D. Environmental Innovation and Firm Performance. A Natural Resource-Based View; Palgrave Macmillan: Basingstoke, UK, 2012. [Google Scholar]
- Wang, Z.; Wang, N. Knowledge sharing, innovation and firm performance. Expert Syst. Appl. 2012, 39, 8899–8908. [Google Scholar] [CrossRef]
- Emory, C.W.; Cooper, D.R. Business Research Methods, 4th ed.; Richard D Irwin: Homewood, IL, USA, 1991. [Google Scholar]
- Byrne, B.M. Structural Equation Modeling with AMOS, Basic Concepts, Application and Programming, 2nd ed.; La Erlbaum Associates: Trenton, NJ, USA, 2009. [Google Scholar]
- Huang, J.H.; Lee, B.C.Y.; Ho, S.H. Consumer attitude toward grey market goods. Int. Mark. Rev. 2004, 21, 598–614. [Google Scholar] [CrossRef] [Green Version]
- Hair, J.F.; Hult, G.T.M.; Ringle, C.M.; Sarstedt, M. A Primer on Partial Least Squares Structural Equation Modeling; Sage: Thousand Oaks, CA, USA, 2017. [Google Scholar] [CrossRef]
- Fornell, C.; Larcker, D.F. Evaluating structural equation models with unobservable variables and measurement error. J. Mark. Res. 1981, 18, 39–50. [Google Scholar] [CrossRef]
- Ahmed, R.R.; Qureshi, J.A.; Štreimikienė, D.; Soomro, R.H.; Vveinhardt, J. Guerrilla marketing trends for sustainable solutions: Evidence from SEM-based multivariate and conditional process approaches. J. Bus. Econ. Manag. 2020, 21, 851–871. [Google Scholar] [CrossRef]
- Kaiser, H.F. An index of factorial simplicity. Psychometrika 1974, 39, 31–36. [Google Scholar] [CrossRef]
- Hayes, A.F.; Rockwood, N.J. Conditional process analysis: Concepts, computation, and advances in modeling of the contingencies of mechanisms. Am. Behav. Sci. 2020, 64, 19–54. [Google Scholar] [CrossRef] [Green Version]
- Sobel, M.E. Some New Results on Indirect Effects and Their Standard Errors in Covariance Structure Models. In Sociological Methodology; Leinhart, S., Ed.; Jossey-Bass: San Francisco, CA, USA, 1986; pp. 159–186. [Google Scholar] [CrossRef]


| Demographics | Frequency | Percent | |
|---|---|---|---|
| Gender | Male | 468 | 54.7% |
| Female | 388 | 45.3% | |
| Marital Status | Single | 505 | 59.0% |
| Married | 323 | 37.3% | |
| Divorced | 28 | 3.3% | |
| Age (In Years) | 20–30 | 297 | 34.7% |
| 30–40 | 180 | 21.0% | |
| 40–50 | 112 | 13.1% | |
| 50–60 | 144 | 16.8% | |
| More than 60 | 123 | 14.4% | |
| Education | Graduation | 379 | 44.3% |
| Post-Graduation (Local) | 278 | 32.4% | |
| Post-Graduation (Foreign) | 130 | 15.2% | |
| Ph.D. degree | 69 | 8.1% | |
| Experience (In Years) | 1–5 | 225 | 26.3% |
| 5–10 | 252 | 29.4% | |
| 10–15 | 107 | 12.5% | |
| 15–20 | 119 | 13.9% | |
| More than 20 | 153 | 17.9% | |
| Income (In USD 000) | 2–5 | 151 | 17.6% |
| 6–9 | 369 | 43.2% | |
| 10–13 | 175 | 20.4% | |
| 14–17 | 103 | 12.0% | |
| More than 18 | 58 | 6.8% | |
| Total–N | 856 | ||
| Factors | N | Mean | Std. Deviation | Skewness | Kurtosis | ||
|---|---|---|---|---|---|---|---|
| Statistic | Statistic | Statistic | Statistic | Std. Error | Statistic | Std. Error | |
| Operational Performance | 856 | 3.7570 | 1.09409 | −0.845 | 0.084 | 0.142 | 0.167 |
| Financial Performance | 856 | 3.7640 | 1.09988 | −0.797 | 0.084 | 0.070 | 0.167 |
| Proactive Environmental Strategy | 856 | 3.8879 | 1.11933 | −0.896 | 0.084 | 0.180 | 0.167 |
| Planning and Organizational Practices | 856 | 3.8575 | 1.00909 | −0.951 | 0.084 | 1.005 | 0.167 |
| Operational Practices | 856 | 3.9019 | 1.12689 | −0.902 | 0.084 | 0.153 | 0.167 |
| Communicational Practices | 856 | 3.8107 | 1.07352 | −0.886 | 0.084 | 0.384 | 0.167 |
| Eco-innovation | 856 | 3.7582 | 1.07330 | −0.776 | 0.084 | 0.208 | 0.167 |
| Technological Advances | 856 | 3.8107 | 1.07352 | −0.886 | 0.084 | 0.384 | 0.167 |
| Factors | Items | FL | CA | CR | AVE |
|---|---|---|---|---|---|
| Operational Performance | OP1 | 0.935 | 0.918 | 0.941 | 0.843 |
| OP2 | 0.885 | ||||
| OP3 | 0.935 | ||||
| Financial Performance | FP1 | 0.928 | 0.925 | 0.946 | 0.856 |
| FP2 | 0.895 | ||||
| FP3 | 0.952 | ||||
| Proactive Environmental Strategy | PES1 | 0.929 | 0.923 | 0.945 | 0.852 |
| PES2 | 0.891 | ||||
| PES3 | 0.949 | ||||
| Planning and Organizational Practices | POP1 | 0.928 | 0.928 | 0.949 | 0.862 |
| POP2 | 0.905 | ||||
| POP3 | 0.952 | ||||
| Operational Practices | OPR1 | 0.923 | 0.897 | 0.925 | 0.805 |
| OPR2 | 0.897 | ||||
| OPR3 | 0.872 | ||||
| Communicational Practices | CP1 | 0.929 | |||
| CP2 | 0.899 | 0.926 | 0.947 | 0.857 | |
| CP3 | 0.949 | ||||
| Eco-innovation | EIN1 | 0.916 | |||
| EIN2 | 0.887 | 0.887 | 0.917 | 0.787 | |
| EIN3 | 0.859 | ||||
| Technological Advances | TEA1 | 0.933 | 0.923 | 0.945 | 0.851 |
| TEA2 | 0.914 | ||||
| TEA3 | 0.921 |
| Component | Initial Eigenvalues | Extraction Sums of Squared Loadings | Rotation Sums of Squared Loadings | ||||||
|---|---|---|---|---|---|---|---|---|---|
| Total | % of Variance | Cumulative % | Total | % of Variance | Cumulative % | Total | % of Variance | Cumulative % | |
| 1 | 3.195 | 13.313 | 13.313 | 3.195 | 13.313 | 13.313 | 2.621 | 10.922 | 10.922 |
| 2 | 3.048 | 12.699 | 26.013 | 3.048 | 12.699 | 26.013 | 2.612 | 10.884 | 21.806 |
| 3 | 2.727 | 11.362 | 37.375 | 2.727 | 11.362 | 37.375 | 2.600 | 10.832 | 32.638 |
| 4 | 2.574 | 10.724 | 48.098 | 2.574 | 10.724 | 48.098 | 2.586 | 10.774 | 43.413 |
| 5 | 2.526 | 10.525 | 58.623 | 2.526 | 10.525 | 58.623 | 2.571 | 10.711 | 54.124 |
| 6 | 2.245 | 9.355 | 67.978 | 2.245 | 9.355 | 67.978 | 2.559 | 10.664 | 64.788 |
| 7 | 2.234 | 9.310 | 77.288 | 2.234 | 9.310 | 77.288 | 2.465 | 10.269 | 75.057 |
| 8 | 1.861 | 7.752 | 85.041 | 1.861 | 7.752 | 85.041 | 2.396 | 9.984 | 85.041 |
| Bartlett’s and KMO Results | |||||||||
| Kaiser–Meyer–Olkin Measure of Sampling Adequacy. | 0.705 | ||||||||
| Bartlett’s Test of Sphericity | Approx. Chi-Square | 15,406.272 | |||||||
| Df | 276 | ||||||||
| Sig. | 0.000 | ||||||||
| The Goodness of Fit Measures | Absolute Fit Indices | Relative Fit Indices | Non-Centrality-Based Indices | Parsimonious Fit Indices | |||||||
|---|---|---|---|---|---|---|---|---|---|---|---|
| χ2/df | Probability | GFI | NFI | IFI | TLI | CFI | RMSEA | RNI | PCFI | PNFI | |
| Measurement Model | 3.55 | 0.0312 | 0.97 | 0.93 | 0.99 | 0.97 | 0.98 | 0.025 | 0.99 | 0.82 | 0.80 |
| Structural Model | 3.37 | 0.0301 | 0.98 | 0.92 | 0.98 | 0.96 | 0.97 | 0.028 | 0.96 | 0.81 | 0.79 |
| Criterion (Threshold values) | <5.0 | <0.05 | >0.95 | >0.90 | >0.95 | >0.95 | >0.95 | <0.05 | >0.95 | >0.75 | >0.75 |
| Hypotheses | Independent Variables | Regression Paths | Standardized Regression Weights (β) | SE | T | P | Decision |
|---|---|---|---|---|---|---|---|
| H1A | Proactive Environmental Strategy | PES † → OP | 0.7020 | 0.0199 | 35.19 | 0.0000 | Supported |
| H1B | Planning and Organizational Practices | POP † → OP | 0.4935 | 0.0468 | 13.41 | 0.0000 | Supported |
| H2 | Operational Practices | OPR † → OP | 0.5662 | 0.0345 | 16.41 | 0.0000 | Supported |
| H3 | Communicational Practices | CP † → OP | 0.6018 | 0.0322 | 18.71 | 0.0000 | Supported |
| H4 | Proactive Environmental Strategy | PES † → FP | 0.1864 | 0.0238 | 7.84 | 0.0000 | Supported |
| H5 | Planning and Organizational Practices | POP † → FP | 0.5388 | 0.0260 | 20.70 | 0.0000 | Supported |
| H6 | Operational Practices | OPR † → FP | 0.3900 | 0.0282 | 13.84 | 0.0000 | Supported |
| H7 | Communicational Practices | CP † → FP | 0.4801 | 0.0252 | 19.04 | 0.0000 | Supported |
| H8 | Operational Performance | OP † → FP | 0.4223 | 0.0459 | 9.19 | 0.0000 | Supported |
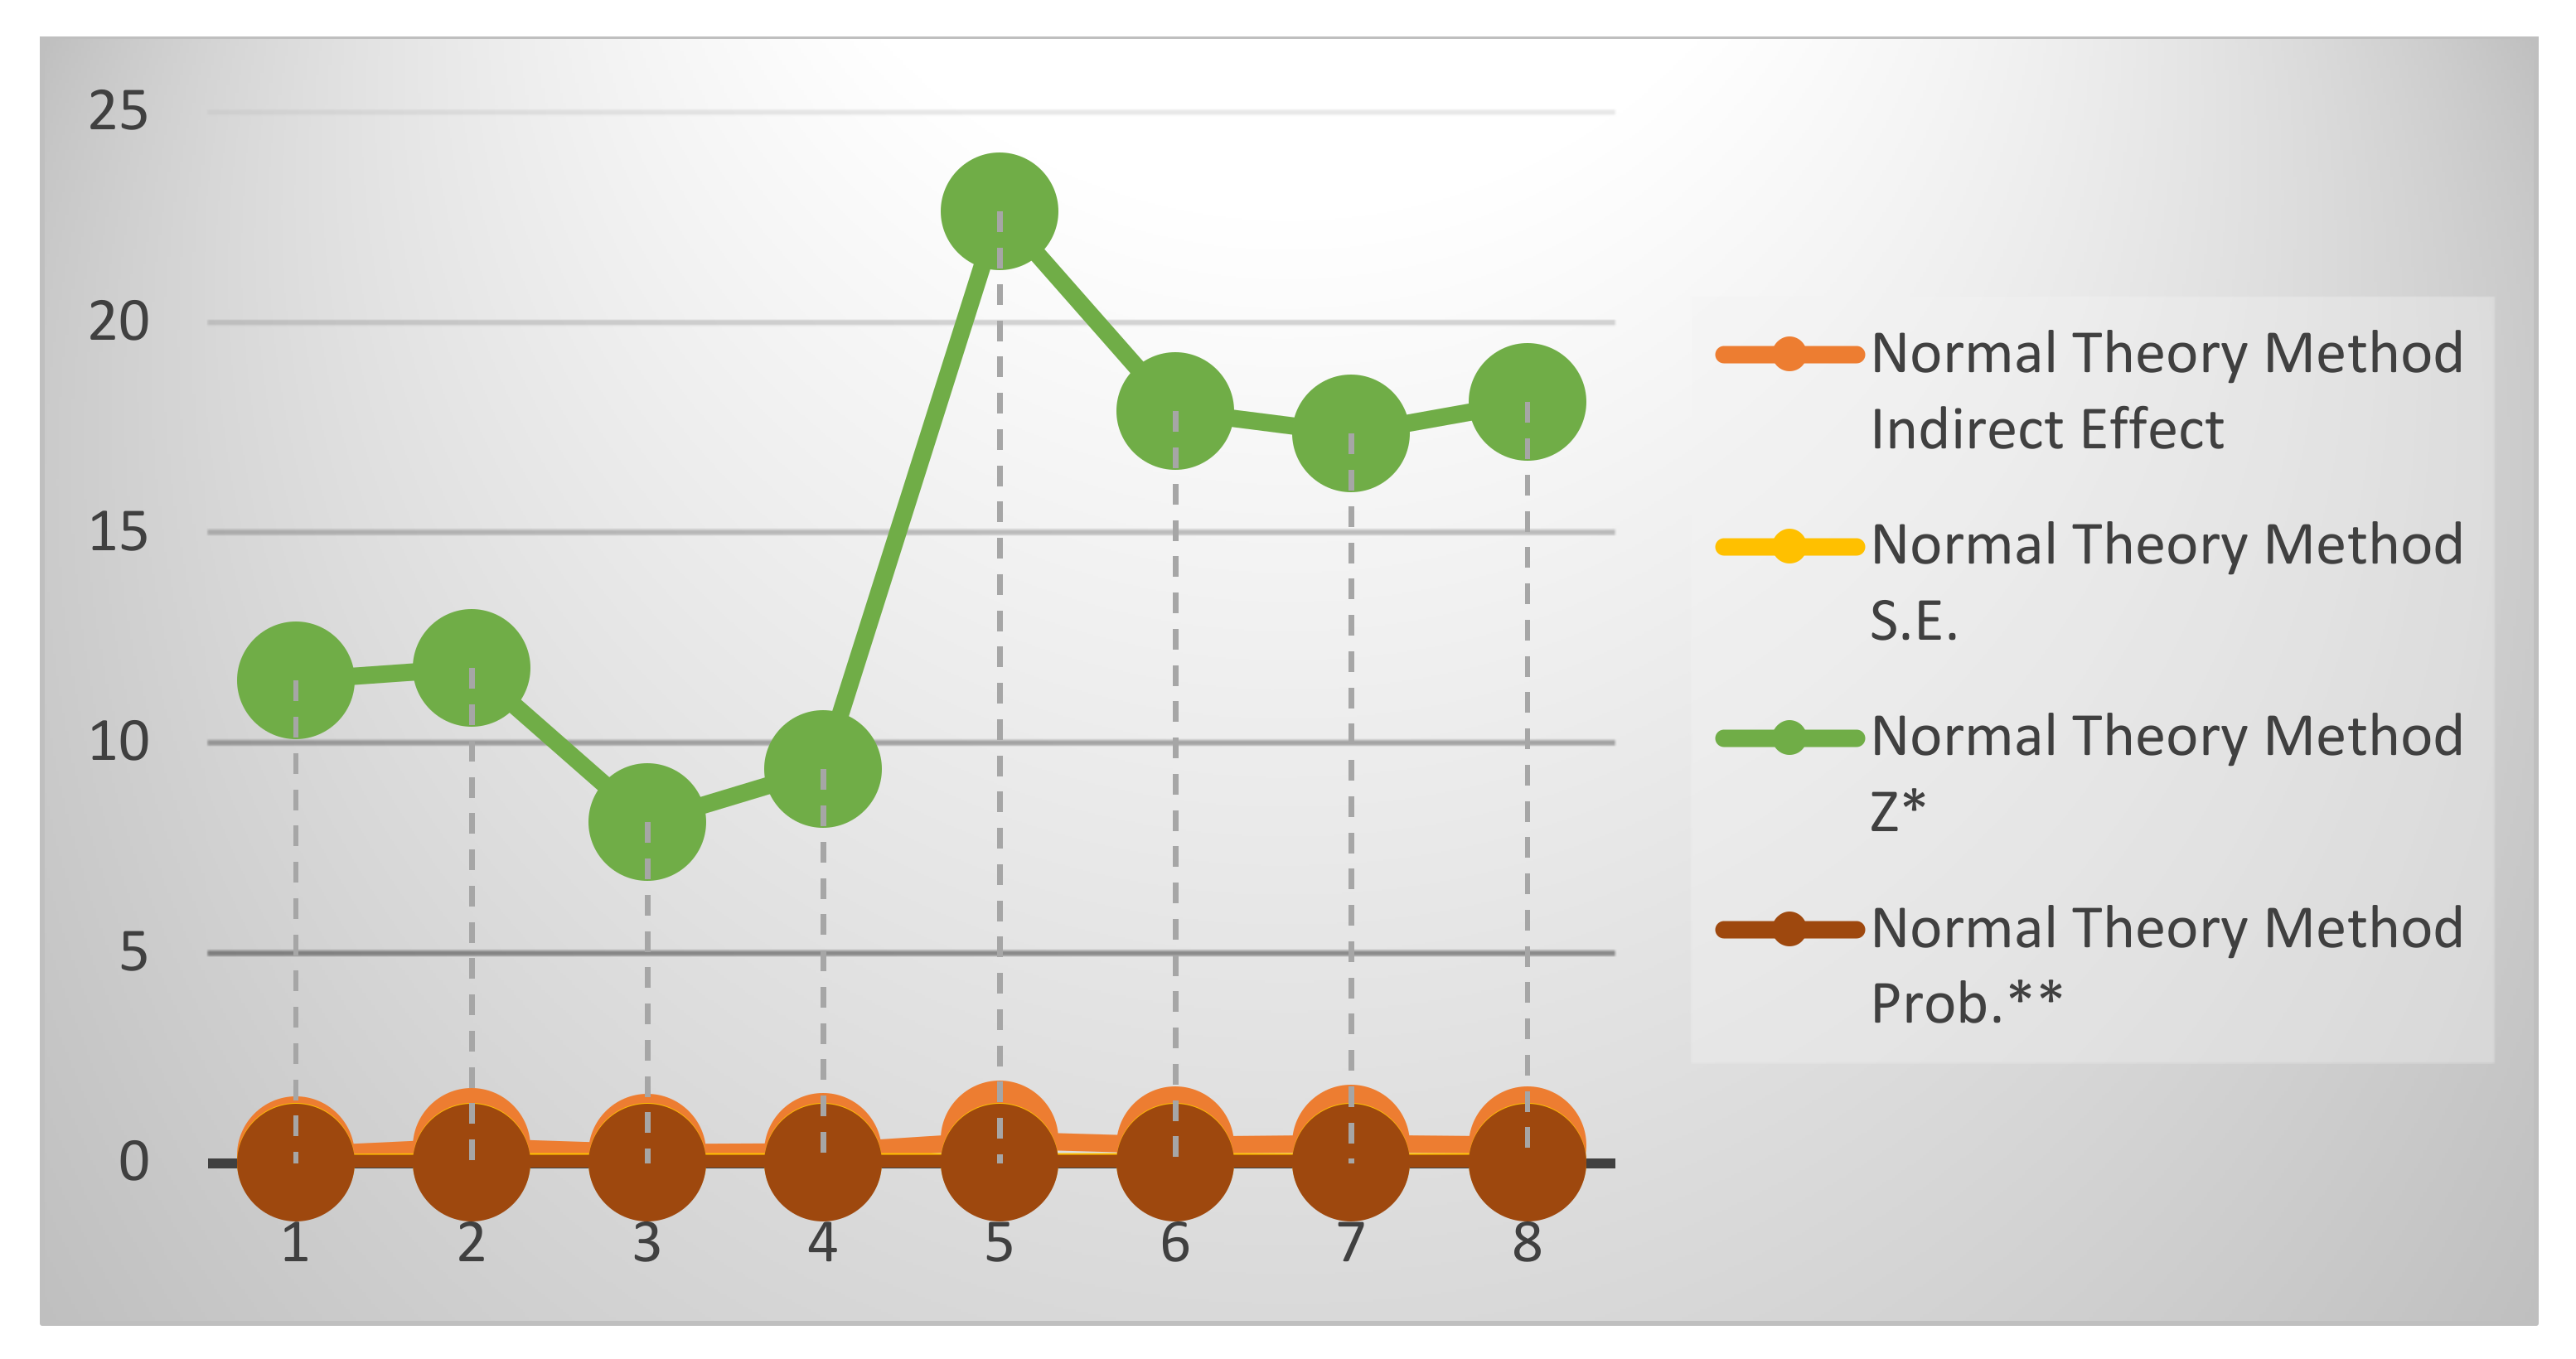
| Hypotheses | Mediation | Bootstrapping Method | Normal Theory Method | Decisions | ||||||
|---|---|---|---|---|---|---|---|---|---|---|
| Indirect Effect | Boot SE | Boot LLCI | Boot ULCI | Indirect Effect | S.E. | Z * | Prob. ** | |||
| H9A: | PES→EIN→OP | 0.1845 | 0.0148 | 0.1556 | 0.2135 | 0.1845 | 0.0161 | 11.47 | 0.0000 | Supported |
| H9B: | POP→EIN→OP | 0.3741 | 0.0250 | 0.3262 | 0.4241 | 0.3741 | 0.0317 | 11.78 | 0.0000 | Supported |
| H9C: | OPR→EIN→OP | 0.2439 | 0.0207 | 0.2050 | 0.2861 | 0.2439 | 0.0301 | 8.11 | 0.0000 | Supported |
| H9D: | CP→EIN→OP | 0.2565 | 0.0219 | 0.2163 | 0.3024 | 0.2565 | 0.0274 | 9.36 | 0.0000 | Supported |
| H10A: | PES→EIN→FP | 0.5477 | 0.0235 | 0.5030 | 0.5947 | 0.5477 | 0.0242 | 22.64 | 0.0000 | Supported |
| H10B: | POP→EIN→FP | 0.4240 | 0.0277 | 0.3718 | 0.4813 | 0.4240 | 0.0237 | 17.88 | 0.0000 | Supported |
| H10C: | OPR→EIN→FP | 0.4492 | 0.0256 | 0.4028 | 0.5022 | 0.4492 | 0.0259 | 17.35 | 0.0000 | Supported |
| H10D: | CP→EIN→FP | 0.4168 | 0.0254 | 0.3667 | 0.4673 | 0.4168 | 0.0230 | 18.10 | 0.0000 | Supported |
| Hypotheses | Moderator | Moderation | Coefficient | SE | T | p * | LLCI | ULCI |
|---|---|---|---|---|---|---|---|---|
| Moderating Effect of TEA b/w PES and Firm’s operational performance (OP) | ||||||||
| H11A: | TEA | PES × TEA | −0.0603 | 0.0126 | −4.80 | 0.0000 | −0.0849 | −0.0357 |
| Moderating Effect of TEC b/w POP and Firm’s operational performance (OP) | ||||||||
| H11B: | TEA | POP × TEA | −0.1433 | 0.0148 | −9.66 | 0.0000 | −0.1724 | −0.1142 |
| Moderating Effect of TEA b/w OPR and Firm’s operational performance (OP) | ||||||||
| H11C: | TEA | OPR × TEA | −0.1471 | 0.0142 | −10.36 | 0.0000 | −0.1750 | −0.1193 |
| Moderating Effect of TEA b/w CP and Firm’s operational performance (OP) | ||||||||
| H11D: | TEA | CP × TEA | −0.1774 | 0.0134 | −13.20 | 0.0000 | −0.2038 | −0.1511 |
| Moderating Effect of TEA b/w PES and Firm’s financial performance (FP) | ||||||||
| H12A: | TEA | PEP × TEA | −0.1124 | 0.0133 | −8.45 | 0.0000 | −0.1386 | −0.0863 |
| Moderating Effect of TEA b/w POP and Firm’s financial performance (FP) | ||||||||
| H12B: | TEA | POP × TEA | −0.0289 | 0.0108 | −2.67 | 0.0076 | −0.0500 | −0.0077 |
| Moderating Effect of TEA b/w OPR and Firm’s financial performance (FP) | ||||||||
| H12C: | TEA | OPR × TEA | −0.0525 | 0.0116 | −4.51 | 0.0000 | −0.0753 | −0.0297 |
| Moderating Effect of TEA b/w CP and Firm’s financial performance (FP) | ||||||||
| H12D: | TEA | CP × TEC | −0.0535 | 0.0115 | −4.67 | 0.0000 | −0.0760 | −0.0311 |
Publisher’s Note: MDPI stays neutral with regard to jurisdictional claims in published maps and institutional affiliations. |
© 2021 by the authors. Licensee MDPI, Basel, Switzerland. This article is an open access article distributed under the terms and conditions of the Creative Commons Attribution (CC BY) license (https://creativecommons.org/licenses/by/4.0/).
Share and Cite
Ahmed, R.R.; Kyriakopoulos, G.L.; Streimikiene, D.; Streimikis, J. Drivers of Proactive Environmental Strategies: Evidence from the Pharmaceutical Industry of Asian Economies. Sustainability 2021, 13, 9479. https://0-doi-org.brum.beds.ac.uk/10.3390/su13169479
Ahmed RR, Kyriakopoulos GL, Streimikiene D, Streimikis J. Drivers of Proactive Environmental Strategies: Evidence from the Pharmaceutical Industry of Asian Economies. Sustainability. 2021; 13(16):9479. https://0-doi-org.brum.beds.ac.uk/10.3390/su13169479
Chicago/Turabian StyleAhmed, Rizwan Raheem, Grigorios L. Kyriakopoulos, Dalia Streimikiene, and Justas Streimikis. 2021. "Drivers of Proactive Environmental Strategies: Evidence from the Pharmaceutical Industry of Asian Economies" Sustainability 13, no. 16: 9479. https://0-doi-org.brum.beds.ac.uk/10.3390/su13169479