
Impact Resistance and Sodium Sulphate Attack Testing of Concrete Incorporating Mixed Types of Recycled Plastic Waste

 ,
,  ,
,  , ,
, ,  and
and
Abstract
:1. Introduction
2. Experimental Program
2.1. Materials
2.2. Mix Design and Specimens Preparation
2.3. Hardened Concrete Tests
2.3.1. Impact Resistance Test
2.3.2. Water Transport Properties
2.3.3. Sodium Sulphate Attack Test
3. Results and Discussion
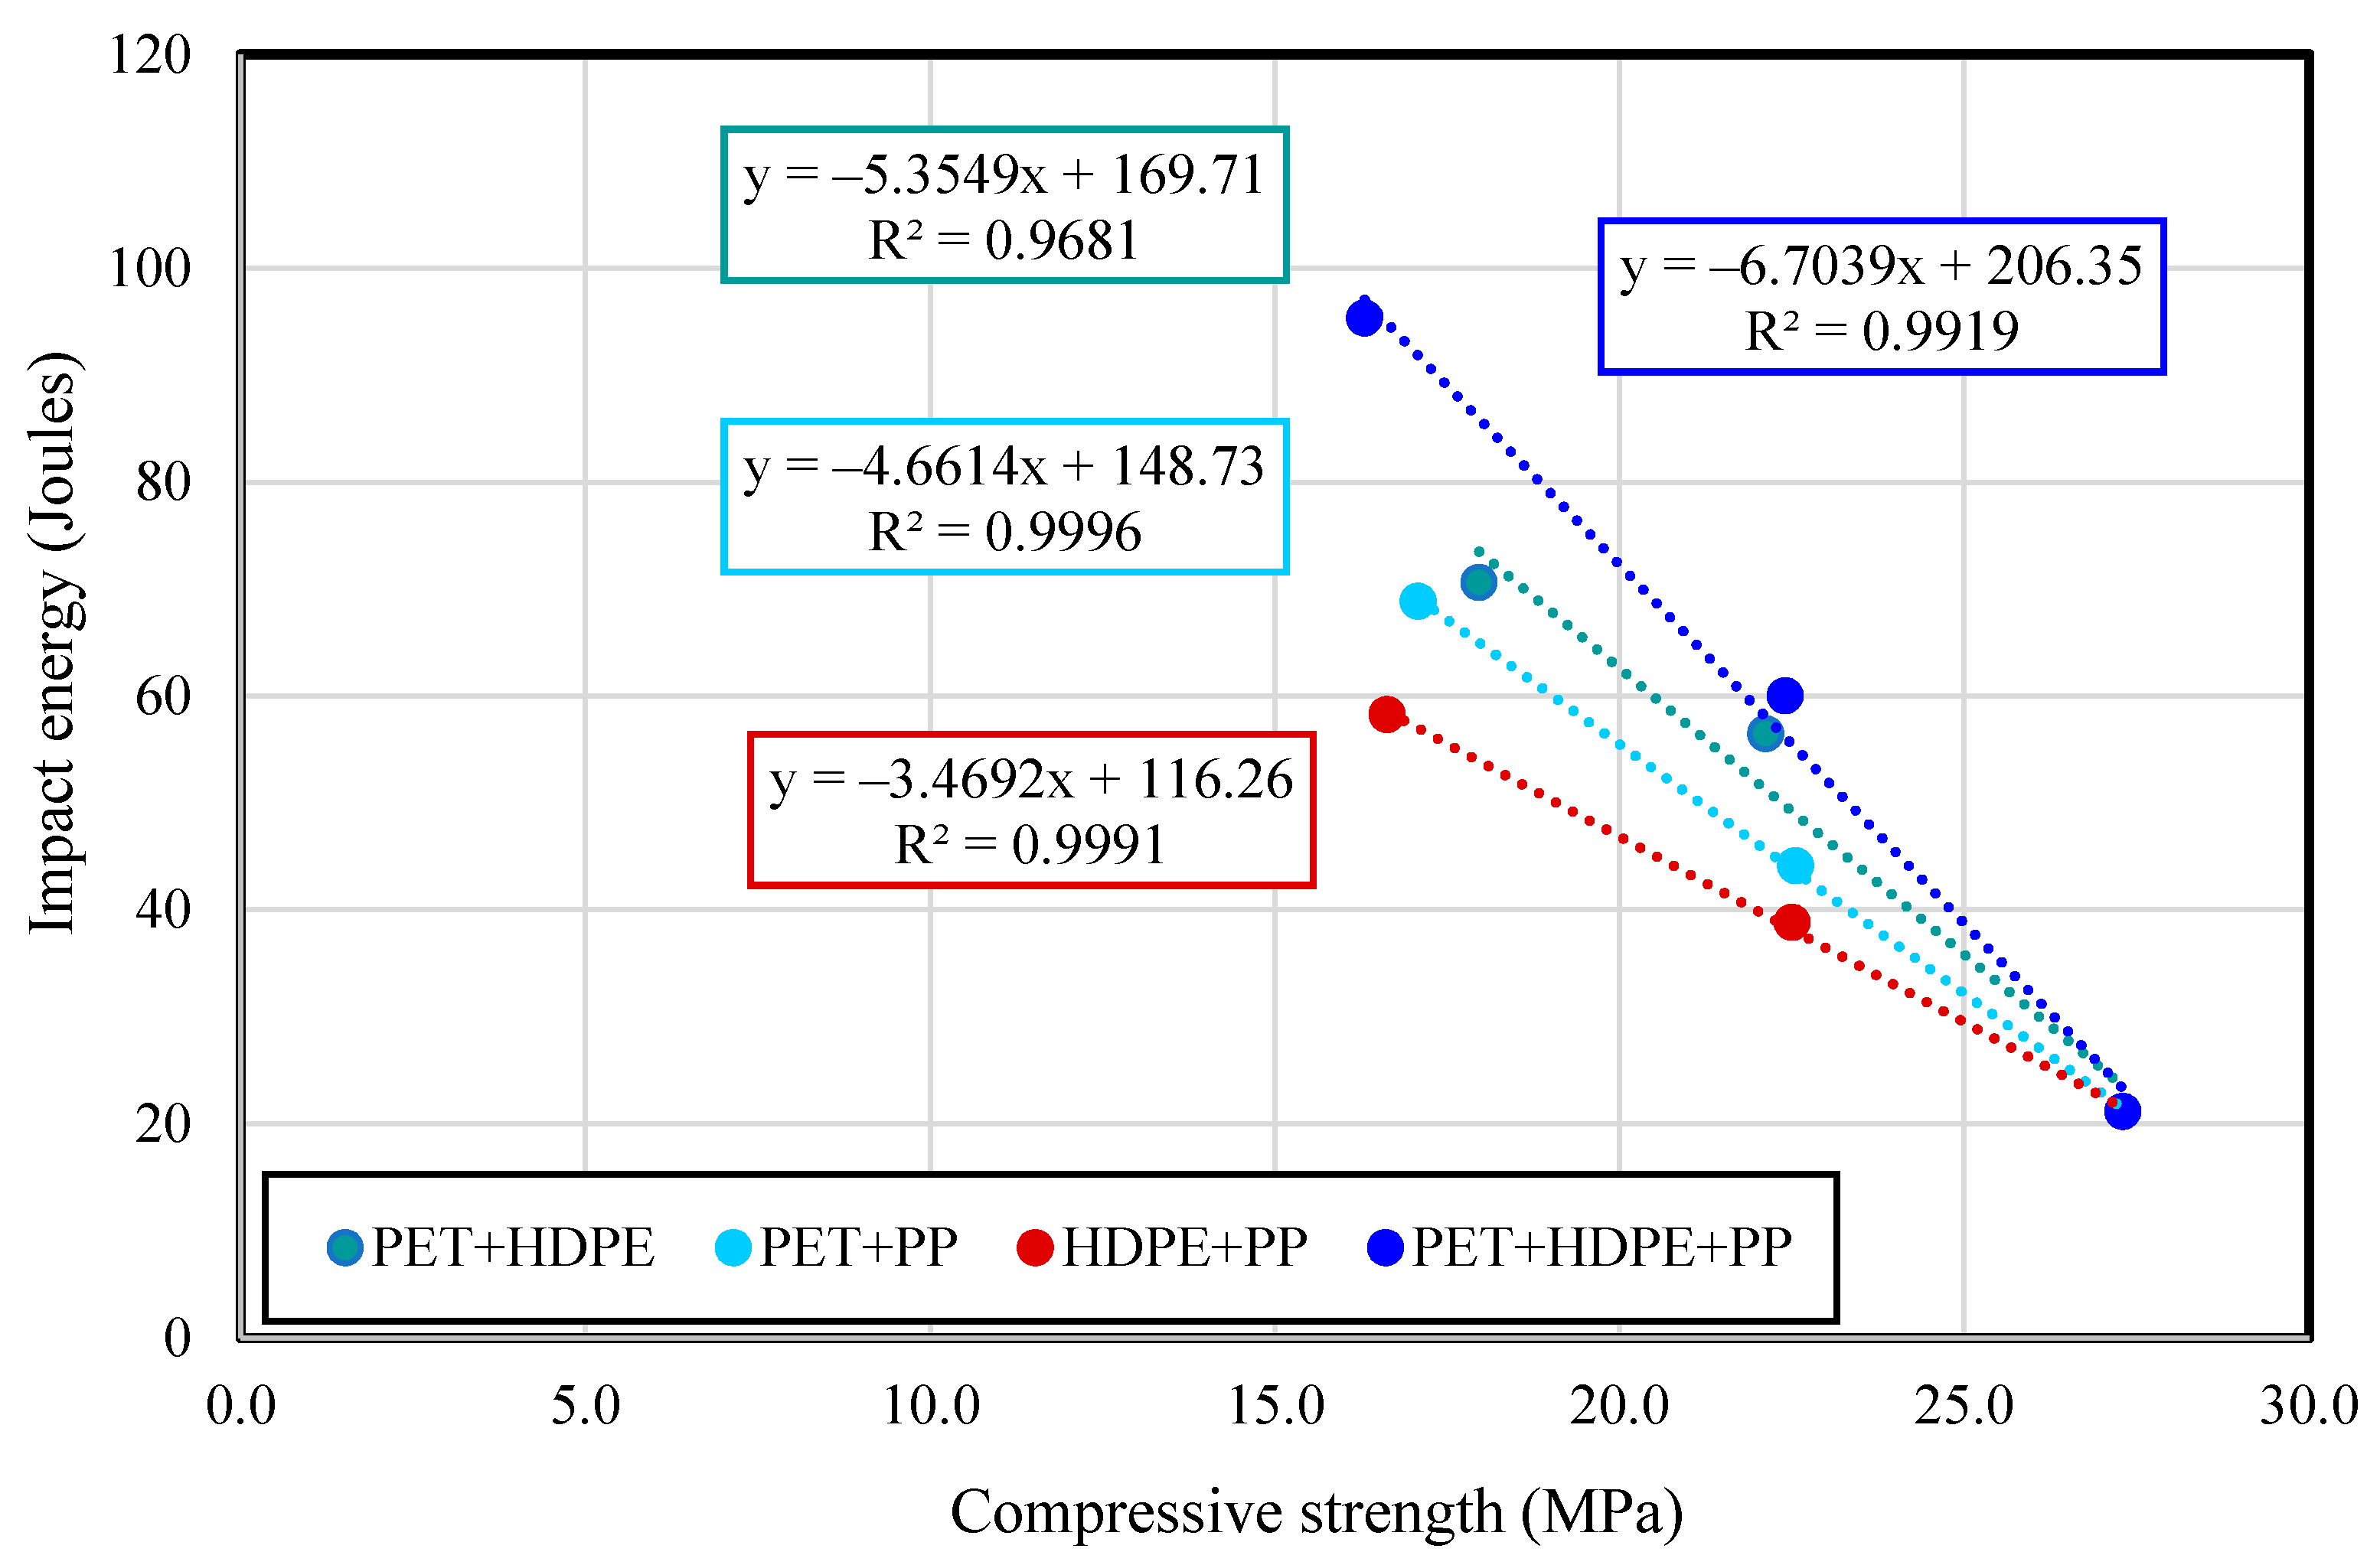
3.1. Impact Resistance
- N = Number of blows for final failure of specimen
- m = Mass of steel cylinder (4.5 kg)
- g = Gravity acceleration (9.81 m/s2)
- h = Drop distance (200 mm).
3.2. Water Transport Properties
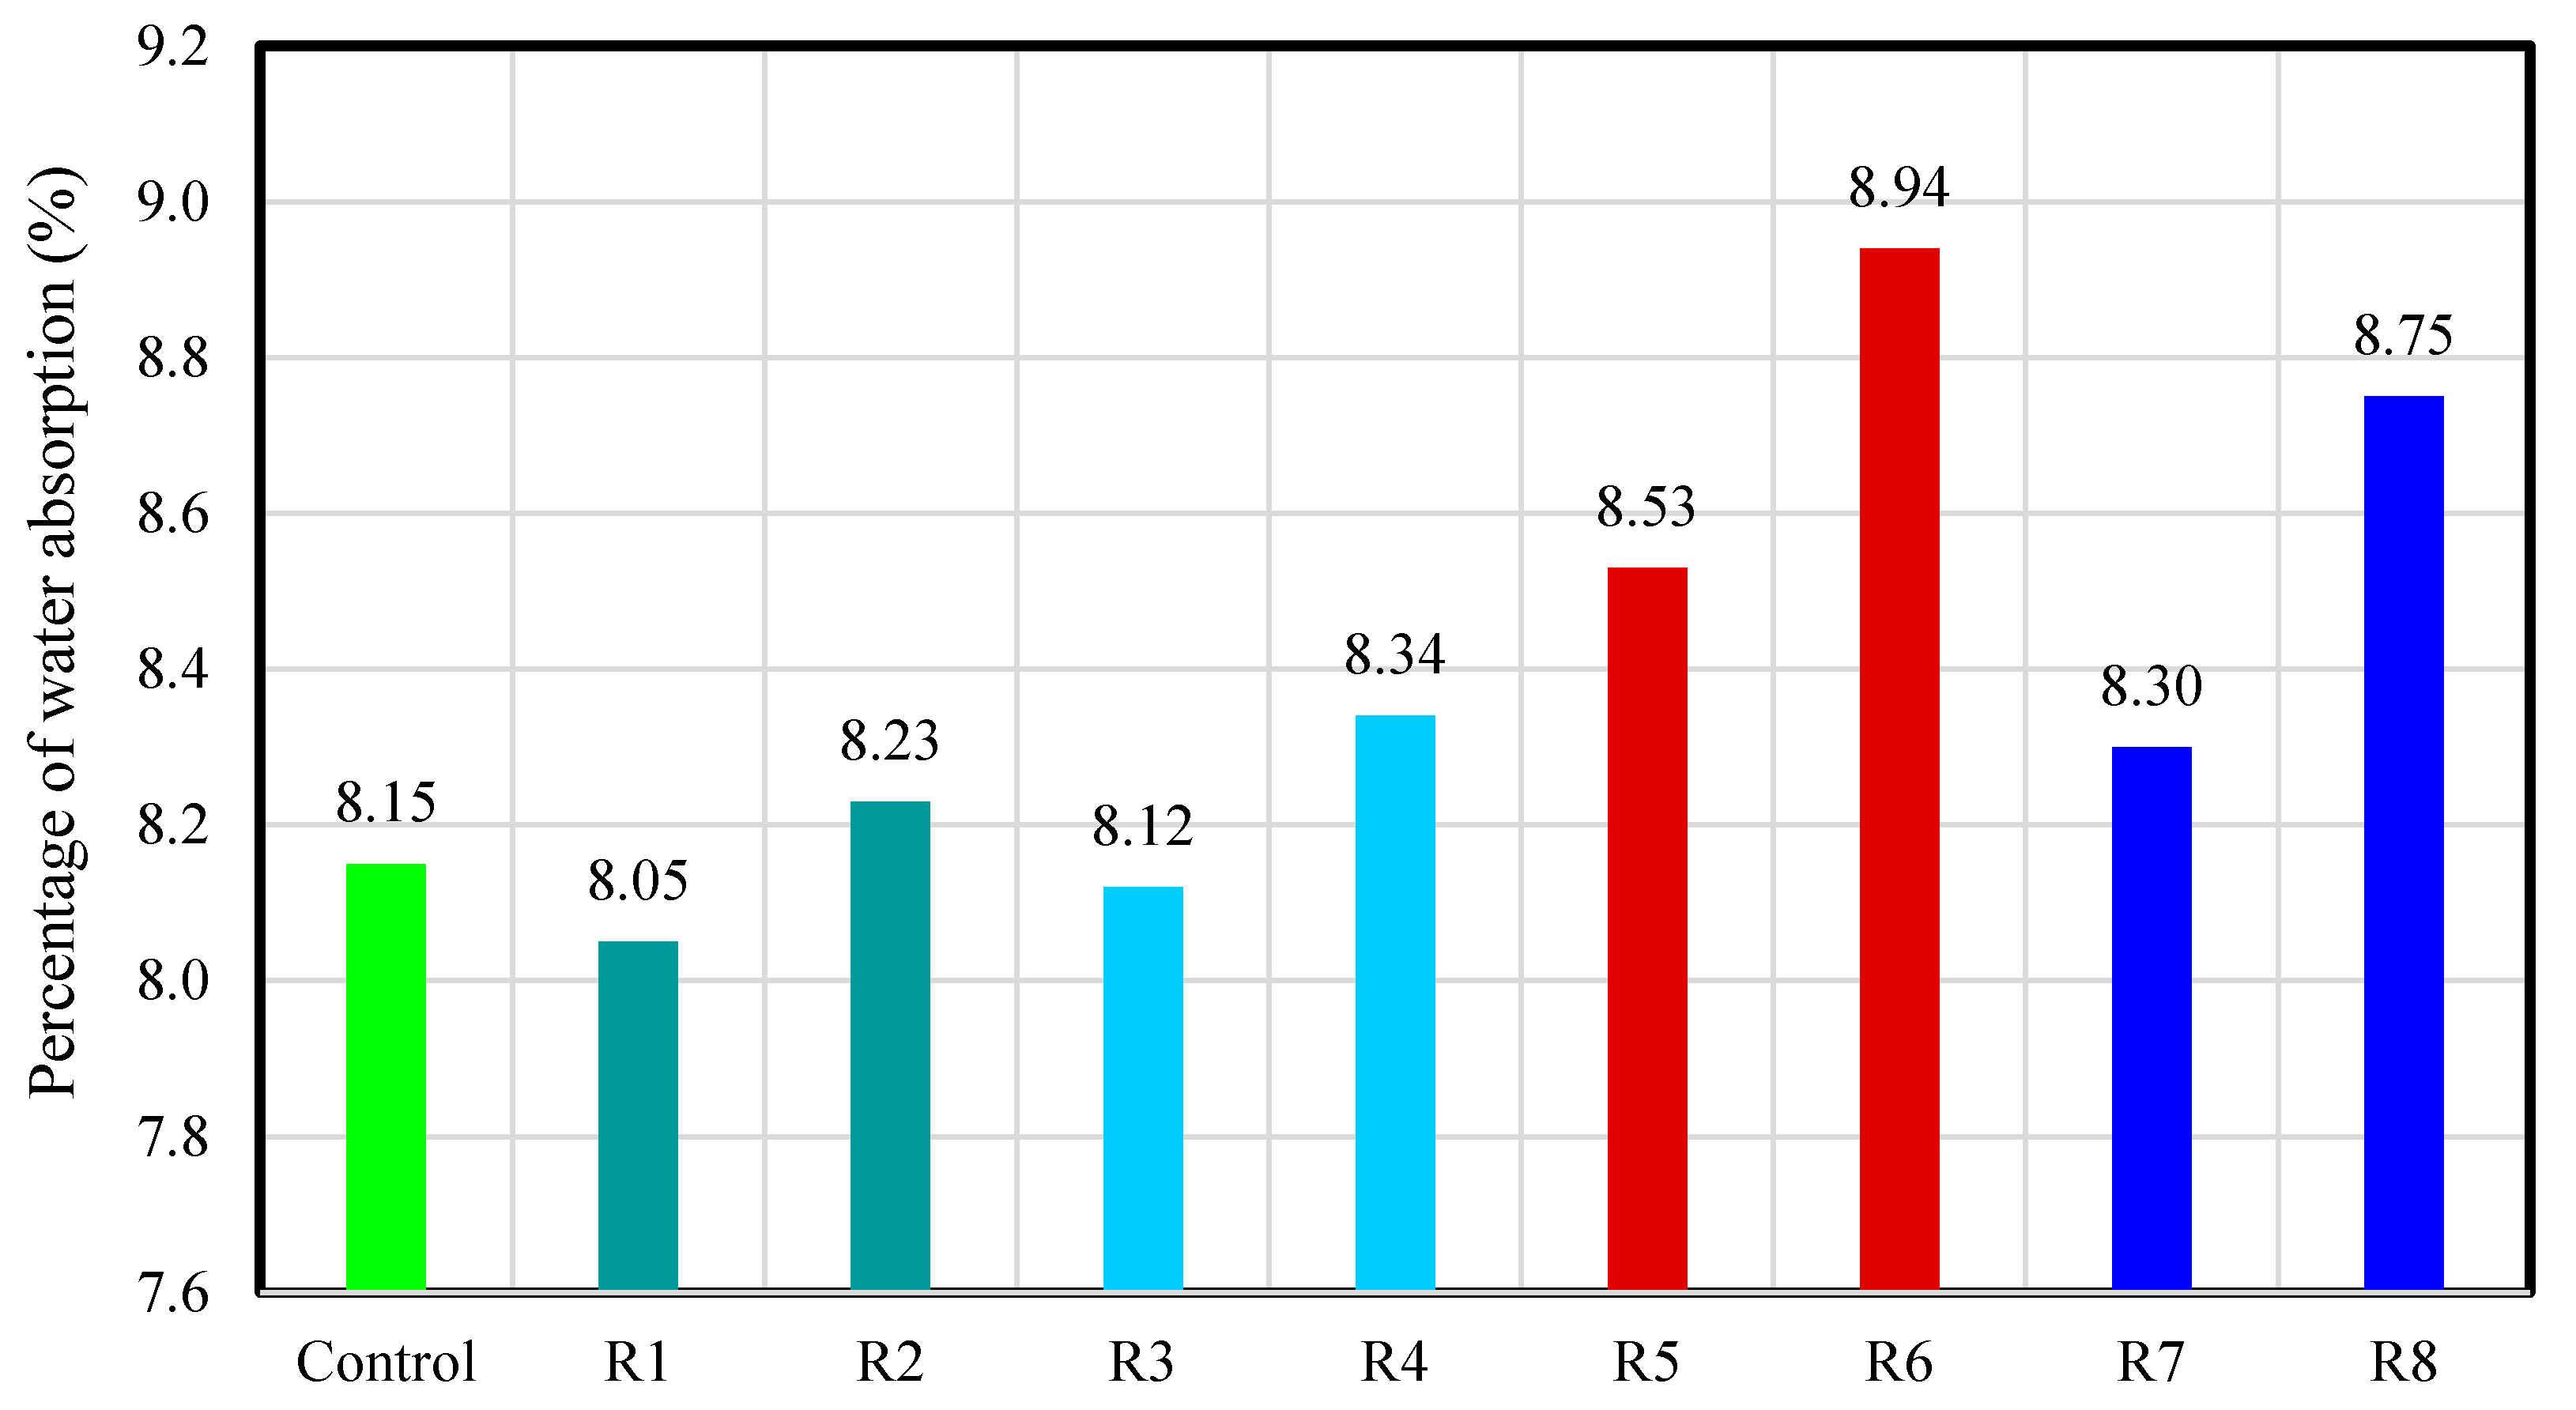
3.2.1. Water Absorption
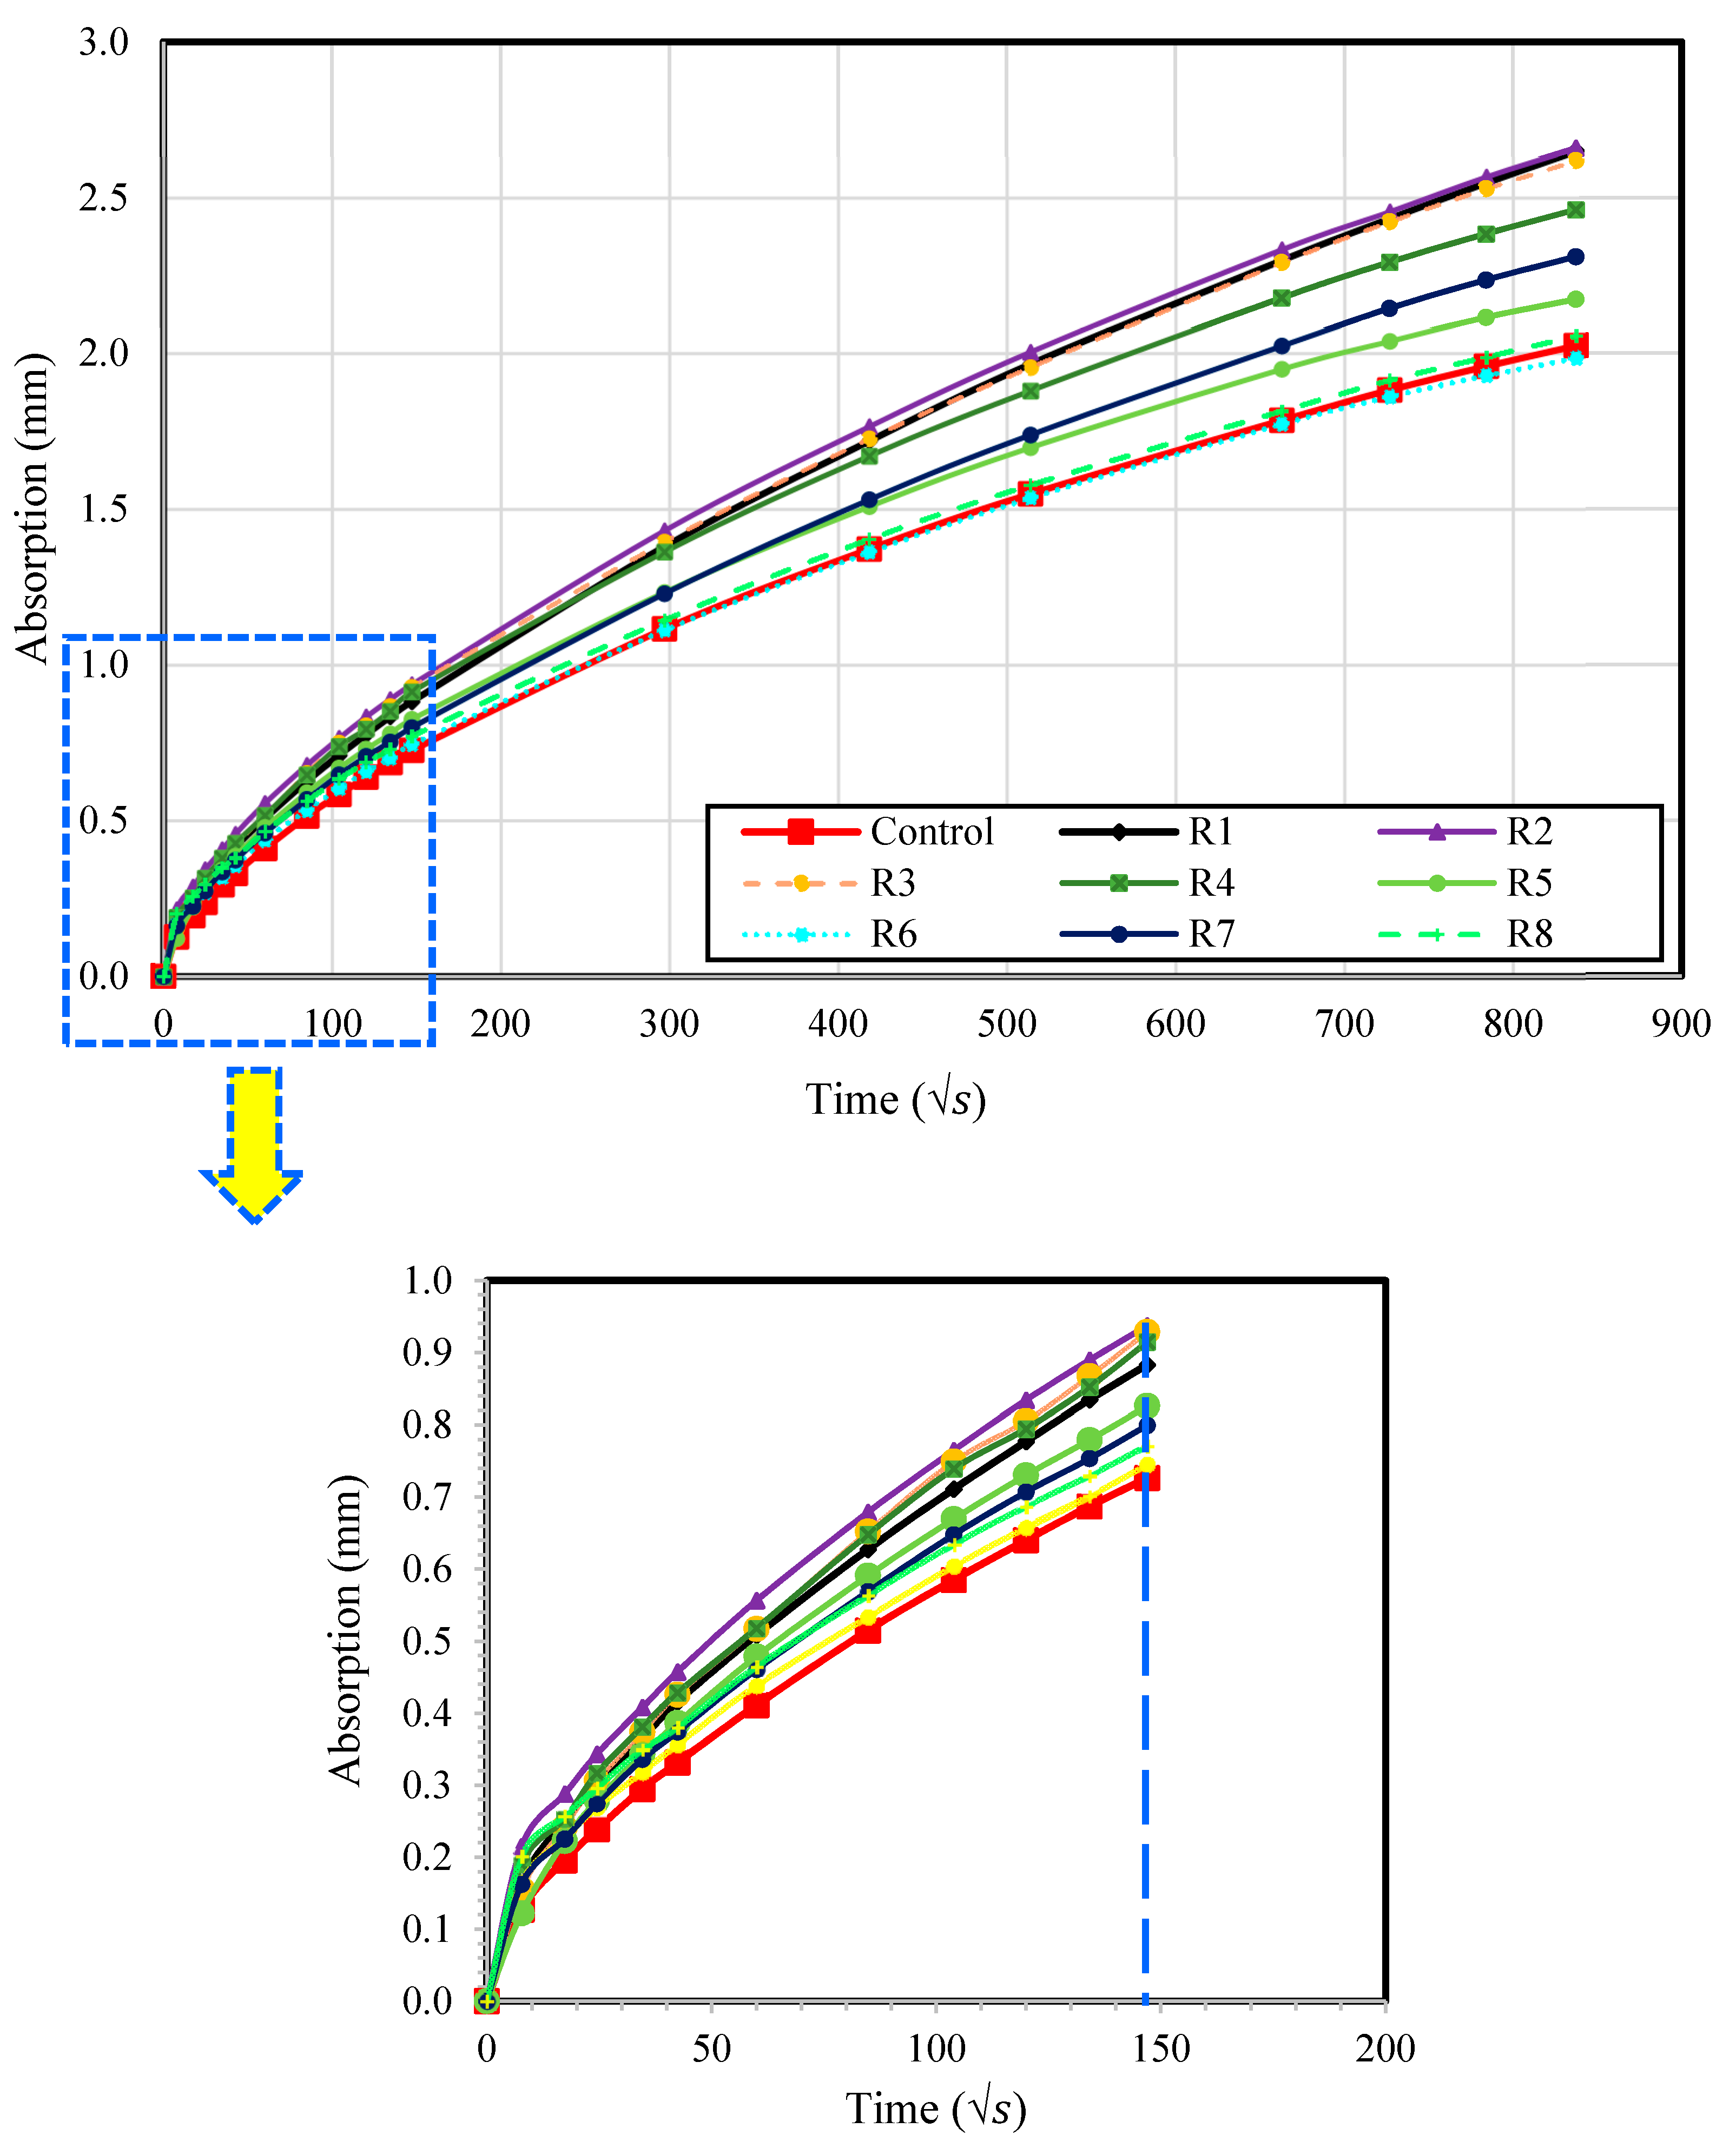
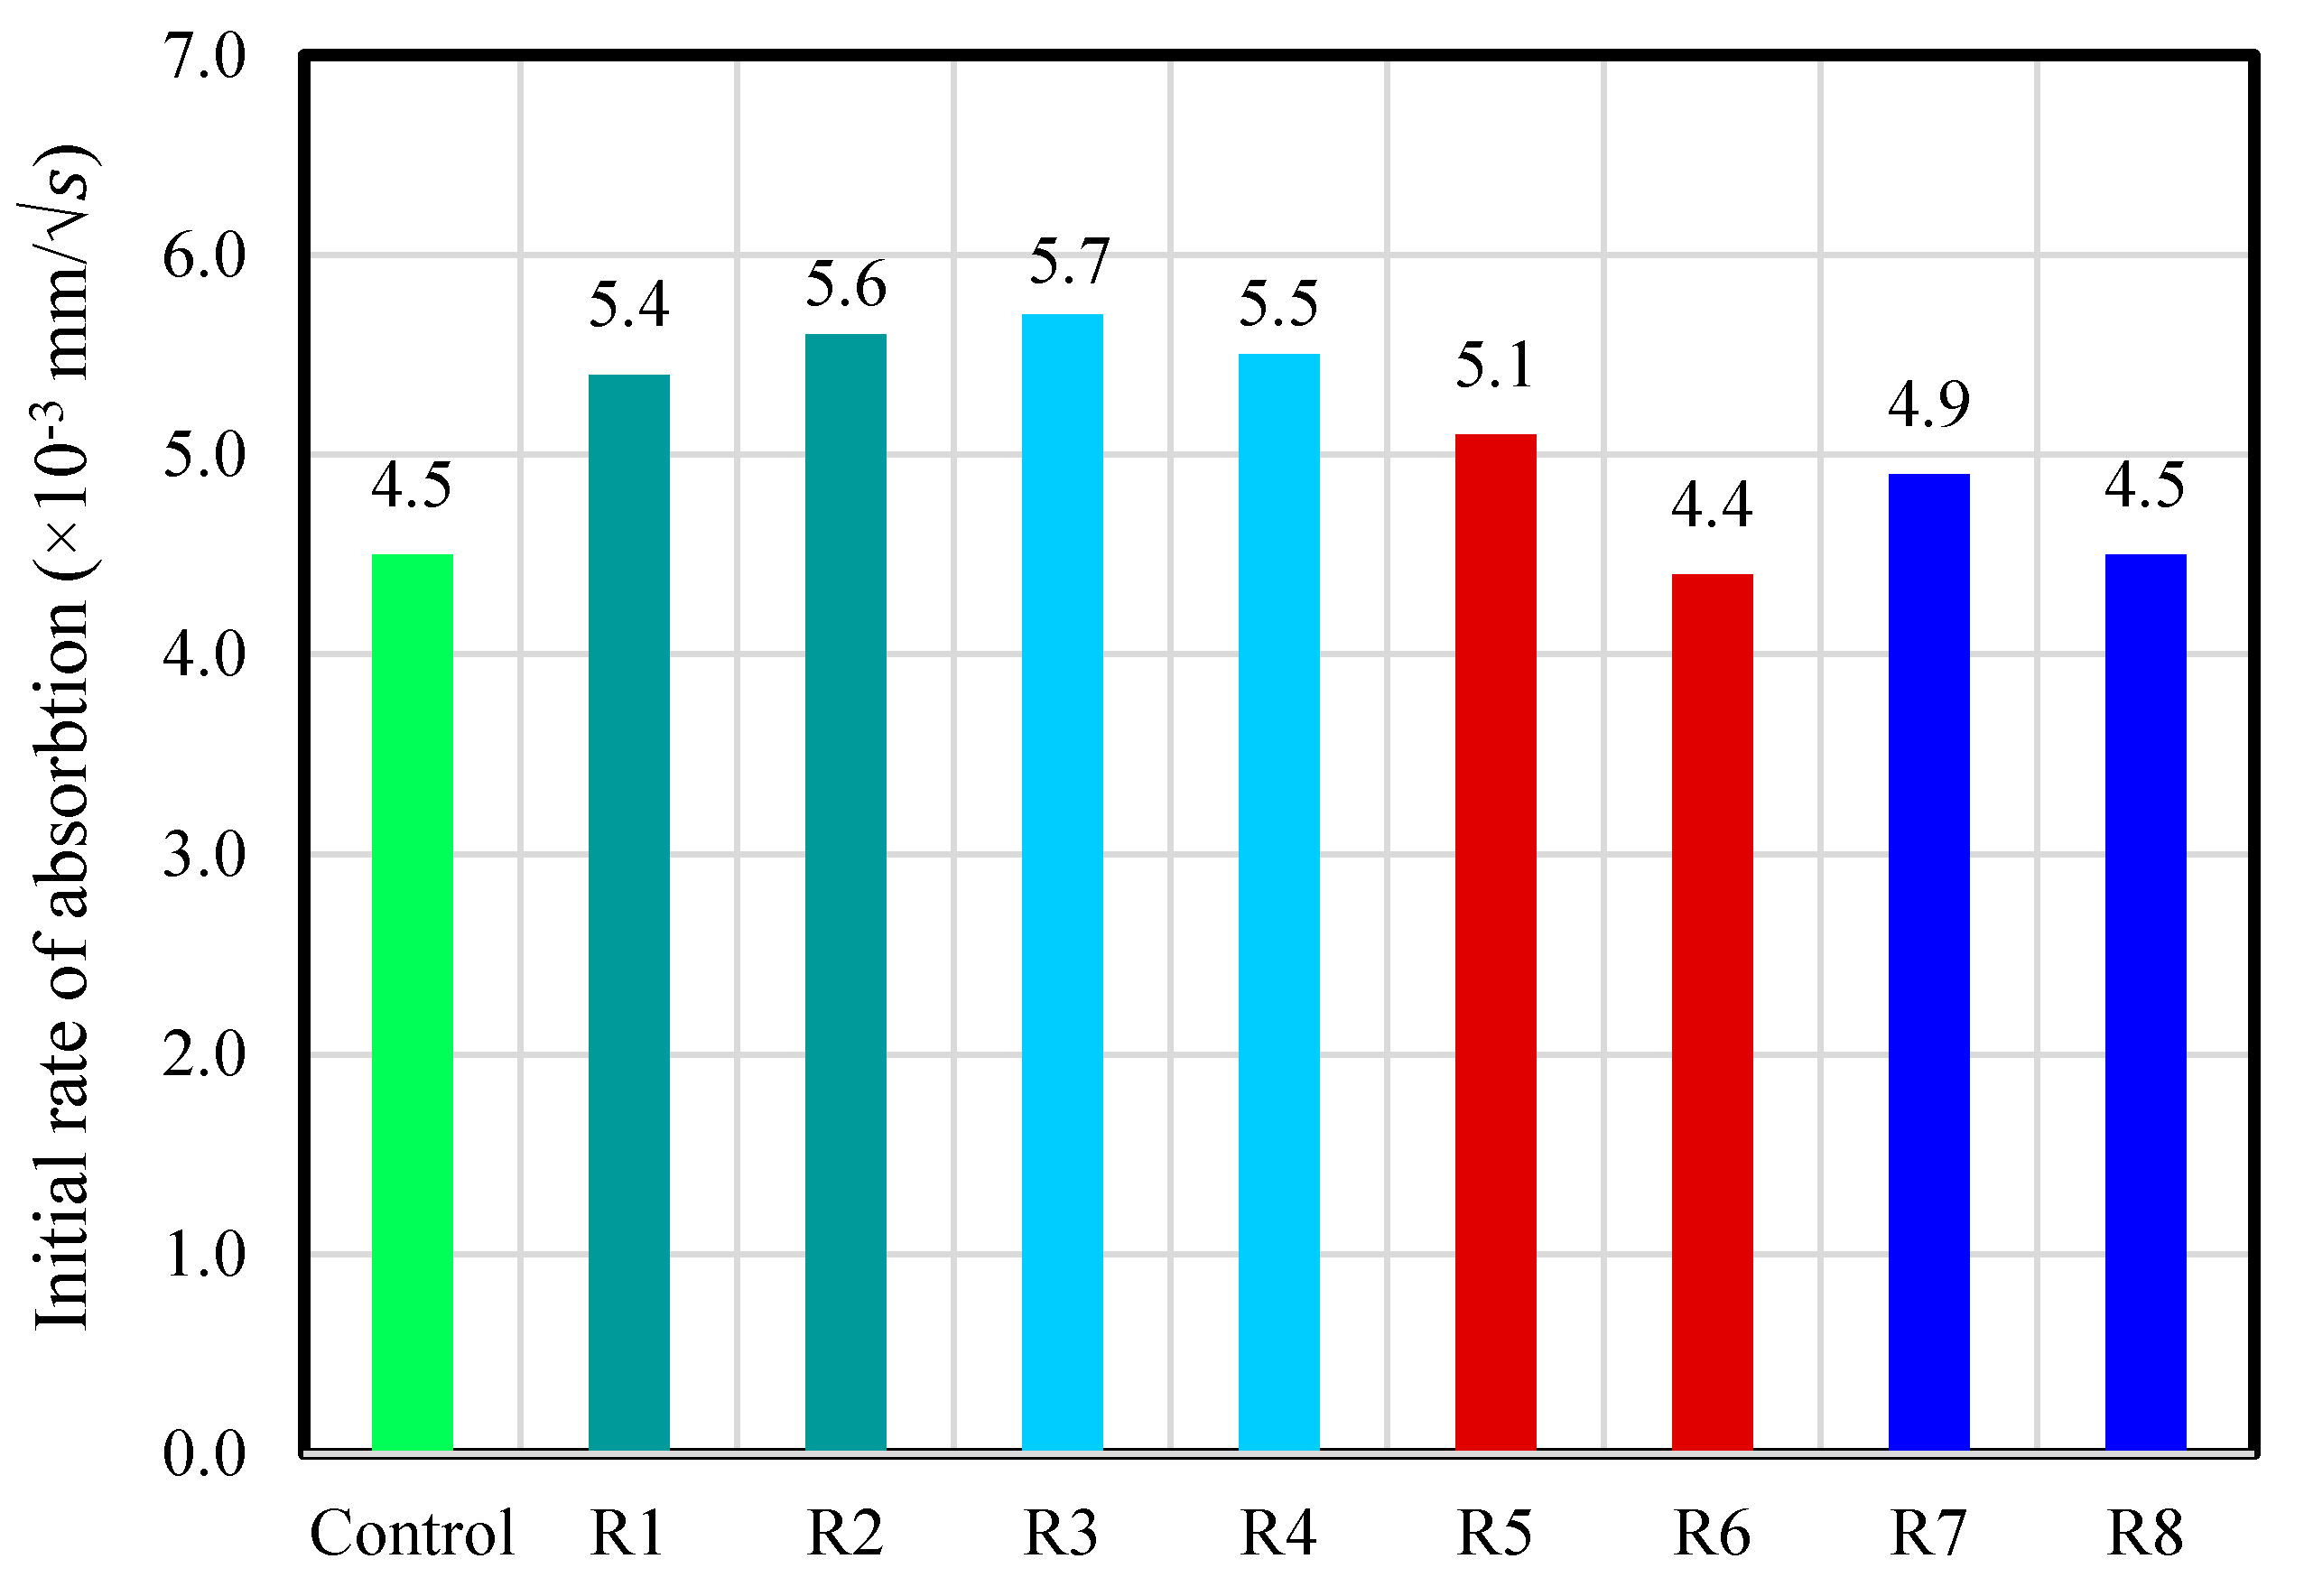
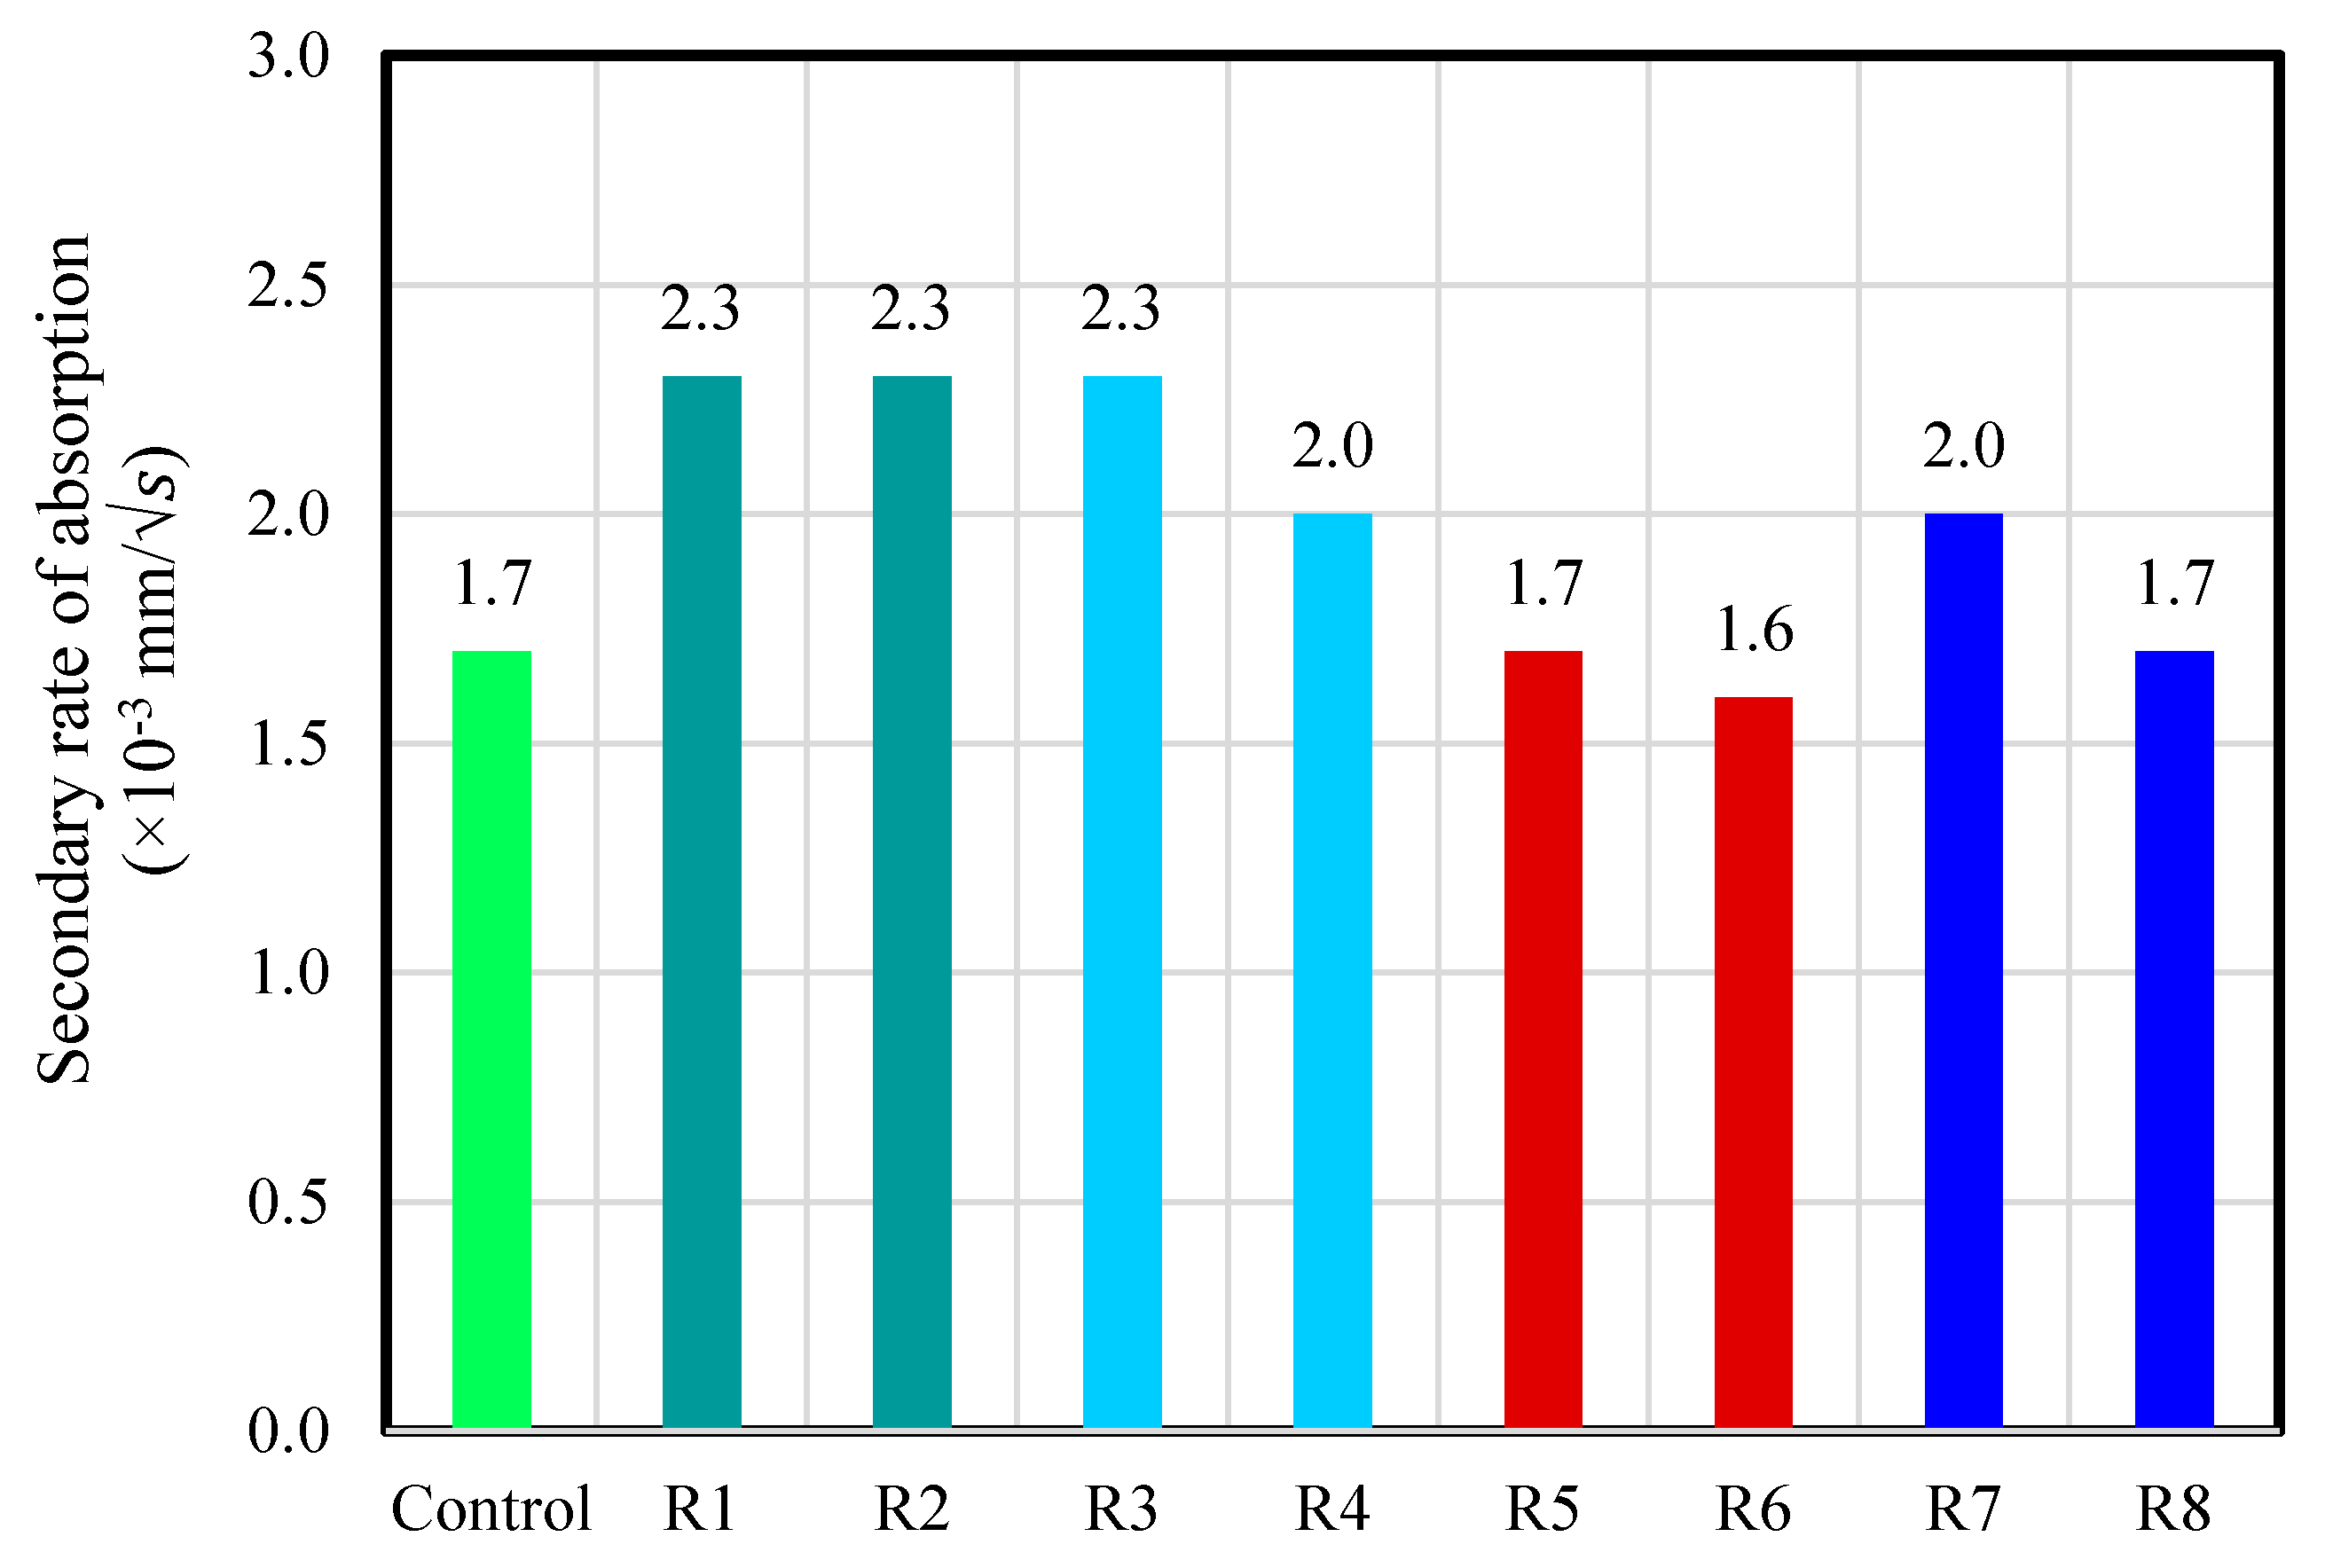
3.2.2. Water Sorptivity
3.3. Resistance to Sodium Sulphate Attack
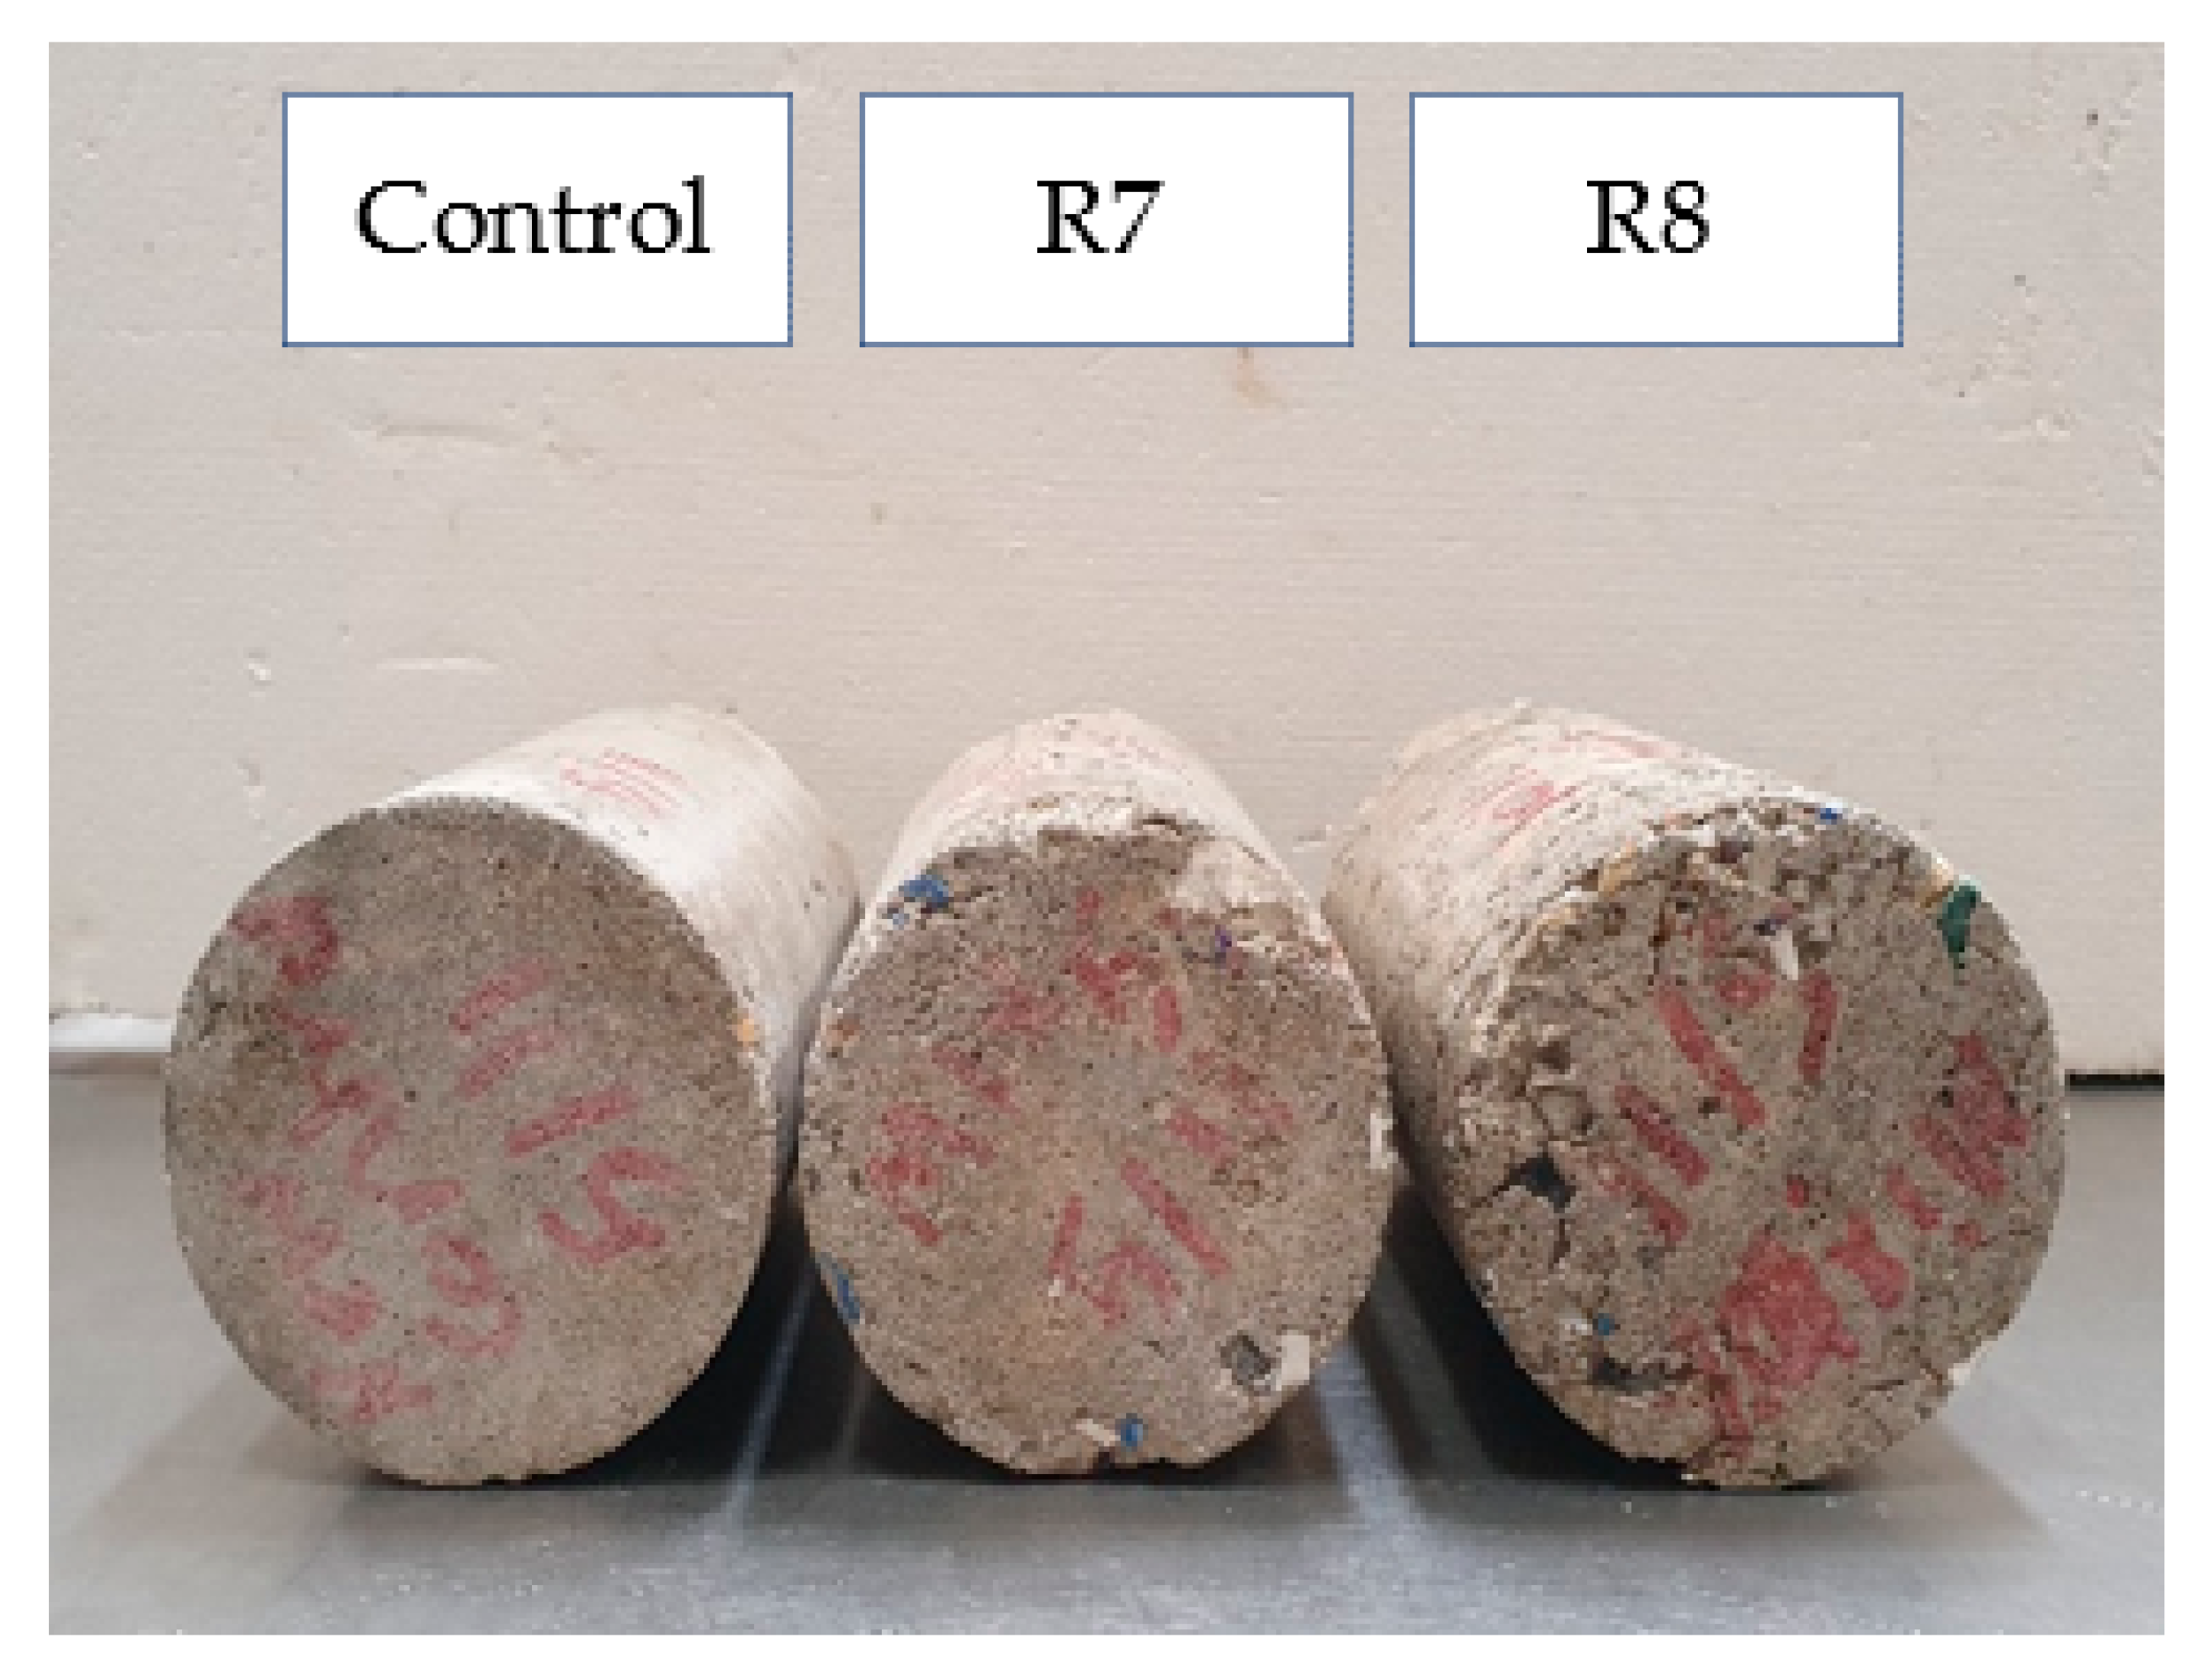
3.3.1. Visual Inspection
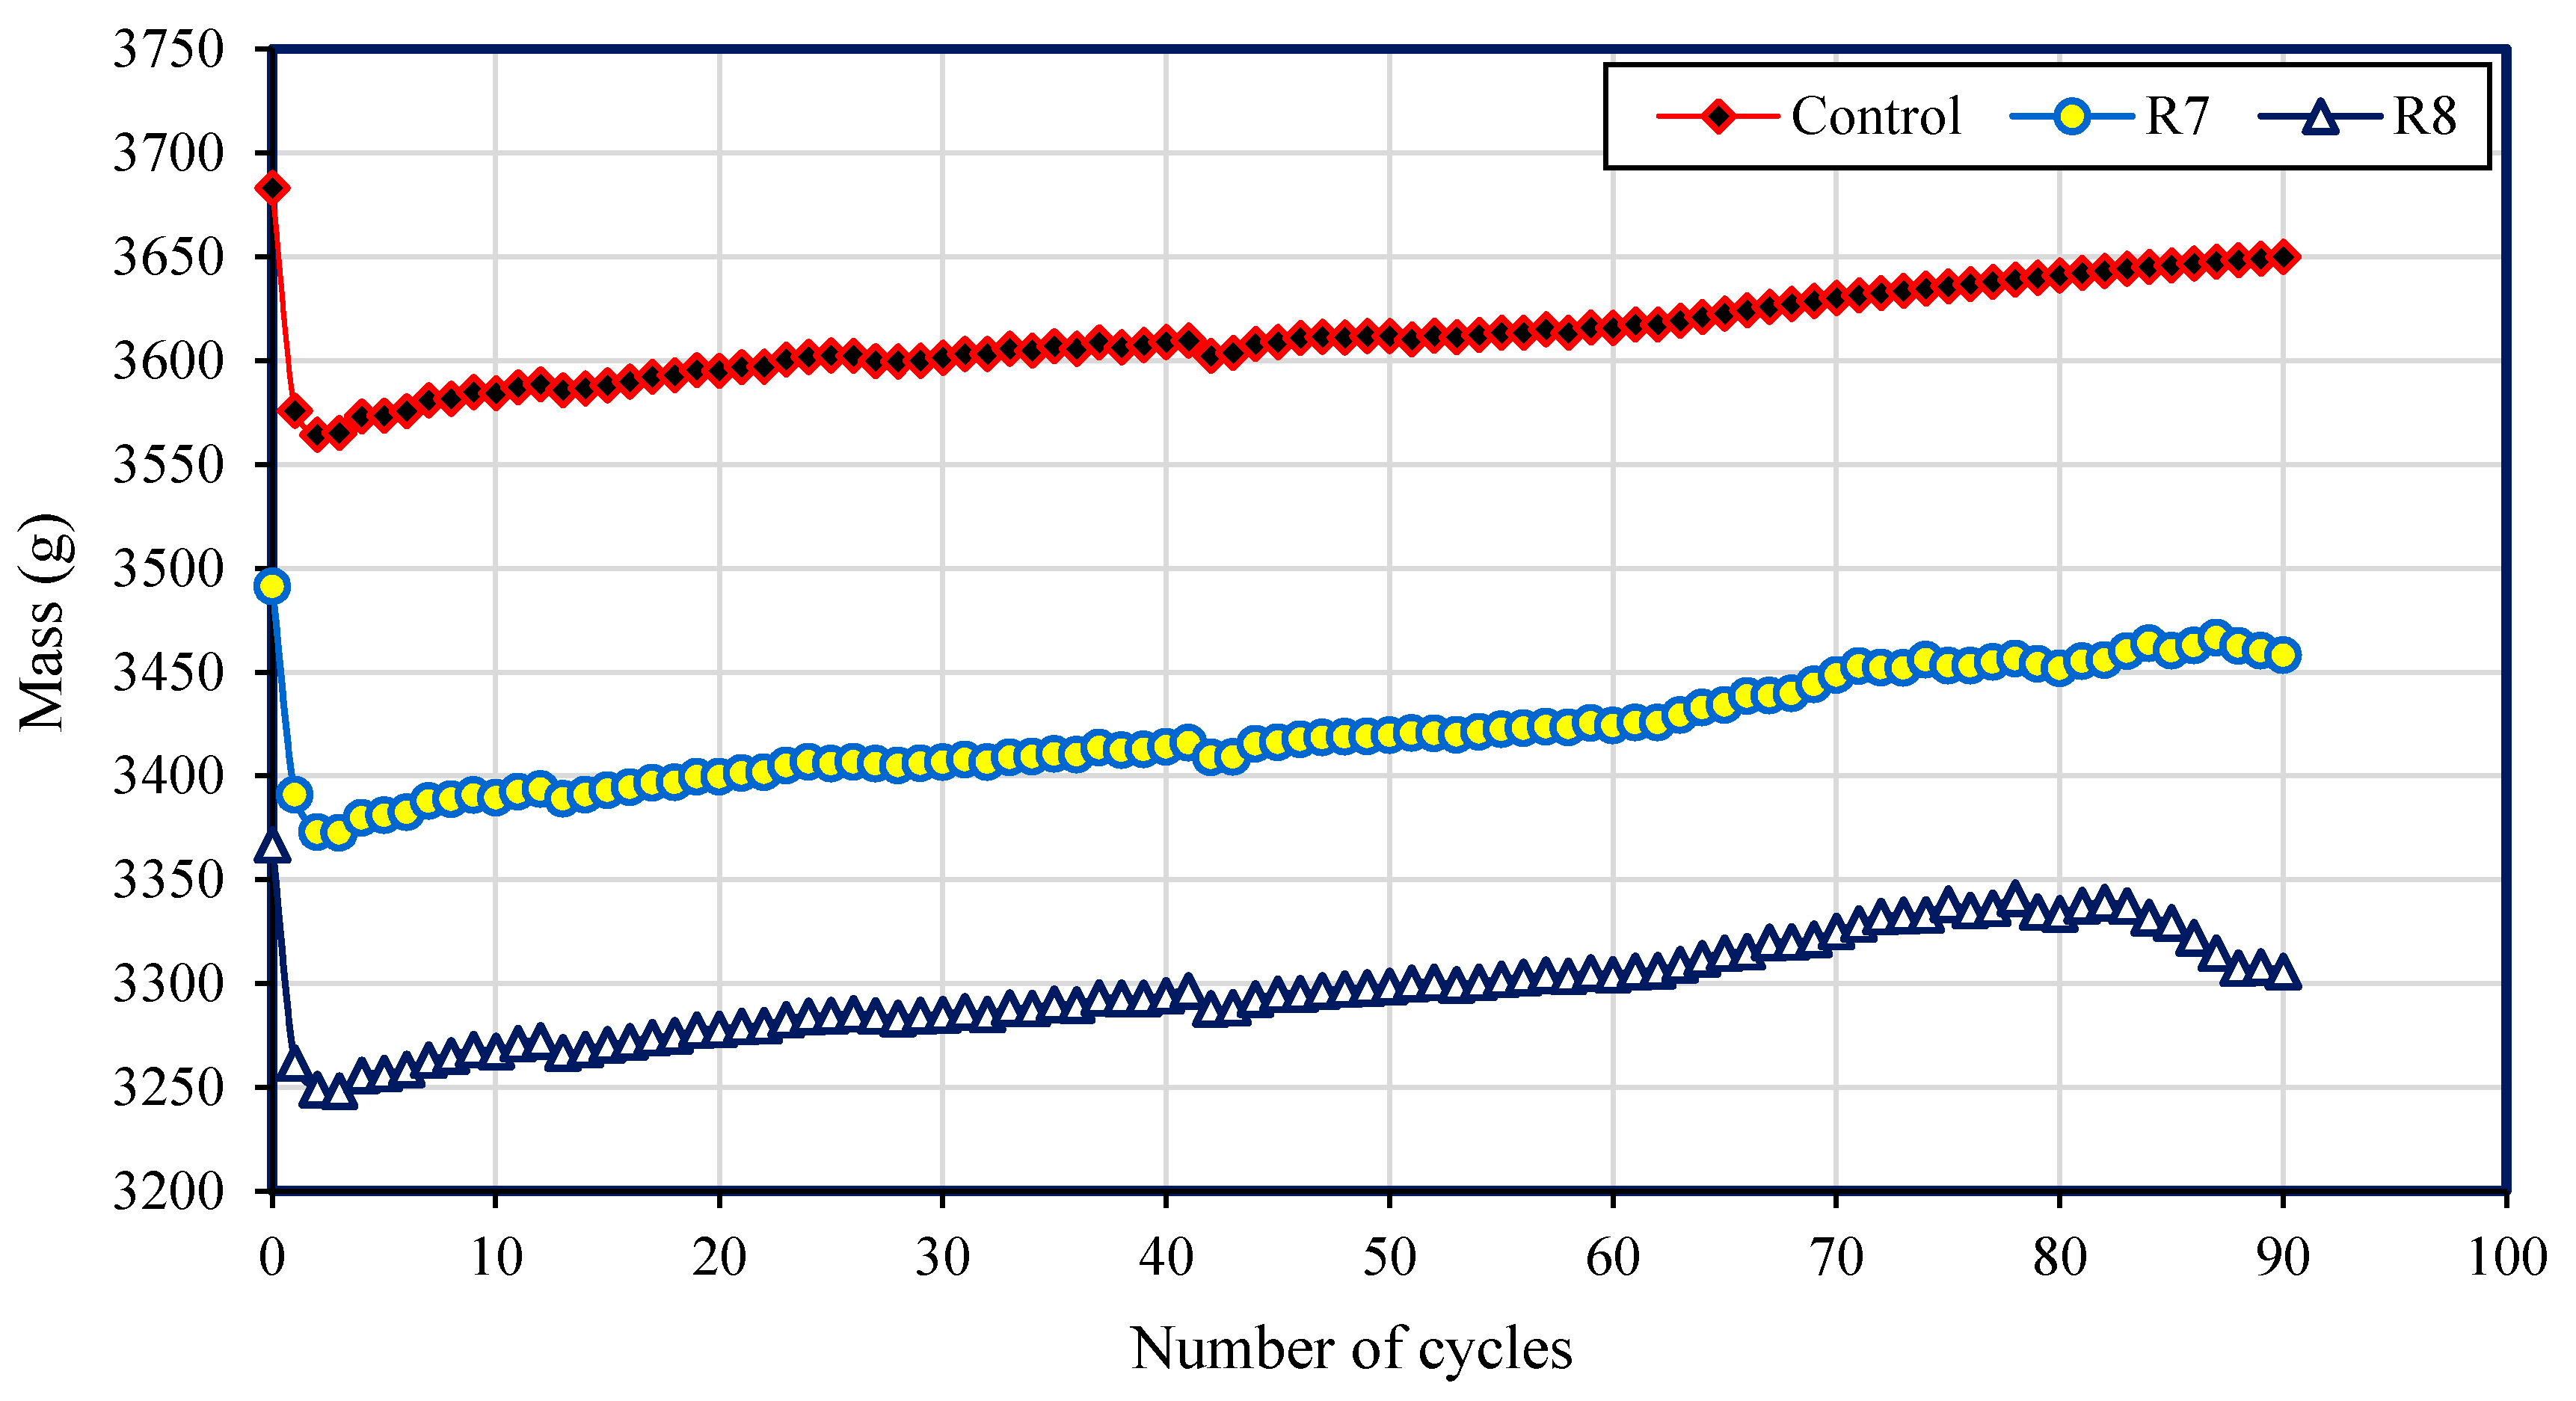
3.3.2. Mass Change
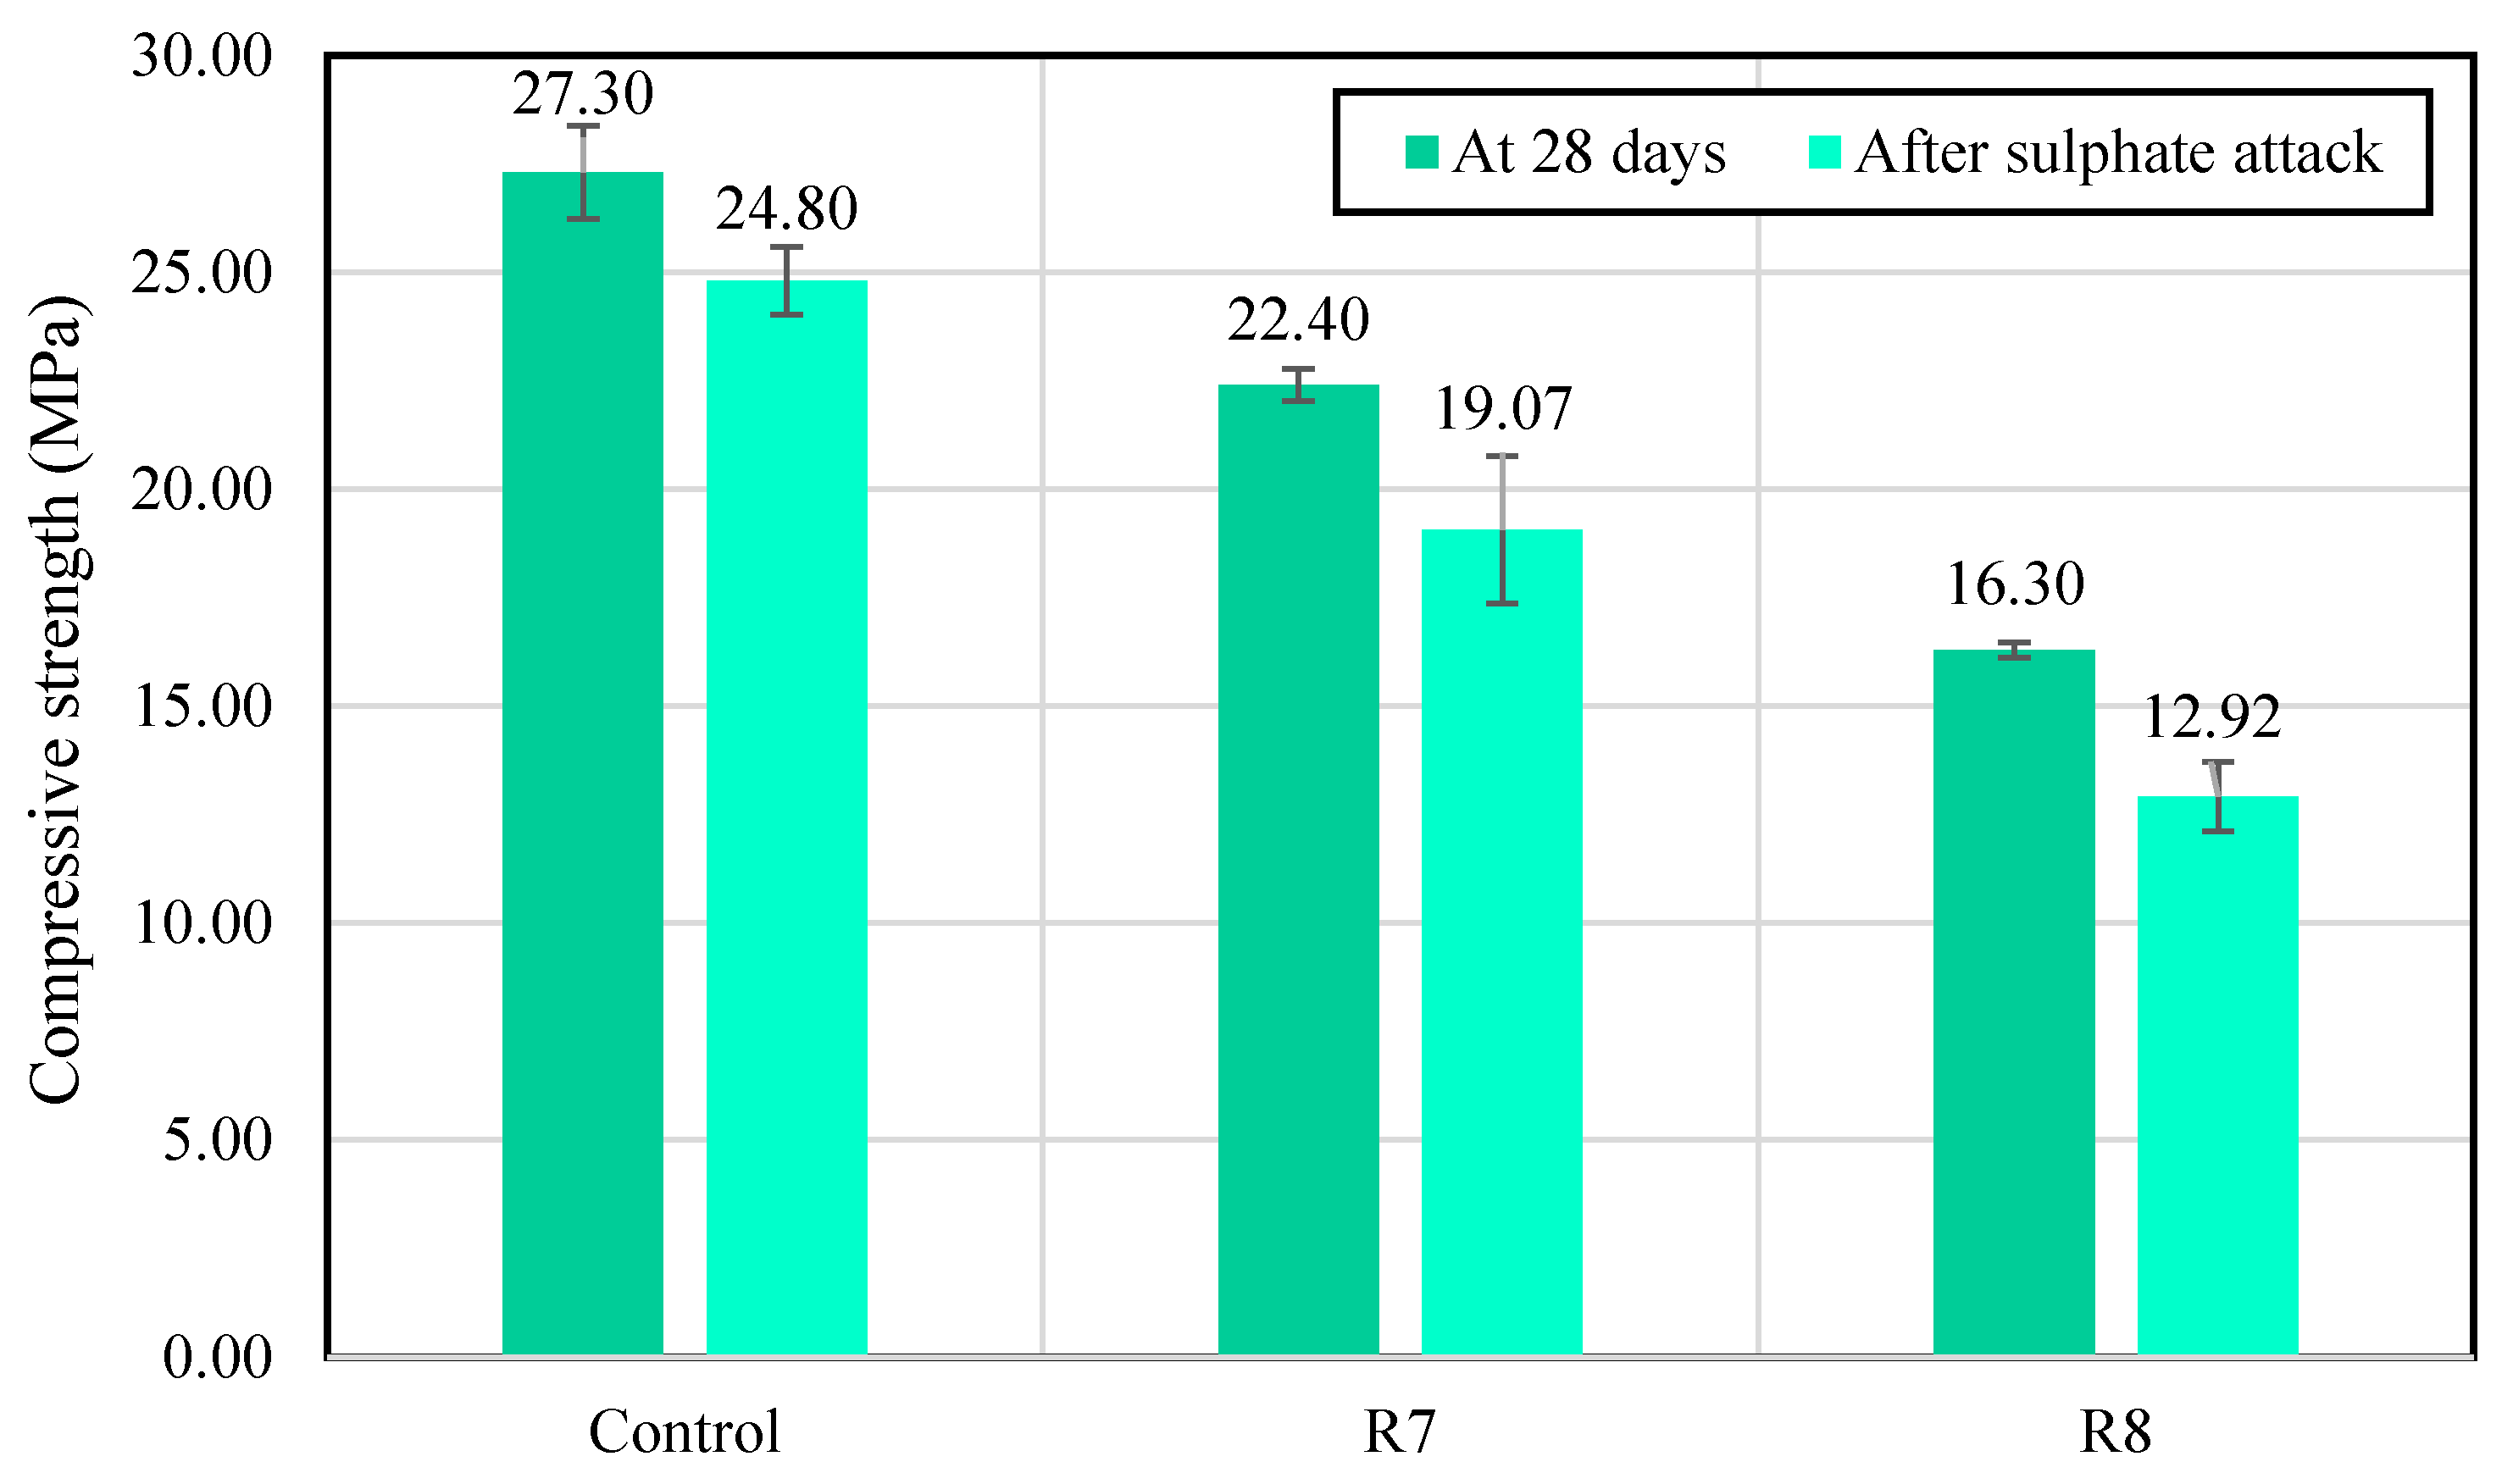
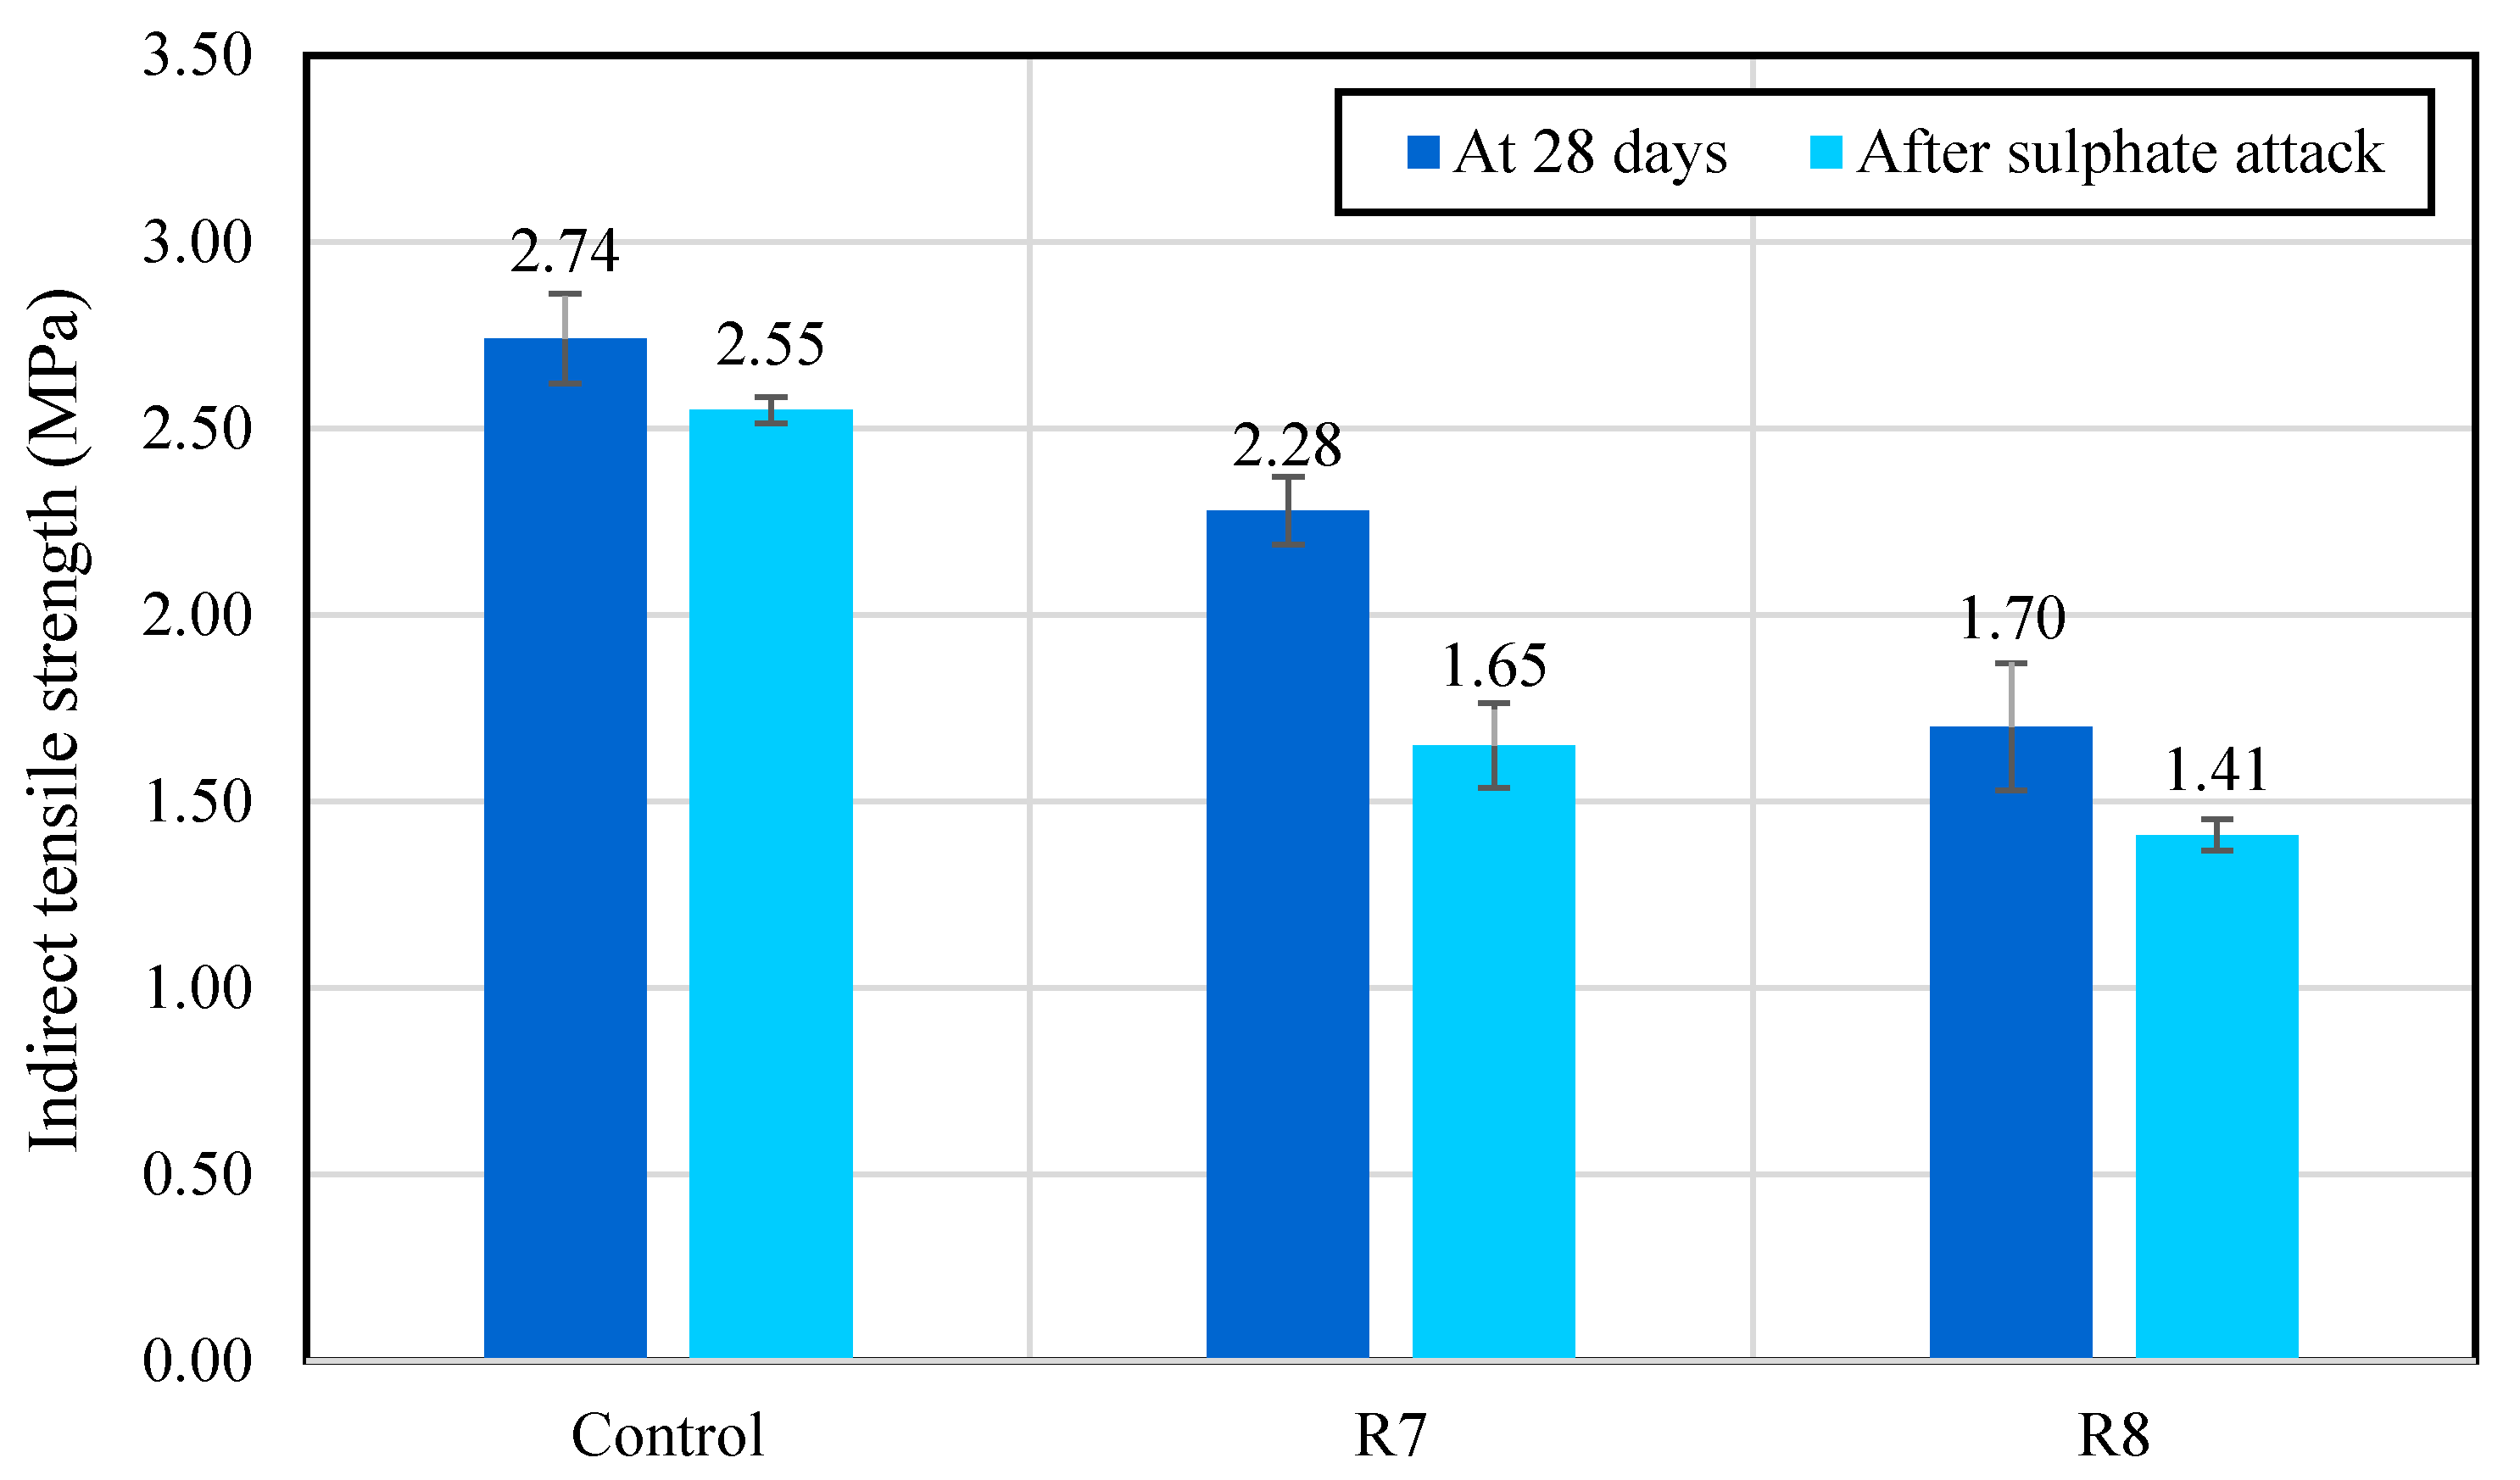
3.3.3. Compressive and Splitting Tensile Strengths
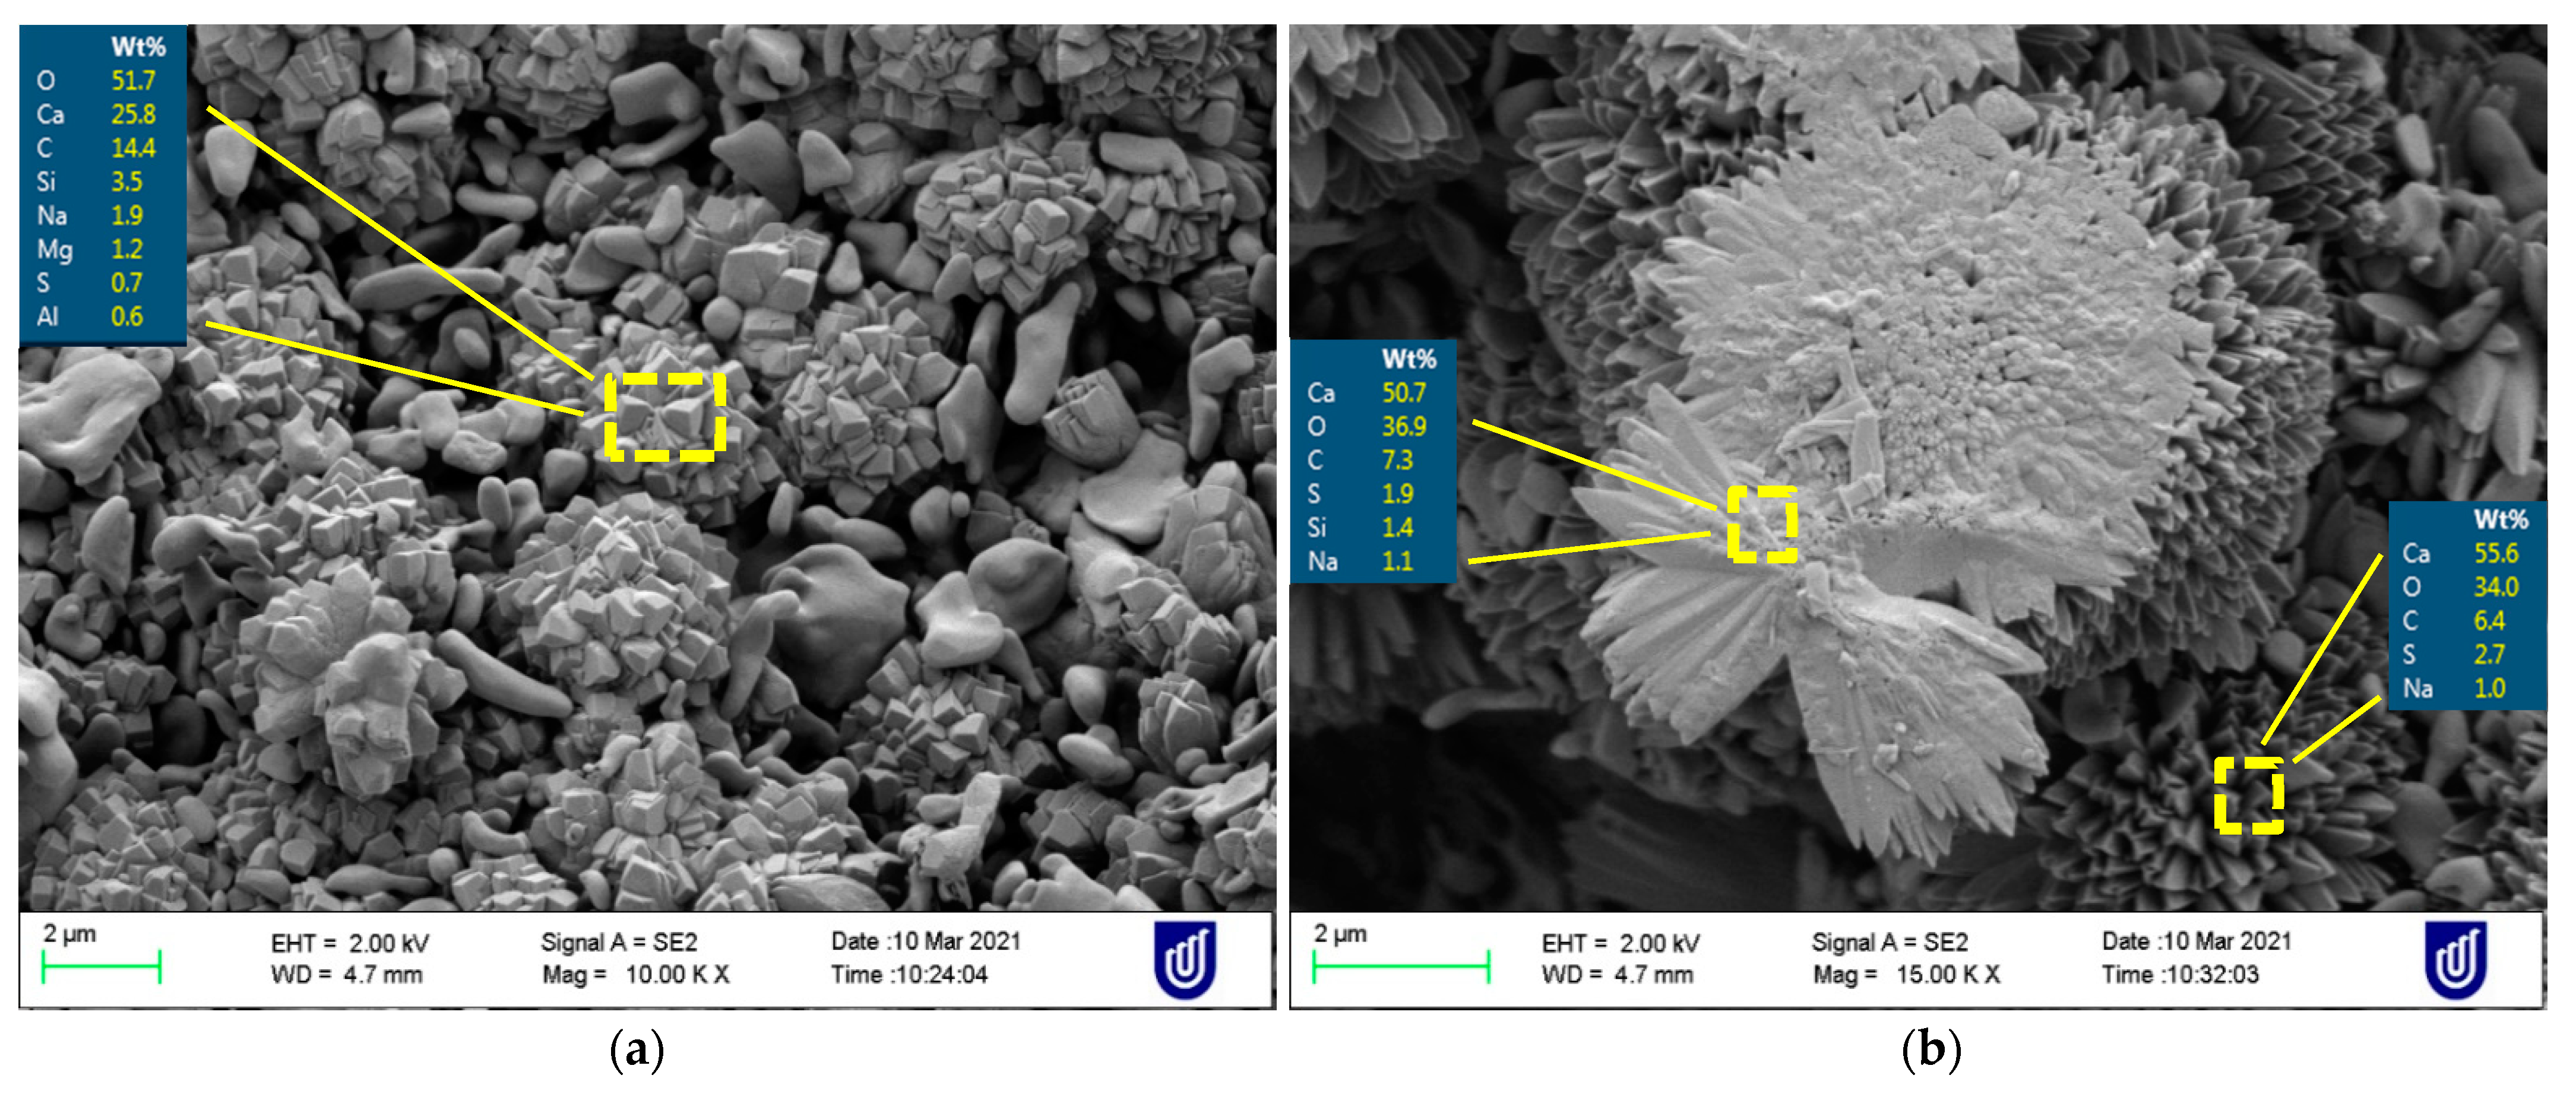
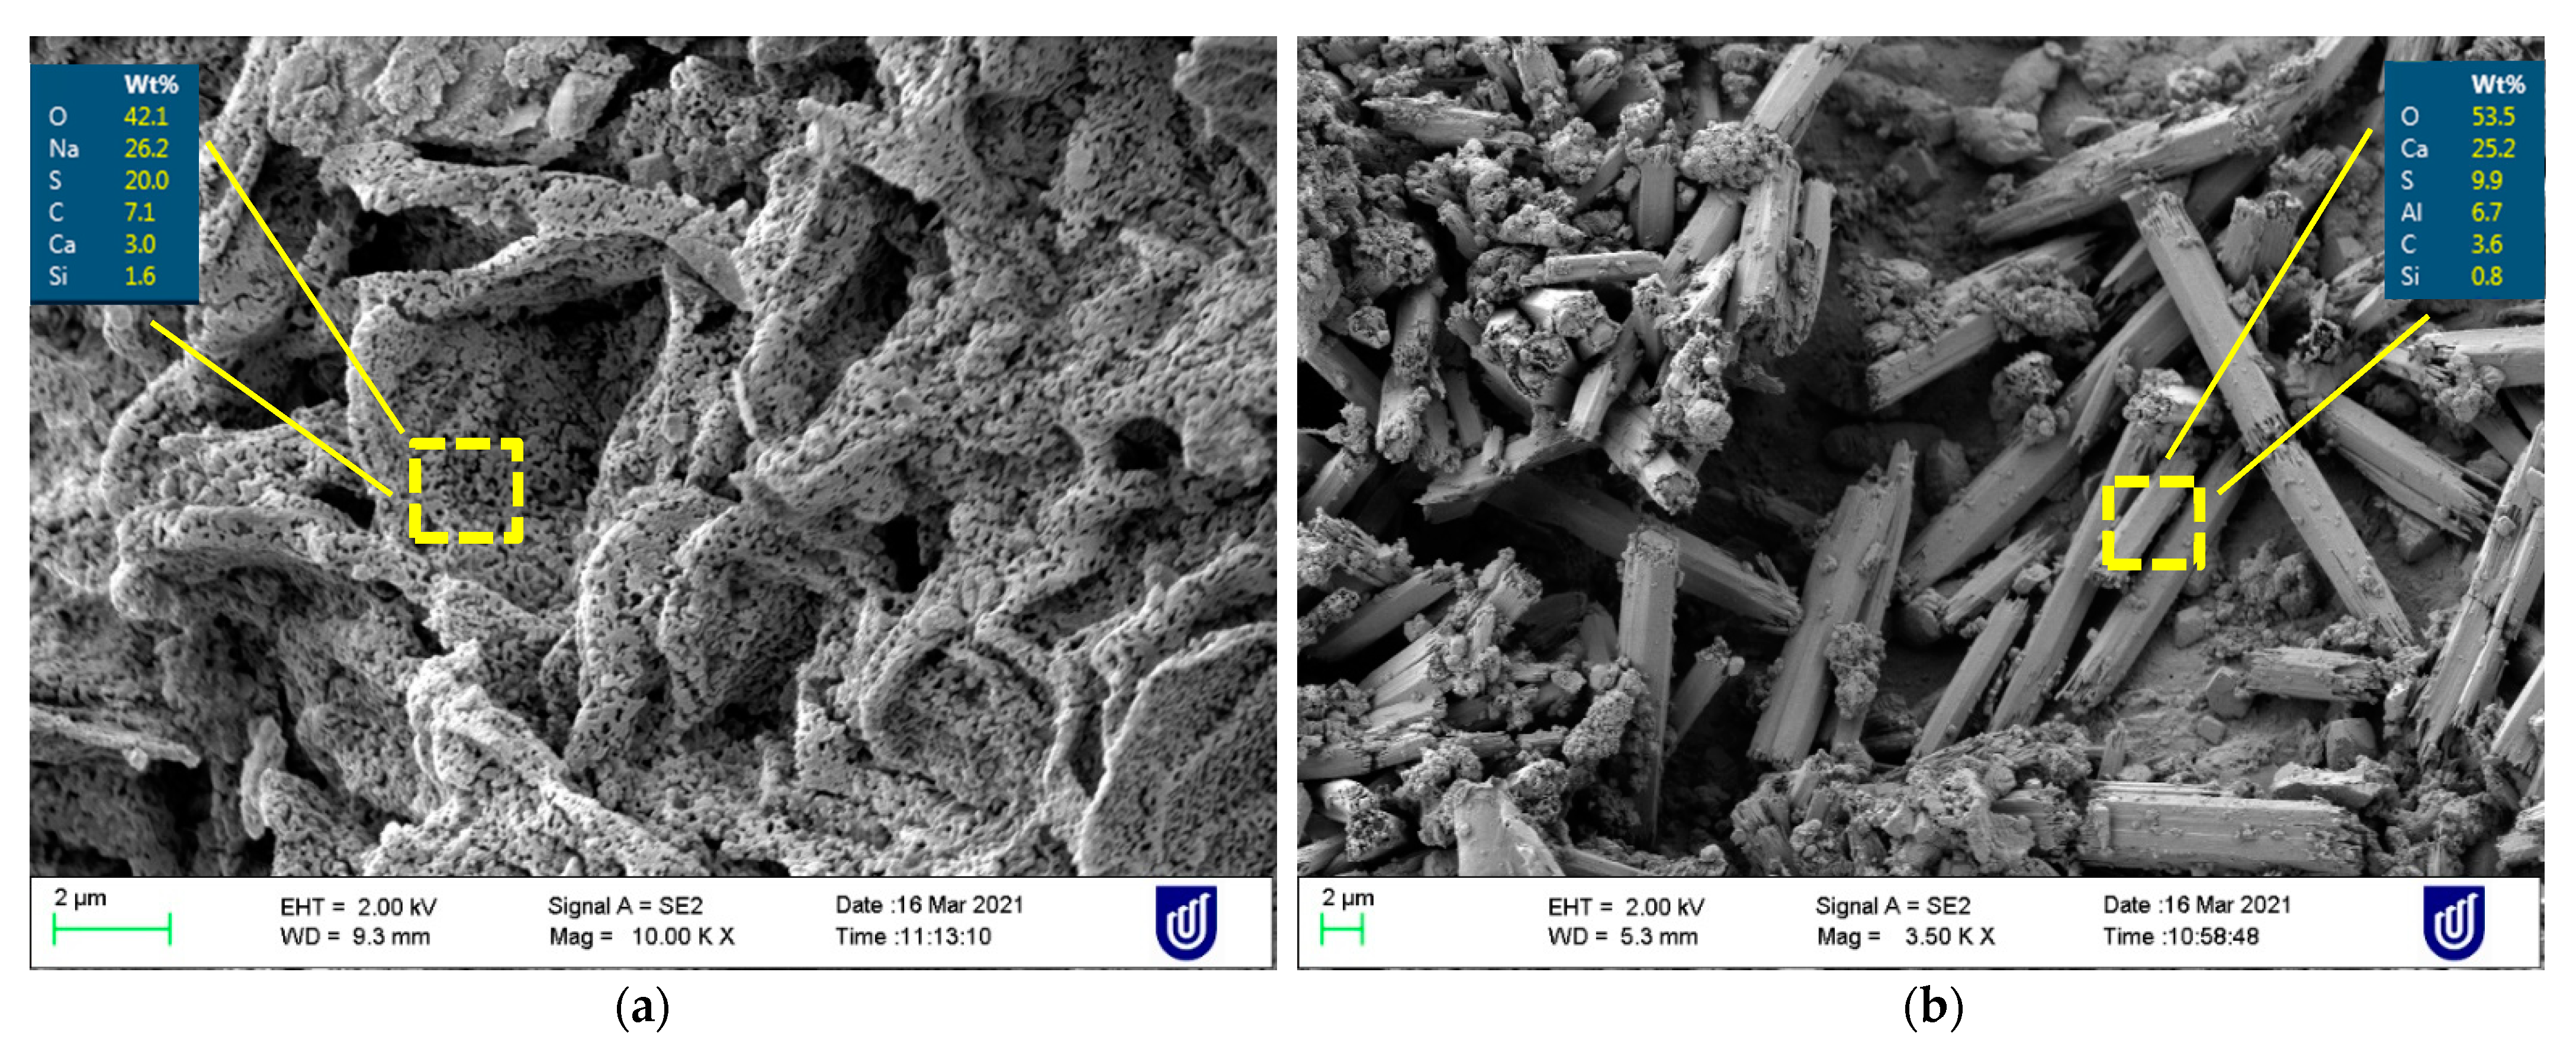
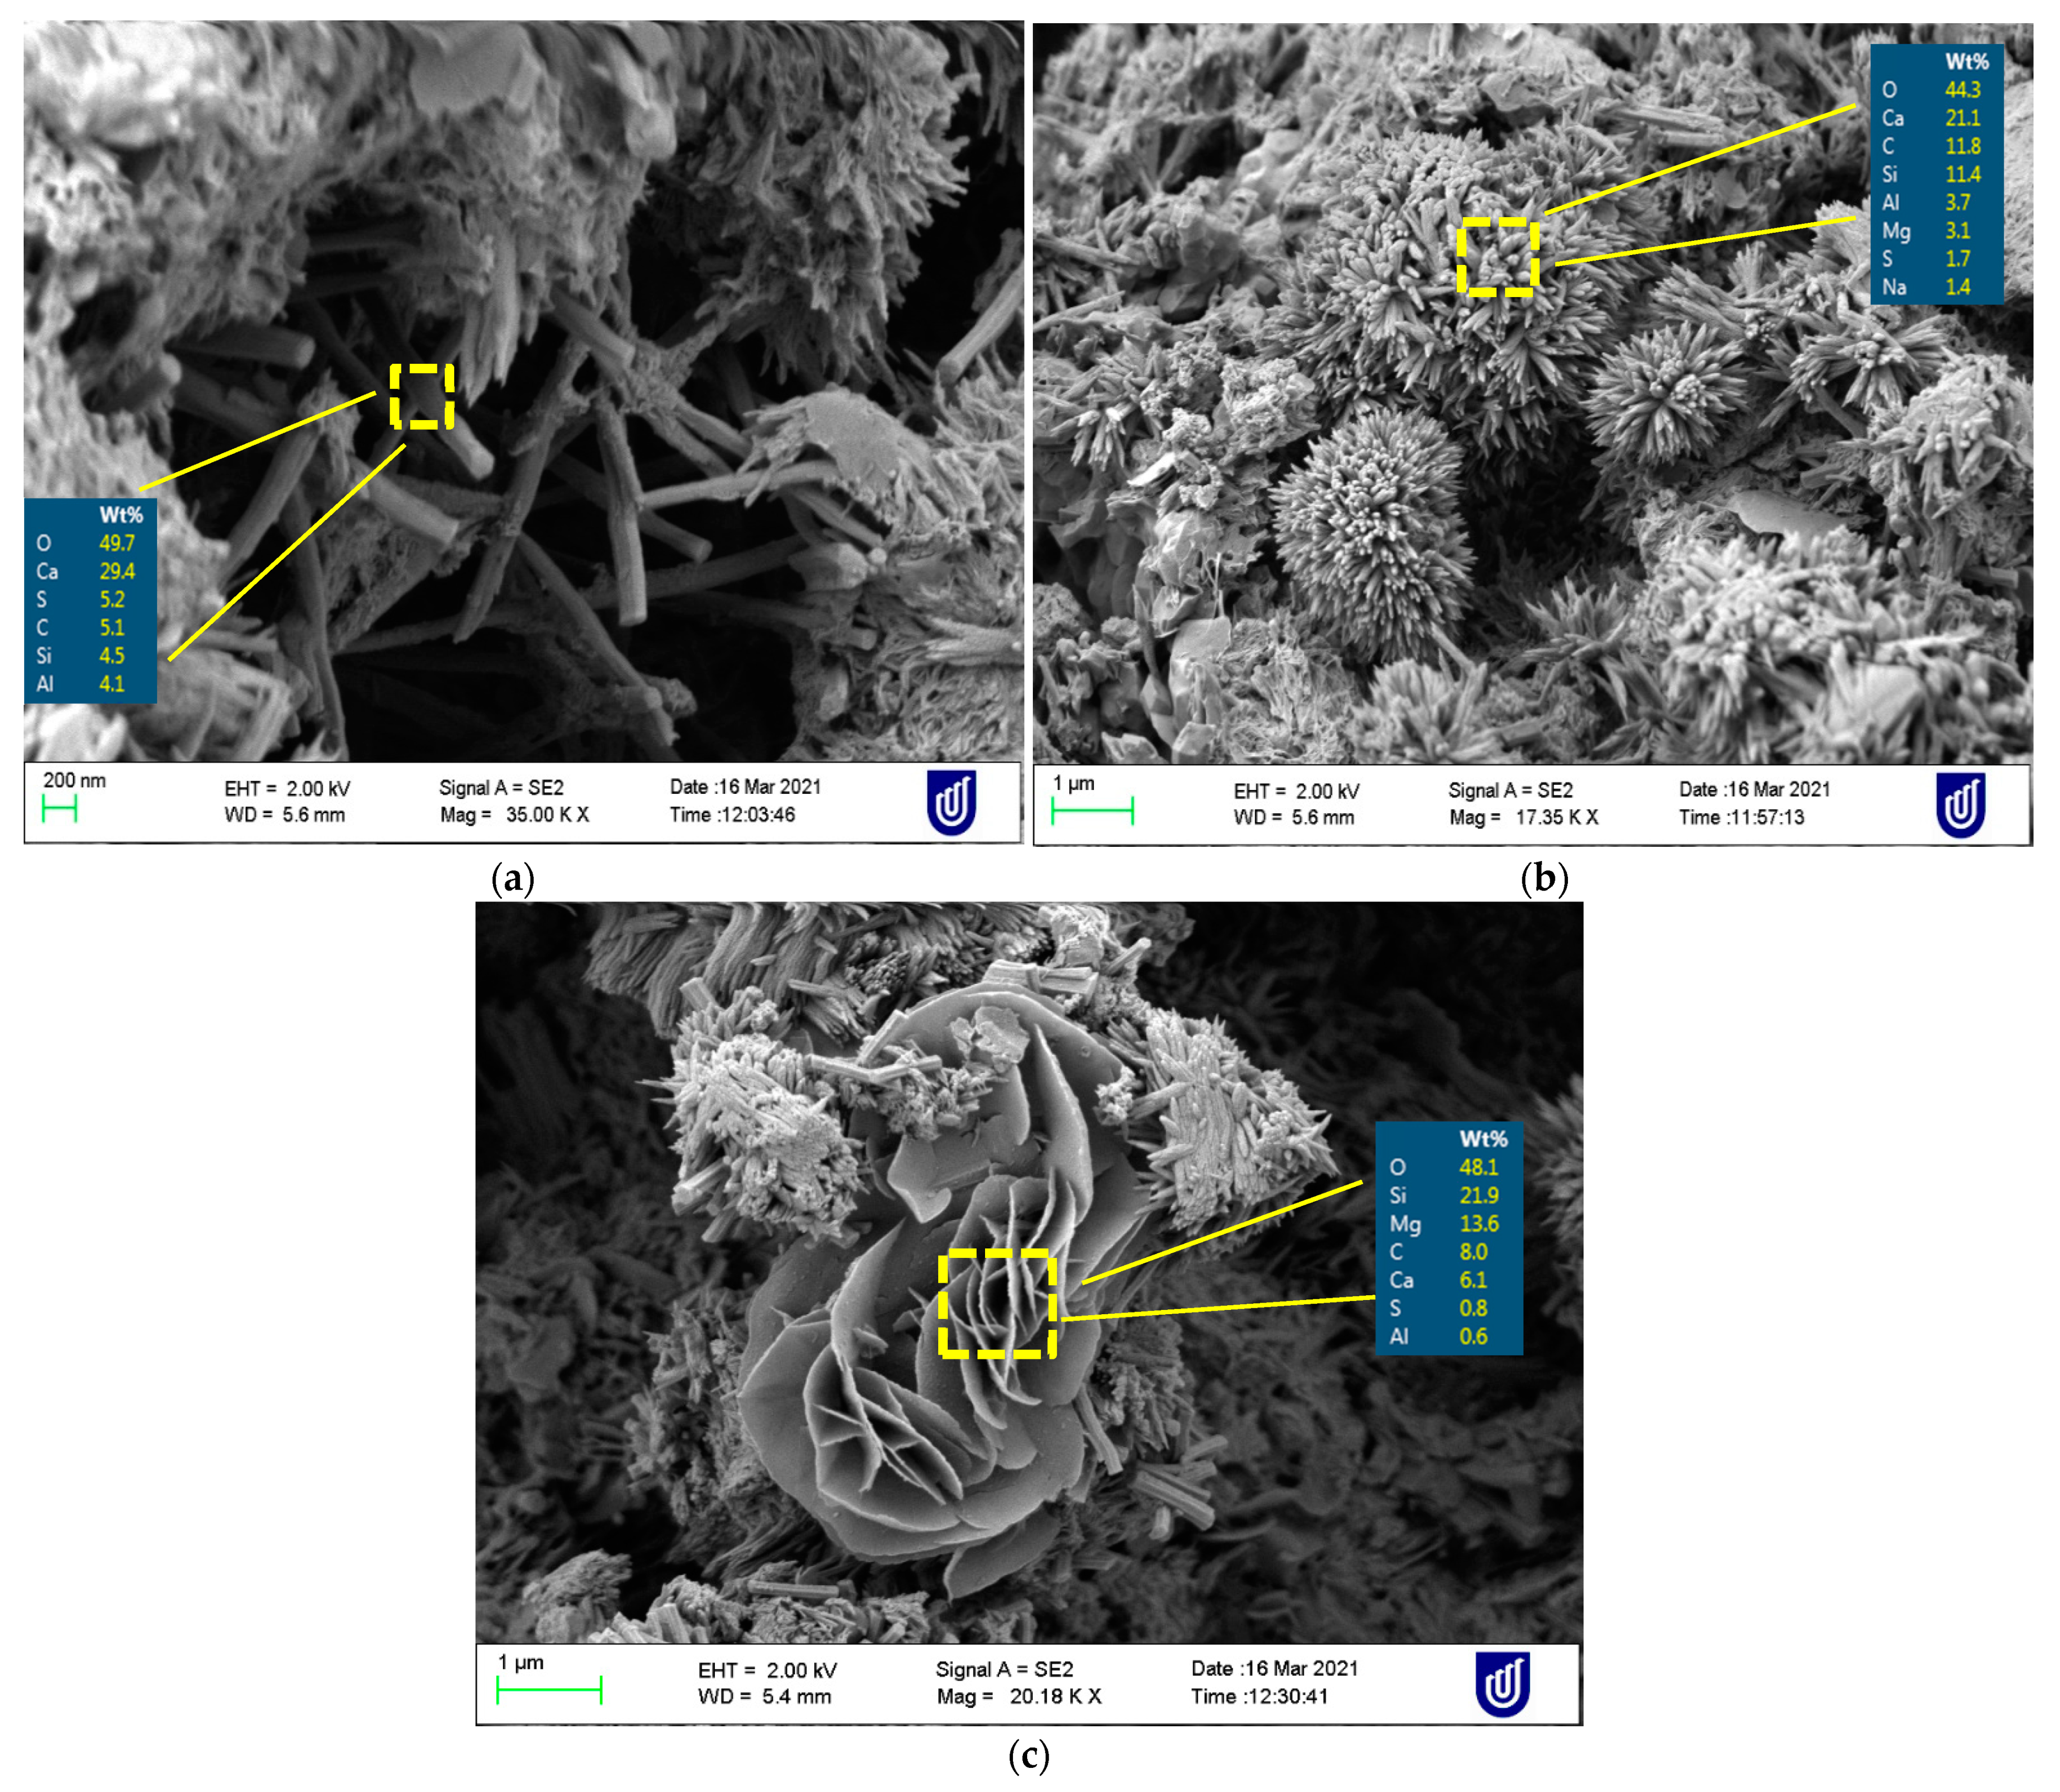
3.3.4. SEM Images and EDS Analysis
4. Conclusions
- The addition of mixed types recycled plastic in concrete improved the impact resistance for all mixes. The presence of PET effectively improved the quality of concrete by increasing the number of blows to cause the failure of the samples;
- The addition of PET plastic in the concrete containing MRPC tended to decrease the water absorption values more than the other two types. This is attributed to the stronger bond of PET with concrete paste compared with other two types;
- In terms of sorptivity results, it is better to add PET plastic type with the two other types to overlook the surface energy property of PET towards water;
- Analysis of mass change showed that the incorporation of higher plastic content negatively affected sodium sulphate resistance slightly as a result of sulphate ion deposition within the pores and voids during the test period;
- In general, the compressive and splitting tensile strengths of the tested MRPC decreased slightly after 90 wet-dry cycles of sodium sulphate exposure;
- The microstructural analysis detected that the mixes including recycled plastic waste have more corrosion minerals with different forms compared to the control mix.
Author Contributions
Funding
Institutional Review Board Statement
Informed Consent Statement
Data Availability Statement
Acknowledgments
Conflicts of Interest
References
- The Australian Government, State and Territory Governments, The Australian Local Government Association. National Waste Policy Action Plan 2019. Available online: https://www.environment.gov.au/protection/waste/publications/national-waste-policy-action-plan (accessed on 2 January 2021).
- Abu-Saleem, M.; Zhuge, Y.; Hassanli, R.; Ellis, M.; Rahman, M.; Levett, P. Evaluation of concrete performance with different types of recycled plastic waste for kerb application. Constr. Build. Mater. 2021, 293, 123477. [Google Scholar] [CrossRef]
- Olofinnade, O.; Chandra, S.; Chakraborty, P. Recycling of high impact polystyrene and low-density polyethylene plastic wastes in lightweight based concrete for sustainable construction. Mater. Today Proc. 2021, 38, 2151–2156. [Google Scholar] [CrossRef]
- Villanueva, A.; Eder, P. End-of-Waste Criteria for Waste Plastic for Conversion; European Commission: Luxembourg, 2014. [Google Scholar]
- Harper, C.A.; Petrie, E.M. Plastics Materials and Processes: A Concise Encyclopedia; John Wiley & Sons, Inc.: Hoboken, NJ, USA, 2003. [Google Scholar]
- Chanda, M. Plastics Technology Handbook, 5th ed.; CRC Press, Taylor & Francis: Boca Raton, FL, USA, 2018. [Google Scholar]
- Jacob-Vaillancourt, C.; Sorelli, L. Characterization of concrete composites with recycled plastic aggregates from postconsumer material streams. Constr. Build. Mater. 2018, 182, 561–572. [Google Scholar] [CrossRef]
- Mohammadinia, A.; Wong, Y.C.; Arulrajah, A.; Horpibulsuk, S. Strength evaluation of utilizing recycled plastic waste and recycled crushed glass in concrete footpaths. Constr. Build. Mater. 2019, 197, 489–496. [Google Scholar] [CrossRef]
- Saxena, R.; Siddique, S.; Gupta, T.; Sharma, R.K.; Chaudhary, S. Impact resistance and energy absorption capacity of concrete containing plastic waste. Constr. Build. Mater. 2018, 176, 415–421. [Google Scholar] [CrossRef]
- Jain, A.; Siddique, S.; Gupta, T.; Sharma, R.K.; Chaudhary, S. Utilization of shredded waste plastic bags to improve impact and abrasion resistance of concrete. Environ. Dev. Sustain. 2020, 22, 337–362. [Google Scholar] [CrossRef]
- Sancak, E.; Özkan, Ş. Sodium sulphate effect on cement produced with building stone waste. J. Mater. 2015, 2015, 12. [Google Scholar] [CrossRef] [Green Version]
- Benosman, A.; Taïbi, H.; Senhadji, Y.; Mouli, M.; Belbachir, M.; Bahlouli, M. Plastic waste particles in mortar composites: Sulfate resistance and thermal coefficients. Prog. Rubber Plast. Recycl. Technol. 2017, 33, 171–202. [Google Scholar] [CrossRef]
- Abu-Saleem, M.; Zhuge, Y.; Hassanli, R.; Ellis, M.; Rahman, M.M.; Levett, P. Stress-Strain Behaviour and Mechanical Strengths of Concrete Incorporating Mixed Recycled Plastics. J. Compos. Sci. 2021, 5, 146. [Google Scholar] [CrossRef]
- Standards Australia. Methods for Sampling and Testing Aggregates–Particle Density and Water Absorption of Coarse Aggregate–Weighing-in-Water Method, AS1141.6.1; Standards Australia Limited: Sydney, Australia, 2000. [Google Scholar]
- Standards Australia. Methods for Sampling and Testing Aggregates–Particle Density and Water Absorption of Fine Aggregate, AS 1141.5; Standards Australia Limited: Sydney, Australia, 2000. [Google Scholar]
- ASTM D792. Standard Test Methods for Density and Specific Gravity (Relative Density) of Plastics by Displacement; ASTM International: West Conshohocken, PA, USA, 2013. [Google Scholar]
- Standards Australia. Methods for Sampling and Testing Aggregates, Method 11.1: Particle Size Distribution—Sieving Method, AS 1141.11.1; Standards Australia Limited: Sydney, Australia, 2009. [Google Scholar]
- Standards Australia. Methods of Testing Concrete, Preparation of Concrete Mixes in the Laboratory, AS 1012.2; Standards Australia Limited: Sydney, Australia, 2014. [Google Scholar]
- Standards Australia. Methods of Testing Concrete, Method for Making and Curing Concrete—Compression and Indirect Tensile Test Specimens, AS 1012.8.1; Standards Australia Limited: Sydney, Australia, 2014. [Google Scholar]
- Shah, S.P.; Daniel, J.I.; Ahmad, S.H.; Arockiasamy, M.; Balaguru, P.; Ball, C.G.; Ball, H.P.; Batson, G.B.; Bentur, A.; Craig, R.J. Measurement of properties of fiber reinforced concrete. ACI Mater. J. 1988, 85, 583–593. [Google Scholar]
- Badr, A.; Ashour, A.F. Modified ACI Drop-Weight Impact Test for Concrete. ACI Mater. J. 2005, 102, 249–255. [Google Scholar]
- Standards Australia. Methods of Testing Concrete—Determination of Water Absorption and Apparent Volume of Permeable Voids in Hardened Concrete, AS 1012.21; Standards Australia Limited: Sydney, Australia, 1999. [Google Scholar]
- ASTM C1585. Standard Test Methods for Measurement of Rate of Absorption of Water by Hydraulic Cement Concretes; ASTM International: West Conshohocken, PA, USA, 2013. [Google Scholar]
- Standards Australia/Standards New Zealand. Masonry Units and Segmental Pavers and Flags—Methods of Test—Method 10: Determining Resistance to Salt Attack, AS/NZS 4456.10; Standards Australia Limited: Sydney, Australia; Standards New Zealand: Wellington, New Zealand, 2003. [Google Scholar]
- Mohammadhosseini, H.; Tahir, M.M. Durability performance of concrete incorporating waste metalized plastic fibres and palm oil fuel ash. Constr. Build. Mater. 2018, 180, 92–102. [Google Scholar] [CrossRef]
- DesignerData. Impact Strength of Polyethylene Terephthalate. Available online: https://designerdata.nl/materials/plastics/thermo-plastics/polyethylene-terephthalate (accessed on 2 January 2021).
- DesignerData. Impact Strength of High Density Polyetheen. Available online: https://designerdata.nl/materials/plastics/thermo-plastics/high-density-polyetheen (accessed on 2 January 2021).
- DesignerData Impact Strength of Polypropylene. Available online: https://designerdata.nl/materials/plastics/thermo-plastics/polypropylene-(cop.) (accessed on 2 January 2021).
- Mohammadhosseini, H.; Tahir, M.M.; Sam, A.R.M. The feasibility of improving impact resistance and strength properties of sustainable concrete composites by adding waste metalized plastic fibres. Constr. Build. Mater. 2018, 169, 223–236. [Google Scholar] [CrossRef]
- Skalny, J.P.; Marchand, J.; Odler, I. Sulfate Attack on Concrete; Spon Press: London, UK, 2002; pp. 43–126. [Google Scholar]
- Shah, R.A.; Pitroda, J. Effect of water absorption and sorptivity on durability of pozzocrete mortar. Int. J. Emerg. Sci. Eng. 2013, 1, 73–77. [Google Scholar]
- Guo, X.; Xiong, G. Resistance of fiber-reinforced fly ash-steel slag based geopolymer mortar to sulfate attack and drying-wetting cycles. Constr. Build. Mater. 2021, 269, 121326. [Google Scholar] [CrossRef]
- Li, Q.; Li, X.; Yang, K.; Zhu, X.; Gevaudan, J.P.; Yang, C.; Basheer, M. The long-term failure mechanisms of alkali-activated slag mortar exposed to wet-dry cycles of sodium sulphate. Cem. Concr. Compos. 2021, 116, 103893. [Google Scholar] [CrossRef]
- Lakshmi, R.; Nagan, S. Investigations on durability characteristics of E-plastic waste incorporated concrete. Asian J. Civ. Eng. 2011, 12, 773–787. [Google Scholar]
- Gabrisova, A.; Havlica, J.; Sahu, S. Stability of calcium sulphoaluminate hydrates in water solutions with various pH values. Cem. Concr. Res. 1991, 21, 1023–1027. [Google Scholar] [CrossRef]


| Property | PET | HDPE | PP |
|---|---|---|---|
| Chemical formula | [C10H8O4]n | (C2H4)n | [CH(CH3)CH2]n |
| Repeating unit | ethylene terephthalate | polyethylene | propylene |
| Saturation | unsaturated polymer | saturated polymer | saturated polymer |
| Aggregate | Particle Density on a Saturated Surface-Dried (t/m3) (AS Code) | Apparent Particle Density (t/m3) (AS Code) | Water Absorption (%) (AS Code) | Specific Gravity (ASTM Code) | Density (kg/m3) (ASTM Code) | |
|---|---|---|---|---|---|---|
| Coarse | Stone | 2.73 | 2.83 | 2.3 | - | - |
| PET | - | - | - | 1.23 | 1224.95 | |
| HDPE | - | - | - | 0.96 | 960.48 | |
| PP | - | - | - | 0.91 | 905.32 | |
| Fine | 2.6 | 2.61 | 0.17 | - | - | |
| Mix | Mix ID | Rc (%) 1 | Mix Quantities (kg/m3) | |||||||
|---|---|---|---|---|---|---|---|---|---|---|
| Cement | Water | Fine | Coarse | Plastic | SP 2 | |||||
| PET | HDPE | PP | ||||||||
| Control | control | - | 320.2 | 241.5 | 886.3 | 858.5 | - | - | - | 1.8 |
| PET5% + HDPE5% | R1 | 10 | 320.2 | 241.5 | 886.3 | 772.65 | 19.34 | 15.10 | - | 1.8 |
| PET10% + HDPE10% | R2 | 20 | 320.2 | 241.5 | 886.3 | 686.8 | 38.68 | 30.19 | - | 1.8 |
| PET5% + PP5% | R3 | 10 | 320.2 | 241.5 | 886.3 | 772.65 | 19.34 | - | 14.31 | 1.8 |
| PET10% + PP10% | R4 | 20 | 320.2 | 241.5 | 886.3 | 686.8 | 38.68 | - | 28.61 | 1.8 |
| HDPE5% + PP5% | R5 | 10 | 320.2 | 241.5 | 886.3 | 772.65 | - | 15.10 | 14.31 | 1.8 |
| HDPE10% + PP10% | R6 | 20 | 320.2 | 241.5 | 886.3 | 686.8 | - | 30.19 | 28.61 | 1.8 |
| PET5% + HDPE5% + PP5% | R7 | 15 | 320.2 | 241.5 | 886.3 | 729.73 | 19.34 | 15.10 | 14.31 | 1.8 |
| PET10% + HDPE10% + PP10% | R8 | 30 | 320.2 | 241.5 | 886.3 | 600.95 | 38.68 | 30.19 | 28.61 | 1.8 |
| Mix ID | Conducted Tests | Number of Specimens | ||||||
|---|---|---|---|---|---|---|---|---|
| Impact Resistance | Water Transport Properties | Sodium Sulphate Attack | Impact Resistance | Water Transport Properties | Sodium Sulphate Attack | |||
| Water Absorption | Water Sorptivity | Water Absorption | Water Sorptivity | |||||
| control | ✓ | ✓ | ✓ | ✓ | 10 discs | 9 discs | 6 discs | 3 cylinders |
| R1 | ✓ | ✓ | ✓ | - | 10 discs | 9 discs | 6 discs | - |
| R2 | ✓ | ✓ | ✓ | - | 10 discs | 9 discs | 6 discs | - |
| R3 | ✓ | ✓ | ✓ | - | 10 discs | 9 discs | 6 discs | - |
| R4 | ✓ | ✓ | ✓ | - | 10 discs | 9 discs | 6 discs | - |
| R5 | ✓ | ✓ | ✓ | - | 10 discs | 9 discs | 6 discs | - |
| R6 | ✓ | ✓ | ✓ | - | 10 discs | 9 discs | 6 discs | - |
| R7 | ✓ | ✓ | ✓ | ✓ | 10 discs | 9 discs | 6 discs | 3 cylinders |
| R8 | ✓ | ✓ | ✓ | ✓ | 10 discs | 9 discs | 6 discs | 3 cylinders |
Publisher’s Note: MDPI stays neutral with regard to jurisdictional claims in published maps and institutional affiliations. |
© 2021 by the authors. Licensee MDPI, Basel, Switzerland. This article is an open access article distributed under the terms and conditions of the Creative Commons Attribution (CC BY) license (https://creativecommons.org/licenses/by/4.0/).
Share and Cite
Abu-Saleem, M.; Zhuge, Y.; Hassanli, R.; Ellis, M.; Rahman, M.M.; Levett, P. Impact Resistance and Sodium Sulphate Attack Testing of Concrete Incorporating Mixed Types of Recycled Plastic Waste. Sustainability 2021, 13, 9521. https://0-doi-org.brum.beds.ac.uk/10.3390/su13179521
Abu-Saleem M, Zhuge Y, Hassanli R, Ellis M, Rahman MM, Levett P. Impact Resistance and Sodium Sulphate Attack Testing of Concrete Incorporating Mixed Types of Recycled Plastic Waste. Sustainability. 2021; 13(17):9521. https://0-doi-org.brum.beds.ac.uk/10.3390/su13179521
Chicago/Turabian StyleAbu-Saleem, Mahmoud, Yan Zhuge, Reza Hassanli, Mark Ellis, Md Mizanur Rahman, and Peter Levett. 2021. "Impact Resistance and Sodium Sulphate Attack Testing of Concrete Incorporating Mixed Types of Recycled Plastic Waste" Sustainability 13, no. 17: 9521. https://0-doi-org.brum.beds.ac.uk/10.3390/su13179521