Article

Assessing the Plant Phytoremediation Efficacy for Azolla filiculoides in the Treatment of Textile Effluent and Redemption of Congo Red Dye onto Azolla Biomass

by
Sathish Sundararaman
1,*,
Ponnusamy Senthil Kumar
2,*,
Prabu Deivasigamani
1,
Aravind Kumar Jagadeesan
1,
Marshiana Devaerakkam
3,
Abdulrahman Al-Hashimi
4 and
Dongjin Choi
5
1
Department of Chemical Engineering, Sathyabama Institute of Science and Technology, Chennai 600119, India
2
Department of Chemical Engineering, Sri Sivasubramaniya Nadar College of Engineering, Chennai 603110, India
3
Department of Electronics and Instrumentation Engineering, Sathyabama Institute of Science and Technology, Chennai 600119, India
4
Department of Botany and Microbiology, College of Science, King Saud University, Riyadh 11451, Saudi Arabia
5
Department of Materials Science and Engineering, Hongik University, 2639-Sejong-ro, Jochiwon-eup, Sejong 30016, Korea
*
Authors to whom correspondence should be addressed.
Sustainability 2021, 13(17), 9588; https://0-doi-org.brum.beds.ac.uk/10.3390/su13179588
Submission received: 16 July 2021 / Revised: 12 August 2021 / Accepted: 19 August 2021 / Published: 26 August 2021
(This article belongs to the Special Issue Sustainable Materials for Environmental Applications)

Abstract

:
In this work, Azolla filiculoides was used for the bioremediation of a textile effluent and as a potential sorbent for the rejection of Congo red (CR9) dye from a synthetic aqueous solution. The sorbent was characterized, and a pot culture test was carried out to assess the physiological responses in a controlled environment. The response of the plants to the exposure to the emanating pollutants was subordinate. The BOD, COD, and TDS removals were found to be 98.2%, 98.23%, and 90.29%, respectively. Moreover, the dried biomass was studied for the expulsion of CR9, and the process variables were optimized. The maximum CR9 removal was 95% at the optimal conditions of 2 g/L of the sorbent dose at acidic pH. Equilibrium data for adsorption were analyzed using a two-parameter isotherm model. It was observed that the Langmuir isotherm fit with the data (R2 = 0.98) and also had satisfactory lower error values, with its maximum sorption capacity reaching 243 mg/g. The pseudo-second-order kinetics were well fitted (R2 = 0.98). The mass transfer models and the thermodynamic parameters of the system were evaluated. The regeneration studies also showed that the uptake efficacy in the fifth cycle is reduced by 20% when compared with the first cycle. The results show that the biomass was a capable sorbent for the removal of CR9.

1. Introduction

The rapid growth of industrialization has led to the disposal of various types of organic and inorganic pollutants into water bodies. Over recent decades, dyes have been used in industrial and commercial applications for coloring products such as foodstuffs, cosmetics, fabrics, pharmaceuticals, and tannery products [1]. Now, there are more than 10,000 dyes being used commercially. These recalcitrant dyes cause a threat to human health and aquatic ecosystems, and the adverse environmental impact of textile effluents has drawn significant attention from researchers [2]. The textile and dyeing industries are considered to be a major source of pollution, since the effluent they produce is characterized by excessive quantities of BOD and COD. There is an extensive use of synthetic dyes in the current scenario, but it is the pollutants that raise concerns due to their impact on the environment and their toxic effect on living things. Textile effluents are highly complex, with high contents of organic and inorganic sulfides and solids, of which the color is the most visible pollutant. The presence of color in the effluent is highly visible, even in very low-level contamination. The water sources where dyes are discharged exhibit low BOD and high COD. Furthermore, the dyes can affect the aquatic ecosystem, since they can hinder photosynthetic activity. Some of the synthetic dyes are hazardous, toxic, carcinogenic, and non-biodegradable and are more persistent because of their aromatic structure [3]. Consequently, the expulsion of dye from wastewater turns into a noteworthy test in treating wastewaters by ordinary techniques [4]. Currently, many techniques are utilized for wastewater treatment, including mechanical, thermal, and chemical oxidizing processes, as well as the use of reducing agents and physical and biological methods (bacteria, fungi) [5]. Phytoremediation alludes to innovations involving the utilization of living plants to treat hazardous wastewater. Phytoremediation attempts to use plants for the expulsion of toxins as natural and inorganic wastes to protect the environment [6]. Phytoremediation is a savvy approach of remediation that exploits the capacity of plants to concentrate the pollutants and to process them in their tissues [7]. Adsorption processes are also the most common processes used in the effluent treatment process. Eco-friendly, low-priced adsorbents [8] are used to eradicate pollutants from wastewater. Biosorbents have also taken on a great significance in designing sorbents for wastewater treatment. Based on their biological origin (or where they are derived from), these materials have more similar reactive groups than those found on ion exchange or chelating resins [9]. The present objective was to utilize the waste biomass Azolla filiculoides as an adsorbent. The importance of this examination is to create a discourse about the variety in the system of sorption and the enhancement of system parameters. Azolla is small and floats but can be abundant and form large mats, and it may, in fact, restore nitrogen from the air by using symbiotic cyanobacteria [10]. It can survive in water, where optimum growth has been observed at temperatures of 25–35 °C. This has led to a plant that can easily colonize areas and grow at great speed, doubling its biomass every two to three days. Azolla shows a remarkable capacity to concentrate heavy metals and toxins or sewage water, and it is also used for fish, poultry, and cattle as fodder. Moreover, it can also be used for the production of hydrogen fuel and the production of biogas [11]. There are currently more than 100,000 dyes and colorants commercially available, and more than 7 × 10⁵ tons are produced annually worldwide. Their presence in effluents is a cause for great concern because they change the spectrophotometry of wastewater from industries and textiles. Upon reduction of azo groups, aromatic amines are produced, which are more toxic compared to the original compounds. Further azo dyes are designed to resist breakdown attributable to time and exposure to sunlight, water, soap, and other parameters such as bleach and perspiration. Once their metabolites and by-products come into contact with surface effluents such as lakes and rivers, they can cause carcinoma, as well as damage to the nervous system and urinary systems of living beings. In this study, Azolla was grown on a textile effluent to analyze the percentage deduction of BOD and COD. The adsorption ability of Azolla was estimated for the treatment of CR9, while the materials were characterized using SEM, FTIR, and EDX. For a clear understanding of the biosorption dynamics in relation to time, the calculated results were analyzed by employing intraparticle diffusion and kinetics models [12]. The influences of process parameters and isotherm studies were examined, and the efficiency of the adsorbent was determined.

2. Materials and Methods

2.1. Chemicals and Reagents

Glassware was washed with a detergent solution [13] and rinsed with chromic acid solution (10% potassium dichromate in 25% sulfuric acid) followed by a demineralized water wash. Glassware was dried and sterilized in an autoclave at 121 °C at 15 psi for 20 min. Azolla filiculoides was collected from the Aduthurai Rice Institute. The chemicals were of AR grade and high purity. Effluents were collected from a common effluent treatment plant (CETP) in Iyyampet, Kanchipuram, and stored at 4 °C for further analysis.

2.2. Physiochemical Methodology for Estimation of Properties

2.2.1. Estimation of Phosphate and Sulfates

The phosphate level in the water was estimated by a UV spectrophotometric method. An amount of 20 mg/L of phosphate standard solution was produced by dissolving 0.877 g of KH2PO4 in 0.8 L of distilled water and making it up to 1 L. For the detection of phosphate, conditional reagents were prepared by mixing appropriate quantities. Dilute H2SO4 and some conditional reagents were added to a known quantity of a wastewater sample using phenolphthalein as an indicator. The absorbance of each sample at 880 nm was measured, using the reagent blank as the reference solution.
The sulfate concentration in the sample was estimated using a spectrophotometric method. An amount of 4.438 g of sodium sulfate in 0.5 L of distilled water was used as a standard solution. Amounts of 5 mL of the conditioning reagent and 10 mg of barium chloride were added and made up to 100 mL. The solutions became turbid and were then measured with a UV–visible spectrometer at 420 nm. The sulfate concentration in the wastewater sample was determined with reference to the graphical representation obtained for the standard solutions.

2.2.2. Estimation of TDS and TSS

TDS and TSS in the wastewater sample were determined by a gravimetric method. A clean Petri dish was subjected to a temperature of 100 °C in an oven, cooled, and then weighed. The collected effluent sample was filtered into a clean conical flask using a pre-weighed filter paper. A known volume of the filtrate was poured into the Petri dish and heated in an oven at a temperature of 180 °C. The obtained residue was then cooled in the desiccator and weighed to a constant weight.
The effluent sample was filtered through a pre-weighed filter. The filter was dried in the oven at a temperature of 105 °C overnight. The increase in mass of the dry filter paper was recorded and used for calculating TSS.

2.2.3. Estimation of Chlorides

The concentration of chloride ions in the sample was determined by using Mohr’s method. The Mohr method uses chromate ions as an indicator in the titration of chloride ions with a silver nitrate standard solution. The concentration of chloride in the wastewater was determined from the stoichiometry and moles consumed at the end point.

2.2.4. Estimation of Oil and Greases

A partition gravimetric method was used to determine the oil and grease in the samples. This was carried out through an extraction technique with hexane as a solvent. The sample and the solvent were poured into a separating funnel. The aqueous layer was collected through the top of the separating funnel while the organic phase was poured into a conical flask. The solvent extracts were collected together and evaporated to dryness at ambient temperature. The difference in weight is equivalent to the oil and grease in the sample.

2.2.5. Estimation of BOD and COD

BOD is basically determined by the difference in the dissolved oxygen (DO) levels of samples prior to incubation and after 5 days of incubation. The BOD of the sample was determined by the dilution method. Reagents such as phosphate buffer, magnesium sulfate, calcium chloride, ferric chloride, sodium sulfite, and ammonium chloride were added to 10 L of distilled water as the dilution water. Two 300 mL amber bottles were completely filled with the diluted water. One of the bottles was incubated at 20 °C for 5 days.
COD of the sample was obtained through the open reflux method. This was carried out by the addition of mercuric sulfate and sulfuric acid to the sample in a reflux flask. On cooling, the obtained solution was reacted with potassium dichromate and a known volume of sulfuric acid. The solution was refluxed for 2 h and cooled. The obtained solution was diluted to twice its volume and cooled, and excess K2Cr2O7 was determined by titrating with ferrous ammonium sulfate using the ferroin indicator.

2.2.6. Total Metal Analysis

Samples were digested by nitric acid, and the digests were analyzed using atomic absorption spectrophotometry. Calibration curves were plotted for each of the metals separately, by running various concentrations of standard solutions at specified wavelengths. A reagent blank sample was also analyzed. The concentration of the metal was obtained from the difference between the readings of the samples and that of the blank [14].

2.3. Phytoremediation

A. filiculoides was taken from the pots and washed with distilled water. Initially, Azolla was weighed at about 5 g and was allowed to grow in wastewater. The growth of Azolla was observed daily. After 20 days, the grown Azolla was collected, air dried, and then positioned in a dehydrator for three days and dried in an oven for 4 h at 80 °C [15]. The dried biomass had been powdered and preserved in an airtight container for further studies. The morphology and nature of the adsorbent were characterized.

2.4. Batch Experiments

CR9 decolorization tests were administered in a 100 mL sample of pH 7 ± 0.2 which was adjusted using 1 M sodium hydroxide and 1 M hydrochloric acid solution [16]. In each flask, the sorbent was charged and kept for agitation. At regular time intervals, the aliquots were drawn, which were centrifuged to separate the biomass. The supernatant was assessed for the removal of color by measuring absorbance at 530 nm by using a UV–Vis spectrophotometer. The decolorization rate was determined from the difference between the initial and the final absorbance [17].

3. Results and Discussion

3.1. Phytoremediation Studies

The effluent was kept at the atmospheric temperature, humidity, and sunlight for a period of 20 days, and it was observed daily. The Azolla growth can be observed in the effluent from the 10th day; before the 10th day, some of the Azolla decomposed, thus reducing the mass, but after the 10th day, we can observe the spores spreading from the Azolla, which is cause for sexual reproduction (Figure 1).
On the 20th day, the growth was significant, and the spores were still visible, meaning growth was continuously happening, and the change in the turbidity of the effluent could be observed by the naked eye [18]. The wet biomass of Azolla after 20 days was about 25 g. The leaves and roots of Azolla are visible in Figure 2.
The roots were healthy, and the growth of Azolla gradually increased in the tannery effluent. The tannery effluent before and after phytoremediation was analyzed to assess the change in properties. The results are summarized and tabulated in Table 1. The BOD, COD, and TSS removals were found to be 98.2%, 98.23%, and 90.29%, respectively. The removals of sulfates and phosphates were found to be 83.68% and 79.67%, respectively. On average, the removal efficiency of pollutants from the effluent was found to be more efficient by the phytoremediation technique (Figure 3).

3.2. Adsorption Studies

3.2.1. Sorbent Characterization

The morphology of the sorbent was studied by a scanning electronic microscope (SEM) (Evo/LS15) [19], displaying porous and fibrous voids in the surface of the prepared adsorbent. These active sites enhance the adsorption of the dye. After the adsorption experiments, the SEM image confirms that the pores were occupied by the solute molecules, showing the capacity of Azolla for the sorption of CR9 dye from an aqueous feed (Figure 4).

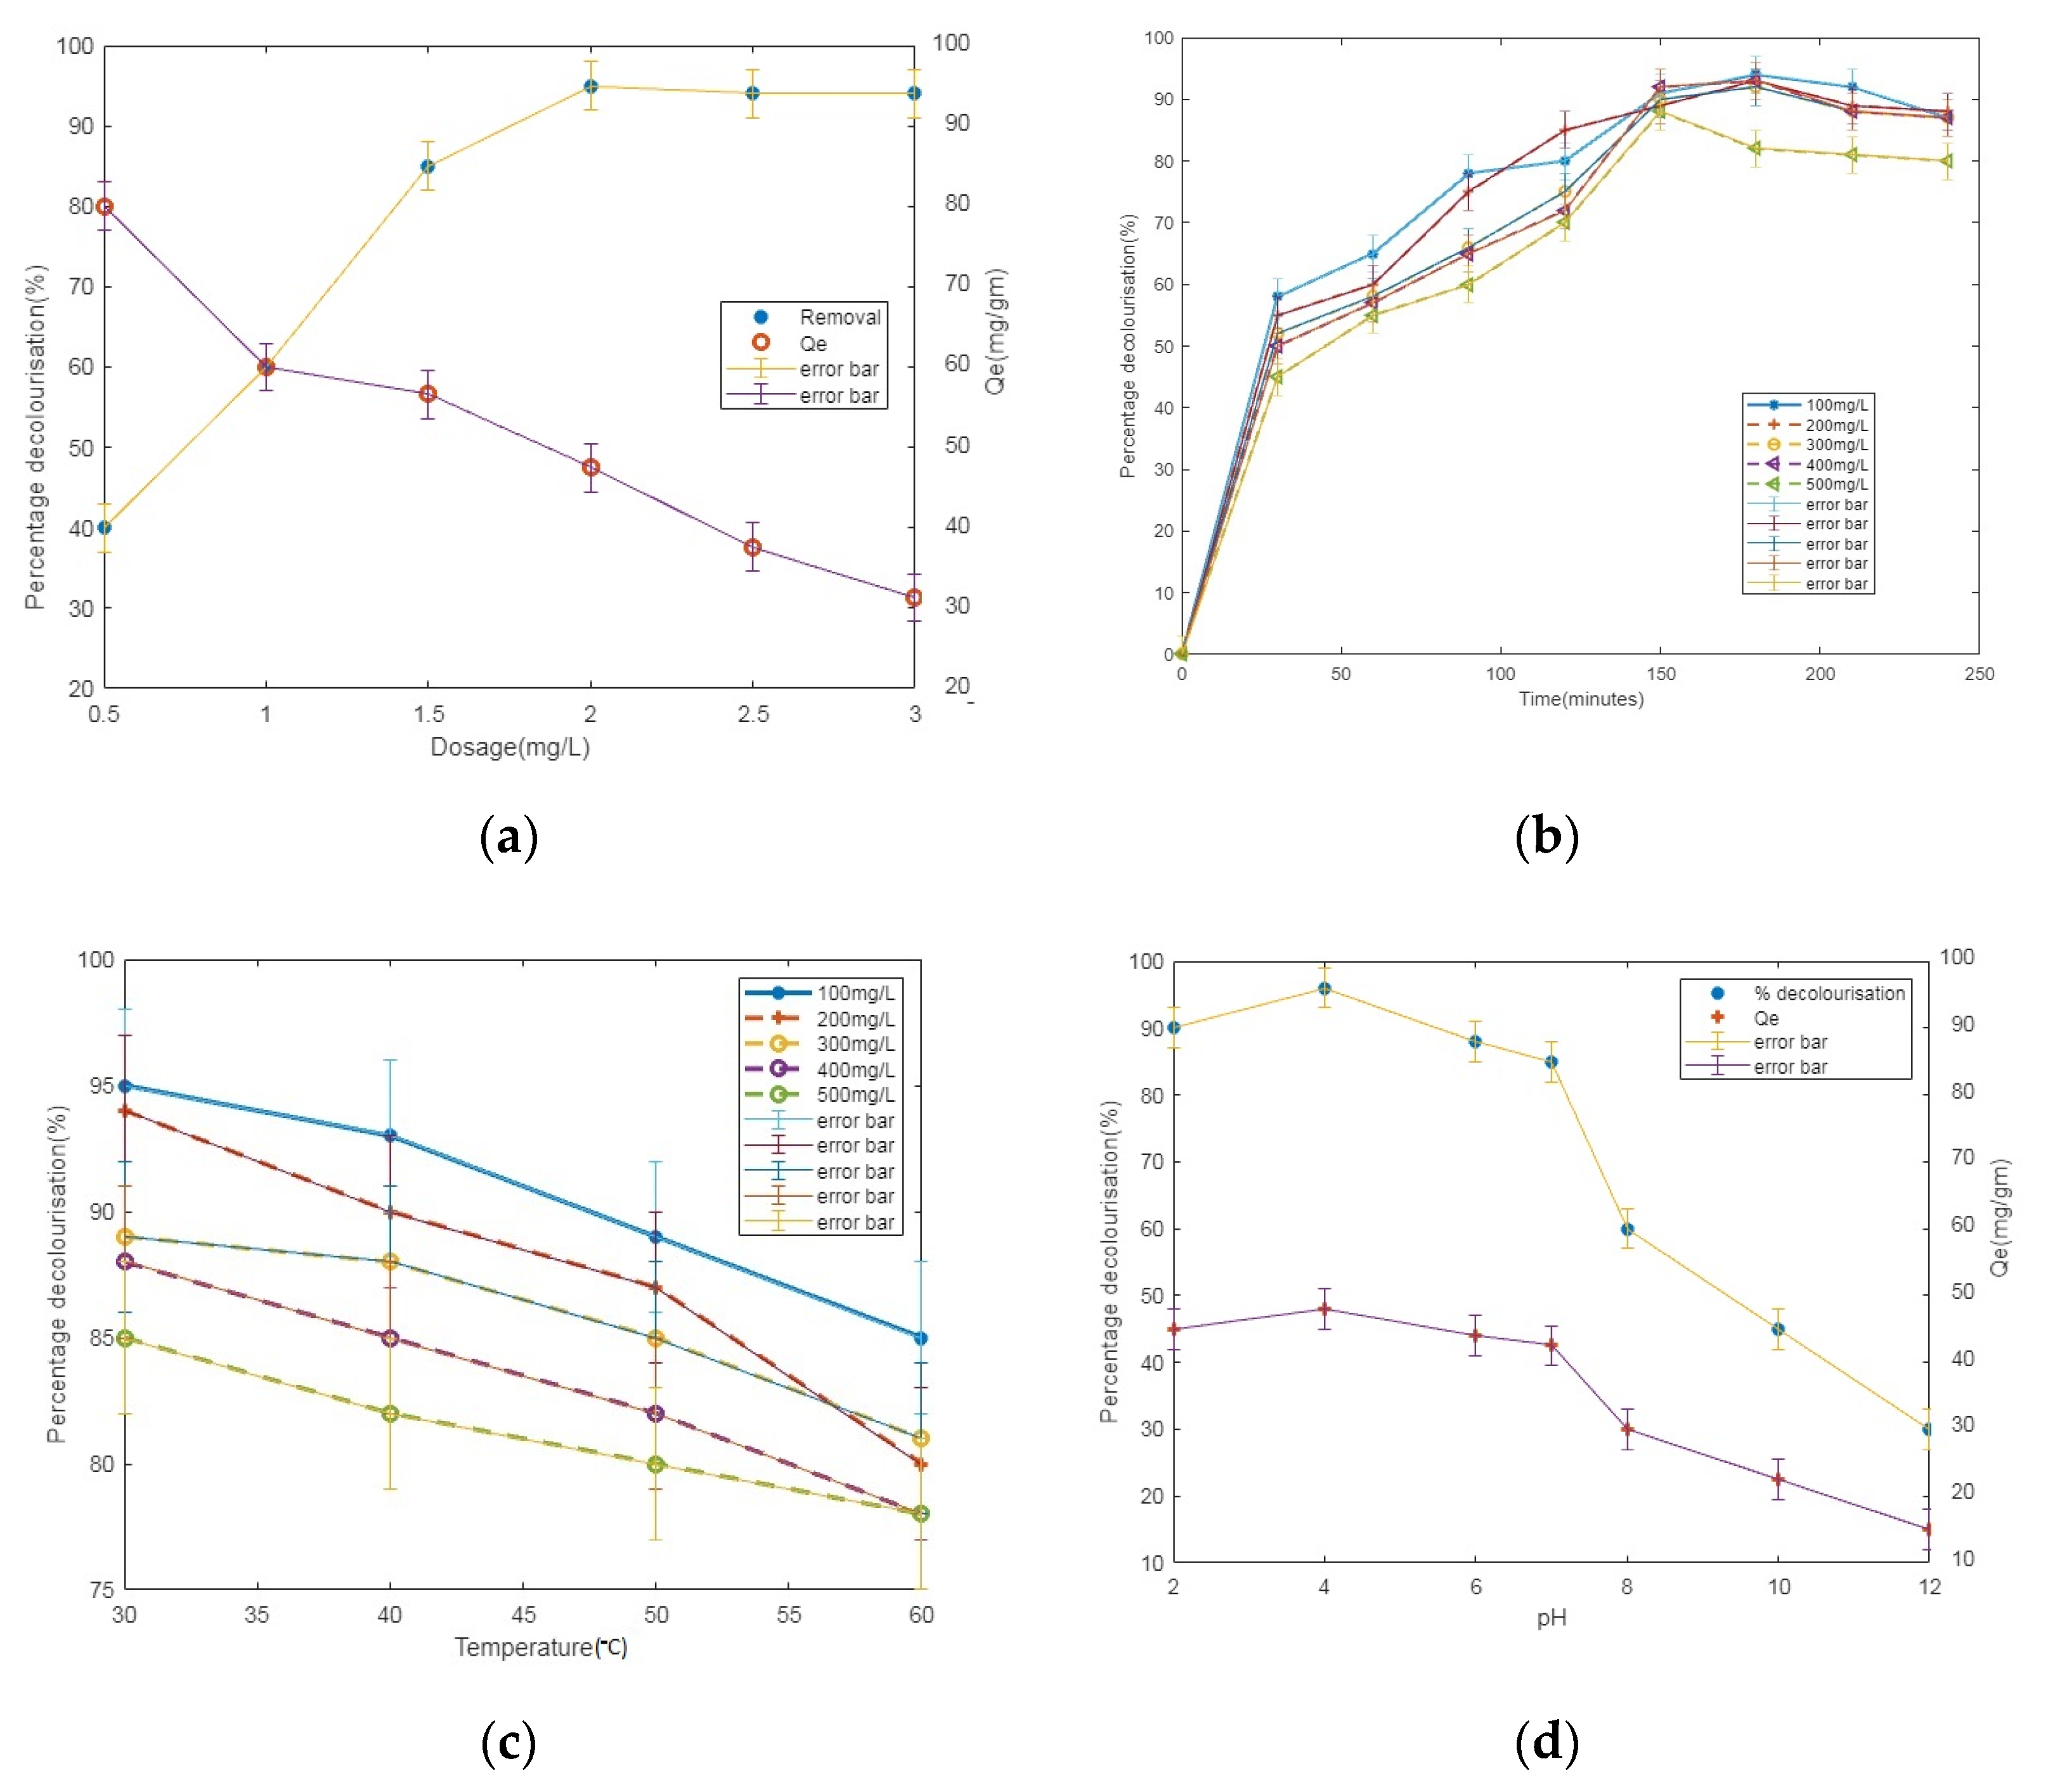
3.2.2. Effect of Process Variables

The biosorption equilibria of the CR dye were tested in this study using the dried mass of Azolla as a biosorbent. Figure 5a depicts the impact of the Azolla dosage on the sorption of CR9. Figure 5a shows that the expulsion of CR9 became elevated with the rise in the sorbent dose. However, the adsorption capacity (qe) was decreased. The effect of the Azolla dosage (2.0 g/L) displayed adequate transferable sites for the removal of CR9. Further, it was noticed that there are no significant changes upon further addition of Azolla biomass. The quantity of vacant regions enhances with the increments in the adsorbent dosage which encourages the sorption of the CR dye. Nevertheless, the rate of adsorption diminishes after a certain point, and this may be because the increase in the dosage might cause aggregation that decreases the available vacant sites for the dye.
The simultaneous impact of the initial concentration on the elimination of the CR dye was studied in the range of 100 to 500 mg/L (Figure 5b). The decolorization level was elevated from 90.68 ± 3% to 95.15 ± 3% with increments in the concentration of CR9 from 100 to 200 mg/L. Additional expansion in the concentration led to a decrement in the percentage of CR9 decolorization from 95.2% to 80% owing to the substrate inhibition [20].
Figure 5c represents the impact of the system temperature, where an increase in the temperature results in a decrease in decolorization from 95% to 85%. An enhancement in the rate of color was observed in the range of 30–35 °C. This represents the process of adsorption being exothermic [21]. According to Le Chatelier’s principle, the lower temperature favors elevated removal rates compared to the higher temperature.
The adsorption of the CR dye onto the dried mass of Azolla was studied at various pH ranges from 2 to 12. An amount of 200 mg/L of the sample was investigated at different pH values and examined at 303K. An amount of 0.1 N of HCl/NaOH [22] was used to adjust the pH of the sample. The results demonstrate that the optimum pH was acidic. The rate of decolorization [23] decreased for strongly alkaline pH values (Figure 5d). Since CR9 is an anionic dye at pH 2 to 4, an electrostatic attraction exists between the Azolla and CR9. If the system reaches alkalinity, the removal rate decreases due to the electrostatic repulsion [24].
The point of zero discharge was evaluated for Azolla filiculoides, and the inferences depict that the PZC was 6.2. Such factor can be utilized to determine the impact of the pH on CR dye adsorption. The convergence point of the plotted curve at which the change in pH reaches towards zero denoted the PZC of Azolla filiculoides [25]. The intersection point was examined to be 6.2, which predicted that the biosorbent surface occluded a positive ion accumulation which thereby attracted CR9 on its surface (Figure 6).

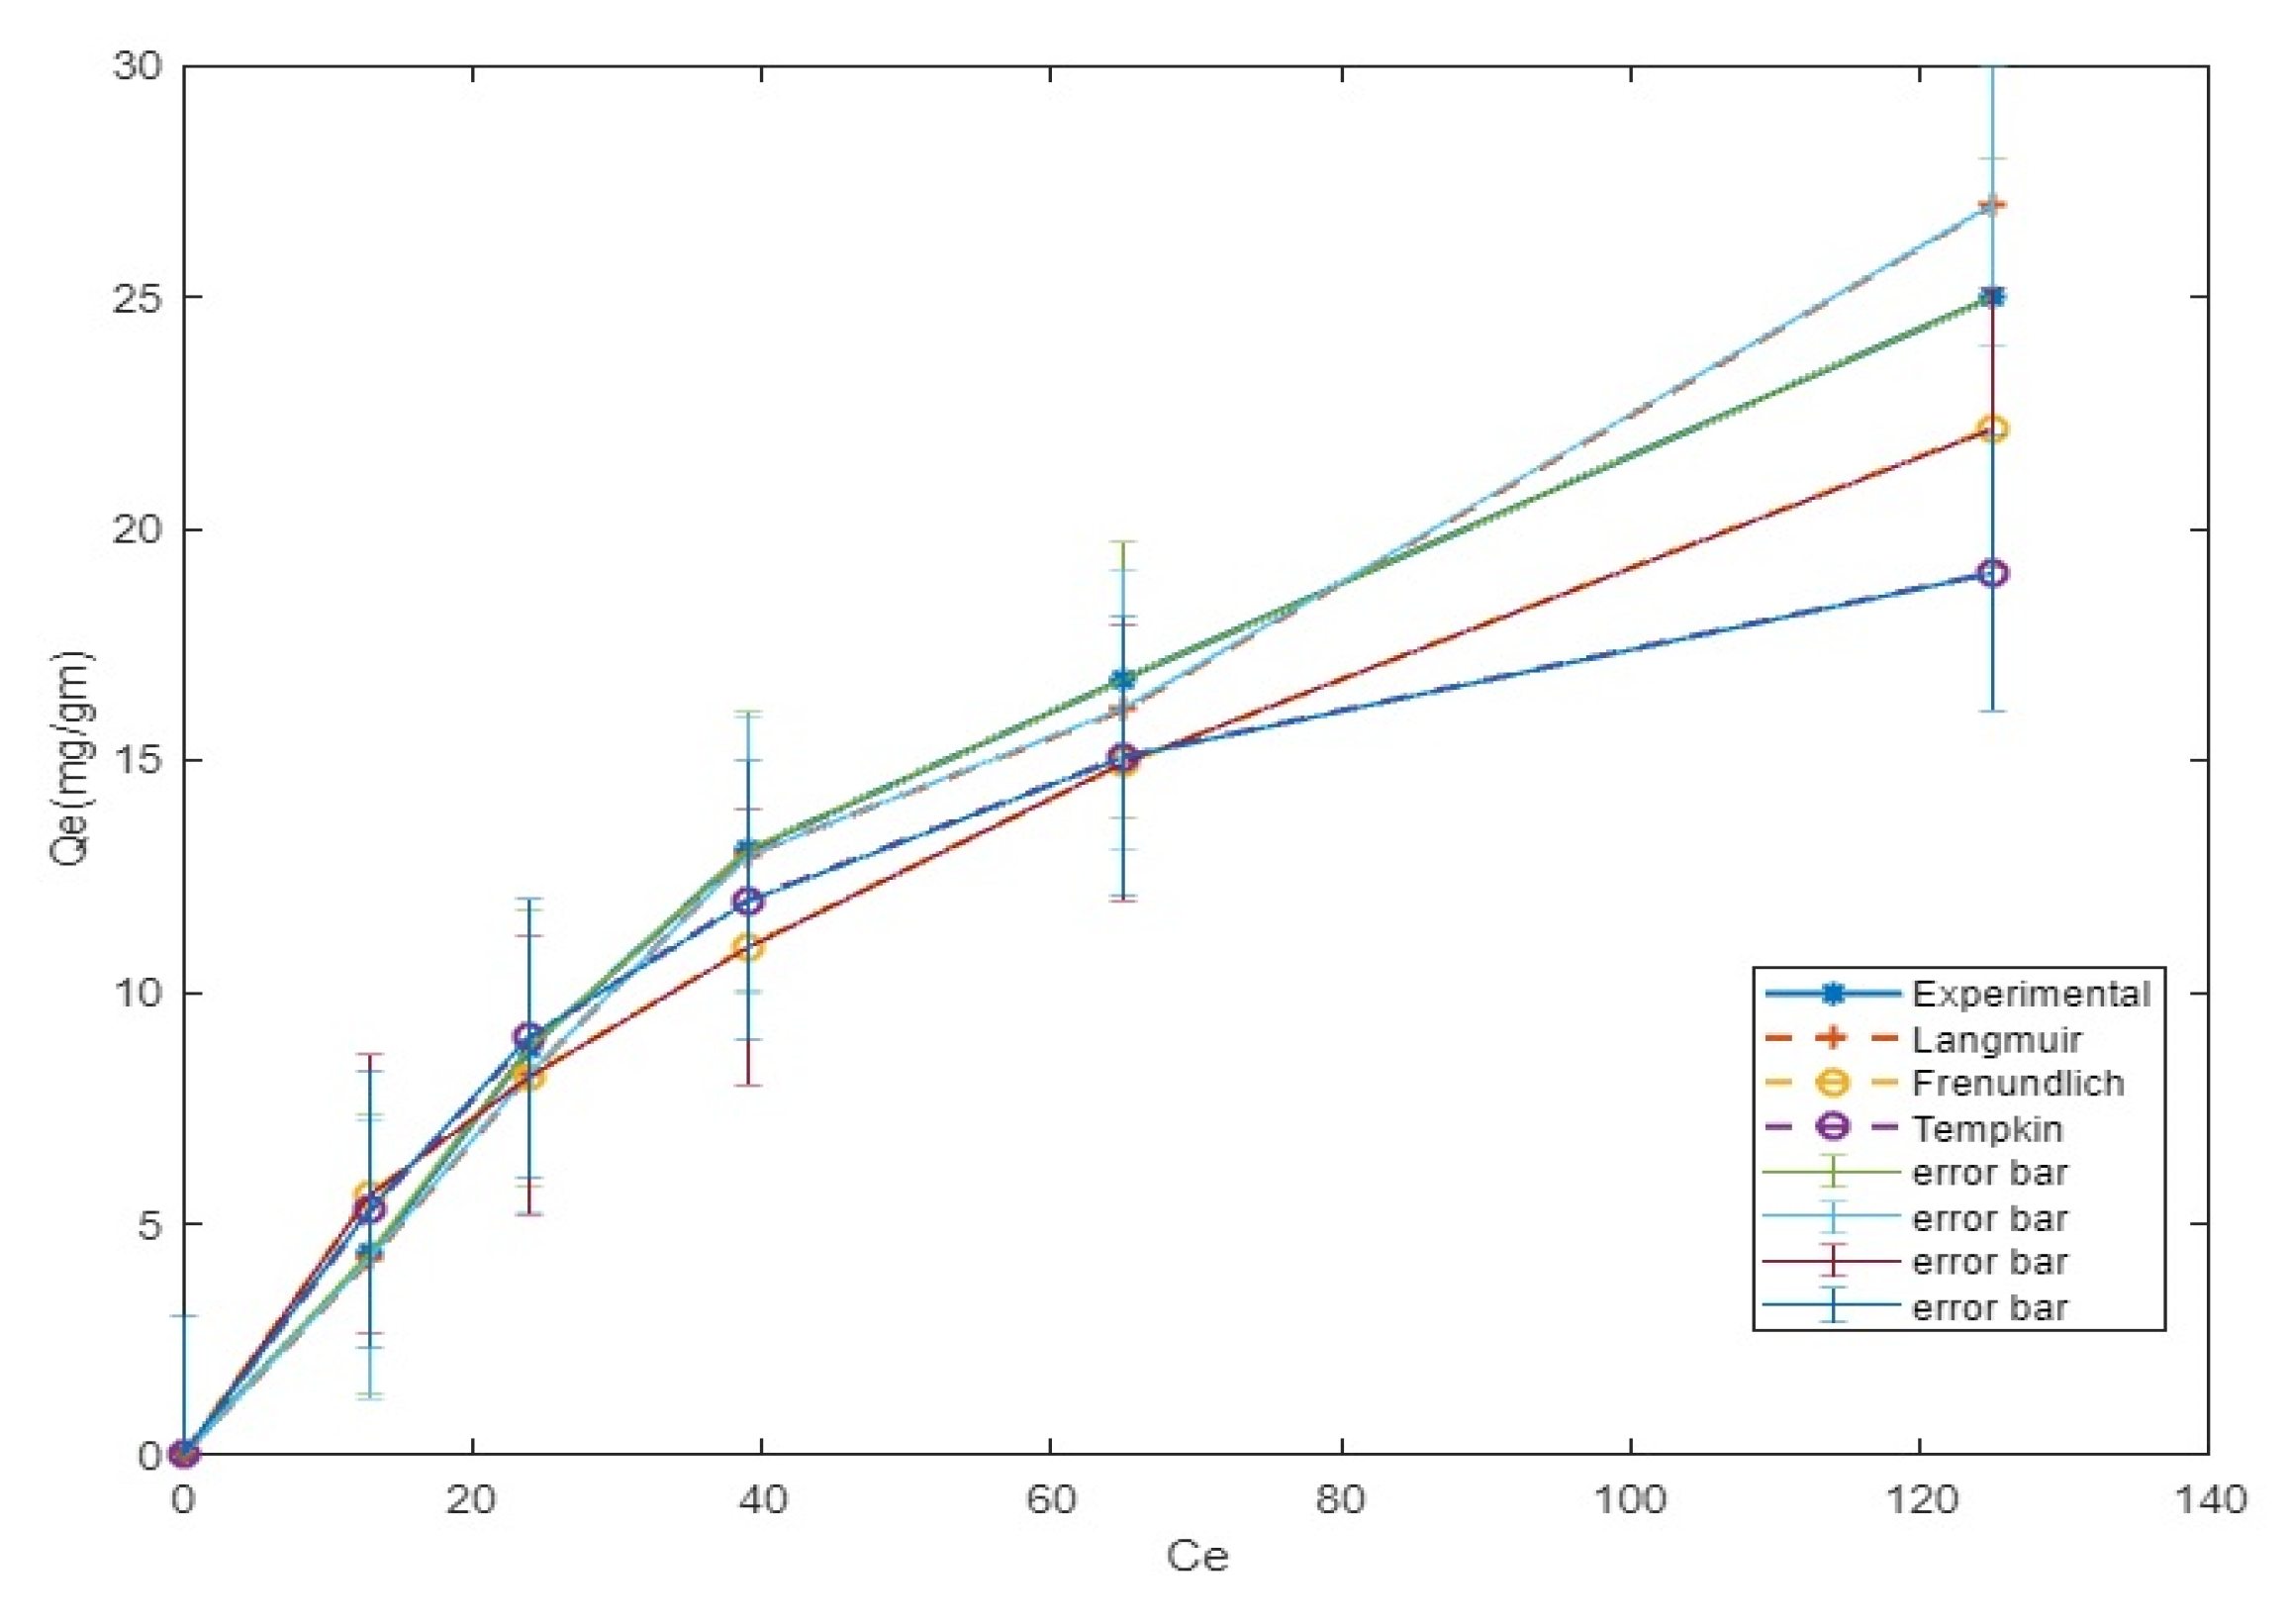
3.3. Adsorption Isotherms

CR9–Azolla interactions were assessed using isotherm studies. Two-parameter models (Langmuir/Freundlich/Temkin) were utilized to calculate the adsorption equilibrium [26]. The Langmuir model explains monolayer adsorption, and it can be predicted based on the separation factor [27].
q e = q m K L C e 1 +   K L C e
  R L = 1 1 + K L C i
q e =   K F C e 1 / n
                                                        q e = B ( ln C e   + ln A )
where RL is the separation factor, KL is the Langmuir adsorption constant, Ci is the initial concentration of CR9, Ce is the equilibrium concentration of CR9 in solution, KF is the Freundlich adsorption constant, n is the adsorption intensity, A is the equilibrium binding constant (L/g), and B= RT/b where b is the Temkin constant (J/mol).
The RL values are used to envisage whether the process is favorable or not. The RL values determined were between 0.56342 and 0.205, which portrayed a favorable adsorption of CR9 onto the biomass adsorbent, where 243.9 mg/g for the qm value was obtained, which is very close to the investigated qm. Anyhow, the R2 value of 0.98 showed the best fitting of this isotherm to the trial data. The Freundlich model describes the heterogeneous adsorption mechanism. The Freundlich adsorption constant (n) depicts the sorption nature. The value obtained for n was 1.656, which highlights the physisorption. The positivity of ‘b’ represents the adsorption being exothermic (Figure 7).
Different error functions such as the root mean square error (RMSE), chi-square, and R2 error were calculated for the optimization of the isotherm models. The smallest values of the error functions were taken as the criteria for the selection of the best fitting model as they had a minimum error distribution between the experimental and predicted values.
RSME = 1 n 1 i = 1 n ( q e predictedq e )  
  Chi   Square =   χ 2 = i = 1 n ( q e Predicted   q e ) 2 Predicted   q e    
R 2   Error = SSR SST = Sum   of   Squares   Regression Sum   of   Squares   Total
In these equations, n represents the number of observations in the isotherms. In order to identify the best fitting adsorption model, nonlinear models were considered. Although the degrees of determination values were close to 0.9 (Table 2) in the isotherm models, the error functions for the three models varied considerably. Lower values of error functions were obtained for the Langmuir isotherms. The results also suggest that the R2 values provide us with an indication about the better fitting Langmuir model.

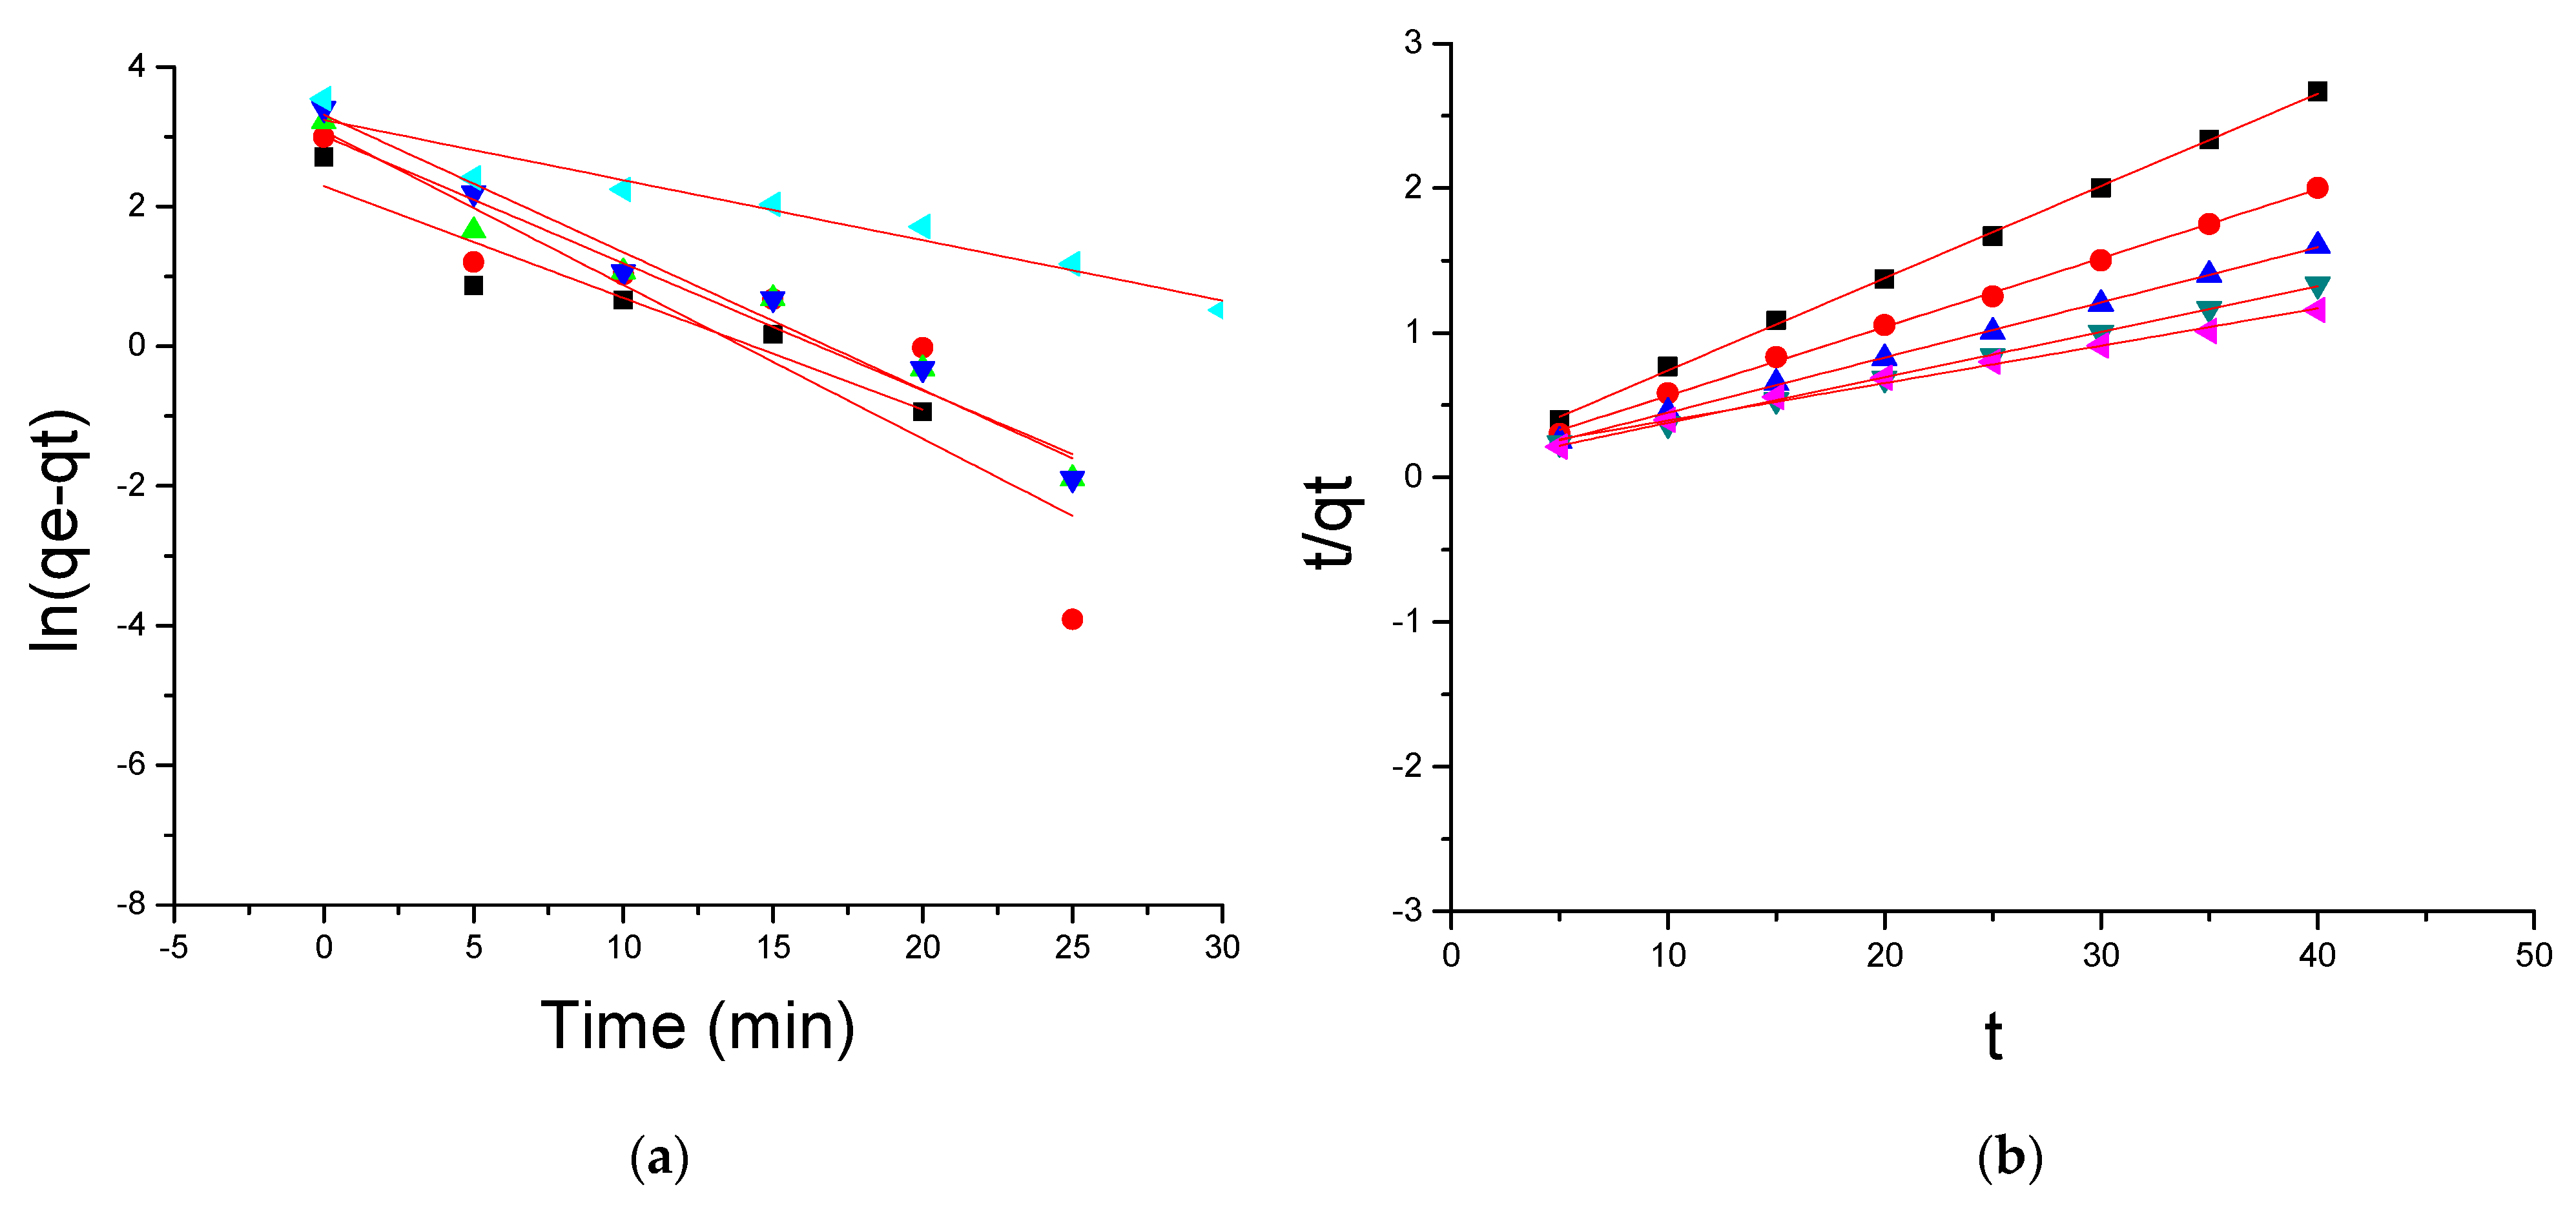
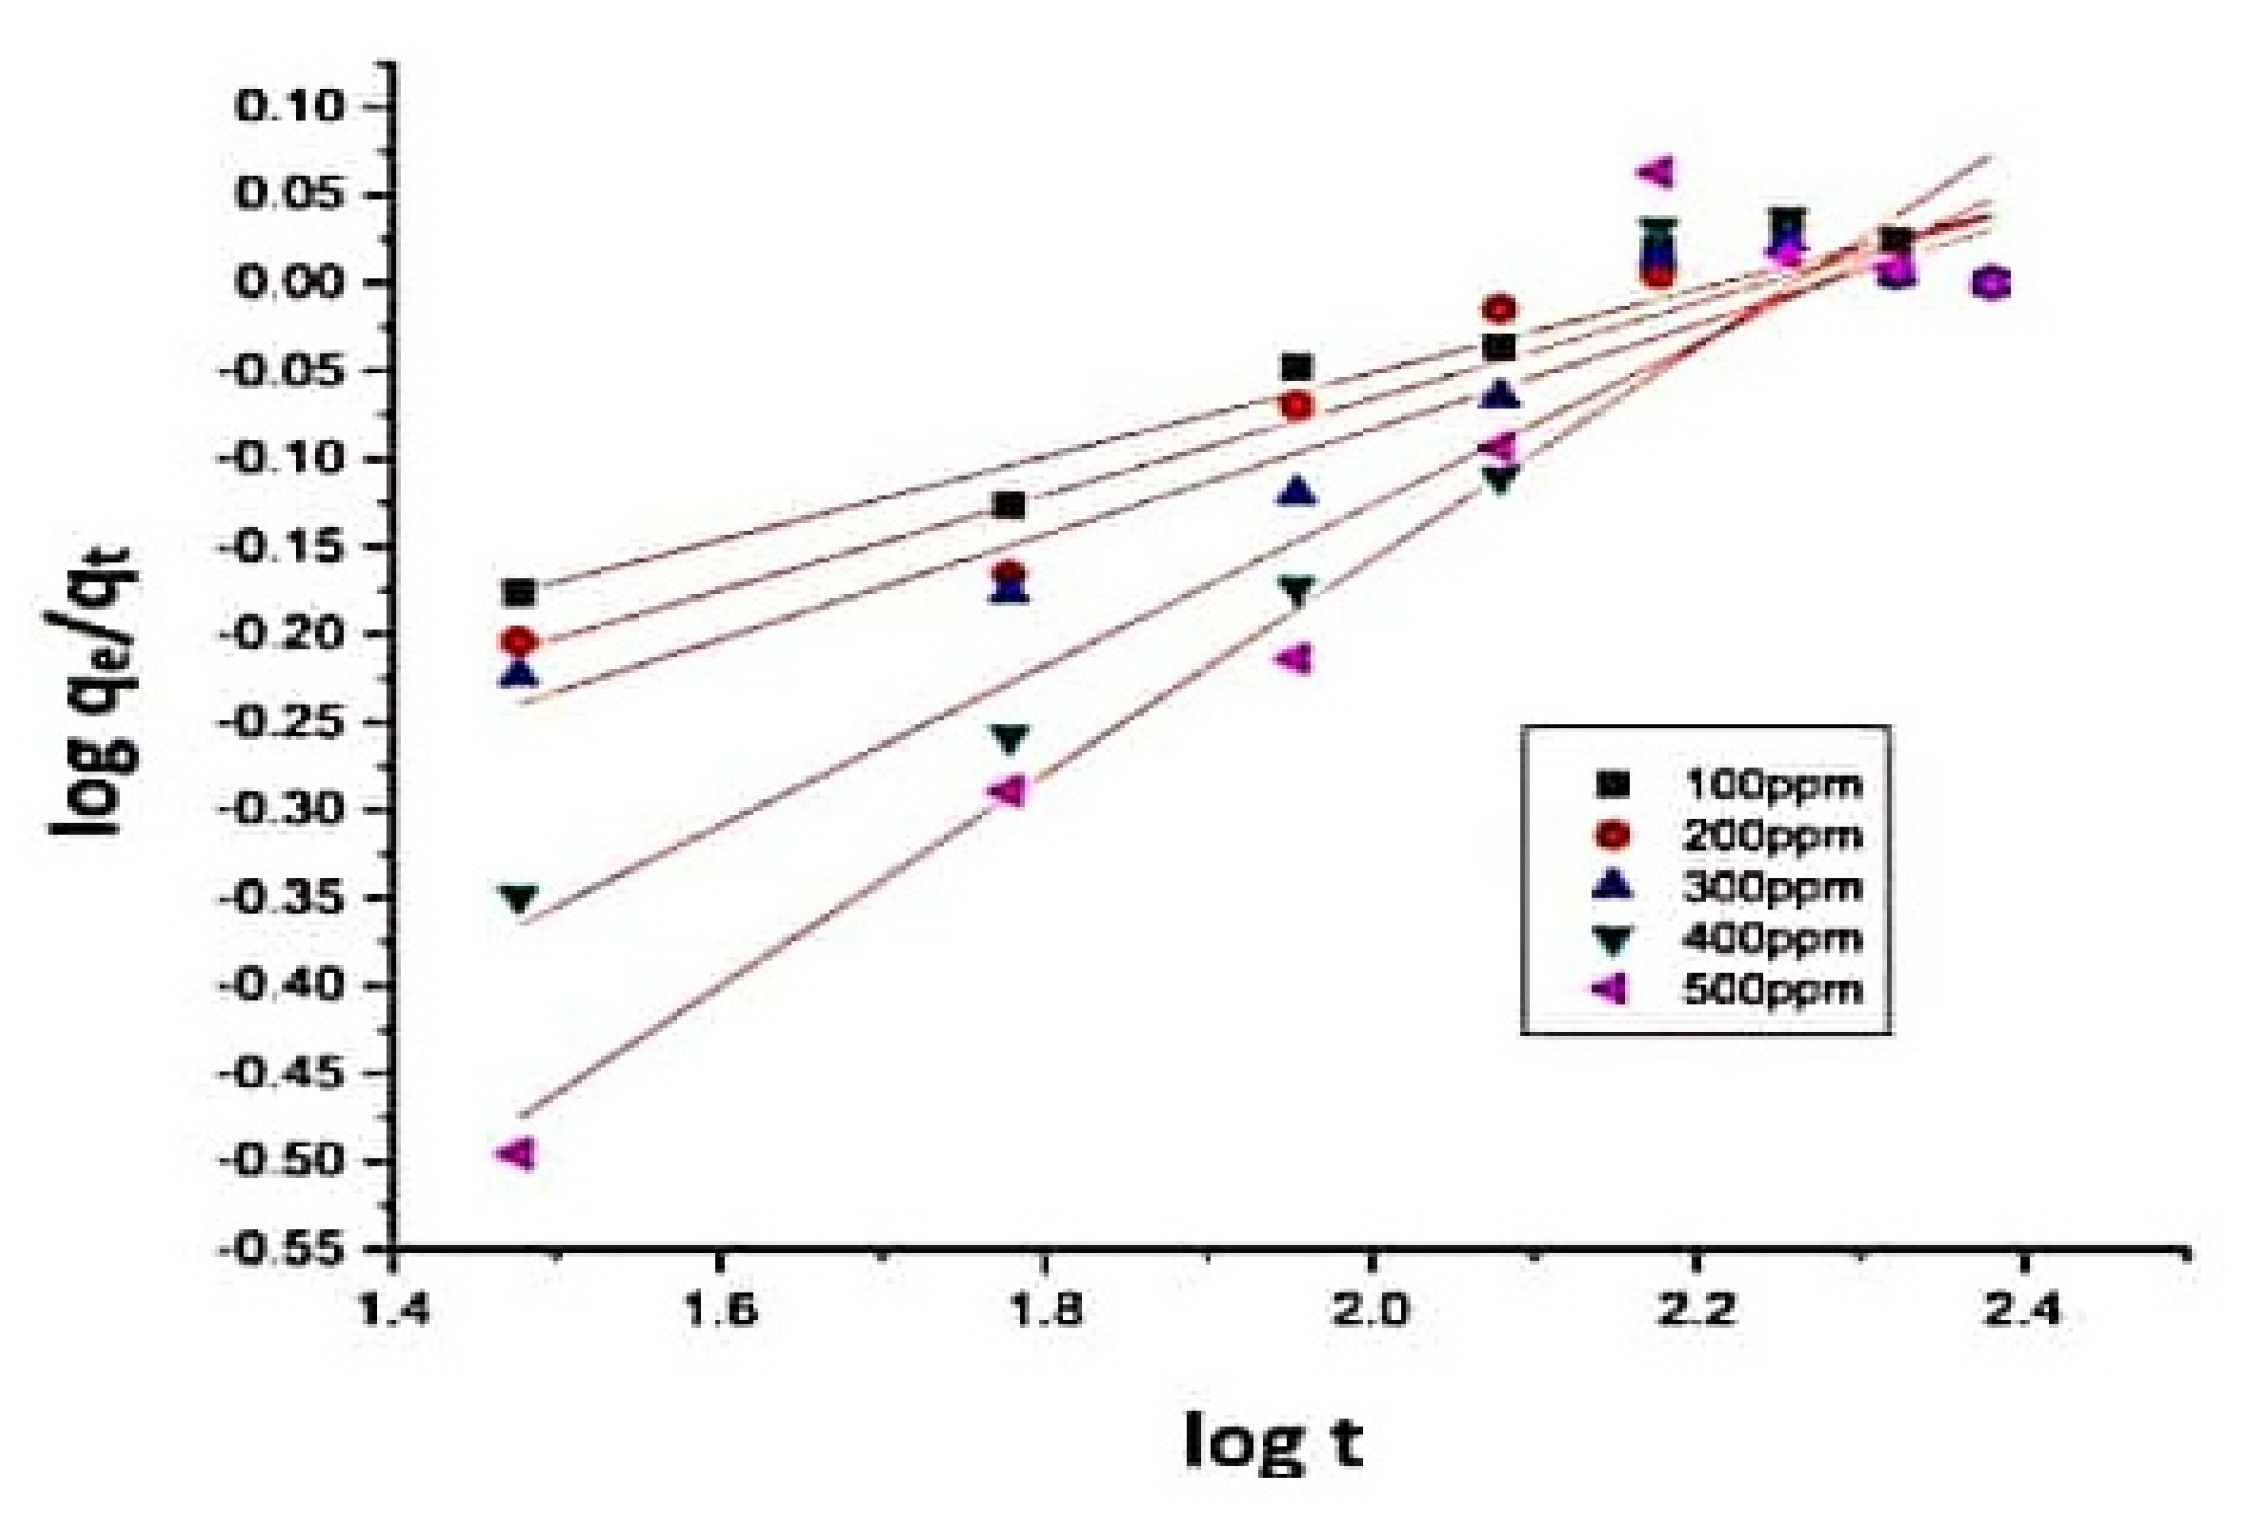
3.4. Adsorption Kinetics

The kinetics were examined to assess the rate and mechanism of adsorption [28].
The linear form of the pseudo-first-order adsorption kinetic equation is
ln ( q e q t ) = ln q e   k 1 t
The linear form of the pseudo-second-order adsorption kinetic equation is
t q e = 1 k 2 q e 2 + t q e
where qt—amount of dye removed at any time ‘t’ (mg/g); qe—equilibrium adsorption capacity (mg/g); and k1 and k2—rate constants. As it can be seen in Table 3, k1 and k2 decremented with an increment in the CR9 concentrations [29]. The elucidated values of qe were well matched with the qe values predicted experimentally [30]. The pseudo-second-order kinetic model fits the adsorption process for CR9 on Azolla better than the pseudo-first-order kinetic model (Figure 8a,b) [31].
The rate constants and the kinetic parameters were determined and are listed in Table 3. The pseudo-second-order kinetics better described the experimental data with an R2 of 0.98. The equilibrium rate constant for the pseudo-second-order model was 0.0102 g/mg min. This reveals that the adsorption rate (k2qe2) increases with an increase in the initial CR9 concentration. When there was a lower concentration of CR9 in solution, the chance of collision was lower between the species, hence the faster sorption onto the active sites of the adsorbent [32].

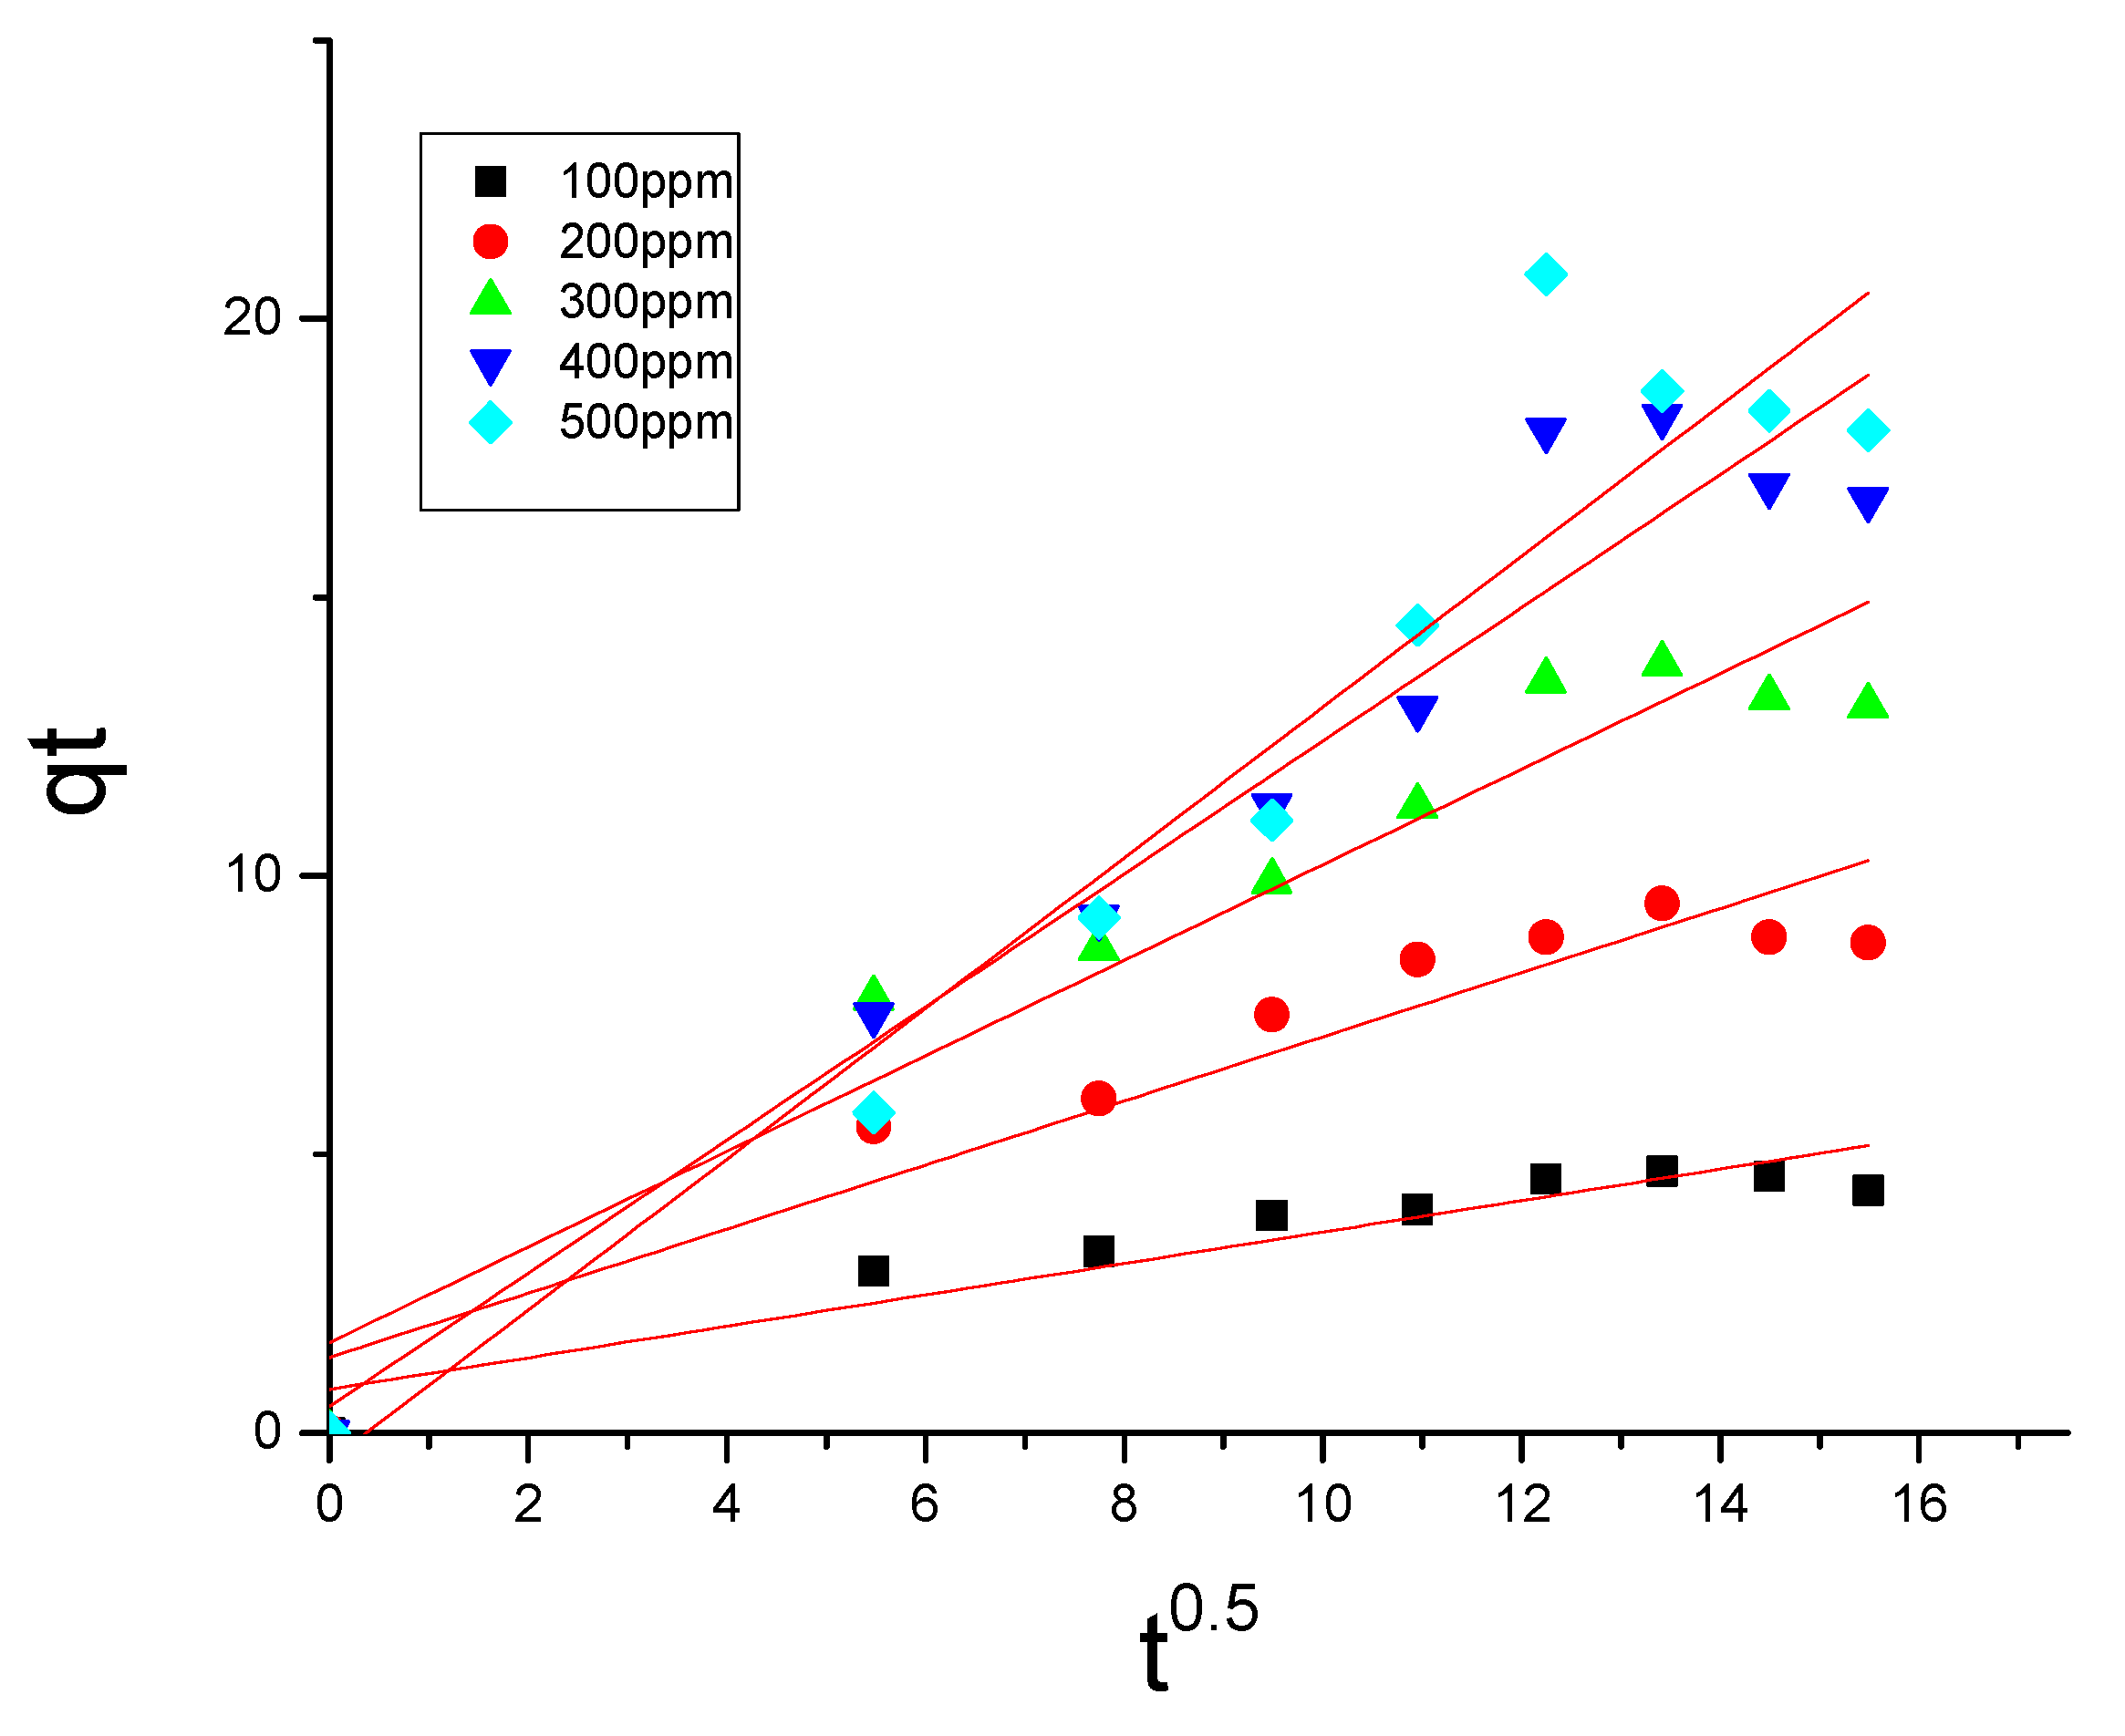
3.4.1. Weber and Morris Model
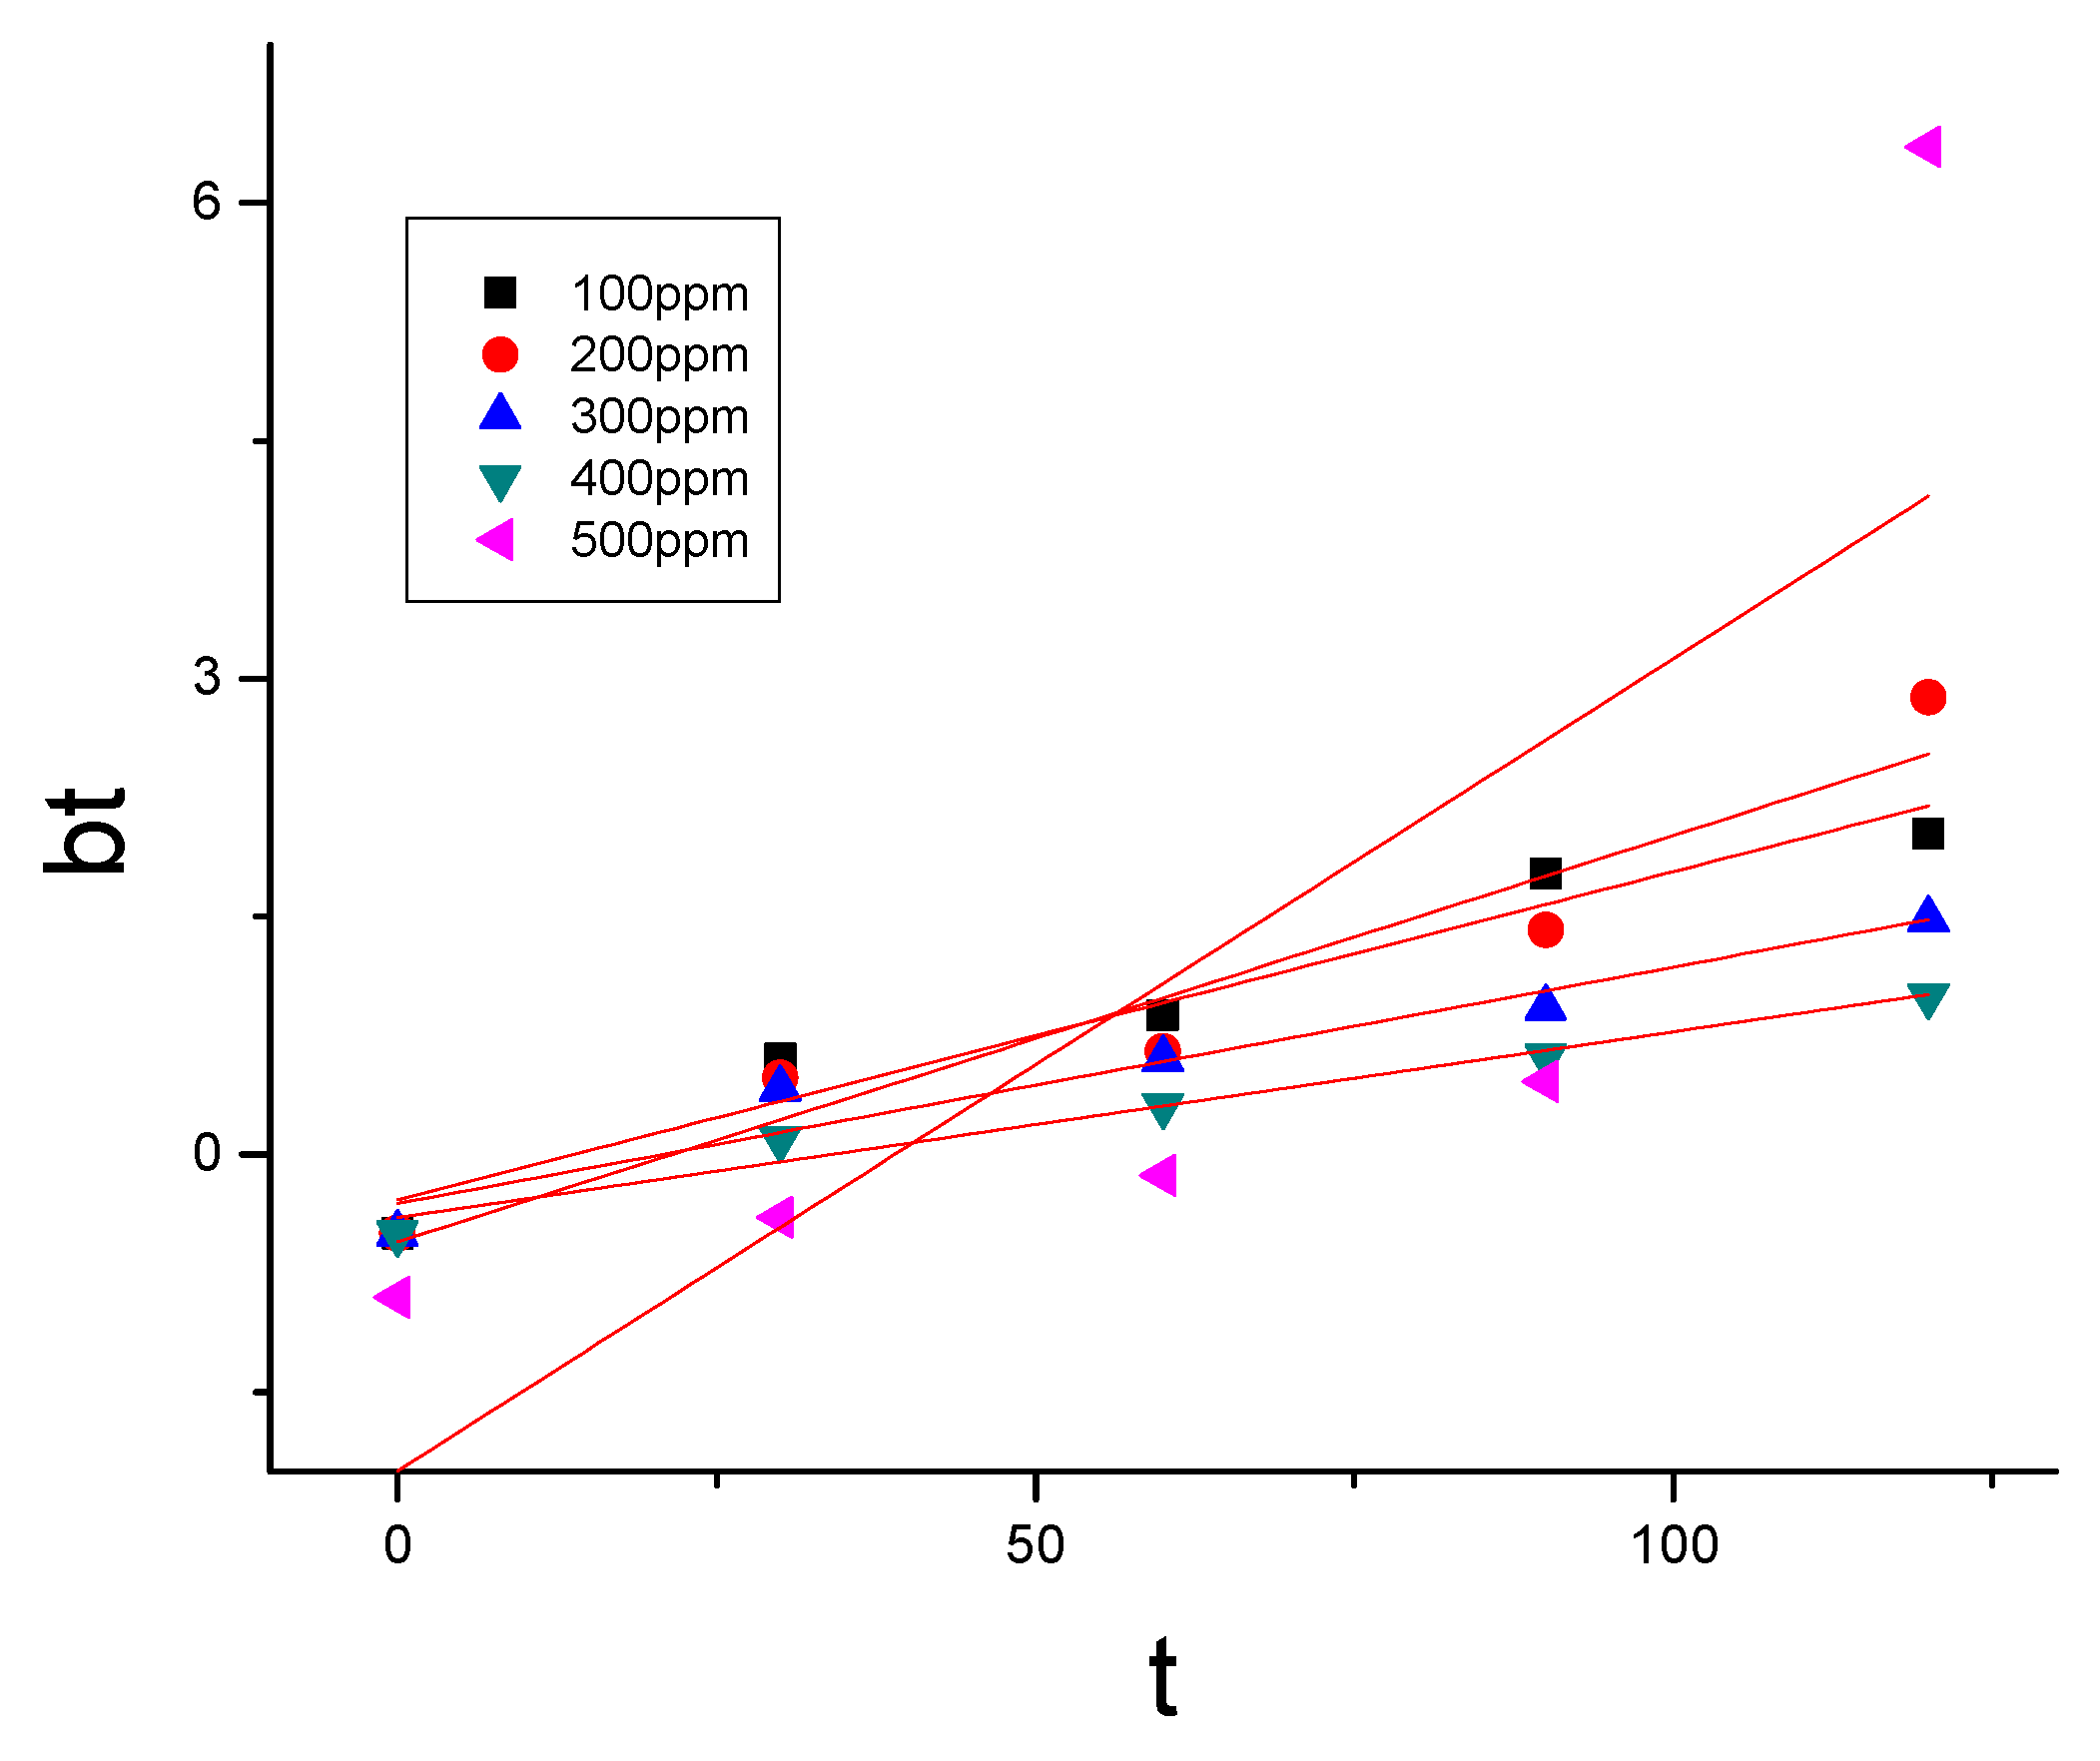
Biosorption of CR9 occurs mainly through interactions such as complexation, adsorption by physical forces, precipitation, and entrapment in inner spaces [33]. This can be enlightened by the fact that decolorization by Azolla involves several complex mechanisms. CR9 is first adsorbed on the Azolla biomass surface, and the second stage, intraparticle diffusion, occurs.
The intraparticle diffusion is
q t =   k i t 0.5 +   C
where ki is the diffusion rate constant (mg/g min0.5). ki was determined through the slope evaluated in the qt vs. t0.5 plot. Figure 9 shows that the CR9 adsorption follows three stages. The primary linear segment showcases the boundary diffusion. The next segment represents intraparticle diffusion. The final linear segment demonstrates the equilibrium between adsorption and desorption. It was concluded that the adsorption processes follow both intraparticle and film diffusion [34].

3.4.2. Boyd Plot

The kinetic expression is given by
B t = 0.4977 ln ( 1 q t q e   )
The Bt values at different contact times were plotted against the time t (Figure 10). It was found that the adsorption of CR onto the adsorbent follows a linear plot. This implies that if particulate diffusion is a rate-limiting step, then the mass transfer was governed by external mass transport.

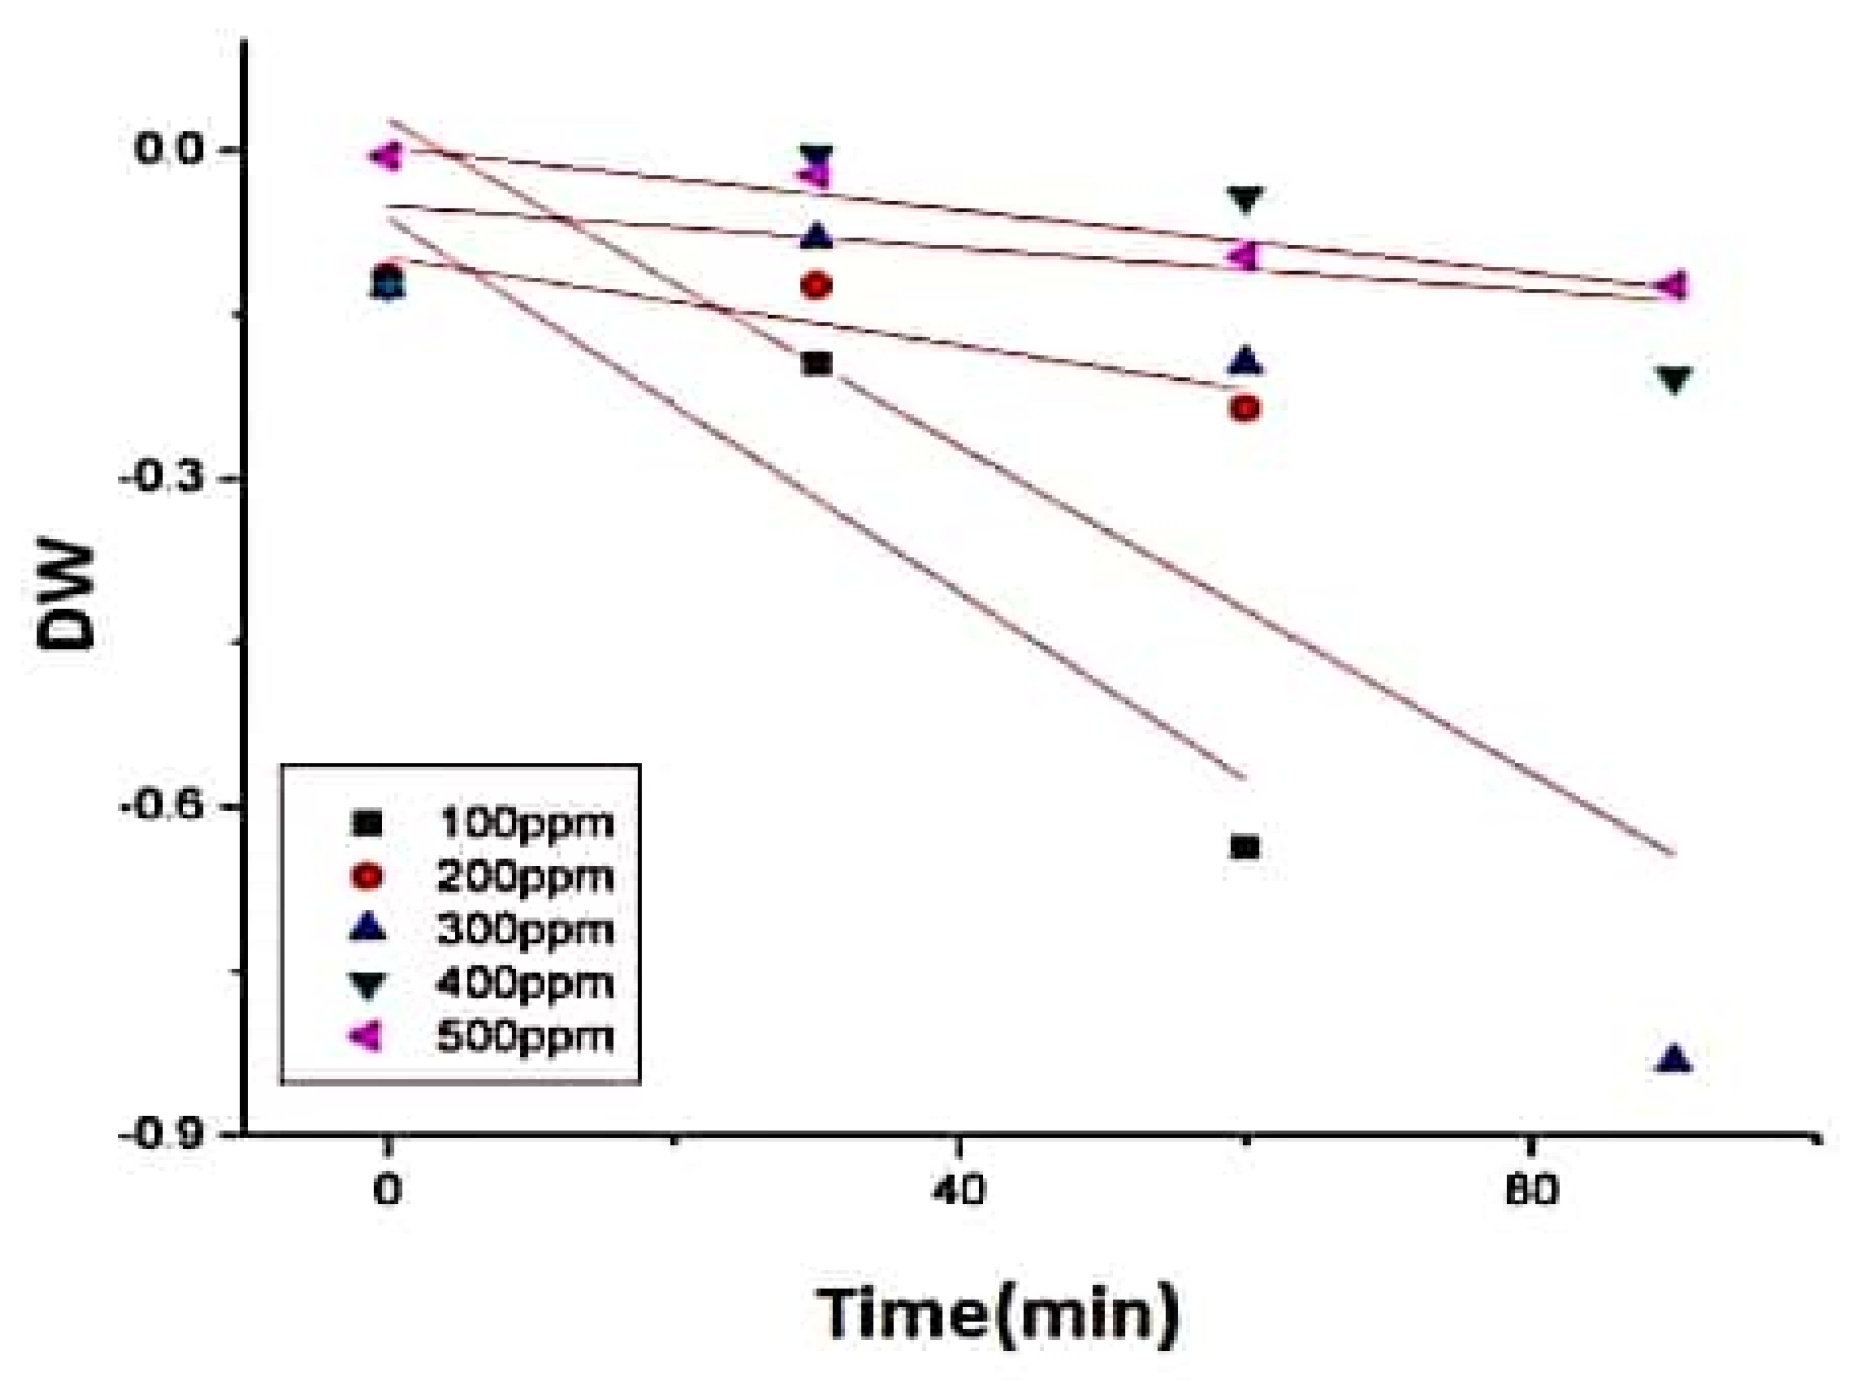
3.4.3. Transport Number and Dumwald–Wagner (DW) Model

q t q e =   k m t n      
where km—interaction coefficient, and n—transport number. In Figure 11, the km and n values are calculated. The average n value was found to be n = 0.352, which represents Fick’s mechanism (Table 4) [35]. The DW model was used to figure out the adsorption parameter which included the corrections for diffusion effects (Table 5). At a lower temperature and the initial concentrations, the rate of adsorption is high. Thus, the experimental data are concordant with the model (Figure 12).

3.5. Thermodynamic Parameters

The thermodynamic parameters were estimated through the extent of the adsorption process by using the rate law. The ΔH° and ΔS° values were calculated from the Van’t Hoff plot [36].
ln K   = Δ S ° R + Δ H ° RT    
  K D = q e C e    
k D = q e m C e V
K C = C s C 0 = C 0 C e C 0
KL = 55.51 × molecular weight of CR9 × 1000 × kL
where Kd is the distribution constant (L/g), qe is the sorption capacity (mg/g) at equilibrium, and Ce is the equilibrium concentration (mg/L); kd is the dimensionless form of the distribution constant; KC is the dimensionless form of the equilibrium constant, Cs is the concentration of the solid phase (mg/L), and C0 is the initial adsorbate concentration (mg/L); KL is the best isotherm model obtaining the equilibrium constant, and kL is the Langmuir equilibrium constant (L/mol) [37].
In Table 6, it is noted that the concentration measure units implicitly define the selected standard states. It follows that ΔG° varies accordingly [38]. ΔG° < 0 indicates that sorption occurs spontaneously in a system in its standard states (Table 7). The negativity of the ΔH° value indicates the complete adsorption of CR onto the biomass, which signifies an exothermic nature. The ΔH° values show that the CR9 adsorption capability increments with a decrement in the temperature. The negativity of ΔS shows that the process was enthalpy-driven (Table 8). There was decreased randomness of CR9 during adsorption onto the Azolla adsorbent. This was confirmed by the negative value of ΔS° [39].

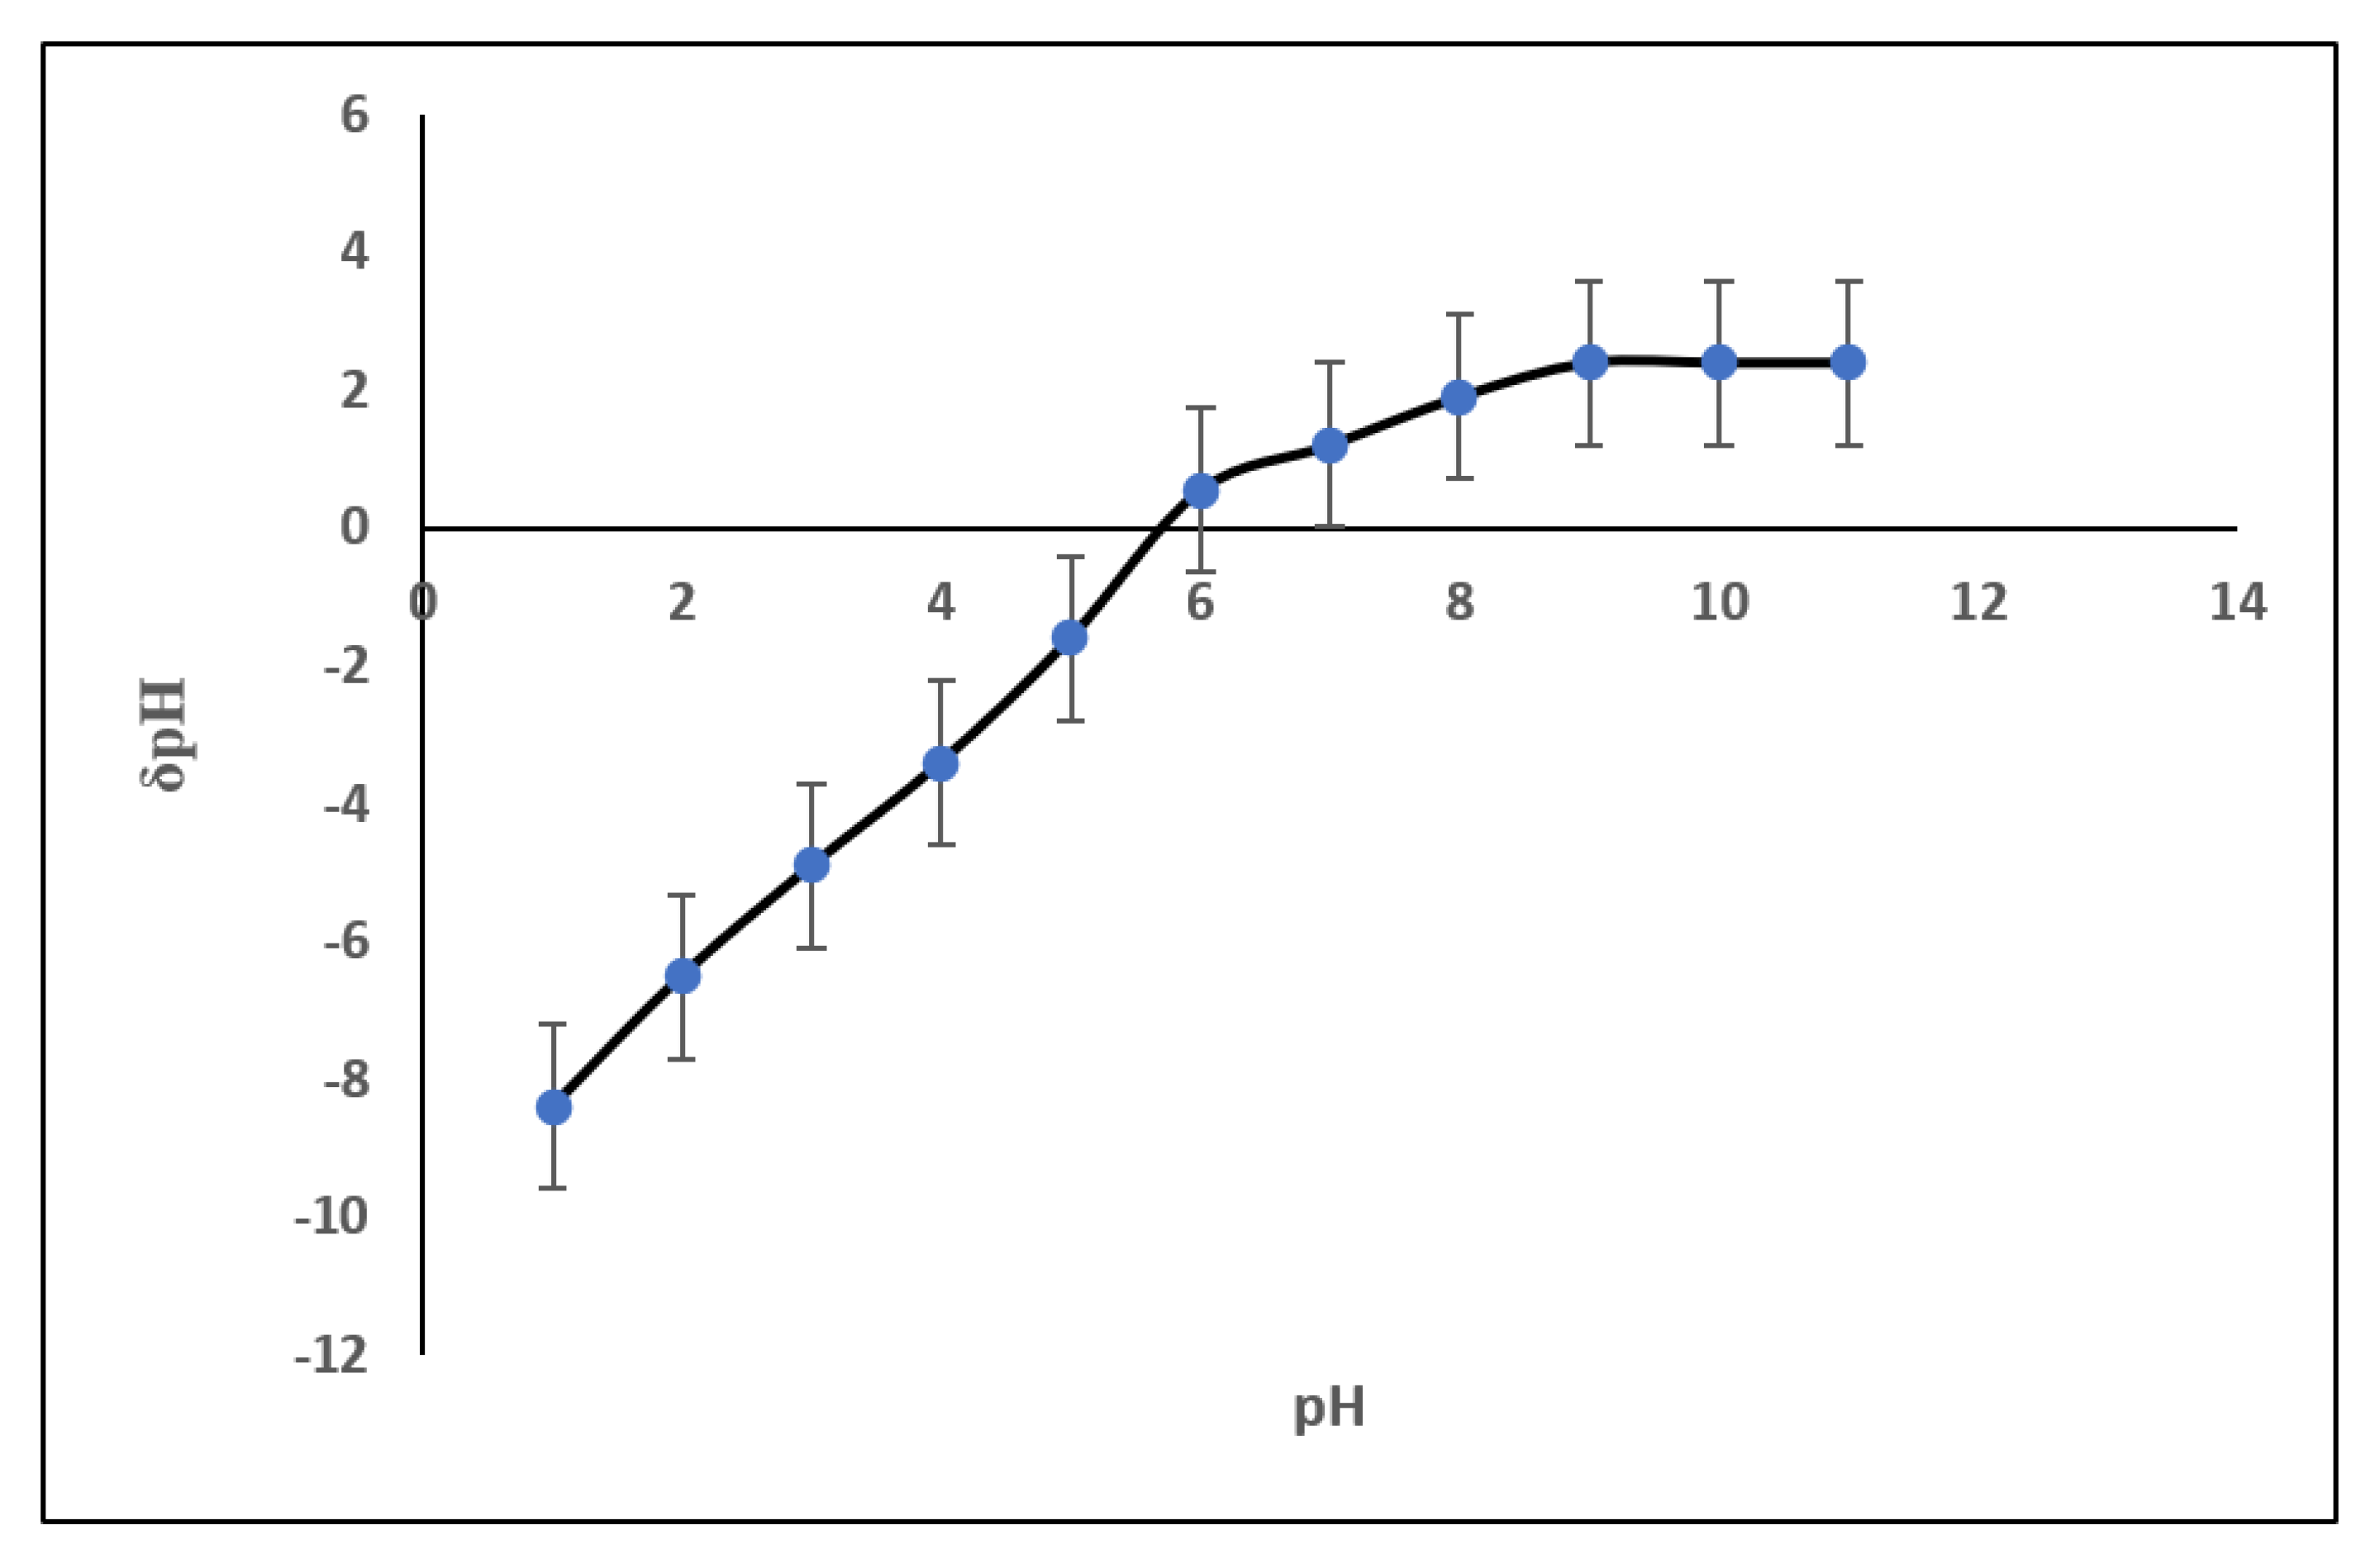
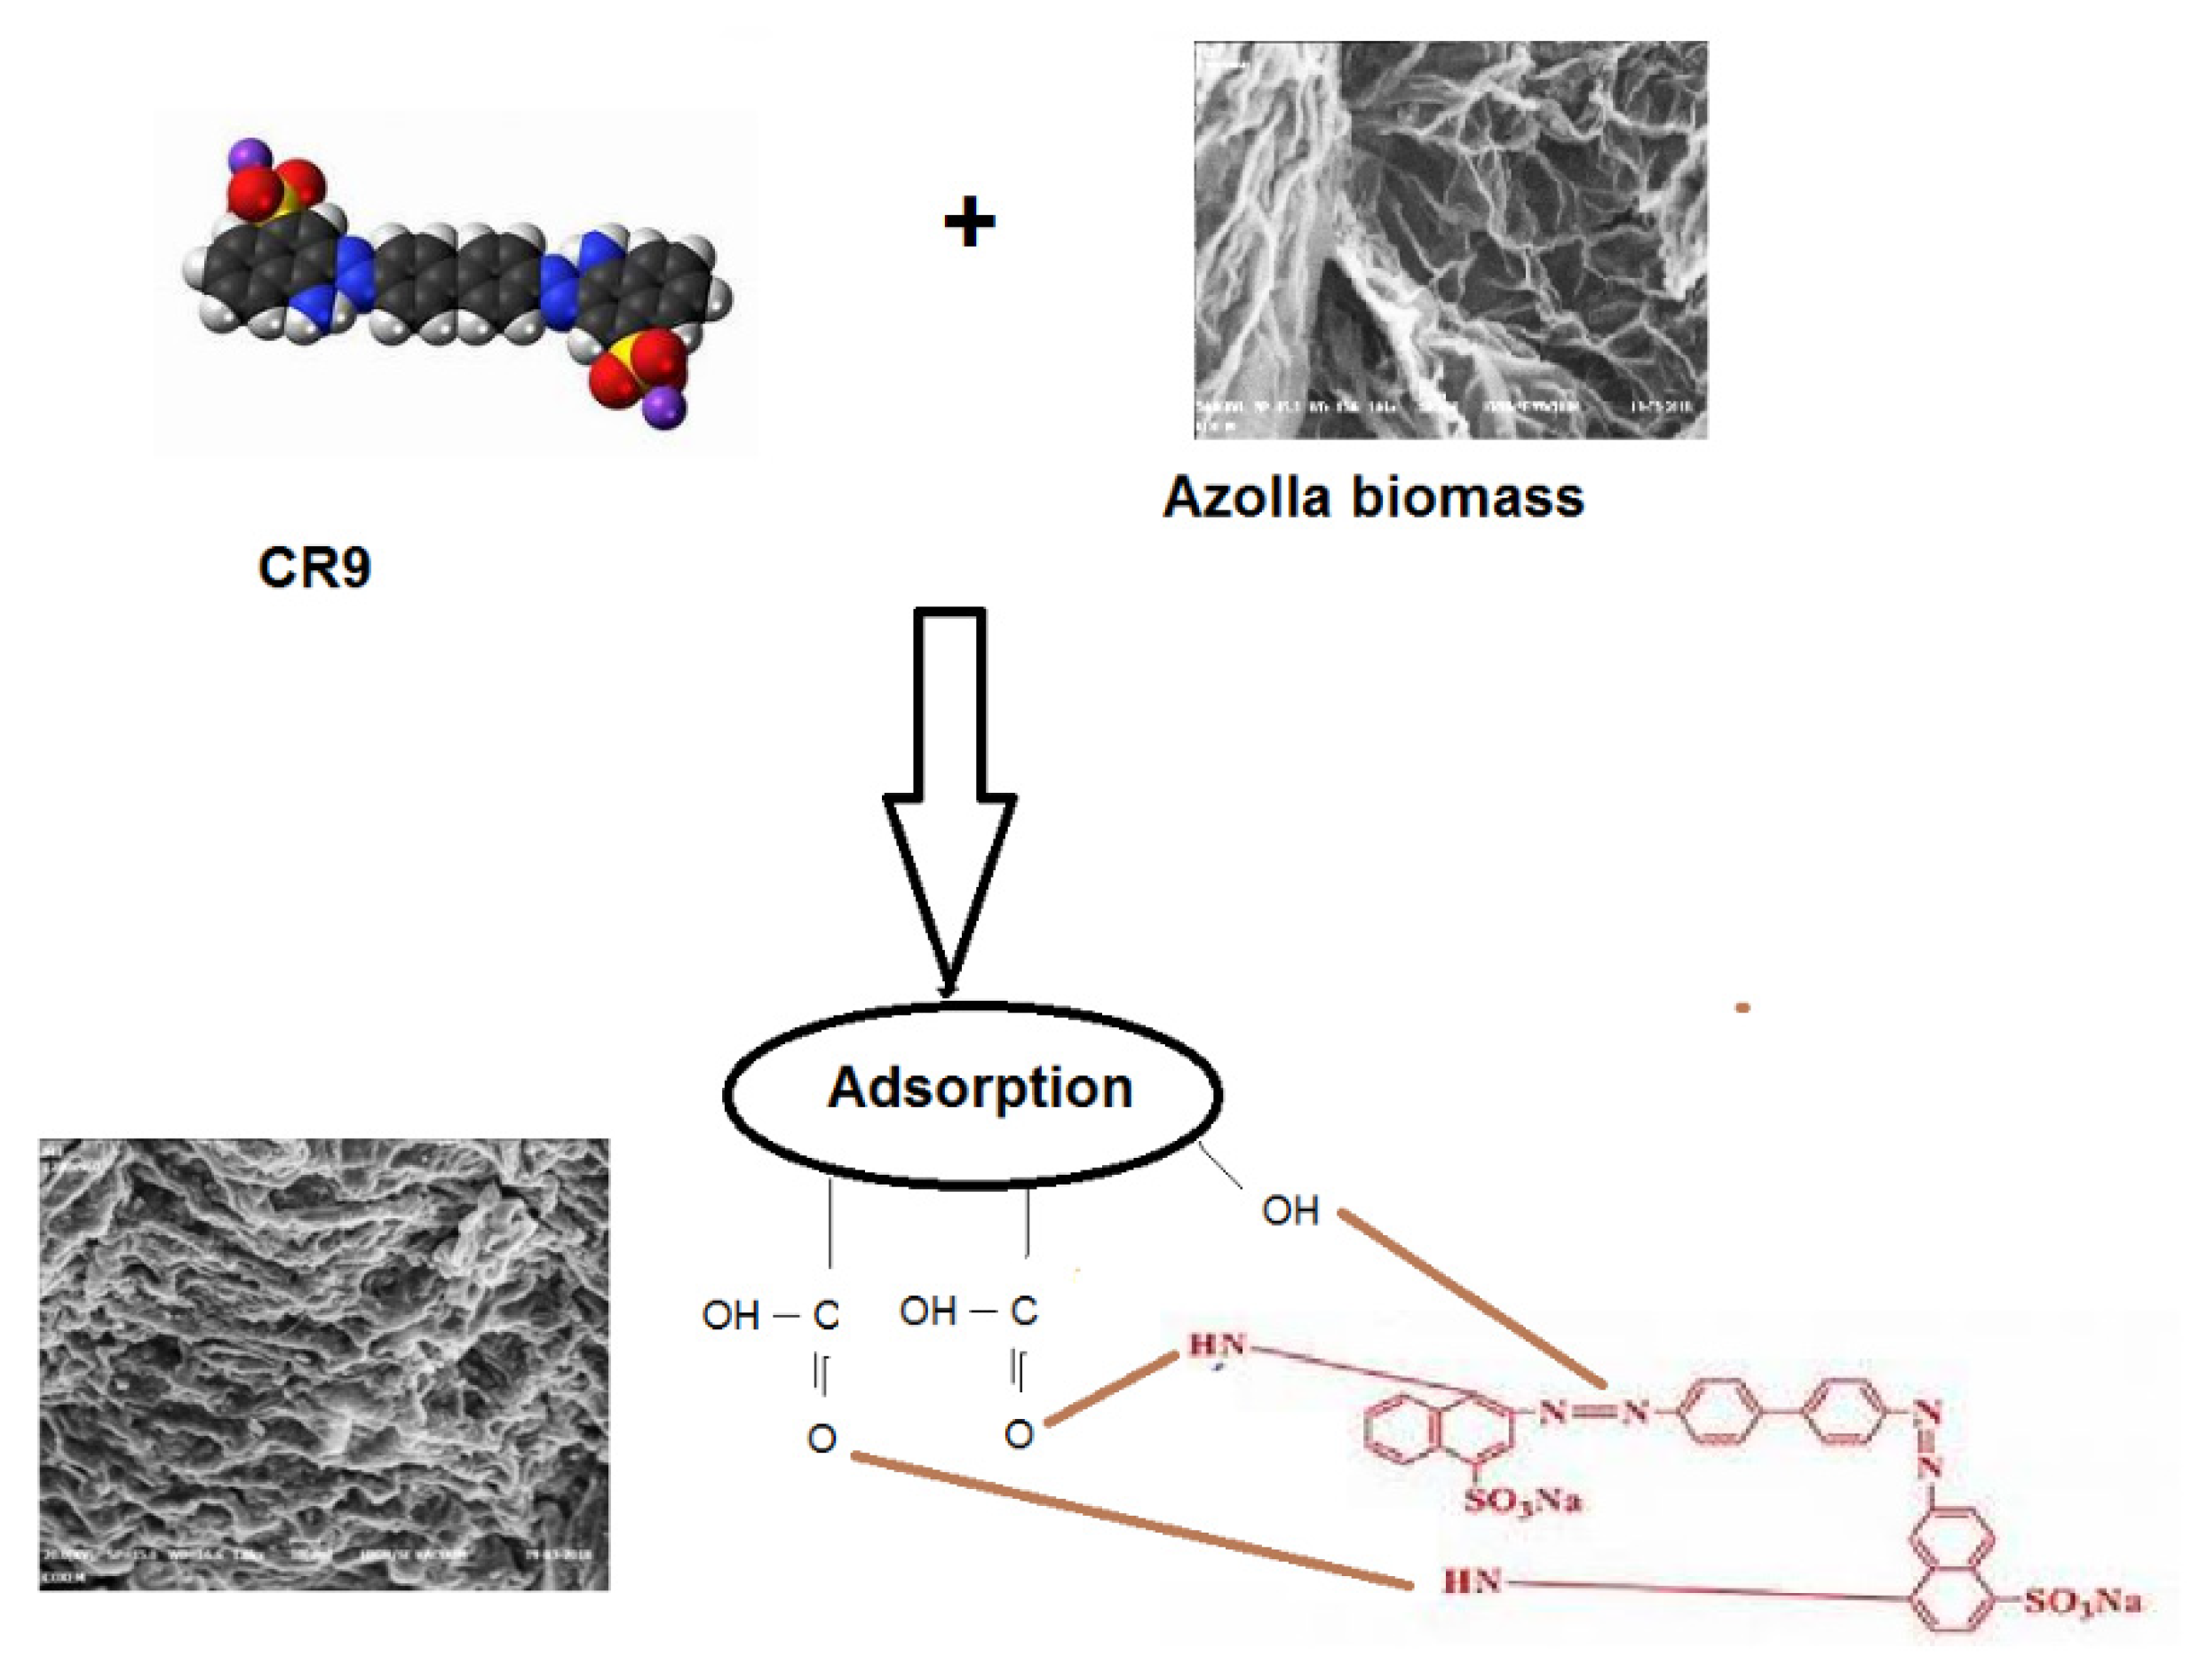
3.6. Mechanism of Adsorption
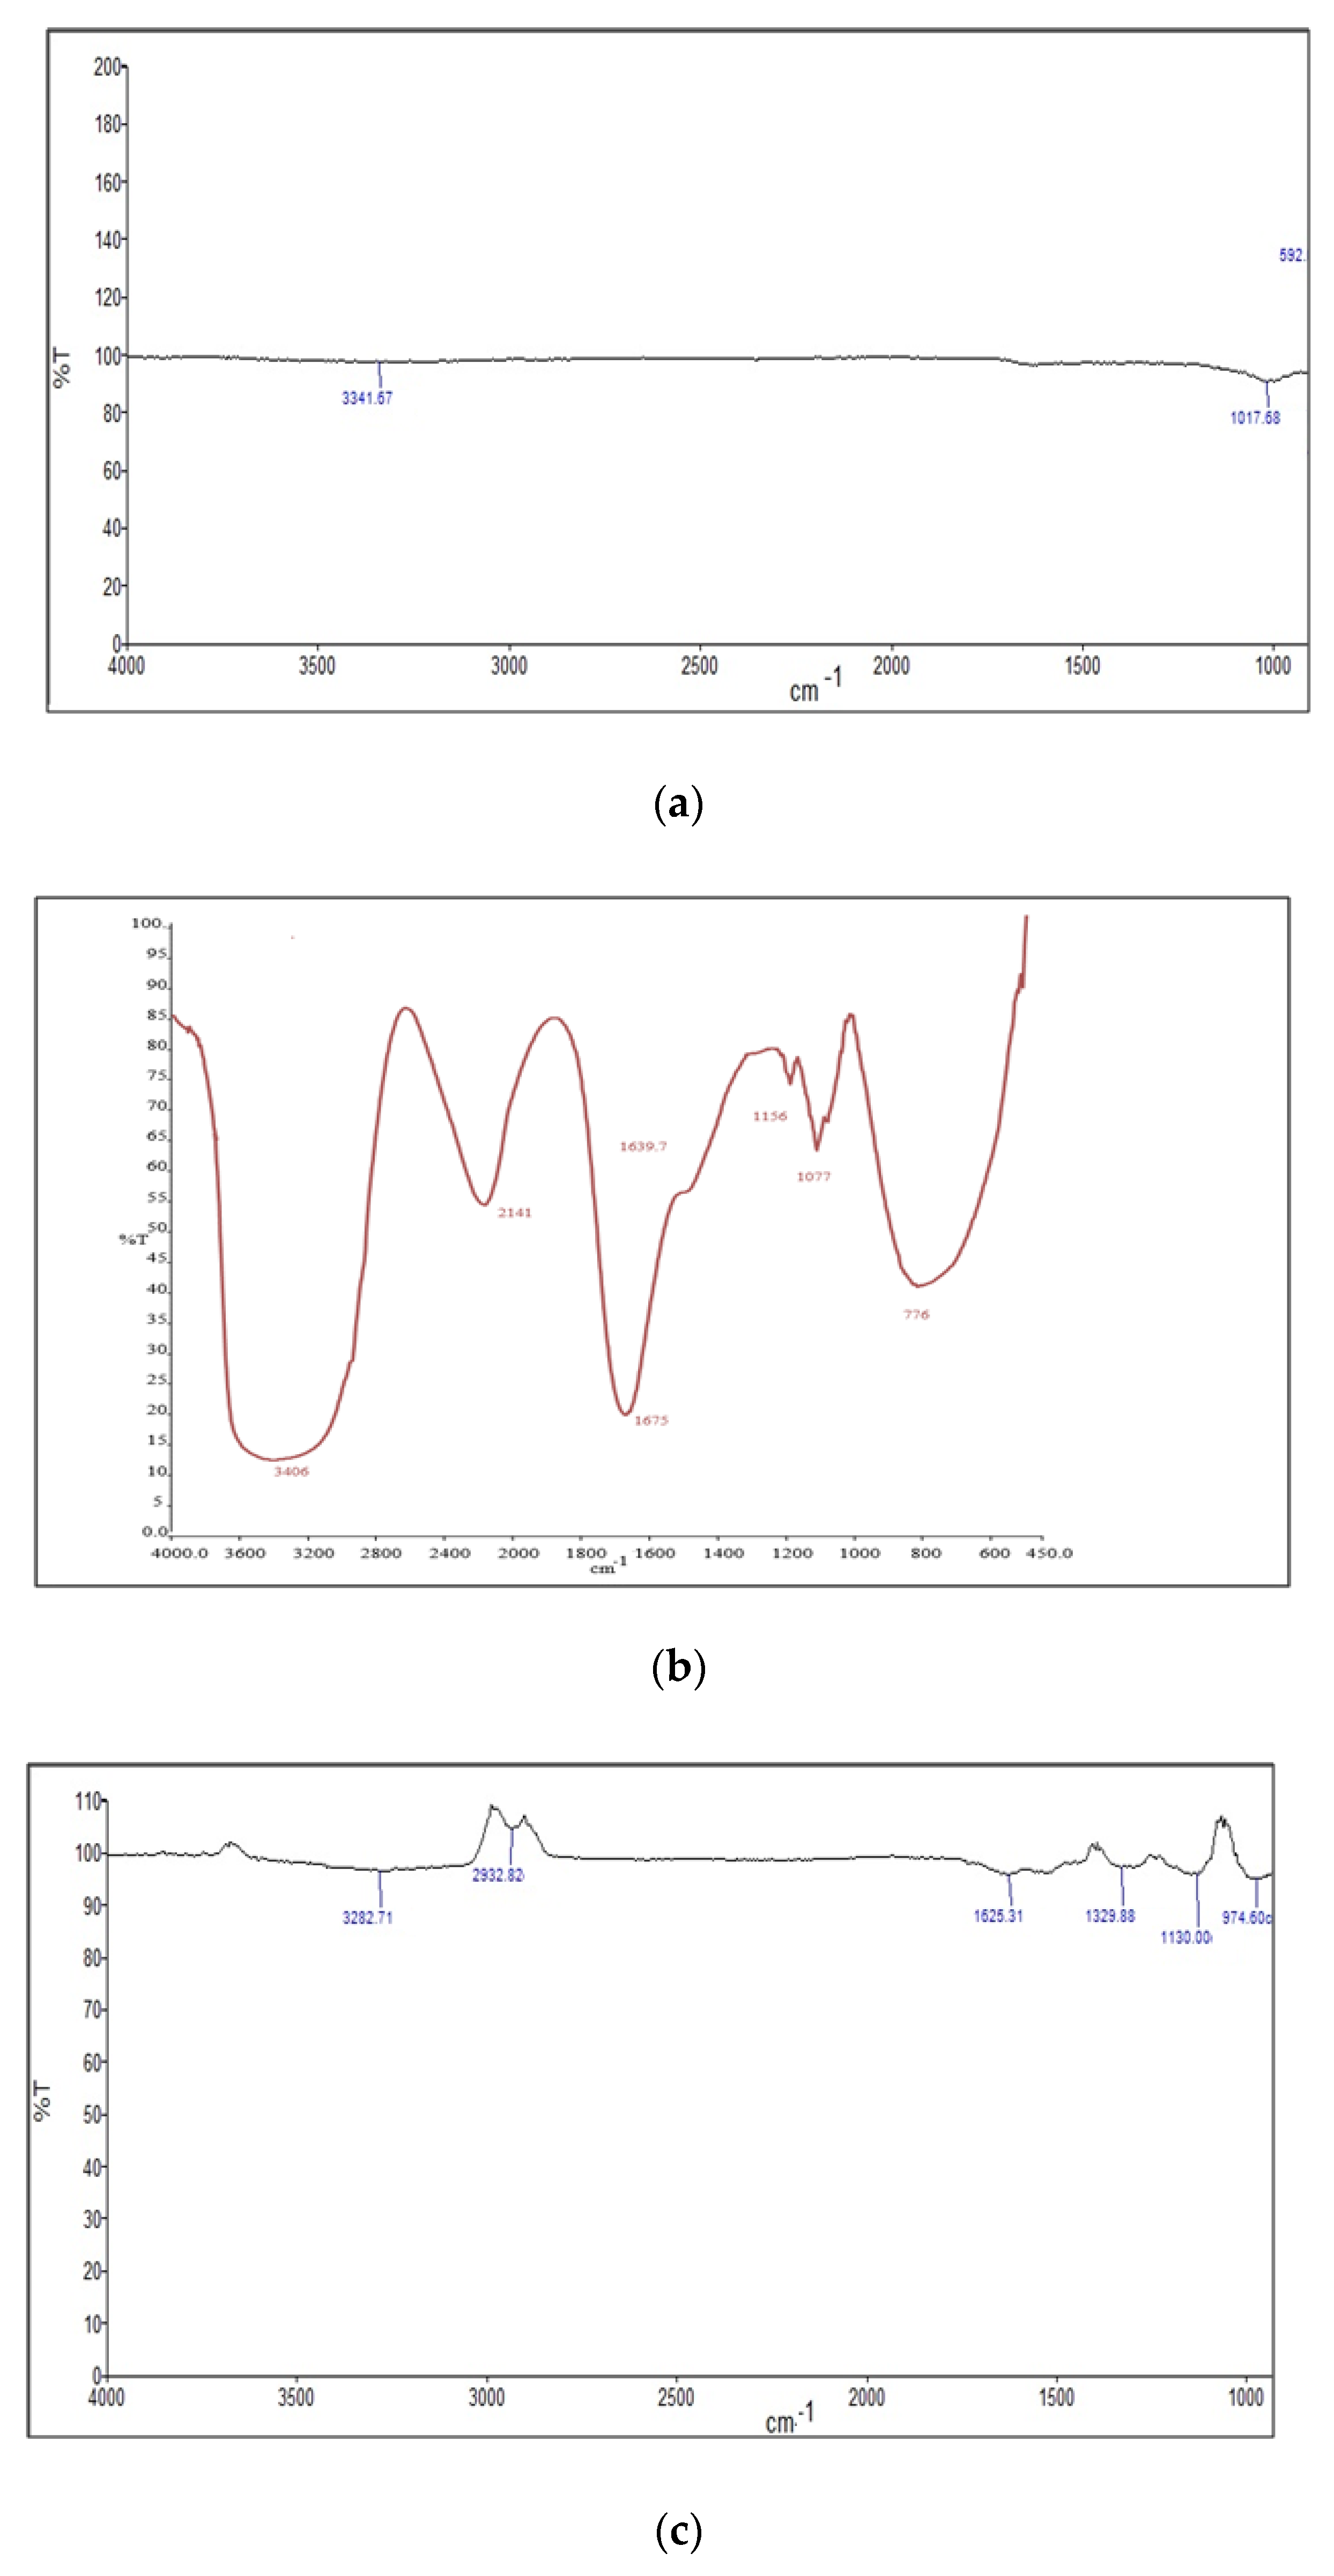
In the context of the above stated findings, the probable physicochemical and ionic interactions between the surface functional groups of the various Azolla adsorbents and CR macromolecules during adsorption are summarized in Figure 13. Biosorption of CR9 occurs mainly through interactions such as complexation, adsorption by physical forces, precipitation, and entrapment in inner spaces. In the initial stages, there is surface adsorption or transport of the CR9 molecules from the bulk phase to the adsorbent surface. Then, intraparticle diffusion of the CR9 anions into the pores of the adsorbent particles occurs. Finally, the equilibrium stage shows gradual adsorption dominated by porous diffusions. Therefore, diffusion between particles intervened in the adsorption process but cannot control the CR molecules’ overall adsorption [40].

3.7. FT-IR

The FT-IR spectrum of the Azolla sample before adsorption recorded peaks in the range of 3600–400 cm−1. The Azolla adsorbent revealed a few absorption bands of fly ash at 3341 cm–1 and 1017 cm–1 corresponding to the O–H stretching and Si–O bending vibrations, respectively. The dye before adsorption experiments displayed peaks at 3406, 2141, 1675, 1156, 1077, and 776 cm−1 for -NH (primary or secondary amine) stretching, -C=N, alkene stretching, -N=N- stretching, and -S=O, respectively. However, the CR9-loaded adsorbent displayed supplementary peaks around 1625 cm–1 of an aromatic ring vibration. The C≡N stretch was confirmed at 2932 cm–1, which precluded the attachments of aromatics from the CR9 dye (Figure 14).

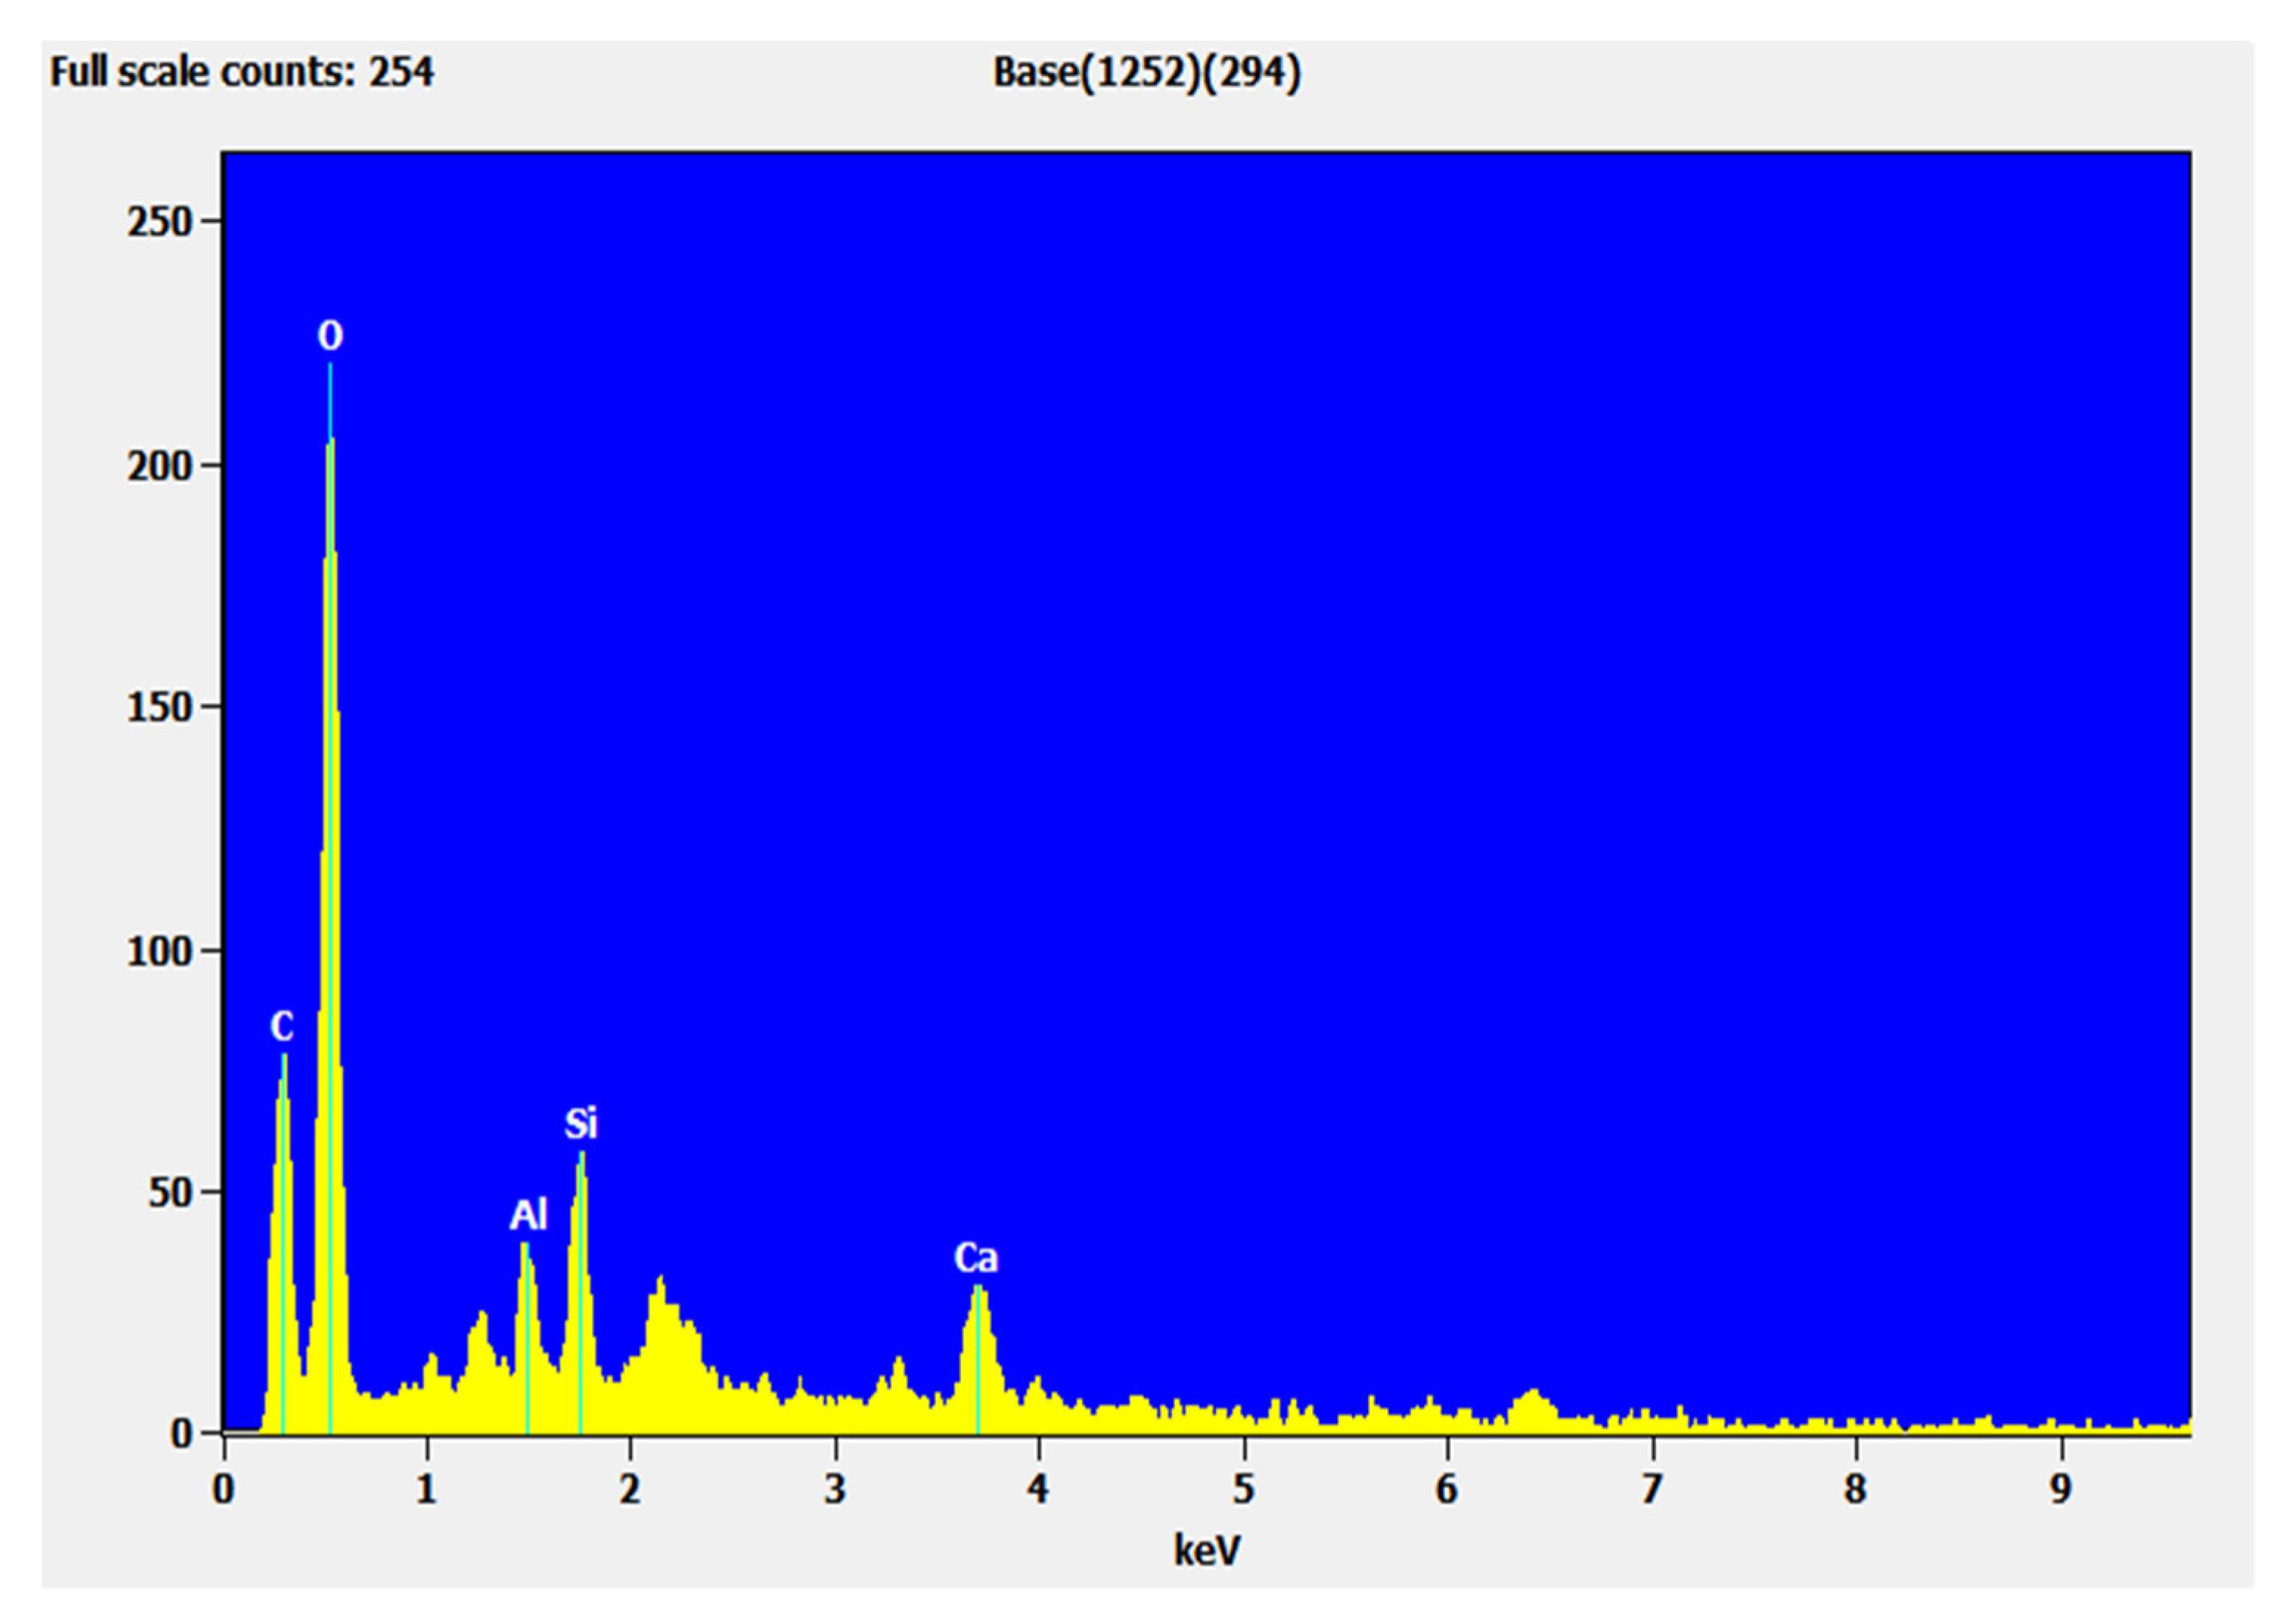
3.8. Energy-Dispersive X-ray Spectroscopy (EDX)

The chemical components of the sample were characterized using EDX. The EDX spectrum in Figure 15 and Figure 16 shows the elements present in the sample and their weight percentage before and after adsorption. The extent of the carbon increase shows that adsorption occurred and the potassium present in Azolla was exchanged with the adsorbent (Table 9). The adsorbent efficiency was compared with other adsorbents, and the results are tabulated in Table 10.

3.9. Regeneration Studies for CR Dye Desorption

The reusability of Azolla filiculoides biosorbents after several cycles is a crucial factor determining the efficiency of the entire sorption process [49]. In the present study, eluents such as ethanol and basic water were utilized for CR dye elution from the Azolla filiculoides biosorbent. The percentage elution (E) was determined using
Percentage   Elution =   amount   of   desorbed   CR   dye amount   of   adsorbed   CR   dye   ×   100
The utilized biosorbent was mixed with ethanol and basic water for 40 min in an agitator shaker, and the CR dye that was desorbed was evaluated to better analyze the eluent. The higher desorption was about 98% for the basic solution, whereas lower desorption was achieved for ethanol, at 30%, under similar working conditions [50]. Since good claims resulted from the basic solution, further regeneration cycles were performed using basic water as an eluent. As it is portrayed in Figure 17, the uptake efficiency of Azolla filiculoides was reduced from 220.37 mg/g in the first cycle to 176.25 mg/g in the fifth cycle. The uptake efficiency in the fifth cycle was reduced by 20% when compared with the first cycle. The elution percentage was marked to reduce from 98% in the first cycle to about 89% in the fifth cycle. The procured inferences allow us to conclude on the reusability efficiency of the Azolla filiculoides biosorbent in CR dye removal from an aqueous sample.

4. Conclusions

The efficacy of Azolla filicolides as a potential biosorbent for the treatment of CR9 dye was investigated in a batch system. The optimum conditions for such adsorption were found to be 200 mg/L for the initial dye concentration with 2 g/L of the biosorbent dosage at acidic pH ranges. Anyhow, the pH was hardly adjusted in further experiments as the adsorptive removal of the CR dye between pH ranges of 4 and other ambient pH values was comparable. The objective of finding the optimal pH emphasized the impact of hydrophobic and electrostatic interactions in acting as a driving force for such biosorption. The pseudo-second-order mechanism was found to be the best fitting mechanism for such CR dye treatment, and it also proved the chemical nature of the chosen adsorption process. The Weber–Morris kinetic model accounted for a meager contribution of intraparticle diffusion, and there was more dominance of complexation, precipitation, and entrapment in the inner spaces of Azolla filiculoides in governing the rate-limiting step of the adsorption process, whereas the Boyd model highlighted the impact of film diffusion as the rate-limiting factor for CR dye biosorption. The Langmuir > Freundlich > Temkin isotherm proved to be the optimum isotherm that matches the experimental value. Moreover, the Langmuir model was best fitted to such experimental results, with qm of 243 mg/g at ambient conditions. Thermodynamic analysis revealed the extent of adsorption to be physisorption as well as exothermic. The regeneration studies possibly validate the benefit of ethanol and basic water in effectively regenerating the biosorbent with maximum retention of the selective adsorptive efficiency, which almost coincides with that of the unused biosorbent after five cycles. Hence, the future goal should be to focus on the treatment of industrial discharges as well.

Author Contributions

Conceptualization, methodology, S.S. and P.S.K.; software, M.D.; validation, S.S., P.D., A.K.J. and P.S.K.; formal analysis, P.S.K., A.A.-H. and D.C.; investigation, S.S.; resources, S.S.; data curation, S.S.; writing—original draft preparation, S.S.; writing—review and editing, P.S.K.; visualization, P.D. and A.K.J.; supervision, P.S.K.; project administration, S.S. and P.S.K.; funding acquisition, A.A.-H. and D.C. All authors have read and agreed to the published version of the manuscript.

Funding

This research received no external funding.

Institutional Review Board Statement

Not applicable.

Informed Consent Statement

Not applicable.

Data Availability Statement

The data presented in this study are available on request from the corresponding author.

Acknowledgments

We are grateful to the management of the Sathyabama Institute of Science and Technology for providing the research facilities that greatly assisted in this work. The authors extend their appreciation to the Researchers Supporting Project number (RSP-2021/219), King Saud University, Riyadh, Saudi Arabia.

Conflicts of Interest

The authors declare no conflict of interest.

References

  1. Ho, Y.S.; McKay, G. Kinetic models for the sorption of dye from aqueous solution by wood. Process. Saf. Environ. Prot. 1998, 76, 183–191. [Google Scholar] [CrossRef] [Green Version]
  2. Fakhri, A.; Behrouz, S. Assessment of SnS2 nanoparticles properties for photocatalytic and antibacterial applications. Sol. Energy 2015, 117, 187–191. [Google Scholar] [CrossRef]
  3. Gupta, V.K.; Mittal, A.; Krishnan, L.; Gajbe, V. Adsorption kinetics and column operations for the removal and recovery of malachite green from wastewater using bottom ash. Sep. Purif. Technol. 2004, 40, 87–96. [Google Scholar] [CrossRef]
  4. Hameed, B.H.; El-Khaiary, M.I. Malachite green adsorption by rattan sawdust: Isotherm, kinetic and mechanism modeling. J. Hazard. Mater. 2008, 159, 574–579. [Google Scholar] [CrossRef]
  5. Elgarahy, A.M.; Elwakeel, K.Z.; Akhdhar, A.; Hamza, M.F. Recent advances in greenly synthesized nanoengineered materials for water/wastewater remediation: An overview. Nanotechnol. Environ. Eng. 2021, 6, 1–24. [Google Scholar] [CrossRef]
  6. Bahadar, A.; Khan, M.B. Progress in energy from microalgae: A review. Renew. Sustain. Energy Rev. 2013, 27, 128–148. [Google Scholar] [CrossRef]
  7. Anastasakis, K.; Ross, A.B. Hydrothermal liquefaction of the brown macro-alga Laminaria saccharina: Effect of reaction conditions on product distribution and composition. Bioresour. Technol. 2011, 102, 4876–4883. [Google Scholar] [CrossRef]
  8. Kumar, J.A.; Amarnath, D.J.; Sathish, S.; Jabasingh, S.A.; Saravanan, A.; Hemavathy, R.V.; Anand, K.V.; Yaashikaa, P.R. Enhanced PAHs removal using pyrolysis-assisted potassium hydroxide induced palm shell activated carbon: Batch and column investigation. J. Mol. Liq. 2019, 279, 77–87. [Google Scholar] [CrossRef]
  9. Elwakeel, K.Z.; Shahat, A.; Khan, Z.A.; Alshitari, W.; Guibal, E. Magnetic metal oxide-organic framework material for ultrasonic-assisted sorption of Titan Yellow and Rose Bengal from aqueous solutions. Chem. Eng. J. 2019, 392, 123635. [Google Scholar] [CrossRef]
  10. Bhatnagar, A.; Sillanpää, M. Utilization of agro-industrial and municipal waste materials as potential adsorbents for water treatment—A review. Chem. Eng. J. 2010, 157, 277–296. [Google Scholar] [CrossRef]
  11. Bulut, E.; Özacar, M.; Şengil, İ.A. Adsorption of malachite green onto bentonite: Equilibrium and kinetic studies and process design. Microporous Mesoporous Mater. 2008, 115, 234–246. [Google Scholar] [CrossRef]
  12. Elgarahy, A.M.; Elwakeel, K.Z.; Mohammad, S.H.; Elshoubaky, G.A. Multifunctional eco-friendly sorbent based on marine brown algae and bivalve shells for subsequent uptake of Congo red dye and copper(II) ions. J. Environ. Chem. Eng. 2020, 8, 103915. [Google Scholar] [CrossRef]
  13. Al-Degs, Y.S.; El-Barghouthi, M.I.; El-Sheikh, A.H.; Walker, G.M. Effect of solution pH, ionic strength, and temperature on adsorption behavior of reactive dyes on activated carbon. Dye. Pigment. 2008, 77, 16–23. [Google Scholar] [CrossRef]
  14. Aniyikaiye, T.E.; Oluseyi, T.; Odiyo, J.O.; Edokpayi, J.N. Physico-Chemical Analysis of wastewater Discharge from Selected Paint Industries in Lagos, Nigeria. Int. J. Environ. Res. Public Health 2019, 16, 1235. [Google Scholar] [CrossRef] [PubMed] [Green Version]
  15. Preethi, S.; Sivasamy, A.; Sivanesan, S.; Ramamurthi, V.; Swaminathan, G. Removal of safranin basic dye from aqueous solutions by adsorption onto corncob activated carbon. Ind. Eng. Chem. Res. 2006, 45, 7627–7632. [Google Scholar] [CrossRef]
  16. Fakhri, A.; Nejad, P.A. Antimicrobial, antioxidant and cytotoxic effect of Molybdenum trioxide nanoparticles and application of this for degradation of ketamine under different light illumination. J. Photochem. Photobiol. B Biol. 2016, 159, 211–217. [Google Scholar] [CrossRef]
  17. Ng, Y.S.; Chan, D.J.C. Phytoremediation capabilities of Spirodelapolyrhiza, Salvinia molesta and Lemna sp. in synthetic wastewater: A comparative study. Int. J. Phytoremediation 2018, 20, 1179–1186. [Google Scholar] [CrossRef]
  18. Mohammadi, S.; Sohrabi, M.; Golikand, A.N.; Fakhri, A. Preparation and characterization of zinc and copper co-doped WO3 nanoparticles: Application in photocatalysis and photobiology. J. Photochem. Photobiol. B Biol. 2016, 161, 217–221. [Google Scholar] [CrossRef]
  19. Sulthana, R.; Taqui, S.N.; Zameer, F.; Syed, U.T.; Syed, A.A. Adsorption of ethidium bromide from aqueous solution onto nutraceutical industrial fennel seed spent: Kinetics and thermodynamics modeling studies. Int. J. Phytoremediation 2018, 20, 1075–1086. [Google Scholar] [CrossRef]
  20. Sundararaman, S.; Deivasigamani, P.; Gopakumaran, N.; Kumar, J.A.; Balasubramaniam, J.S.; Kumar, N.M. Amalgamation and application of nano chitosan cross-linked with fish scales based activated carbon as an adsorbent for the removal of reactive dye (RB9). IET Nanobiotechnol. 2020, 14, 289–299. [Google Scholar] [CrossRef]
  21. Suganya, T.; Renganathan, S. Optimization and kinetic studies on algal oil extraction from marine macroalgae Ulva lactuca. Bioresour. Technol. 2012, 107, 319–326. [Google Scholar] [CrossRef] [PubMed]
  22. Nachiyar, C.V.; Rajkumar, G.S. Degradation of a tannery and textile dye, Navitan Fast Blue S5R by Pseudomonas aeruginosa. World J. Microbiol. Biotechnol. 2003, 19, 609–614. [Google Scholar] [CrossRef]
  23. Fakhri, A.; Rashidi, S.; Tyagi, I.; Agarwal, S.; Gupta, V.K. Photodegradation of Erythromycin antibiotic by γ-Fe2O3/SiO2 nanocomposite: Response surface methodology modeling and optimization. J. Mol. Liq. 2016, 214, 378–383. [Google Scholar] [CrossRef]
  24. Munagapati, V.S.; Kim, D.S. Adsorption of anionic azo dye Congo red from aqueous solution by cationic modified orange peel powder. J. Mol. Liq. 2016, 220, 540–548. [Google Scholar] [CrossRef]
  25. Ganesan, P.; Kamaraj, R.; Vasudevan, S. Application of isotherm, kinetic and thermodynamic models for the adsorption of nitrate ions on graphene from aqueous solution. J. Taiwan Inst. Chem. Eng. 2013, 44, 808–814. [Google Scholar] [CrossRef]
  26. Fakhri, A.; Behrouz, S. Photocatalytic properties of tungsten trioxide (WO3) nanoparticles for degradation of Lidocaine under visible and sunlight irradiation. Sol. Energy 2015, 112, 163–168. [Google Scholar] [CrossRef]
  27. Nethaji, S.; Sivasamy, A.; Mandal, A.B. Adsorption isotherms, kinetics and mechanism for the adsorption of cationic and anionic dyes onto carbonaceous particles prepared from Juglans regia shell biomass. Int. J. Environ. Sci. Technol. 2013, 10, 231–242. [Google Scholar] [CrossRef] [Green Version]
  28. Ravi, T.; Sundararaman, S. Synthesis and characterization of chicken eggshell powder coated magnetic nano adsorbent by an ultrasonic bath assisted co-precipitation for Cr(VI) removal from its aqueous mixture. J. Environ. Chem. Eng. 2020, 8, 103877–103889. [Google Scholar]
  29. Neveux, N.; Yuen, A.K.L.; Jazrawi, C.; Magnusson, M.; Haynes, B.S.; Masters, A.F.; Montoya, A.; Paul, N.A.; Maschmeyer, T.; De Nys, R. Biocrude yield and productivity from the hydrothermal liquefaction of marine and freshwater green macroalgae. Bioresour. Technol. 2014, 155, 334–341. [Google Scholar] [CrossRef]
  30. Arasteh, R.; Masoumi, M.; Rashidi, A.M.; Moradi, L.; Samimi, V.; Mostafavi, S.T. Adsorption of 2-nitrophenol by multi-wall carbon nanotubes from aqueous solutions. Appl. Surf. Sci. 2010, 256, 4447–4455. [Google Scholar] [CrossRef]
  31. Garg, V.K.; Amita, M.; Kumar, R.; Gupta, R. Basic dye (methylene blue) removal from simulated wastewater by adsorption using Indian Rosewood sawdust: A timber industry waste. Dye. Pigment. 2004, 63, 243–250. [Google Scholar] [CrossRef]
  32. Sundararaman, S.; Narendrakumar, G. Stabilization of bacterial cells culture on immobilized alginate beads and optimization of congo red decolorization. Indian J. Chem. Technol. 2019, 26, 544–552. [Google Scholar]
  33. Elwakeel, K.; Elgarahy, A.M.; Guibal, E. A biogenic tunable sorbent produced from upcycling of aquatic biota-based materials functionalized with methylene blue dye for the removal of chromium(VI) ions. J. Environ. Chem. Eng. 2021, 9, 104767–104772. [Google Scholar] [CrossRef]
  34. Cheung, W.H.; Szeto, Y.S.; McKay, G. Intraparticle diffusion processes during acid dye adsorption onto chitosan. Bioresour. Technol. 2007, 98, 2897–2904. [Google Scholar] [CrossRef] [PubMed]
  35. Fakhri, A.; Naji, M. Degradation photocatalysis of tetrodotoxin as a poison by gold doped PdO nanoparticles supported on reduced graphene oxide nanocomposites and evaluation of its antibacterial activity. J. Photochem. Photobiol. B Biol. 2017, 167, 58–63. [Google Scholar] [CrossRef] [PubMed]
  36. Salvestrini, S.; Leone, V.; Iovino, P.; Canzano, S.; Capasso, S. Considerations about the correct evaluation of sorption thermodynamic parameters from equilibrium isotherms. J. Chem. Thermodyn. 2014, 68, 310–316. [Google Scholar] [CrossRef]
  37. Eder, C.L.; Hosseini-Bandegharaei, A.; Moreno-Pirajánd, J.C.; Anastopoulos, I. A critical review of the estimation of the thermodynamic parameters on adsorption equilibria. Wrong use of equilibrium constant in the Van’t Hoof equation for calculation of thermodynamic parameters of adsorption. J. Mol. Liq. 2019, 273, 425–434. [Google Scholar]
  38. Fenti, A.; Iovino, P.; Salvestrini, S. Cr(VI) Sorption from Aqueous Solution: A Review. Appl. Sci. 2020, 10, 6477. [Google Scholar] [CrossRef]
  39. Patil, S.; Renukdas, S.; Patel, N. Removal of methylene blue, a basic dye from aqueous solutions by adsorption using teak tree (Tectona grandis) bark powder. Int. J. Environ. Sci. 2011, 1, 711–726. [Google Scholar]
  40. Tejada-Tovar, C.; Villabona-Ortíz, A.; Gonzalez-Delgado, A.D. Adsorption of Azo-Anionic Dyes in a Solution Using Modified Coconut (Cocos nucifera) Mesocarp: Kinetic and Equilibrium Study. Water 2021, 13, 1382. [Google Scholar] [CrossRef]
  41. Khoshsang, H.; Ghaffarinejad, A.; Kazemi, H.; Wang, Y.; Arandiyan, H. One-pot synthesis of S-doped Fe2O3/C magnetic nanocomposite as an adsorbent for anionic dye removal: Equilibrium and kinetic studies. J. Nanostruct. Chem. 2017, 8, 23–32. [Google Scholar] [CrossRef] [Green Version]
  42. Litefti, K.; Freire, M.S.; Stitou, M.; Gonzalez-Alvarez, J. Adsorption of an anionic dye (Congo red) from aqueous solutions by pine bark. Sci. Rep. 2019, 9, 16530–16540. [Google Scholar] [CrossRef] [Green Version]
  43. Chen, H.; Zhao, J. Adsorption study for removal of Congo red anionic dye using organo-attapulgite. Adsorption 2009, 15, 381–389. [Google Scholar] [CrossRef]
  44. Cheng, Z.; Zhang, L.; Guo, X.; Jiang, X.; Li, T. Adsorption behavior of direct red 80 and Congo red onto activated carbon/surfactant: Process optimization, kinetics and equilibrium. Spectrochim. Acta Part A Mol. Biomol. Spectrosc. 2015, 137, 1126–1143. [Google Scholar] [CrossRef] [PubMed]
  45. Dawood, S.; KantiSen, T. Removal of anionic dye Congo red from aqueous solution by raw pine and acid-treated pine cone powder as adsorbent: Equilibrium, thermodynamic, kinetics, mechanism and process design. Water Res. 2012, 46, 1933–1946. [Google Scholar] [CrossRef] [PubMed]
  46. Wanyonyi, W.C.; Onyari, J.M.; Shiundu, P.M. Adsorption of Congo Red Dye from Aqueous Solutions Using Roots of Eichhornia Crassipes: Kinetic and Equilibrium Studies. Energy Procedia 2014, 50, 862–869. [Google Scholar] [CrossRef] [Green Version]
  47. Hu, Z.; Chen, H.; Ji, F.; Yuan, S. Removal of Congo red from aqueous solution using cattail roots. J. Hazard. Mater. 2010, 173, 292–297. [Google Scholar] [CrossRef] [PubMed]
  48. Wang, L.; Wang, A. Adsorption properties of Congo red from aqueous solution onto N,O-carboxymethyl-chitosan. Bioresour. Technol. 2008, 99, 1403–1408. [Google Scholar] [CrossRef] [PubMed]
  49. Elgarahy, A.M.; Elwakeel, K.Z.; Elshoubaky, G.A.; Mohammad, S.H. Microwave-accelerated sorption of cationic dyes onto green marine algal biomass. Environ. Sci. Pollut. Res. 2019, 26, 22704–22722. [Google Scholar] [CrossRef]
  50. Mahmood, Z.; Zahra, S.; Iqbal, M. Comparative study of natural and modified biomass of Sargassum sp. for removal of Cd2+ and Zn2+ from wastewater. Appl. Water Sci. 2017, 7, 3469–3481. [Google Scholar] [CrossRef] [Green Version]
Figure 1. Phytoremediation for the treatment of a textile effluent by Azolla filiculoides.
Sustainability 13 09588 g001
Figure 2. Well-grown Azolla filiculoides (a) Leaves (b) Roots.
Sustainability 13 09588 g002
Figure 3. Removal efficiency of phytoremediation on effluent parameters.
Sustainability 13 09588 g003
Figure 4. SEM image of biomass adsorbent: (a) before adsorption; (b) after adsorption.
Sustainability 13 09588 g004
Figure 5. Effect of process variables: (a) adsorbent dosage; (b) initial concentration of dye; (c) temperature; and (d) pH, on decolorization of CR dye.
Sustainability 13 09588 g005
Figure 6. PZC estimation for Azolla filiculoides biomass.
Sustainability 13 09588 g006
Figure 7. Adsorption isotherms for the sorption of CR by Azolla filiculoides.
Sustainability 13 09588 g007
Figure 8. Kinetics of CR9 adsorption: (a) pseudo-first order; (b) pseudo-second order.
Sustainability 13 09588 g008
Figure 9. Intraparticle diffusion studies of adsorption of CR dye onto Azolla biomass.
Sustainability 13 09588 g009
Figure 10. Boyd plot.
Sustainability 13 09588 g010
Figure 11. Plot of log t vs. log q e q t for the determination of the transport number for the sorption of CR9 dye.
Sustainability 13 09588 g011
Figure 12. Dumwald–Wagner model (where DW = ln (1 − q t q e )).
Sustainability 13 09588 g012
Figure 13. Mechanism of CR9 adsorption.
Sustainability 13 09588 g013
Figure 14. FT-IR spectra of (a) Azolla before adsorption; (b) CR9; and (c) Azolla after adsorption.
Sustainability 13 09588 g014
Figure 15. EDX spectra of Azolla before adsorption.
Sustainability 13 09588 g015
Figure 16. EDX spectra of Azolla after adsorption.
Sustainability 13 09588 g016
Figure 17. Reusability of Azolla after 5 cycles for CR9 removal.
Sustainability 13 09588 g017
Table 1. Properties of textile effluent before and after treatment.
ComponentsBefore TreatmentAfter TreatmentPermissible Limits 1
TDS (mg/L)13413
TSS (mg/L)70302450100
Chlorides (mg/L)912.5527.31000
Sulfates (mg/L)1354221.11000
Magnesium (mg/L)26.420.4
Total alkalinity (mg/L)827.7364.9600
Total hardness (mg/L)283.5194.3300
Total iron (mg/L)0.340.173
COD (mg/L)136124.1250
BOD (mg/L)167.53.030
Oil and grease22.06.010
Total phosphates (mg/L)12.32.515
Sodium (mg/L)873594
Potassium (mg/L)4539
Table 2. Isotherm constants.
ModelParametersValuesR2
LangmuirMaximum adsorption capacity (mg/g)243.90.98
Langmuir adsorption constant (L/mg)0.0016
RSME 0.8812
R2 error0.7343
Χ2 (chi-square)0.2219
FreundlichAdsorbent capacity ((mg/g)(L/mg)(1/n))1.040.95
Freundlich constant (g/L)1.656
RSME 1.7185
R2 error1.3608
Χ2 (chi-square)1.2813
TemkinEquilibrium binding constant (L/g)0.184060.941
Heat of adsorption constant (J/mol)6.074
RSME2.5934
R2 error1.7574
Χ2 (chi-square)1.8867
Table 3. Adsorption kinetics constants.
KineticsParametersInitial Concentration (mg/L)
100200400500
Pseudo-first orderk1 (min−1)0.020.0130.0080.003
qe, (mg/g)3.5213.88414.86136.317
R20.93720.909270.96620.79823
Pseudo-second orderk2 (g/mg·min)0.02160.00990.00590.0034
qe, (mg/g)10.01219.78229.42545.127
R20.9830.980.9060.84
Table 4. Transport number.
Concentration (mg/L)SlopeInterceptR2
1000.238−0.5270.909
2000.298−0.6810.913
3000.298−0.6810.913
4000.457−1.0410.914
5000.607−1.3720.919
Table 5. Mass transfer models.
Initial Concentration (mg/L)Weber–Morris ModelDumwald-Wagner Model
ki (mg/g min0.5)R2k (min−1)R2
1000.2820.8650.0080.851
2000.5750.8840.0020.811
3000.8570.9140.0070.789
4001.1950.9290.0010.651
5001.3530.8990.0020.853
Table 6. Constants’ estimation applying equations for them to become dimensionless. The adsorbent dosage utilized was 2 g/L.
Initial Concentration
Co (mg/L)
Kc = C o C e C 0 l n   ( C o C e C 0 ) k d = q e   m C e V ln ( q e   m C e V )
1000.87−0.139266.69311.9009
2000.88−0.127837.33331.9924
3000.87−0.139266.69231.9009
4000.84−0.177335.15381.6397
5000.82−0.198454.01001.3863
Table 7. Equilibrium constants based on Langmuir isotherm and after applying an equation to become dimensionless. The adsorbent dosage utilized was 2 g/L.
Temperature
K
ln Kc Δ G °   J / mol ln k d ΔG° kJ/molln KL Δ G °   kJ / mol ln KD Δ G °     kJ / mol
303−0.139350.16076.62−16.6776.9−17.3846.9077−17.401
313−0.125325.28537.3−18.9976.5−16.9177.256−18.882
323−0.177475.31975.6−15.0346.2−16.6526.25−16.784
333−0.198548.17534.9−13.5666.1−16.8855.2−14.397
Table 8. Values of change in enthalpy and entropy obtained from the plots.
PropertiesKc k d KDKL
ΔH° (J/mol)−1900.91−56,768−50,640.6−22,793.7
ΔS° (J/mol)−7.31299−127.977−106.203−18.3507
R20.75570.67370.74310.953
Table 9. Composition of elements present before and after adsorption.
Element
Line
Before TreatmentAfter Treatment
Weight%ErrorWeight%Error
C25.21±1.2233.75±0.98
O71.16 63.13
Si1.42±0.211.10±0.15
K1.43±0.19
Al 0.95±0.10
Ca --1.07±0.09
Table 10. Comparison with other studies.
AdsorbateAdsorbentMaximum Capacity of Adsorption (mg/g)Reference
Congo red (CR9)Azolla filiculoides biomass243.9This study
Congo redFe2O3/C magnetic nanocomposite270[41]
Congo redPine bark0.3–1.6[42]
Congo redOrgano-attapulgite 189.39[43]
Congo redActivated carbon/surfactant 769.48[44]
Congo redRaw pine32.65[45]
Congo redAcid-treated pine40.19[45]
Congo redRoots of Eichhornia crassipes4.8[46]
Congo redCattail root38.79[47]
Congo redN,O-carboxymethyl-chitosan330.62[48]
Publisher’s Note: MDPI stays neutral with regard to jurisdictional claims in published maps and institutional affiliations.

