Article

Supreme Audit Institutions and Sustainability of Public Finance. Links and Evidence along the Economic Cycles

by
Ionel Bostan
1,*,
Mihaela Brindusa Tudose
2,
Raluca Irina Clipa
3,
Ionela Corina Chersan
3 and
Flavian Clipa
4
1
Faculty of Law and Administrative Sciences, Ștefan cel Mare University, Universitatii 13, 720229 Suceava, Romania
2
Engineering and Management Department, Faculty of Industrial Design and Business Management, Gheorghe Asachi Technical University, Profesor Dimitrie Mangeron 29, 700050 Iasi, Romania
3
Faculty of Economics and Business Administration, Alexandru Ioan Cuza University, Carol I 20A, 700505 Iasi, Romania
4
Independent Researcher, 700505 Iasi, Romania
*
Author to whom correspondence should be addressed.
Sustainability 2021, 13(17), 9757; https://0-doi-org.brum.beds.ac.uk/10.3390/su13179757
Submission received: 17 July 2021 / Revised: 24 August 2021 / Accepted: 27 August 2021 / Published: 30 August 2021

Abstract

:
Against the backdrop of concerns for diminishing the vulnerabilities of the economies of the Member States, the EU has adopted measures to strengthen budgetary discipline and control of the public deficit. In this context, the responsibility of government institutions has increased, not only in ensuring the sustainability of public finances but also in direct or indirect cooperation for good economic governance. From this perspective, this study aims to assess the impact of macroeconomic variables and those associated with supreme audit institutions on the sustainability of public finances measured by the size and dynamics of government deficit and gross public debt. Additionally, the impact of the same variables on governmental effectiveness and control of corruption has also been assessed. The data collected from secondary sources and panel data models were used to conduct an empirical study of the EU Member States which covered the 2002–2019 period and the sub-periods, divided as follows: pre-crisis, crisis, and post-crisis. The results of the study show that supreme audit institutions, through their organizational structure, the nature of their activities, and professionalism, may contribute to the reduction of public deficit and gross public debt and, implicitly, to higher efficiency and control of corruption. The results of analyses for the sub-periods show that ISAs played a more important role in reducing government deficit during crisis and post-crisis periods. By confirming or rejecting the results of the few studies that have been conducted so far, this study provides additional evidence that fills the gaps in the literature.

1. Introduction

As stated by the Stability and Growth Pact applicable in the European Union (EU) Member States, the concerns of governments for ensuring the sustainability of public finances should not be an end in itself but must also follow the rules of economic governance. The ultimate goal is the early detection of the causes of potential economic and financial crises. Therefore, according to EU regulations, public deficit control and budgetary discipline are preconditions for ensuring the sustainability of public finances and for sustaining the economic health of the Member States. Although these regulations were issued early on, discrepancies among the Member States in terms of their adherence to the imposed standards [1] increased their vulnerability prior to the 2008 crisis. To strengthen discipline, the regulations were integrated into the European Semester, an EU mechanism used for economic policy coordination.
Research on the sustainable development of nations, economies, and companies has lately gained momentum. Two of the three pillars of sustainability (economic growth and social progress) impose effective cooperation between business representatives and public authorities. This collaboration should mark the move from sporadic economic growth to economic development and social progress. Public finances play an important role in ensuring social progress. The literature reports such developments on the subject as the focus on the quality of public finance [2,3,4], public finance reform [5,6,7], the quality of public financial management [8,9], and the sustainability of public finances [10,11,12].
Over the last years, the concept of quality of public finance (QPF) has constantly gained higher significance. The focus has been on the role that could be played by public finances and fiscal policy in supporting the resilience of national economies and facilitating economic growth, employment, and competitiveness [2]. QPF has become more of a strategy oriented toward the sustainability of public finance than making the tax system and public expenditure policies more efficient, things that enable a country to stabilize its economy and react promptly to economic shocks, and allow a proper operation of goods, services, and labor markets [13,14]. In this sense, a mere change in the way public resources are allocated is not an efficient strategy for improving QPF; it must be supplemented by more efficient use of these resources.
New public governance strategies fuelled by the financial crisis, economic deceleration, and the need for governments to do more with less have forced countries to perform introspective analyses of governmental processes and their outcomes. Supreme Audit Institutions (SAIs) and other national and international institutions have unused potential to help governments cope with these challenges and are able to provide key evidence related to what works or what does not in public governance [15,16].
As a result of the reduction of available resources and higher expectations of stakeholders in institutions, the need emerged for better management and more efficient operation of SAIs. Consequently, more pressure has been applied for increasing the responsibility of these institutions towards the citizens and society and using their knowledge and social capital to help society adopt a resilient behavior when it comes to economic shocks, give support to sustainability overall, and focus especially on the sustainability of public finances. Higher SAIs performance may lead to lowering governmental expenditures, more efficient management of public finances, higher trust, transparency, and responsibility [17,18,19]. Most studies on SAIs concentrate on assessing the impact of the activities of these institutions on the use of public resources and public value creation [20,21,22,23,24,25]. Hay and Cordery [20] found more explanations generally helpful for public sector auditing (agency, signaling, governance, and confirmation, etc.). They believe that agency theory is the most relevant as agency relationships in the public sector are more complicated than in the private sector. There are agency relationships between voters and politicians, between the government and the Parliament, and between government and public servants. Barrios and Schaechter [14] maintain that some EU Member States are at high risk for their public finances to become unsustainable given their current debt levels and the projected costs for pension and long-term care systems. Therefore, a study investigating the impact of macroeconomic variables and the variables related to supreme audit institutions on the sustainability of public finances in the EU countries becomes extremely relevant and useful in the context of concerns for ensuring the sustainability of public finances. This research departs from the study of Blume and Voigt [26] that analyses the economic effect of the organizational structure of these institutions by building an SAI vector.
This study has two research aims: (1) to assess the impact of macroeconomic variables and the variables related to SAIs on the sustainability of public finances and (2) to assess the interdependencies between governmental effectiveness, the control of corruption, and the way SAIs are organized and operated. In order to identify the relations of interdependence among the SAIs variables, on the one hand, and public debt, governmental efficiency, and control of corruption, on the other hand, correlation and regression analyses were performed. The Data Analysis software was used to perform the statistical analysis for the suggested econometric models. A review of the current literature in the field found that the proposed line of research has been poorly developed. This study aims to fill this gap in the literature. The novelty of the study lies in the manner in which the interdependencies were assessed. The methods used here helped gain a better understanding of the impact of different variables on the deficit and governmental debt. Also, another element of originality that brings value to this study is the way these interdependencies for different phases of economic cycles were assessed.
The paper is divided as follows: the first section overviews the literature in the field on the sustainability of public finances and the role of SAIs in ensuring efficient use of public resources and in consolidating the trust of citizens in public governance; the next section describes the methodology and gives the details used in the construction of the sample and presents the variables used in the empirical study; the next section discusses the results; the last section summarises the conclusions, and presents the study limitations and the future lines of research.

2. Literature Review

2.1. Sustainability of Public Finances

Crises, whether financial, economic, social, or pandemic, bring back into discussion the need to ensure the overall sustainability of the economy, especially public finances. Budgetary imbalances leave a mark, both on world economies [11] and free-market economies. The growth of public expenditures compared to income is a scenario that generates a public budget deficit. Expenditure financing (whether for current spending or investments) requires governments to have proper policies in place for attracting public resources. To decrease the public budget deficit, governments have at their disposal two strategies: reduction of public expenditures and growth of revenue. Public finance experts show that budgetary-neutral investment spending may bring the highest number of long-term benefits. [11].
Most often, public expenditure reduction is not favorable for the image of governments. Therefore, the focus is placed on new sources of revenue. From the perspective of revenue structure, governments choose between increasing ordinary (especially fiscal) revenue and extraordinary revenue (such as public loans). Inevitably, out of concern for not damaging the political image of governments, financing through loans is seen as a better option than the growth of fiscal burden (that could lead to loss of voters).
Discussions regarding public finances comprise issues such as the reform of public finances [5,6,7], quality of public financial management [8], and public finance sustainability [10]. Studies have reported that less developed economies are more exposed to the risks of short-term budgetary deficits [27]. Nevertheless, these countries may demonstrate good resilience of public finances in the medium and long-term, a more fragile fiscal basis, and higher sensitivity to macroeconomic shocks (cyclical fluctuations, financial contagion, etc.).
Concerning the sustainability of public finances, the study by Schick [28] was significant as it showed that sustainability could be divided into four dimensions (which are mutually interrelated): solvency, growth, stability, and fairness. Solvency is the government’s capacity to pay its financial obligations. Growth reflects the degree to which fiscal policy supports economic growth. Stability is the government’s capacity to undertake its future obligations with the current tax burden. Fairness is seen as a government’s capacity to pay its current obligations without transferring their cost to future generations. The central pillar in the sustainability of public finance is its fiscal policy, which is viewed as having the capacity of stimulating/slowing down economic growth. Out of the four pillars of public finance sustainability, most concerns are related to the growth of fiscal burden and government indebtedness, which have the risk of being transferred to future generations.
The literature in the field focused on the sustainability of public finances tried to explain not only the causes of rapid growth in public debt but also its effects on sustainability, not only for public finances but also for the entire economy. It appears that the long-term sustainability of public finance is essential for economic stability and growth and also for maintaining public spending expenditures at an adequate level [29].
Public authorities cannot (at least, should not) incur continually growing debts. Despite this fact, many countries, including some economies of Central and Eastern Europe, generated high volume (still in fast growth) of public debt. In this context, several basic questions arise. Such as, should public finance from indebted economies be considered sustainable or seeking sustainability? Could public finances be considered sustainable? To answer these questions and compare the results of different countries, the research should focus more on the volume of deficit and debt than on the volume and dynamics of public revenue and expenditure. These are very important, and among other things, also relevant for any country’s political system, level of development, and fiscal needs (which could be hard to compare). The level of deficit and debt, seen as a result of fiscal and public spending policies in different economies, could be compared more easily.
To shape a profile of public finances in South-Eastern Europe, Vukčević and Jovović [30] studied the link between the quality of public finance and a set of variables, such as socialist heritage, politicization as an abuse of macroeconomic policies, instability of institutional environments, human capital deficits in the area of public finances, and financial accountability deficits. The authors underlined that financial sustainability should be based on a sustainable fiscal framework, strategic planning, and budgeting of expenditures.
As mentioned earlier, the sustainability of public finances depends on the sustainability of the national economy. Therefore, it is expected that the sustainability of public finance should oscillate with each economic cycle. As arguments in favor of these interdependencies, the following could be mentioned:
-
fiscal consolidation, as such, contributes to the stabilization of key macroeconomic aggregates [1,31];
-
institutions play a key role (inevitable and a priority) in economic and social development [32,33,34];
-
countries with weak institutional structures are more vulnerable to a crisis, also measured by a decline in production and by other economic indicators [30];
-
weak institutions are sensitive to shocks, which could make collaboration among decision-makers hard to achieve [35].

2.2. Supreme Audit Institutions

Globally, there are almost 200 SAIs with different structures and responsibilities that function under different political and economic contexts, and whose general objectives include: accurate and efficient use of public funds; development of good financial management; accurate carrying out of administrative tasks; provision of information to the general public and authorities. Through these activities, SAIs contribute to the growth of responsibility, transparency, and integrity in the public sector, necessary conditions for the stability and development of the states [36]. Several studies [37] discuss the issue of ethics as the fourth objective that SAIs should consider together with efficiency, economy, and effectiveness.
As for the types of SAIs and their activities in different states of the world, the World Bank’s classification has been the most widely used. It stipulates that there are court (Napoleonic or judicial), Westminster, and board models [38]. Also, there are other classifications of SAIs, such as the classification included in the INTOSAI (The International Organization of Supreme Audit Institutions) database comprising five possible models: Westminster; board/collegial; court/judicial; part of a Ministry of Finance; or another institutional model.
In the EU, SAIs with a collective structure of governance are highly heterogeneous in the number of people and by the names given to their governing. As for the name given to the Head of SAI, there is a high variability in the EU countries with such names as Auditor General (most common), President, and Comptroller and Auditor General. The SAIs’ activities in the EU countries vary significantly, but all audit central governments, state enterprises, and public bodies. Auditing local governments and municipalities is an activity that was found only in about half of SAIs.
The human and financial resources of SAIs differ greatly by country, whether taken as a proportion of the number of inhabitants or as audited budgets. Studies conducted by Blume and Voigt [26] and Cordery and Hay [39] show a high variation in SAIs budgets, from EUR 1.14 per 100,000 population in the United Kingdom to EUR 7.62 in Luxembourg. Cordery and Hay [39] suggest that “the size of the country is important and that there appear to be fixed costs in establishing and running SAIs that are larger per head of population in a small country”. However, there are large differences in the funding of SAIs in countries with similar populations: Italy and Malta have high expenditure per head (EUR 5.13 and EUR 7.39) compared to Spain (EUR 1.33), ), or the Slovak Republic (EUR 1.97) [39]. Moreover, the data provided by the European Court of Auditors (2019) indicates very large differences between EU countries in the number of staff, SAI budget (million euros), and SAI budget per staff member.
Financial audits aim to provide assurance regarding correctness in public spending. This type of audit underlines the relationship between the employees of governmental bodies (as agents) and taxpayers (as the main beneficiaries) [39]. Historically, one of the first activities of SAIs was a compliance audit, or checking the government’s compliance with spending policies [39]. This type of audit is still important in countries such as Belgium and Greece [40]. The mid-1970s marked the appearance of the new Public Management (NPM). This brought with it a concern for public sector performance, including efficiency, efficacy, and economy [41]. A performance audit called the “value for money” (audit VFM) [42] was added to SAIs’ mandates only a few decades ago and is oriented at programs and policies assessing efficiency, economy, and efficacy in the use of resources.
Once the focus of SAIs’ objectives changed from traditional financial audits to performance audits, the interest of researchers toward these institutions and the results of their activity have grown. Still, the literature discussing the results of SAIs is quite limited and mainly includes studies that used qualitative research methods [43]. There are three theoretical frameworks applied to these institutions: (1) the agency theory [44], (2) the neo-institutionalist approach [45,46], or (3) the socio-psychological theories [47,48]. These theoretical approaches do not represent a solid theoretical framework as they are not integrated into a consolidated theoretical body with clearly defined milestones. Seen as a “pillar of integrity” and part of the “national system of integrity”, SAIs can be a very effective means for promoting transparency and openness of government operations and can contribute to higher government performance [49]. Some authors showed that the professionalism of SAIs staff contributes to governmental effectiveness [50,51].
Although prevention of corruption is not the explicit responsibility of the supreme audit institutions, they may detect fraud and abuses after performing their activities. So, the quality of SAIs actions is essential in detection and prevention through the promotion of transparency and responsibility in governmental programs and actions. SAIs could underline the likely losses due to legislative gaps and ask that anti-corruption measures be adopted [52]. Dye [53] argues that SAIs should encourage the adoption of anti-corruption policies for the government and assist in the development of anti-fraud programs, and later auditors should audit policy implementation. There is a relatively low number of studies on how SAIs influence governmental effectiveness and corruption. This study found, in line with [54,55,56], that although there is evidence that audits in the public sector may contribute to fighting corruption, there are few studies investigating the role of SAIs in detecting and fighting this phenomenon and in deeply analyzing the contribution of different types of audits to fight against corruption. Assakaf et al. [54] argue that no one has managed to give a specific answer to how SAIs contribute to preventing and fighting corruption, and there are no studies researching the link between the performance of audits in the public sector and corruption.
Blume and Voigt [26] measured the effectiveness of SAIs in different models and concluded that if there is an effective SAI in a country, government expenditures should be lower and governmental effectiveness should be higher. Similar results were reported by Cordery and Hay [39], who analyzed government effectiveness considering the types of audits conducted. They also found that financial and performance audits are associated with higher governmental effectiveness, while compliance audits appear to be associated with lower governmental effectiveness.
The empirical studies conducted by Pereș et al. [57], Tara et al. [58], and Gherai et al. [59] (with variables describing SAIs as being correlated with governmental effectiveness, the efficiency of the government, and corruption) proved that the existence of supreme audit institutions has a positive influence on the efficacy and efficiency of the government and a negative influence on the level of perception of corruption. Other studies [60,61] suggest that a properly functioning SAI is a necessary component of the sound financial management of government. Using data from a survey covering more than 100 countries, Gustavson and Sundström [55] conducted a study (using an OLS regression model) showing that good auditing has a positive effect on national levels of public sector corruption. A study indicating a direct and strong link between the activities of SAIs and corruption was conducted by Olken [62]; its results suggested that an increased probability of external audits substantially reduced the missing funds in a project. Specifically, increasing the probability that a village would be audited by the central government audit agency from a baseline of 4 percent to 100 percent reduced missing expenditures from 27.7 to 19.2 percentage points.
Liu and Lin [63] conducted an empirical study using China’s provincial panel data from 1999 to 2008 to examine the role of SAIs in China’s corruption control initiatives. The study results indicate that the number of irregularities detected in government auditing is positively related to the corruption level and provides empirical evidence on how SAIs can contribute to curbing corruption. When analyzing the organizational models of SAIs, Blume and Voigt [26] and Cordery and Hay [39] found an association between the court model and reduced government effectiveness. They found that court model countries appear to have a higher level of corruption than the other groups, without establishing a clear cause and effect relationship as to whether there is more corruption in the court model or if countries with more corruption chose this model as a solution to this problem.

2.3. The SAIs and Public Finances Sustainability

The literature has widely acknowledged the importance of SAIs in public debt management of the state [64] and in ensuring the financial stability of the budgets of developing countries [65].
A line of research that establishes a link between the architecture of SAIs and the sustainability of public finances includes the analysis of the impact of the organizational and operational structure of SAIs on fiscal policy. In this sense, single-country studies (Switzerland, Romania) show that public expenditures and tax burden decrease where independent audit institutions have an extended mandate of auditing the public budget [66]; there is a positive relation between SAIs structure and tax burden reduction [67] or a positive impact between the SAIs’ mandate and tax morale [68]; the external audit performed by these institutions play a key role in regaining the trust of the population in regard to the quality of the financial system [21].
A pioneering cross-country study had ambiguous and insignificant results that question the efficacy of these institutions: the institutional and organizational structure of SAIs does not significantly influence the governmental expenditure or public deficit, and a more extended mandate may relate to governmental deficit [69]. Another study [26] sought to identify the economic consequences of SAIs activity using data covering 44 states; it found that variables such as independence, mandate, and the organizational design of the SAIs have no influence on fiscal policy, government effectiveness, and productivity. Concerning the relationship between the independent variables linked to the functioning of SAIs and government debt, Yalçin [70] found in a descriptive study on Turkey during 2006–2013 that the independence of SAIs impacts the reduction of public debt and contributes to ensuring the sustainability of government debt through the contribution of external audit to public expenditure reduction.
Efficient management of public debt is a priority, especially at a time when a quarter of OECD (The Organisation for Economic Co-operation and Development) countries [71] and one-fourth of EU Member States [72,73] show a level of debt exceeding 100% of GDP. Regarding the role of SAIs in the future, recent studies [74] stressed that these institutions will be facing challenges generated by uncertainty and will be the ones that will describe the capacity of governments to react promptly and properly to the crisis generated by the evolution of Covid-19, including the sustainability of public finances. Moreover, these external and unpredictable forces will generate institutional mimesis converging towards structural parallelism with the organization and functioning of these institutions [75].

3. Methodology

To investigate the sustainability of public finances, special attention should be given to the following aspects: careful selection of instruments/tools used to measure the variables and their accurate representation; assessment of data sources (it is known that secondary data provide historical information, while primary data, based on observation, are not relevant for longer periods of time); sample representativeness (lack of homogeneity limits the representativeness; focus on specific areas/fields limits generalization). In view of this, this study opted for a sample-based cross-sectional analysis that makes use of data collected from secondary sources. To capture the influences specific to the phases of economic cycles (pre-crisis, crisis, and post-crisis), this research extended the analyzed period to 18 years (2002–2019). The arguments underlying the selection of this period for analysis included:
-
concern for selecting a period of analysis not exposed to major transformations; 2002 is the year of single currency introduction in 12 of the 15 Member States; The largest EU expansion took place in 2004, but the ten new states had been already engaged in ensuring the stability of institutions guaranteeing democracy, the rule of law, and human rights;
-
availability of data at the time of database construction.
The selected sample comprises 28 countries (countries with EU Member State status in the last period of analysis). The inclusion into the analysis of all Member States is justified by the fact that they all have set up mechanisms ensuring public expenditure liability and ensuring that these are transparent and rigorously supervised—an important role being played by the SAIs.
To assess the impact of macroeconomic and SAIs-associated variables on the sustainability of public finances, this study considers six causality models for a dependent variable and several independent variables (explanatory). For the regression models that will be defined and tested, the dependent variables are:
-
Government deficit/surplus, debt, and associated data (GDS). EUROSTAT [72] and ONS [73] calculate this indicator as a proportion of net lending (+)/net borrowing (−) to the total gross domestic product. The indicator is given a positive or negative value depending on whether the budget execution ends with a surplus or deficit. This indicator was selected to emphasize solvability (defined as the government’s capacity to pay its financial obligations [28]), one of the four dimensions of public finance sustainability. According to the Maastricht Treaty, the reference value for this indicator is 3%.
-
General governmental gross debt (GGGD). According to the EUROSTAT [72] and ONS [73] methodology, public debt includes the elements of gross liability in cash and deposits, debt instruments, and loans that exist at the end of the year in the public administration sector, calculated at nominal value and consolidated. This indicator was selected to assess fairness (defined as the government’s capacity to pay its current obligations without transferring its costs to future generations [28]), one of the four dimensions of public finance sustainability. This indicator reflects the size of public debt as a percentage in GDP, and it is representative of the entire public administration sector (it includes both the government’s and central public administration’s debts, as well as the debts of local administration and social security funds). According to the Maastricht Treaty, the reference value for this indicator is 60%.
-
Government effectiveness (GE). According to the World Bank [76], this indicator measures the degree of satisfaction of citizens with the public services provided by the state and the degree of independence in the exercise of public office from political interference. The estimation of this indicator is a score situated in the interval of standard distribution between [−2.5, 2.5]. The introduction into the analysis of this indicator aimed to assess the degree to which SAIs, through their organizational structures and quality of activities, ensures the fair use of public resources.
-
Control of corruption (CC). Calculated by the World Bank [76], the degree to which political power is diverted to serve individual/private group interests and the degree to which the state is “captured” by elite and private interests. The estimation of this indicator is a score situated in the interval of standard distribution [−2.5, 2.5].
The arguments underlying the selection of these four dependent variables are: the first two provide an internal perspective and evaluate the two facets of public finance sustainability (according to [28]); The following two (considered variables Dummy for Government Effectiveness and Control of Corruption) allow an external evaluation from the perspective of citizens’ perceptions of how to manage public resources.
For the explanatory variables, this study considers two datasets: (i) one dataset describing the dynamics of national economies: the GDP growth rate, the rate of unemployment, and inflation rate [77]; (ii) one dataset describing the activity and organizational structure of SAIs; their structure, the estimation method, and the attributed labels are shown in Table 1.
The independent variables for SAIs selected from the countries included in the sample were collected from the paper, Public Audit in The European Union [78]. By analyzing the regulatory framework for SAIs in these countries, this study found that in most countries, SAIs legislation was adopted before 2002, which allowed considering the data for the entire analyzed period as representative. The only exceptions were Denmark, Italy, and three former communist states—Bulgaria, Croatia, and Hungary, which adopted new legislation during the analyzed period. For these countries, the database was reviewed by taking into account the old and the new legislation. For example, in the case of Denmark, the Auditor General Act of Denmark (from 1976) was consolidated in 2012. According to information provided by [79], in 1991, the Rigsrevisionen was transferred from the Ministry of Economic Affairs to the Parliament; this integration remained valid even after the adoption of the legislative modifications of 2012. The consolidated Act (2012) brought changes related to the mandate of the general auditor, which was reflected in the built database. In the case of Italy, Law No 213/2012 introduced changes only to the harmonization of accounting systems and to the budget structure of public administrations, so this regulatory act had no impact on database construction.
When looking into the National Audit Office Act adopted in Bulgaria [80], this study observed that the National Audit Office remained an independent institution performing financial, performance, and compliance audits, as well as other special audits (such as ad-hoc audits). Its activity is related to central, municipal, and other state budgets and accounts for the EU funds and state enterprise; the management still was given a 7-year mandate. Therefore, the variables included in the analysis are valid.
For Croatia, the regulatory act was compared with the State Audit Act of 1993 [81], and no large differences were found in terms of analyzed indicators. By studying the New Act on the SAO adopted in Hungary and the Deed of Foundation [82], three issues were found: the new act supported the consolidation of independence and transparency of reports (in line with international trends), preserved the status of the “audit office” (rooted in the architecture of the National Assembly), and brought changes to the length of the mandate of representatives.
To follow the interdependencies among the selected variables, the study opted for a two-fold analysis: (i) an analysis of the entire period and (ii) an analysis by phases of economic cycles. The phases were set by taking into account the dynamics of the GDP growth rate (Figure 1). In this study, 2002–2007 is the pre-crisis period, 2008–2013 is the crisis period, and 2014–2019 is the post-crisis period; the division into these phases is also justified by the dynamics of other indicators that capture monetary and labor market imbalances.
Figure 2 is explicit as it validates the theory that monetary imbalances (the rate of inflation becomes more vulnerable to economic variations) and labor market distortions (the rate of unemployment grows) are amplified during crisis periods.
Considering the above and the specific features of the sample that will be used in the analysis, the following hypotheses will be tested:
Hypotheses (H1).
SAIs may contribute to the reduction of deficits and governmental debt, and accordingly, to the growth of public finance sustainability by means of their organizational structure, nature of their activities, and professionalism.
Hypotheses (H2).
SAIs may contribute to the growth of governmental efficiency and control of corruption by means of their organizational structure, nature of their activities, and professionalism.
To identify the relations of interdependence among the SAIs variables, on the one hand, and public debt, governmental efficiency, and control of corruption, on the other hand, correlation and regression analyses have been performed. The Data Analysis software was used to perform the statistical analysis for the suggested econometric models. As the data in the sample explore a set of 17 indicators for 28 states over a period of 18 years, the regression analysis was adapted to panel data (fixed effects). This method processes repeated observations at various times for the same entity. The results of this method take into account both structural changes and cyclic fluctuations. The general equation of applied regression models is the following:
Yit = Xit·β1 + Zit·β2 + uit
where: i represents the countries included in the analysis, t is time (2002–2019); Yit is the dependent variable (in this case GDS, GGGD, GE, and CC); Xit is the vector for macroeconomic independent variables (GDP, UR, IR); Zit is the variables associated with IAS (Gb, M, Rm, S, Ns, C, O, D, Ta, Sa—as IAS variables); Zit are the vector for control variables (CS, LL, and SGR); β1 and β2 represent the coefficients; uit is the error term.
The regression analyses were run for four time-intervals: 2002–2019; 2002–2007 (pre-crisis), 2008–2013 (crisis), 2014–2019 (post-crisis). The results of these analyses are presented and discussed in the next section.

4. Results and Discussion

As mentioned in the previous section, in order to identify the relations of interdependence between public finance sustainability and its determinants, correlation and regression analyses were performed. Before carrying out these analyses, we summarised the results of descriptive statistics (Table 2). The results show that the analyzed indicators had no significant variation during the analyzed period, except for GGGD.
Average GDS (government deficit/surplus, debt, and associated data) is negative (−2.1), which indicates that government deficit prevails in the sample. With variations between −32.1% and 10% of GDP, the indicators reflect the shortcomings in the management of public resources and the incapacity of governments to pay their financial obligations, respectively. Countries with the highest value for this indicator (representative and positive mean for the analyzed period) are Great Britain, Finland, Denmark, and Luxemburg. On the other end are Ireland, Greece, and Portugal. The minimum value (−32.1%) was found for Ireland in 2010, and the highest (10.0%) for Great Britain, also in 2010.
Average GGGD indicates that the consolidated gross average debt is 56.9% of GDP. The highest values were found for Great Britain for 2002 (1.9), and the most unfavorable was in Greece for 2018 (186.2%). The means by country and period (2002–2019) show that the highest values were found in Great Britain (4.57%) and Estonia (7.23%), Greece (144.8%) and Italy (120.2%) being situated at the other end.
For GE, the indicator mean value is 1.1. Considering that the interval for this indicator is [−2.5; 2.5], the perceptions of most respondents are in the positive area of the interval (0; 2.5], although the situation is far from being positive. The most negative perception towards the quality of public services was found in Romania (−0.4 in 2009). The highest number of positive views was found in Denmark in 2007. The means by country and period (2002–2019) indicate that the most positive values appear for Finland (2.08), Denmark (2.06), and Sweden (1.93); at the other end being situated Romania (−0.23), Bulgaria (0.15) and Italy (0.47).
For control of corruption (CC), the indicator mean value is 1. Compared to the previous indicator (with the same distribution interval of perceptions), this indicator put countries under a more unfavorable light. Respondents in Denmark have the most favorable perception of control of corruption, getting close to the upper end of the interval (+2.4). At the other end is Romania with (−0.4). The analysis of means by country and period (2002–2019) indicate that the most favorable perceptions are found for Denmark (2.33), Finland (2.29), and Sweden (2.20); Romania (−0.19), Greece (0.09), and Croatia (0.13) being situated at the other end.
Concerning the explanatory macroeconomic variables, the descriptive statistics could be interpreted as follows:
-
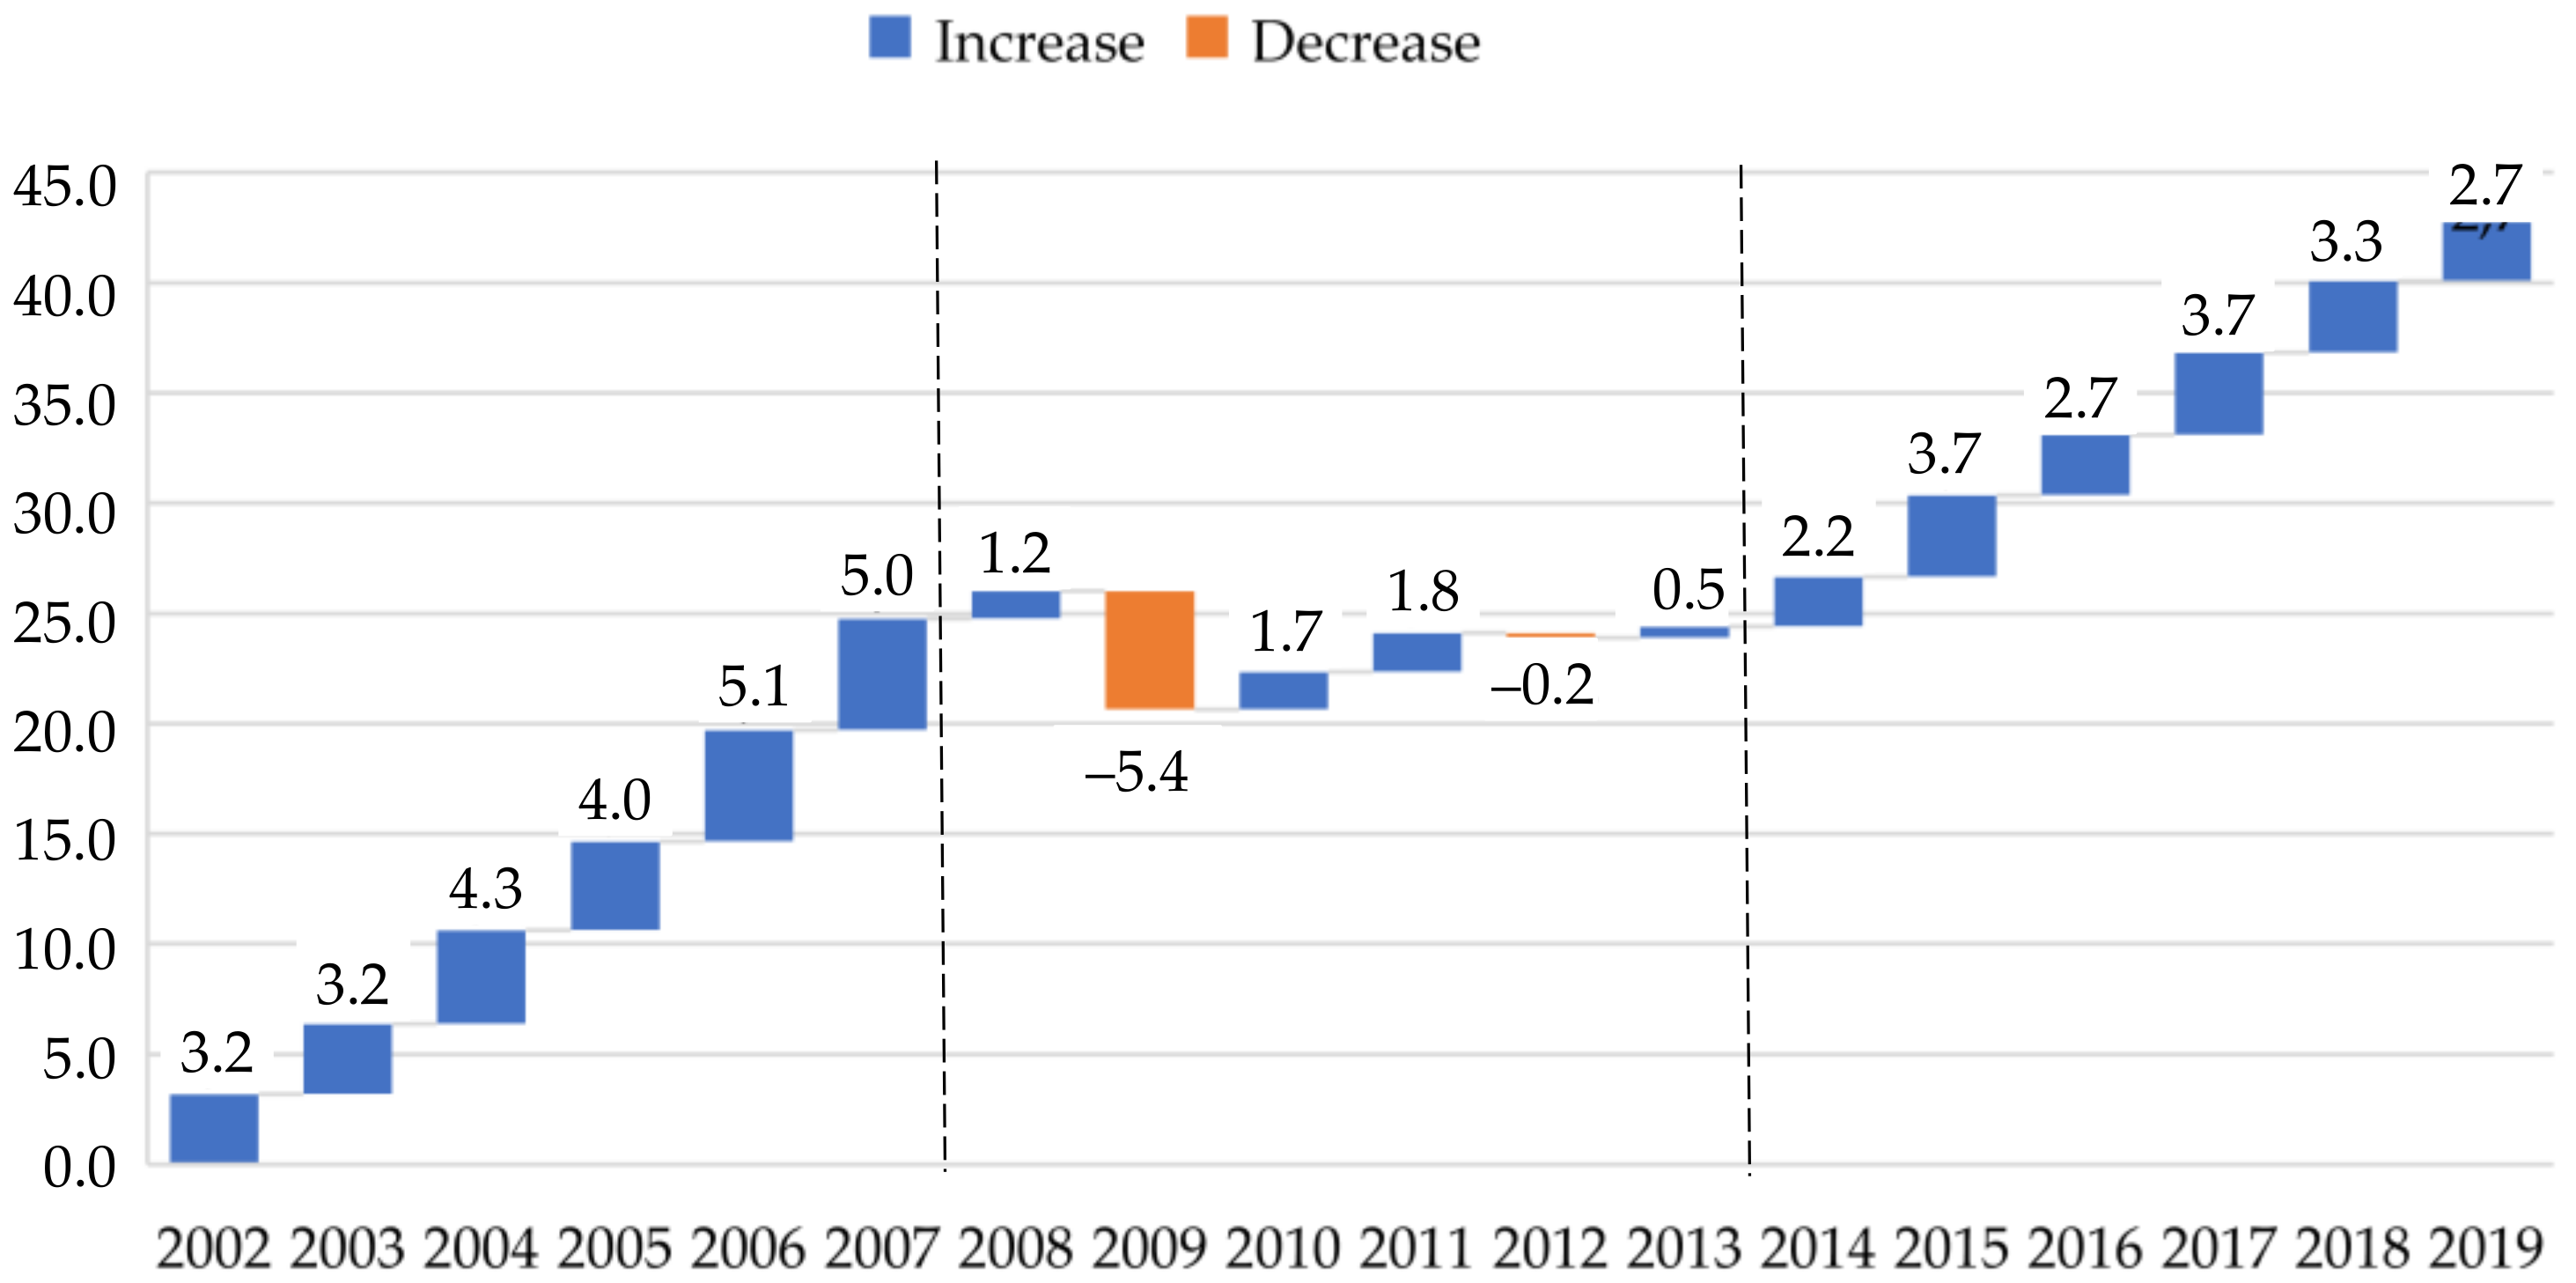
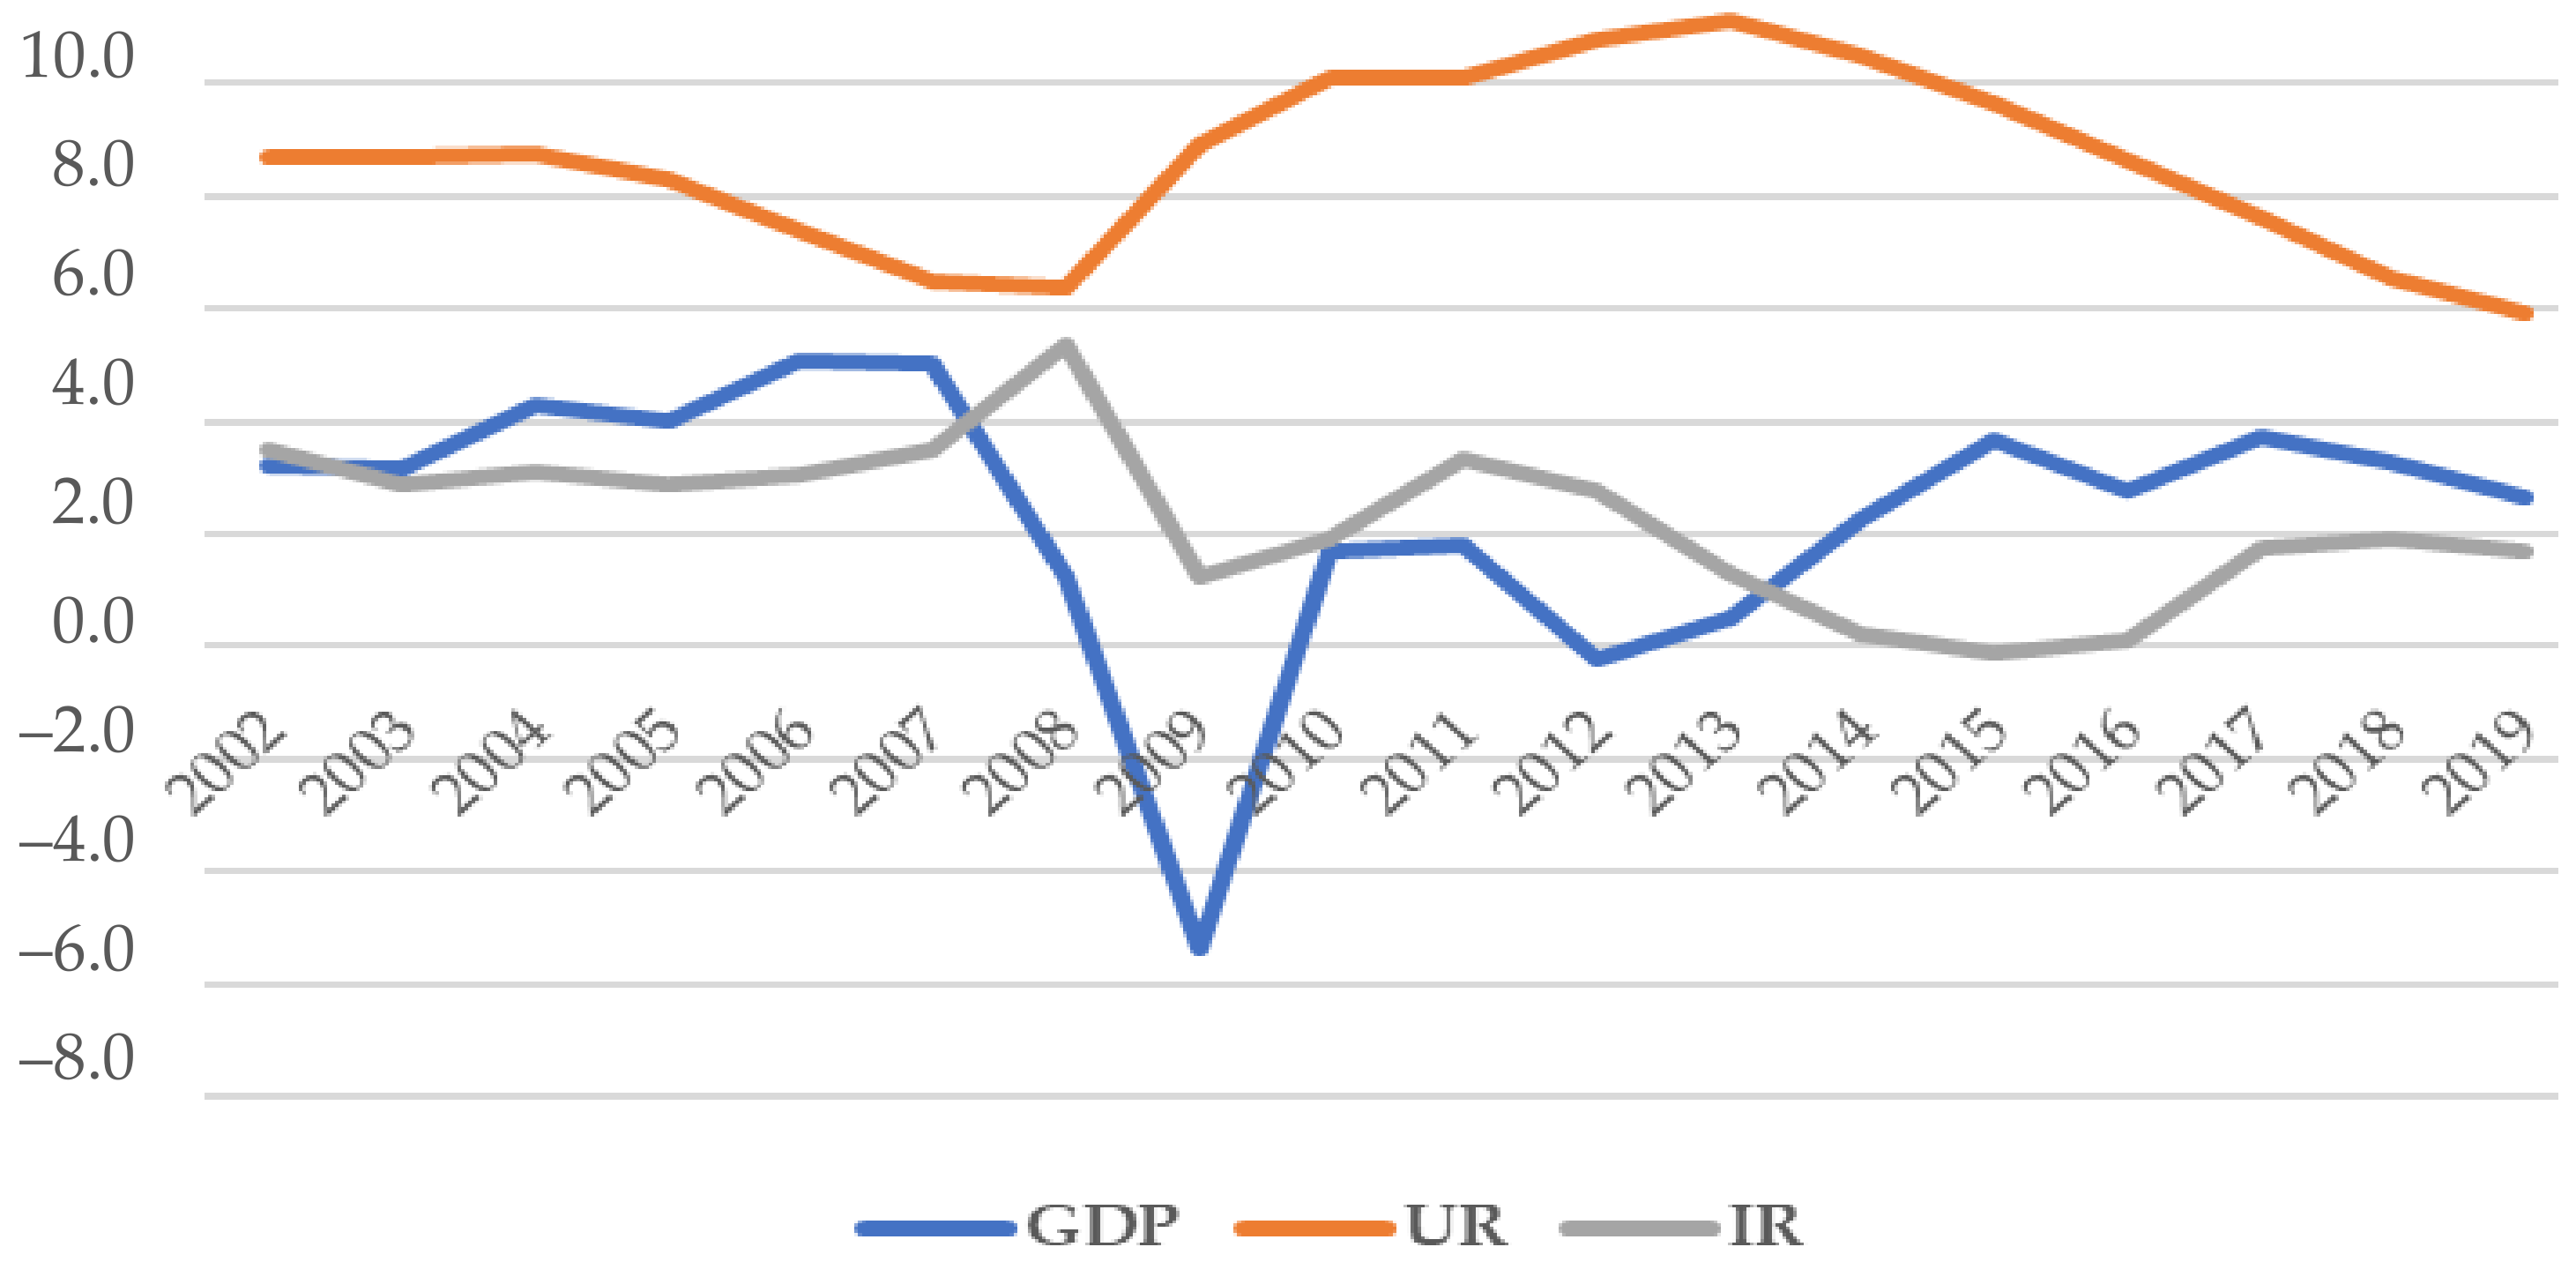
The average GDP growth rate was 2.4%, oscillating between a minimum of −14.8% (Lithuania, 2009) and a maximum of 25.2% (Ireland, 2015);
-
The average unemployment rate was 8.6%, indicating that about 9 out of 100 active people were jobless; the lowest rate of unemployment was found in the Czech Republic (2.01% in 2019), and the highest in Greece (27.5% in 2016);
-
The average inflation rate was 2.2%; the inflation rate oscillated between a minimum of−4.5% (Ireland, 2009) and a maximum of 22.5% (Romania, 2002).
The variables describing the activity and the organizational structure of SAIs could be described as follows:
-
In the countries included in the sample, SAIs are governed either by a president (14 countries) or a governing body (14 countries); the average mandate is 13 years, keeping in mind that 5 out of 28 states have no legal provision for the length of the mandate; to make the calculations for these states, a general longest mandate of 40 years was considered;
-
In the case of 22 states, the mandate for the representatives of SAIs is renewable (mean Rm = 1.2);
-
Fourteen belong to governmental control bodies, seven have jurisdictional positions, and eight do not belong to any of these bodies (mean 2.1);
-
SAIs in the EU Member States have, on average, 556 employees; the biggest organizational structure was found in Italy (2658 employees), and the smallest in Luxemburg; as this indicator is relevant if it is interpreted in a sterile way, it was calculated as the number of SAIs employees per 1 million inhabitants; in this case, the states with the biggest organizational structure (over 1000 employees) are: Romania 1/83, Italy 1/44, Poland 1/42, and Germany (1/14); for the entire sample, the most negative situation was found in Cyprus (with a ratio of 1/160), Malta (1/145), Lithuania (1/103), and Romania 1/83); the most favorable values appear for France (1/11), Great Britain (1/13), the Netherlands, and Germany with one SAIs employee to 14 citizens;
-
Regarding the scope of SAI competencies, in ten countries it covers all levels that use public money (central, regional, and local; SAIs in seven countries only audit the financial statements of central, regional and local public administrations and state enterprises);
-
Regarding the number of years of SAIs activity, it differs by country (varying from 16 to 212 years); the mean value of the sample is 72 years;
-
SAIs in five states have explicit legal provisions for the responsibility to take action for financial/public debt;
-
All 28 SAIs in the analyzed countries perform financial and performance audits; only six performing legality and regularity audits, and 16 conducting compliance audits; Four SAIs perform special audits, such as technical and environmental audits (Cyprus), an external audit of EU community public funds (Romania), and budgetary policy audit (Finland).
As regards the analysis of data symmetry/asymmetry, the data in Table 2 show the following:
-
As a symmetry measure, Kurtosis indicates that 11 of the 17 variables have values lower than 3 (meaning a flattening of the curve reflecting the distribution of values); four variables (GDS, GDP, IR, and M) take values higher than 3 (indicating a leptokurtic distribution); only one of the variables (UR) has an average bolt value (3.1);
-
Ten of the analyzed variables have an approximately symmetrical distribution (Skewness taking values between E −1/2 and +1/2); seven variables show asymmetric distributions (skewness values being less than −1 or higher +1); a single variable has a moderate asymmetric distribution (GGGD).
The correlation analysis showed only one strong association among the variables (details in Table 3). GE and CC show a positive and very strong correlation; due to this fact, these variables will not be included in the same regression model.
The results of the regression analysis are summarised in Table 4. R Square indicates that only 36% (37%) of the GDS variation and 58% (60%) of the GGGD variation may be explained by variation of the independent variables included in the regression models. Then, 66% of the GE variation and 70% of the CC variation may be explained by the variation of the same independent variables. The level of confidence was 95%, with a significance level of 0.05. For the ANOVA test, the Significance F has a lower level than the significance level and is different from 0, which validates the proposed regression models.
The results of the first regression analyses processing data for the entire period are summarised in Table 5.
Considering the values in columns 8–9 of Table 5, the GDS, section, it may be noted that the p-value (which is the bilateral critical probability of the t-test for hypotheses mentioned in the t Stat) is below 0.05 for 7 out of the 14 variables included in the analysis, which means that the null hypothesis for the coefficients of the 7 variables (marked in grey color) is rejected. Lower than 95% and Upper than 95% indicate the lower and upper limits of the confidence level for each variable.
The first regression models could be noted down as:
Model 1: GDS (with GE) = 2.19·GE + 0.33·GDP0.22·UR0.04·IR0.97·Gb0.03·M + 1.33·Rm + 0.35·S+
0.31·Ns0.13·C0.41·O + 0.64·D + 0.07·Ta0.92·Sa3.27
Model 2: GDS (with CC) = 1.61·CC + 0.32·GDP0.21·UR0.06·IR0.98·Gb0.03·M + 1.20·Rm + 0.34·S+
0.21·Ns0.12·C0.45·O + 0.44·D + 0.05·Ta0.64·Sa1.52
The results of the first regression analyses (on the GDS model, considering the GE and the CC row, respectively) do not differ significantly, which ensures a reciprocal validity of the two models. The only difference is the statistically significant negative impact of Sa over GDS. Therefore, the next discussion will interpret the results by considering the two models.
There is a positive and statistically significant relation between GDS, on the one hand, and the GE&CC, GDP, and Rm, on the other hand. In other words, with high GE and growth of GDP, governments are allowed to accept higher deficits (the reference threshold of 3% of GDP); i.e., most of the GDP growth rate allows governments to accept higher deficits (Model 1). On the other hand, according to Model 2, growth in positive perceptions of control of corruption has an impact on the growth of governmental deficit; this interdependence may be explained by the fact that in order to ensure rigorous control of corruption, the governments should spend additional amounts, which could lead to the growth of deficits.
Concerning the SAI variable (whose impact proved to be positive and statistically significant), the results indicate that the renewable mandate option (Rm) for SAIs representatives leads to growth in GDS. It could be justified if it is considered that keeping in office the same representatives of SAIs may bring additional public expenditure. In other words, appointing new representatives for SAIs bodies (at the end of the mandate of previous representatives) may allow a more rigorous control over governmental expenditures and implicitly over the deficits.
There is a negative and statistically significant relation between the GDS, on the one hand, and UR, Gb, O, and Sa, on the other hand. The growth of UR (unemployment rate) generates a decrease in GDS; it could be explained by the fact that growth of unemployment at the country level may cause the government to allocate fewer resources (as there are fewer unemployed people), and therefore, have low deficits. Then, the representation method of SAIs (one person or a group of people) has a negative impact on GDS; considering that there is no dominance on this line (50% of SAIs being represented by governing committees), this result of the regression analysis is more difficult to interpret. Regarding the length of service (O-old), the analysis shows that GDS decreases as SAIs have more years of service; in other words, in countries with younger SAIs, there could be a growth of government deficit. To generalize, it may be accepted that there is a link between public deficit and maturity reached by SAIs as an effect of the learning curve. Compared to this generalization, it may be noted that there could be a set of parameters that could cancel it, such as legislative instability, a decrease of allocated funds for running a specific activity, or political interference, such as the appointment of SAIs management using biased criteria.
In Model 2 (which considers CC), Sa appears as a negative and significant influence for special audits (technical audits, environmental audits, EU community public funds audits, etc.). In other words, special audits incur additional public expenditure. In this context, governments are likely to have higher deficits.
According to Table 5, eight out of 14 variables (IR, LN_M, S, LN_Ns, C, D, Ta) now show statistically significant influence on GDS. The regression models with GGGD as a dependent variable (according to data in the second part of the table) could be noted as:
Model 3: GGGD (with GE) = −11.15·GE0.78·GDP + 2.11·UR2.20·IR4.98·Gb + 0.84·M + 16.30·Rm1.58·S
0.99·Ns + 5.14·C + 20.33·O2.95·D14.29·AM + 18.01·Sa54.17
Model 4: GGGD (with CC) = −14.32·CC0. 38·GDP + 1.84·UR2.29·IR4.62·Gb + 0.99·M + 16.49·Rm
2.62·S1.41·Ns + 4.34·C + 22.57·O0.80·D11.73·AM + 17.11·Sa57.51
Even in this case, the coefficients of regression models (3 and 4) do not differ significantly, which allows a joint interpretation of results. There is a negative and statistically significant relationship between GGGD, on the one hand, and GE&CC, GDP, IR, and Ta, on the other hand. In Model 3, the decrease of GE is associated with the growth of public debt; the first sign of the efficiency of governments is growth in public expenditure without any socio-economic or technical justification; insufficient revenue (or incapacity to identify and collect revenue) to cover public expenditure orients public administration towards indebtedness. In Model 4, growth in positive perception of control of corruption is associated with a decrease in public debt (and the opposite, a deterioration in the perception of control of corruption is associated with the growth of public debt).
Both models (3 and 4) show that GDP growth may alleviate the gross debt of public administrations. On the other hand, the growth of the inflation rate may lead to the reduction of public debt (due to erosion of the purchasing power of the currency). In both models (3 + 4), the Ta (Types of audit) as a variable associated with SAIs has a negative and significant influence on GGGD. In other words, using different types of audits (legality or regularity audits, compliance audits) strengthens discipline in the use of public resources and diminishes governmental indebtedness.
The next two regression models have GE and CC as dependent variables. The result of the analysis is shown in Table 6. As it has been shown in the first part of this section, even these models are valid and relevant for the context of this research.
Model 5: GE = −0.02·GDP0.02·UR0.03·IR + 0.04·Gb + 0.02·M0.11·Rm0.13·S0.16·Ns0.09·C
+ 0.23·O + 0.04·D + 0.18·Ta + 0.19·Sa + 1.47
Model 5 indicates that there is a negative and statistically significant relation between GE, on the one hand, and GDP, UR, IR, Rm, S, Ns, and C, on the other hand. Growth in the value of macroeconomic variables introduced into the analysis generated the decrease of GE. It occurred as the growth of GDP in the context of the growth of allocations for productive investments (to the detriment of unproductive investments) affecting the perception of GE. Also, in the context of higher monetary imbalances and distortions on the labor market, the governments adopt measures for rebalancing, which improves the perception of the efficacy of their policies.
The mandate renewal option for SAIs representatives, belonging to a specific body (legal) (S), number of employees (Ns) in SAIs, and the scope of SAI’s activities (C) influence negatively the perceptions of GE. There is a positive and statistically significant relation between GE, on the one hand, and M, O, Ta, and Sa, on the other hand. The longer the length of the mandates of representatives SAIs (M), and the older the SAI’s experience, the more favorable the perception of GE becomes. Also, a higher number of the types of audits performed by SAIs (here, the study does not refer only to financial and performance audits, but also to legality and regularity audits, as well as compliance audits and special audits) generates a higher positive perception of the quality of public services, their independence from political interference, the quality of policy formulation and implementation, and credibility of government’s commitment to such policies (GE).
Model 6: CC = −0.02·GDP0.04·UR0.03·IR + 0.06·Gb + 0.02·M0.8·Rm0.18·S0,15·Ns0.13·C + 0.34·O
+ 0.18·D + 0.32·Ta + 0.09·Sa + 0.91
Model 6 indicates that there is a negative and statistically significant relation between CC, on the one hand, and GDP, UR, IR, S, Ns, and C, on the other hand. It means that under economic growth, growth of rate of unemployment, and growth of inflation, perceptions of control of corruption (CC) deteriorates. Also, the belonging of SAIs to a specific body (legal) (S), growth in the number of employees in the organizational structure of SAIs (Ns), and the extension of the scope of its activities (C) turn the perceptions of citizens into negative ones. It forces us to consider how SAIs create their image of being a guarantor of law enforcement, actors who are called to diminish the imperfections of the agency contract, and use and make the results of their work accessible for the citizens (which make it mandatory to formulate and implement coherent institutional marketing strategies). Instead, growth in length of the mandates of SAIs representatives (M), growth in the years of experience of these institutions (O), growth of actions for financial/public debts (D), and growth in the types of performed audits (Ta) have a positive impact on perceptions and improve the perception of control of corruption (CC).
The coefficients of regression models 5 and 6 have relatively low values, meaning that the impact of independent variables over dependent variables (GE and CC) is not high. Still, the results of the analyses are highly valuable. Moreover, as free coefficients of these models have bilateral critical probabilities below 0.05, it should be noted that there are other variables (not comprised in the model) that have an impact on GE and CC. The novelty of this study lies in the fact that it identifies and validates (statistically) the relation between SAIs and the sustainability of public finances.
The second aim of this study was to assess the interdependencies (among GDS, GGGD, GE, and CC, on the one hand, and their determining factors, on the other hand) by different phases of economic cycles. To reach this aim, the regression models were applied to different phases: pre-crisis (2002–2007), crisis (2008–2013), and post-crisis (2014–2019). The details on the relevance of the proposed models are summarised in Table 7.
The degree of representativeness of models varies between 42% and 78%. It means that most of the variation of the analyzed dependent variables (GDS, GGGS, GE, and CC) may be explained by the variation of the independent variables included in the analysis. The significance F shows values lower than the undertaken significance level (5%) and is different from null, which validates the proposed regression models. The results of the conducted analyses by different phases of economic evolution are summarised in Table 8.
The analysis in dynamics of the influence of SAI variables enables us to formulate the following conclusions:
-
The impact of macroeconomic variables on public deficits (GDS) is more significant during the crisis periods; the acceleration in the pace of growth of GDP may diminish public debt (GGGD) during the pre-crisis periods;
-
How SAIs are represented (Gb) is important only during crisis and post-crisis periods, having an impact only on GDS;
-
The length of the mandate of SAIs representatives (M) is important for control of GDS and GGGD only in the post-crisis periods; the impact of this variable on GE and CC is positive during pre-crisis and crisis periods, and negative in the post-crisis;
-
The option of renewable mandate (Rm) amplifies GGGD; the abandoning of this option may improve the perception of GE in the post-crisis periods;
-
The integration of SAIs into parliamentary bodies (S) may deteriorate the perceptions of GE and CC; the impact grows in the crisis periods and diminishes in the post-crisis;
-
The growth in the number of employees of SAIs (Ns) does not influence the perceptions of GE and CC in the pre-crisis and post-crisis periods positively;
-
By extending the scope of competencies of SAIs (C), the debt of governments grows progressively (once there is a movement from pre-crisis to crisis and post-crisis) and affects the perceptions of GE and CC similarly;
-
The maturity of SAIs measured by the number of years of experience (O) is not favorable for the decrease of GGGD but improves the perceptions of GE and CC, being more prevalent in crisis and post-crisis periods;
-
Conducting regularity and legality audits, as well as compliance audits (Ta), decreases GGGD and improves perceptions of GE and CC;
-
Conducting special audits (SA) favors the growth of GGGD during crisis and post-crisis and improves the perceptions of GE in the post-crisis.
The analysis of the impact of the SAIs-associated variables on the deficit and public debt, and perceptions of government efficacy and control of corruption, respectively, depending on the stage of the economy (marked by the alternation of pre-crisis, crisis, and post-crisis), provided valuable input that shed light on the commitment to ensure the sustainability of public finances.

5. Conclusions

This study aimed to assess the impact of macroeconomic and SAIs-associated variables on the sustainability of public finances and establish the interdependencies between governmental effectiveness (and control of corruption, respectively) and the organizational structure and activities of SAIs. Therefore, this study has contributed to filling this gap in the literature in the field. The study is remarkable in the way in which it assessed the interdependencies as it has expanded the knowledge on the impact of different variables on governmental deficit and debt. Another element of novelty of this study is the assessment of interdependences for different phases of economic cycles.
The results partially have confirmed the first formulated hypothesis. The representation of SAIs by a single person, abandonment of the mandate renewal option, the reforming of SAIs, and undertaking the responsibility for performing special audits play an important role in ensuring the sustainability of public finances (through the decrease of the budget deficit and government debt).
The second hypothesis has also been partially validated in the sense that: (i) abandoning the renewable mandate, not integrating SAIs into legislative/jurisdictional bodies and reducing the number of employees; (ii) increasing the length of the mandate of SAIs representatives, growing the number of years of experience of SAIs (as independent bodies and increasing the number of types of audits performed by SAIs could improve the perceptions of the effectiveness of the government (GE) and of control of corruption (CC).
The only SAIs variables that have maintained their impact on GE and CC (demonstrated by negative/positive and statistically significant values of the regression models) in the pre-crisis, crisis, and post-crisis periods are integration into the legislative and jurisdictional bodies (S), the number of employees (Ns), the territorial-administrative level for the exercise of responsibilities (C), and types of performed audits (Ta).
Our study has confirmed the results of Blume and Voigt [26] and Cordery and Hay [39] in the sense that the types of performed audits influence GE. Moreover, if the study departs from the supposition that high professionalism of SAIs staff is essential for being able to perform such diverse audits, it could be said that our findings are in line with those of Gustavson [50] and Isaksson and Bigsten [51].
The results of our study differ from those reported by Blume and Voigt [28], who conclude that the mandates and the organizational design of the SAIs do not influence governmental effectiveness and fiscal policy; still, the results of this study are in line with the findings of Blume and Voigt [69] in the sense that an extended mandate may contribute to governmental deficit, and in line with the results of Schelker and Eichenberger [66], according to which, if the mandate includes the auditing of the public budget, it results in reductions in public expenditure, and also match the results of Torgler [68], who identifies a positive relation between a larger scope of SAIs and tax morale, and results therefore in reduction of public deficit.
Although Pereș et al. [57], Tara et al. [58], and Gherai et al. [59] used slightly different variables compared to this study, they reached similar conclusions to this research in the sense that the existence of supreme audit institutions has a positive influence on governmental efficacy and a negative influence on the level of perception of corruption.
Our results that link maturity of audit institutions and extension of types of activities performed by SAIs with perceptions of corruption converge with the results of other researchers, who identified the relationship between the quality of audit [55], probability of conducting an audit [62], and audit activities [63].
The results of this study encourage supreme audit institutions to develop new ways aimed at demonstrating their relevance for the sustainability of public finances and value creation. This study can have an impact on the types of audits that must be carried out by the supreme audit institutions and influence the way SAIs are organized and operated for ensuring efficient and effective public outcomes and better public sector accountability.
Study limitations and future lines of research. This study is not comprehensive; there are limitations associated with the dummy variables that lay at the foundation of this analysis and the heterogeneous nature of data available for the countries included in the sample. Still, from a statistical perspective, the results have been validated. In specific regression models, the coefficient of the term free is statistically significant, which indicates that there are other independent variables that may influence the dependent variable. Therefore, a future study could focus on identifying these variables and their impact on the deficit and public debt, and the perceptions of GE and CC, accordingly. Future research could use the database developed in this study on the organization and functioning of SAIs during 2002–2019, which could be used as a starting point for other empirical analyses.

Author Contributions

Conceptualization, I.B., M.B.T., R.I.C., I.C.C. and F.C.; methodology, I.B., M.B.T., R.I.C., I.C.C. and F.C.; validation, I.B., M.B.T., R.I.C., I.C.C. and F.C.; formal analysis, I.B., M.B.T., R.I.C., I.C.C. and F.C.; investigation, I.B., M.B.T., R.I.C., I.C.C. and F.C.; resources, I.B., M.B.T., R.I.C., I.C.C. and F.C.; data curation, I.B., M.B.T., R.I.C., I.C.C. and F.C.; writing—original draft preparation, I.B., M.B.T., R.I.C., I.C.C. and F.C.; writing—review and editing, I.B., M.B.T., R.I.C., I.C.C. and F.C.; visualization, I.B., M.B.T., R.I.C., I.C.C. and F.C.; supervision, I.B., M.B.T., R.I.C., I.C.C. and F.C.; project administration, I.B., M.B.T., R.I.C., I.C.C. and F.C.; funding acquisition, I.B., M.B.T., R.I.C., I.C.C. and F.C. All authors have read and agreed to the published version of the manuscript.

Funding

This research received no external funding.

Institutional Review Board Statement

Not applicable.

Informed Consent Statement

Not applicable.

Data Availability Statement

Not applicable.

Conflicts of Interest

The authors declare no conflict of interest.

References

  1. Onofrei, M.; Gavriluță (Vatmanu), A.; Bostan, I.; Oprea, F.; Paraschiv, G.; Lazăr, C.M. The Implication of Fiscal Principles and Rules on Promoting Sustainable Public Finances in the EU Countries. Sustainability 2020, 12, 2772. [Google Scholar] [CrossRef] [Green Version]
  2. Giosi, A.; Testarmata, S.; Brunelli, S.; Staglianò, B. The dimensions of fiscal governance as the cornerstone of public finance sustainability: A general framework. J. Public Budg. Account. Financ. Manag. 2014, 26, 94–139. [Google Scholar] [CrossRef] [Green Version]
  3. Kargol-Wasiluk, A.; Wildowicz-Giegiel, A. The quality of public finance in the light of fiscal governance concept: Implications for the European Union countries. Equilib. Q. J. Econ. Econ. Policy 2019, 13, 411–426. [Google Scholar] [CrossRef]
  4. Rodriguez-Vives, M. The quality of public finances: Where do we stand? Econ. Bus. Lett. 2019, 8, 97–105. [Google Scholar] [CrossRef]
  5. Pinsard, N.; Tadjeddine, Y. The marketization of the French public finance before capitalism: The paulette edict of 1604. Econ. Soc. 2021, 50, 471–493. [Google Scholar] [CrossRef]
  6. Ermasova, N.; Guzman, T.; Ceka, E. Legacy Effect of Soviet Budgeting System on Public Capital Budgeting: Cases of Russia, Moldova, and Uzbekistan. Int. J. Public Adm. 2021. [CrossRef]
  7. Hao, J.; Tang, C.; Zhu, J.; Jiang, J. The Impacts of Flattening Fiscal Reform on Health Expenditure in China. Front. Public Health 2021, 9, 614915. [Google Scholar] [CrossRef] [PubMed]
  8. Bertoa, F.C.; Rama, J. Paying for appeasement: On the moderating role of public subsidies in East Central European party politics. Party Politics 2021. [Google Scholar] [CrossRef]
  9. Pulay, G.; Simon, J. Measuring the Macroeconomic Performance of Public Finance Management. Public Financ. Q. 2020, 23–43. [Google Scholar] [CrossRef]
  10. Guter-Sandu, A.; Murau, S. The Eurozone’s Evolving Fiscal Ecosystem: Mitigating Fiscal Discipline by Governing Through Off-Balance-Sheet Fiscal Agencies. New Political Econ. 2021. [Google Scholar] [CrossRef]
  11. Hickey, R.; Lozej, M.; Smyth, D. Financing government investment and its implications for public capital: A small open economy perspective. Econ. Model. 2020, 93, 620–641. [Google Scholar] [CrossRef]
  12. Novo-Corti, I.; Picatoste, X. Sustainable Public Finance and Debt Management. In Financing Sustainable Development. Palgrave Studies in Impact Finance; Ziolo, M., Sergi, B., Eds.; Palgrave Macmillan: Cham, Switzerland, 2019; pp. 227–247. [Google Scholar] [CrossRef]
  13. Afonso, A.; Erbert, W.; Schuknect, L.; Thone, M. Quality of Public Finance and Growth; EBC Working Paper Series n. 438; European Central Bank: Frankfurt, Germany, 2005; p. 45. [Google Scholar]
  14. Barrios, S.; Schaechter, A. The Quality of Public Finance and Economic Growth; European Economy Economic Paper n. 337; Directorate-General for Economic and Financial Affairs: Brussels, Belgium, 2008; p. 48. [Google Scholar]
  15. OECD. Supreme Audit Institutions and Good Governance: Oversight, Insight and Foresight. 2016. Available online: https://0-www-oecd--ilibrary-org.brum.beds.ac.uk/governance/supreme-audit-institutions-and-good-governance_9789264263871-en (accessed on 19 June 2021).
  16. Dobrowolski, Z.; Sułkowski, Ł. Implementing a Sustainable Model for Anti-Money Laundering in the United Nations Development Goals. Sustainability 2020, 12, 244. [Google Scholar] [CrossRef] [Green Version]
  17. Nagy, S. The role of Supreme Audit Institutions in fight against the consequences of financial and economic crisis: A theoretical approach. In Crisis Aftermath: Economic Policy Changes in the EU and Its Member States; Conference Proceedings; University of Szeged: Hungary, Szeged, 2012; pp. 270–282. [Google Scholar]
  18. Bergman, U.M.; Hutchison, M.M.; Hougaard Jensen, S.E. Promoting sustainable public finances in the European Union: The role of fiscal rules and government efficiency. Eur. J. Political Econ. 2016, 44, 1–19. [Google Scholar] [CrossRef] [Green Version]
  19. Caldeira, V. Audit is Vital to Transparent and Accountable Public Finances. In ICAEW, Sustainable Public Finances: Global Views; ICAEW: London, UK, 2012; p. 6. Available online: https://www.ifac.org/system/files/news/files/ICAEW%20Sustainable%20public%20finances%20global%20views.pdf (accessed on 10 June 2021).
  20. Hay, D.C.; Cordery, C.J. Evidence about the value of financial statement audit in the public sector. Public Money Manag. 2021, 41, 304–314. [Google Scholar] [CrossRef]
  21. Zeti, C.F.; Luca, M.; Pirvu, C. The Impact of External Public Audit on Public Administration Efficiency. Ann. Constantin Brancusi Univ. Targu-Jiu. Econ. Ser. 2020, 2, 58–66. [Google Scholar]
  22. Van Loocke, E.; Put, V. The impact of performance audits: A review of the existing evidence. In Performance Auditing: Contributing to Accountability in Democratic Government; Lonsdale, J., Wilkins, P., Ling, T., Eds.; Edward Elgar Publishing: Northampton, MA, USA, 2011; pp. 175–208. [Google Scholar]
  23. Hay, D.C.; Cordery, C.J. The value of public sector audit: Literature and history. J. Account. Lit. 2018, 40, 1–15. [Google Scholar] [CrossRef] [Green Version]
  24. Cordery, C.J.; Hay, D.C. Supreme audit institutions and public value: Demonstrating relevance. Financ. Account. Manag. 2019, 35, 128–142. [Google Scholar] [CrossRef]
  25. Antohi, V.-M.; Zlati, M.L.; Ionescu, R.V.; Neculita, M.; Rusu, R.; Constantin, A. Attracting European Funds in the Romanian Economy and Leverage Points for Securing their Sustainable Management: A Critical Auditing Analysis. Sustainability 2020, 12, 5458. [Google Scholar] [CrossRef]
  26. Blume, L.; Voigt, S. Does organizational design of supreme audit institutions matter? A cross-country assessment. Eur. J. Political Econ. 2011, 27, 215–229. [Google Scholar] [CrossRef]
  27. Council for Budget Responsibility. How to Evaluate the Long-Term Sustainability of Public Finances? 2013. Available online: https://www.rozpoctovarada.sk/download2/dp1_2012_final_eng.pdf (accessed on 19 June 2021).
  28. Schick, A. Sustainable Budget Policy: Concepts and Approaches. OECD J. Budg. 2005, 5, 107–126. [Google Scholar] [CrossRef]
  29. European Union. Long-Term Sustainability of Public Finances for a Recovering Economy. EU 2011/C 161 E/17. Available online: https://eur-lex.europa.eu/legal-content/EN/TXT/PDF/?uri=CELEX:52010IP0190&from=EN (accessed on 18 June 2021).
  30. Vukčević, I.; Jovović, R. The Quality of Public Finance in the Countries of South-East Europe. J. Cent. Bank. Theory Pract. 2020, 1, 169–184. [Google Scholar] [CrossRef] [Green Version]
  31. Bethlendi, A.; Lentner, C. Subnational Fiscal Consolidation: The Hungarian Path from Crisis to Fiscal Sustainability in Light of International Experiences. Sustainability 2018, 10, 2978. [Google Scholar] [CrossRef] [Green Version]
  32. Baland, J.M.; Bourguignon, F.; Platteau, J.P.; Verdier, T. Economic Development and Institutions. In The Handbook of Economic Development and Institutions; Baland, J.M., Bourguignon, F., Platteau, J.P., Verdier, T., Eds.; Princeton University Press: New Jersey, NJ, USA, 2020; pp. 1–20. [Google Scholar]
  33. Iacobuță, A.-O.; Ifrim, M. Welfare Mentality as a Challenge to European Sustainable Development. What Role for Youth Inclusion and Institutions? Sustainability 2020, 12, 3549. [Google Scholar] [CrossRef]
  34. Iacobuta, A.O.; Mursa, G.C.; Mihai, C.; Cautisanu, C.; Cismas, L.M. Institutions and Sustainable Development: A Cross-Country Analysis. Transform. Bus. Econ. 2019, 18, 628–646. [Google Scholar]
  35. Praščević, A.; Ješić, M. Modeling Macroeconomic Policymakers’ Interactions under Zero Lower Bound Environment: The New Keynesian Theoretical Approach. J. Cent. Bank. Theory Pract. 2019, 8, 5–38. [Google Scholar] [CrossRef] [Green Version]
  36. INTOSAI. 40 Years of Lima Declaration of INTOSAI. 2017. Available online: https://www.intosai.org/fileadmin/downloads/documents/open_access/INTOSAI_Publications/Publication_40y_Lima_Declaration/EN_40_Jahre_Lima_Deklaration.pdf (accessed on 10 June 2021).
  37. Bringselius, L. Efficiency, economy and effectiveness-but what about ethics? Supreme audit institutions at a critical juncture. Public Money Manag. 2018, 38, 105–110. [Google Scholar] [CrossRef]
  38. Stapenhurst, R.; Titsworth, J. Features and Functions of Supreme Audit Institutions; PREM-notes No 59; World Bank: Washington, DC, USA, 2001; Available online: https://openknowledge.worldbank.org/handle/10986/11363 (accessed on 7 June 2021).
  39. Cordery, C.J.; Hay, D.C. Public Sector Audit, 1st ed.; Routledge Taylor and Francis Group: London, UK, 2021. [Google Scholar]
  40. Groenendijk, N.S. Assessing member states’ management of EU finances: An empirical analysis of the annual reports of the European Court of Auditors, 1996–2001. Public Adm. 2004, 82, 701–725. [Google Scholar] [CrossRef]
  41. Pollitt, C.; Summa, H. Comparative and international administration reflexive watchdogs? How supreme audit institutions account for themselves. Public Adm. 1997, 75, 313–336. [Google Scholar] [CrossRef]
  42. Scott, C.D. Speaking Softly Without Big Sticks: Meta-Regulation and Public Sector Audit. Law Policy 2003, 25, 203–219. [Google Scholar] [CrossRef]
  43. Bonollo, E. Measuring supreme audit institutions’ outcomes: Current literature and future insights. Public Money Manag. 2019, 39, 468–477. [Google Scholar] [CrossRef]
  44. Jacobs, K. Making sense of social practice: Theoretical pluralism in public sector accounting research. Financ. Account. Manag. 2012, 28, 1–25. [Google Scholar] [CrossRef]
  45. Di Maggio, P.; Powell, W. The iron cage revisited: Institutional isomorphism and collective rationality in organizational fields. Am. Sociol. Rev. 1983, 48, 147–160. [Google Scholar] [CrossRef] [Green Version]
  46. Frumkin, P.; Galaskiewicz, J. Institutional isomorphism and public sector organizations. J. Public Adm. Res Theory 2004, 14, 283–307. Available online: https://0-www-jstor-org.brum.beds.ac.uk/stable/3525838 (accessed on 10 June 2021). [CrossRef] [Green Version]
  47. Van Der Meer, F.B. Evaluation and the social construction of impacts. Evaluation 1999, 5, 387–406. [Google Scholar] [CrossRef] [Green Version]
  48. Morin, D. Measuring the impact of value- for- money audits: A model for surveying audited managers. Can. Public Adm. 2004, 47, 141–164. [Google Scholar] [CrossRef]
  49. Dye, K.M.; Stapenhurst, R. Pillars of Integrity: The Importance of Supreme Audit Institutions in Curbing Corruption; The Economic Development Institute—World Bank: Washington, DC, USA, 1998; Available online: http://info.worldbank.org/etools/docs/library/18120/pillars.pdf (accessed on 7 June 2021).
  50. Gustavson, M. Auditing Good Government in Africa: Public Sector Reform, Professional Norms and the Development Discourse; Palgrave Macmillan: Basingstoke, UK, 2014. [Google Scholar]
  51. Isaksson, A.-S.; Bigsten, A. Institution building with limited resources: Establishing a supreme audit institution in Rwanda. World Dev. 2012, 40, 1870–1881. [Google Scholar] [CrossRef] [Green Version]
  52. Busse, K.H. The SAI’s Role in Combating Corruption. Int. J. Gov. Audit. 2007, 34, 8–11. [Google Scholar]
  53. Dye, K.M. Corruption and Fraud Detection by Public Sector Auditors. EDP Audit Control Secur. Newsl. 2007, 36, 6–15. [Google Scholar] [CrossRef]
  54. Assakaf, E.A.; Samsudin, R.S.; Othman, Z. Public sector auditing and corruption: A literature. Asian J. Financ. Account. 2018, 10, 226–241. [Google Scholar] [CrossRef] [Green Version]
  55. Gustavson, M.; Sundström, A. Organizing the Audit Society: Does Good Auditing Generate Less Public Sector Corruption? Adm. Soc. 2016, 50, 1508–1532. [Google Scholar] [CrossRef]
  56. Melo, M.A.; Pereira, C.; Figueiredo, C.M. Political and institutional checks on corruption: Explaining the performance of Brazilian audit institutions. Comp. Political Stud. 2009, 42, 1217–1244. [Google Scholar] [CrossRef]
  57. Pereș, I.; Gherai, D.S.; Balaciu, D.E. Research on the Contribution of Supreme Audit Institutions to Government Efficiency and to Corruption Perception. Audit. Financ. 2014, 12, 28–38. [Google Scholar]
  58. Tara, I.G.; Gherai, D.S.; Droj, L.; Matica, D.E. The Social Role of the Supreme Audit Institutions to Reduce Corruption in the European Union—Empirical Study. Rev. Cercet. Interv. Soc. 2016, 52, 217–240. [Google Scholar]
  59. Gherai, D.S.; Tara, I.G.; Matica, D.E. The Supreme Audit Institution Can Control the Corruption or Not. Ann. Univ. Oradea Econ. Sci. Ser. 2016, 25, 465–476. [Google Scholar]
  60. Stuiveling, S.J.; Turksema, R.W. Public expenditure control in the Netherlands. In Public Expenditure Control in Europe. Coordinating Audit Functions in the European Union; Crespo, M.G., Ed.; Edward Elgar Publishing Limited: Cheltenham, UK, 2005; pp. 55–78. [Google Scholar]
  61. PEFA. Framework for Assessing Public Financial Management. 2019. 2nd ed. Washington, DC. Available online: https://www.pefa.org/sites/pefa/files/resources/downloads/PEFA%202016_latest%20version_with%20links%20%282%29.pdf (accessed on 1 July 2021).
  62. Olken, B. Monitoring corruption: Evidence from a field experiment in Indonesia. J. Political Econ. 2007, 115, 200–249. [Google Scholar] [CrossRef] [Green Version]
  63. Liu, J.; Lin, B. Government auditing and corruption control: Evidence from China’s provincial panel data. China J. Account. Res. 2012, 5, 163–186. [Google Scholar] [CrossRef] [Green Version]
  64. Tăvală, F.M. The Public Debt Audit—An Important Form of Public Audit in the Current Macroeconomic Context. Rev. Econ. 2018, 70, 131–142. [Google Scholar]
  65. Karabayev, E.B.; Sembiyeva, L.M.; Zeinelgabdin, A.B.; Beisenova, L.Z.; Pankou, D.A. The Role of External Public Audit in Ensuring the Financial Stability of the Budgets of Developing Countries. Public Policy Adm. 2021, 20, 108–117. [Google Scholar]
  66. Schelker, M.; Eichenberger, R. Auditors and fiscal policy: Empirical evidence on a little big institution. J. Comp. Econ. 2010, 38, 357–380. [Google Scholar] [CrossRef]
  67. Eichenberger, R.; Schelker, M. Independent and competing agencies: An effective way to control government. Public Choice 2007, 130, 79–98. [Google Scholar] [CrossRef] [Green Version]
  68. Torgler, B. A Knight without a Sword? The Effects of Audit Courts on Tax Morale. J. Inst. Theor. Econ. 2005, 161, 735–760. Available online: https://0-www-jstor-org.brum.beds.ac.uk/stable/40752549 (accessed on 10 June 2021). [CrossRef]
  69. Blume, L.; Voigt, S. Supreme Audit Institutions: Supremely Superfluous? A Cross Country Assessment. SSRN Electron. J. 2007. [Google Scholar] [CrossRef]
  70. Yalçin, S. The Effects of Supreme Audit Institutions’ independency on Public Debt Sustainability: An Investigation for Turkey. Muhasebe Bilim Dünya. Derg. 2018, 20, 375–388. [Google Scholar] [CrossRef]
  71. OECD. General Government Debt (Indicator). 2020. Available online: https://0-doi-org.brum.beds.ac.uk/10.1787/a0528cc2-en (accessed on 10 June 2021).
  72. Eurostat Database. 2020. Available online: https://ec.europa.eu/eurostat/web/main/data/database (accessed on 10 June 2021).
  73. Office for National Statistics. Government, Public Sector and Taxes. 2020. Available online: https://www.ons.gov.uk/economy/governmentpublicsectorandtaxes (accessed on 8 June 2021).
  74. Cordery, C.J.; Hay, D.C. Public sector audit in uncertain times. Financ. Account. Manag. 2021, 1–20. [Google Scholar] [CrossRef]
  75. Hay, D.C.; Cordery, C.J. The future of auditing research in the public sector. J. Public Budg. Account. Financ. Manag. 2021, 33, 234–242. [Google Scholar] [CrossRef]
  76. Worldwide Governance Indicators. 2020. Available online: http://info.worldbank.org/governance/wgi/ (accessed on 10 June 2021).
  77. The World Bank Indicators. 2020. Available online: https://data.worldbank.org/indicator (accessed on 7 June 2021).
  78. European Court of Auditors. Public Audit in the European Union; Publications Office of the European Union: Luxembourg, 2019; Available online: https://op.europa.eu/en/publication-detail/-/publication/5ff4cf77-2b53-11e9-8d04-01aa75ed71a1/language-en/format-PDF/source-218220259 (accessed on 20 June 2021).
  79. Rigsrevisionen. Available online: https://uk.rigsrevisionen.dk/about-us/history-and-background (accessed on 2 June 2021).
  80. The Bulgarian National Audit Office. 2015. Available online: https://www.bulnao.government.bg/en/articles/national-audit-office-act-1035 (accessed on 2 June 2021).
  81. Croatia State Audit Act. 1999. Available online: http://webcache.googleusercontent.com/search?q=cache:N6IG4cfZvfsJ:www1.worldbank.org/publicsector/pe/BudgetLaws/CroatiaStateAuditAct1999.doc+&cd=4&hl=en&ct=clnk&gl=ro (accessed on 2 June 2021).
  82. The State Audit Office of Hungary. 2020. Available online: https://www.asz.hu/en/ (accessed on 2 June 2021).
Figure 1. GDP growth rate dynamics (Source: Processed by authors, according to [72]).
Sustainability 13 09757 g001
Figure 2. GDP growth rate (GDP), the unemployment rate (UR), and the inflation rate (IR)—average values (Source: Processed by authors, according to [72]).
Sustainability 13 09757 g002
Table 1. Dependent and independent SAIs variables.
VariablesSymbolSources/Calculation/Representation
Dependent variables
Government deficit/surplusGDS[72,73]
General government gross debtGGGD[72,73]
Government effectivenessGE[76]
Control of corruptionCC[76]
Independent variables
Macro-economicsGDP growth rateGDPgr[77]
Unemployment rateUR[77]
Inflation rateIR[77]
Related to SAIGoverning bodyGb1 = one person, 2 = a group
President/Body mandate MNumber of years (natural logarithm of number of years)
Renewable mandateRm1 = Yes, 2 = No
Part of a structureS1 = Parliamentary, 2 = Jurisdictional, 3 = Neither
Number of staffNsNumber of staff (natural logarithm of NS)
Covered levelC1 = Central Government,
2 = Central + Regional Government,
3 = Central + Regional +Local Government,
4 = 3 + State Enterprises, 5 = 4+Public Bodies,
6 = 5+Municipalities, 7 = 6+Other beneficiaries
OldONumber of years of activity (on 31 December of each year of the analysis period) (natural logarithm of years number)
Actions regarding the financial/public debt situationD1 = Yes, 2 = No
Types of audits TaAll institutions perform financial and performance audits.
1 = Legality and regularity audit, 2 = Compliance audit 3 = Neither 1 nor 2
Special audit Sa1 = Yes, 2 = No
Source: Processed by authors.
Table 2. Descriptive statistics.
GDSGGGDGECCGDPURIRGbLN_MRmSLN_ NsCLN_ODTaSa
Mean−2.156.91.11.02.48.62.21.53.31.22.15.95.63.81.82.01.9
Standard Error0.21.60.00.00.20.20.10.00.20.00.00.00.10.00.00.00.0
Median−2.150.21.11.02.47.52.01.52.21.02.05.86.03.72.02.02.0
Standard Deviation3.735.70.60.83.54.32.30.54.10.40.91.01.21.00.40.70.4
Kurtosis8.81.1−0.6−1.26.53.116.5−2.023.80.0−1.7−0.2−1.5−1.30.8−0.72.2
Skewness−1.30.9−0.20.1−0.41.62.80.04.71.4−0.1−0.2−0.20.1−1.70.0−2.0
Range42.1184.32.72.940.025.527.01.026.91.02.04.43.03.71.02.01.0
Minimum−32.11.9−0.4−0.4−14.82.0−4.51.01.11.01.03.54.01.61.01.01.0
Maximum10.0186.22.42.525.227.522.52.028.02.03.07.97.05.42.03.02.0
Count504504504504504504504504504504504504504504504504504
Source: Processed by authors.
Table 3. Correlation analysis.
GDSGGGDGECCGDPURIRGbLN_MRmSLN_NsCLN_ODTaSa
GDS1
GGGD−0.41
GE0.3−0.11
CC0.3−0.10.91
GDP0.3−0.3−0.1−0.11
UR−0.40.4−0.3−0.4−0.21
IR0.0−0.3−0.3−0.30.2−0.11
Gb−0.20.2−0.2−0.1−0.10.10.11
LN_M0.0−0.10.10.1−0.1−0.10.1−0.21
Rm0.10.0−0.2−0.1−0.10.00.10.20.01
S0.0−0.1−0.3−0.30.00.10.10.3−0.10.11
LN_Ns−0.20.3−0.4−0.3−0.10.20.10.40.00.4−0.11
C−0.30.3−0.5−0.50.00.40.1−0.1−0.10.00.00.21
LN_O0.00.40.50.5−0.2−0.1−0.30.2−0.1−0.1−0.20.1−0.21
D0.0−0.10.10.10.00.00.00.10.0−0.20.00.1−0.20.01
Ta0.3−0.30.40.40.1−0.20.0−0.30.00.3−0.1−0.4−0.30.00.01
Sa−0.10.10.20.2−0.10.0−0.20.00.0−0.3−0.20.00.00.10.30.01
Source: Processed by authors.
Table 4. Regression analysis—GDS and GGGD.
Regression StatisticsGDSGGGDGECC
with GEwith CCwith GEwith CC
Multiple R0.600.600.760.770.810.84
R Square0.370.360.580.600.660.70
Adjusted R Square0.350.340.570.590.650.69
Standard Error3.003.0223.3922.880.350.44
Observations504504504504504504
ANOVA
Significance F4.57 × 10405.28 × 10392.52 × 10835.59 × 10881.68 × 101061.66 × 10119
Source: Processed by authors.
Table 5. Coefficients of regression models.
Models 1 &2
GDS
CoefficientsStandard Errort Statp-ValueLower 95%Upper 95%
GECCGECCGECCGECCGECCGECC
Intercept−3.27−1.522.102.05−1.56−0.740.120.46−7.38−5.550.852.50
GE or CC2.191.610.390.315.685.180.000.001.431.002.942.23
GDP0.330.320.040.048.057.830.000.000.250.240.410.40
UR−0.22−0.210.040.04−5.95−5.560.000.00−0.30−0.29−0.15−0.14
IR−0.04−0.060.070.07−0.64−0.870.520.38−0.17−0.190.090.07
Gb−0.97−0.980.350.35−2.77−2.760.010.01−1.67−1.67−0.28−0.28
LN_M−0.03−0.030.040.04−0.91−0.890.370.37−0.10−0.100.040.04
Rm1.331.200.490.492.712.450.010.010.370.242.292.17
S0.350.340.190.191.821.760.070.08−0.03−0.040.720.72
LN_Ns0.310.210.230.221.350.920.180.36−0.14−0.230.750.65
C−0.13−0.120.140.15−0.88−0.820.380.42−0.41−0.400.160.17
LN_O−0.41−0.450.190.20−2.20−2.290.030.02−0.78−0.84−0.04−0.06
D0.640.440.410.411.581.060.120.29−0.16−0.371.441.24
Ta0.07−0.050.310.320.24−0.150.810.88−0.53−0.670.680.58
Sa−0.92−0.640.450.44−2.07−1.440.040.15−1.80−1.51−0.050.23
Models 3&4
GGGD
CoefficientsStandard Errort Statp-ValueLower 95%Upper 95%
GECCGECCGECCGECCGECCGECC
Intercept−54.17−57.5116.3415.54−3.31−3.700.000.00−86.28−88.05−22.06−26.98
GE or CC−11.15−14.323.002.36−3.71−6.060.000.00−17.05−18.97−5.25−9.68
GDP−0.78−0.830.320.31−2.44−2.670.020.01−1.41−1.44−0.15−0.22
UR2.111.840.290.297.236.310.000.001.541.272.692.41
IR−2.20−2.290.510.50−4.33−4.620.000.00−3.20−3.27−1.20−1.32
Gb−4.98−4.622.752.69−1.82−1.720.070.09−10.38−9.890.410.66
LN_M0.840.990.280.273.033.650.000.000.300.461.381.52
Rm16.3016.493.823.724.274.430.000.008.799.1723.8023.80
S−1.58−2.621.491.46−1.07−1.800.290.07−4.51−5.501.340.25
LN_Ns−0.99−1.411.761.70−0.56−0.830.570.41−4.46−4.752.471.94
C5.144.341.121.104.593.940.000.002.942.177.336.50
LN_O20.3322.571.471.4913.8715.130.000.0017.4519.6423.2125.50
D−2.95−0.803.173.12−0.93−0.260.350.80−9.18−6.943.275.34
Ta−14.29−11.732.412.42−5.93−4.850.000.00−19.03−16.47−9.56−6.98
Sa18.0117.113.483.365.185.090.000.0011.1810.5124.8523.71
Source: Processed by authors.
Table 6. Coefficients of regression models.
Model 5: GECoefficientsStandard Errort Statp-ValueLower 95%Upper 95%
Intercept1.470.246.200.001.001.93
GDP−0.020.00−3.250.00−0.02−0.01
UR−0.020.00−5.360.00−0.03−0.01
IR−0.030.01−3.570.00−0.04−0.01
Gb0.040.041.040.30−0.040.12
LN_M0.020.004.550.000.010.03
Rm−0.110.06−1.990.05−0.230.00
S−0.130.02−6.260.00−0.18−0.09
LN_Ns−0.160.03−6.120.00−0.21−0.11
C−0.090.02−5.450.00−0.12−0.06
LN_O0.230.0211.890.000.190.27
D0.040.050.830.41−0.050.13
Ta0.180.045.040.000.110.25
Sa0.190.053.770.000.090.30
Model 6: CCCoefficientsStandard Errort Statp-ValueLower 95%Upper 95%
Intercept0.910.293.090.000.331.49
GDP−0.020.01−2.660.01−0.030.00
UR−0.040.01−6.970.00−0.05−0.03
IR−0.030.01−2.900.00−0.05−0.01
Gb0.060.051.150.25−0.040.16
LN_M0.020.014.930.000.020.03
Rm−0.080.07−1.060.29−0.220.06
S−0.180.03−6.640.00−0.23−0.12
LN_Ns−0.150.03−4.750.00−0.21−0.09
C−0.130.02−6.160.00−0.16−0.09
LN_O0.340.0213.920.000.290.38
D0.180.063.070.000.070.30
Ta0.320.047.240.000.230.40
Sa0.090.061.370.17−0.040.21
Source: Processed by authors.
Table 7. Regression analysis in pre-and post-crisis periods.
Regression
Statistics
GDSGGGDGECC
Pre-
Crisis
CrisisPost-CrisisPre-
Crisis
CrisisPost-CrisisPre-
Crisis
CrisisPost-CrisisPre-
Crisis
CrisisPost-Crisis
Multiple R0.680.650.710.750.770.880.870.840.830.880.860.87
R Square0.460.420.510.570.590.780.750.700.690.780.750.75
Adjusted R Square0.410.370.470.530.550.760.730.670.660.760.720.73
Standard
Error
2.393.671.6519.1023.9719.560.340.340.310.380.420.40
Observa-
tions
168168168168168168168168168168168168
ANOVA
Significance F1.3 × 10141.6 × 10121.3 × 10171.3 × 10216.8 × 10231.5 × 10421.4 × 10391.3 × 10332.9 × 10323.7 × 10443.4 × 10395.9 × 1040
Source: Processed by authors.
Table 8. Coefficients of regression models in pre-and post-crisis periods.
Regression
Statistics
GDSGGGDGECC
Pre-CrisisCrisesPost-CrisesPre-CrisisCrisesPost-CrisesPre-CrisisCrises Post-CrisesPre-CrisisCrisesPost-Crises
Intercept−3.75−4.950.5532.42−74.80−109.021.631.861.661.330.851.24
GE3.094.100.31−7.84−9.01−9.55
GDP0.510.170.02−4.22−0.430.80−0.050.002−0.05−0.070.00−0.06
UR−0.05−0.23−0.18−0.372.004.35−0.02−0.03−0.03−0.03−0.04−0.05
IR0.020.380.07−0.84−1.810.81−0.06−0.05−0.05−0.07−0.05−0.09
Gb−0.07−1.96−0.95−2.67−8.87−0.410.050.000.030.110.10−0.09
LN_M0.02−0.08−0.670.150.609.710.010.01−0.070.020.02−0.12
Rm−0.542.011.4613.0221.9318.14−0.06−0.12−0.280.04−0.24−0.17
S0.040.710.30−1.74−2.19−2.63−0.11−0.15−0.09−0.13−0.18−0.11
LN_Ns0.450.950.01−0.96−1.15−4.52−0.14−0.19−0.09−0.16−0.13−0.08
C−0.21−0.42−0.424.704.738.14−0.07−0.07−0.13−0.05−0.12−0.18
LN_O−0.28−1.330.099.1622.9321.160.190.240.230.220.360.44
D0.630.36−0.28−1.220.23−1.800.150.05−·0.110.270.140.09
Ta0.61−0.460.46−15.13−17.04−18.420.220.140.250.350.380.36
Sa−2.94−0.560.917.9723.9423.960.040.140.24−0.130.080.07
Statistically significant coefficients are marked in bold. Source: Processed by authors.
Publisher’s Note: MDPI stays neutral with regard to jurisdictional claims in published maps and institutional affiliations.

