
Organization’s Sustainable Operational Complexity and Strategic Overview: TISM Approach and Asian Case Studies


Department of Management Studies, Indian Institute of Technology Delhi, New Delhi 110016, India
*
Author to whom correspondence should be addressed.
Sustainability 2021, 13(17), 9790; https://0-doi-org.brum.beds.ac.uk/10.3390/su13179790
Submission received: 9 August 2021
/
Revised: 24 August 2021
/
Accepted: 25 August 2021
/
Published: 31 August 2021
(This article belongs to the Special Issue Assessment of Socio-Economic Sustainability and Resilience after COVID-19)
Abstract
:As a region, Asia comprises communist China, democratic India and many small quasi-democratic and authoritarian states. Both China and India play a significant role in maintaining multilateral world order. Asia’s regional power remains with its enormous potential of resources for domestic markets and per capita purchasing power parity. Hence, the economic and the business aspects of the Asian region require comprehensive study. Sustainable operational excellence is a notion carried by an organisation’s sustainable economic development and other values. This study incorporates the multiple case study method. Twelve case organisations such as Tata Motors, Samsung, Nissan, Indigo, Mitsubishi, Huawei, Wilmar, Canon, NTPC, Hitachi, Singapore Airlines, and L&T were chosen to study their sustainability values, and operational and strategic strands. TISM (total interpretive structural modelling) method is used for model building; four variables such as operating activities, investing activities, financing activities, and SVE (Social value expenditures) are taken for empirical analysis. Based on the available secondary data, the study incorporated panel data regression analysis. The result shows that SVE positively and significantly explains operational activities that proxy with sustainable business practices. The study concludes with a Paux strategy framework for discussion and managerial implications.
1. Introduction
Organisational business activities are the central axis of the economic development of a particular region, and their performance is related to the financial position of the region. The state as an actor provides land, resources, and bureaucratic support to conduct business activities. In turn, business activities are expected by the state to cater to economic and regional development in particular. Business activities are an influential and essential source for the generation of income. Hence, business operations and operations strategy decide the opportunities and operational excellence of a particular enterprise.
In the competitive world, to sustain the market enterprise operational performance and order of merit are the pillars to maintain their status quo in the domestic and international markets. The company’s position in local markets decides their equity returns and income generation, such as shareholder capital and subsidies from financial institutions. Focus on market demands, introducing new products, international market expansion with quality, and price-sensitive products are essential for operational excellence.
Asia is a unique continent with passionate philosophers such as Confucius, Gautama Buddha, and many enlightened masters fertilised the local knowledge system. Similarly, within a region, many cultural groups practise various faiths and knowledge dimensions. The Confucius ideology in China, the wide prevalence of Buddhism in the far east and south-east Asian countries, and Hinduism in India make Asia an oriental region in world politics. After globalisation, India opened its market economy in 1999, which initiated its economic growth. According to Dittmer [1], “Distance and other geographic barriers have diminished in power and cost, permitting people, things, and ideas to move more freely from place to place. However, the globalisation trend is not new, and there was greater demographic mobility than today in the 19th century and the early 20th centuries.” The East Asian region is considered an anthropological paradise by experts. Throughout human history, historical belief and faith had built many cultural institutions or political institutions. Concerning the Asian region, familism, universalism, and cultural relativism are considered as Asian values [2].
Although those values are not confined to a particular region, Asia is a multi-cultural region with strong cultural institutions. Such sentimental attachments towards cultural institutions led to the formation of quasi-democracy and soft- authoritarian governments. However, in response to the recent crisis and disaster in east and south-east Asia leads to re-examination of their human rights standards [3]. Different philosophical belief systems, different languages with numerous dialects and these variations lead to differences in market structure, distribution systems, income groups, and uncertain stores [4]. Likewise, India’s impressive eco-centre growth could centre Asia’s growth and integration progressively. However, the Asian situation remains complex and challenging as the bitter history still haunts many countries in Asia [5]. “While on the other side, both south Asian nations remain caught in a vicious cycle of poverty, deprivation, and underdevelopment. Economic deprivation, illiteracy and unemployment provide a fertile ground for intolerance and extremism, which in turn promotes conflict and violence within the south Asian societies.” [6].
From the strategic point of view, [7] explains four factors that add turmoil in regionalism: non-traditional security threats, territorial conflicts, arms race, and international trade negotiations; these lead to strategic uncertainty. On the other hand, [8] the south Asian context views globalisation as a boon that facilitates the availability of transportation, upliftment of the poor from a vicious circle of poverty, creation of free trade, and ultimately draws the countries closer. Therefore, fewer studies apply scientific inquiry on developing regional-based studies focused on organisational sustainability values and model building. Hence, the objective of the study is to evolve a sustainable business model for Asian regional case studies, analyse the operational complexities in their management discussions, and study what contributes towards sustainable business practices. The study applies quantitative and qualitative research methods such as multiple case studies and interpretive research methods. This study includes testing of the framework study, Pareto chart analysis, histogram analysis, and panel data analysis secondary data that are available in the chosen firms’ annual reports and finally concluding with limitations and future scope of the study. The study is confined to an Asian regional analysis and the time frame of the study is 2013–2017.
1.1. Regional Complexities: An Overview
On 12 June 2002, China reported its first SARS (severe acute respiratory syndrome) case; such diseases are caused to people living in rural areas where global standards do not apply. SARS is attributed with ‘Drama’ due to its nature of sudden appearance and unfamiliarity [9]. Many questions remain unanswered concerning SARS, such as the source of origin and pathogenesis. During the peaks of the SARS pandemic, Hong Kong, Mainland China, and Singapore cancelled 50% of their airline movements. SARS provided a warning of its severe impact on health and the economy [10]. Between 2002–2003 in the SARS pandemic, 19% of FDI (foreign direct investment) was lowered; two issues are insisted as significant outbreaks, such as governance and the need for risk diversification [11]. However, careful planning remains a vital human factor [12].
The second significant factor in regional complexity is a natural disaster. According to Frankenberg et al. [13], “Disasters are threats to population well-being that derail socio-economic progress, strain social safety nets, and require complex assistance and recovery interventions. Over the last decade alone, Indonesia, Sri Lanka, Pakistan, China, Haiti, and Japan have experienced natural disasters with death tolls in the tens of thousands.” Such disasters are related to human behaviour and deeply associated with cultural, social, and political contexts [14]. Natural disasters also affect the labour market and growth in income and have an undeniable effect on regional development [15].
On the other side of the socio-economic development, disaster brings numerous health challenges; public health requires safe drinking water, medical facilities, vector control, food, and shelter [16]. The existing market structure cannot separate the labour market and the public from a service point of view. The sound development policies lead to a strong labour market. Therefore, sustainability and resilience can provide a new design to regional studies that contribute to the advancement of the knowledge paradigm. Quasi-democracy, an authoritarian form of government, and bureaucratic corruption were significant contributors to the Asian financial crisis, and functions as a third important factor for regional complexity. As an integral part of society, enterprises or organisations had to oblige to the regional tension and pressure groups. Since the Asian market is a potentially promising market for investors, the concept of resilience is very much applicable in Asian regional developmental studies.
1.2. Context of the Study
According to United Nations ESCAP [17], “Asia-Pacific share in global FDI inflows dropped from 45% in 2018 to 35% in 2019. However, the region remains the largest source of global outflows for the second consecutive year. The FDI is expected to remain low and below pre-crisis level throughout 2021”. The gap between the rich and poor is increasing, and inequality of opportunity is also prevailing in Asia [18]. In terms of regional integration, a national income and neighbourhood are positively associated with regional integration in Asia. A low level of regional integration is found in geographically disadvantaged countries [19].
1.3. Rationale of Asian Regional Study
According to Claessens et al. [20], sudden shifts in market expectations and confidence were the primary source of financial turmoil. Some macro-economic fundamentals have worsened in the middle of the 1990s. Others argue that the crisis reflected structural and policy distortions [21]. Like Thailand, they had done in 1997 that developed the US dollar against the local currency. China, too attempted to devaluate the US dollar. Although the East-Asian economy was called as tiger economy, it lacked security regulations and import restrictions to develop domestic industries. Studies show that tiger economies have relatively recovered well. The IMF (International Monetary Fund) explains that the financial reason for the crisis is that the region accumulated large external deficits, property, and stock market bubbles. The same phenomenon is showing in the recent analysis of market absorption, with their increasing purchasing power. China’s economic presence and ‘red giant’ effect in the Asian region is another reason to choose for the regional study. Japan’s dominant position in automobiles and far-east proficiency on IoT (Internet of Things) in communication and progress are expected for another Asian miracle or the persistence of plaque. Such a combination of opportunities and challenges fabricated with Asian regional studies and the political dilemmas and modernisation process are the reason for choosing the Asian regional case study.
2. Literature Review
The study follows theme-based literature review that is focused on organizational complexity in a regional perspective. The study identifies four themes such as
- (i)
- Imperatives of operational excellence;
- (ii)
- Organizational Strategic Inheritance;
- (iii)
- Resilience and regional development;
- (iv)
- Theoretical background: Institutionalist approach.
2.1. Imperatives of Operational Excellence
According to Wisner and Fawcett [22], “The greatest problem associated with traditional performance criteria is their failure to provide sufficient guidance in the formation of tactical decisions”. Mere financial information on performance is insufficient; how much a firm’s turnover and opportunity loss and tax loss an organisation underwent are part of financial performance. In contrast, imperatives for business excellence and performance are the essentials that firms incorporate to sustain their business in a competitive market. When the firm is under administrative changes or external changes such as regional political factors, disturbance in regional peace, and bureaucratic corruption affects sustainable operational excellence. Hence, firms’ influential culture and capability to adjust incrementally over a period [23] are essential. Little evidence shows a direct connection between trust and civic cooperation towards economic performance [24]. This evidence is applicable in operational decision making. Such organisational complexity affects profits negatively. However, that might provide advantage information in certain circumstances [25].
Market competitiveness cannot be averted. Hence, only enterprise elements are essential; despite accelerated macro competitiveness, vast gaps exist, which remains an opportunity [26]. Internal enterprise capabilities to be developed to understand the opportunities available externally. Furthermore, strategic vision is essential to utilise the growing economic opportunities [27]. Although strategy and the company’s magic recipes are not to be discussed or disclosed, certain universal imperatives are widely discussed by researchers and academicians that are considered essential for sustainable operational excellence practices. Organisations have to assimilate various dimensions of performance and its interconnectived elements [28].
Similarly, Calori [29] insists on the importance of managers and planners coming together in understanding creative tensions and the existence of ambivalence in organisations. Such ambivalence can be answered by employees’ participation and moving from the base of the pyramid. That leads to information sharing to improve the social categorisation process in corporations [30,31]. Additionally, such associated activities introduce bias and are open to few alternatives [32].
2.2. Strategic Organizational Inheritance
Exogenous environments, such as the industrial environment, play a critical role in an organisation’s strategic choice, financial performance, and resource heritage [33,34]. Similarly, Device and Carañana et al. [35] say that an assimilation strategy enhances the chances of international joint ventures performances. Further, various stakeholders’ value systems, power, and influence in pluralistic settings bestow organisations’ strategic change and development, leading to won dissolution [36]. Lack of visibility on the world scale and viewing through a historical point of view [37] may provide a monochromatic belief system in operational performances.
2.3. Resilience and Regional Development
Although resilience is more allied with psychology and ecological concepts, organisational scientists incorporate resilience in terms of organisation strategy and their capabilities to cope with emerging challengeable global scenarios. The path and pattern of economic growth are destabilised by regional crisis, disaster, and shocks [38]. The stability domain is a constantly changing parameters, prolonged crisis or pandemic situations, and unattended disasters led to the system’s collapse or may enter another stability domain [39]. In India, the pandemic situation widely affected regular business, production system, education, and good governance [40]. Therefore, understanding how far resilience helps in regional development and change seems essential [41]. Jones et al. [42] say there are conceptual and methodological hurdles in measuring resilience. However, organisations are slowly assuming the importance of sustainability models that provide competitive advantage and reputation [43].
2.4. Theoretical Background: Institutionalist Approach
Regional development is triggered by economic and non-economic factors and collective consumption, including education facilities, health, power distribution, and political stratification. Additionally, in all these endogenous conditions there is a ‘circular causation’. This is what Myrdal [44] called an institutional approach. Preston [45] states that Myrdal argued that the third world must consistently work towards socio-economic, political and cultural problems. Once the direction is set, it will continue further, which requires proper planning and development approach. The power distribution reflects the complexity of institutional arrangements among different groups and their influence in the market either directly or through a network of government regulations and political processes [46]. Likewise, Sushil [47] says any managerial context consists of the situation (time frame), actors (potential claimants), and process and resilience is necessary to cope with the situation. The doctrine of balanced growth, what Myrdal called ‘holistic’ in the institutionalist approach, stresses unwanted production is not production [48]. In terms of political institutionalization, statelike (structured) polities enjoy long term developmental advantages over less institutionalized polities [49] that remain a question.
3. The Methodology of the Study
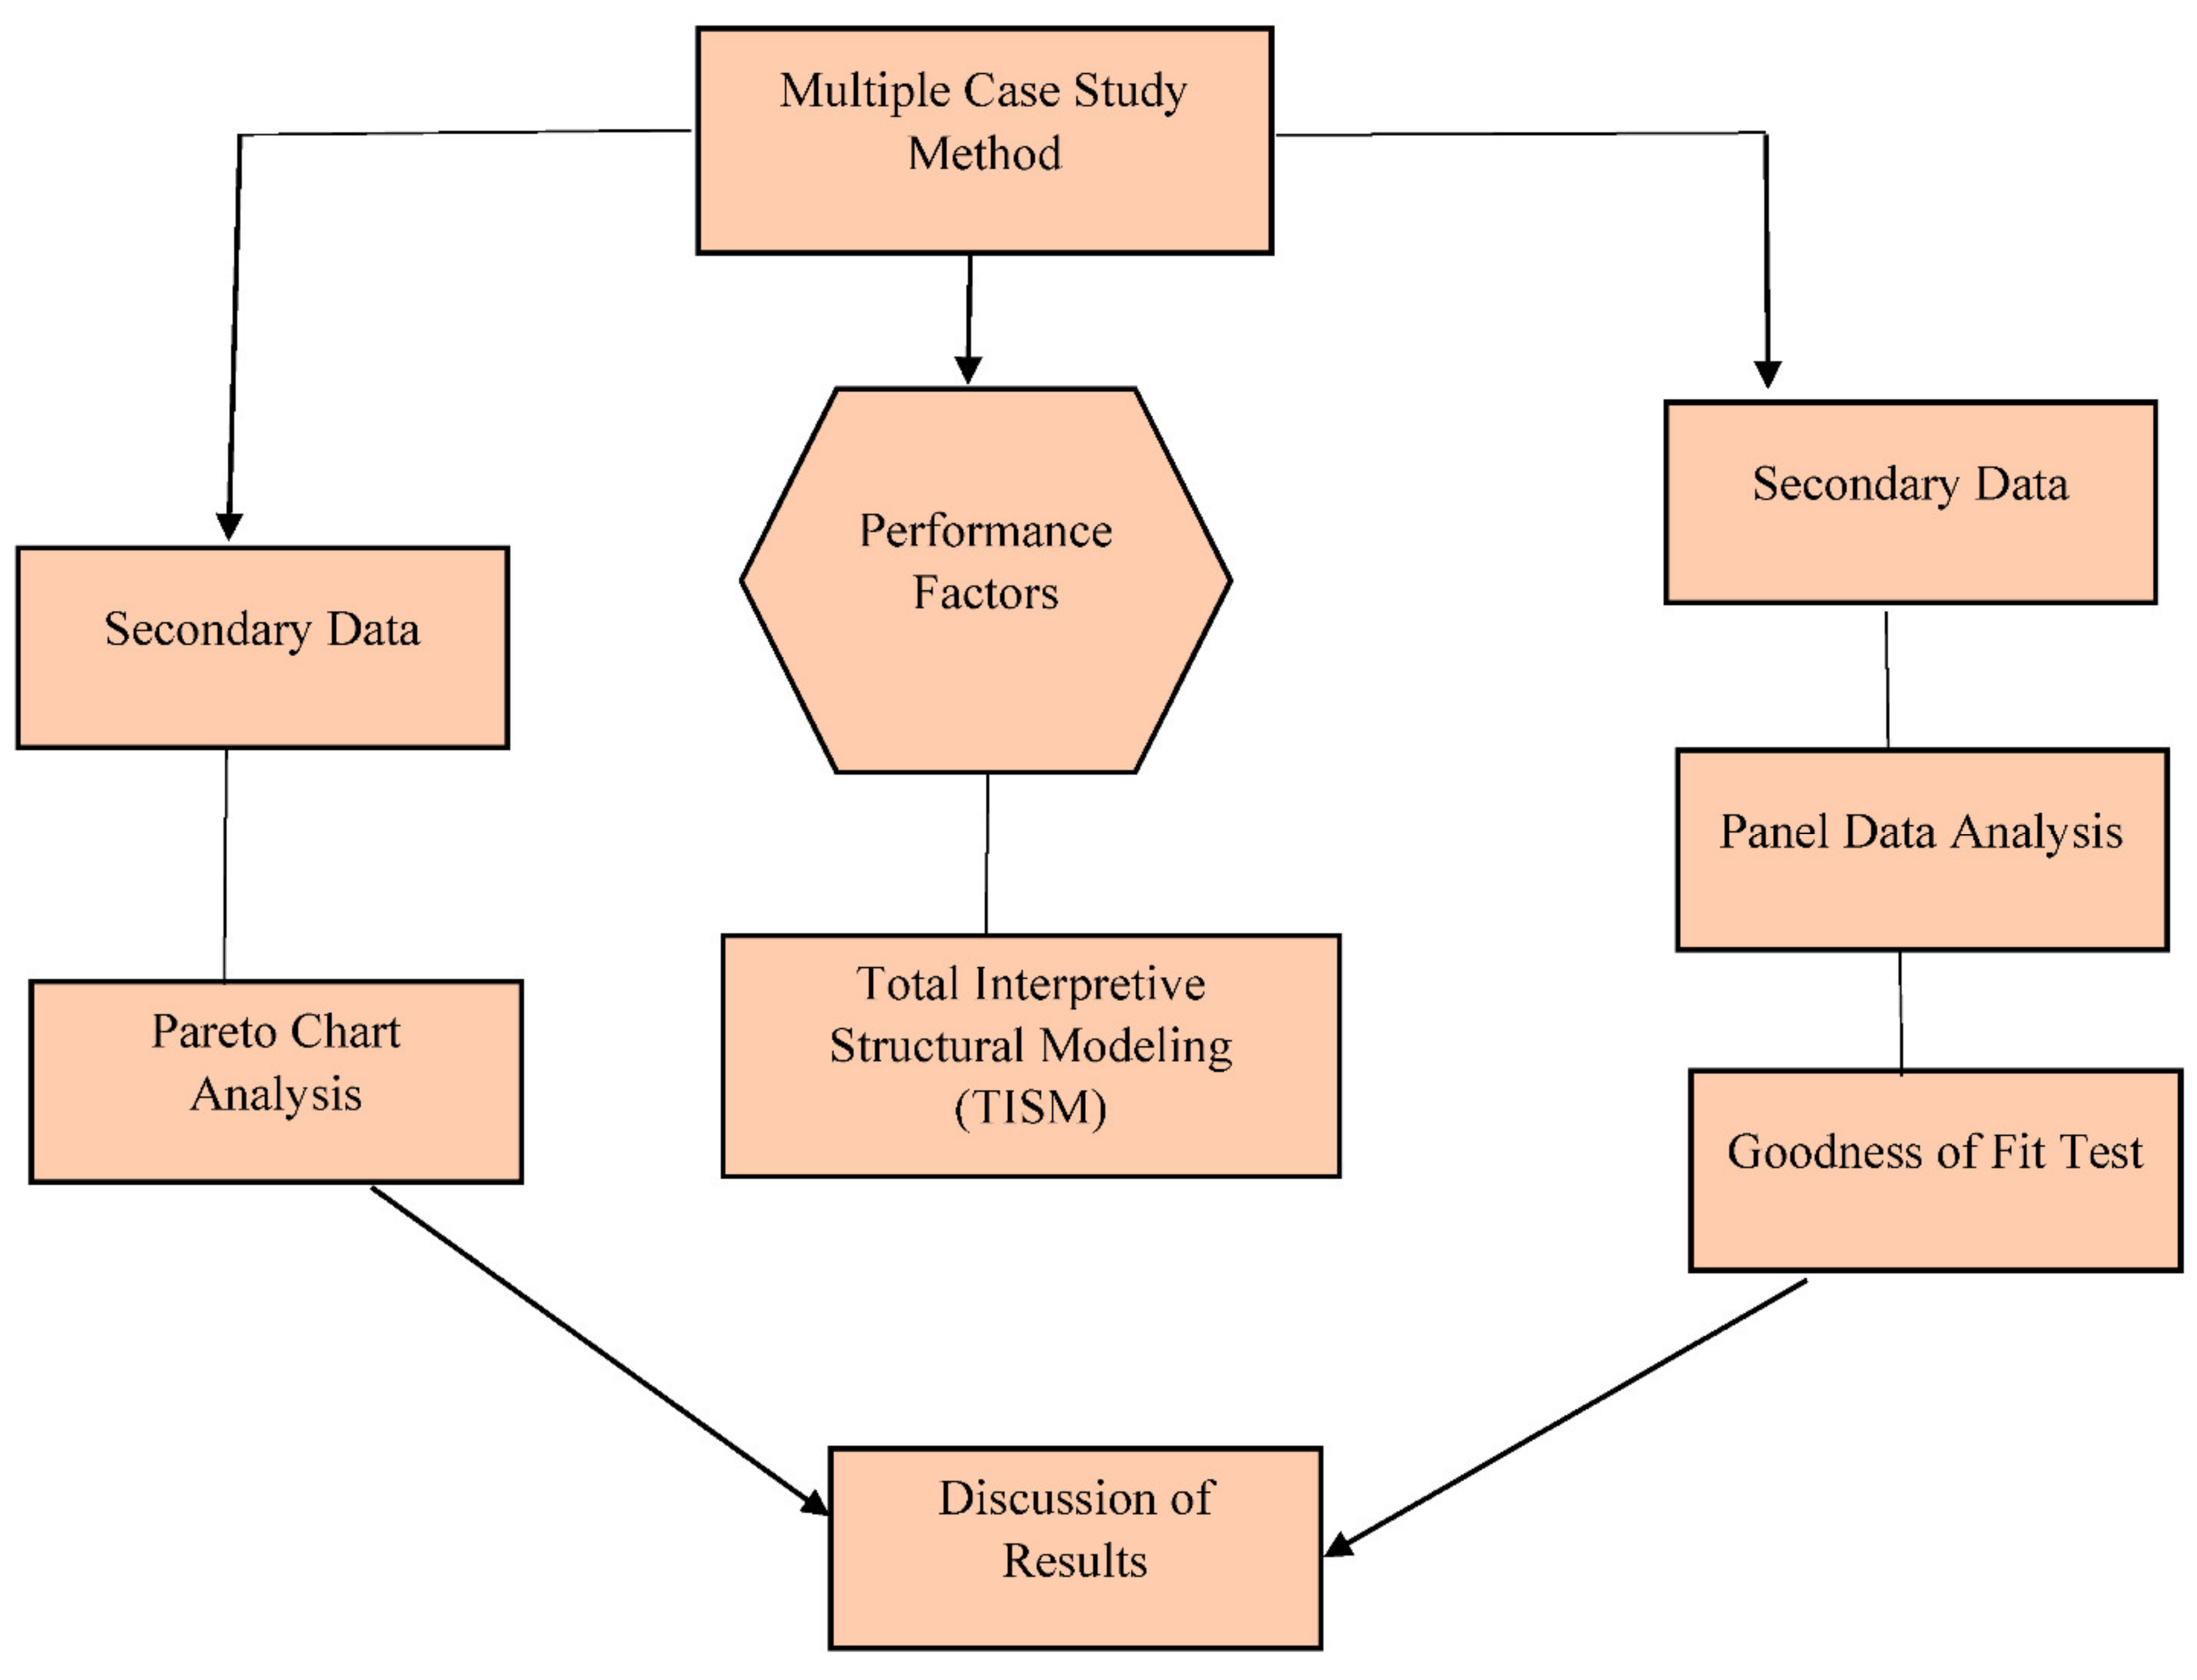
The phenomenon involved studying with operational excellence and complexity included within the concept of sustainability. The literature review is conducted on the imperatives and attributes perspectives. For case study analysis, twelve major firms were considered: Tata Motors, Samsung, Nissan, Indigo, Mitsubishi, Huawei, Wilmar, Canon, NTPC, Hitachi, Singapore Airlines, and L&T, focusing on the Asian region. Based on the twelve case studies, factors were collected for total interpretive structural modelling (TISM) and for validation panel data analysis. The methodology of the study is shown in Figure 1.
3.1. Case Study Method
Case studies rely on an observational technique that requires hard, deep and holistic analysis of organisational studies [50]. The case study method remains a potential strategic research framework; this particular method clears the susceptible researchers to advance towards framing knowledge body and provides theoretical and the current trend in knowledge paradigm. Although the validation requires both causal and empirical studies, the results tend to be dynamic and holistic.
Case studies provide a distinguishable body of knowledge with various decisions and what it implies [51]. Another important aspect is the generalisation of inferences obtained through the case study research method; this could be validated through regional studies, clustering the case organisations or impartial towards research approach. Hence, the ambiguity persists with the quantitative technique, the conceptual framework and factors involved within the framework will restrict the deviation of the scope of research. The most challenging aspect of the case study strategy is investigating from ‘what happens’ to the worth being claimed [52].
A case study enhances the researcher’s observation technique and the need for an appropriate approach; it is the most popular qualitative research strategy that generates valuable theoretical insights [53]. This method may vary along several dimensions, including internal validity and precise influence related to ambiguity [54]. A case study is an essential research track in organisational science for testing and generating theory [55]. If a case paper stands and sustains within the conceptual framework, it will view the challenges involved with a case-based approach [56]. Some of the required guidelines for the case study are internal validity, external validity, and experimental reliability [57].
Multiple case studies require a careful specification of the study’s nature to extend the claim and degree of generalisation [58]. Multiple case study is an adequate research strategy for when and why questions are being posed [59]. This case study method helps in research when conducting external validations [60], which cannot be possible in a single case study or comparative case study. External validation in multiple case studies means demarcating the domain and generalising the inferences [57].
3.2. Total Interpretive Structural Modeling
The interpretive research method is knowledge action that involves social actors in the human domain more related to critical realism [61]. Total interpretive structural modelling helps create a knowledge base based on interpretive logic and allows policymakers and decision analysts by providing transitive links and decision links [62,63,64]. According to Dhir and Dhir [65], “paired comparison is used to reduce the cognitive overload of elements in model building.” Modified TISM helps in studying and analysing the antecedent that is suitable to the context [66]. The process of identification of relationships is repeated until the establishment of complete transitivity [67]. Modified TISM need not compare the pair of factors with transitive links [68]. There are many possibilities of permutations and combinations of relationships, and some may result in transitive and others may not [63].
3.3. Poisson Situation
According to Consul and Jain [69], Poisson distribution is explained as “It has also observed that in a population, supposed to be Poissonian the probability of the occurrence of an event does not remain constant. Additionally, changes with time or previous occurrences, resulting in unequal mean and variance in the data, for example, for the increase in the suicide rate, vary from time to time and particularly concerning depression period”. It is used to explain the observed pattern. The Poisson situation is considered, as within a given internal time, when the event happens with a fixed period. Similarly, Thorndike [70] explains Poisson distribution as the possible number of occurrences is much larger than the average of occurrences through series of discrete points.
3.4. Goodness of Fit Test
Panel data regression analysis has three different models: the fixed effect, random effect, and Ordinary Least Square (OLS). When the panel data is fed into Stata 14 software, it can obtain all three models. However, model fit relevant and appropriate to the study can be obtained only by conducting a goodness of fit test. According to Hsiao [71], “panel data could have more complicated clustering or hierarchical structure; however, in certain cases, the panel data simplifies computation and inference.” Panel data provides a variety of models and general references to standards over the years [72]. Based on the obtained data, the time frame, and the variables, the models may vary. Some studies obtain a result from the fixed-effect model and random-effect model, under such circumstances, the Hausman specification test need to be conducted. Similarly, OLS regression and random effect model yield results, then the LM test need to be undertaken. That shows which model is appropriate for this study. In Asian case cluster analysis, both OLS regression and random effect model are to be conducted. The goodness of fit test (LM test) shows that the random effect model is appropriate for the study with the Prob > chibar2 = 0.0000.
3.5. Data
The secondary data is collected from the balance sheets of twelve firms: Tata Motors, Samsung, Nissan, Indigo, Mitsubishi, Huawei, Wilmar, Canon, NTPC, Hitachi, Singapore Airlines, and L&T. These firms are located in the Asian region. The time frame covered five years, i.e., from 2013 to 2017. Four variables were taken for studying their operational performance, such as operating activities, investing activities, financing activities, and social value expenditure. Operating expenditure is defined as cash generated or spent on goods and services. Such as money is coming from and how it is spent, chosen variables provide such insights.
Operating activities show the cash entering into the firm through their manufacturing, distribution of goods and services, the cash position that shows spending on plants and machinery considered investing activities, similarly cash provided for debt, equity, and funding as financing activities.
Three essential investments are considered when calculating the social value expenditure, such as administrative expenses or employee benefit expenditure (X), other expenses or doubtful returns (Y), and tax expenses (Z). Collectively referred as X + Y + Z = social value expenditure. We collected Data from 12 case organisations balance sheets of consolidated cash flow statements and social value expenditure taken from profit loss statements from the company’s balance sheet between 2012–2013 to 2016–2017.
4. Case Diagnostic Criteria and Background for Case Studies
According to Woodside and Wilson [73], “a case study is an empirical inquiry investigating a contemporary phenomenon within its real-life context, especially when the boundaries between the phenomenon and context are not evident”. Like human action, the research is also familiarised with philosophical notions. Removing the philosophical notion in case study research could seriously affect the quality of the management research [74]. Good case studies are new, interesting and theoretically relevant. Any research aims to find a new way to observe, examine new ideas, and check the theory’s accuracy [75].
The case studies are taken from the Asian region, committed to sustainable values in conducting their business. All those twelve firms have had a sustainability report for more than five years. Some have as an integrated report combined as annual report and sustainability report. The background of chosen case organisations is as follows:
(1) Hitachi is committed to society by developing original technology and products. The Hitachi sustainability approach initiated the social innovation business aspires to find solutions through digital technology in social, power, finance, and health care.
(2) L&T is one of the leading construction enterprises that focus on construction engineering and smart cities. It is committed to social development through soil conservation structures, providing necessary infrastructure such as toilet blocks and midday meal kitchens.
(3) Nissan aims to conduct fair and efficient business activities and sustainable economic growth; it also practised ethical and environmentally sound actions in all supply chain stages.
(4) Mitsubishi Corporation is committed to contributing to society through a firmly rooted business in integrity and fairness.
(5) Huawei provides communication service across all geographic areas; it also develops supporting network stability and security, especially at critical times.
(6) Canon contributes to solving problems faced by global communities and working for sustainable societies focusing on commercial printing, network camera, health care, and industrial equipment.
(7) Wilmar has been producing a sustainability report from 2009 onwards; they are committed to reporting their palm oil and sugar productions, operations and are committed to United Nations Sustainable Development Goals (UNSDG’s).
(8) InterGlobe Aviation Limited (IndiGo) is India’s largest and most profitable passenger aviation company and fastest-growing carrier company with low fare as a strategy in ticketing. Indigo reach programme focuses on three themes such as children education, women empowerment, and environment.
(9) Samsung established itself as a leader in home appliances and later evolved as a prospectus player in consumer electronics, mobile communication, and the life care business. As a part of the United Nations sustainable developmental goal practices, Samsung is working towards global corporate citizenship and promote sustainable economic growth.
(10) Singapore Airlines has a sustainability strategic working committee (SSWC) that monitors the company’s sustainability initiative. The airline strongly believes that its sustainability commitments are one of the main reasons for its success.
(11) NTPC (National Thermal Power Corporations) is India’s largest energy-producing enterprise, committed to generating reliable power through multiple energy sources. NTPC sustainability policy is inclusive growth with a focus on neighbourhood operations.
(12) Tata Motors is a part of the Tata Group founded by Jamsetji Tata in 1868; the company is significantly contributing to India’s auto-motors. Tata Motors is practising good corporate citizenship. Tata motors widely focusing on education, health, clean water, community development, and skill development.
Asian case organisations’ industries and sustainability values are shown in Table 1. Table 2 shows the obtained factors that are sensitive towards sustainability and operational complexities from the case studies.
It is evident that these firms are committed to sustainable developmental values, and they make an effort to envision sustainable development goals. The study is intended to understand the complexity involved in operational decision making while bringing sustainable principles along with long-term enterprise goals regarding the planning process. The case studies provide some insights towards their sustainability understandings from a regional perspective. The questions are “What comprises sustainable development principles and what attributes are stick towards operational decisions” are vital aspects to follow in this study.
4.1. Attributes of Sustainable Operational Decisions
Firms are committed to their functional values, such as answering customer needs, responding to global changes, and, at the same time, keeping their market value through meeting their fluctuating product demands. The customer needs change according to their differences in lifestyle, and needs are diverse in socio-economic conditions. Individual needs and affordability continue to remain as a driving component in customer-based business. The linear series of demand for a particular product may not continue for a long time; that sort of monologue in order may be due to any of the market phenomenon of customer curiosity. Therefore, continuous knowledge of the market and customer is essential. Global economic and political uncertainty has a significant role in the present political and global economic structure. Hence, the operational decisions are crucial in conducting business and sustaining profit motives.
Success in the domestic market and exploring new ventures for the international market deserve much bolstering effort and operational decisions to achieve the global market share, particularly about emerging economies. Although a new market flourishing creates positive signals, it is important to consider the infrastructure problems, local insurgency problems, inefficient bureaucracy crisis, and local currency value. The elements of sustainable operational decisions will certainly be based on a few of those mentioned above, which are shown in Table 3.
4.2. Macro-Economic Criteria: Business Opportunities
According to Denoon and Colbert [76], “The 1967 Bangkok Declaration called for joint endeavours to accelerate economic growth. It was not until 1976 at the Bali Summit that ASEAN committed itself to specific economic activities. These included efforts to improve global market access, cooperative approaches to international commodity issues, and co-operation in establishing region-wide industries”. The critical business element of these regions is the outward-looking economies in orientation, and they have three times trade share with the world economy. Specific emphasis regarding ASEAN is rapid economic growth, open for structural change, and steady social indicators improvement [77]. The ASEAN +3 had proposed to pursue co-operation with China, Japan, and South Korea [78]. Therefore, the regional macro-economic condition provides business opportunities.
“At the Male summit in 1997, member countries agreed to work towards forming a South Asian Free Trade Area (SAFTA) by 2001. South Asian Free Trade Association (SAFTA) can treat as the third step of South Asian economic integration. South Asian Customs Union (SACU) is to be established by 2015 as the second stage, and the South Asia Economic Union (SAEU) is to be established by 2020 as the final stage of economic union” [79].
Searching for new markets both in local and international spheres requires macro-economic insights. Where is the enterprise aspiring for channel enhancement? That particular geographic sphere’s culture, individual purchasing power parity, and political structure are essentials for business performance. For example, India’s newly introduced GST (goods and services tax) has a compelling impact on individual purchasing choices over a product’s design and extra features. The board capital might have been inclined to open extra channels in the southern part of India. In contrast, the new bureaucratic structure might insist enterprises open an outlet in an economically backward region or economic up shooting regions. Therefore, such bureaucratic adjustments and compulsions will affect business performances and significantly impact operational performances.
4.3. Poisson Situation
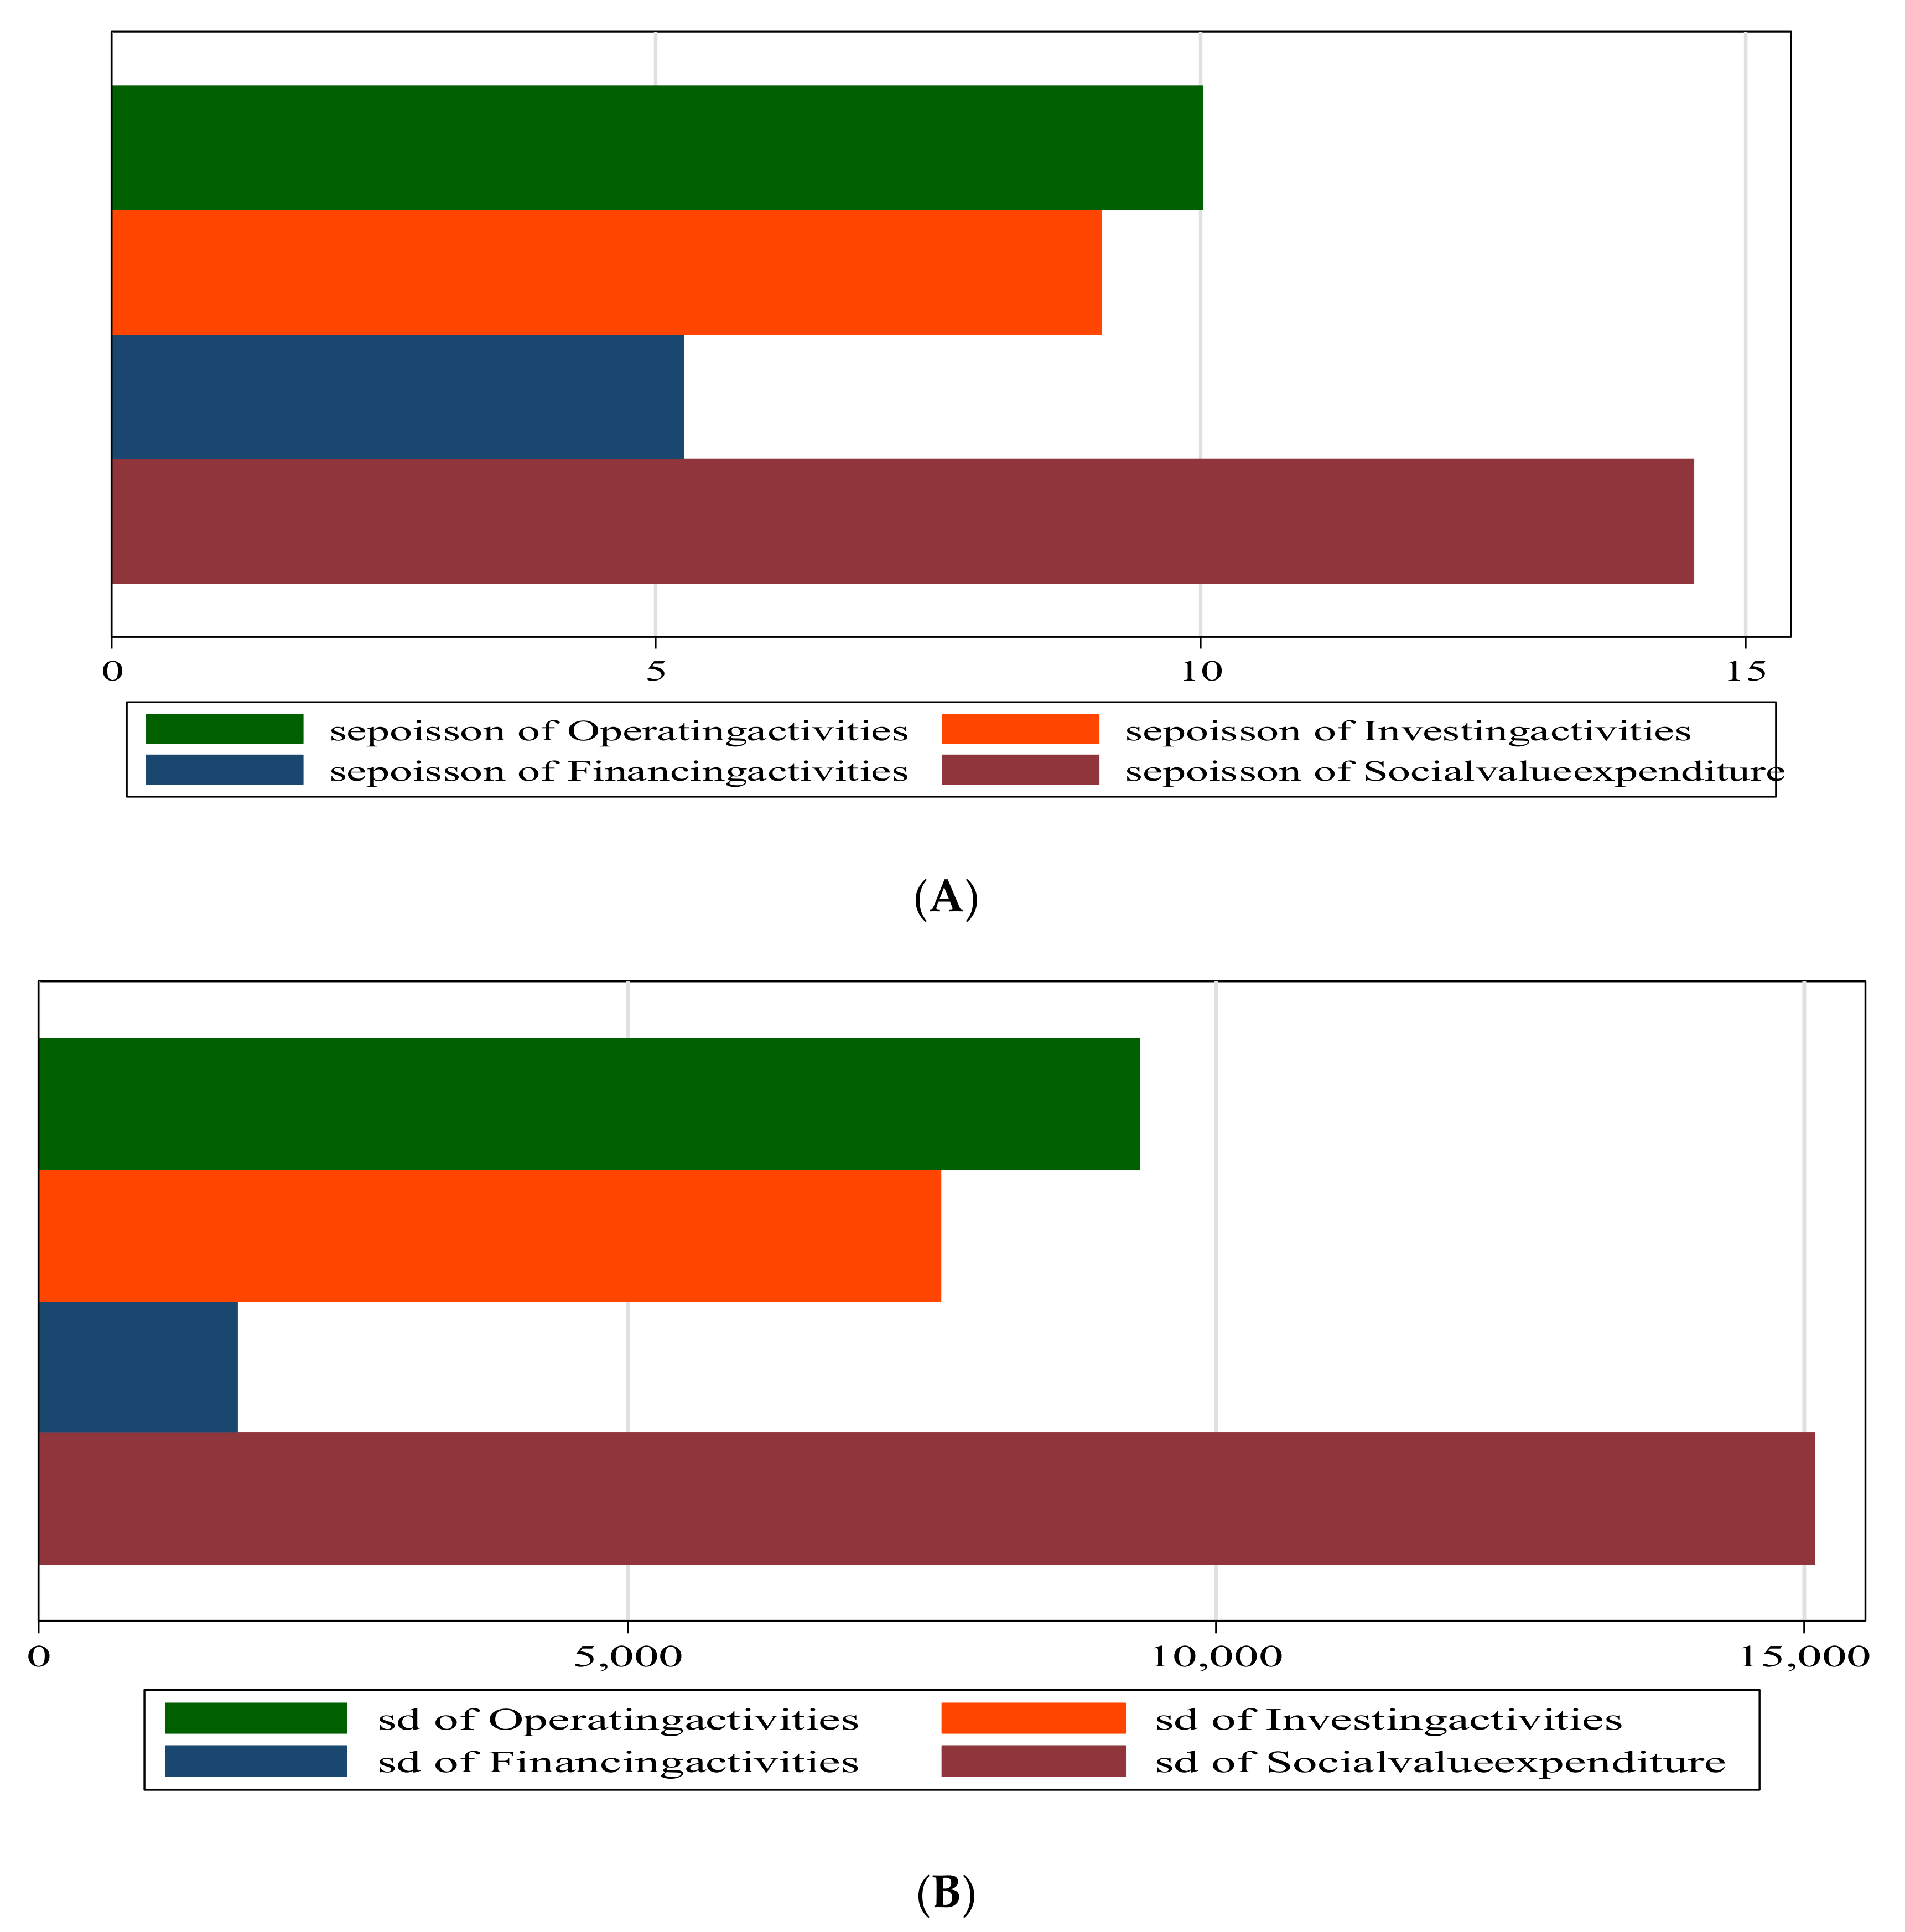
Operational excellence of 12 groups (firms) captured between the time trend of 2013–2017. Asia is an emerging economy and shows much potential for regional development and shaping the world economy. In the 1980s and early 1990s, East Asian economies (newly industrialised countries) had considered Asian tigers because of their double-digit economic growth rate, educated labour force, and potential of economic growth. However, the currency devaluation issue created the financial crisis in 1991 and became an Asian plague. The situation turned from an East Asian miracle to an Asian plague. The economic development of ‘takeoff’ happened due to government and IMF intervention to avoid capital flight. However, financial institutions continue to remain silent due to the lack of appropriate procedures [80]. The head of the Indonesian chamber of commerce had already warned that 25,000 Indonesian businessmen had already fled the country with an estimated USD 500 million in their briefcases [81]. The business CEO and board capital had pledged this towards the board’s of chambers of commerce in terms of investments tax and duties. Therefore, corporations have to invest a considerable amount in supporting activities. The growth is expected not through knowledge intensity of technology intensity. However, their labour forces educated, indigenous improvement is limited [82]; therefore, the East Asian economies may focus on “catch up” syndrome through involvement in R&D and expanding domestic market. The past lesson on the financial crisis and economic meltdown taught the importance of regional economic cooperation and its necessities to institutionalise interdependence. The specific situation is pictured in Figure 2.
The Poisson situation here is: within five years (2013–2017), there were a capital push in the investing and financing (funding) activities of chosen 12 observation groups. Hence, the data fit the Poisson expectation closely and something other than random occurrence is at work. Considerable expansion on plants and machinery spending is shown in the second subfigure Figure 1 that explains the Poisson situation of twelve identified firms. Such significant financial investments and investing activities are an answer to solve the plague of earlier financial crisis or a laying stone for regional economic interdependence?
4.4. Overall Customer Needs
The customer needs change according to their differences in lifestyle. Flight travel is often unavoidable due to laissez-faire communication circumstances. In emerging economies like India, travel fare is also an important criterion; hence, economical and affordable travel fare extensively supports Indigo’s price-sensitive consumer’s policy. Similarly, Singapore Airlines is involved in onboard comfort through taking pre-orders and increasing passenger’s carriages to 16%. Likewise, Canon understood the customer value as a potential element in unlocking new growth potential; therefore, Canon strives to achieve production reforms through cost reductions [83]. For a successful business, Nissan figured out that customer trust is an essential element. Huawei supports customers through supporting the energy sector, transportation, and manufacturing.
4.5. Channel Enhancement
The successful movement of goods in domestic markets enhance enterprise opportunities to expand their fortune towards international markets. Hence, channel enhancement is an essential factor to succeed in business ventures. Channel enhancement is adjacent to expanding markets and business opportunities; it introduces new products with new features and sophisticated technologies. Choosing a location for an outlet for sustainable transportation of goods involves channel enhancement. Nissan also continues to launch attractive new products and expand new technologies [84]. Singapore Airlines explains the importance of channel enhancement in their 2012–2013 annual report: “In light of continued economic difficulties in southern Europe, reduced frequencies to Milan and Barcelona to five times weekly. While the management had suspended Athens services, a codeshare agreement with Aegean Airlines allows SIA customers to travel to Athens via London, Frankfurt, Milan and Munich. Consequently, Istanbul flights no longer linked to Athens” [85]. Channel enhancement is a one-way process and involves two-way communication that involves international market health. Similarly, L&T says it reduces business dependence from the middle east, focusing on Egypt and African regions. Moore [86] says channel strategy is a plan that requires a product to move towards consumers through various chains of commerce. Hence, assessing sustainability in any supply chain is essential [87]. However, supply chains are becoming circular and closed loops [88]. A green supply chain helps to achieve the sustainable growth of a company [89].
4.6. Functional Training
Safety at work is an essential focus for L&T business operations; L&T practises initiatives such as digital monitoring, recording, and reviewing safety practices in construction sites. The frontline staff provides opportunities to learn leadership and professional skills, front office management, new training programmes that facilitate customer connectivity, and various functional areas of sales and marketing, reservations and ticketing, and airport operations [85]. Tata Motors focuses on 10th- and 12th-grade dropouts by giving them vocational training to prepare a ‘ready supply of workforce’. The company also started training programmes in collaboration with the automotive skill development council (ASDC); the programme aims for training about the shop floor to service centre [90].
4.7. Technology Integration
Data comes from more sources and in more forms, from personal and consumption data to video and technical data. During this digital transformation, enterprises face the challenge of deploying and integrating new technologies. These platforms enable to harness new technologies and agilely innovate to deal with changes and new competitive forces [91]. Nissan introduced intelligent seat belts that increase security, comfort, and hospitality; the secure systems function helps the driver and the front passengers secure feeling in skids or abrupt manoeuvres. Samsung’s 28FDS process technology combines high performance and low power consumption with responsiveness to power management design techniques and promises modern mobile and consumer multimedia chips.
4.8. Opportunity Loss
The course of action did not permit the investor to profit due to strategic choice or a specific asset. The opportunity loss may happen due to other factors such as the decline of demand for specific traditional brands related to competitors’ introduction of new products. In the case of Nissan, demand shifts from mature markets to growing markets faster than Nissan’s mid-term planning assumptions. In the NTPC case, the generation of power from the coal-based unit could have been higher but reduced due to less generation schedule.
4.9. Urban Infrastructure
Huawei supports urban infrastructure by developing ubiquitous connectivity that provides network connectivity in three main areas: individuals, homes, and organisations. Nissan is introducing advanced safety technologies and autonomous driving technologies such as ProPILOT to advance the ultimate goal of reducing fatalities involving Nissan vehicles to zero [84]. L&T continues to remain as one of a few leaders in construction, providing building solutions, affordable housing, hospitals, smart cities, intelligent traffic management, and logistic systems, which are some of L&T’s milestones.
4.10. Purposeful Design
Product design determines the company’s success and turnover. A purposeful design must be portable, cost-effective, and scientific. What product definition that the top management is visualised; its purpose is essential that is characterised by the ability to repeatedly employ problem-solving, creativity and decision-making in a controlled and efficient manner to reach an adequate product definition [92].
5. Application of TISM
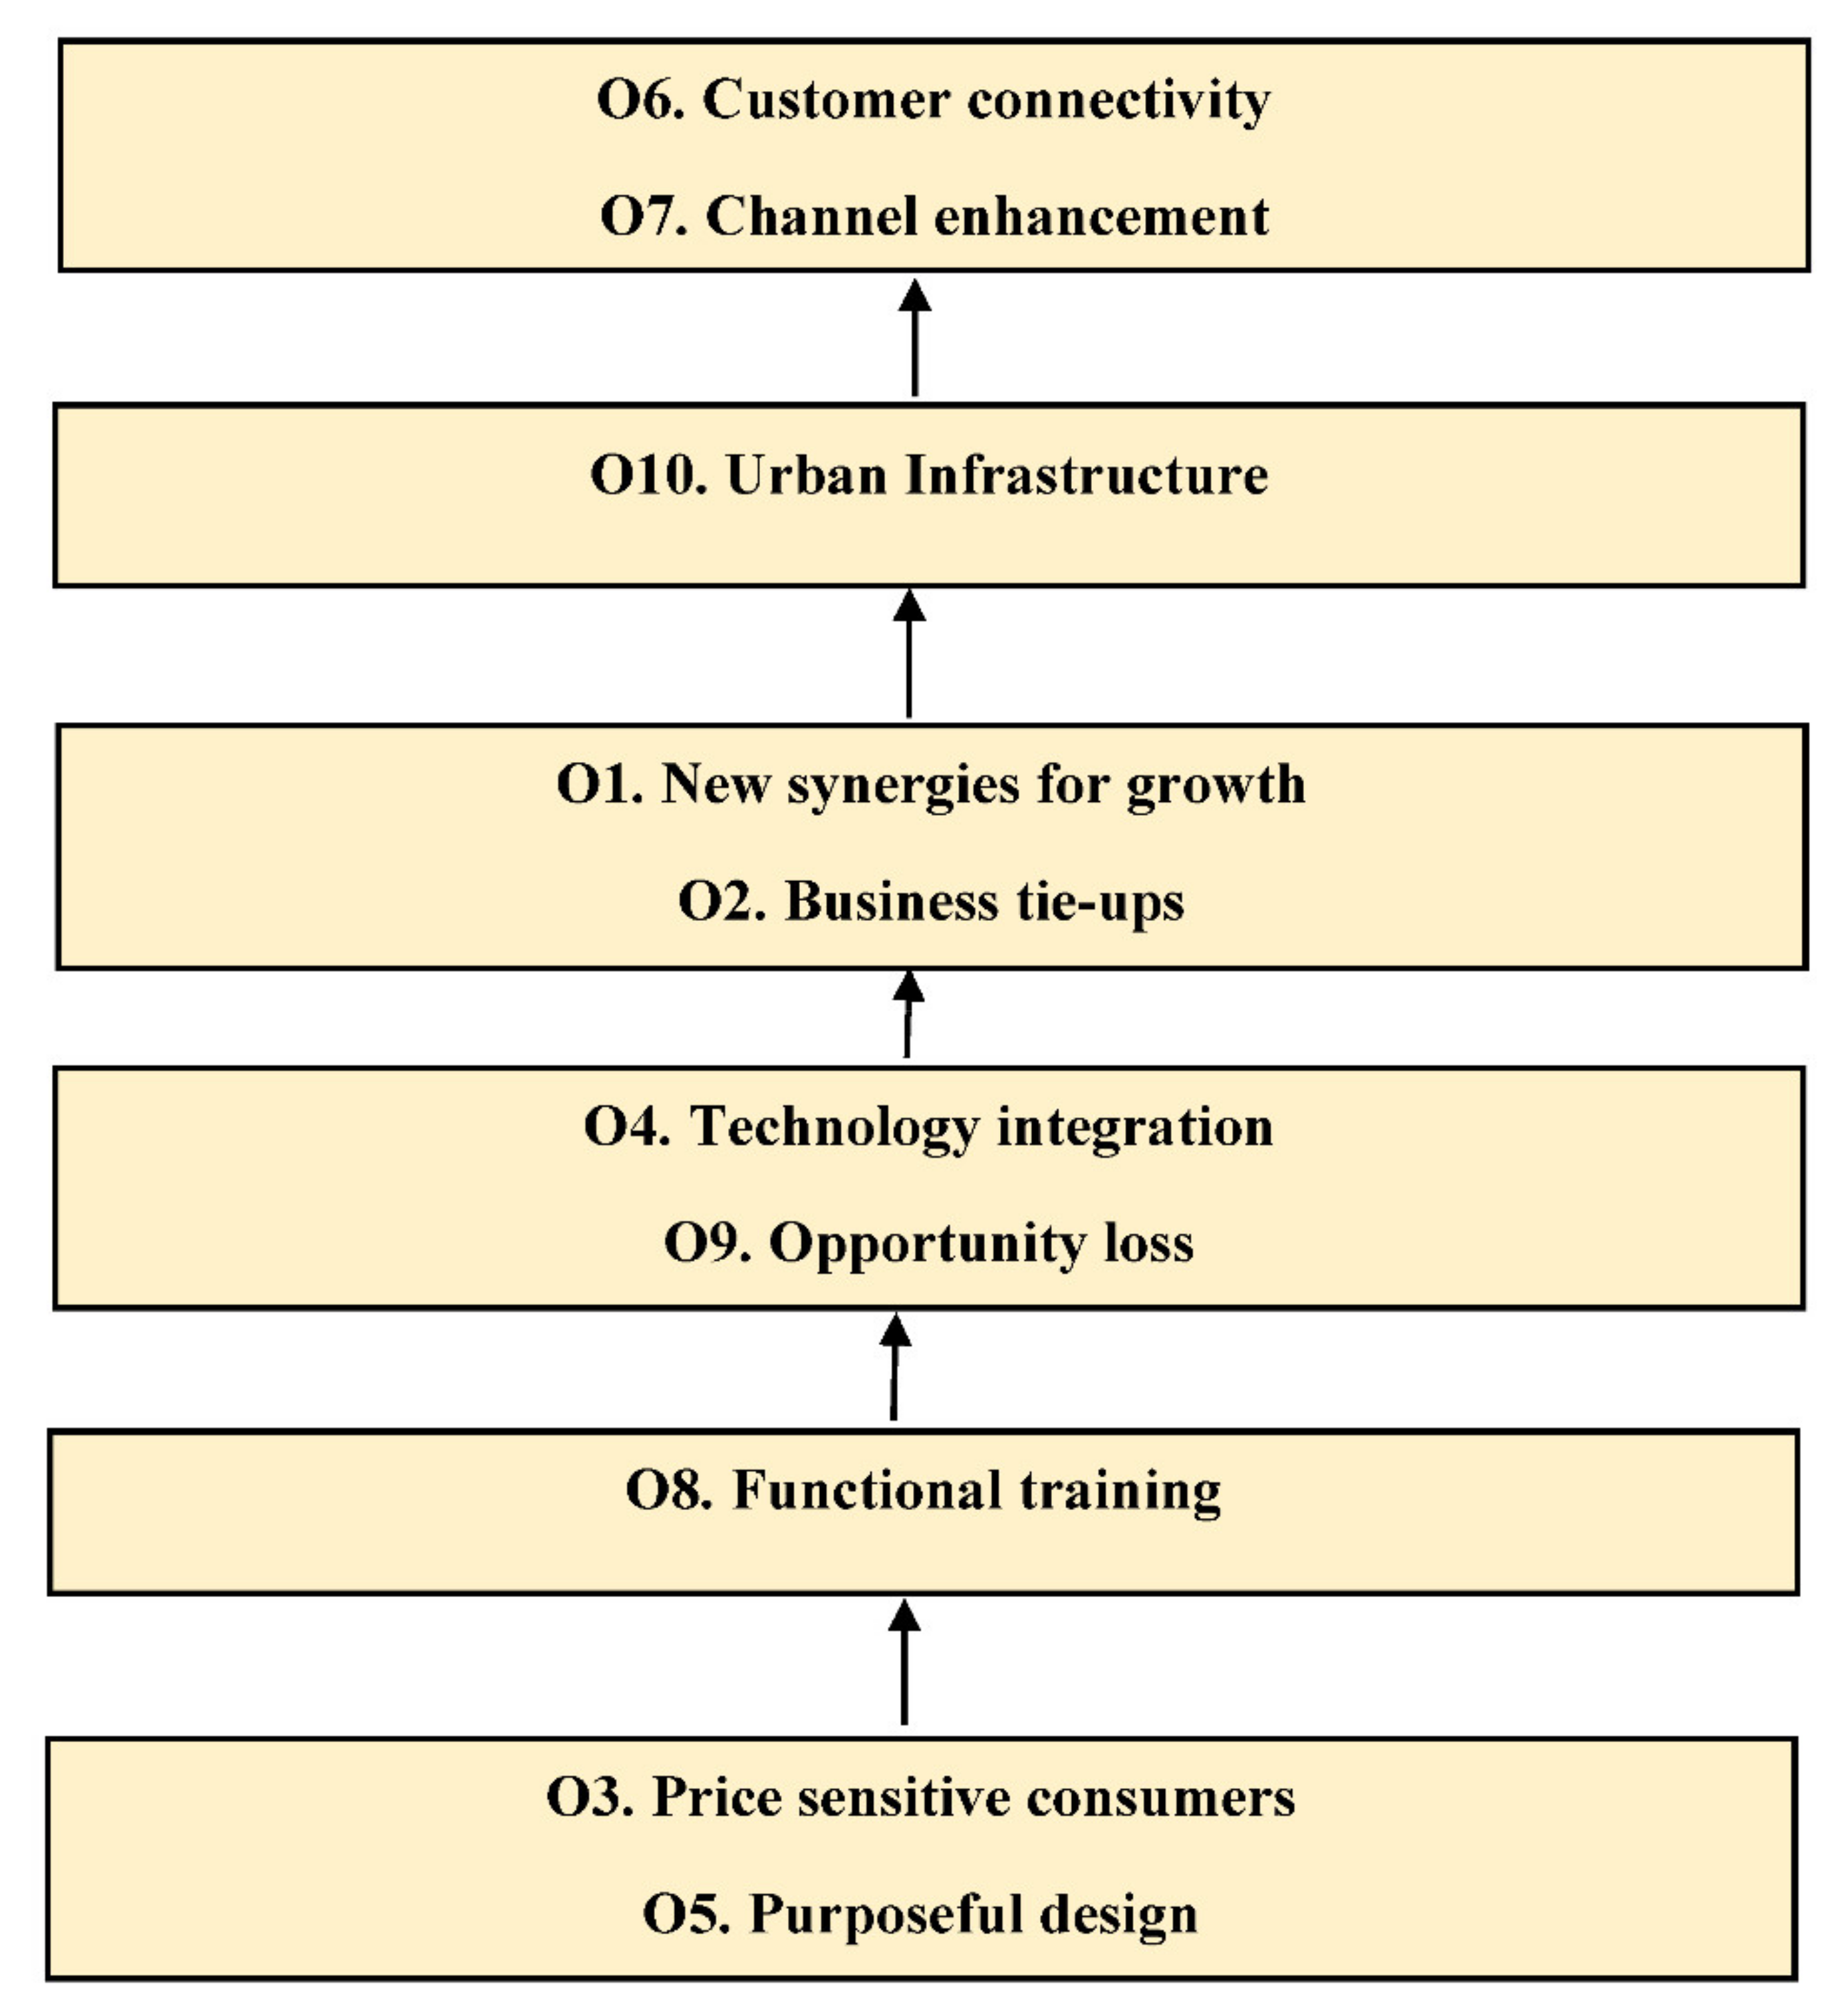
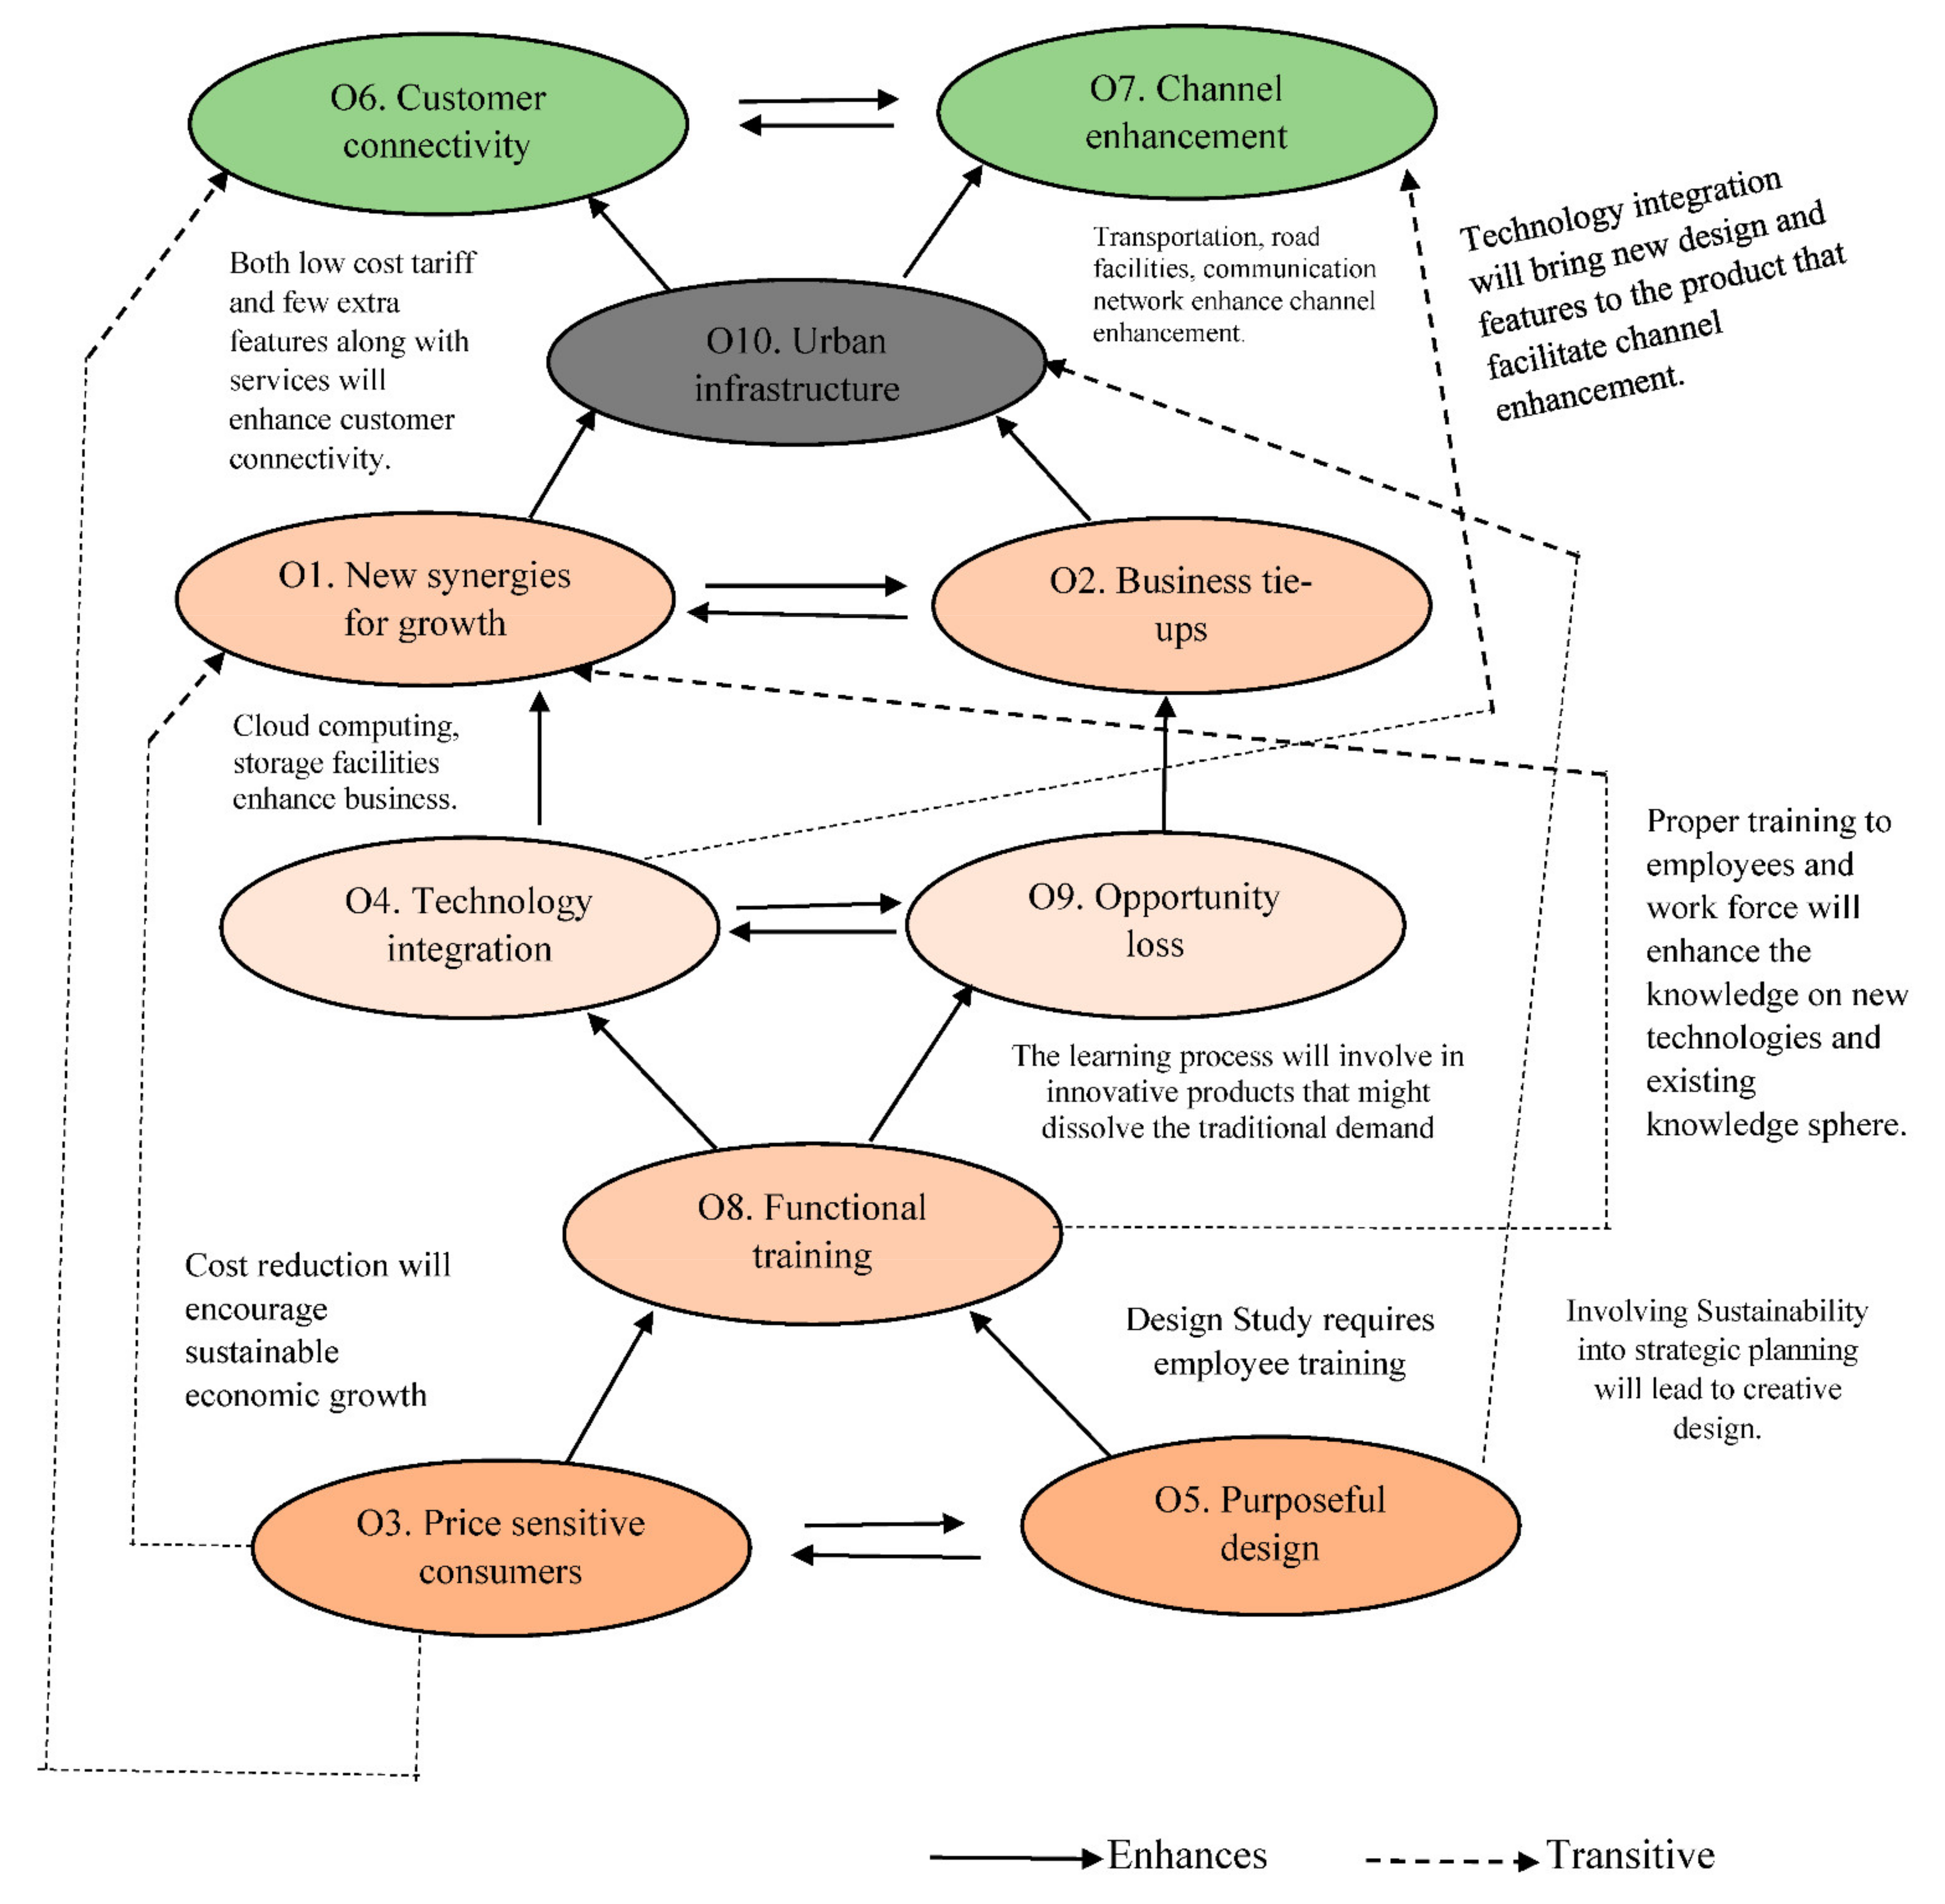
Total interpretive structural modelling (TISM) is a technique that facilitates researchers thinking process into systematic and structured knowledge. Table 4 shows the factors that are derived for strategic intent. In the transitive reachability matrix, factors numbered as ten vertical and ten linear, and diagonal matrices remain one shown in Table 5. When the definite significant answer had marked as one, and the inverse marked as zero. Additionally, in the next step, the transitivity is checked; further, Table 6 shows level partitioning obtained that shows the hierarchical positions of factors. The successive pairwise comparison of both decision and transitive links is shown in Figure 3. Based on the obtained level, partitioned factor’s ISM (Interpretive structural modelling) is developed that shown in Figure 4. From the ISM, the fully developed TISM model, along with transitive links, are shown in Figure 5.
The ten factors are taken from case studies collectively and combined with the joint discussion similar to the case organisations. Channel enhancement and customer connectivity remain as high-intensity factors for the case organisations. The firms are interested in fulfilling customer needs, and they are operating and strategizing to expand their channels from the domestic market to the international market. Technology integration remains a transitive link for channel enhancement. Urban infrastructure enhances the channel enhancement and customer connectivity process. New synergies for growth and business tie-ups enhance urban infrastructure; when there are more business activities, infrastructure comes up in the geographical areas, road constructions, network connectivity, and transportation facilities are part of urban infrastructure. Such new synergies of growth are possible through technology integration. At the same time, the enterprise has to be aware of opportunity loss; every business tie-up does not yield success, as explained in the TISM model in Figure 5.
Functional training remains a driving factor for technology integration and opportunity loss. Proper training on soft skills and technical skills supports the technology integration that avoids unnecessary workforce stigmas. Similarly, lack of knowledge on the market, new technology, and technical and soft skills leads to opportunity loss. Purposeful design and price-sensitive consumers remain as driving factors of the model. Low-cost strategy and purposeful structure of the front office, product design seems to be pushing element in case discussions. Hence, the model explains that Asian firms are framing business strategies to utilise the emerging economies market and business opportunities. At the same time, they are aware of fluctuating macro-economic situations. The interpretations are derived from case studies for both decision and transitive links are shown in Table 7 and Table 8.
6. Testing of the Framework Study
How does the study empirically analyse the current position and shortcomings of chosen case organisations? The answer lies in selecting the appropriate variables that are related to the study. The amount received from operating activities and money spent on investing in machines and plants is directly associated with the manufacturing process. Similarly, money returned as credit pay and debt took as variables for conducting panel data analysis along with social value expenditure. Operating activities remain the dependent variable, whereas investing activities, financing activities, and social value expenditure remain explanatory variables. The study conducted panel data analysis to understand the model fit are shown in Table 9 and Table 10. The empirical analysis based on secondary data is shown in Table A1 and Table A2 in Appendix A. The model fit of the empirical analysis is performed through the goodness of fit test is shown in Table 11.
Both pooled OLS regression and random effect GLS regression were conducted to understand the model fit for this study. Further Breush Page (LM) test undertaken to understand the goodness of fit that shows random effect model is appropriate for the study shown in Table 11.
Twelve firms were considered as twelve groups and sixty observation points throughout 2013–2017. The data analysis supports the study by showing that social value expenditure and investing activities positively and significantly explain operating activities. It implies that social value expenditure needs explanation and clarifications in understandings. In this study, employees benefit expenditure, pension allowances, administrative expenses, and other least expected returns by management and board capitals are considered social value expenditures (SVE). An increase in SVE increase firms operating activities. This observation positively implies that SVE positively and significantly contributes to enterprise sustainable operational performances. Organisations’ investment in sophisticated technology, efficient plant and machinery and less energy-consuming machinery led to an increase in the firm’s operating activities that had explained in the model as investing activities positively and significantly explaining firms operating activities.
Asian Regional Study Result Analysis
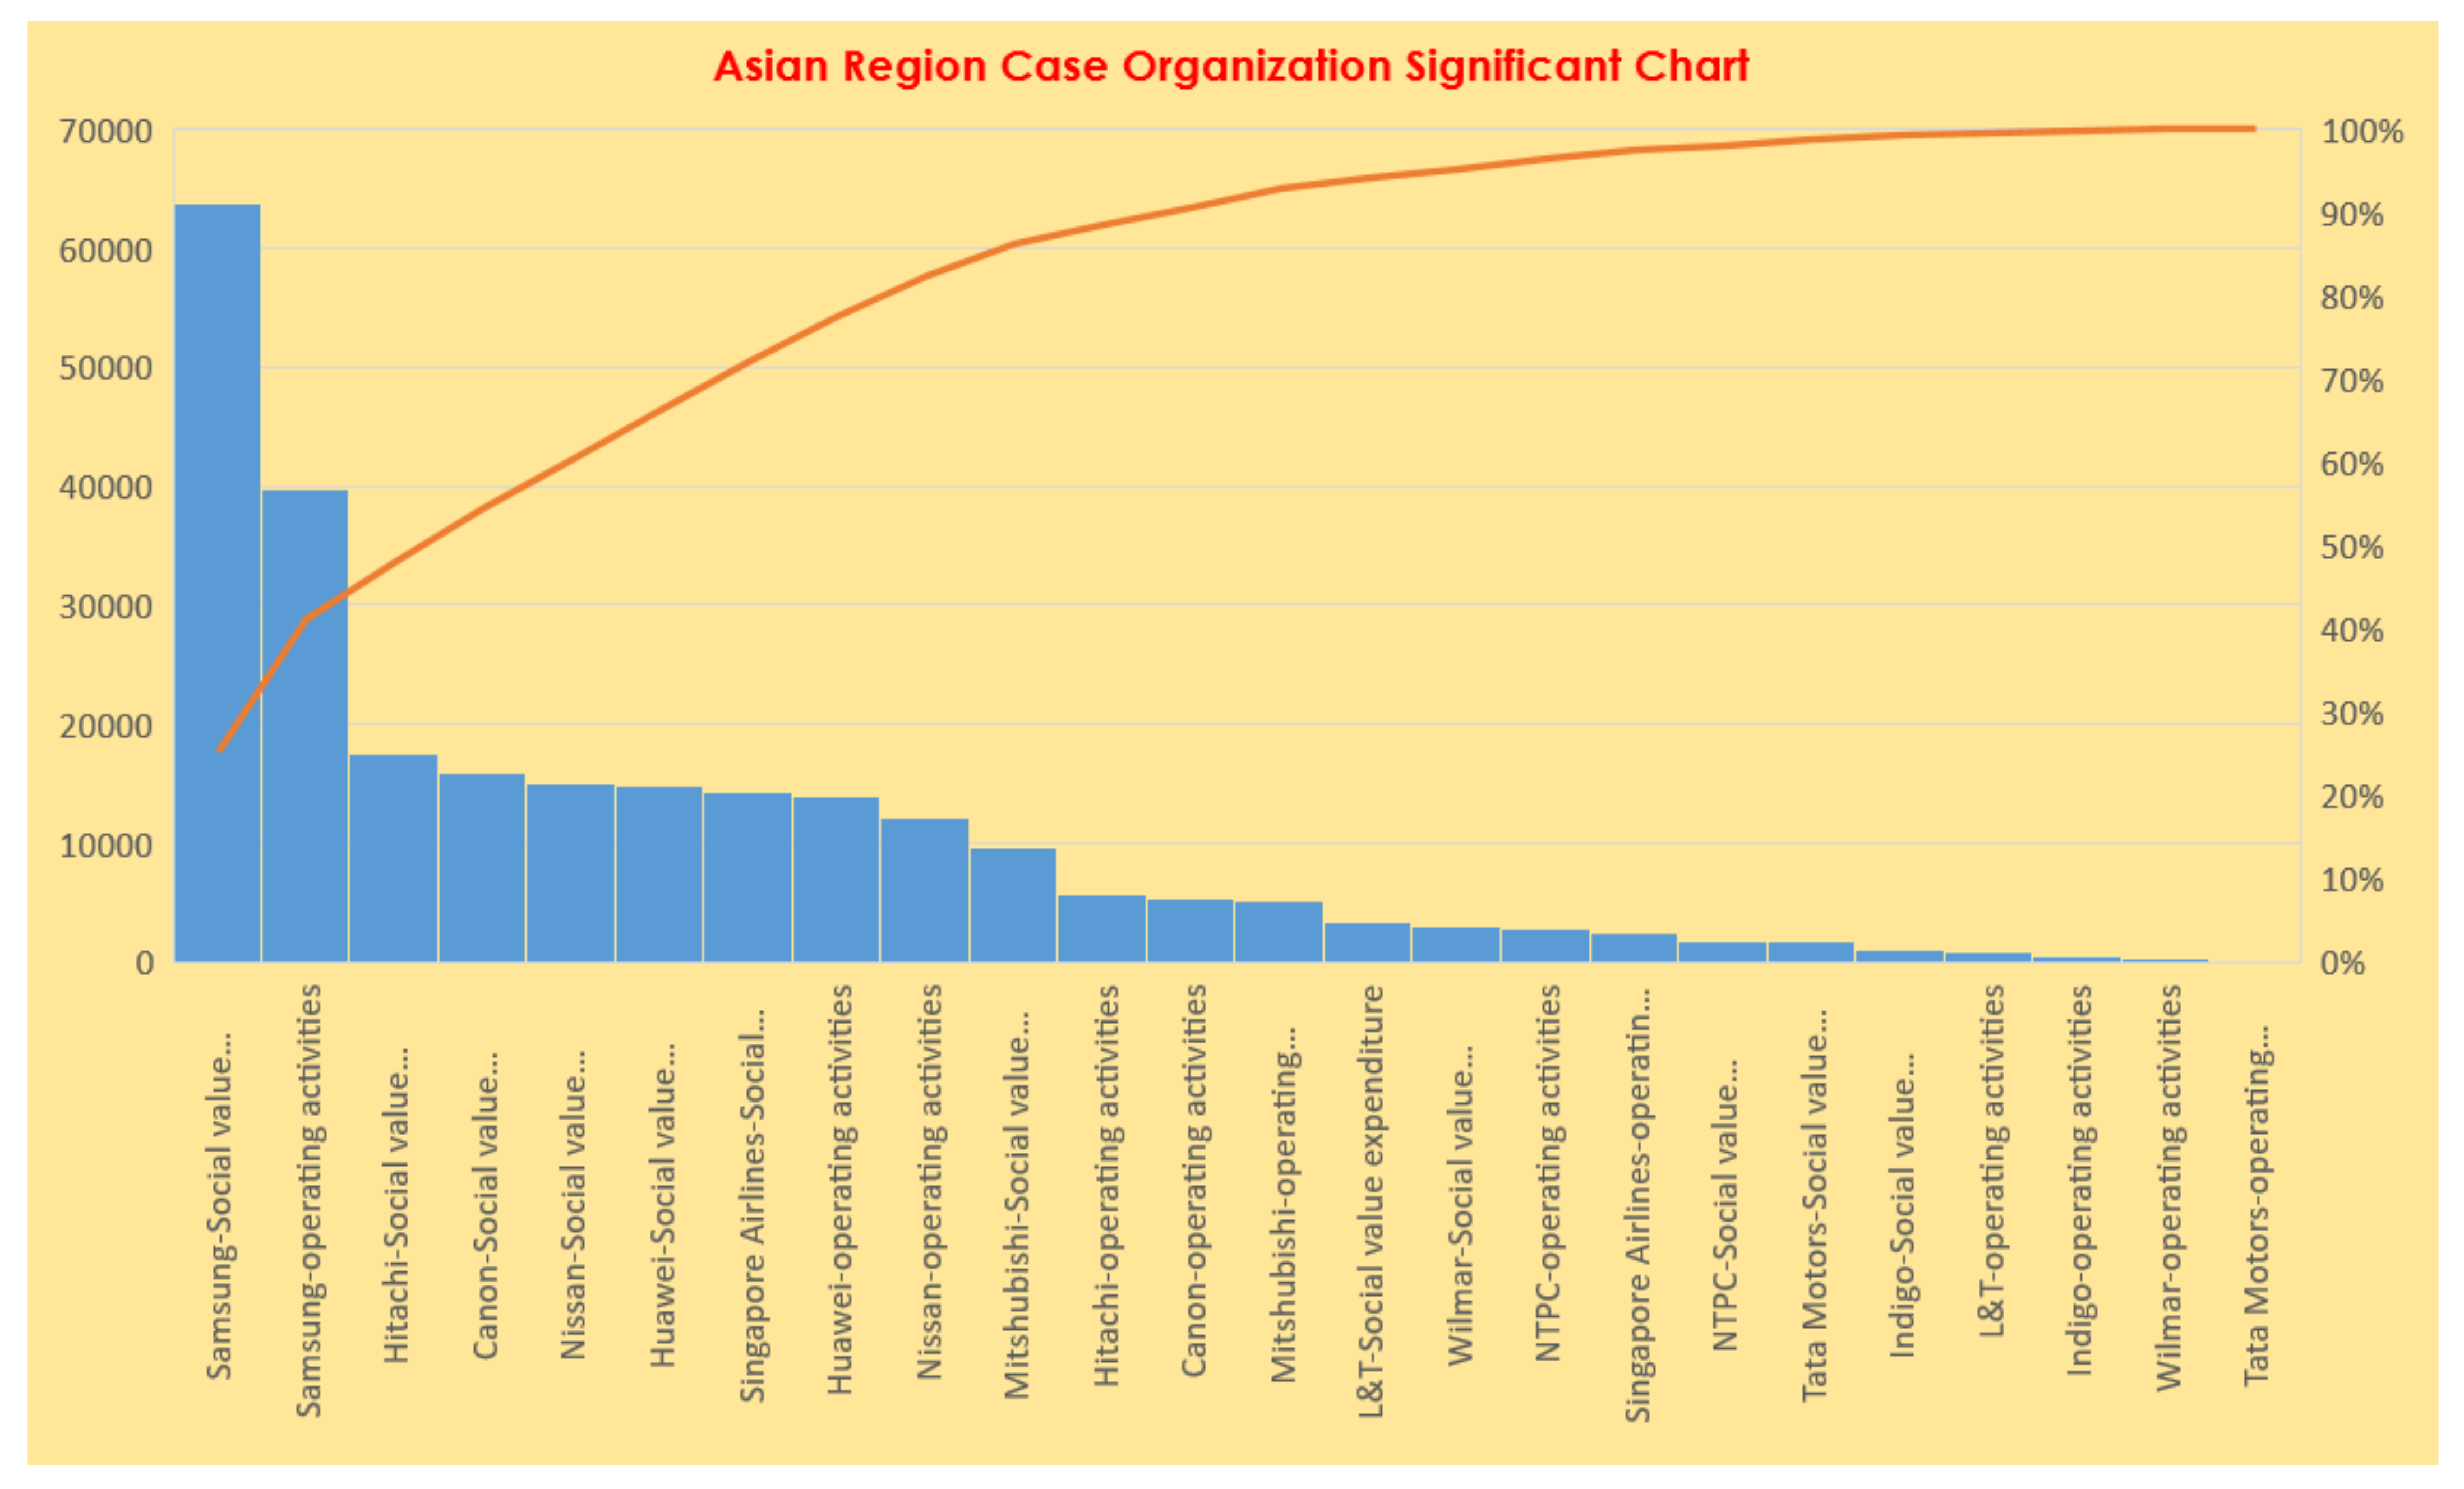
In this section, for Asian regional analysis is conducted with a Pareto chart. According to Grosfeld-Nir [93], “Statistically, a Pareto chart is simply a frequency block diagram displaying the relative frequency of different attributes in descending order. This classification is an essential step that must precede taking the corrective measures of differentiation and allocation”. A Pareto chart is widely used to gather information on minor attributes that cause significant problems. This technique is a decisive decision-making criterion in quality that explains that the bulk of the issues result from few sources [94]. This bar graph analysis in this regional study aims to identify the amount of expenses and analyse their performance differences among twelve regional firms collectively.
From the bar diagram shown in Figure 6, it is evident that three firms such as Samsung, Hitachi, and Canon, are spending significantly towards social value expenditure. The exponential line shows that SVE is higher than the operating expenses. This observation conveys important regional information that operating activities are facilitated by SVE (social value expenditures). Such an approach can be a part of their operational strategy or business tactics to utilise the available market opportunities and absorbing capacities. All the first three firms are electronic and communication equipment focused firms, there may be situational growth, wide presence of growth opportunities, and their competitive parity may slow down. However, the analysis shows that SVE enhances operational activities.
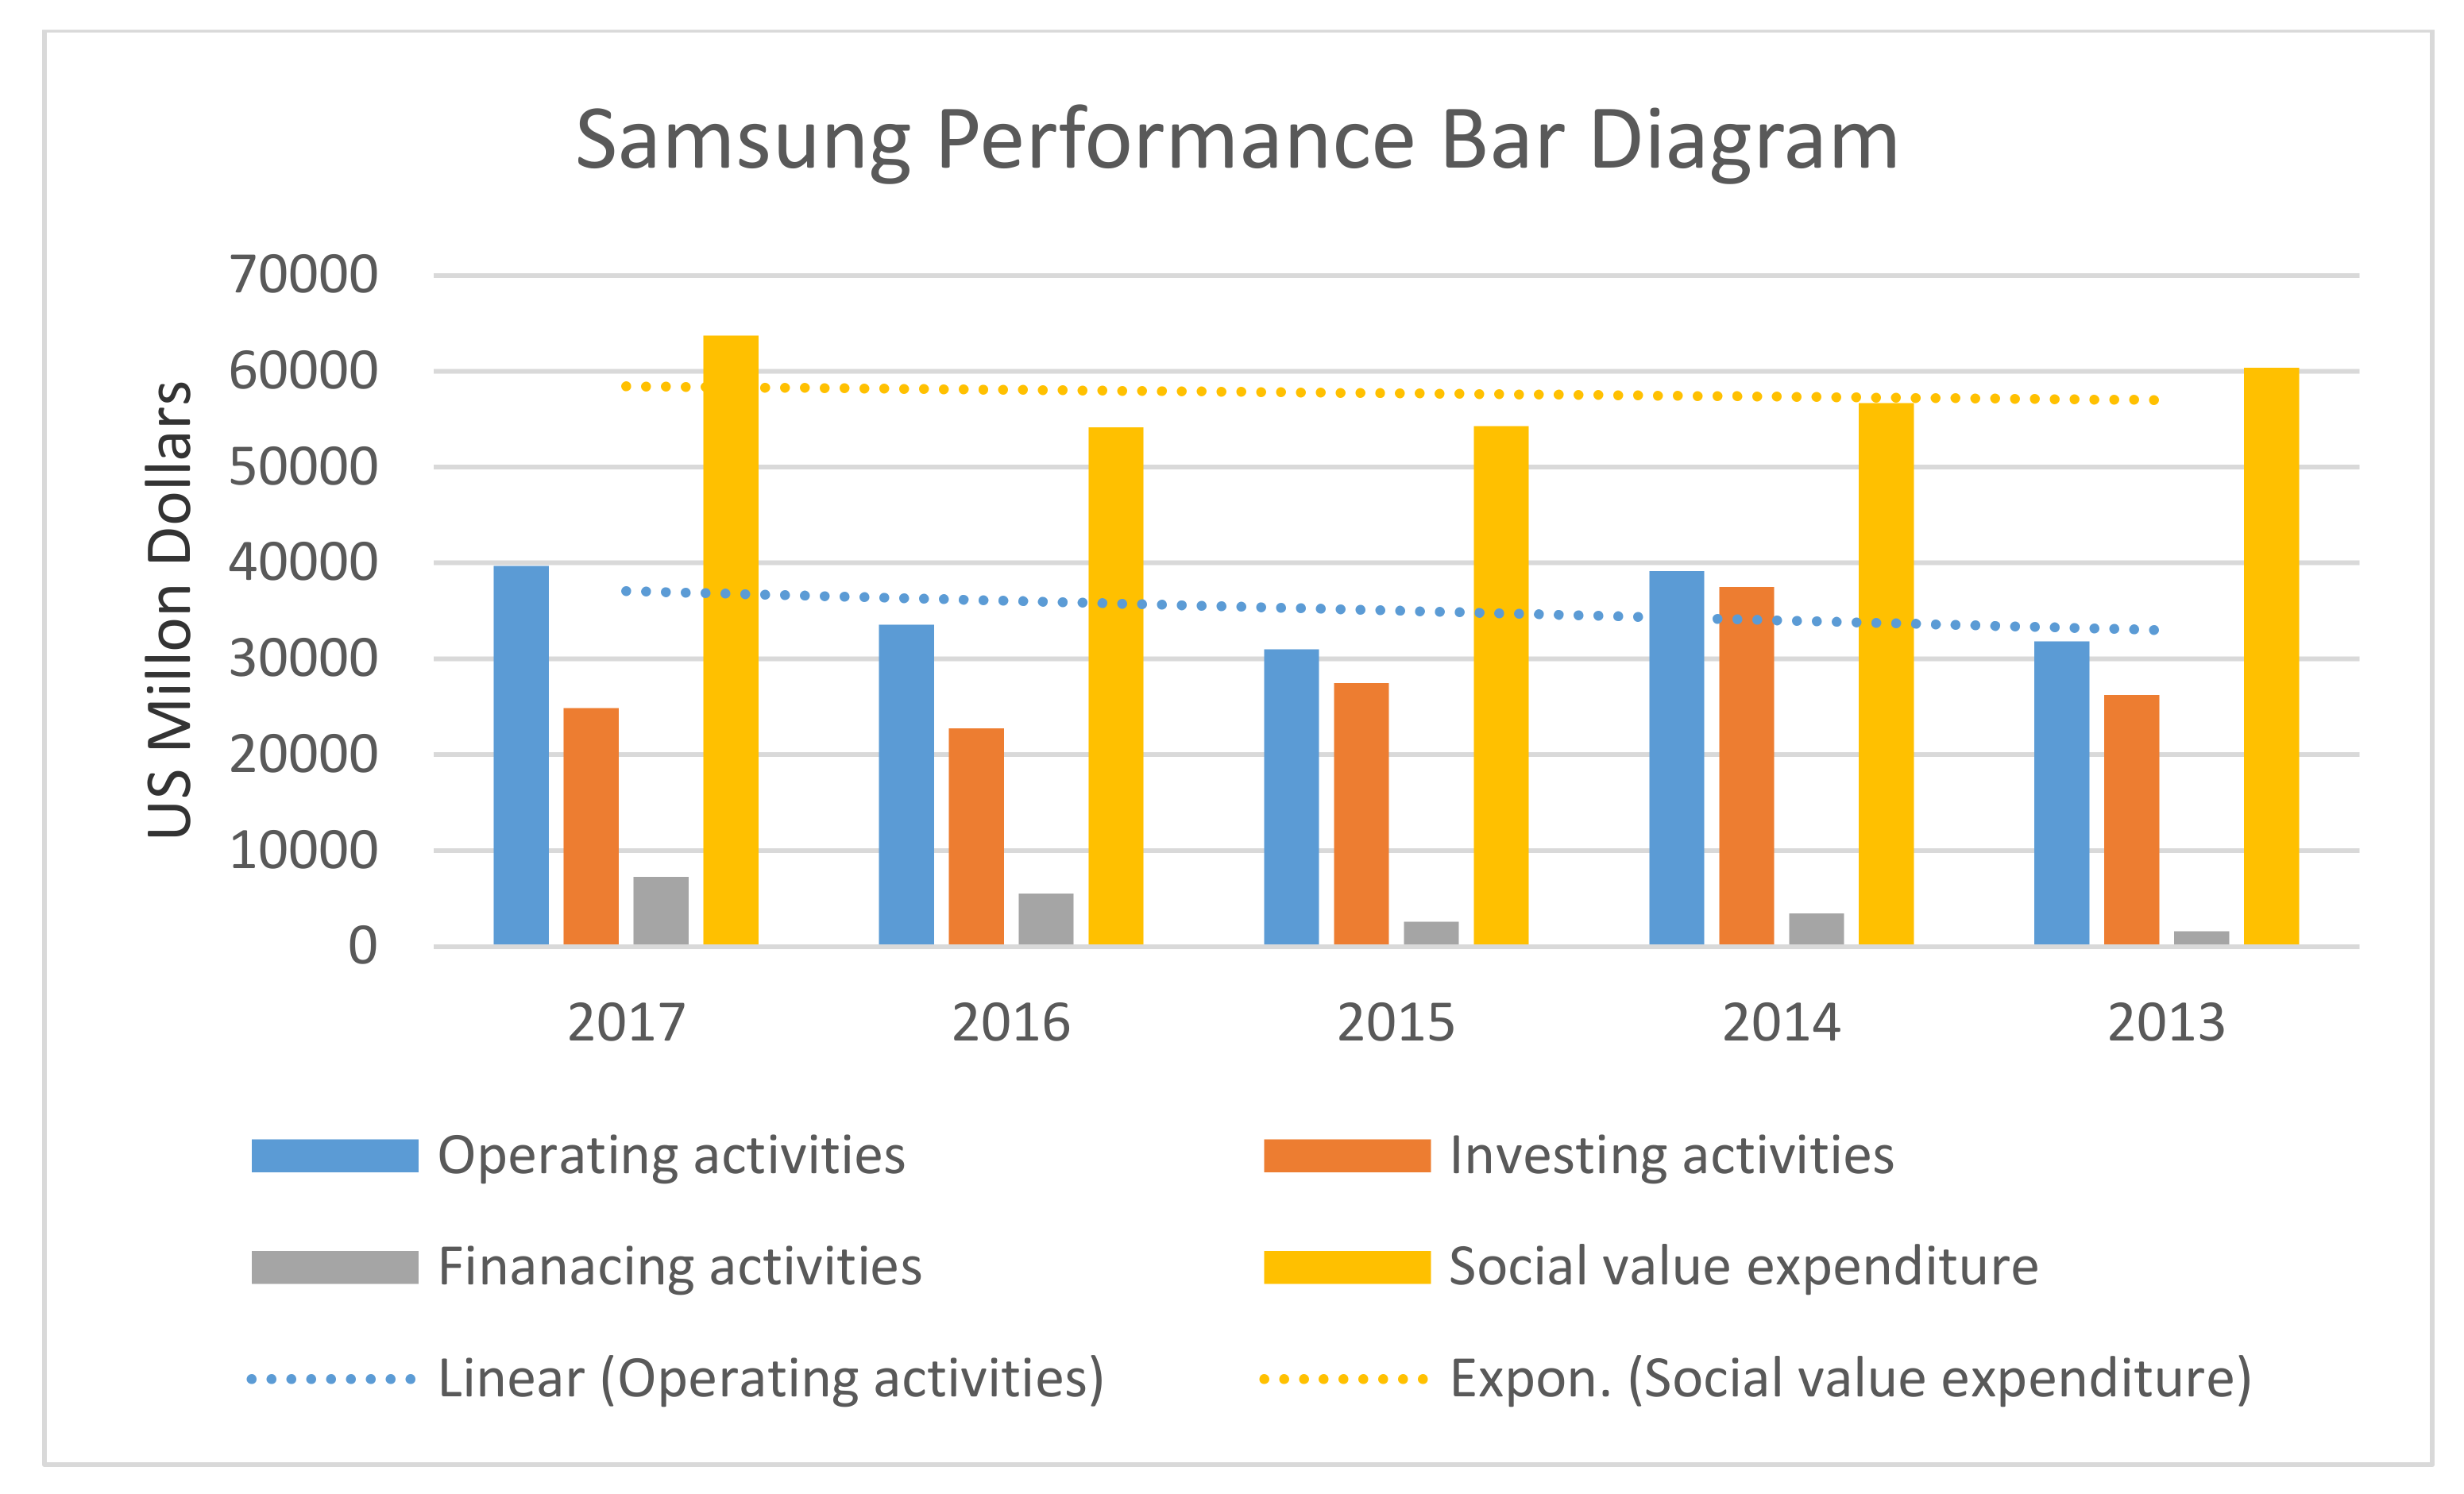
In the case of Samsung, their design strategy continues to remain as their business cutting edge. Although yet to firmly establish in the global market, according to Yoo and Kim [95], “The bold designs of its televisions often defy conventional style. With its Galaxy Note series, Samsung introduced a new category of smartphones—the phablet—widely copied by competitors. Design is now so much of its corporate DNA that top leaders rely on designers to help visualise the entire company’s future. They incorporate empathy, visualisation and experimentation”. Another reason for Samsung’s growth is the ‘opportunity based’ approach. The opportunity for channel enhancement exists because other known brands slow down the process or lack knowledge towards the emerging market scenario. However, statistically, the ratio between SVE and operating activities are 3:1 that is shown in Figure 7 two of the exponential line of SVE and operating activities.
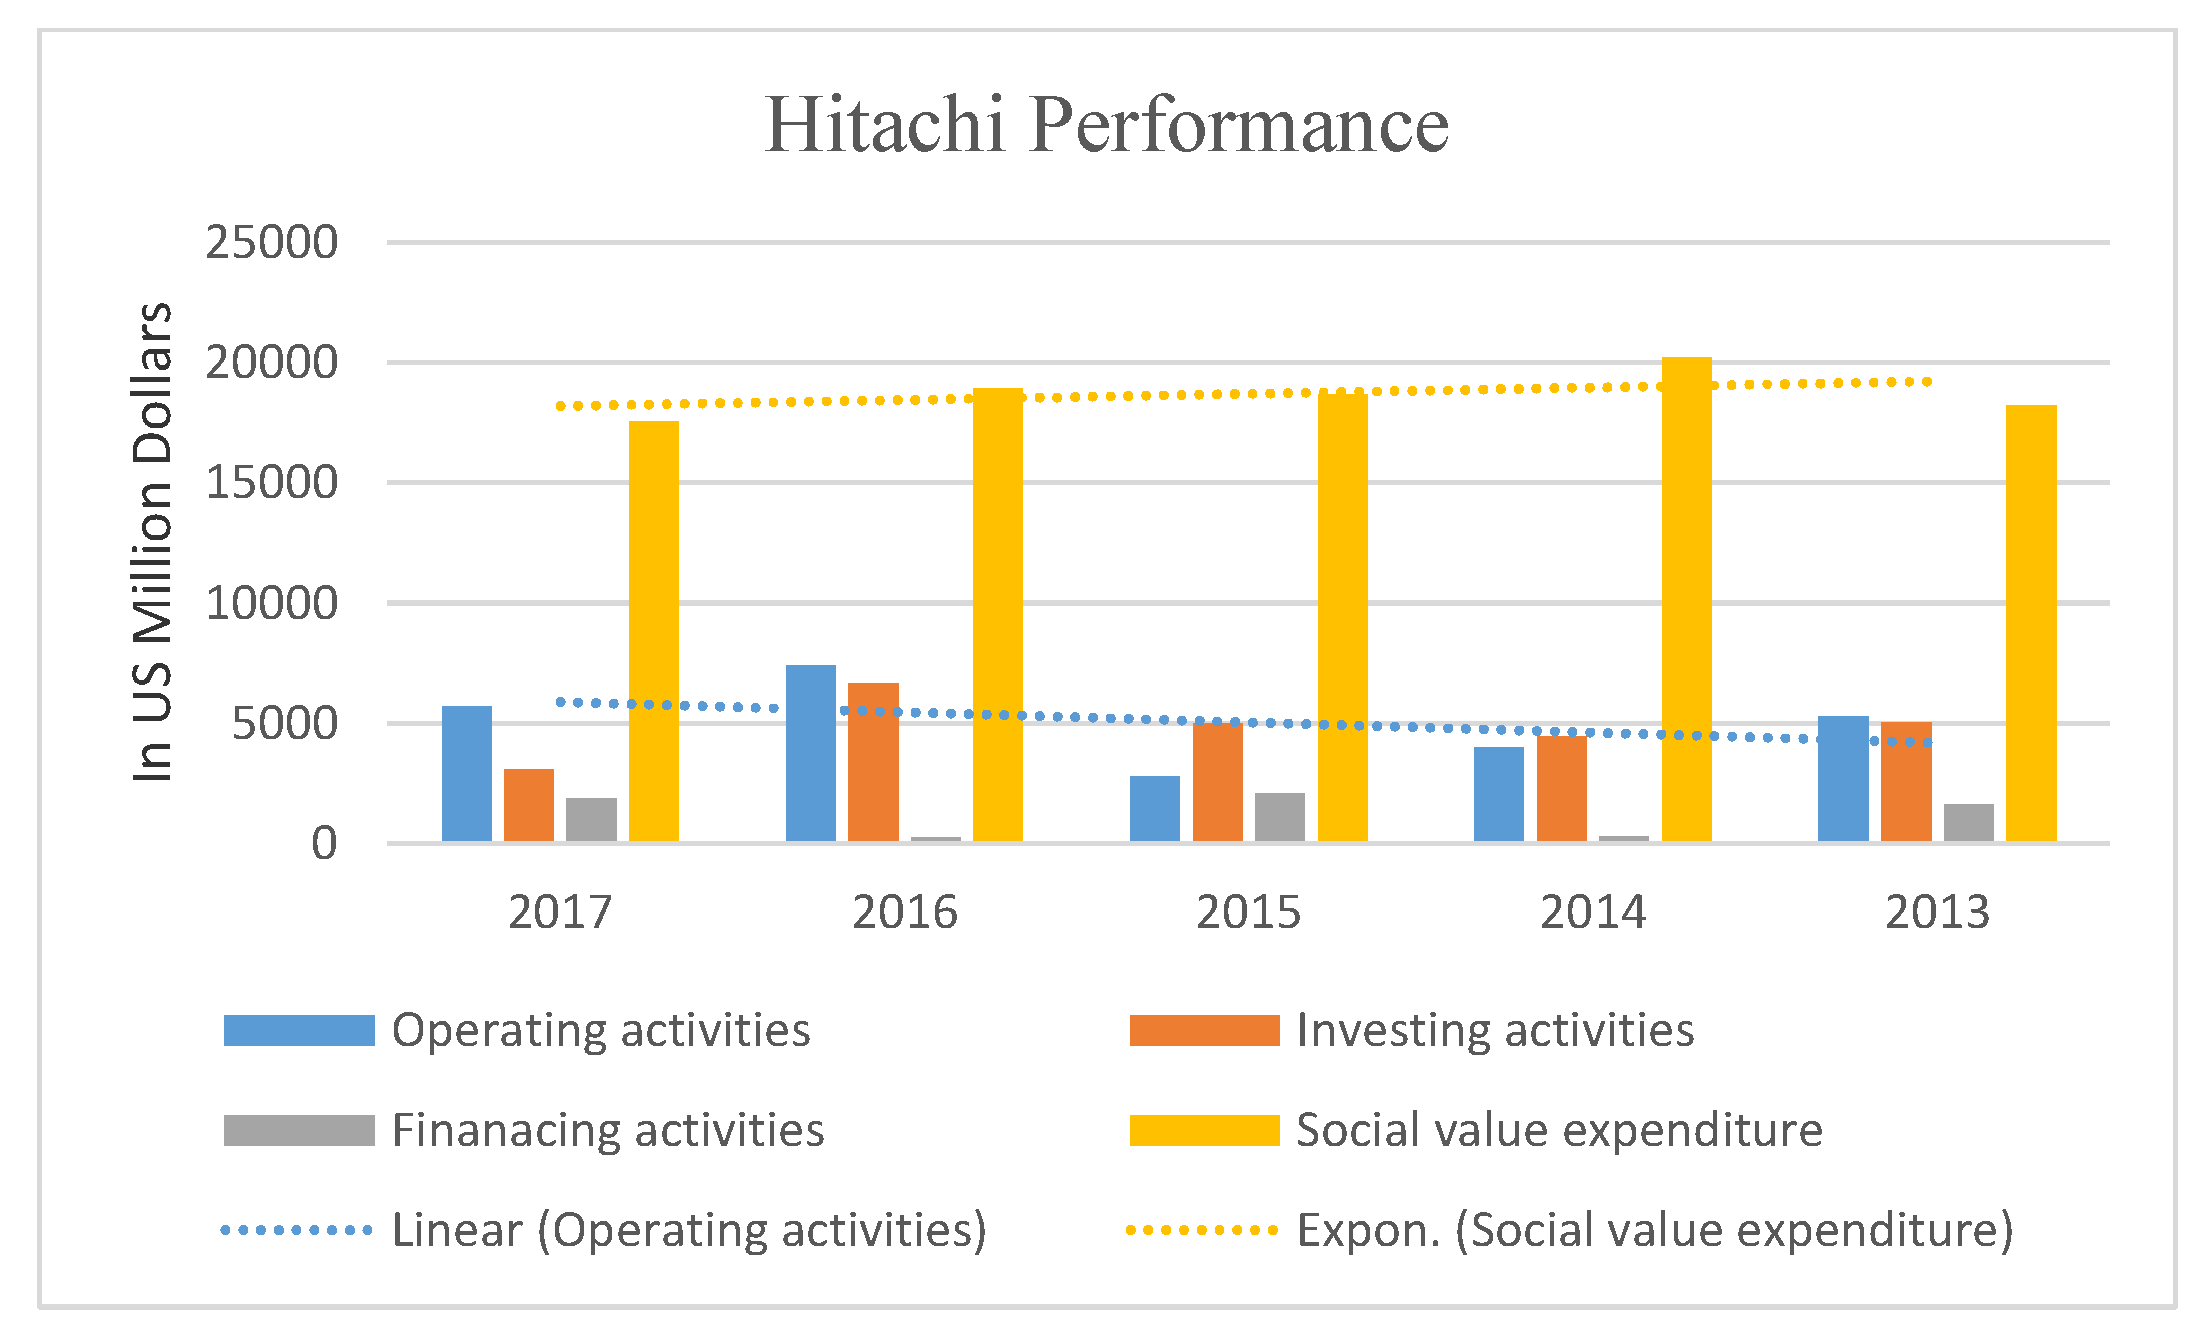
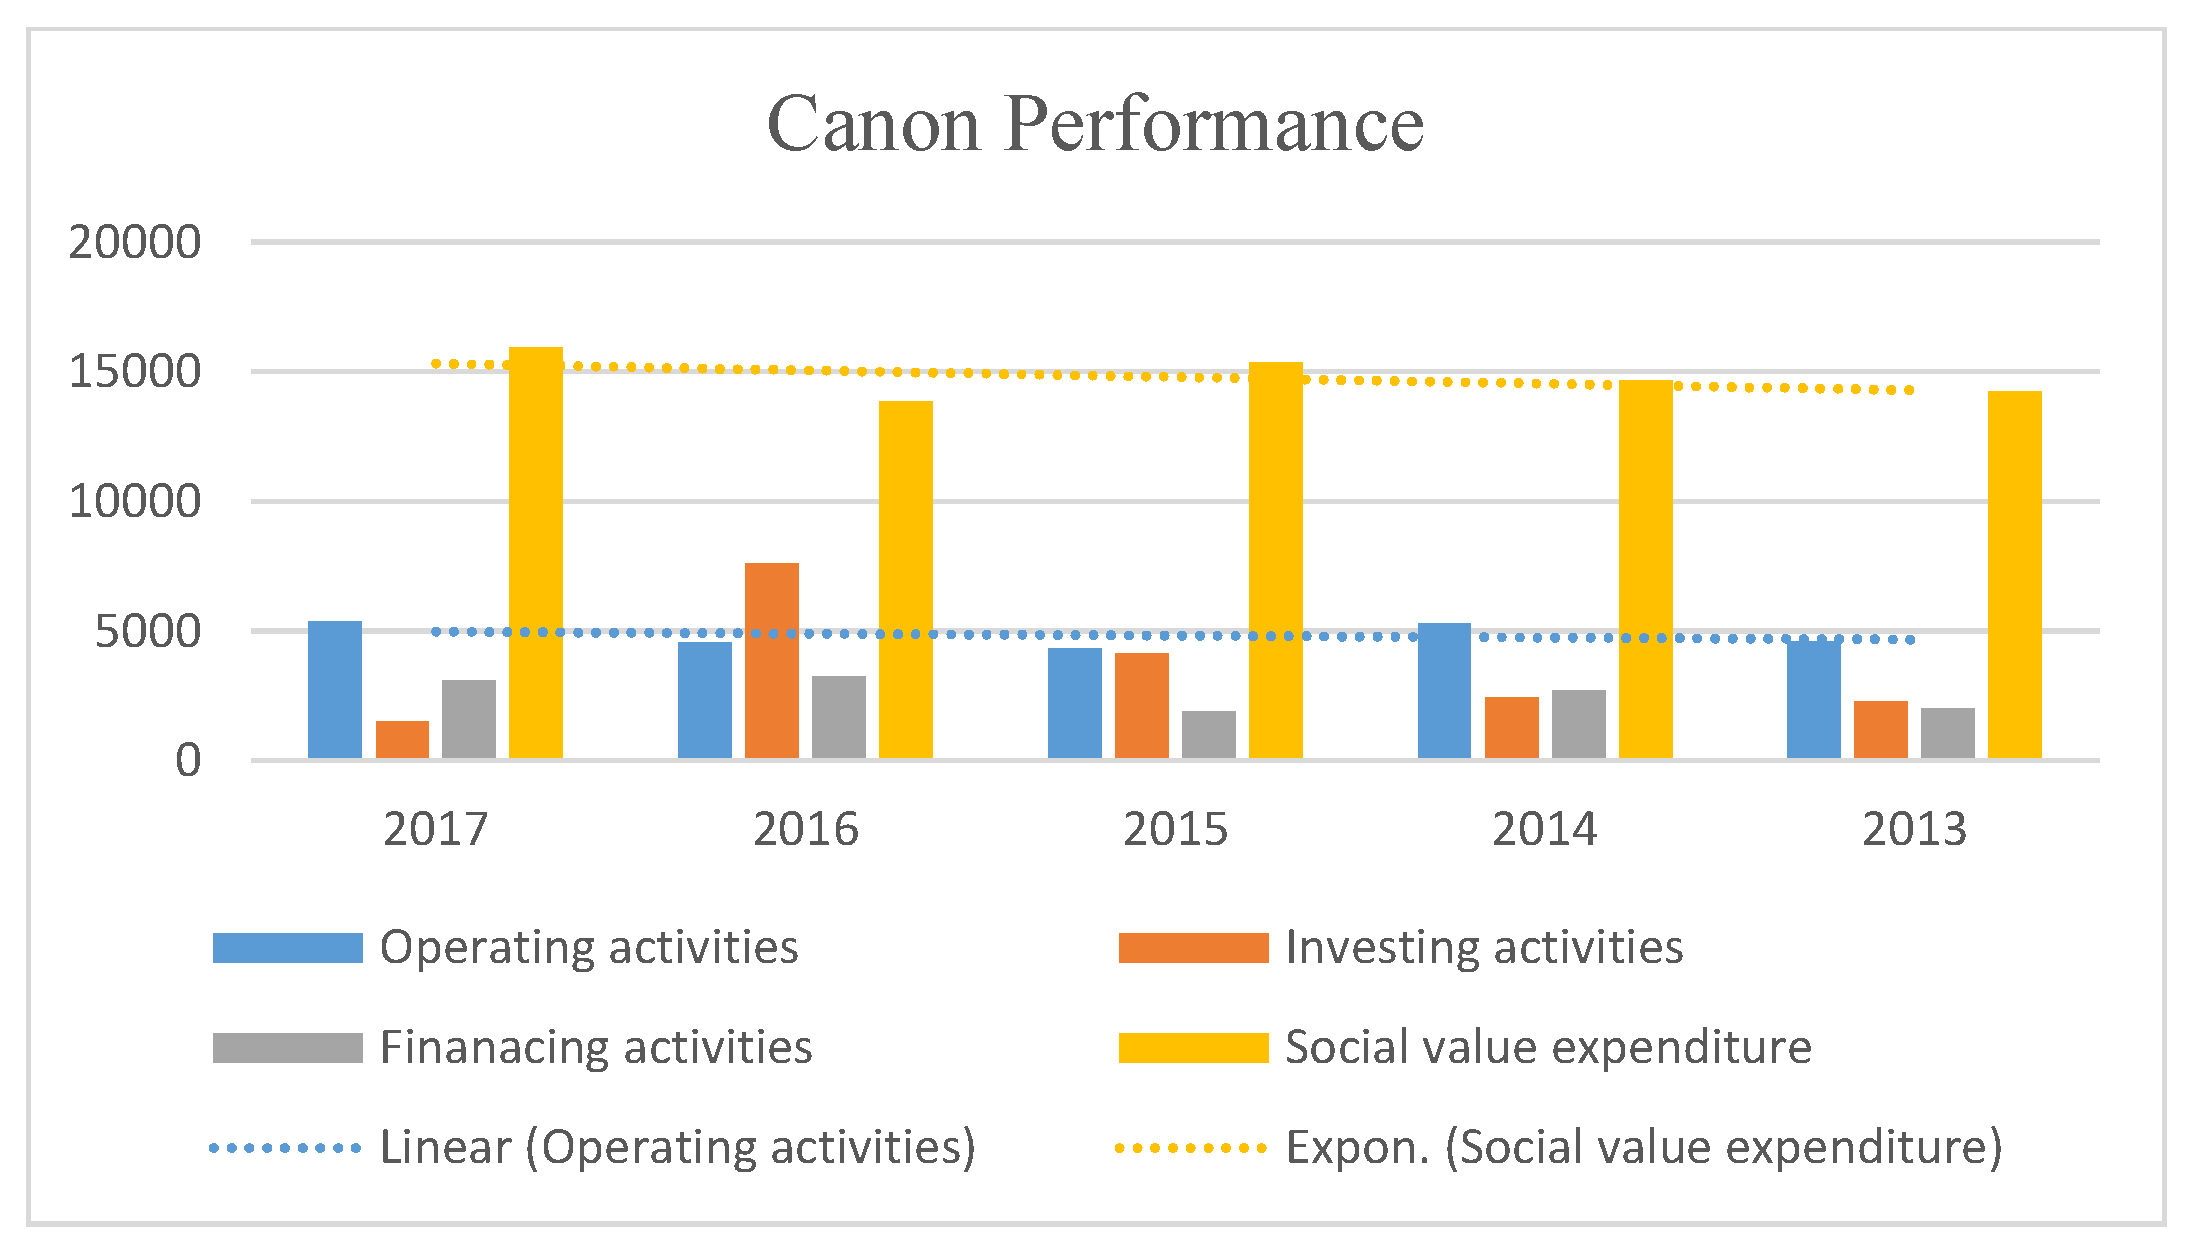
Hitachi is known for its best service delivery, highest quality and advanced technology, and it skilfully uses the workforce to get the maximum out of the system [96]. Hitachi exponential line is shown in Figure 8 and Canon in Figure 9.
Canon used original technology that did not violate any of the 600 patents; until then, Canon was concentrated in its camera industry, as a part of diversification, canon started a plain paper copier. Canon viewed the market as a fresh and positive rather than matured market in technology [97].
7. Implications
After a broader understanding that derived from Asian regional case studies, the generalised implications are:
- Social value expenditure positively signifies the operating activities of an organisation.
- Efficient machinery and plants in manufacturing activities had positively signified enterprise operation excellence.
- Be it profit, total turnover, or total sales, such returns are an outcome of enterprise operational excellence practices cultivated over time through experience and R&D practices. Hence, both workforce (SVE) and investing activities (plant and machinery) are visible as both sides of a single coin to achieve enterprise sustainable operational excellence.
Enterprise financing activities shows moderate observation as credit and loans need to be considered in enterprise cash flow activities.
7.1. Sustainability Implications from Asian Case Studies
Based on the case organisations sustainability practices and their effort in sustainability principles, the following sustainability implications are:
- Environmentally friendly products and services (Operating activities) provide a competitive advantage.
- Incorporating sustainability in employee training (Social Value Expenditure) will increase the organisation internal knowledge.
- Customer connectivity (Social Value Expenditure) through network communications will improve the sustainable operation chances.
7.2. Managerial Implications
Globalisation is a period of both challenges and opportunities. As a proverbial English story of an ant and grasshopper explains the importance of climate and effort, Europe underwent an industrialisation era in the 16th century that is the involved metaphor. Similarly, globalisation is one of such inevitable events. Hence, when a situation requires more effort, a positive perk for the workforce must facilitate firms’ production activities. The government focuses on supportive measures such as providing water, electricity, and infrastructure facilities to the MNC’s and domestic enterprises. On the other hand, service is expected to the respective regional people and regional economic development. Structured government and well-informed consumers attract investment activities that significantly affect operational activities in Asian regional case studies. Hence, careful framing of planning and strategic directions are essential in sustainable business practices.
8. Discussion
Does sustainable operational excellence depend on the firm’s manufacturing decisions or strategic decisions? What leads to enterprise sustainable operational excellence? Such questions had comprehended sustainability issues about decision making. However, there is limited evidence that the strategic decision-making process influences decision effectiveness; the same way, the link between strategic decision process and efficacy has not been convincingly demonstrated [98,99]. Some of the most fundamental decisions are made by top management through a strategic decision-making process; managers need to be keenly aware of assumptions, heuristics, and biases in decision making [100].
Business success, turnover, and pitfalls in profit-making are intensely related to board capital decision making and the planning process. Board capitals generally follow few important thumb rules in decision making; otherwise, they are visibly flexible and listening towards constructive criticism. They are concerned with manufacturing, business operations, and channel enhancement, mostly towards existing macroeconomic circumstances in domestic and international markets. Local government tax policies, land utilisation policies, and workforce policies are considered in the decision-making process. When the turnover lies in billion dollars and the enterprise is actively involving itself in technology integration, board capital expects that may provide leverage in the existing competitive market, it is crucial in the discussion. Under those circumstances, it is always suggestible to rely on past experiences, past knowledge sources and local knowledge. In terms of planning and decisions, it is obligatory to rely on data and its inference results.
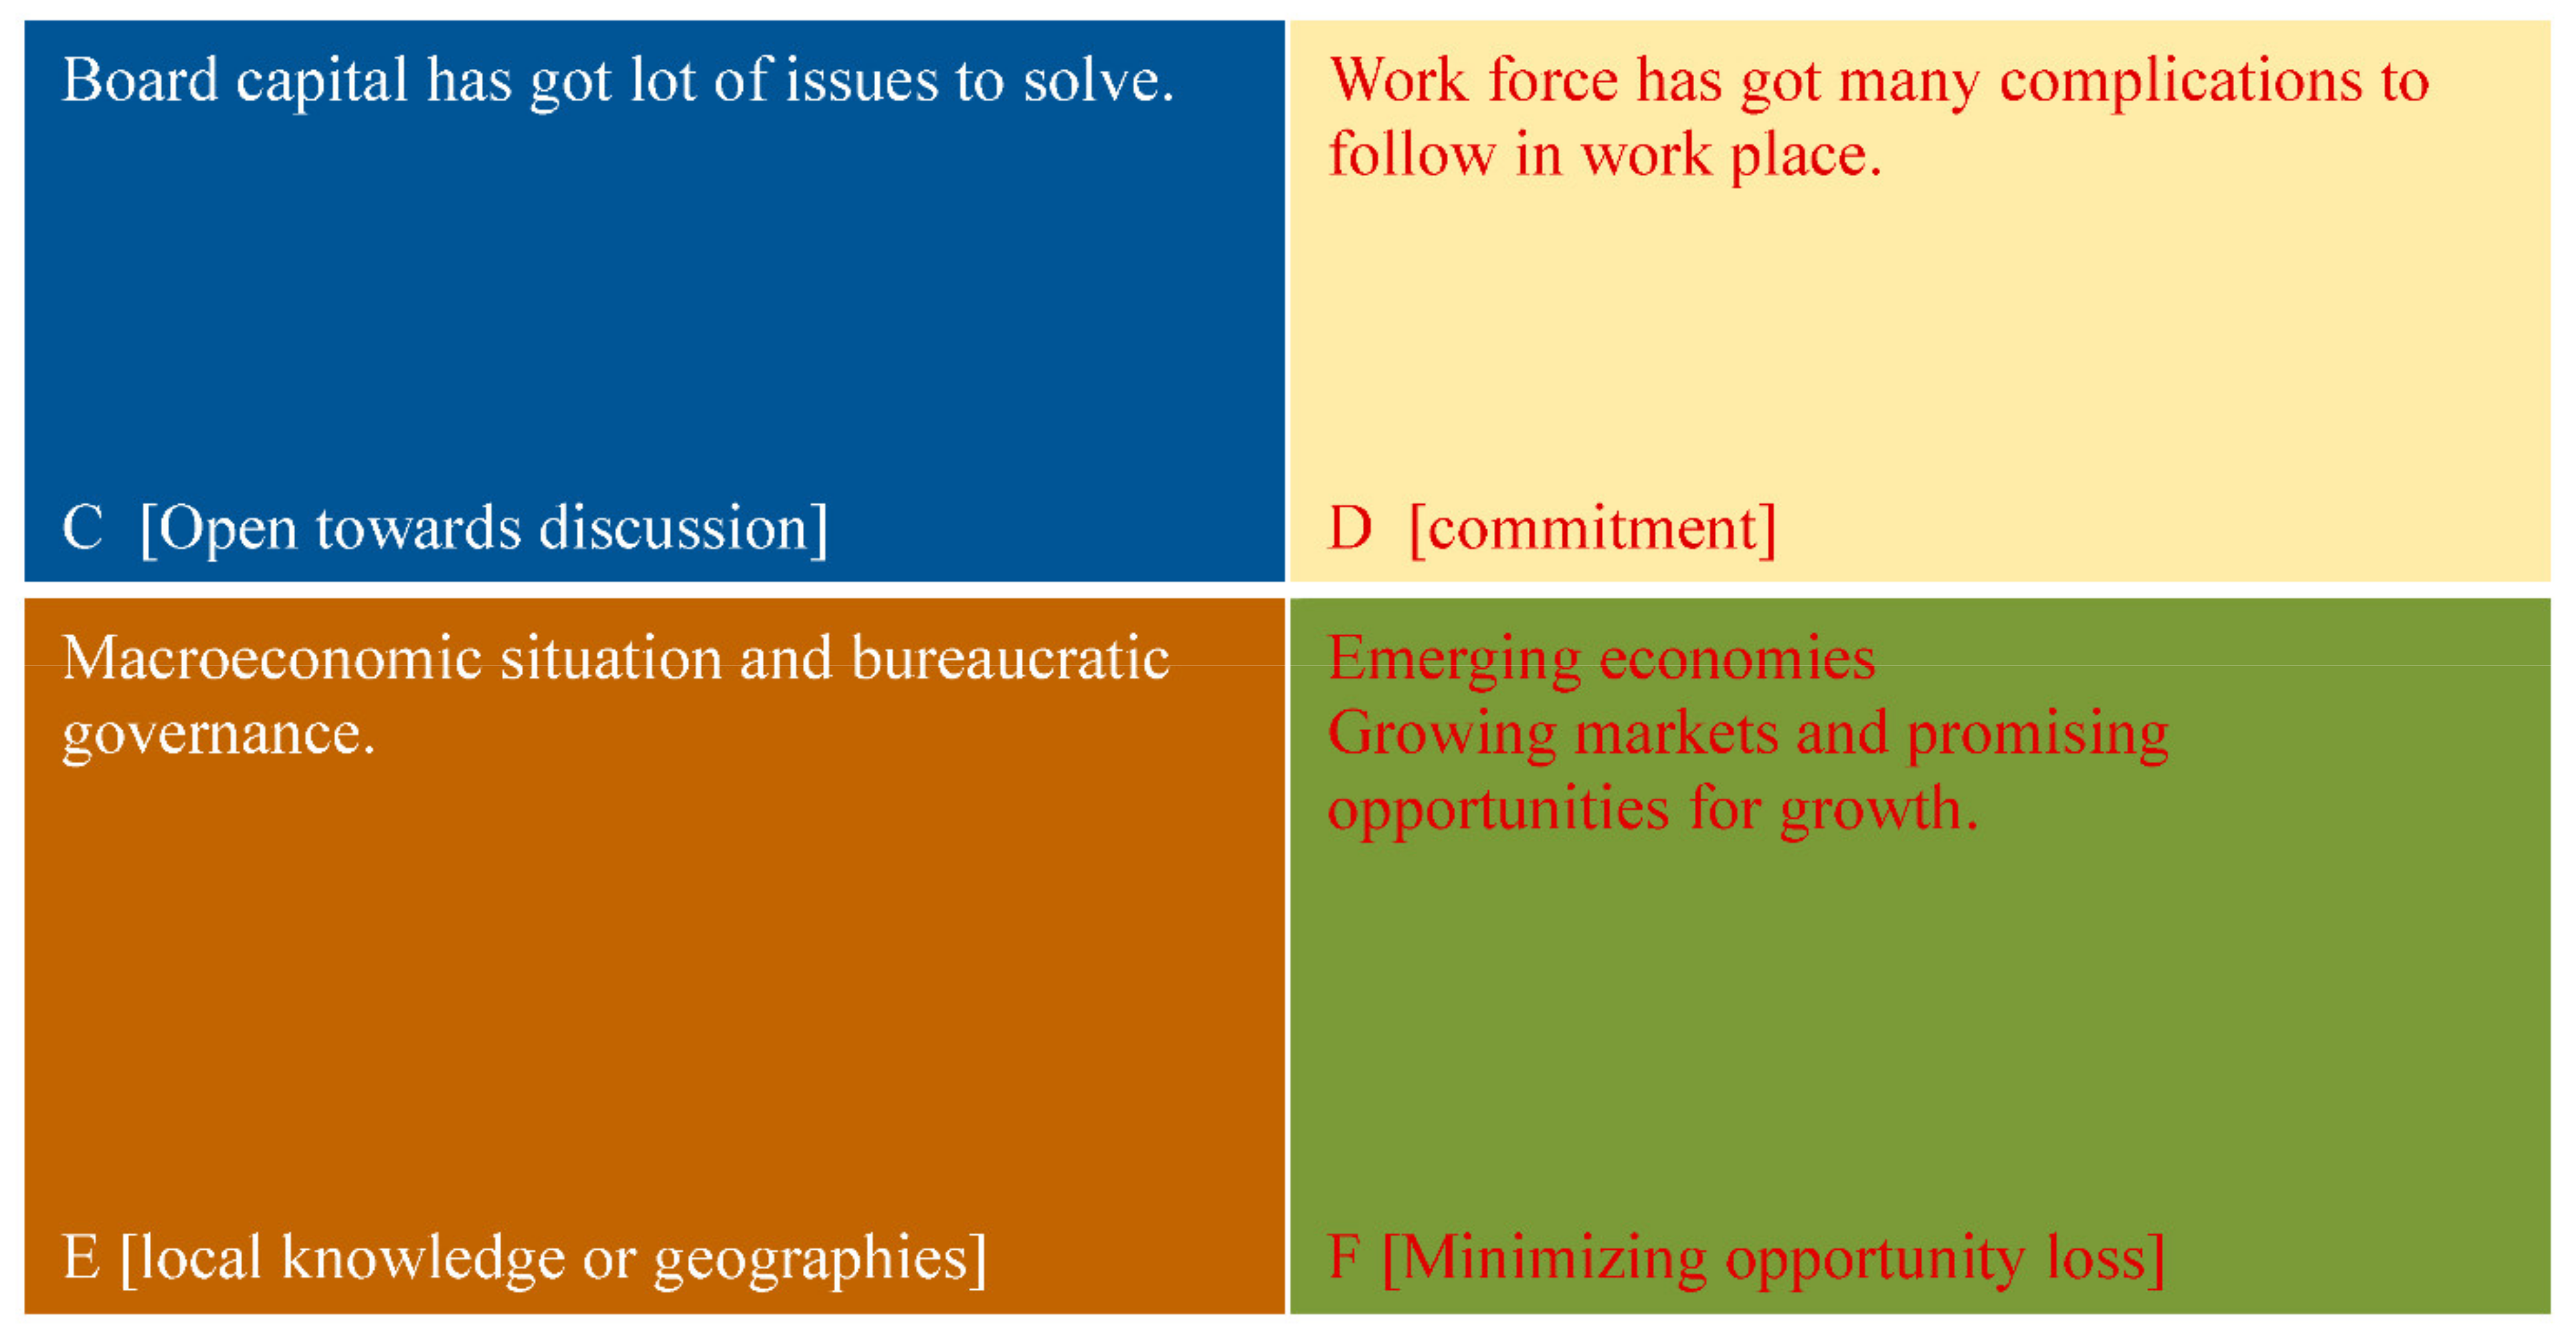
There are no established rules in strategic process or strategic decision making. It is an instrument that facilitates and conveniently drives towards the established target or goal set ahead of a particular department or planning team. Business is all about profit-making both for enterprise and shareholders and equity holders. The rest of the intangible aspects follows the firm positive performance. It is obvious in the balance sheet of any enterprise that says if at all other expenditures exist that can calculate otherwise, it remains mute. Therefore, manufacturing decisions strengthened by strategic decisions through managerial actions are considered a core value in strategic decision making. The study developed the Paux strategy framework to explain this complex phenomenon and show how four elements accumulate together in a strategic planning process, as shown in Figure 10.
One frame accepts that board capitals have problems or issues to discuss; similarly, the workforce is obliged to accept new changes in practices and training. For both board capital and workforce macro-economic situation remain the same. However, managerial tactics and skills are used to resolve the problem and reduce opportunity loss through strategic choices and decisions.
In this framework, there is a potential to stimulate a synergic and converging effort to address health, social and needed green transition [101]. Environmental concerns, recurring oil crises and market weaknesses, combined with the availability of power from natural resources and resulting possibilities for job creation and energy independence, have all pushed developed and developing countries towards new energy strategies [102]. The application of multi-criteria analysis can support this initiative, in which a panel of experts can determine the weight. The importance of providing a quantitative study that aims to reduce subjectivity during policy choices and increase models of reflexive governance is evident [103,104]. Asset creation, market regulation, and developing a sound labour market will further increase sustainability and resilience through capability enhancement for domestic and MNC’s in the Asian region.
9. Relationship with Conceptual Framework
Many firms incorporate the concept of sustainability and sustainable business practices into their group strategy. The board capital started to view sustainability as an integrated part of their business practices. Some firms even designed sustainability committees to evaluate their practices. From the employee perspective, their human rights, safety and training program are covered in this framework. The governance aspect is once again directly related to the group strategy of sustainable enterprise. Macroeconomic situation and regional economics are defined.
10. Concluding Remarks
The study aimed to focus on the Asian region through multiple case study research methods. Two aspects are concerned, such as operational complexities and their strategic overview. Some of the research notions are that despite being rich in cultural and social values, the Asian region remains a developing region. The role of business is identified as an influential factor in uplifting regional development with a promising domestic market and investment opportunities. Hence, the managerial discussion and governance need scholarly attention.
To generalise any findings or conclusion, the point of observation in the empirical study has to be significant. Such observations provide a clearer picture of the study. Since TISM (total interpretive structural modelling) is one of those of kind methods, the study has incorporated the TISM method for model building. Similarly, for empirical research, panel data analysis is applied, which shows SVE (social value expenditure) positively and significantly contributes to operational activities. Such an observation shows that sustainable business practices enhance firms’ commitment towards sustainability values. The employee benefit expenses contribute towards a healthy and well-informed workforce. The tax expenses offer organisations social obligations, respect for the constitution, and follow the rule of law. The administrative expenses enhance the working atmosphere and conducive working culture that further improve firms’ productivity.
Observations from the Pareto chart show that leading firms are significantly investing in social value expenditure and histogram analysis shows as the social value expenditure increases; operational activities show an increasing trend. The observations are made from the secondary data available in their respective annual reports. Although this is a preliminary attempt to study Asian regional firms using an index, there can be many other significant factors such as geography, political environment, domestic governance regulations, and bureaucratic pressures. However, business activities have to be carried out for any successful enterprise.
Various firms with multiple foci on strategy and operational practices; some want to expand their market share, some want to regain their traditional positions, another set of firms want to bring out cost reduction in new products. Airline industries focus mainly on customer satisfaction and customer connectivity and training and development in front office management; all these discrete approaches in operational excellence practising by multiple sectors show diversification in modes of operation and board capital expectations. Because investing, expenditures, and manufacturing are directly concerned with board capitals. What kind of technology innovation is expected by the workforce? The purchasing capacity of an enterprise, increasing pension allowances and cutting other expenses related to operational decisions. Hence, sustainable operational excellence is interwoven with organisation cash flows and investing priorities on par with derived strategic decisions.
The study is confined to the Asian region and the chosen case studies committed to sustainable developmental values. Although social value expenditure (SVE) is catered for in this study, how much is invested in value creation? Other expenses have to explain whether those expenses are socially inclined or administrative related. The annual reports repeat the context with changes in the numerical figures of every year: the cross-sectional analysis and regional comparative study of similar firms or similar sectors. What remains a row between decision making and implementation of inboard capital while discussing sustainable business operational practices is the future scope of the study.
Author Contributions
S., Investigation and supervision; P.A., conceptualization and Methodology. Both authors have read and agreed to the published version of the manuscript.
Funding
This research received no external funding.
Institutional Review Board Statement
Not Applicable.
Informed Consent Statement
Not Applicable.
Data Availability Statement
Data are collected from the financial statements of the annual reports of respective firms for the particular study time frame. The links are provided in the Appendix.
Conflicts of Interest
The authors declare no conflict of interest.
Appendix A

Table A1.
Shows the chosen variables for the study. (In million USD).
| Operating Activities | Investing Activities | Financing Activities | Social Value Expenditure | Firm_id | Year |
|---|---|---|---|---|---|
| 196.72 | 389.9 | 159.38 | 1767.23 | 1 | 2017 |
| 334.1 | 416.66 | 10.13 | 1600.37 | 1 | 2016 |
| 364.92 | 85.69 | 374.73 | 1712.83 | 1 | 2015 |
| 350.8 | 363.53 | 716.81 | 10,066.09 | 1 | 2014 |
| 321.6 | 141.19 | 576.11 | 8020.3 | 1 | 2013 |
| 39,699.92 | 24,848.18 | 7263.36 | 63,716.792 | 2 | 2017 |
| 33,563.93 | 22,761.3 | 5507.32 | 54,145.441 | 2 | 2016 |
| 30,978.16 | 27,485.36 | 2561.26 | 54,258.115 | 2 | 2015 |
| 39,131.35 | 37,489.25 | 3466 | 56,656.721 | 2 | 2014 |
| 31,813.96 | 26,241.72 | 1562.51 | 60,376.108 | 2 | 2013 |
| 12,139.45 | 12,522.62 | 2914.34 | 15,052.82 | 3 | 2017 |
| 8426.55 | 11,174.16 | 4823.21 | 15,724.2 | 3 | 2016 |
| 6297.07 | 9290.21 | 2235.19 | 15,064.98 | 3 | 2015 |
| 6618.64 | 9820.98 | 3608.05 | 12,966.63 | 3 | 2014 |
| 3553.25 | 8700.38 | 4141.65 | 10,366.84 | 3 | 2013 |
| 538.57 | 432.59 | 199.53 | 1052.14 | 4 | 2017 |
| 441.31 | 188.85 | 173.72 | 823.42 | 4 | 2016 |
| 339.47 | 133.93 | 186.28 | 664.58 | 4 | 2015 |
| 227.2 | 414.92 | 182.96 | 484.68 | 4 | 2014 |
| 247.96 | 269.09 | 5.14 | 390.18 | 4 | 2013 |
| 5205 | 1603 | 6716 | 9650.13 | 5 | 2017 |
| 6251 | 4499 | 3255 | 9913.4 | 5 | 2016 |
| 6652 | 1290 | 2544 | 10,991.19 | 5 | 2015 |
| 3705 | 2917 | 1154 | 10,563.27 | 5 | 2014 |
| 4291 | 8005 | 4273 | 8174.52 | 5 | 2013 |
| 13,941.96 | 3568.41 | 2451.01 | 14,760.85 | 6 | 2017 |
| 7122.94 | 4128.06 | 1570.38 | 14,074.12 | 6 | 2016 |
| 7136.97 | 324.76 | 2860.14 | 10,292.64 | 6 | 2015 |
| 6042.87 | 3793.02 | 1505.98 | 7836.09 | 6 | 2014 |
| 3264.06 | 1163.13 | 1031.29 | 6812.81 | 6 | 2013 |
| 386.372 | 936.594 | 917.723 | 2917.874 | 7 | 2017 |
| 1123.61 | 810.723 | 271.594 | 3052.674 | 7 | 2016 |
| 2232.126 | 1312.999 | 1593.744 | 2984.032 | 7 | 2015 |
| 1973.343 | 1228.279 | 1281.248 | 2848.142 | 7 | 2014 |
| 2161.055 | 1432.14 | 527.311 | 2776.031 | 7 | 2013 |
| 5368.16 | 1499.94 | 3094.82 | 15,954.8 | 8 | 2017 |
| 4547.57 | 7609.47 | 3233.24 | 13,857.67 | 8 | 2016 |
| 4315.24 | 4123.4 | 1910.74 | 15,372.92 | 8 | 2015 |
| 5307.9 | 2447.92 | 2735.05 | 14,653.34 | 8 | 2014 |
| 4614.47 | 2274.43 | 2019.63 | 14,230 | 8 | 2013 |
| 2890.92 | 3519.96 | 456 | 1782.22 | 9 | 2017 |
| 2065.3 | 2623.39 | 631.74 | 1374.87 | 9 | 2016 |
| 2027.02 | 2073.71 | 267.44 | 1277.85 | 9 | 2015 |
| 2240.26 | 1990.71 | 471.2 | 1627.54 | 9 | 2014 |
| 2206.51 | 1996.01 | 107.14 | 1654.64 | 9 | 2013 |
| 5722.9 | 3072.01 | 1904.68 | 17,553.41 | 10 | 2017 |
| 7383.13 | 6642.96 | 240.59 | 18,946.04 | 10 | 2016 |
| 2788.6 | 5001.13 | 2080.16 | 18,686.07 | 10 | 2015 |
| 3994.2 | 4466.49 | 299.68 | 20,217.44 | 10 | 2014 |
| 5304.09 | 5030.92 | 1640.25 | 18,207.64 | 10 | 2013 |
| 2532.9 | 2943.5 | 224.6 | 14,322.4 | 11 | 2017 |
| 3005.5 | 2699.7 | 1321.4 | 14,678.1 | 11 | 2016 |
| 2067.2 | 1605.2 | 137.1 | 15,192.3 | 11 | 2015 |
| 2098.1 | 1822.7 | 435.8 | 15,041.1 | 11 | 2014 |
| 1854.4 | 1146.2 | 338.6 | 14,909.4 | 11 | 2013 |
| 887.84 | 1387.01 | 502.26 | 3307.26 | 12 | 2017 |
| 459.8 | 588.4 | 1066.36 | 2568.65 | 12 | 2016 |
| 95.25 | 777.87 | 1123.64 | 111.83 | 12 | 2015 |
| 149.13 | 172.92 | 71.78 | 1200.98 | 12 | 2014 |
| 209.65 | 93.52 | 472.23 | 1075.44 | 12 | 2013 |
(Source: Annual report of the respective 12 firms) Note: Firm id: 1-Tata motors; 2-Samsung; 3-Nissan; 4-Indigo; 5-Mitshubishi; 6-Huawei; 7-Wilmar; 8-Canon; 9-NTPC; 10-Hitachi; 11-singapore Airlines; 12-L&T).
Table A2.
Social value expenditure.
| Administrative Expenses/Employee Benefit Expenses (X) | Other Expenses/Non-operating Expenses/Doubtful Receivables (Y) | Income Tax/Tax Expenses (Z) | Social Value Expenditure (Sum of XYZ) | Social Value Expenditure (In USD Millions) | Firm_id | Year |
|---|---|---|---|---|---|---|
| 3558.52 | 8697.42 | 59.22 | 12,315.16 | 1767.23 | 1 | 2017 |
| 3026.75 | 8041.81 | 83.84 | 11,152.4 | 1600.37 | 1 | 2016 |
| 3091.46 | 8080.39 | 764.23 | 11,936.08 | 1712.83 | 1 | 2015 |
| 21,556.42 | 43,825.77 | 4764.79 | 70,146.98 | 10,066.09 | 1 | 2014 |
| 16,584.05 | 35,535.58 | 3770.99 | 55,890.62 | 8020.30 | 1 | 2013 |
| 50,075,918 | 1,255,130 | 12,385,744 | 63,716,792 | 63,716.792 | 2 | 2017 |
| 45,134,348 | 2,124,281 | 6,886,812 | 54,145,441 | 54,145.441 | 2 | 2016 |
| 44,866,898 | 3,291,288 | 6,099,929 | 54,258,115 | 54,258.115 | 2 | 2015 |
| 50,253,744 | 2,146,611 | 4,256,366 | 56,656,721 | 56,656.721 | 2 | 2014 |
| 51,370,553 | 1,529,468 | 7,476,087 | 60,376,108 | 60,376.108 | 2 | 2013 |
| 1,555,262 | 105,290 | - | 1,660,552 | 15,052.82 | 3 | 2017 |
| 1,599,243 | 135,372 | - | 1,734,615 | 15,724.20 | 3 | 2016 |
| 1,544,305 | 117,588 | - | 1,661,893 | 15,064.98 | 3 | 2015 |
| 1,348,092 | 82,322 | - | 1,430,414 | 12,966.63 | 3 | 2014 |
| 1,083,372 | 60,246 | - | 1,143,618 | 10,366.84 | 3 | 2013 |
| 20,481.90 | 47,986.24 | 4851.52 | 73,319.66 | 1052.14 | 4 | 2017 |
| 17,899.23 | 38,393.71 | 1088.37 | 57,381.31 | 823.42 | 4 | 2016 |
| 11,886.91 | 30,876.97 | 3548.59 | 46,312.47 | 664.58 | 4 | 2015 |
| 9289.40 | 24,480.46 | 5.61 | 33,775.47 | 484.68 | 4 | 2014 |
| 6971.33 | 19,015.34 | 1202.25 | 27,189.92 | 390.18 | 4 | 2013 |
| 932,607 | 10,581 | 121,366 | 1064,554 | 9650.13 | 5 | 2017 |
| 1,015,968 | 37,787 | 39,841 | 1093,596 | 9913.40 | 5 | 2016 |
| 998,751 | 45,411 | 168,331 | 1,212,493 | 10,991.19 | 5 | 2015 |
| 952,898 | 66,794 | 145,595 | 1,165,287 | 10,563.27 | 5 | 2014 |
| 889,955 | 5827 | 5990 | 901,772 | 8174.52 | 5 | 2013 |
| 92,681 | 573 | 8673 | 101,927 | 14,760.85 | 6 | 2017 |
| 86,442 | 3737 | 7006 | 97,185 | 14,074.12 | 6 | 2016 |
| 62,281 | 3715 | 5077 | 71,073 | 10,292.64 | 6 | 2015 |
| 47,468 | 1455 | 5187 | 54,110, | 7836.09 | 6 | 2014 |
| 38,943 | 3942 | 4159 | 47,044, | 6812.81 | 6 | 2013 |
| 699,678+1,814,478 | 112,842 | 290,876 | 2,917,874 | 2917.874 | 7 | 2017 |
| 680,675+1,806,434 | 359,271 | 206,294 | 3,052,674 | 3052.674 | 7 | 2016 |
| 696,461+1,677,771 | 315,756 | 294,044 | 2,984,032 | 2984.032 | 7 | 2015 |
| 673,816+1,668,882 | 191,770 | 313,674 | 2,848,142 | 2848.142 | 7 | 2014 |
| 681,313+1,619,993 | 90,032 | 384,693 | 2,776,031 | 2776.031 | 7 | 2013 |
| 1,661,212 | 98,024, | 818 | 1,760,054 | 15,954.80 | 8 | 2017 |
| 1,444,967 | 82,681, | 1061 | 1,528,709 | 1,3857.67 | 8 | 2016 |
| 1,579,174 | 116,105 | 584 | 1,695,863 | 15,372.92 | 8 | 2015 |
| 1,497,983 | 118,000 | 500 | 1,616,483 | 14,653.34 | 8 | 2014 |
| 1,461,144 | 108,088 | 550 | 1,569,782 | 14,230.00 | 8 | 2013 |
| 4324.60 | 5092.38 | 3002.64 | 12,419.62 | 1782.22 | 9 | 2017 |
| 3609.32 | 5787.39 | 184.24 | 9580.95 | 1374.87 | 9 | 2016 |
| 3669.78 | 4979.31 | 255.79 | 8904.88 | 1277.85 | 9 | 2015 |
| 3867.99 | 4543.85 | 2929.91 | 11,341.75 | 1627.54 | 9 | 2014 |
| 3360.12 | 4211.22 | 3959.24 | 11,530.58 | 1654.64 | 9 | 2013 |
| 1,792,278 | 19,014 | 125,112 | 1,936,404 | 17,553.41 | 10 | 2017 |
| 1,940,363 | 27,594 | 122,075 | 2,090,032 | 18,946.04 | 10 | 2016 |
| 1,887,901 | 26,913 | 146,540 | 2,061,354 | 18,686.07 | 10 | 2015 |
| 2,000,028 | 26,107 | 204,152 | 2,230,287 | 20,217.44 | 10 | 2014 |
| 1,875,052 | 26,707 | 106,816 | 2,008,575 | 18,207.64 | 10 | 2013 |
| 14,245.7 | - | 76.7 | 14,322.4 | 14,322.4 | 11 | 2017 |
| 14,557.5 | - | 120.6 | 14,678.1 | 14,678.1 | 11 | 2016 |
| 15,156.1 | - | 36.2 | 15,192.3 | 15,192.3 | 11 | 2015 |
| 14,984.6 | - | 56.5 | 15,041.1 | 15,041.1 | 11 | 2014 |
| 14,869.0 | - | 40.4 | 14,909.4 | 14,909.4 | 11 | 2013 |
| 7045.50 | 13,853.07 | 2148.55 | 23,047.12 | 3307.26 | 12 | 2017 |
| 6146.68 | 9204.84 | 2548.48 | 17,900 | 2568.65 | 12 | 2016 |
| 1997.11 | 4150.84 | 1645.04 | 7792.99 | 111.83 | 12 | 2015 |
| 1932.03 | 4662.37 | 1774.78 | 8369.18 | 1200.98 | 12 | 2014 |
| 2085.66 | 3860.93 | 1547.80 | 7494.39 | 1075.44 | 12 | 2013 |
(Source: Profit loss statement /income statement from the balance sheet of 12 firms).
Data Source
Tata Motors Annual Report. (2018). https://www.tatamotors.com/wp-content/uploads/2018/07/12115930/Annual-Report-2017-2018.pdf Retrieved on 18 November 2019
Singapore Airlines Annual Report. (2018). https://www.singaporeair.com/saar5/pdf/Investor-Relations/Annual-Report/annualreport1819.pdf Retrieved on 18 November 2019
Samsung Annual Report. (2018). https://images.samsung.com/is/content/samsung/p5/global/ir/docs/2018_Business_Report_vF.pdf Retrieved on 18 November 2019
Nissan Annual Report. 2018. Nissan motor corporation annual report, available online: Nissan https://www.nissan-global.com/EN/IR/LIBRARY/AR/2018/. Retrieved on 11 May 2019.
Indigo Annual Report. (2018). https://www.goindigo.in/content/dam/goindigo/investor-relations/annual-report/2018-19/Annual-Report-and-Notice-InterGlobe-Aviation-Limited-2018-19.pdf Retrieved on 18 November 2019
Huawei Annual Report. (2018). https://www-file.huawei.com/-/media/corporate/pdf/annual-report/annual_report2018_en.pdf?la=en Retrieved on 18 November 2019
Hitachi Annual Report. (2018). https://www.hitachi.com/IR-e/library/integrated/2018/index.html Retrieved on 18 November 2019
Canon Annual Report. (2018). Canon annual report, available online https://global.canon/en/ir/annual/2018/canon-annual-report-2018.pdf. Retrieved on 11 May 2019.
L&T Annual Report. (2018). https://investors.larsentoubro.com/AnnualReports.aspx Retrieved on 18 November 2019
Mitsubishi Annual Report. (2018). https://www.mitsubishicorp.com/jp/en/ir/library/ar/pdf/areport/2018/all.pdf Retrieved on 18 November 2019
NTPC Annual Report. (2018). https://www.ntpc.co.in/en/investors/annual-reports Retrieved on 18 November 2019
Wilmar Annual Report. (2018). https://www.wilmar-international.com/annualreport2018/ Retrieved on 18 November 2019.
References
- Dittmer, L. Globalization and the Asian financial crisis. Asian Perspect. 1999, 23, 45–64. [Google Scholar] [CrossRef]
- Kim, S.Y. Do Asian values exist? Empirical tests of the four dimensions of Asian values. J. East Asian Stud. 2010, 10, 315–344. [Google Scholar] [CrossRef] [Green Version]
- Kausikan, B. Asia’s different standard. Foreign Policy 1993, 92, 24. [Google Scholar] [CrossRef]
- Schmitt, B. The “new wave” in studying Asian markets and consumers. Mark. Lett. 2015, 26, 261–264. [Google Scholar] [CrossRef] [Green Version]
- Cheow, E.T. Strategic relevance of Asian economic integration. Econ. Polit. Wkly. 2005, 40, 3960–3967. [Google Scholar]
- Rana, A. Challenges to strategic stability in south Asia. Strateg. Stud. 2018, 38, 1–20. [Google Scholar]
- He, K.A. Strategic Functional Theory of Institutions and Rethinking Asian Regionalism: When Do Institutions Matter? Asian Surv. 2014, 54, 1184–1208. [Google Scholar] [CrossRef] [Green Version]
- Johnston, T. The Strategic Risks of East Asia’s Slowing Economies. Australian Strategic Policy Institute. August 2017. Available online: https://ethz.ch/content/dam/ethz/special-interest/gess/cis/center-for-securities-studies/resources/docs/ASPI-SI120%20The%20strategic%20risks%20of%20East%20Asias%20slowing%20economies.pdf (accessed on 24 August 2019).
- Biao, X.; Wong, T. SARS: Public Health and Social Science Perspectives. Econ. Polit. Wkly. 2003, 38, 2480–2483. [Google Scholar]
- Lam, W.K.; Zhong, N.S.; Tan, W.C. Overview on SARS in Asia and the World. Respirology 2003, 8, S2–S5. [Google Scholar] [CrossRef] [PubMed]
- Hanna, D.; Huang, Y. The Impact of SARS on Asian Economies. Asian Econ. Pap. 2004, 3, 102–112. [Google Scholar] [CrossRef]
- Chan-Yeung, M.; Seto, W.H.; Sung, J.J.Y. Severe acute respiratory syndrome: Patients were epidemiologically linked. BMJ 2003, 326, 1393. [Google Scholar] [CrossRef] [Green Version]
- Frankenberg, E.; Sikoki, B.; Sumantri, C.; Suriastini, W.; Thomas, D. Education, Vulnerability, And Resilience After a Natural Disaster. Ecol. Soc. J. Integr. Sci. Resil. Sustain. 2013, 18, 16. [Google Scholar] [CrossRef] [PubMed] [Green Version]
- Gaillard, J.-C.; Clavé, E.; Vibert, O.; Azhari, D.; Denain, J.-C.; Efendi, Y.; Grancher, D.; Liamzon, C.C.; Sari, D.R.; Setiawan, R. Ethnic groups’ response to the 26 December 2004 earthquake and tsunami in Aceh, Indonesia. Nat. Hazards 2008, 47, 17–38. [Google Scholar] [CrossRef]
- Kellenberg, D.; Mobarak, A.M. The Economics of Natural Disasters. Annu. Rev. Resour. Econ. 2011, 3, 297–312. [Google Scholar] [CrossRef] [Green Version]
- Low, W.-Y.; Binns, C. Disasters and Public Health Concerns. Asia Pac. J. Public Health 2011, 23, 277–279. [Google Scholar] [CrossRef] [PubMed]
- United Nations ESCAP. Available online: https://www.unescap.org/sites/default/d8files/knowledge-products/APTIT%20FDI.pdf (accessed on 19 August 2021).
- OECD. Available online: https://www.oecd.org/development/asia-challenges.htm (accessed on 19 August 2021).
- ABD. Available online: https://www.adb.org/sites/default/files/publication/674421/asian-economic-integration-report-2021.pdf (accessed on 19 August 2021).
- Claessens, S.; Djankov, S.; Xu, L.C. Corporate Performance in the East Asian Financial Crisis. World Bank Res. Obs. 2000, 15, 23–46. [Google Scholar] [CrossRef] [Green Version]
- Silva, C.A.; Ordeñana, X.; Vera-Gilces, P.; Jiménez, A. Global Imbalances: The Role of Institutions, Financial Development and FDI in the Context of Financial Crises. Sustainability 2021, 13, 356. [Google Scholar] [CrossRef]
- Wisner, J.D.; Fawcett, S.E. Linking Firm Strategy to Operating Decisions Through Performance Measurement. Prod. Inventory Manag. J. 1991, 32, 5. [Google Scholar]
- Sørensen, J.B. The Strength of Corporate Culture and the Reliability of Firm Performance. Adm. Sci. Q. 2002, 47, 70. [Google Scholar] [CrossRef] [Green Version]
- Knack, S.; Keefer, P. Does Social Capital Have an Economic Payoff? A Cross-Country Investigation. Q. J. Econ. 1997, 112, 1251–1288. [Google Scholar] [CrossRef]
- Larsen, M.M.; Manning, S.; Pedersen, T. The ambivalent effect of complexity on firm performance: A study of the global service provider industry. Long Range Plan. 2019, 52, 221–235. [Google Scholar] [CrossRef]
- Momaya, K.S.; Bhat, S.; Lalwani, L. Institutional Growth and Industrial Competitiveness: Exploring the Role of Strategic Flexibility Taking the Case of Select Institutes in India. Glob. J. Flex. Syst. Manag. 2017, 18, 111–122. [Google Scholar] [CrossRef]
- Bhattacharya, S.; Momaya, K.S.; Iyer, K.C. Strategic Change for Growth: A Case of Construction Company in India. Glob. J. Flex. Syst. Manag. 2012, 13, 195–205. [Google Scholar] [CrossRef]
- Dosi, G.; Faillo, M.; Marengo, L. Organizational Capabilities, Patterns of Knowledge Accumulation and Governance Structures in Business Firms: An Introduction. Organ. Stud. 2008, 29, 1165–1185. [Google Scholar] [CrossRef] [Green Version]
- Calori, R. Essai: Philosophizing on Strategic Management Models. Organ. Stud. 1998, 19, 281–306. [Google Scholar] [CrossRef]
- Van de Ven, A.H.; Rogers, R.W.; Bechara, J.P.; Sun, K. Organizational diversity, integration and performance. J. Organ. Behav. 2008, 29, 335–354. [Google Scholar] [CrossRef]
- Yström, A.; Agogué, M.; Rampa, R. Preparing an Organization for Sustainability Transitions—The Making of Boundary Spanners through Design Training. Sustainability 2021, 13, 8073. [Google Scholar] [CrossRef]
- Mueller, G.C.; Mone, M.A.; Barker, V.L. Formal Strategic Analyses and Organizational Performance: Decomposing the Rational Model. Organ. Stud. 2007, 28, 853–883. [Google Scholar] [CrossRef]
- Luo, Y.; Tan, J.J.; Shenkar, O. Strategic Responses to Competitive Pressure: The Case of Township and Village Enterprises in China. Asia Pac. J. Manag. 1998, 15, 33–50. [Google Scholar] [CrossRef]
- Colpan, A.M. Are strategy-performance relationships contingent on macroeconomic environments? Evidence from Japan’s textile industry. Asia Pac. J. Manag. 2007, 25, 635–665. [Google Scholar] [CrossRef]
- Damanpour, F.; Devece, C.; Chen, C.C.; Pothukuchi, V. Organizational culture and partner interaction in the management of international joint ventures in India. Asia Pac. J. Manag. 2010, 29, 453–478. [Google Scholar] [CrossRef] [Green Version]
- Abdallah, C.; Langley, A. The Double Edge of Ambiguity in Strategic Planning. J. Manag. Stud. 2013, 51, 235–264. [Google Scholar] [CrossRef]
- Lasserre, P. Corporate strategic management and the overseas Chinese groups. Asia Pac. J. Manag. 1988, 5, 115–131. [Google Scholar] [CrossRef]
- Martin, R.; Sunley, P. On the notion of regional economic resilience: Conceptualization and explanation. J. Econ. Geogr. 2014, 15, 1–42. [Google Scholar] [CrossRef] [Green Version]
- Lele, S. Resilience, sustainability environmentalism. Environ. Dev. Econ. 1998, 3, 221–262. [Google Scholar] [CrossRef]
- Khan, M.; Pervez, A.; Modibbo, U.; Chauhan, J.; Ali, I. Flexible Fuzzy Goal Programming Approach in Optimal Mix of Power Generation for Socio-Economic Sustainability: A Case Study. Sustainability 2021, 13, 8256. [Google Scholar] [CrossRef]
- Martin, R. Regional economic resilience, hysteresis and recessionary shocks. J. Econ. Geogr. 2012, 12, 1–32. [Google Scholar] [CrossRef]
- Jones, L.; Constas, M.A.; Matthews, N.; Verkaart, S. Advancing resilience measurement. Nat. Sustain. 2021, 4, 288–289. [Google Scholar] [CrossRef]
- D’Adamo, I.; Lupi, G. Sustainability and resilience after COVID-19: A circular premium in the fashion industry. Sustainability 2021, 13, 1861. [Google Scholar] [CrossRef]
- Myrdal, G. What is development? J. Econ. Issues 1974, 8, 729–736. [Google Scholar] [CrossRef]
- Preston, P.W. Development Theory: An Introduction; Blackwell Publishers Ltd.: Oxford, UK, 1999; pp. 169–173. [Google Scholar]
- Gordon, R.A. Rigor and relevance in a changing institutional setting. Am. Econ. Rev. 1976, 66, 1–14. [Google Scholar]
- Sushil. SAP-LAP Framework. Glob. J. Flex. Syst. Manag. 2001, 2, 51–55. [Google Scholar]
- Streeten, P. Unbalanced growth. Oxf. Econ. Pap. 1959, 11, 167–190. [Google Scholar] [CrossRef]
- Gerring, J.; Ziblatt, D.; Van Gorp, J.; Arevalo, J. An institutional theory of direct and indirect rule. World Polit. 2011, 63, 377–433. [Google Scholar] [CrossRef]
- McClintock, C.C.; Brannon, D.; Maynard-Moody, S. Applying the logic of sample surveys to qualitative case studies: The case cluster method. Adm. Sci. Q. 1979, 24, 612. [Google Scholar] [CrossRef]
- Lowi, T.J. American business, public policy, case-studies, and political theory. World Polit. 1964, 16, 677–715. [Google Scholar] [CrossRef]
- Rowley, J. Using case studies in research. Manag. Res. News 2002, 25, 16–27. [Google Scholar] [CrossRef]
- Welch, C.; Piekkari, R.; Plakoyiannaki, E.; Paavilainen-Mäntymäki, E. Theorising from case studies: Towards a pluralist future for international business research. J. Int. Bus. Stud. 2010, 42, 740–762. [Google Scholar] [CrossRef]
- Kazdin, A.E. Drawing valid inferences from case studies. J. Consult. Clin. Psychol. 1981, 49, 183. [Google Scholar] [CrossRef]
- Patton, E.; Appelbaum, S.H. The case for case studies in management research. Manag. Res. News 2003, 26, 60–71. [Google Scholar] [CrossRef] [Green Version]
- Siggelkow, N. Persuasion with case studies. Acad. Manag. J. 2007, 50, 20–24. [Google Scholar] [CrossRef]
- Kitchenham, B.; Pickard, L.; Pfleeger, S. Case studies for method and tool evaluation. IEEE Softw. 1995, 12, 52–62. [Google Scholar] [CrossRef] [Green Version]
- Stewart, J. Multiple-case study methods in governance-related research. Public Manag. Rev. 2012, 14, 67–82. [Google Scholar] [CrossRef]
- Kompier, M.A.; Cooper, C.L.; Geurts, S.A. A multiple case study approach to work stress prevention in Europe. Eur. J. Work. Organ. Psychol. 2000, 9, 371–400. [Google Scholar] [CrossRef]
- Bandara, W.; Gable, G.G.; Rosemann, M. Factors and measures of business process modelling: Model building through a multiple case study. Eur. J. Inf. Syst. 2005, 14, 347–360. [Google Scholar] [CrossRef] [Green Version]
- Walsham, G. Doing interpretive research. Eur. J. Inf. Syst. 2006, 15, 320–330. [Google Scholar] [CrossRef]
- Sushil. Interpretive matrix: A tool to aid interpretation of management and social research. Global J. Editor. Flex. Syst. 2005, 6, 27–30. [Google Scholar]
- Sushil. Modified ISM/TISM process with simultaneous transitivity checks for reduced direct pair comparisons. Glob. J. Flex. Syst. Manag. 2017, 18, 331–351. [Google Scholar] [CrossRef]
- Sushil. How to check correctness of total interpretive structural models? Ann. Oper. Res. 2018, 270, 473–487. [Google Scholar] [CrossRef]
- Dhir, S.; Dhir, S. Modeling of strategic thinking enablers: A modified total interpretive structural modeling (TISM) and MICMAC approach. Int. J. Syst. Assur. Eng. Manag. 2020, 11, 175–188. [Google Scholar] [CrossRef]
- Singh, S.; Dhir, S. Modified total interpretive structural modelling of innovation implementation antecedents. Int. J. Prod. Perform. Manag. 2021. [Google Scholar] [CrossRef]
- Agrawal, A. Modified Total Interpretive Structural Model of Corporate Financial Flexibility. Glob. J. Flex. Syst. Manag. 2020, 21, 369–388. [Google Scholar] [CrossRef]
- Rajan, R.; Rana, N.P.; Parameswar, N.; Dhir, S.; Sushil; Dwivedi, Y.K. Developing a modified total interpretive structural model (M-TISM) for organizational strategic cybersecurity management. Technol. Forecast. Soc. Chang. 2021, 170, 120872. [Google Scholar] [CrossRef]
- Consul, P.C.; Jain, G.C. A generalization of the Poisson distribution. Technometrics 1973, 15, 791–799. [Google Scholar] [CrossRef]
- Thorndike, F. Applications of Poisson’s probability summation. Bell Syst. Tech. J. 1926, 5, 604–624. [Google Scholar] [CrossRef]
- Hsiao, C. Panel data analysis—advantages and challenges. Test 2007, 16, 1–22. [Google Scholar] [CrossRef] [Green Version]
- Plümper, T.; Troeger, V.E.; Manow, P. Panel data analysis in comparative politics: Linking method to theory. Eur. J. Polit. Res. 2005, 44, 327–354. [Google Scholar] [CrossRef]
- Woodside, A.G.; Wilson, E.J. Case study research methods for theory building. J. Bus. Ind. Mark. 2003, 18, 493–508. [Google Scholar] [CrossRef]
- Amaratunga, D.; Baldry, D. Case study methodology as a means of theory building: Performance measurement in facilities management organisations. Work. Study 2001, 50, 95–105. [Google Scholar] [CrossRef]
- Stiles, W.B. Theory-building case studies of counselling and psychotherapy. Couns. Psychother. Res. 2007, 7, 122–127. [Google Scholar] [CrossRef]
- Denoon, D.B.H.; Colbert, E. Challenges for the Association of Southeast Asian Nations (ASEAN). Pac. Aff. 1998, 71, 505. [Google Scholar] [CrossRef]
- Hill, H. ASEAN economic development: An analytical survey—The state of the field. J. Asian Stud. 1994, 53, 832–866. [Google Scholar] [CrossRef]
- Raipuria, K. ASEAN and SAARC: Select Futuristic Scenarios. Econ. Polit. Wkly. 2002, 37, 3581–3582. [Google Scholar]
- Bandara, J.S.; Yu, W. How Desirable is the South Asian Free Trade Area? A Quantitative Economic Assessment. World Econ. 2003, 26, 1293–1323. [Google Scholar] [CrossRef] [Green Version]
- Park, J.H. The East Asian Model of Economic Development and Developing Countries. J. Dev. Soc. 2002, 18, 330–353. [Google Scholar] [CrossRef] [Green Version]
- Moghadam, M.R.; Samavati, H.; Dilts, D.A. An Examination of Capital Flight from East Asian Emerging Economies: Paradise Lost. J. Asia-Pac. Bus. 2003, 5, 33–49. [Google Scholar] [CrossRef]
- Kim, J.-I.; Lau, L.J. The Sources of Economic Growth of the East Asian Newly Industrialized Countries. J. Jpn. Int. Econ. 1994, 8, 235–271. [Google Scholar] [CrossRef]
- Canon Annual Report. 2018. Available online: https://global.canon/en/ir/annual/2018/canon-annual-report-2018.pdf (accessed on 11 May 2019).
- Nissan Annual Report. Nissan Motor Corporation Annual Report. 2018. Available online: https://www.nissan-global.com/EN/IR/LIBRARY/AR/2018/ (accessed on 11 May 2019).
- Singapore Airlines Annual Report. Annual Report and Sustainability Report. 2018. Available online: https://www.singaporeair.com/en_UK/us/about-us/information-forinvestors/annual-report/ (accessed on 11 May 2019).
- Moore, J. Channel Strategy. 2021. Available online: https://searchitchannel.techtarget.com/definition/channel-strategy (accessed on 19 August 2021).
- Bappy, M.M.; Ali, S.M.; Kabir, G.; Paul, S.K. Supply chain sustainability assessment with Dempster-Shafer evidence theory: Implications in cleaner production. J. Clean. Prod. 2019, 237, 117771. [Google Scholar] [CrossRef]
- Dulia, E.F.; Ali, S.M.; Garshasbi, M.; Kabir, G. Admitting risks towards circular economy practices and strategies: An empirical test from supply chain perspective. J. Clean. Prod. 2021, 317, 128420. [Google Scholar] [CrossRef]
- Rabbi, M.; Ali, S.M.; Kabir, G.; Mahtab, Z.; Paul, S.K. Green Supply Chain Performance Prediction Using a Bayesian Belief Network. Sustainability 2020, 12, 1101. [Google Scholar] [CrossRef] [Green Version]
- Economic Times. Tata Motors Aims to Provide Skill Training to 40k in 3 Years. 2017. Available online: https://economictimes.indiatimes.com/industry/tata-motors-aims-to-provide-skill-training-to-40k-in-3-years/articleshow/58912005.cms (accessed on 28 May 2019).
- Huawei Annual Report. 2018. Available online: https://www.huawei.com/en/press-events/annual-report (accessed on 11 May 2019).
- Lutters, E.; Van Houten, F.J.; Bernard, A.; Mermoz, E.; Schutte, C.S. Tools and techniques for product design. CIRP Ann. 2014, 63, 607–630. [Google Scholar] [CrossRef]
- Grosfeld-Nir, A.; Ronen, B.; Kozlovsky, N. The Pareto managerial principle: When does it apply? Int. J. Prod. Res. 2007, 45, 2317–2325. [Google Scholar] [CrossRef]
- Radson, D.; Boyd, A.H. The pareto principle and rate analysis. Qual. Eng. 1997, 10, 223–229. [Google Scholar] [CrossRef]
- Yoo, Y.; Kim, K. How Samsung Became a Design Powerhouse. Harv. Bus. Rev. 2015, 93, 73–78. [Google Scholar]
- Lincoln, J.R.; Ahmadjian, C.L.; Mason, E. Organizational Learning and Purchase-Supply Relations in Japan: Hitachi, Matsushita, and Toyota Compared. Calif. Manag. Rev. 1998, 40, 241–264. [Google Scholar] [CrossRef]
- Nonala, I.; Kenney, M. Towards a new theory of innovation management: A case study comparing Canon, Inc. and Apple Computer, Inc. J. Eng. Technol. Manag. 1991, 8, 67–83. [Google Scholar] [CrossRef]
- Dean, J.W., Jr.; Sharfman, M.P. Does Decision Process Matter? A Study of Strategic Decision-Making Effectiveness. Acad. Manag. J. 1996, 39, 368–392. [Google Scholar]
- Ma, H.; Park, S. Relationship between Corporate Sustainability Management and Sustainable Tax Strategies. Sustainability 2021, 13, 7429. [Google Scholar] [CrossRef]
- Das, T.K.; Teng, B.-S. Cognitive Biases and Strategic Decision Processes: An Integrative Perspective. J. Manag. Stud. 1999, 36, 757–778. [Google Scholar] [CrossRef]
- D’Adamo, I.; Gastaldi, M.; Morone, P. The post COVID-19 green recovery in practice: Assessing the profitability of a policy proposal on residential photovoltaic plants. Energy Policy 2020, 147, 111910. [Google Scholar] [CrossRef] [PubMed]
- Cucchiella, F.; D’Adamo, I.; Gastaldi, M. Financial analysis for investment and policy decisions in the renewable energy sector. Clean Technol. Environ. Policy 2015, 17, 887–904. [Google Scholar] [CrossRef]
- D’Adamo, I.; Rosa, P. How Do You See Infrastructure? Green Energy to Provide Economic Growth after COVID. Sustainability 2020, 12, 4738. [Google Scholar] [CrossRef]
- Margherita, E.G.; Braccini, A.M. Industry 4.0 Technologies in flexible manufacturing for sustainable organizational value: Reflections from a multiple case study of italian manufacturers. Inf. Syst. Front. 2020, 1–22. [Google Scholar] [CrossRef]
Figure 1.
Methodology of the study.

Figure 2.
Fluctuations are shown in Poisson distribution from obtained case data. (A) shows the data structure with standard deviation of four factors. (B) shows the data structure with Poisson distribution of four factors.
Figure 2.
Fluctuations are shown in Poisson distribution from obtained case data. (A) shows the data structure with standard deviation of four factors. (B) shows the data structure with Poisson distribution of four factors.

Figure 3.
The successive pairwise comparison of both decision and transitive links of Asian case studies.
Figure 3.
The successive pairwise comparison of both decision and transitive links of Asian case studies.

Figure 4.
Interpretive structural modelling (ISM) of the case studies.

Figure 5.
Total interpretive structural modelling of case studies.

Figure 6.
The bar diagram shows the Asian firms expenditure activities. Source: Author.

Figure 7.
Samsung’s performance with exponential lines. Source: Author.

Figure 8.
Hitachi’s performance with exponential lines. Source: Author.

Figure 9.
Canon’s performance with exponential lines. Source: Author.

Figure 10.
Paux Strategy Framework. Source: Author.

Table 1.
Asian case organisations industries and sustainability values.
| Case Organizations (Country) | Industry | Sustainability Values |
|---|---|---|
| 1. Tata Motors (India) | Automotive | Holistic approach and strategic initiative towards sustainability practices |
| 2. Samsung (South Korea) | Conglomerate | Operating in an ethical manner; certified products with environmental labels |
| 3. Nissan (Japan) | Automotive | Listening to society and solid understanding towards stakeholders |
| 4. Indigo (India) | Airlines | Low cost and customer satisfaction and employment opportunities in small cities are the fundamentals for business |
| 5. Mitsubishi (Japan) | Automotive | Create sustainable corporate value and contributing towards economic development as responsible corporate citizen |
| 6. Huawei (China) | Telecommunications | creating more social values through ICT (information communication technology) by providing scientific solutions |
| 7. Wilmar (Singapore) | Food Processing | Strengthen labour practices and sustainability certification |
| 8. Canon (Japan) | Electronics | A growth strategy based on social and industrial shift; creating new values and solving social issues |
| 9. NTPC (India) | Electric Utility | Sound corporate practices based on openness, soundness and fairness |
| 10. Hitachi (Japan) | Conglomerate | Integrating sustainability into their management and business practices |
| 11. Singapore Airlines (Singapore) | Airline | From farm to plane; supporting local communities and sustainable operation with limited resources |
| 12. L&T (India) | Conglomerate | Creating value in a socially responsible manner through newer technologies focused on customer requirements |
Source: Author.
Table 2.
The obtained factors from the case studies.
| 1-New Synergies for Growth | 2-Business Tie-ups | 3-Price Sensitive Consumers | 4-Technology Integration | 5-Purposeful Design |
| (i) Certified products | (i) Growth strategy; Industrial shift | (i) Low cost | (i) Social values through ICT | (i) Certified products |
| (ii) Sustainable operations | (ii) Corporate value and economic development | (ii) Fairness in approach | (ii) Social responsibility through newer Technologies | (ii) New products and listening to society |
| 6-Customer Connectivity | 7-Channel Enhancement | 8-Functional Training | 9-Opportunity Loss | 10-Urban Infrastructure |
| (i) Low cost | (i) Strategic initiatives | (i) Labour practices | (i) Openness | (i) Supporting local communities |
| (ii) Customer connectivity | (ii) Growth strategy | (ii) Integrating sustainability | (ii) Sound corporate practices | (ii) Creating value |
| (iii) Attending customer needs | (iii) Socially responsible manner |
Source: Author.
Table 3.
Elements of sustainable operational decisions shown from Asian case studies.
| S. No | Firms | Business Strategy and Operating Efficiencies | Opportunities | Planning and Decision | Technology Initiatives | Sustainability |
|---|---|---|---|---|---|---|
| 1 | Tata Motors | New product development | New geographical markets | To meet customer needs, premium markets. Strong engineering capabilities. | Hybrid and connected vehicles. | Sustainable supply chains. |
| 2 | Samsung | New dimensions in designs. High quality products | Business platform in the global market particularly in Europe, Pacific Island and Africa. | Job training and improving healthcare. | Cross-discipline thinking and collective knowledge. | Better global society. |
| 3 | Nissan | Profitable growth. Clear changes in management strategies and directions. | Steady growth (Seven new models per year.) | Revival plan and enhancing the brand | Autonomous drive technologies. | Zero emissions. |
| 4 | Indigo | Moving forward. Selective new routes and destinations. | Strong economic growth along with continued population growth. | Continue to maintain low-cost measures. (CASK) High frequency flights. | Fleet uniformity. Structural cost advantage by overall maintenance and operations. | Women empowerment and child education. |
| 5 | Mitsubishi Motors | Demand recovers enhancing business platform. | Emerging countries market. | Responding to global structural changes by bolstering strength. | Automated manual transmissions and flexible fuel vehicles. | Integrity and fairness, responsibility towards society. |
| 6 | Huawei | Sensible artificial intelligence. Responding to changing needs of people. | A total of 20% people will own more than 10 smart devices; 86% of companies will be using AI. (Artificial Intelligence) | Cutting edge connectivity technologies that work in any scenario. | Integrating new technologies. | Inclusive and sustainable economic growth. |
| 7 | Wilmar | Food and Non-food applications. | Emerging market demand particularly from Indonesia and India. | Reducing energy consumption. | Food technology, oleo chemical research. | No deforestation, no peat and no exploitation policy. |
| 8 | Canon | Wide ranging products. Pursuing new possibilities. | Packaging printing and industrial printing. | New synergies for growth. Total solutions. | Discovering new technologies for future. | Environmentally friendly throughout the product lifecycle. |
| 9 | NTPC | Flexibility in generation of renewable power providing cheaper power. | Increasing self –reliance and diversifying business. | Customer focus. Cleaner power. | Safety in all operations. Reduction in emissions. | Responsible waste dumbing. |
| 10 | Hitachi | Product range diversification channel expansion. | Energy efficient products customer awareness. | Export led growth particularly to UAE, Middle East, Nepal. | Blockchain and other emerging technologies. | Sustainable society |
| 11 | Singapore Airlines | Pilot training and joint ventures. | New fleet modernization network growth and expansion. | Bilateral partnership (Vistara, Nokscoot) | Fuel efficiency and Joint ventures | Inclusive sustainable economic growth. |
| 12 | L&T | International business traction Global growth revival. | Increasing formalization structural reforms. | Enhance return on equity (RoE) | Generating power | Creating sustainable eco-system. |
Source: Author.
Table 4.
Strategic intend of the Asian case study.
| Element No. | Identified Factors | Contextual Relationship | Interpretation |
|---|---|---|---|
| O1 | New synergies for growth | A→B means A will help achieve B | |
| O2 | Business tie-ups | In what way A will help to achieve B | |
| O3 | Price sensitive consumers | ||
| O4 | Technology integration | ||
| O5 | Purposeful design | ||
| O6 | Customer connectivity | ||
| O7 | Channel enhancement | ||
| O8 | Functional training | ||
| O9 | Opportunity loss | ||
| O10 | Urban Infrastructure |
Table 5.
Transitive reachability matrix.
| O1 | O2 | O3 | O4 | O5 | O6 | O7 | O8 | O9 | O10 | |
|---|---|---|---|---|---|---|---|---|---|---|
| O1 | 1 | 1 | 0 | 0 | 0 | 1* | 1 | 0 | 0 | 1 |
| O2 | 1 | 1 | 0 | 0 | 0 | 1 | 1 | 0 | 0 | 1 |
| O3 | 1* | 0 | 1 | 1 | 1 | 1* | 1 | 1 | 1 | 0 |
| O4 | 1 | 1* | 0 | 1 | 0 | 1 | 1* | 0 | 1 | 0 |
| O5 | 1* | 1* | 1 | 1 | 1 | 1 | 1 | 1 | 1* | 1* |
| O6 | 0 | 0 | 0 | 0 | 0 | 1 | 1 | 0 | 0 | 0 |
| O7 | 0 | 0 | 0 | 0 | 0 | 1 | 1 | 0 | 0 | 0 |
| O8 | 1* | 0 | 0 | 1 | 0 | 1* | 1 | 1 | 1 | 0 |
| O9 | 0 | 1 | 0 | 1 | 0 | 1 | 1 | 0 | 1 | 0 |
| O10 | 0 | 0 | 0 | 0 | 0 | 0 | 1 | 0 | 0 | 1 |
1* Transitive links O –Operational factors.
Table 6.
Hierarchical partitioning of the Asian case studies TISM.
| E. No. | Reachability | Antecedent | Intersection | Level |
|---|---|---|---|---|
| O1 | 1,2,6,7,10 | 1,2,3,4,5,8 | 1,2 | |
| O2 | 1,2,6,7,10 | 1,2,4,9 | 1,2 | |
| O3 | 1,3,4,5,6,7,8,9 | 3,5 | 3,5 | |
| O4 | 1,2,4,6,7,9 | 3,4,5,9 | 4,9 | |
| O5 | 1,2,3,4,5,6,7,8,9,10 | 3,5 | 3,5 | |
| O6 | 6,7 | 1,2,3,4,5,6,7,8,9 | 6,7 | I |
| O7 | 6,7 | 1,2,3,4,5,6,7,8,9,10 | 6,7 | I |
| O8 | 1,4,6,7,8,9 | 3,5,8 | 8 | |
| O9 | 2,4,6,7,9 | 3,4,9 | 4,9 | |
| O10 | 7,10 | 1,2,10 | 10 | |
| O1 | 1,2,10 | 1,2,3,4,5,8 | 1,2 | |
| O2 | 1,2,10 | 1,2,4,9 | 1,2 | |
| O3 | 1,3,4,5,8,9 | 3,5 | 3,5 | |
| O4 | 1,2,4,9 | 3,4,5,9 | 4,9 | |
| O5 | 1,2,3,4,5,8,9,10 | 3,4,5,9 | 4,9 | |
| O8 | 1,4,8,9 | 3,5,8 | 8 | |
| O9 | 2,4,9 | 3,4,8,9 | 4,9 | |
| O10 | 10 | 10 | 10 | II |
| O1 | 1,2 | 1,2,3,4,5,8 | 1,2 | III |
| O2 | 1,2 | 1,2,4,9 | 1,2 | III |
| O3 | 1,3,4,5,8,9 | 3,5 | 3,5 | |
| O4 | 1,2,4,9 | 3,4,5,9 | 4,9 | |
| O5 | 1,2,3,4,5,8,9 | 3,5 | 3,5 | |
| O8 | 1,4,8,9 | 3,5,8 | 8 | |
| O9 | 2,4,9 | 3,4,8,9 | 4,9 | |
| O3 | 3,4,5,8,9 | 3,5 | 3,5 | |
| O4 | 4,9 | 3,4,5,9 | 4,9 | IV |
| O5 | 3,4,5,8,9 | 3,5 | 3,5 | |
| O8 | 4,8,9 | 3,5,8 | 8 | |
| O9 | 4,9 | 3,4,8,9 | 4,9 | IV |
| O3 | 3,5,8 | 3,5 | 3,5 | |
| O5 | 3,5,8 | 3,5 | 3,5 | |
| O8 | 8 | 3,5,8 | 8 | V |
| O3 | 3,5 | 3,5 | 3,5 | VI |
| O5 | 3,5 | 3,5 | 3,5 | VI |
Note: The bold ones are level partitioning.
Table 7.
Decision links obtained from Asian case studies.
| S. No | Element No. | Paired Comparison of Reachability Links | Case Organizations |
|---|---|---|---|
| 1 | O1-O2 | Under the philosophy of Kyosei (Excellent global corporation plan) company emphasis on financial health and business reforms. | Canon |
| 2 | O1-O7 | Expanding business operation through diversification; -The sales and profit grew steadily each year. | Canon |
| 3 | O1-O10 | Canon institute for global studies draws strategic policies for 3 major areas such as macroeconomic, energy and foreign affairs. | Canon |
| 4 | O2-O1 | Mitsubishi work with business partners in Japan and overseas that have technology advancement, global capability in terms of IT services, including consulting and system development. | Mitsubishi |
| 5 | O2-O6 | Value based on consumer needs by providing safe and stable supply of living essentials. | Mitsubishi |
| 6 | O2-O7 | Focus on Asia and continued to sell new vehicles. | Mitsubishi |
| 7 | O2-O10 | Business in public with focus on infrastructure transactions. | Mitsubishi |
| 8 | O3-O4 | Price sensitive consumers will enhance technology integration | Indigo |
| 9 | O3-O5 | Accommodating and tracking of customers are important in purposeful design | Indigo |
| 10 | O3-O7 | Low-cost strategy will enhance channel enhancement by connecting more domestic routes. | Indigo |
| 11 | O3-O8 | Consumers needs are managed and promptly answered through functional training of staffs and front office team. | Indigo |
| 12 | O3-O9 | Unattended consumers’ needs will lead to opportunity loss | Indigo |
| 13 | O4-O1 | New technologies including cloud computing, big data, will enhance business opportunities. | Huawei |
| 14 | O4-O5 | Huawei is working towards developing top smart brand preferred and trusted by consumers. | Huawei |
| 15 | O4-O6 | Technology integration will enhance customer connectivity | Huawei |
| 16 | O4-O9 | In technology integration; cost loss, new knowledge will further delay the immediate progress. | Huawei |
| 17 | O5-O3 | Purposeful design will enhance price sensitive consumers | Samsung |
| 18 | O5-O4 | New product with integrated features in appliances is a part of technology integration activity. | Samsung |
| 19 | O5-O6 | Attractive features and combat products will enhance customer base. | Samsung |
| 20 | O5-O7 | Beautiful designs and purposeful features will cater more demands in markets that will lead to channel enhancement. | Samsung |
| 21 | O5-O8 | The market knowledge, design trends and technological advancements are learned through functional trainings. | Samsung |
| 22 | O6-O7 | Successful customer connectivity will enhance channel enhancement | Singapore Airlines |
| 23 | O7-O6 | Opening outlets and expanding domestic markets will familiarize the products to the customers | Hitachi |
| 24 | O8-O4 | Functional training will enhance technology integration | Tata Motors |
| 25 | O8-O7 | Training and knowledge will help | Tata Motors |
| 26 | O8-O9 | Functional training will enhance opportunity loss | Tata Motors |
| 27 | O9-O2 | Identifying right alliances will yield positive outcome. | NTPC |
| 28 | O9-O4 | Novel technology and clear technology will have a significant impact over opportunity loss | NTPC |
| 29 | O9-O6 | Wide customer base will be affected by opportunity loss | NTPC |
| 30 | O9-O7 | More business opportunities and market share will be affected by opportunity loss. | NTPC |
| 31 | O10-O7 | Proper network connectivity, transportations, road connectivity will improve channel enhancement. | L&T |
Source: Author.
Table 8.
Transitive Links Related to Asian Case Studies.
| S. No | Element No. | Paired Comparison of Transitive Links | Case Organizations |
|---|---|---|---|
| 1 | O1-O6 | New and sophisticated products will enhance customer connectivity | Canon |
| 2 | O3-O1 | The need for flight carriage in emerging economies will provide new synergies for growth | Indigo |
| 3 | O3-O6 | Price sensitive consumers enhance customer connectivity | Indigo |
| 4 | O4-O2 | Utilizing technology in network connectivity and safety will enhance business tie-ups | Huawei |
| 5 | O4-O7 | Technology upgradation will make product and service more feasible to market reach | Huawei |
| 6 | O5-O1 | Purposeful features, new designs will favour business growth | Samsung |
| 7 | O8-O1 | Knowledge on technology and technology utilization will enhance customer connectivity | Tata motors |
| 8 | O8-O6 | Soft skills, technical skills on front office will enhance customer connectivity. | Tata motors |
Source: Author.
Table 9.
Pooled OLS model.
| Number of obs = 60 | ||||||
| F (3, 56) = 282.05 | ||||||
| Prob > F = 0.0000 | ||||||
| R- squared = 0.9379 | ||||||
| Adj R—squared = 0.9346 | ||||||
| Root MSE = 2391.5 | ||||||
| Source | SS | df | MS | |||
| Model | 4.8392 × 10⁹ | 3 | 1.6131 × 10⁹ | |||
| Residual | 320,270,129 | 56 | 5,719,109.45 | |||
| Total | 5.1595 × 10⁹ | 59 | 87,449,072.6 | |||
| Operating Activities | Coef. | Std. Err. | t | P > |t| | [95% conf. Interval] | |
| Investing Activities | 0.5525548 | 0.0978834 | 5.65 | 0.000 | 0.3564708 | 0.7486387 |
| Financing activities | 0.4058251 | 0.2249273 | 1.80 | 0.077 | −0.0447585 | 0.8564086 |
| Social value expenditure | 0.3060674 | 0.0496878 | 6.16 | 0.000 | 0.2065308 | 0.4056039 |
| _cons | −1273.329 | 463.3307 | −2.75 | 0.008 | −2201.492 | −345.1664 |
Table 10.
Random-effect Model.
| Random-effects GLS regression | Number of observations = 60 | |||||
| Group Variable: Firm_id | Number of groups = 12 | |||||
| R-sq: | Observation per group: | |||||
| within = 0.4472 | min = 5 | |||||
| between = 0.9535 | avg = 5.0 | |||||
| overall = 0.9345 | max = 5 | |||||
| Wald chi2 (4) = 248.97 | ||||||
| corr (u_i, xb) = 0 (assumed) | prob > chi2 = 0.0000 | |||||
| Operating Activities | Coef. | Std. Err. | z | P > |z| | [95% conf. Interval] | |
| Investing Activities | 0.3898477 | 0.0888032 | 4.39 | 0.000 | 0.2157965 | 0.5638988 |
| Financing activities | 0.5678415 | 0.2003188 | 2.83 | 0.005 | 0.1752239 | 0.960459 |
| Social value expenditure | 0.3787422 | 0.0542567 | 6.98 | 0.000 | 0.2724011 | 0.4850833 |
| _cons | −1655.192 | 797.5347 | −2.08 | 0.038 | −3218.331 | −92.05232 |
| sigma_u | 2005.1502 | |||||
| sigma_e | 1536.4836 | |||||
| rho | 0.63005321 | (Fraction of variance due to u_i) | ||||
The significance of the study is shown in colour.
Table 11.
Goodness of fit test estimated result.
| Var | sd = sqrt (Var) | |
|---|---|---|
| operati~ s | 8.74 × 10⁷ | 9351.421 |
| e | 2360782 | 1536.484 |
| u | 4020628 | 2005.15 |
u is the random -error component, e is overall error component. Test: Var (u) = 0. chibar2 (01) = 33.44. Prob > chibar2 = 0.0000.
Publisher’s Note: MDPI stays neutral with regard to jurisdictional claims in published maps and institutional affiliations. |
© 2021 by the authors. Licensee MDPI, Basel, Switzerland. This article is an open access article distributed under the terms and conditions of the Creative Commons Attribution (CC BY) license (https://creativecommons.org/licenses/by/4.0/).
Share and Cite
MDPI and ACS Style
Sushil; Anbarasan, P. Organization’s Sustainable Operational Complexity and Strategic Overview: TISM Approach and Asian Case Studies. Sustainability 2021, 13, 9790. https://0-doi-org.brum.beds.ac.uk/10.3390/su13179790
AMA Style
Sushil, Anbarasan P. Organization’s Sustainable Operational Complexity and Strategic Overview: TISM Approach and Asian Case Studies. Sustainability. 2021; 13(17):9790. https://0-doi-org.brum.beds.ac.uk/10.3390/su13179790
Chicago/Turabian StyleSushil, and Periyasami Anbarasan. 2021. "Organization’s Sustainable Operational Complexity and Strategic Overview: TISM Approach and Asian Case Studies" Sustainability 13, no. 17: 9790. https://0-doi-org.brum.beds.ac.uk/10.3390/su13179790
Note that from the first issue of 2016, this journal uses article numbers instead of page numbers. See further details here.