Article

Do Tourism and Institutional Quality Asymmetrically Effects on FDI Sustainability in BIMSTEC Countries: An Application of ARDL, CS-ARDL, NARDL, and Asymmetric Causality Test

1
Economics and Education, Teachers College, Columbia University, New York, NY 10027, USA
2
School of Business and Economics, United International University, Dhaka 1212, Bangladesh
3
Department of Finance, College of Business Administration, King Saud University, Riyadh 11587, Saudi Arabia
*
Author to whom correspondence should be addressed.
Sustainability 2021, 13(17), 9989; https://0-doi-org.brum.beds.ac.uk/10.3390/su13179989
Submission received: 3 August 2021 / Revised: 23 August 2021 / Accepted: 31 August 2021 / Published: 6 September 2021

Abstract

:
The motivation of the study is to investigate the nature of the relationship between institutional quality, tourism, and FDI in BIMSTEC nations for the period 1996Q1–2018Q4. Exploring their nature of association, the study performed several panel econometric models, namely Panel ARDL, Nonlinear ARDL, and Toda-Yamamoto causality test, with symmetric and asymmetric effects of institutional quality and tourism. The results of the Wald test confirmed the long-run asymmetric relationship between institutional quality, tourism, and FDI, both in the long-run and short-run. Furthermore, directional casualty established a feedback hypothesis explaining the relationship between institutional quality, tourism, and FDI.

1. Introduction

Foreign direct investment (FDI) is important for economic progress, especially for developing nations. Hence, developing nations have been keen to accept foreign investment since FDI bridges capital, technological expertise, and management gap between domestic and foreign firms. Thus, by allowing FDI in the economy, countries can spur their investment possibilities, in the top prioritized area(s), in the economy that eventually expedite the hustle of economic growth in the long run. Furthermore, in globalization, FDI is considered an important stimulator of productivity enhancement, technological advancement, and job creation. The study by Quazi [1] advocated that FDI accelerates economic growth, playing a vital role in tax revenue, foreign exchange, and development gaps in developing and transition economies.
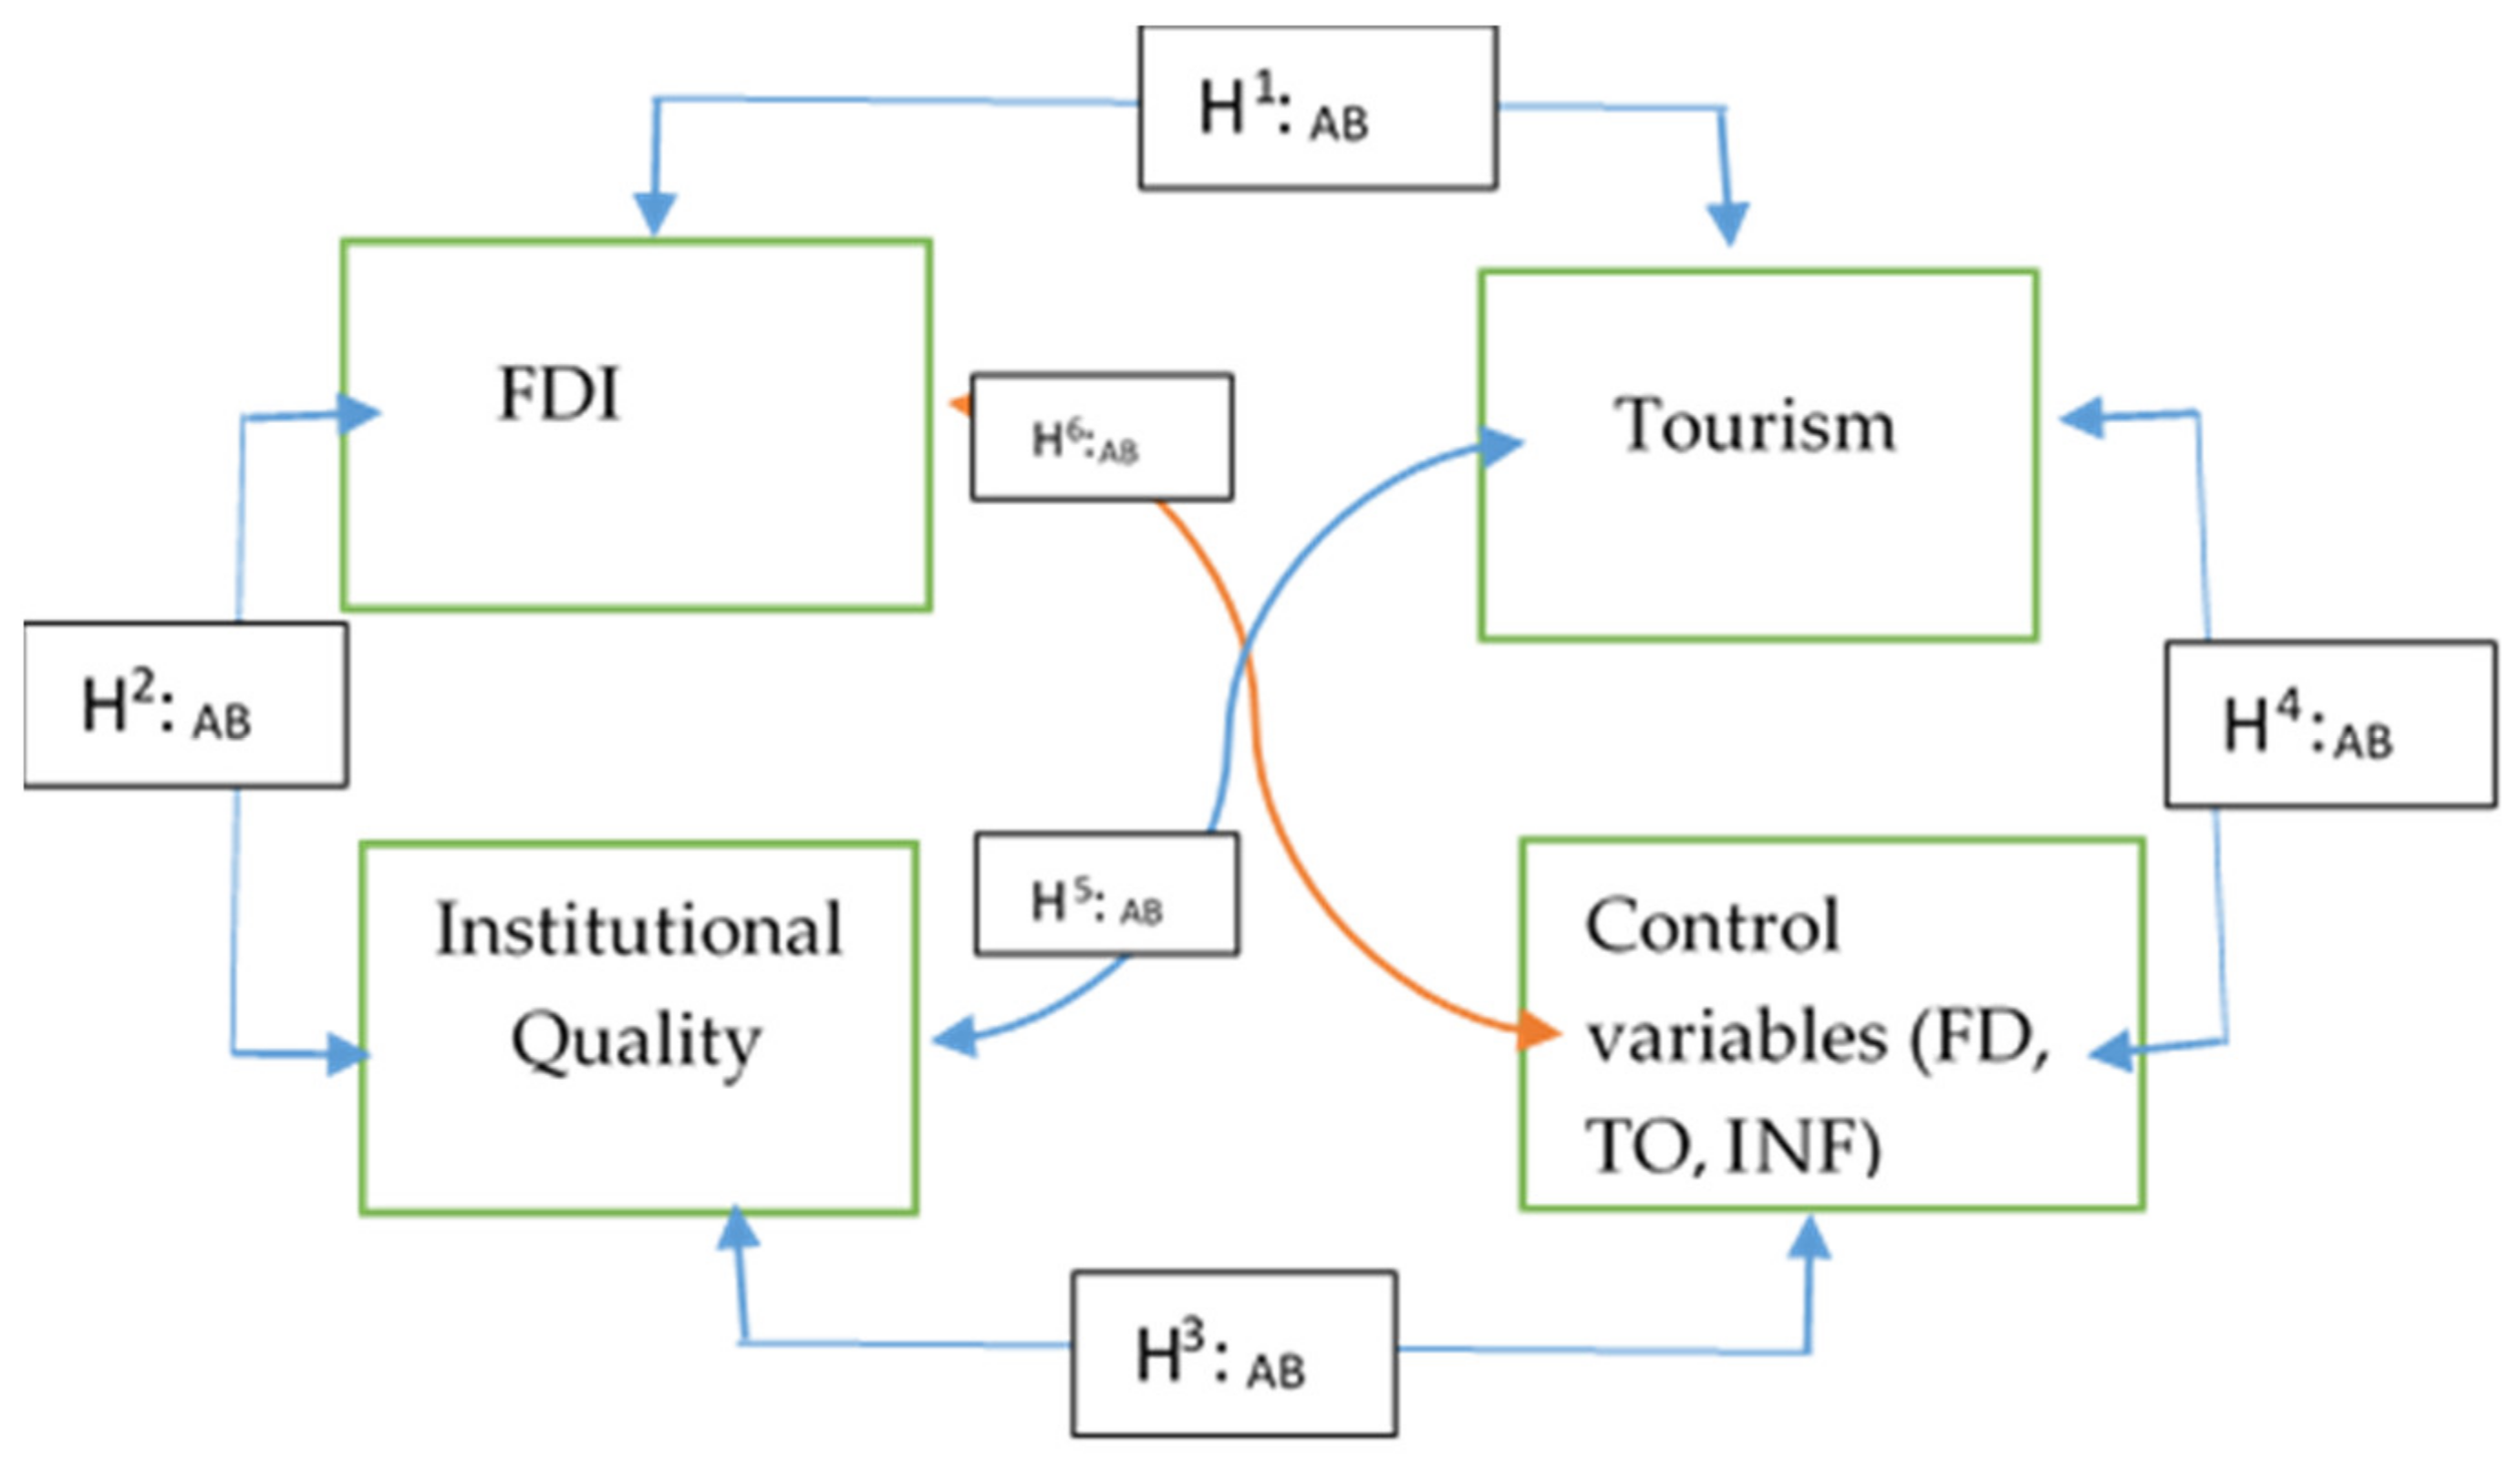
The motivation of the study is to gauge the role of tourism and institutional development on FDI inflows in BIMSTEC Countries. The study implemented both symmetry and asymmetry frameworks of exploring the insight evidence in empirical assessment. The study detected that FDI inflows positively augmented further development in tourism and institutional quality in BIMSTEC countries. BIMSTEC is a sub-regional organization comprised of seven South and Southeast Asian nations. Its mission is to foster economic growth, accelerate social advancement, and foster cooperation on issues of mutual concern in the Bay of Bengal. The underlying motivation for selecting BIMSTEC as a panel is sharing the common economic dynamics and economic integration.
Acknowledging the potential effects of FDI in the economy, a growing number of studies were performed targeting to discover the key determinants of FDI inflows. Empirical literature signifies several macro fundaments including, level of economic development [2,3], financial markets development [4,5,6], human capital [7,8,9], quality infrastructure [10], size of the market [11,12], the infrastructure of the host country [13], interest rate [14], the exchange rate [15], inflation [16], trade openness and domestic investment [17], good governance [18], and so on.
The novelty of this study lies in the following actualities. First, in the study, the effect on FDI will be investigated by considering the three aspects. As part of the contributions of this study, we employ three dependent variables—flows of FDI (% of GDP) and stock of FDI and FDI volatility. The volatility of FDI is measured by the variance of FDI following Buchanan et al. [19]. The underlying motivation for selecting three proxies so that broad aspects of the empirical nexus can be investigated and side-by-side unleash conclusive evidence. Second, the long and short-run magnitude of tourism and institutional quality on FDI will be investigated applying both PGM-ARDL and CS-ADRL. Third, to our best knowledge, for the first time, asymmetric effects of institutional quality and tourism on FDI were investigated by following a nonlinear framework imitated by Shin et al. [20]. Finally, the directional relationship between institutional quality, tourism, and FDI is to be assessed by following the non-granger causality framework proposed by Toda and Yamamoto [21] with symmetric and asymmetric effects of institutional quality and tourism in the empirical equation.
Study findings revealed that both institutional quality and tourism positively influence the inflows of FDI, especially in the long run. These findings have been confirmed by both panel ARDL and CS-ARDL estimation. Referring to asymmetry assessment, the study findings revealed that the results of the Wald test, both in the long-run and short-run, are statistically significant, implying the presence of an asymmetric relationship between institutional quality, tourism, and FDI in BEMISTEC countries during 1996–2018. Furthermore, the causality test disclosed the feedback hypothesis for explaining the causality between institutional quality, tourism, and FDI symmetry. The asymmetric casualty tests recognized bidirectional casualty running between negative shocks in institutional quality, tourism, and FDI. However, unidirectional causality runs from FDI to positive shocks in institutional quality and tourism, respectively.
The paper is structured as follows. Section 2 deals with the empirical literature survey on the nexus between institutional quality, tourism, and FDI. Data sources, descriptions of variables, and econometric methodologies are explained in Section 3. Empirical models estimation and their interpretation are reported in Section 4. Finally, summary findings and policy implications are displayed in Section 5.

2. Literature Review

2.1. Nexus between Tourism and FDI

According to existing literature, two lines of evidence are available focusing on the nexus between FDI and Tourism. First, FDI-led tourism development, suggesting that foreign investors assist a nation in increasing tourism by upgrading tourist attractions and transportation and lodging facilities such as airports and hotels [22,23,24] and tourism-led FDI in the economy [25,26].
International tourism has been one of the world’s fastest expanding industries and a significant source of foreign revenue for many nations [27]. Moreover, its effect on a country’s economy is often measured in terms of GDP growth. An economy’s potential to profit from tourism is contingent upon the availability of (international) money to invest in infrastructure development, particularly transportation and lodging services. In recent years, the tourism industry has risen to become a primary industry, generating an increasingly significant source of foreign money needed to fund development. There are significant impacts on the economy when it comes to tourism growth. While tourism’s advantages are not confined to a certain segment of society, the breadth of the population that they reach is greater than those benefits derived from other sectors of the economy [28]. The growth of the tourism industry expedites economic growth, offering employment and sources of income, which eventually increase the standard of living in society. The important role of tourism development in economic prosperity in literature is based on the tourism-led growth hypothesis [29,30]. Tourism development, especially in developing nations, only accelerates export earning with manufacturing industries and assists the services industry to thrive with employment opportunities. Tourism-related sectors are anticipated to see greater inflows of foreign direct investment (FDI) as a result of an increase in tourism [29]. Thus, under this assumption, tourism-related FDI is considered a key mechanism for economic growth [31].
Referring to tourism-led FDI, empirical studies have produced three-line findings. The first line of research established positive effects running from Tourism to FDI. In this regard, supporting the demand leading hypothesis, that is, tourism augments the inflows of FDI in the host economy, see, for instance, Perić and Radić [32], Katircioglu et al. [33]; Kaur and Sarin [34], Tomohara [31]. On the other hand, the supply leading hypothesis was also established in empirical studies, which suggests that foreign direct investment accelerates tourism development by allowing expansion growth see, for instance, Vorley [35], Ivanovic et al. [36], Siddiqui and Siddiqui [37], Arain et al. [38] and, Arain, Sharif, Akbar, and Younis [38].
The second line of thought supports the “feedback hypothesis”, that is, bidirectional causality running between Tourism-FDI see, for instance, Arain, Sharif, Akbar and Younis [38]; Satrovic [39]; Salleh et al. [40], Sokhanvar [24]. Finally, the neutral relationship is also observed in the literature; it implies that tourism does not play any role in augmenting the recipients of FDI in the host economy. See, for instance, Khoshnevis Yazdi and Shakouri [41].
Samimi, Sadeghi, and Sadeghi [29] conducted a study investigating the role of tourism on FDI inflows in Japan data for the 1996–2011 period by utilizing the system GMM estimation. The study findings document the supporting evidence favoring tourism-led FDI in Japan. The study findings postulated that increased incoming international tourism has spillover effects that extend beyond the tourism-related industries to other sectors. Further evidence is available in the study of Chang and Chang [42]. The study suggests that growth in inbound tourism can boost FDI inflows to tourism businesses and FDI inflows to other sectors. The summary of the literature survey is displayed in Table 1. In other words, flourishing inbound tourism may have spillover effects on non-tourism industries.

2.2. Institutional Quality and FDI Nexus

In recent research, the institutional quality of a host nation has gained increasing attention as one of the major factors in foreign capital investment decisions. Institutional factors such as legal and political systems are considered critical in reducing the risk of opportunism in foreign direct investment (FDI). Furthermore, less corruption and a fair, reliable, and efficient bureaucracy assist in attracting foreign direct investment. Nexus between institutional quality and FDI has been investigated extensively in the empirical literature, and a growing number of researchers have confirmed positive associations, including Bouchoucha and Benammou [74]; Masron and Abdullah [75]; Masron and Naseem [76]; Shah et al. [77]. Quality institutions, according to Hall and Jones [78], accelerate the growth phenomena by encouraging private investments and improving the overall efficiency of the economic system. The theoretical literature supports the importance of efficient and well-performing institutions in disciplining economic actors’ conduct and enacting rules and regulations that restrict opportunism and foster transactional trust in financial transactions, thus increasing foreign investor confidence and FDI inflows. In a study by Globerman and Shapiro [79], they contended that stronger institutions may benefit FDI inflows by creating favorable conditions for foreign investors. Additionally, they discovered that various metrics of governance quality had a somewhat varied effect on FDI inflows. The study of Masron [80] advocated that although raising IQ is a good thing, it does not always translate into greater FDI. That is, IQ is a required but not sufficient condition for FDI inflows. Ongoing efforts to strengthen ASEAN economies should improve labor markets, natural resource supply stability, and physical infrastructure.
Possessing quality institutions in the economy, countries can have experienced additional benefits for receiving FDI in various ways. First, quality institutions and productivity are interlinked in the long run, and the possibility of achieving higher productivity encourages foreign investors to invest in the economy. Second, an unfavorable institutional environment may raise the cost of conducting business. Corruption, for example, may discourage investment by raising the cost of conducting business. Third, since FDI entails a large sunk cost, it is susceptible to uncertainty, particularly caused by poor government efficiency. Improper contract enforcement, for example, may raise uncertainty about future returns and, as a result, have a detrimental impact on investment.
Regarding IQ and FDI nexus, another group of researchers has observed the adverse association [19,81,82,83]. In the study of North [84], the study findings postulated that inefficient institutions are responsible for increasing the production costs through disrupting the supply chain, and excessive formalities in obtaining permits can significantly increase production costs.
However, the empirical literature has also exposed neutral effects running between IQ and FDI, see [85,86,87]. Furthermore, the indirect effects of institutional quality on FDI inwards are also investigated and established in empirical studies such as human capital, healthy labor force, and the quality of public facilities to promote FDI [88]. The study of Michael Michael et al. [89] investigated the moderating effects of institutional quality on inflows of FDI in 40 countries in the Sub-Saharan African region over the period from 1996 to 2011. The study findings revealed that institutional quality augmented the inflows of FDI by reducing the negative effects of macroeconomic uncertainty. The summary of survey literature is displayed display in Table 2.

2.3. The Motivation of the Study and Proposed Hypothesis of the Study

Concerning the literature survey, it is apparent that many empirical studies have already been conducted by taking account of several macroeconomic fundamentals with time series and panel data. However, the nexus between institutional quality, tourism, and FDI is yet to be investigated, and their possible asymmetry is still undiscovered in the empirical literature.
Furthermore, it is obvious that directional causality is investigated extensively; however, their asymmetric causality relationship is yet to be unleashed. Therefore, with this study, for the first time, the possible asymmetric relationship between Tourism and FDI will be investigated by applying the nonlinear framework propose by Shin, Yu, and Greenwood-Nimmo [20] in panel form, and asymmetric directional causality will be assessed by following Toda and Yamamoto [21] causality test with the asymmetry of tourism in the equation. It is expected that the current research findings will contribute towards fulfilling the existing research gap and put another view for explaining the nexus between institutional quality, tourism, and FDI that is asymmetry effects. Figure 1 displays the conceptual and hypnotized empirical model for hypothesis testing.

3. Data and Methodology of the Study

To investigate the dynamic relationships between institutional quality, tourism, and FDI, this study considers annual panel data from 1996Q1 to 2018Q4. Except for the proxy variables of institutional quality, all the relevant data were collected from the World D evelopment Indicator published by World Bank. Furthermore, the proxy variables of tourism were collected from Worldwide Governance Indicators (WGI). All the research variables were transformed into a natural log before estimation.
As a dependent variable of the study, the study employed three different proxies, that is, flows of FDI, (% of GDP) and stock of FDI. The volatility of FDI is measured by the variance of FDI following [19]. The motivation for selecting three proxies is to explore comprehensive and conclusive evidence so that the study findings can contribute substantially to future literature development on the purported topic.

3.1. Tourism

Gauging tourism effects on FDI, in the empirical estimation, it is observed that two measures were used extensively. First, international tourism receipts in current USD [46,126,127]. Second, International tourist arrival is measured by the number of tourism visitors/million People, see for instance [29,69,128]. However, a growing number of researchers emphasized using international tourism receipts as a proxy for tourism in the empirical estimation, and this study is on the same trajectory.

3.2. Institutional Quality

Measuring institutional quality in the empirical literature, two lines of thought are available. A growing number of empirical studies have utilized a single proxy for IQ in these respective studies see, for instance, Aizenman and Spiegel [129]; Levchenko [130]; Habib and Zurawicki [131]; Wijeweera and Dollery [132]. The second line of empirical findings have been suggesting the use of index measures for institutional quality, which is constructed by taking into account the indicators from World Governance Indicators [133] with the application of Principal component analysis see for an instance Le et al. [134]; Qamruzzaman, Tayachi, Mehta, and Ali [18]; Daude and Stein [104]. In regards to institutional quality measurement, the present study follows the second line of under sting that is the use of the institutional quality index following Qamruzzaman, Tayachi, Mehta, and Ali [18]; Asamoah, Adjasi, and Alhassan [119]; Buchanan, Le, and Rishi [19]. The pair-wise correlation of six indicators of WGI is displayed in Table 3 and the output of PCA is reported in Table 4.
As a result, following existing literature, see, for instance, Asamoah and Alagidede [135], Globerman and Shapiro [88], the study performed principal components of the six indicators of governance employing factor analysis and construct instructional quality index (IQ). The results of PCI are exhibited in Table 4.
Apart from the target variables, following existing literature see Carkovic and Levine [136] and Hayat [137], the study considers a list of control variables for robustness in empirical estimation such as trade openness (TO) measured by the sum of export and import as a percentage of GDP. Domestic investment (DI) is measured by gross capital formation as a percentage of GDP, inflation (INF) is measured by consumer price index and money supply (M) which is proxied by Broad money as a percentage of GDP.
Considering all proxies representing FDI in the empirical equation, the generalized empirical model in panel form can be represented in the following Equations (1)–(3), and different methodologies will be applied for assessment purposes.
F D I i t = α t + β Inst i t + γ Tour i , t + µ X i t i , t + φ i t
F D I _ s t o c k i t   = α t + β Inst i t + γ Tour i , t + µ X i t i , t + φ i t
F D I _ v o l a t i l i t y i t = α t + β Inst i t + γ Tour i , t + µ X i t i , t + φ i t
The subscripts i and t denote the sample countries (i = 1, 2,..., N) and months (t = 1, 2,…, T), respectively. FDI, FDI_stock, and FDI_volatility. FDI are inflows of FDI as % of GDP, FDI stock as a % of GDP and FDI volatility is measured by five years standard deviation. Inst indicates a composite index of institutional quality, and Tour represents international tourism receipts. X i t for a group of control variables in the equation, which includes trade openness (TO), money supply (M), domestic investment (DI), and inflation (INF), respectively. The results of the descriptive statistics are exhibited in Table 5.

3.3. Estimation Strategies

3.3.1. Cross-Sectional Dependency Test

The cross-section dependence test is critical in panel data empirical research, particularly when representative nations have similar economic features, such as emerging countries, growing economies, and transition countries. A similar economy is vulnerable to the impacts of any shock in other countries due to trade internationalization, financial integration, and globalization. As a consequence, cross-sectional dependency analysis is often needed in empirical research using panel data. According to existing literature, a number of CSD tests have emerged and been applied for detecting the presence of common dynamics in research units, such as LMBP test was offered by Breusch and Pagan [138], and the test statistics can be derived with the following equation:
y i t = α i + β i x i t + u i t
i   =   1 N , t   =   1 T
where y i t   , x i t stands for dependent and independent variables and the subscript of t, and i represent cross-section and period, respectively. Under the circumstance of larger cross-section units in the model, the LMBP test cannot handle the issue. Overcoming the present limitation Pesaran [139] proposed the following modified Lagrange multiplier (CDlm) for examining cross-sectional dependency among research units:
C D l m   =   N N N     1 I   =   1 N     1 J   =   i   +   1 N T ρ ^ i j     1
The empirical model with larger N relative to T, CDlm estimation incapacity to manage this issue and resolve the limitation in CFlm, Pesaran [140] offered the following CD test for the situation with larger N than T.
C D l m   =   2 T N N     1 I   =   1 N     1 J   =   i   +   1 N ρ ^ i j
Finally, Pesaran et al. [141] familiarized the improved version of CDlm test known as the bias-adjusted LM test, and the test statistics can be derived using the following equation:
C D l m   =   2 N N     1 I   =   1 N     1 J   =   i   +   1 N T K ρ ^ i j 2 u T i j υ T i j 2 d N , 0
where K refers to the number of regresses, u T i j and υ T i j 2 specifies the mean and variance of T K ρ ^ i j 2 , respectively.

3.3.2. Panel Unit Root Tests

The study performed several unit root tests to discover the properties of the variable, especially with cross-sectional dependency. Second generation panel unit root tests introduced by Pesaran [142], commonly known as CADF and CIPS and have been extensively utilized see [143,144,145]. The Dickey–Fuller Sectional Augmented Statistics (CADF) can be expressed as:
Δ X i t   =   μ i   +   θ i X i , t 1   +   γ i X ¯ t 1   +   k = 1 p   γ i k Δ X i , k 1   +   k = 0 p   γ i k Δ X ¯ i , k 0   +   τ i t
where Y i t 1 and y ¯ t 1 stands lagged level average and first difference operator for each cross-section, the CIPS unit root test displays in Equation (9).
C I P S   =   N 1 i 1 N   i N , T
where the parameter i N , T explain the test statistics of CADF, which can be replaced in the following manner:
C I P S   =   N 1 i 1 N   C A D F

3.3.3. Panel Cointegration Test

The present research used several panel cointegration tests following Pedroni Pedroni [146,147], Kao [148] and the bootstrap panel cointegration method developed by Westerlund [149] to find the evidence of a long-run relationship between variables. The Bootstrap panel cointegration technique is more advantageous if each cross section is composed of condensed time series. Because traditional methods do not take CD into account, they accept the null hypothesis of no cointegration even in the presence of CD.

3.4. Pooled Grouped Mean Estimation

For detecting the impact of tourism and institutional quality on FDI inflows, the study considered Panel ARDL familiarized by Pesaran et al. [150], which is capable of identifying both long-run and short-run coefficients in empirical assessment. The first fundamental assumption of PGM is that the error correction term is free from correlation dependency and is normally distributed by regressors. Additionally, the dependent and explanatory variables are related throughout time, which means there will be a long-term correlation between them; finally, the long-term parameters will stay consistent across nations. Pesaran proposed the following ARDL (p, q …. n) as an empirical structure:
F D I i t   =   ϵ i t + j   =   1 p β i j F D I i , t j   +   j = 0 q   γ i j X i , t j   +   ϵ i t
where,
ϵ i t = ω t G t + ε i t
X i , t j = α i + β i j F D I   i , t j   +   ω t G t   +   µ i t
Following Pesaran, Shin, and Smith [150], the following empirical model is used to detect the association between FDI, tourism, and institutional quality in panel assessment.
Δ F D I i t = α i + ξ i F D I i t 1 ω t X i t 1 + J = 1 M 1 γ i J Δ F D I i t J + J = 0 N 1   β i j Δ X i t J + μ i t
where ξ i = 1 ( 1 j 1 M γ i J ) , ω t = ξ i 1 j = 0 N β i j , γ i , j * = I = J + 1 M γ i l for J = 1, 2, ..M-l, and β i , j * = I = J + 1 N β i l for J = 1, 2, ..N-l. F D I i t 1 ω t X i t 1 .
Specify the long-run relationship between foreign direct investment and explanatory variables such as institutional quality, tourism, and a list of control variables. The long-run coefficient denoted by ω ¯ i; and the speed to the recovery of short-run disequilibrium is explained by the vector of ξi the remaining coefficient (i.e., γ i , j * ,   β i j ) in Equation (14) represent the short-run dynamics.

3.5. Cross-Sectional ARDL

The presence of cross-sectional dependency among research units has raised inconsistency with traditional panel regression estimation. Thus Chudik and Pesaran [151] proposed an advanced, econometrics technique known as the Common Correlated Effects (CCE) approach for gauging the relationship with panel data, which is the extension of Pesaran [140]. Following the proposed framework, the generalized empirical model is as follows:
F D I ¯ i t = α ¯ i t + j = 1 p β ¯ i j F D I ¯ i , t j + j = 0 q γ ¯ i j X ¯ i , t j + ω ¯ t G t + ϵ ¯ i t
where, α ¯ i t = i 1 N α i N  
F D I ¯ t j = i N F D I i , ,   t j N , β ¯ j = i N β i ,   j N j = 0 , 1 , 2 p
X ¯ t j = i N X i , ,   t j N , ¯ j = i N i ,   j N , J = 0 , 1 , 2 q
ω ¯ ¯ j = i = 1 N ω i N ,   ε ¯ t = i N ϵ i ,   t N  
F D I i t   =   α ¯ i t   +   j = 1 p   β ¯ i j F D I ¯ i , t j   +   j = 0 q   γ ¯ i j X ¯ i , t j   +   ω ¯ t G t ω ¯ t G t = F D I ¯ i t α ¯ i t + j = 1 p   β ¯ i j F D I ¯ i , t j + j = 0 q   γ ¯ i j X ¯ i , t j G t =   F D I ¯ i t α ¯ i t + j = 1 p β ¯ i j F D I ¯ i , t j + j = 0 q   γ ¯ i j X ¯ i , t j ω ¯ t
Thus, the Panel CS-ARDL specification of Equation (15)
F D I ¯ i t = ϵ i t + j = 1 p   β i j F D I ¯ i , t j + j = 0 q   γ i j X ¯ i , t j + j = 0 p   ¯ t j Z ¯ i , t j + ϵ i t
where, Z ¯ = F D I ¯ , X ¯ and S Z ¯ in the number of lagged cross-sectional average, Similarly Equation (11) can be reparametrized to the effects of ECM presentation of Panel CS-ARDL as follows:
Δ F D I i t = α i + ξ i F D I i t 1 ω t X i t 1 + J = 1 M 1   γ i J Δ F D I i t J   + J = 0 N 1   β i j Δ X i t J + j = 1 p   λ j Δ F D I ¯ i , t j + j = 0 q   δ j Δ X ¯ i , t j + j = 0 S Z ¯   ¯ t j Z ¯ i , t j + μ i t  
where Δ F D I ¯ t j = i N Δ F D I i ,   t j N , Δ X ¯ t j = i N Δ X i , ,   t j N .

3.6. The Asymmetric Panel ARDL

The study implements a nonlinear framework following Shin, Yu, and Greenwood-Nimmo [20] in panel form to evaluate the asymmetric effects of tourism and institutional quality on FDI inflows. Taking into account the positive and negative shocks that are (TOR=, TOR−, IQ+, and IQ−), the following empirical asymmetric equation can be derived:
Δ F D I i t = β 0 i   + β 1 i F D I i t 1 + β 2 i + I Q t 1 + + β 2 i I Q t 1 + β 3 t + T O R t 1 + + β 3 t T O R t 1 + β 4 t D I t 1 + β 5 t T O t 1 + β 6 t M t 1 + β 7 t I N F t 1 + J = 1 M 1 γ i J Δ F D I _ i i , t J + J = 0 N 1   γ i j + Δ I Q i , t j + + γ i j Δ I Q i , t j +   J = 0   O 1   δ i j + Δ T O R i , t j + + δ i j Δ T O R i , t j + β 4 t D I t 1 + β 5 t T O t 1 + β 6 t M t 1 + β 7 t I N F t 1 + ε i t
where i n s t + & i n s t stand for the positive and negative shock of institutional quality, T O R + and T O R   Represents the positive and negative shock of tourism. The long-run coefficients are computed as + = β 2 i + β 1 i , = β 2 i β 1 i , µ + = β 3 i + β 1 i , µ = β 3 i β 1 i , respectively. These shocks are computed as positive and negative partial sum decomposition of institutional quality and tourism in the following ways:
I Q i +   =   k = 1 t   Δ I Q i k   +   =   K = 1 T   M A X Δ I Q i k , 0 i n s t i   =   k = 1 t   Δ i n s t i k   =   K = 1 T   M I N Δ i n s t i k , 0
T O R i +   =   k = 1 t   Δ T O R i k +   =   K = 1 T   M A X Δ T O R i k , 0 T O R i   =   k = 1 t   Δ T O R i k   =   K = 1 T   M I N Δ T O R i k , 0
The error correction version of Equation (22) is as follows:
Δ R E i t = τ 1 i ξ i t 1 + J = 1 M 1 γ i J Δ R E i , t J + J = 0 N 1 γ i j + Δ F D i , t j + + γ i j Δ F D i , t j + J = 0 O 1 δ i j + Δ T O i , t j + + δ i j Δ T O i , t j + J = 0 P 1 μ i j + Δ C F i , t j + + μ i j Δ C F i , t j + ε i t

3.7. Causality Test with Symmetric and Asymmetric with Toda-Yamamoto

Gauging the possible directional causality between institutional quality, tourism, and FDI, this study applied the non-causality test proposed by Toda and Yamamoto [21]. Zapata and Rambaldi [152] claimed that Toda and Yamamoto’s non-causality test outperforms the Granger causality test in certain situations. First, a non-causality test requires no cointegration characteristics in the system equation. Second, the MWALD test may examine existing causality between variables when the integration order is I (0) or I (1). Equation (26) showed symmetrical impacts between institutional quality and tourism.
X t i = α 0 + v = 1 k β 1 v F D I t v + j = k + 1 d m a x β 2 j F D I t j + i = 1 k γ 1 i I Q t i + j = k + 1 d m a x γ 1 j I Q t j + i = 1 k π 1 i T O R t i + j = k + 1 d m a x π 1 j T O R t j + i = 1 k τ 1 i D I t i + j = k + 1 d m a x τ 1 j D I t j + i = 1 k φ 1 i M t i + j = k + 1 d m a x φ 1 j M t j + i = 1 k δ 1 i T O t i + j = k + 1 d m a x δ 2 j T O t j i = 1 k δ 1 i I N F t i + j = k + 1 d m a x δ 2 j I N F t j + ε 1 t
.
In the following, integrating the positive and negative shocks of institutional quality [ I Q i + ,   I Q i ] and tourism ( T O R i + ,   T O R i ), the symmetric Equation (26) can be rewritten into an asymmetric Equation (27).
F D I t i = α 0 + v = 1 k β 1 v F D I t v + j = k + 1 d m a x β 2 j F D I t j + i = 1 k γ 1 i I Q + t i + j = k + 1 d m a x γ 1 j I Q + t j + i = 1 k γ 1 i I Q t i + j = k + 1 d m a x γ 1 j I Q t j + i = 1 k π 1 i T O R + t i + j = k + 1 d m a x π 1 j T O R + t j + i = 1 k π 1 i T O R t i + j = k + 1 d m a x π 1 j T O R t j + i = 1 k τ 1 i D I t i + j = k + 1 d m a x τ 1 j D I t j + i = 1 k φ 1 i M t i + j = k + 1 d m a x φ 1 j M t j + i = 1 k δ 1 i T O t i + j = k + 1 d m a x δ 2 j T O t j i = 1 k δ 1 i I N F t i + j = k + 1 d m a x δ 2 j I N F t j + ε 1 t
.

4. Empirical Model Estimation and Discussion

4.1. Panel Unit Root, Cross-Section Dependence, and Cointegration Tests

Now, we move to assess variables’ order of integration that is the test of stationarity. Several first-generation unit-roots were performed in the study, namely, the LLC test [153], the IPS test proposed by Im et al. [154], the Breitung test proposed by Breitung [155], the Fisher-ADF proposed by Maddala and Wu [156] which have the null hypothesis that all the panel contains a unit root. Besides, the Lagrange multiplier (LM) test proposed by Hadri [157] has the null hypothesis that all panels are stationary; the first generation unit root test results are exhibited in Table 6.
Furthermore, we believe that data are cross-sectionally correlated since the lists of panel countries are geographically and economically connected. Therefore, we performed a cross-sectional dependency test, and the results are reported in Table 7, given that the variable under investigation has a cross-sectional dependency. So, one can assume that FDI, tourism, institutional quality, and domestic investment seem to exhibit some dynamisms common to all countries.
With regards to the results of the cross-sectional dependency test and following empirical literature including, Gengenbach et al. [158] and Dogan and Aslan [159], we perform a two-panel unit root test, which is predominately applied due to the presence of cross-sectional dependency in the panel data that is augmented cross-sectional ADF (CADF) and CIPS unit root test proposed by Pesaran [142]. The results of the panel unit root tests are exhibited in Table 8. Results of panel unit root tests established mixed order of integration, that is, variables are integrated either at a level I (0) or/and after the first difference I (1).
In the following, the study performed a residual-based panel cointegration test proposed by Pedroni [146,147] and Kao [148], assessing the possible long-run association between institutional quality, tourism, and FDI. The results of the panel cointegration test are reported in Table 9. Alluding to the outcomes, we can postulate the presence of a long-run equilibrium relationship between FDI, institutional quality, and tourism since the null hypothesis is rejected at a 1% level of significance. This verdict is valid for all empirical model estimations. The existence of a cointegrating equilibrium relationship between the variables paves the way for uncovering both the short- and long-run dynamics.
Additionally, the study performed the Westerlund–Durbin–Hausman panel cointegration test proposed by Westerlund [149], and test results are exhibited in Table 10. Model estimation produces two statistics: Group statistics based on panel homogeneity and Panel statistics based on panel heterogeneity report the summary results of the panel cointegration test. Regarding the associate p-value of test statistics, they are statistically significant at a1% level of significance. These findings imply that inflows of FDI will be affected by any changes in institutional quality, tourism, in the economy in the long run.
Furthermore, the presence of a long-run relationship can also be assessed by considering the coefficient of ECT in panel PGM estimation. In order to establish a long-run association, the coefficient of ECT should be negative and statistically significant. Referring to the coefficients reported in Column (1) to Column (9), it is observable that all the coefficients are negative in sign and statistically significant at a 1% level. Therefore, we can conclusively postulate that institutional quality, tourism, and FDI move together in the long run.

4.2. Results of Panel-ARDL (PGM) Estimations

Table 11 displayed the results of PGM estimation, which includes the long-run and the short-run coefficients in panel-A and Panel-B, respectively. Getting insight into the tested nexus between institutional quality, tourism, and FDI, this study has performed nine empirical models based on various proxies for the dependent variable. The Study findings with FDI inflows as a percentage of GDP are reported in columns (1)–(3), in terms of FDI stock displayed in columns (4)–(6), and FDI volatility exhibited in columns (7)–(9).
The model estimation outcome is displayed in columns (1)–(3), where FDI inflows are treated as a dependent variable. In the long run, we observed that both institutional quality (a coefficient of 0.440) in column (1) and tourism (a coefficient of 0.240) in column (2) are positively associated with their respective empirical model. Furthermore, the empirical model outcome with the presence of both independent variables (see, column-(3)), it is apparent that tourism (a coefficient of 0.166) and institutional quality (a coefficient of 0.942) induced inflows of FDI with a positive attitude and their coefficients are statistically significant at a 1% level. As such, one can assume that in the long run, inflows of FDI in BMISTEC nations can be accelerated by offering a better institutional perspective and internationalization of tourism services. In the short-run (see, Panel-B, Columns (1)–(3)), the effects of institutional quality and tourism are positively linked to inflows of FDI. Considering the model output reported in Column (3), it is apparent that both institutional quality (a coefficient of 0.092) and tourism (a coefficient of 0.124) are positively connected with inflows of FDI.
The results are reported in columns (4) to (6), where FDI stock is considered a dependent variable. In the long run, institutional quality (a coefficient of 0.536) and tourism (a coefficient of 2.230) are positively associated with FDI inflows in terms of stock in their respective sole empirical assessment. Furthermore, referring to column (6), where both institutional quality and tourism are incorporated in the equation and unveiled positive effects, that is, institutional quality (a coefficient of 0.516) and tourism (a coefficient of 0.487), on FDI stocks. More specifically, if it is possible to implement a 10% acceleration in institutional quality and tourism, such an injection will result in 5.16% of FDI stock flows due to the development of institutional quality and 4.87% due to tourism expansion. In the short run, the long-run equilibrium convergence is established in all tested empirical models, implying that the coefficients of ECT are negative and statistically significant. However, considering the short-run elasticities of institutional quality and tourism on FDI stock. The study findings suggested a negative association between them, but all the coefficients are statistically insignificant.
Finally, empirical model estimation with FDI volatility as the dependent variable and the results are reported in Column (7) to (9). In the long run, in their respective equation, that is a sole model, both institutional quality (a coefficient of −0.031) and tourism (a coefficient of −0.413) exhibited a negative association with FDI volatility. Further, referring to results reported in column (9), we observed that both institutional quality (a coefficient of −0.246) and tourism (a coefficient of −0.196) play a negative role. More precisely, these findings suggest that a 10% development in institutional quality and tourism will reduce FDI volatility by 2.46% due to institutional quality and 1.96% due to tourism effects in the economy. Referring to the short-run effects reported in Panel-B, a statistically insignificant positive association between institutional quality, tourism, and FDI volatility is established.
For the control variables, money supply and trade openness play a positive role in increasing FDI inflows and FDI stock in the long run. However, insignificant effects are established in the case of FDI volatility. The coefficient of control variables, especially in the short-run, exhibited statistically insignificant except domestic investment. Domestic investment augments inflows of FDI and FDI stocks, but insignificant effects are observed for FDI volatility.

4.3. CS-ARDL Estimation

In the following section, the study investigates the long-run and the short-run association between institutional quality, tourism, and FDI by performing CS-ARDL since the presence of cross-sectional dependency among researched variables. Table 12 exhibits the results of the long-run and short-run effects on FDI. Referring to long-run estimation (see, Panel-A), the noticeable findings are that both institutional quality and tourism are positively associated with FDI; these findings are also valid for all empirical model estimations. More specifically, the following results are reported in Columns (3), (6), and (9) with both institutional quality and tourism present in the equation. However, in the case of FDI volatility as a dependent variable in the equation, the study findings established a negative association, that is, development in institutional quality and tourism will result in the stability in FDI inflows in the long run.
In the short run, the coefficients of error correction term, regardless of empirical model investigation, are negative in sign and statistically significant at a 1% level. These findings confirmed the presence of long-run convergence among the variables (see panel-B). Furthermore, analyzing the short-run magnitude running from the institutional quality and tourism, the study findings disclosed positive association (see panel-B, Columns (3), (6), and (9)). Specifically, 10% development in institutional quality will result in further development in FDI inflows by 13.58%, and tourism contributes to the process by 8.16%; furthermore, FDI stock enhancement will be accelerated by 1.5% due to institutional quality and 9.92% assistance from tourism development. However, the short-run effects from the institutional quality and tourism on FDI volatility are statistically insignificant.

4.4. Asymmetric Long-Run and Short-Run Effects Estimation

In the following section, the study investigates the potential asymmetric association between institutional quality, tourism, and FDI by following a nonlinear framework introduced by shin. Using the nonlinear equation (see Equation (24)), we performed nine [09} empirical models based on three proxy variables measuring FDI and the combined presence of independent variables in the equation. The results of nonlinear ARDL are presented in Table 13, consisting of long-run effects displayed in Panel-A, short-run coefficient inserted in Panel-B, and the result of the Wald test for assessing symmetry reported in Panel-C, respectively.
Referring to Panel-C, the results of the Wald test with the null hypothesis of both long-run and short-run symmetry. It is observable that the test statistics of the Wald test are statistically significant at a 1% level of significance that means asymmetric effects running from institutional quality and tourism towards FDI. These conclusions are applicable for all nine (09) tested empirical models.
Now, we analyze the potential effect and their association (see, Panel-A). The results are reported in columns (1) to (3), where FDI inflows as a percentage of GDP are treated as a dependent variable. Positive shocks in institution quality (a coefficient of 0.066 in column (1) and a coefficient of 0.131 in column 3) and negative shocks in institution quality (a coefficient of 0.046 in column (1) and a coefficient of 0.361 in column (3)) positively linked with inflows of FDI. The study findings suggest that both positive and negative shocks in institutional quality and tourism are critical for inflows of FDI in the long run. However, the possessions of negative shocks are greater than the positive shocks in both variables.
On the other hand, observing the positive and negative shocks in tourism see, Column (2) and (3) we observed, see in column (2), that is, the positive (a coefficient of 0.161) and negative shocks (a coefficient of 0.909) and the results in column (3) positive shock (a coefficient of 0.877) and negative (a coefficient of 0.877), positive association with FDI. The study findings suggest that tourism recipients’ increase or decrease will be critical for maintaining stability in FDI inflows in the long run. It is important to maintain the present state and put considerable effort into further development because any possible degradation might produce unwell full consequences.
Referring to the results exhibited in columns (4)–(6), FDI stock was treated as a dependent variable in the equation. In the long run, see column (6), positive shocks in institutional quality is positively linked (a coefficient of 0.253) with FDI stock, but negative shocks exhibit negative association (a coefficient of 0.021). These findings suggested that FDI stock inflows could be accelerated by adopting positive and negative institutional quality changes. However, the elasticity of positive innovation is greater than negative; therefore, policy formulation should understand the fact and do accordingly. In contrast, positive (a coefficient of 0.033) and negative (a coefficient of 0.881) shock in tourism disclosed a positive linkage with FDI stock. However, the negative shocks produce greater intensity than positive shocks in tourism. It refers that any deviation in tourism activities adversely affected the trend of FDI stock inflows in the economy.
Considering the model output displayed in columns (7)–(9), FDI volatility was treated as a dependent variable. In the long run, positive and negative shocks in institutional quality (a coefficient of −0.053, −0.651) and tourism (a coefficient of −0.004, −0.792) are negatively associated with FDI volatility, and coefficients are statistically significant. Considering the elasticity of FDI volatility, negative shocks in institutional quality and tourism have a higher impact than positive shocks in variables. More specifically, a 10% variation in negative shocks in institutional quality and tourism will increase FDI volatility by 6.51% and 7.925, respectively. On the other hand, 10% positive shocks in institutional quality and tourism can reduce FDI volatility by 0.531% and 0.04%, respectively. Furthermore, the results reported in columns (7) and (8) also established a negative linkage with FDI volatility in both cases of positive and negative shocks in institutional quality and tourism.
In the short run, the coefficients of error correction terms exhibit negative signs and are statistically significant at a 1% level of significance. These findings suggest long-run convergence between institutional quality, tourism, and inflows of FDI in selected south Asian countries. Furthermore, referring to short-run elasticities, it is observable that positive shocks in institutional quality are positively linked to FDI, that is, a coefficient of 1.068 in column (3), a coefficient of 0.238 in column (6), and a coefficient of 0.042 in column (9) and all the coefficients are statistically significant. At the same time, the coefficients of negative shocks in institutional qualities are statistically insignificant except for FDI volatility (a coefficient of 1.744).
The positive and negative shocks in tourism established a mixed relationship with FDI. Both coefficients posted in column (3) displayed positive linkage with FDI inflows (a coefficient of 2.003 and a coefficient of 0.329). Results posted in column (6), reveal that positive shocks are positively associated (a coefficient of 0.019), and negative shocks are negatively caused (a coefficient of −0.293), and finally, tourism effects on FDI volatility exhibited mixed effects, but all the coefficients are statistically insignificant.

4.5. Causality Analysis with Symmetry

The results of the directional casualty test with symmetry effect from institutional quality and tourism are exhibited in Table 14.
Considering the results reported in Panel-A. The study findings established several causal relationships among research variables. However, we are primarily focusing on investigating casualty between FDI, IQ, and TOR. Regarding the desired causality, study findings established unidirectional causality running from institutional quality to tourism [IQ→TOR]. Furthermore, the feedback hypothesis hold in assessing causality between institutional quality and FDI [IQ←→FDI], and tourism and FDI [TOR←→FDI].
The result is reported in Panel –B, where FDI stock is treated as a proxy for the dependent variable. Similar to Panel-A, study findings established several causal relationships but considering the target relationship, that is, causality between FDI, IQ, and TOR. It has appeared that the Feedback hypothesis hold in explaining the causality between institutional quality and FDI [IQ←→FDI], and tourism and FDI [TOR←→FDI] but neutral effects appeared in the case of institutional quality and tourism [IQ ≠ TOU]. Finally, the causality results are exhibited in Panel-C, with FDI volatility as a dependent variable in the equation. The study findings established unidirectional casualty running form [TOR→ X *], on the other hand, bidirectional causal relationship disclosed between institutional quality and FDI volatility [IQ←→ X *].
In the following section, the causality test results considering asymmetry in institutional quality and tourism are exhibited in Table 15. Panel-A reports the results with FDI inflows as a dependent variable, Panel-B displays the results with FDI stock as dependent variables. Finally, Panel C reports the results with FDI volatility as a dependent variable, respectively. Referring to causality results, it appeared that several directional causalities are available, however focusing on the key motivation of the study, the summary results are exhibited in Table 16.

5. Discussion

Tourism is quickly becoming one of the most important businesses in many nations. It is primarily owing to its significant contribution to foreign exchange inflows, national income, and job possibilities, all of which have a significant economic effect on the individual nations. Refers to tourism-led foreign capital investment, the study documented a positive statistically significant association that is tourism positively assists in increasing the inflows of FDI in the economy. Our study findings align with existing literature see, for instance, Tomohara [31], Samimi, Sadeghi, and Sadeghi [29], and Perić and Radić [32]. Salleh, Othman, and Sarmidi [40] investigated the impact of tourism development on FDI inflows in the south Asian economy by employing ARDL. The study documented the long-run association between tourism development and growth in FDI. Moreover, the causality test established unidirectional causality running from tourism to FDI. The study of Siddiqui and Siddiqui [37] revealed unidirectional causality between tourism and FDI in Pakistan. The study advocated that effective tourism policy implementation can accelerate foreign capital investment in the economy.
Selvanathan, Selvanathan and Viswanathan [52] investigated the dynamic connection between tourism and FDI in India from 1995–2007 using quarterly statistical data under VAR estimation. The results indicated a unidirectional causal relationship between FDI and tourism and advocated that FDI attraction accelerated the development of foreign tourism in India’s economy during the past decade. Khoshnevis Yazdi, Homa Salehi, and Soheilzad [46] established that foreign direct investment substantially affects tourist development in developing nations’ economies. Inbound tourism generates export income, but it also creates jobs in the service sector via FDI because of tourist-related investment. Thus, to promote inbound tourism, it is necessary first to determine the nature of the connection between inbound tourism and FDI, as well as whether inward FDI flows only to tourism-related sectors, before formulating a more effective strategy based on the degree of correlation.
The growing interest in institutional and political development economics issues has resulted in detailed research on the factors influencing institutional quality [160]. The current study investigated the nexus of institutional quality-led tourism and exposed positive connections in empirical assessment, which is in line with Delgado and McCloud [161], Kim and Choi [162], Qamruzzaman, Tayachi, Mehta, and Ali [18]. Because of good institutional quality, the foreign direct investment (FDI) inflows are strong, and foreign direct investment (FDI) volatility is low. On the other side, there are drivers of FDI outflows that are detrimental, such as corruption and institutional distance between the home and host nations. Quality institutions augmented inflows of FDI in the economy in three different manners. First, strong institutions improve productivity potential, which may attract international investment. Second, a dysfunctional institutional framework may drive up the cost of conducting business. For instance, corruption may discourage investment by increasing the cost of conducting business [163]. Third, FDI is subject to uncertainty, particularly uncertainty caused by inefficient governance, since it entails a large sunk cost. For instance, imprecise contract enforcement may raise uncertainty about future rewards, thus discouraging investment from foreign soil.

6. Conclusions

The prominent role of FDI is extensively investigated in empirical studies and the key determinants for accelerating the inflows of FDI, especially for developing countries. The motivation of the study is to unleash the fresh evidence regarding the nexus between institutional quality, tourism, and FDI in BIMSTEC nations during the period 1996Q1–2018Q4. Several econometric methodologies were applied including, panel–ARDL, CS-ARDL, Nonlinear-ARDL, and directional casualty investigated following Toda and Yamamoto [21] with the incorporation of both symmetry and asymmetry effects of institutional quality and tourism. The key findings of this study are reported below:
First, the study began with established variables order of integration by applying both first and second-generation panel unit root tests. The study established mixed order integration, that is, few variables are integrated at a level, and few become stationary after the first difference. Furthermore, a cross-sectional dependency test confirmed the presence of common dynamism among the selected variables.
Second, the study findings with Panel-ADRL confirmed the long-run positive association between institutional qualities, tourism, and inflows of FDI. The study findings suggest that further development in institutional quality and tourism activities will result in a positive way in the economy that induces foreign investors and increase possibilities for receiving additional FDI. These studies’ findings are in line with Turan Katircioglu et al. [33]; Perić and Radić [32]; Khoshnevis Yazdi, Nateghian and Sheikh Rezaie [67]; Buchanan, Le, and Rishi [19]; Jushi et al. [164]. About CS-ARDL, the study findings also ascertain positive relations between institutional quality, tourism, and inflows of FDI in BIMSTEC nations, especially in the long run. In respective studies, Alfaro et al. [165] and Bénassy-Quéré, Coupet, and Mayer [103] have argued that the investors prefer to locate the environments of cases where property rights are well protected and the actors are the least corrupt as well that they require a high degree of political stability. Considering an empirical model with FDI stocks and FDI volatility as a dependent variable, the study findings revealed positive effects from the institutional quality and tourism towards FDI stock and negative impact towards FDI volatility, especially in the long run. These findings are applicable in both empirical models under panel-ARDL and CS-ARDL.
Third, the study findings with the nonlinear framework of assessing the asymmetric effects, i.e., positive and negative shocks in institutional quality and tourism on FDI. Referring to the results of the Wald test to establish possible asymmetric effects on both the long run and short run. The study findings revealed a long-run asymmetric relationship between institution quality, tourism, and FID, which applies to all models. These findings suggest that in the long run, the movement of the effects of each variable might not experience by other variables in the linear form, i.e., increasing independent variables may not result in the same progress in the dependent variable.
Fourth, the results of directional causality among research variables with symmetry and asymmetry effects of institutional quality and tourism in the equation. Concerning the traditional casualty test, i.e., symmetric framework, the study findings hold a feedback hypothesis explaining the relationship between institutional quality, tourism, and FDI. The study findings support existing empirical literature including, Chowdhury and Mavrotas [98]; Shah, Ahmad and Ahmed [77]; Arain, Han, Sharif, and Meo [43]. Furthermore, causality tests with the asymmetry of institutional quality and tourism. We observed that the feedback hypothesis explains the casualty between negative shocks in institutional quality and tourism and inflows of FDI and FDI stock. However, unidirectional causality is also revealed i.e., FDI inflows to positive shocks in institutional quality and positive shocks in institutional quality to FDI stock. On the other hand, referring to the asymmetry effect of tourism and FDI, findings divulged unidirectional causality running from FDI to positive shocks in tourism and feedback hypothesis is established between a negative shock in tourism and inflows of FDI.
Understanding the study findings, we also proposed the following policy recommendations for future guidance. First, institutional quality tourism emerged as a strategically critical factor for the economy, especially the decision about FDI. Policy formulation, therefore, and the promotional, strategic decision-making process by the government and private institutions have to put considerable attention on the present state of institutional quality and tourism in respective countries. Second, countries should use financial and tax incentives, as well as attractive rates to attract FDI. Reducing complex procedures (bureaucracy) and defining clear FDI policies in tourism is an important part of the process. Local authorities can also help indirectly to promote FDI by providing basic infrastructures free of cost to the investor.
The present study possesses certain limitations in terms of data aggregation and economical estimation. For institutional quality, the study considered an index derived from WGI information. Nonetheless, taking other measures might produce diverse findings. Inclusion of other variables such as Human capital development, economic policy uncertainty, and financial volatility can robust the estimation and bring another angle in empirical relationships.

Author Contributions

Conceptualization, Y.Y. and M.Q.; Data curation, Y.Y. and M.Q.; Formal analysis, M.Z.R. and S.K.; Funding acquisition, M.Q.; Methodology, Y.Y. and M.Z.R.; Writing–original draft, M.Q., M.Z.R. and S.K.; Writing–review & editing, Y.Y., M.Q., M.Z.R. and S.K. All authors have read and agreed to the published version of the manuscript.

Funding

This research received no external funding.

Institutional Review Board Statement

Not applicable.

Informed Consent Statement

Not applicable.

Data Availability Statement

Att the data used in the study are available in public domin sucs as World Developent Indicator, International financial statistis.

Acknowledgments

We would like to thank the three anonymous reviewers for the critical and constructive suggestions, and due to so, we finally revised and reconstructed entire manuscripts. Furthermore, we are also grateful to the editor-in-chief and assistant editor for their kind consideration during the revision process. Furthermore, we would like to give our sincere gratitude to Amra Sabic-El-Rayess, Alex Eble, and Judith Scott-Clayton. With extraordinary patience and consistent encouragement, they gave us great help by providing the necessary materials, advice of great value, and inspiration of new ideas during study at Teachers College, Columbia University.

Conflicts of Interest

The authors declare no conflict of interest.

References

  1. Quazi, R. Economic freedom and foreign direct investment in East Asia. J. Asia Pacific Econ. 2007, 12, 329–344. [Google Scholar] [CrossRef]
  2. Blomstrom, M.; Lipsey, R.E.; Zejan, M. What explains the growth of developing countries? Converg. Prod. Cross Nat. Stud. Histor. Evid. 1994, 9, 243–259. [Google Scholar]
  3. Ajayi, S.I. FDI and Economic Development in Africa; ADB/AERC International: New York, NY, USA, 2006. [Google Scholar]
  4. Agbloyor, E.K.; Abor, J.; Adjasi, C.K.D.; Yawson, A. Exploring the causality links between financial markets and foreign direct investment in Africa. Res. Int. Bus. Financ. 2013, 28, 118–134. [Google Scholar] [CrossRef]
  5. Soumaré, I.; Tchana Tchana, F. Causality between FDI and financial market development: Evidence from emerging markets. World Bank Econ. Rev. 2015, 29, S205–S216. [Google Scholar] [CrossRef] [Green Version]
  6. Tsagkanos, A.; Siriopoulos, C.; Vartholomatou, K. Foreign direct investment and stock market development. J. Econ. Stud. 2019, 26, 178–185. [Google Scholar] [CrossRef]
  7. Noorbakhsh, F.; Paloni, A.; Youssef, A. Human capital and FDI inflows to developing countries: New empirical evidence. World Dev. 2001, 29, 1593–1610. [Google Scholar] [CrossRef]
  8. Blomstrom, M.; Kokko, A. Human Capital and Inward FDI; Centre for Economic Policy Research: London, UK, 2003. [Google Scholar]
  9. Dorozynska, A.; Dorozynski, T. Human capital and FDI in central and eastern europe. Manag. Glob. Transit. 2015, 13, 151. [Google Scholar]
  10. Greenberg, J.; Mollick, E. Leaning in or leaning on? Gender, homophily, and activism in crowdfunding (SSRN Working Paper No. 2462254). Acad. Manag. Proc. 2015. Available online: https://repository.upenn.edu/cgi/viewcontent.cgi?article=1294&context=mgmt_papers (accessed on 3 September 2021). [CrossRef]
  11. Crotti, S.; Cavoli, T.; Wilson, J.K. The impact of trade and investment agreements on Australia’s inward FDI flows. Aust. Econ. Pap. 2010, 49, 259–275. [Google Scholar] [CrossRef]
  12. Chung, K. Foreign debt, foreign direct investment and volatility. Int. Econ. J. 2010, 24, 171–196. [Google Scholar] [CrossRef]
  13. Kosekahyaoglu, L. A comparative analysis of FDI in Turkey and the CEECs: Is there any link between FDI and trade? J. Bus. Econ. Manag. 2006, 7, 183–200. [Google Scholar] [CrossRef] [Green Version]
  14. De Angelo, C.F.; Eunni, R.V.; Fouto, N.M.M.D. Determinants of FDI in emerging markets: Evidence from Brazil. Int. J. Commer. Manag. 2010, 20, 203–216. [Google Scholar] [CrossRef]
  15. Liargovas, P.G.; Skandalis, K.S. Foreign direct investment and trade openness: The case of developing economies. Soc. Indic. Res. 2012, 106, 323–331. [Google Scholar] [CrossRef]
  16. Singhania, M.; Gupta, A. Determinants of foreign direct investment in India. J. Int. Trade Law Policy 2011, 10, 64–82. [Google Scholar] [CrossRef]
  17. Anyanwu, J.C.; Yameogo, N.D. What drives foreign direct investments into West Africa? An empirical investigation. Afr. Dev. Rev. 2015, 27, 199–215. [Google Scholar] [CrossRef]
  18. Qamruzzaman, M.; Tayachi, T.; Mehta, A.M.; Ali, M. Do international capital flows, institutional quality matter for innovation output: The mediating role of economic policy uncertainty. J. Open Innov. Technol. Market Complex. 2021, 7, 141. [Google Scholar] [CrossRef]
  19. Buchanan, B.G.; Le, Q.V.; Rishi, M. Foreign direct investment and institutional quality: Some empirical evidence. Int. Rev. Financ. Anal. 2012, 21, 81–89. [Google Scholar] [CrossRef]
  20. Shin, Y.; Yu, B.; Greenwood-Nimmo, M. Modelling asymmetric cointegration and dynamic multipliers in a nonlinear ARDL framework. In Festschrift in Honor of Peter Schmidt; Springer: Berlin, Germany, 2014; pp. 281–314. [Google Scholar]
  21. Toda, H.Y.; Yamamoto, T. Statistical inference in vector autoregressions with possibly integrated processes. J. Econom. 1995, 66, 225–250. [Google Scholar] [CrossRef]
  22. Fauzel, S. FDI and tourism futures: A dynamic investigation for a panel of small island economies. J. Tour. Futures 2021, 7, 98–110. [Google Scholar] [CrossRef]
  23. Jena, N.R.; Sethi, N. Foreign capital and growth nexus revisited: Empirical evidence from South Asian countries. Transnat. Corp. Rev. 2021, 13, 269–292. [Google Scholar] [CrossRef]
  24. Sokhanvar, A. Does foreign direct investment accelerate tourism and economic growth within Europe? Tour. Manag. Perspect. 2019, 29, 86–96. [Google Scholar] [CrossRef]
  25. Fereidouni, H.G.; Al-mulali, U. The interaction between tourism and FDI in real estate in OECD countries. Curr. Issues Tour. 2014, 17, 105–113. [Google Scholar] [CrossRef]
  26. Udemba, E.N. Triangular nexus between foreign direct investment, international tourism, and energy consumption in the Chinese economy: Accounting for environmental quality. Environ. Sci. Pollut. Res. 2019, 26, 24819–24830. [Google Scholar] [CrossRef]
  27. Lea, J. Tourism and Development in the Third World; Routledge: London, UK, 2006. [Google Scholar]
  28. Schroenn, J.; Tecle, Y. The contribution of HRD to tourism-led development in an African context: Economics. S. Afr. J. Econ. Manag. Sci. 2006, 9, 444–457. [Google Scholar]
  29. Samimi, A.J.; Sadeghi, S.; Sadeghi, S. The relationship between foreign direct investment and tourism development: Evidence from developing countries. Inst. Econ. 2017, 5, 59–68. [Google Scholar]
  30. Sinclair, M.; Stabler, M. The Economics of Tourism, Advances in Tourism; Routledge: London, UK; New York, NY, USA, 2002. [Google Scholar]
  31. Tomohara, A. Japan’s tourism-led foreign direct investment inflows: An empirical study. Econ. Model. 2016, 52, 435–441. [Google Scholar] [CrossRef]
  32. Perić, J.; Radić, M.N. FDI-led tourism growth hypothesis: Empirical evidence from Croatian tourism. Eur. J. Tour. Hospital. Recreat. 2016, 7, 168–175. [Google Scholar] [CrossRef] [Green Version]
  33. Katircioglu, S.T.; Kahyalar, N.; Benar, H. Financial Development, Trade and Growth Triangle: The Case of India. Int. J. Soc. Econ. 2007, 45, 586–598. [Google Scholar]
  34. Kaur, H.; Sarin, V. Causality relationship between GDP, FDI, tourism: Empirical evidence from India. Int. J. Appl. Bus. Econ. Res. 2016, 14, 247–255. [Google Scholar]
  35. Vorley, B. Risks and opportunities in attracting foreign direct investment in the agrifood sector: The case of supermarkets. In Responsible Enterprise, Foreign Direct Investment and Investment Promotion: Key Issues in Attracting Investment for Sustainable Development; International Institute for Environment and Development, JSTOR: New York, NY, USA, 2008; p. 53. [Google Scholar]
  36. Ivanovic, Z.; Baresa, S.; Bogdan, S. Influence of FDI on tourism in Crostia. UTMS J. Econ. 2011, 2, 21–28. [Google Scholar]
  37. Siddiqui, F.; Siddiqui, D.A. Causality between Tourism and Foreign Direct Investment: An Empirical Evidence from Pakistan. Asian J. Econ. Modell. 2019, 7, 27–44. [Google Scholar] [CrossRef] [Green Version]
  38. Arain, H.; Sharif, A.; Akbar, B.; Younis, M.Y. Dynamic connection between inward foreign direct investment, renewable energy, economic growth and carbon emission in China: Evidence from partial and multiple wavelet coherence. Environ. Sci. Pollut. Res. 2020, 27, 40456–40474. [Google Scholar] [CrossRef] [PubMed]
  39. Satrovic, E. Financial development and human capital in Turkey: ARDL approach. Kapadokya Akad. Bakış 2017, 1, 1–15. [Google Scholar]
  40. Salleh, N.H.M.; Othman, R.; Sarmidi, T. An analysis of the relationships between tourism development and foreign direct investment: An empirical study in elected major Asian countries. Int. J. Bus. Soc. Sci. 2011, 2, 17. [Google Scholar]
  41. Khoshnevis Yazdi, S.; Shakouri, B. The effect of renewable energy and urbanization on CO2 emissions: A panel data. Energy Sour. Part B Econ. Plann. Policy 2018, 13, 121–127. [Google Scholar] [CrossRef]
  42. Chang, S.-C.; Chang, H.-F. Same Trade Openness Yet Different Environmental Quality—But Why? J. Int. Commer. Econ. Policy 2020, 11, 2050002. [Google Scholar] [CrossRef]
  43. Arain, H.; Han, L.; Sharif, A.; Meo, M.S. Investigating the effect of inbound tourism on FDI: The importance of quantile estimations. Tour. Econ. 2019, 26, 682–703. [Google Scholar] [CrossRef]
  44. Katircioglu, S. The Bounds Test to the Level Relationship and Causality Between Foreign Direct Investment and International Tourism: The Case of Turkey; University of West Bohemia: Plzeň, Chech Republic, 2011. [Google Scholar]
  45. Satrovic, E.; Muslija, A. Foreign direct investments and tourism: Empirical evidence from Turkey. In Proceedings of the ICPESS (International Congress on Politic, Economic and Social Studies), Istanbul, Turkey, 9–11 November 2017. [Google Scholar]
  46. Khoshnevis Yazdi, S.; Homa Salehi, K.; Soheilzad, M. The relationship between tourism, foreign direct investment and economic growth: Evidence from Iran. Curr. Issues Tour. 2017, 20, 15–26. [Google Scholar] [CrossRef]
  47. Sanford, D.M., Jr.; Dong, H. Investment in familiar territory: Tourism and new foreign direct investment. Tour. Econ. 2000, 6, 205–219. [Google Scholar] [CrossRef]
  48. Tiwari, A.K. Tourism, Exports and FDI as a Means of Growth: Evidence from four Asian Countries. Rom. Econ. J. 2011, 14, 40. [Google Scholar]
  49. Muckley, C.B. Terrorism, Tourism and FDI: Estimating a Lower Bound on the Peace Dividend in Northern Ireland; University College Dublin: Dublin, Ireland, 2010. [Google Scholar]
  50. Buckley, P.; Geyikdagi, N.V. Explaining foreign direct investment in Turkey’s tourism industry. Transnat. Corp. 1996, 5, 99–110. [Google Scholar]
  51. Ma, X.; Wang, Y.; Song, H.; Liu, H. Time-varying mechanisms between foreign direct investment and tourism development under the new normal in China. Tour. Econ. 2020, 26, 324–343. [Google Scholar] [CrossRef]
  52. Selvanathan, S.; Selvanathan, E.A.; Viswanathan, B. Causality between foreign direct investment and tourism: Empirical evidence from India. Tour. Anal. 2012, 17, 91–98. [Google Scholar] [CrossRef] [Green Version]
  53. Ravinthirakumaran, K.; Selvanathan, E.; Selvanathan, S.; Singh, T. Tourism and Foreign Direct Investment Inflows in Sri Lanka. South Asia Econ. J. 2019, 20, 248–273. [Google Scholar] [CrossRef]
  54. Subbarao, P.S. A Study on Foreign Direct Investment (FDI) in Indian Tourism; IIMK: Kerala, India, 2008. [Google Scholar]
  55. Van Parys, S.; James, S. The Effectiveness of Tax Incentives in Attracting FDI: Evidence from the Tourism Sector in the Caribbean; Universiteit Ghent: Ghent, Belgium, 2010. [Google Scholar]
  56. Perić, J.; Radıć, M.N. Tourism productivity and tourism FDI in Croatia. Mediterr. J. Soc. Sci. 2015, 6, 425. [Google Scholar] [CrossRef]
  57. Bezuidenhout, H.; Grater, S. The Dimensions of FDI in the Tourism Sector in Africa; North-West University: Potchefstroom, Africa, 2016. [Google Scholar]
  58. Chen, X. The Influence of FDI on China’s Tourism Industry; Auckland University of Technology: Auckland, New Zeland, 2010. [Google Scholar]
  59. Sharma, A.; Johri, A.; Chauhan, A. FDI: An instrument of economic growth & development in tourism industry. Int. J. Sci. Res. Publ. 2012, 2, 1–6. [Google Scholar]
  60. Simatupang, P.; Chik, A.R. FDI in Tourism Sector and Economic Growth in Sumatra Utara. Winners 2014, 15, 150–158. [Google Scholar] [CrossRef] [Green Version]
  61. Willem te Velde, D.; Nair, S. Foreign direct investment, services trade negotiations and development: The case of tourism in the Caribbean. Dev. Policy Rev. 2006, 24, 437–454. [Google Scholar] [CrossRef]
  62. Daly, M.T.; Stimson, R.J.; Jenkins, O. Tourism and foreign investment in Australia: Trends, prospects and policy implications. Aust. Geogr. Stud. 1996, 34, 169–184. [Google Scholar] [CrossRef]
  63. Barrowclough, D. Foreign investment in tourism and small island developing states. Tour. Econ. 2007, 13, 615–638. [Google Scholar] [CrossRef]
  64. Peric, J.; Niksic Radic, M. Sustainable foreign direct investment in tourism sector of developing countries. Tour. South East Eur. 2011, 2011, 263–278. [Google Scholar]
  65. Işik, C. Foreign direct investment in tourism: Panel data analysis of D7 countries. Athens J. Tour. 2015, 2, 93–103. [Google Scholar] [CrossRef]
  66. Fortanier, F.; Van Wijk, J. Sustainable tourism industry development in sub-Saharan Africa: Consequences of foreign hotels for local employment. Int. Bus. Rev. 2010, 19, 191–205. [Google Scholar] [CrossRef]
  67. Khoshnevis Yazdi, S.; Nateghian, N.; Sheikh Rezaie, N. The causality relationships between tourism development and foreign direct investment: An empirical study in EU countries. J. Pol. Res. Tour. Leisure Events 2017, 9, 247–263. [Google Scholar] [CrossRef]
  68. Fayissa, B.; Nsiah, C.; Tadesse, B. Research note: Tourism and economic growth in Latin American countries–further empirical evidence. Tour. Econ. 2011, 17, 1365–1373. [Google Scholar] [CrossRef]
  69. Phung-Tran, P.; Trang-Le, H. The Granger Causality Relationship between FDI, GDP and International Tourist Arrivals–Empirical evidence from 5 countries. In Proceedings of the Seventh Vietnam Economist Annual Meeting (VEAM 2014), Ho Chi Minh, Vietnam, 7–11 November 2014. [Google Scholar]
  70. Das, R.K.; Chakraborty, J. An evaluative study on tourism in Bangladesh. Dev. Country Stud. 2012, 2, 17–27. [Google Scholar]
  71. Hassan, M.R.; Ullah, M.M.; Chowdhury, M.S.A. Impact of tourism in Bangladesh economy. World J. Soc. Sci. 2013, 3, 228–240. [Google Scholar]
  72. Aktar, M.A.; Sadekin, M.N.; Saha, S.K. Relationship between tourist arrival and foreign exchange earnings: The case for Bangladesh. Mediterr. J. Soc. Sci. 2014, 5, 162. [Google Scholar] [CrossRef] [Green Version]
  73. Chowdhury, M.A.F.; Shahriar, F.M. The impact of tourism in a deficit economy: A conceptual model in Bangladesh perspective. Bus. Intell. J. 2012, 5, 163–168. [Google Scholar]
  74. Bouchoucha, N.; Benammou, S. Does institutional quality matter foreign direct investment? Evidence from African countries. J. Knowl. Econ. 2018, 11, 1–15. [Google Scholar] [CrossRef]
  75. Masron, T.A.; Abdullah, H. Institutional quality as a determinant for FDI inflows: Evidence from ASEAN. World J. Manag. 2010, 2, 115–128. [Google Scholar]
  76. Masron, T.A.; Naseem, N. Institutional quality and foreign direct investment in ASEAN. Inst. Econ. 2017, 9, 5–30. [Google Scholar]
  77. Shah, S.H.; Ahmad, M.H.; Ahmed, Q.M. The nexus between sectoral FDI and institutional quality: Empirical evidence from Pakistan. Appl. Econ. 2016, 48, 1591–1601. [Google Scholar] [CrossRef]
  78. Hall, R.E.; Jones, C.I. Why do some countries produce so much more output per worker than others? Q. J. Econ. 1999, 114, 83–116. [Google Scholar] [CrossRef]
  79. Globerman, S.; Shapiro, D.M. The impact of government policies on foreign direct investment: The Canadian experience. J. Int. Bus. Stud. 1999, 30, 513–532. [Google Scholar] [CrossRef]
  80. Masron, T.A. Relative institutional quality and FDI inflows in ASEAN countries. J. Econ. Stud. 2017, 44, 115–137. [Google Scholar] [CrossRef]
  81. Clarke, G.R. How institutional quality and economic factors impact technological deepening in developing countries. J. Int. Dev. 2001, 13, 1097–1118. [Google Scholar] [CrossRef]
  82. Gastanaga, V.M.; Nugent, J.B.; Pashamova, B. Host country reforms and FDI inflows: How much difference do they make? World Dev. 1998, 26, 1299–1314. [Google Scholar] [CrossRef]
  83. Mody, A.; Srinivasan, K. Japanese and US firms as foreign investors: Do they march to the same tune? Can. J. Econ. 1998, 31, 778–799. [Google Scholar] [CrossRef]
  84. North, D.C. A transaction cost theory of politics. J. Theor. Pol. 1990, 2, 355–367. [Google Scholar] [CrossRef]
  85. Nondo, C.; Kahsai, M.S.; Hailu, Y.G. Does institutional quality matter in foreign direct investment?: Evidence from Sub-Saharan African countries. Afr. J. Econ. Sustain. Dev. 2016, 5, 12–30. [Google Scholar] [CrossRef]
  86. Azam, M.; Khan, H.; Hunjra, A.I.; Ahmad, H.M.; Chani, D.; Irfan, M. Institutional, macro economic policy factors and foreign direct investment: South Asian countries case. Afr. J. Bus. Manag. 2010, 5, 4306–4313. [Google Scholar]
  87. Harms, P.; Ursprung, H.W. Do civil and political repression really boost foreign direct investments? Econ. Inq. 2002, 40, 651–663. [Google Scholar] [CrossRef] [Green Version]
  88. Globerman, S.; Shapiro, D. Global foreign direct investment flows: The role of governance infrastructure. World Dev. 2002, 30, 1899–1919. [Google Scholar] [CrossRef]
  89. Michael, P.; Nobay, A.R.; Peel, D.A. Transactions costs and nonlinear adjustment in real exchange rates: An empirical investigation. J. Pol. Econ. 1997, 105, 862–879. [Google Scholar] [CrossRef]
  90. Haile, G.A.; Assefa, H. Determinants of Foreign Direct Investment in Ethiopia: A time-series analysis. In Proceedings of the 4th International Conference on the Ethiopian Economy, Addis Ababa, Ethiopia, 10–12 June 2006. [Google Scholar]
  91. Ramirez, M.D. Economic and institutional determinants of foreign direct investment in Chile: A time-series analysis, 1960–2001. Contemp. Econ. Pol. 2006, 24, 459. [Google Scholar] [CrossRef]
  92. Nasrin, S.; Baskaran, A.; Muchie, M. Major determinants and hindrances of FDI inflow in Bangladesh: Perceptions and experiences of foreign investors and policy makers. In Proceedings of the GLOBELICS—8th International Conference. Making Innovation Work for Society: Linking, Leveraging and Learning, Kuala Lumpur, Malaysia, 1–3 November 2010; pp. 1–3. [Google Scholar]
  93. Esew, N.G.; Yaroson, E. Institutional quality and foreign direct investment (FDI) in Nigeria: A prognosis. IOSR J. Human. Soc. Sci. 2014, 19, 37–45. [Google Scholar] [CrossRef]
  94. Fadhil, M.A.; Almsafir, M.K. The Role of FDI Inflows in Economic Growth in Malaysia (Time Series: 1975–2010). Proc. Econ. Financ. 2015, 23, 1558–1566. [Google Scholar] [CrossRef] [Green Version]
  95. Nguyen, T.V.H.; Cao, T.H.V. The Impact of Institutional Quality on Foreign Direct Investment (FDI) Inflows to Vietnam. EADN Working Pap. 2015, 86, 28. [Google Scholar]
  96. Hussain, M.E.; Haque, M. Foreign direct investment, trade, and economic growth: An empirical analysis of Bangladesh. Economies 2016, 4, 7. [Google Scholar] [CrossRef] [Green Version]
  97. Mahmood, H. An investigation of macroeconomic determinants of FDI inflows in Bangladesh. Acad. Account. Financ. Stud. J. 2018, 22, 1–7. [Google Scholar]
  98. Chowdhury, A.; Mavrotas, G. FDI and growth: What causes what? World Econ. 2006, 29, 9–19. [Google Scholar] [CrossRef]
  99. Busse, M.; Hefeker, C. Political risk, institutions and foreign direct investment. Eur. J. Pol. Econ. 2007, 23, 397–415. [Google Scholar] [CrossRef] [Green Version]
  100. Hyun, H.J. Quality of institutions and foreign direct investment in developing countries: Causality tests for cross-country panels. J. Bus. Econ. Manag. 2006, 7, 103–110. [Google Scholar] [CrossRef] [Green Version]
  101. Mina, W. The location determinants of FDI in the GCC countries. J. Multinat. Financ. Manag. 2007, 17, 336–348. [Google Scholar] [CrossRef]
  102. Kostevc, Č.; Redek, T.; Sušjan, A. Foreign direct investment and institutional environment in transition economies. Transit. Stud. Rev. 2007, 14, 40–54. [Google Scholar] [CrossRef]
  103. Bénassy-Quéré, A.; Coupet, M.; Mayer, T. Institutional determinants of foreign direct investment. World Econ. 2007, 30, 764–782. [Google Scholar] [CrossRef]
  104. Daude, C.; Stein, E. The quality of institutions and foreign direct investment. Econ. Pol. 2007, 19, 317–344. [Google Scholar] [CrossRef]
  105. Rose-Ackerman, S.; Tobin, J. Foreign direct investment and the business environment in developing countries: The impact of bilateral investment treaties. Yale Law Econ. Res. Pap. 2005, 293, 52. [Google Scholar] [CrossRef] [Green Version]
  106. Hattari, R.; Rajan, R.S. Understanding bilateral FDI flows in developing Asia. Asian Pac. Econ. Lit. 2009, 23, 73–93. [Google Scholar] [CrossRef]
  107. Ali, F.A.; Fiess, N.; MacDonald, R. Do institutions matter for foreign direct investment? Open Econ. Rev. 2010, 21, 201–219. [Google Scholar] [CrossRef]
  108. Shahadan, F.; Sarmidi, T.; Faizi, F.J. Relationships between doing business indexes and FDI net inflows: Empirical evidence from six Asian countries (Afghanistan, Bangladesh, India, Iran, Pakistan and Sri Lanka). Persidang. Kebangs. Ekon. Malays. 2014, 9, 609–625. [Google Scholar]
  109. Fukumi, A.; Nishijima, S. Institutional quality and foreign direct investment in Latin America and the Caribbean. Appl. Econ. 2010, 42, 1857–1864. [Google Scholar] [CrossRef] [Green Version]
  110. Bissoon, O. Can better institutions attract more foreign direct investment (FDI)? Evidence from developing countries. In Proceedings of the International Conference on Applied Economics, Perugia, Italy, 7 October 2011; pp. 59–70. [Google Scholar]
  111. Tun, Y.-L.; Azman-Saini, W.; Law, S.-H. International evidence on the link between foreign direct investment and institutional quality. Eng. Econ. 2012, 23, 379–386. [Google Scholar] [CrossRef] [Green Version]
  112. Asiedu, E. Foreign Direct Investment, Natural Resources and Institutions; International Growth Centre: London, UK, 2013. [Google Scholar]
  113. Dang, D.A. How foreign direct investment promote institutional quality: Evidence from Vietnam. J. Comp. Econ. 2013, 41, 1054–1072. [Google Scholar] [CrossRef]
  114. Fiodendji, D. Do Institutions Quality Affect FDI Inflows in Sub Saharan African Countries? MPRA: 2013. Available online: https://mpra.ub.uni-muenchen.de/57414/ (accessed on 3 September 2021).
  115. Cristina, J.; Levieuge, G. Growth Effect of FDI in Developing Economies: The Role of Institutional Quality; Orleans Economics Laboratory/Laboratoire d’Economie d’Orleans LEO: Orleans, LA, USA, 2013. [Google Scholar]
  116. Masron, T.A.; Nor, E. FDI in ASEAN-8: Does institutional quality matter? Appl. Econ. Lett. 2013, 20, 186–189. [Google Scholar] [CrossRef]
  117. Herrera-Echeverri, H.; Haar, J.; Estévez-Bretón, J.B. Foreign direct investment, institutional quality, economic freedom and entrepreneurship in emerging markets. J. Bus. Res. 2014, 67, 1921–1932. [Google Scholar] [CrossRef] [Green Version]
  118. Jude, C.; Levieuge, G. Growth Effect of FDI in Developing Economies: The Role of Institutional Quality; SSRN: Rochester, NY, USA, 2015. [Google Scholar]
  119. Asamoah, M.E.; Adjasi, C.K.; Alhassan, A.L. Macroeconomic uncertainty, foreign direct investment and institutional quality: Evidence from Sub-Saharan Africa. Econ. Syst. 2016, 40, 612–621. [Google Scholar] [CrossRef]
  120. Kurul, Z.; Yalta, A.Y. Relationship between institutional factors and FDI flows in developing countries: New evidence from dynamic panel estimation. Economies 2017, 5, 17. [Google Scholar] [CrossRef] [Green Version]
  121. Kurul, Z. Nonlinear relationship between institutional factors and FDI flows: Dynamic panel threshold analysis. Int. Rev. Econ. Financ. 2017, 48, 148–160. [Google Scholar] [CrossRef]
  122. Jude, C.; Levieuge, G. Growth effect of foreign direct investment in developing economies: The role of institutional quality. World Econ. 2017, 40, 715–742. [Google Scholar] [CrossRef]
  123. Bokpin, G.A.; Mensah, L.; Asamoah, M.E. Legal source, institutional quality and FDI flows in Africa. Int. J. Law Manag. 2017, 59, 687–698. [Google Scholar] [CrossRef]
  124. Aziz, O.G. Institutional quality and FDI inflows in Arab economies. Financ. Res. Lett. 2018, 25, 111–123. [Google Scholar] [CrossRef]
  125. Van Bon, N. Effects of Institutional Quality on FDI in Provinces of Vietnam: Empirical Evidence Based on Differenced Panel GMM. J. Econ. Dev. 2019, 22, 26–45. [Google Scholar] [CrossRef]
  126. Uysal, M.; Crompton, J.L. Determinants of demand for international tourist flows to Turkey. Tour. Manag. 1984, 5, 288–297. [Google Scholar] [CrossRef]
  127. Akal, M. Forecasting Turkey’s tourism revenues by ARMAX model. Tour. Manag. 2004, 25, 565–580. [Google Scholar] [CrossRef]
  128. Shoaib, M.; Siddiqui, I.; Amir, Y.M.; Rehman, S.U. Evaluation of wind power potential in Baburband (Pakistan) using Weibull distribution function. Renew. Sustain. Energy Rev. 2017, 70, 1343–1351. [Google Scholar] [CrossRef]
  129. Aizenman, J.; Spiegel, M.M. Institutional efficiency, monitoring costs and the investment share of FDI. Rev. Intern. Econ. 2006, 14, 683–697. [Google Scholar] [CrossRef]
  130. Levchenko, A.A. Institutional Quality and International Trade. Rev. Econ. Stud. 2007, 74, 791–819. [Google Scholar] [CrossRef]
  131. Habib, M.; Zurawicki, L. Corruption and foreign direct investment. J. Int. Bus. Stud. 2002, 33, 291–307. [Google Scholar] [CrossRef]
  132. Wijeweera, A.; Dollery, B. Host country corruption level and Foreign Direct Investments inflows. Int. J. Trade Glob. Markets 2009, 2, 168–178. [Google Scholar] [CrossRef]
  133. Kaufmann, D.; Kraay, A.; Mastruzzi, M. Governance indicators for 2000–2008, the worldwide governance indicators (WGI) project. World Bank Pol. Res. 2010, 7. Available online: http://info.worldbank.org/governance/wgi/pdf/wgi.pdf (accessed on 3 September 2021).
  134. Le, T.-H.; Kim, J.; Lee, M. Institutional quality, trade openness, and financial sector development in Asia: An empirical investigation. Emerg. Markets Financ. Trade 2016, 52, 1047–1059. [Google Scholar] [CrossRef] [Green Version]
  135. Asamoah, M.E.; Alagidede, I.P. Foreign direct investment, real sector growth and financial development. Int. J. Finan. Econ. 2021. Available online: https://0-onlinelibrary-wiley-com.brum.beds.ac.uk/doi/10.1002/ijfe.2440 (accessed on 3 September 2021). [CrossRef]
  136. Carkovic, M.V.; Levine, R. Does Foreign Direct Investment Accelerate Economic Growth? Center for Global Development: Washington, DC, USA, 2002. [Google Scholar]
  137. Hayat, A. Foreign direct investments, institutional quality, and economic growth. J. Int. Trade Econ. Dev. 2019, 28, 561–579. [Google Scholar] [CrossRef]
  138. Breusch, T.S.; Pagan, A.R. The Lagrange multiplier test and its applications to model specification in econometrics. Rev. Econ. Stud. 1980, 47, 239–253. [Google Scholar] [CrossRef]
  139. Pesaran, M.H. General Diagnostic Tests for Cross Section Dependence in Panels; CESifo GmbH: München, Germany, 2004. [Google Scholar]
  140. Pesaran, M.H. Estimation and inference in large heterogeneous panels with a multifactor error structure. Econometrica 2006, 74, 967–1012. [Google Scholar] [CrossRef] [Green Version]
  141. Pesaran, M.H.; Ullah, A.; Yamagata, T. A bias-adjusted LM test of error cross-section independence. Econom. J. 2008, 11, 105–127. [Google Scholar] [CrossRef]
  142. Pesaran, M.H. A simple panel unit root test in the presence of cross-section dependence. J. Appl. Econom. 2007, 22, 265–312. [Google Scholar] [CrossRef] [Green Version]
  143. Jia, Z.; Mehta, A.M.; Qamruzzaman, M.; Ali, M. Economic Policy uncertainty and financial innovation: Is there any affiliation? Front. Psychol. 2021, 12, 1781. [Google Scholar] [CrossRef]
  144. Zhang, Y.; Qamruzzaman, M.; Karim, S.; Jahan, I. Nexus between economic policy uncertainty and renewable energy consumption in BRIC Nations: The mediating role of foreign direct investment and financial development. Energies 2021, 14, 4687. [Google Scholar] [CrossRef]
  145. Qamruzzaman, M.; Wei, J. Do financial inclusion, stock market development attract foreign capital flows in developing economy: A panel data investigation. Q. Financ. Econ. 2019, 3, 88–108. [Google Scholar] [CrossRef]
  146. Pedroni, P. Panel cointegration: Asymptotic and finite sample properties of pooled time series tests with an application to the PPP hypothesis. Econom. Theory 2004, 20, 597–625. [Google Scholar] [CrossRef] [Green Version]
  147. Pedroni, P. Purchasing power parity tests in cointegrated panels. Rev. Econ. Stat. 2001, 83, 727–731. [Google Scholar] [CrossRef] [Green Version]
  148. Kao, C. Spurious regression and residual-based tests for cointegration in panel data. J. Econom. 1999, 90, 1–44. [Google Scholar] [CrossRef]
  149. Westerlund, J. Testing for error correction in panel data. Oxf. Bull. Econ. Stat. 2007, 69, 709–748. [Google Scholar] [CrossRef] [Green Version]
  150. Pesaran, M.H.; Shin, Y.; Smith, R.P. Pooled mean group estimation of dynamic heterogeneous panels. J. Am. Stat. Assoc. 1999, 94, 621–634. [Google Scholar] [CrossRef]
  151. Chudik, A.; Pesaran, M.H. Common correlated effects estimation of heterogeneous dynamic panel data models with weakly exogenous regressors. J. Econom. 2015, 188, 393–420. [Google Scholar] [CrossRef] [Green Version]
  152. Zapata, H.O.; Rambaldi, A.N. Monte Carlo evidence on cointegration and causation. Oxf. Bull. Econ. Stat. 1997, 59, 285–298. [Google Scholar] [CrossRef] [Green Version]
  153. Levin, A.; Lin, C.-F.; Chu, C.-S.J. Unit root tests in panel data: Asymptotic and finite-sample properties. J. Econom. 2002, 108, 1–24. [Google Scholar] [CrossRef]
  154. Im, K.S.; Pesaran, M.H.; Shin, Y. Testing for unit roots in heterogeneous panels. J. Econom. 2003, 115, 53–74. [Google Scholar] [CrossRef]
  155. Breitung, J. The local power of some unit root tests for panel data. In Nonstationary Panels, Panel Cointegration, and Dynamic Panels; Emerald Group Publishing Limited: Bingley, UK, 2001; pp. 161–177. [Google Scholar]
  156. Maddala, G.S.; Wu, S. A comparative study of unit root tests with panel data and a new simple test. Oxf. Bull. Econ. Stat. 1999, 61, 631–652. [Google Scholar] [CrossRef]
  157. Hadri, K. Testing for stationarity in heterogeneous panel data. Econom. J. 2000, 3, 148–161. [Google Scholar] [CrossRef]
  158. Gengenbach, C.; Palm, F.C.; Urbain, J.-P. Panel unit root tests in the presence of cross-sectional dependencies: Comparison and implications for modelling. Econom. Rev. 2009, 29, 111–145. [Google Scholar] [CrossRef] [Green Version]
  159. Dogan, E.; Aslan, A. Exploring the relationship among CO2 emissions, real GDP, energy consumption and tourism in the EU and candidate countries: Evidence from panel models robust to heterogeneity and cross-sectional dependence. Renew. Sustain. Energy Rev. 2017, 77, 239–245. [Google Scholar] [CrossRef]
  160. La Porta, R.; Lopez-de-Silanes, F.; Shleifer, A.; Vishny, R. The quality of government. J. Law Econ. Org. 1999, 15, 222–279. [Google Scholar] [CrossRef]
  161. Delgado, M.S.; McCloud, N. Foreign direct investment and the domestic capital stock: The good–bad role of higher institutional quality. Emp. Econ. 2017, 53, 1587–1637. [Google Scholar] [CrossRef]
  162. Kim, S.; Choi, B. The Impact of the Technological Capability of a Host Country on Inward FDI in OECD Countries: The Moderating Roles of Institutional Quality. Sustainability 2020, 12, 9711. [Google Scholar] [CrossRef]
  163. Qamruzzaman, M.; Jianguo, W. Investigation of the asymmetric relationship between financial innovation, banking sector development, and economic growth. Q. Financ. Econ. 2018, 2, 952–980. [Google Scholar] [CrossRef]
  164. Jushi, E.; Hysa, E.; Cela, A.; Panait, M.; Voica, M.C. Financing Growth through Remittances and Foreign Direct Investment: Evidences from Balkan Countries. J. Risk Financ. Manag. 2021, 14, 117. [Google Scholar] [CrossRef]
  165. Alfaro, L.; Chanda, A.; Kalemli-Ozcan, S.; Sayek, S. Does foreign direct investment promote growth? Exploring the role of financial markets on linkages. J. Develop. Econ. 2010, 91, 242–256. [Google Scholar] [CrossRef]
Figure 1. Conceptual and Hypnotized model for hypothesis testing. H1: AB: FDI granger causes Tourism and vice versa; H2: AB: FDI granger causes Institutional Quality and vice versa; H3: AB: Institutional Quality granger causes C and vice versa; H4: AB: Tourism granger causes Control variables and vice versa; H5: AB: Institutional quality granger causes Tourism and vice versa; H6: AB: FDI granger causes Control variables and vice versa.
Sustainability 13 09989 g001
Table 1. Summary of literature survey.
AuthorTimeCountryMethodologyEffectsCausality
Panel-A: Based on Time series
Perić and Radić [32]2000 to 2012CroatiaVAR, TYC VE+
Arain et al. [43]1995 to 2017China, Russia, Mexico, Spain, and TurkeyGCTVE−←→
Katircioglu [44]1970 to 2005TurkeyARDLVE+T→FDI
Kaur and Sarin [34]1991 to 2014IndiaVAR, GCTVE+
Satrovic and Muslija [45]1995 to 2015TurkeyVAR, GCTVE+←→
Khoshnevis Yazdi et al. [46]1985 to 2013IranGCT, ARDL, VAR, VECMVE+←→
Sanford, Jr. and Dong [47]1988 to 1997USATOBIT ModelVE+
[48]1995 to 2008India, China, Pakistan, RussiaCobb-Douglas production functionVE−
Salleh, Othman and Sarmidi [40]1978 to 2008Malaysia, Singapore, Thailand, China, and Hong KongARDLVE+T←→FDI
Arain, Han, Sharif, and Meo [43]1995 to 2017France, Germany, Italy, the United Kingdom, and the United StatesQQ method, Granger causality testVE+←→
Muckley [49]1970 to 2007Northern IrelandGranger causality testsVE−←→
Vorley [35]1990 to 2006Congo, South Sudan, River Nile, Uganda’s West NileGraphical representationVE+
Ivanovic, Baresa and Bogdan [36]1993 to 2010CroatiaGraphVE+
Siddiqui and Siddiqui [37]1979 to 2017PakistanVAR, MARDL, MVECMVE+
Arain, Han, Sharif, and Meo [43]1995 to 2017France, Germany, Italy, the United Kingdom, and the United StatesQQ method, Granger causality testVE+
Buckley and Geyikdagi [50]1980 to 1994TurkeyTheories and explanation.VE+
Ma et al. [51]1983 to 2017ChinaGranger causality test, TVP-VARVE+←→
Selvanathan et al. [52]1995 to 2007IndiaVARVE+
Ravinthirakumaran et al. [53]1978 to 2015Sri LankaVAR, ARDL, Granger causality testVE+
Subbarao [54]2000 to 2007IndiaBar diagram data representationVE+
Van Parys and James [55]1997 to 2007CaribbeanTheories and explanation.VE+
Perić and Radıć [56]2000 to 2012CroatiaADF testVE+
Bezuidenhout and Grater [57]2003 to 2012AfricaGraphical RepresentationVE+←→
Chen [58]2006 to 2008ChinaGraphical RepresentationVE+
Ivanovic, Baresa and Bogdan [36]1993 to 2009CroatiaBar diagram data representationVE+
Sharma et al. [59]1990 to 2007IndiaData representation and discussionVE+
Simatupang and Chik [60]2006 to 2012Indonesia Sumatra utaraRegression analysisVE+←→
Willem te Velde and Nair [61]1997 to 2003CaribbeanOLS estimatorVE+
DALY et al. [62]1980 to 1993Australia, JapanGraphical representationVE+
Satrovic and Muslija [45]1995 to 2015TurkeyVAR, Granger causality testVE+←→
Category B: Based on Panel data
Fereidouni and Al-mulali [25]1995 to 2009OECD CountriesADF test, Granger cointegration test, Granger causality testVE+←→
Barrowclough [63]200639 Small Island Developing StatesBar diagram representationVE+
Tomohara [31]1996 to 2011Japan ARDL, GMMVE+
Samimi, Sadeghi and Sadeghi [29]1995 to 2008Developing CountriesVECM, PP, ADF VE+←→
Peric and Niksic Radic [64]1995 to 2010Developing CountriesGraphical RepresentationVE+
Işik [65]1980 to 2012D7 CountriesADFVE+
Fortanier and Van Wijk [66]123 hotel sample from 2006Sub-Saharan African countriesRegression analysisVE+
Khoshnevis Yazdi et al. [67]1995 to 2014EU countriesARDL, VAR, ECMVE+
Fayissa et al. [68]1990 to 2005Latin American countriesGMMVE+←→
Sokhanvar [24]1971 to 2010EuropeVAR, ARDLVE−←→
Phung-Tran and Trang-Le [69]1980 to 2012Italy, Spain, Germany, Turkey, and the United KingdomGranger causality analysisn/a
Tomohara [31]1996 to 2011JapanGMMVE+
Category C: Papers based on Bangladesh
Das and Chakraborty [70]2004 to 2010BangladeshGDP Growth RepresentationVE+
Hassan et al. [71]1991 to 2010BangladeshGraphical analysis of GDPVE+
Aktar et al. [72]2004 to 2010BangladeshVARVE+
Chowdhury and Shahriar [73]Fully conceptualBangladeshConceptualVE+
Sources: authors’ accumulation. Note. ←→ for bidirectional causality and ←/→ of unitdirectional causality.
Table 2. Summary of literature survey.
AuthorsLocationTimeMethodologyCausality
Category A: Based on Time series
Haile and Assefa [90]Ethiopia1974–2004ADF test
Ramirez [91]Not specified1960–2001VECM
Nasrin et al. [92]Bangladesh1998–2007GR
Esew and Yaroson [93]Nigeria1980–2011VECM
Fadhil and Almsafir [94]Malaysia1975–2010ADF
Shah, Ahmad, and Ahmed [77]Pakistan1980–2012ARDL←→
Nguyen and Cao [95]Vietnam1996–2011H-Test
Hussain and Haque [96]Bangladesh1973–2014VECM analysis
Mahmood [97]Bangladesh1975–2015ADF←→
Category B: Based on Panel data
Chowdhury and Mavrotas [98]2 countries1969–2000ADF test←→
Busse and Hefeker [99]83 developing1984–2003GMM
Hyun [100]62 developing1984–2003System GMM←→
Mina [101]6 GCC countries1980–2002OLS
Kostevc et al. [102]24 transition economies1995–2002RA
Bénassy-Quéré et al. [103]37 OECD countries1985–2000RA
Daude and Stein [104]34 countries1982–2002OLS
Rose-Ackerman and Tobin [105]63 countries1991–2000RA
Hattari and Rajan [106]24 countries1990–2005RA
Ali et al. [107]69 countries1981–2005RA
Shahadan et al. [108]6 Asian countries2004–2013OLS method
Masron and Abdullah [75]8 ASEAN 1996–2008OLS
Fukumi and Nishijima [109]19 countries 1983–2000OLS
Bissoon [110]45 developing1996–2005OLS
Buchanan Le and Rishi [19]164 countries1996–2006OLS
Tun et al. [111]77 countries1981–2005System GMM
Asiedu [112]99 developing1984–2011System GMM
Dang [113]60 provinces of Vietnam2006–2007OLS, GMM
Fiodendji [114]30 African countries1984–2007ADF
Cristina and Levieuge [115]94 developing1984–2009PSTR
Masron and Nor [116]10 ASEAN countries2002–2010ADF
Herrera-Echeverri et al. [117]87 countries2004–2009RA
Jude and Levieuge [118]94 developing countries1984–2009PSTR Model
Asamoah et al. [119]40 countries 1996–2011ADF Test
Kurul and Yalta [120]113 developing2002–2012OLS method
Kurul [121]126 countries2002–2012System GMM
Jude and Levieuge [122]93 developing1984–2009System GMM
Bokpin et al. [123]49 African countries1980–2011System GMM
Aziz [124]16 Arab countries1984–2012System GMM
Van Bon [125]43 countries2005–2012System GMM
Asiedu [112]99 developing1984–2011System GMM
Source: Authors’ accumulation. Note. ←→ for bidirectional causality and ←/→ of unitdirectional causality.
Table 3. Pair-wise correlation of Institutional quality proxies (WGI).
vpsGERQLCC
v1
ps0.7256521
GE0.5184620.5829311
RQ0.6783910.6406650.735321
L0.7097440.5094990.8794390.7991071
CC0.3387950.7257750.8375520.4925790.7929111
Source: Authors’ estimation.
Table 4. Principle component analysis.
Eigenvalues: (Sum = 6, Average = 1)
CumulativeCumulative
NumberValueDifferenceProportionValueProportion
v2.2524281.1888950.37542.2524280.3754
ps1.0635330.0677490.17733.3159610.5527
GE0.9957840.2130370.16604.3117450.7186
RQ0.7827470.1771020.13055.0944930.8491
L0.6056450.3057820.10095.7001370.9500
CC0.299863-0.05006.0000001.0000
Eigenvectors (loadings):
VariablePC 1PC 2PC 3PC 4PC 5
v0.2685450.557438−0.3600420.689054−0.091162
ps0.568638−0.1205620.254088−0.086339−0.172971
GE0.515108−0.076211−0.212609−0.280558−0.594712
RQ0.392958−0.3010110.5369610.4515780.314848
L0.1461980.7557770.439561−0.4008750.182049
CC0.404239−0.084337−0.528267−0.2727910.689795
Source: Authors’ estimation.
Table 5. Descriptive statistics.
FIFSFVIQTORDIMTOINF
Mean1.6292.1490.602−0.5283.0063.4314.0543.9561.607
Median1.1882.360.317−0.5192.9873.3584.0593.9191.757
Maximum6.8424.1293.3810.4433.1994.2384.8444.9392.768
Minimum−0.191−0.3570.032−1.9432.7472.9372.965−1.787−1.67
Std. Dev.1.4711.1280.6980.5740.1070.2810.4120.8650.703
Skewness1.431−0.2112.071−0.820.1060.892−0.044−4.296−1.724
Kurtosis4.8892.1517.2133.4172.0493.2282.55729.2497.718
Jarque-Bera62.7954.796186.20915.2755.05617.2581.0864068.603182.147
Source: Authors’ estimation.
Table 6. First-generation Unit root test.
LLCBreitlungIPSFisher-ADF HadriOrder of Integration
PANEL–A: LOWER-INCOME COUNTRIES
FDI−2.468 b−1.763 b−12.70 b83.098 b7.313 bI(0) = 5
I(1) = 2
FDI−9.787 b−17.302 b---
FDI_S0.858451.2684154.87190.331137.392 bI(0) = 1
I(1) = 4
FDI_S−8.85 b−2.874 b−15.293 b334.724 b-
FDI_V4.7117.229876.2002749.077311.921 bI(0) = 1
I(1) = 4
FDI_V−11.701 b−3.643 b−10.913 b302.364 b-
IQ−1.0910.274−0.39516.3935.225 aI(0) = 1
I(1) = 5
∆IQ−3.254 a−3.218 a−4.454 a114.32 a2.182 b
Tor0.0180.7820.47511.0785.598 aI(0) = 1
∆tor−3.481 a−3.481 a−3.481 a−3.481 a3.369 aI(1) = 5
DI0.418−0.27−2.74 a30.728 a2.683 aI(0) = 3
∆DI−12.232 a−0.936 a−6.841 a61.868 a2.641 aI(1) = 5
M−2.888 a3.185−4.893 a53.049 a6.584 aI(0) 4
∆M−7.864 a−9.67 a−3.165 a269.138 a10.025 aI(1) = 5
TO−1.371 b−0.752−6.637 a64.879 a2.482 aI(0) 4
∆TO−21.592 a−2.857 a−16.245 a93.727 a7.391 aI(1) = 5
INF2.2683.812−0.57516.3105.715 aI(0) 1
∆INF−2.565 a1.175−4.636 a46.391 a7.694 aI(1) = 4
Source: Authors’ estimation. Note: the superscript a and b denoted the level of significance at 1% and 5%, respectively.
Table 7. Cross-section dependency test.
F_InflowsF_StockF_Volatility
LM BP (Breusch and Pagan, 1980)236.92 a631.960 a121.298 a
LM PS Pesaran (2004)170.311 a73.41 a87.846 a
CD PS Pesaran (2006)6.954 a4.822 a8.415 a
LM adj Pesaran et al. (2008)42.843 a25.866 a52.943 a
Source: Authors’ estimation. Note: the superscript a denoted the level of significance at 1% and 5%, respectively.
Table 8. Results of panel unit root test.
CIPSCADF
At LevelAt Level
FDI−1.734−5.319 a2.122−4.800 a
FDI_S−0.968−6.094 a−4.343 a−4.343 a
FDI_V−2.099−5.385 a0.063−3.942 a
IQ−3.761 a−5.944 a−3.726 b−8.006 a
TOR−2.508 b−5.902 a−0.828−5.904 a
DI−3.085 b−6.905 a1.094−3.992 a
M−5.045 a−7.034 a−3.223 b4.225 a
TO−1.046−3.297 a−6.552 a13.045 a
INF−4.715 a−6.190 a−1.262−9.404 a
Source: Authors’ estimation. Note: the superscript of a and b indicates the level of significance at a 1% and 5% level, respectively.
Table 9. Panel Cointegration Test.
Model-1Model-2Model-3
Panel–A: Padroni Cointegration
Common AR coefficients (within-dimension)
v-Statistic[weighted]−5.815 a6.429 a4.435 a
rho-Statistic[weighted]−0.398−6.269 a3.400 a
PP-Statistic[weighted]−3.112 a−7.742 a−1.636
ADF-Statistic[weighted]−4.282 a−3.851−2.281 a
v-Statistic0.0725.906 a5.026 a
rho-Statistic−2.828 a−7.438 a−0.565
PP-Statistic−7.736 a−18.104 a−3.667 a
ADF-Statistic1.8085.109−1.347
Individual AR coefficients (between-dimension)
Group rho-Statistic1.377−5.141 a−2.325 a
Group PP-Statistic−3.054 a−23.381 a−2.154 a
Group ADF-Statistic−8.764 a−3.185 a−3.307 a
Panel–B: KAO estimation
ADF−3.531 a−2.297 a−3.434 a
Source: Authors’ estimation. Note: a indicate levels of significance at a 1%.
Table 10. Result of Westerlund-Durbin-Hausman (2008) Panel Cointegration Test.
Test(1)(2)(3)
D-H Group Statistic4.448 a23.871 a15.598 a
D-H Panel Statistic17.934 a4.943 a6.142 a
Source: Authors’ estimation. Note: a indicates level of significance at a 1% level.
Table 11. Estimates of Panel Error-Correction Model with PMG method.
Empirical Model Estimation
(1)(2)(3)(4)(5)(6)(7)(8)(9)
Panel-A: Long-run coefficients
β0.440 b-0.166 b0.536 a-0.516 a−0.031 a-−0.246
µ-0.240 b0.942 a-2.2300.487 a-−0.413 a−0.196 a
α1.584 b1.273 b1.297 b0.336 a0.9460.384 a0.518 a0.6113 a0.409 a
δ0.377 b0.059 a1.462 b0.203 a−0.230 a0.147 a−0.240 a−0.339 a−0.581 a
ζ1.724 a1.431 b0.810 b0.771 a0.252 a0.587 a0.209 a0.119 a0.985 a
λ0.254 a0.023 a0.033 a−0.051 a−0.175 a−0.071 a−0.181 a−0.088 a−0.051 a
Panel-B: short-run coefficient
ECT−0.473 a−0.589 a−0.680 a−0.163 a−0.205 a−0.182 a−0.255 a−0.261 a−0.250 a
D(IQ)0.289 b-0.092 a−0.106 a-−0.104 a0.445 a-0.473
TOR-0.161 b0.124 a-−1.354 a−0.471 a-1.721.121
D(M)0.045 *0.112 b0.186 a−0.042−0.115 a−0.044 a−0.017 a−0.053−0.028
D(INF)0.221 c0.297 b0.379 a0.054 a0.0930.052 c0.101 c0.1426 b0.196 a
D(TO)0.4760.593 c0.411 c0.024 a−0.0240.042 c−0.011 c−0.056 b−0.129 b
D(DI)0.373 c0.146 c0.0213 b0.027 b0.021 c0.012 b0.105 b0.088 b0.073 b
C−1.392 b−4.737 b−8.929 b0.373 a−1.232 a0.075 a−0.228 b0.044 b−1.403 b
H-test (p-value)0.9820.6230.8720.5540.5520.2110.8310.6120.223
Source: Authors’ estimation. Note: a/b/c indicates level of significant at a 1%, 5%, and 10% level, respectively. * p < 0.05.
Table 12. Short-run and long-run effects of institutional quality and Tourism on FDI.
FIFSFV
[1][2][3][4][5][6][7][8][9]
Panel-A: Long-run coefficients
IQ1.246 a 0.385 a−1.104 a 0.849 a−0.492 a −0.919 a
TOR 0.271 a1.086 a −1.668 a0.148 a −0.853 a−0.053 a
DI2.706 a−0.401 a0.230 b0.634 a0.297 c0.535 c0.135 a0.281 a0.034 a
M1.991 a0.115 a0.303 a−1.979 a0.516 a0.655 a1.552 a−0.015 a0.058 c
TO0.235 a0.290 a0.175 a0.842 c−1.429 a−0.603 c1.154 a−0.436 a−0.042 a
INF−0.981 a0.960 a−0.014 c−0.049 a0.027 a−0.077−0.033 c−0.081 c−0.065 c
Panel-B: Short-run Coefficients
ETC−0.096 a−0.069 a−0.113 a−0.242 a−0.164 a−0.122 a−0.093 a−0.117 a−0.331 a
IQ0.246 a 1.385 a−0.104 0.150 a0.492 a 0.080
TOR 0.494 a0.816 a −0.6680.992 a 0.853 b0.512
DI−0.981 a−0.261 b−0.782 a0.701 b0.447 b0.132 b−0.361 b0.297 b0.403 b
M0.091 a2.473 a−1.410 a−2.169 a−1.850 c−0.784 a3.810−0.899 a−0.053 c
TO0.954 a−1.272 a0.296 c0.919 c0.798 c0.269 b−2.894−0.623−0.099 c
INF−0.628 c−1.675 c−0.125 c−0.0550.013 b−0.204 b0.044−0.085 c0.113
Panel-C: Diagnostic test
H-test p-value0.3220.4830.2260.9870.8720.6230.5260.9820.831
Observations644644644644644644644644644
Source: Authors’ estimation. Note: a/b/c indicates levels of significance at 1%, 5%, and 10%, respectively.
Table 13. Panel NARDL Estimation.
Dependent Variable→FDI InflowsFDI StockFDI Volatility
(1)(2)(3)(4)(5)(6)(7)(8)(9)
Panel-A: Long-run coefficients
+ 0.066 a-0.131 a0.271-0.253 a−0.032 a-−0.053 a
0.046 a-0.361 a−0.106-−0.021 a−0.227 a-−0.651 a
µ + -0.161 a0.877 a-0.056 a0.033 a-−0.002 b−0.004 a
µ -0.909 a0.226 a-0.124 a0.881 c-−0.037 b−0.792 a
M0.166 a0.611 b0.836 a0.713 a0.246 a0.466 c−0.244 a0.818 b0.673 a
TO−0.816 b−0.206 b−0.76 a−0.509 a0.571 b−0.205 c0.119 a−0.377 b−0.521 a
DI−0.112 b−0.272 a−0.229 a−0.447 a−0.725 b0.407 c0.623 a0.242 c−0.276 c
INF0.461 b0.014 a−0.032 a1.069 a0.097 c−0.272 c0.405 b−0.152 s−0.065 c
Panel-B: Short-run coefficients
ξ−0.753−0.585−0.7050.014 a−0.039 a−0.018 a−0.262 a−0.229 a−0.282 a
IQ+−0.143 a-1.068 a−0.331 a-0.213 a−0.299 a-0.042 a
IQ−1.924 a-−0.022 a−0.932 a-−0.682 a1.845 a-1.744 c
TOR+-2.004 a0.195 a−0.331 a0.113 a0.019 a-−0.016 a0.113 a
TOR-0.329 a−0.683 a−0.932 a−0.421 a−0.293 a-0.613 a−0.982 a
M−0.042 b0.028 b0.018 a−0.139 a−0.016 a0.009 a0.114−0.015−0.007
TO0.365 b0.322 a0.195 a0.079 a0.069 b0.133 c0.1180.1280.041 a
DI0.254 b0.912 b0.921 a−0.392 a−0.031 b−0.145 b−0.1980.117 a0.257 c
INF0.129 b0.375 c−0.1640.008 a−0.018 b0.011 c0.1050.129 a−0.098 c
C−0.043 c−5.67 c−0.023 a−1.993 b−0.003 b−0.032 a−0.479 a−0.357 a0.075
Panel-C: Long-run and short-run Symmetry test
W L R I Q 20.894 a14.092 a16.423 a21.125 a20.793 a21.59 a25.482 a17.951 a19.517 a
W L R T O U R 13.359 a20.613 a13.725 a22.964 a19.924 a19.37814.326 a18.508 a12.225 a
W S R I Q 24.56 a16.802 a19.846 a12.684 a20.486 a15.121 a15.755 a24.759 a12.374 a
W S R T O U R 22.389 a24.614 a15.759 a14.103 a25.796 a21.587 a20.892 a14.433 a17.699 a
H− test (p-value)0.6050.9490.7040.5180.9580.7320.7370.5740.241
N− test (p-value)0.2370.2220.4110.3200.9770.7480.4180.6520.735
Log-likelihood230.14289.641277.91265.06176.07134.97536.978119.05209.81
Source: Authors’ estimation. Note: a/b/c indicates levels of significance at 1%, 5%, and 10%, respectively.
Table 14. Causality test results with symmetry assumption.
Panel-A: Dependent Variable as FDI Inflows
X *IQTORMTODIINFIQ←→FDI; TOR←→FDI; INF→FDI; INF→IQ; IQ→TOR; M→TOR; DI→TOR; INF→TOR; FDI→M; TO←→M; DI←→M; INF←→M; IQ→TO; DI←→TO; IQ→DI; IQ→INF; TO→INF; DI→INF
X *-13.444 a14.108 a3.181.4783.2858.381 b
IQ12.781 a-1.2652.2655.192.1227.962 a
TOR11.781 a5.294 c-11.168 a9.818 a14.453 a9.051 a
M6.391 b3.4580.92-47.344 a29.571 a15.572 a
TO3.8464.131 c3.5349.014 a-13.659 a3.127
DI3.96810.09 a1.7436.345 a8.061 b-2.124
INF1.6035.3982.1220.409 a17.337 a7.328-
Panel-B: Dependent variable as FDI_stock
X *-6.842 c14.068 a7.712 b12.646 a5.2743.807TOR←→FDI; M→FDI; TO←→FDI; FDI←→IQ; INF←→IQ; M→IQ; DI→TOR; TO→M; DI←→M; INF←→M; DI←→TO; FDI→INF; TO→INF; DI→INF
IQ11.137 a-2.965.461 c2.9423.1149.447 b
TOR22.572 a4.005-3.5563.5689.645 b3.671
M3.9473.2660.758-24.266 a19.723 a6.735 c
TO9.114 b2.2843.2544.377-12.209 a1.392
DI4.0794.2012.49920.15 a6.487 c-5.208
INF10.878 a6.416 c2.89242.769 a21.918 a12.522 a-
Panel-C: Dependent variable as FDI_volatility
X *-14.166 a9.127 b1.1072.1114.41414.175 aIQ←→ X *; TOR→ X *; INF→ X *; IQ→TOR; TOR←→DI; TOR→M; TO→M; DI→M; INF→M; TOR→TO; DI←→TO;TO→INF; DI→INF
IQ7.22 b-1.7132.923.2450.2643.189
TOR0.5428.035 b-3.5512.14311.142 a2.957
M2.721.93731.739 a-8.801 b17.505 a14.795 a
TO2.890.20716.784 a5.438-9.057 c3.36
DI2.9215.2611.414 a10.489 a5.035-4.543
INF1.4582.8810.1938.3382.7747.562 b-
Source: Authors’ estimation. Note: the subscripts of a/b/c specify the significance levels at 1%, 5%, and 10%, respectively. * p < 0.05.
Table 15. Causality with Asymmetric assumption.
0XIQ+IQTOR_PTOR_NDIMTOINF
Panel-A: Dependent variable as FDI inflows
X-3.8057.841 b2.64617.28 a1.7661.96876.873 a4.299
IQ+29.09 a-6.767 c6.33740.126 a0.7492.22589.745 a5.588
IQ19.15 a3.428-6.34158.541 a2.6813.12816.612 a5.063
TOR+26.615 a4.296.865 c-23.773 a1.1231.52615.817 a4.1
TOR18.448 a2.0617.403 c6.277 c-0.5612.77611.106 a4.819
DI12.122 a2.95113.449 a6.93550.763 a-2.32114.216 a4.823
M19.343 a8.221 b13.441 a3.77734.051 a0.101-9.231 b8.857 b
TO4.20512.276 a9.789 b4.84919.268 a0.1452.325-2.244
INF7.261 b8.242 b14.048 a5.1939.463 a0.7261.73559.897 a-
Panel-B: Dependent variable as FDI stock
X-7.263 c3.4110.673 a1.29357.417 a15.506 a1.0315.449 a
IQ_P2.265-3.15215.008 a1.79532.242 a6.9864.7855.106
IQ_N13.148 a13.659 a-19.469 a6.555 c17.196 a61.623 a4.7924.122
TOR_P2.7992.7513.129-0.98922.667 a7.079 c3.1372.336
TOR_N11.413 a12.494 a1.54416.603 a-37.764 a9.341 b2.0861.465
DI2.42311.734 a3.03611.009 a3.555-9.352 b0.729.254 b
M1.69319.702 a5.68813.217 a2.32739.595-3.3720.641 a
TO2.50412.326 a6.187 c9.337 a5.17836.8197.344 c-3.337
INF3.61312.307 a4.94711.577 a6.658 c51.63545.284 a4.426-
Panel-C: Dependent variable as FDI Volatility
X-13.326 a11.314 a19.094 a38.726 a16.104 a0.2576.6641.792
IQ_P16.341 a-14.835 a13.521 a12.196 a18.102 a0.14516.34 a1.721
IQ_N15.808 a16.608 a-15.587 a19.349 a68.951 a0.2879.597 b0.864
TOR_P14.352 a38.748 a8.323 a-14.375 a48.296 a0.0613.516 a2.185
TOR_N14.215 a15.577 a15.535 a16.426 a-55.822 a0.2128.507 b0.455
DI19.158 a16.339 a15.505 a18.929 a72.046 a-0.3374.593.828
M4.04723.96 a13.157 a12.767 a18.268 a94.587 a-4.6232.861
TO10.324 a17.805 a18.019 a14.029 a27.047 a89.151 a0.292-1.417
INF15.617 a15.336 a27.007 a11.252 a57.008 a82.368 a0.27412.211 a-
Source: Authors’ estimation Note: supscripts a, b, c specify the significance level at 1%, 5%, a and 10%, respectively.
Table 16. Summary results of causality test.
Causality[1][2][3]
FDI ← ≠ → IQ+FDI → IQ+IQ+FDIFDI ←→ IQ+
IQ+ ← ≠ →FDI
FDI ← ≠ →IQ-FDI ←→ IQFDI ←→ IQ-FDI ←→ IQ
IQ ← ≠ →FDI
FDI ← ≠ →TOR+FDI → TOR+TOR+FDIFDI ←→ TOR+
TOR+ ← ≠ →FDI
FDI ← ≠ →TORFDI ←→ TORFDI → TORFDI ←→ TOR
TOR+ ← ≠ →FDI
Source: Authors’ estimation. Note: ← ≠ →, →, ←→ denotes the non-granger causality, unidirectional causality, and bidirectional causality.
Publisher’s Note: MDPI stays neutral with regard to jurisdictional claims in published maps and institutional affiliations.

