Article

Comparison of Research Data of Diesel–Biodiesel–Isopropanol and Diesel–Rapeseed Oil–Isopropanol Fuel Blends Mixed at Different Proportions on a CI Engine

by
Sai Manoj Rayapureddy
,
Jonas Matijošius
* and
Alfredas Rimkus
Department of Automobile Engineering, Faculty of Transport Engineering, Vilnius Gediminas Technical University, J. Basanavičiaus Str. 28, LT-03224 Vilnius, Lithuania
*
Author to whom correspondence should be addressed.
Sustainability 2021, 13(18), 10059; https://0-doi-org.brum.beds.ac.uk/10.3390/su131810059
Submission received: 15 June 2021 / Revised: 31 August 2021 / Accepted: 1 September 2021 / Published: 8 September 2021

Abstract

:
Depletion in the levels of fossil fuels and increasing environmental concerns associated with the rise in consumption of conventional fuels are among the top global concerns. Finding an alternative sustainable fuel that matches the performance characteristics of diesel/petrol fuels as well as decreases the exhaust emissions has been a challenging task. After deliberate research, it is found that every alternative fuel is associated with different problems when they are used independently, thereby limiting its benefits. Scientists suggest that using different fuel blends might lead to sustainability. This article is the analysis of data obtained from the experimentation based on two different alternative fuels, Rapeseed Methyl Ester (RME)-based biodiesel and Rapeseed Oil (RO), blended with diesel (D) and Isopropanol (P) into three different proportions each. Tests were carried out in a compression ignition (CI) engine, and comparisons are based on the resulted performance and exhaust emission characteristics. The two different alternative fuels are blended into the following proportions to make six fuel mixtures, D50RME30P20, D50RME40P10, D50RME45P5, D50RO30P20, D50RO40P10 and D50RO45P5. The tests are carried out at different loads (BMEP) and are compared to that of pure diesel. Using the experimentation results, we also obtained the combustion characteristics of all fuel mixtures for further evaluation

1. Introduction

The automobile world is concerned with two major problems: decreasing fossil fuel use and the rise in harmful emissions. Research result shows that automotive accounts for almost 14% of the total greenhouse gases and 25% of global carbon dioxide (CO2) emissions [1,2,3,4,5,6]. Internal combustion engines are widely used for various purposes all over the world from small-scale to large-scale applications. Statistics shows that 99.8% of the world transport is IC engine-powered, out of which 95% uses fuels such as petrol and diesel [7]. While we see the increasing demand of diesel vehicles, the amount of pollution caused is also increasing. The pollutants that are released after the combustion of fossil fuels are divided into regulated and unregulated pollutants. The limited of the amount of pollutants released that are regulated by legislation are called regulated pollutants; those for which limits are not specified are categorized into unregulated [8]. Regulated pollutants include nitrogen oxides (NOx), carbon monoxide (CO), hydrocarbons (HC) and particulate matter (PM) [9]. Due to their high-performance parameters, fossil fuels are being used in internal combustion engines [10].
Increasing demand of conventional diesel fuel in the transport sector is one of the primary reasons for the scarcity of fossil fuels [4,5,6]. The major reserves of fossil fuels are confined to a particular region. Countries that are low in these reserves are facing economic and energy crisis [9]. In the wake of these problems, researchers are focusing on finding a naturally available sustainable fuel made locally from vegetable oils, biodiesel and even alcohols to balance the performance characteristics and decrease the emissions [11,12,13].
Biodiesels produced by the transesterification process using primary alcohols are now being greatly studied [14], investigated and implemented in the replacement of fossil fuels [15,16]. Biodiesels showed higher CO and lower brake thermal efficiency (BTE), HC and NOx emissions. Lower peak in-cylinder pressure, maximum heat release rate (HRRmax) and longer combustion duration are observed in biofuels. Combustion noise and vibrations from biofuels are also found to be lower [17]. Blending biodiesel with diesel fuel lowered the emissions but increased the fuel consumption with minimum effect on efficiency [18,19,20,21]. Another research result of Agarwal [9] stated that using biodiesel in conventional diesel fueled engines reduces the emission of unburnt HC, CO and PM. However, the application of biodiesel as a replacement on a full scale has been limited due to its poor low-temperature flow property and high viscosity [22].
To balance the viscosity and solidification complications associated with biodiesel, addition of alcohols to the mixture has been found to solve the problem [23]. Blending oxygen-rich alcohols with diesel fuels in low percentages does not require any modifications in the engine fuel system [24,25]. Results of the previous studies show that, by blending diesel fuel with alcohol, emission characteristics such as smoke, carbon monoxide and nitrogen oxide are found to be improved but at the cost of decreased performance and increased fuel consumption [26,27,28,29]. Low cetane numbers and poor solubility restrict the direct use of alcohols with diesel fuel.
The benefits are limited, and different problems emerge when a single alternative fuel is used [30]. Scientists suggest that sustainability can be achieved by using fuel blends to balance the performance and emission characteristics [7,17,31,32,33,34]. Recent research reveals that using alcohols and biodiesels is one of the primary ways to decrease the emissions that disturb the environment [22,35,36,37,38]. The use of higher alcohols and biodiesels is widely recognized and researched as a replacement for conventional fuels, as they are easily produced and available [9]. Research conducted by Erdiwansyah [39] reveals that using alcohol and biodiesel as an alternative fuel decreases the emission of NOx, CO and HC.
The objective of this research is to check different engine performance and emission characteristics, followed by examining the combustion parameters of two different biofuels, Rapeseed Methyl Easter-based biodiesel and Rapeseed oil, blended with Isopropanol and diesel fuel in three different by volume proportions. The proportions at which the testing carried out were 50% diesel fuel, 30% RME and 20% Isopropanol; 50% diesel fuel, 30% RO and 20% Isopropanol; 50% diesel fuel, 40% RME and 10% Isopropanol; 50% diesel fuel, 40% RO and 10% Isopropanol; 50% diesel fuel, 45% RME and 5% Isopropanol; and 50% diesel fuel, 45% RO and 5% Isopropanol.
The selection of fuel mixture components was determined in order to evaluate the sustainability of the most commonly used biodiesel resource in Lithuania, Rapeseed Oil and its esterification product (RME) used as alternative fuels in internal combustion engines. As the use of pure RO or RME as fuel requires engine modifications [40] (such as changes in valve diameters, etc.), isopropanol alcohol was used to bring its properties closer to that of diesel fuel and to avoid additional engine modifications. This alcohol has advantages over methanol and ethanol (e.g., does not corrode the elements of the fuel supply system), so its calorific value approaches that of diesel fuel, which is directly reflected in the fuel consumption figures.

2. Materials and Methods

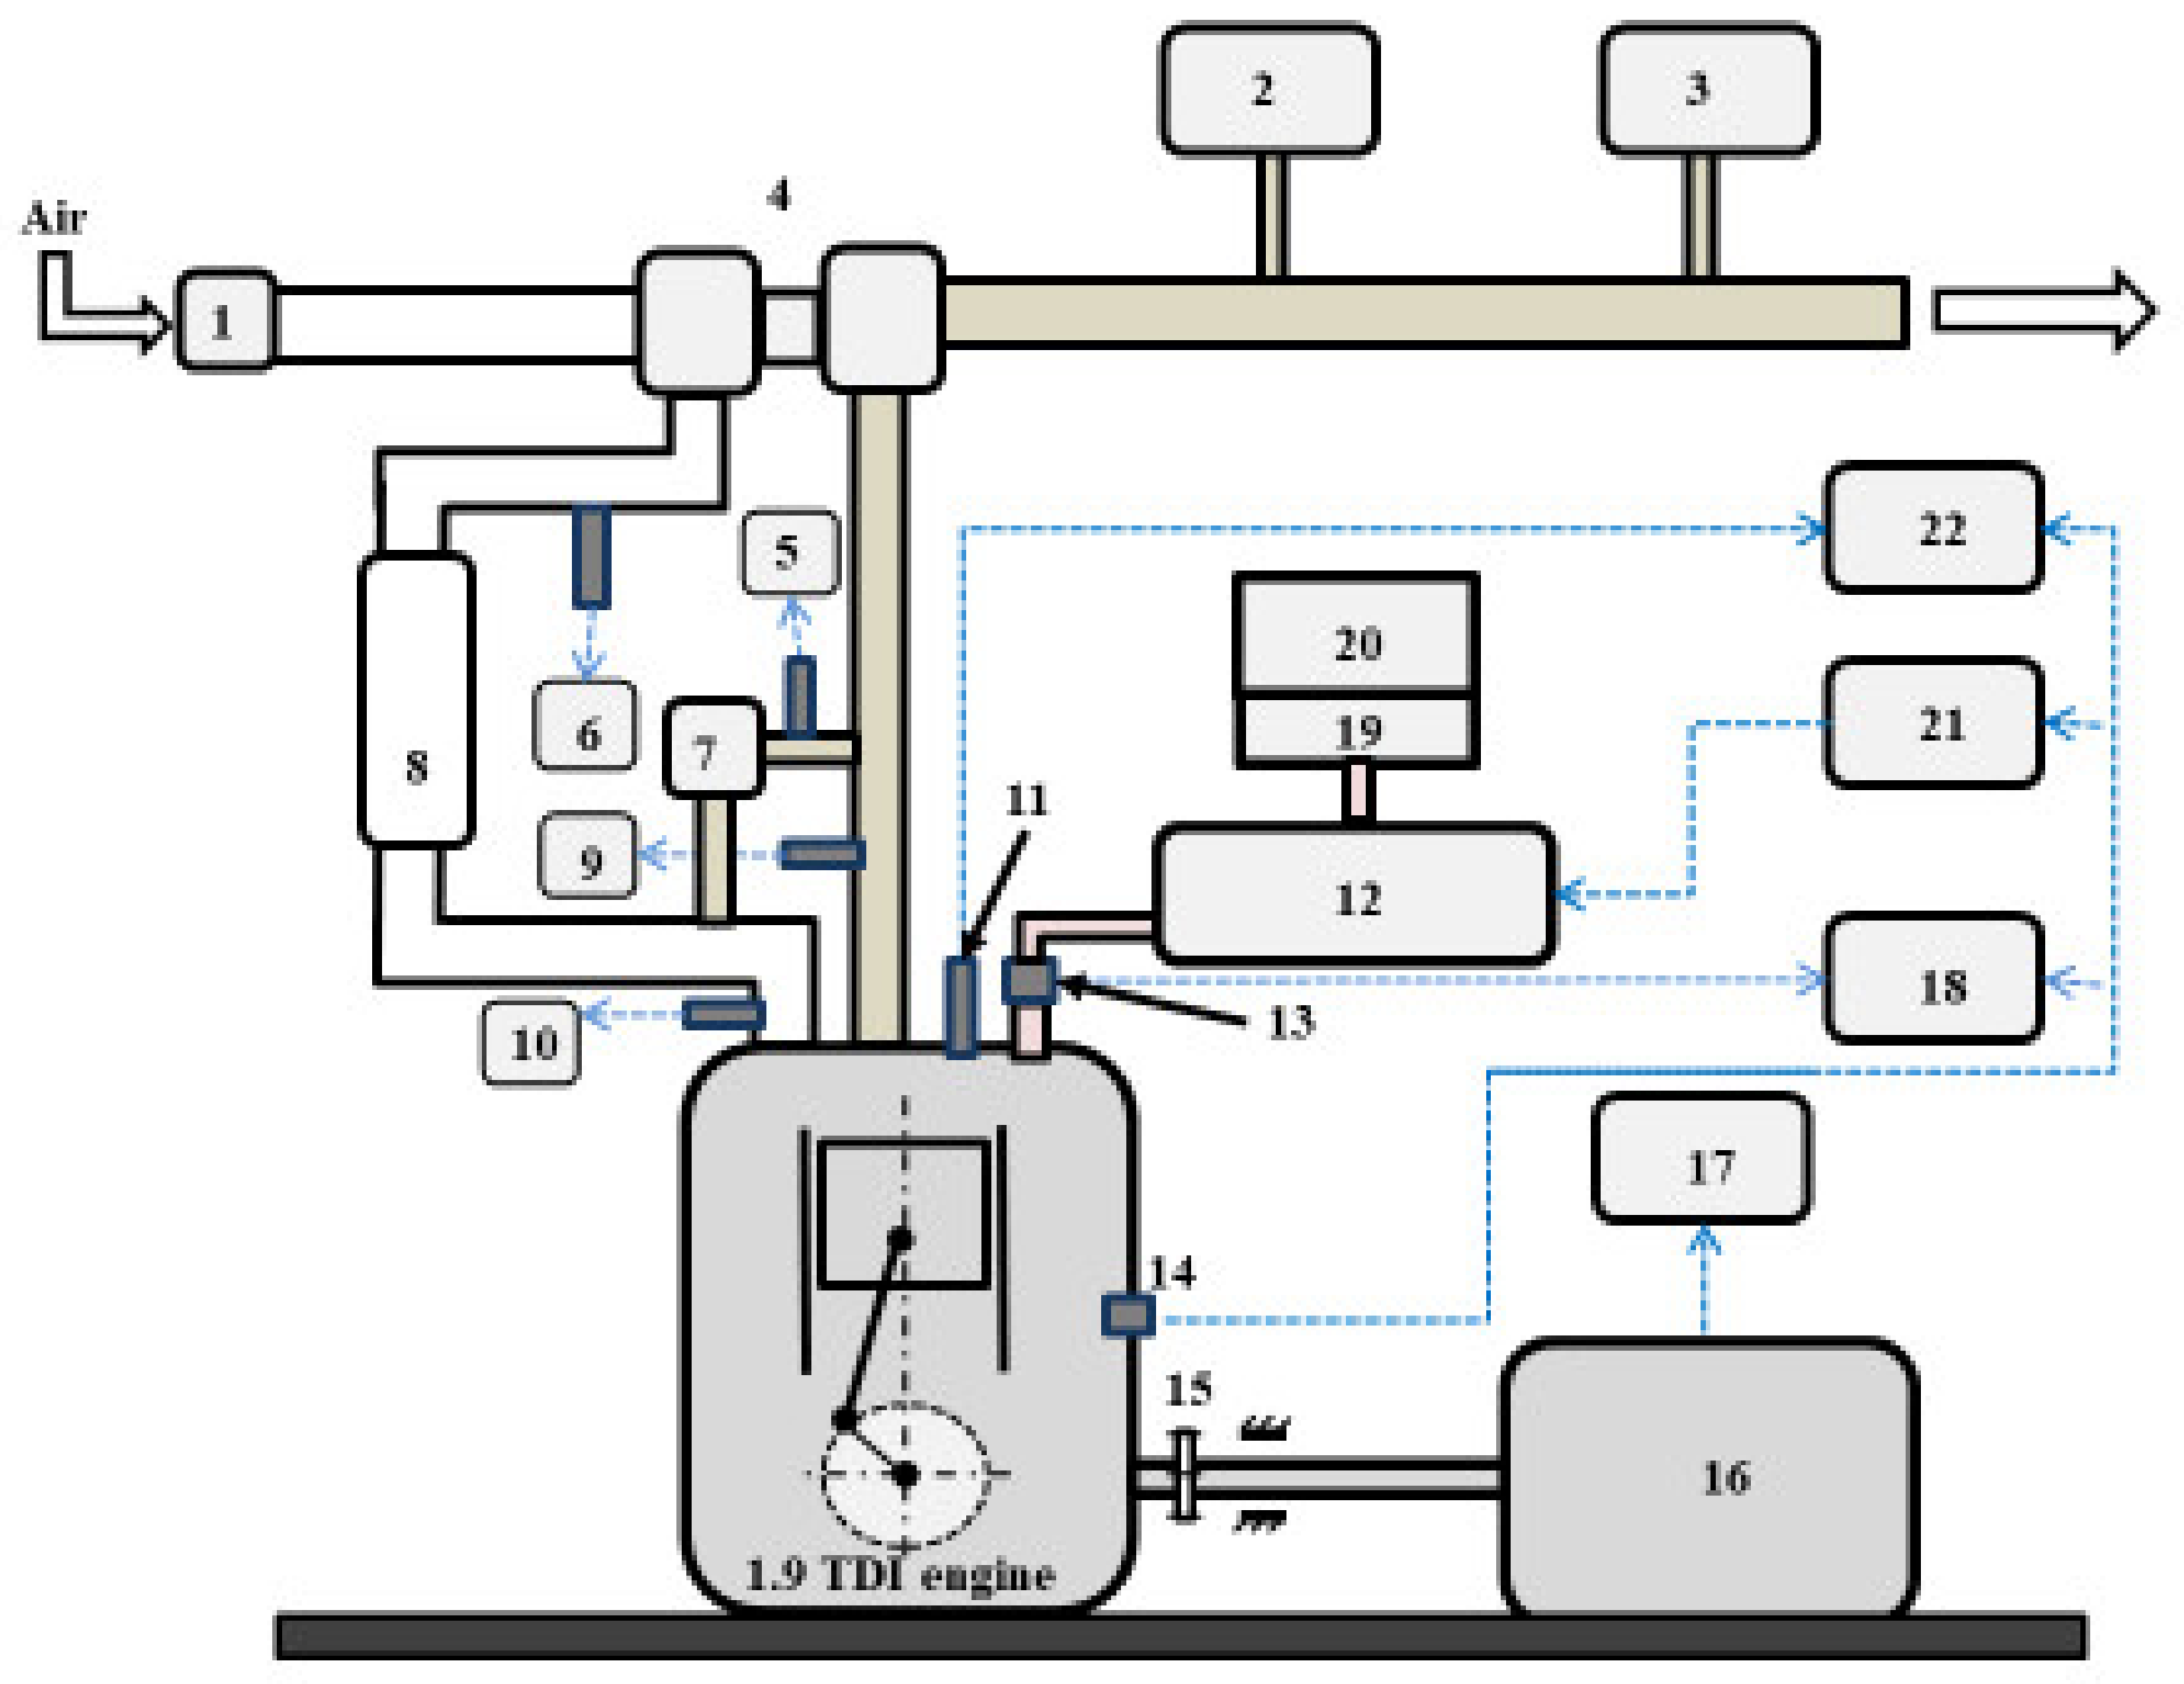
2.1. Engine Testing Equipment

The primary testing equipment is a turbocharged direct injection diesel engine (Table 1) with an electronically controlled distribution fuel pump. It works on a single-injection strategy, and the engine ECU controls the injection timing. The tested engine details can be understood by the schematic diagram presented in Figure 1.
The main parameters of the laboratory equipment used during the tests and the measurement errors are presented in Table 2. Fuel injection timing information is obtained by analyzing the fuel injection timing sensor signal. Data obtained from the piezoelectric cylinder pressure sensor (which is replaced for a glow plug) and the crankshaft position sensor (encoder) were processed using LabView Real software to obtain the in-cylinder pressure diagram. This information was used to analyze the combustion process and determine the rate of heat release, temperature rise and pressure rise in the cylinder. AVL BOOST’s subprogram Burn was used for numerical analysis of the combustion process. Exhaust gas concentration (CO2, CO, HC, NOx) was determined using the AVL DiCom 4000 gas analyzer. The specific emissions (g/kWh) of different pollutants were determined by calculating the exhaust gas flow rate. Exhaust smoke was determined using an opacity measuring chamber.

2.2. Fuels and Test Conditions

The prepared fuels for testing purposes were 100% pure diesel fuel, 100% pure Rapeseed Methyl Ester (RME), 100% pure Rapeseed Oil and 100% pure Isopropanol. Properties of all the four pure fuels presented in Table 3. As presented earlier, tests were carried out by blending Rapeseed Methyl Ester (meets the requirements of the standard EN 14,214) or Rapeseed Oil with diesel fuel (meets the requirements of the standard EN 590) and Isopropanol in three different volume proportions. First mixture consists of 50% diesel fuel, 30% Rapeseed Methyl Ester/Rapeseed Oil and 20% Isopropanol (D50RME/RO30P20), second mixture contains 50% diesel fuel, 40% Rapeseed Methyl Ester/Rapeseed Oil and 10% Isopropanol (D50RME/RO40P10) and third mixture contains 50% diesel fuel, 45% Rapeseed Methyl Ester/Rapeseed Oil and 5% Isopropanol (D50RME/RO45P5).
As the mixtures were prepared by blending the various components in the prescribed volume ratios (V/V), the density was figured by calculating the mass of each component per liter of fuel mixture and determining the mass fraction (m/m) of the individual components. The fuel blends’ characteristics of density, mass fraction of carbon, hydrogen and oxygen, C/H ratio, lower heating value were calculated by estimating the mass fraction (m/m) and properties of the individual components of the mixture; the results are presented in Table 4.
The prepared fuel mixtures were tested over a narrow but frequently used operating range of this engine with a speed (n) of 2000 rpm and brake torque MB = 30; 60; 90 Nm. They were ~20%, ~40% and ~60% from of full load engine, and brake mean effective pressure BMEP = 0.2; 0.4; 0.6 MPa. The performance characteristics such as break specific fuel consumption (BSFC), brake thermal efficiency (BTE), exhaust gas temperature (TEX), turbocharger pressure (pTC) and exhaust emission characteristics such as carbon dioxide (CO2), smoke (Opacity), hydrocarbons (HC) and nitrogen oxides (NOx) are plotted. The accuracy at which our equipment presented the readings of carbon monoxide (CO) was too low to evaluate the difference. The tests were performed when the engine oil reached the operating temperature (~95 °C). The tests were repeated five times, and the average of the obtained results was given (at 0.2 MPa, all fuel mixtures including diesel fuel showed ~4 g/kWh; at 0.4 MPa, the value was noted to be ~1.1 g/kWh, and at 0.6 MPa it was ~0.8 g/kWh). The results were obtained by experimentally testing methods and after were analyzed by AVL BOOST program after numerical analysis of the combustion process. The heat transfer to the walls of the combustion chamber (the cylinder head, the piston, the cylinder liner) was calculated used the Woschni model published in 1978. The Woschni heat transfer model was adapted for the high-pressure cycle and the maximum error of heat transfer coefficient not bigger than 3.2% [41]. The prepared fuel mixtures were analyzed, and the results were compared with those of the diesel fuel results.

3. Results and Discussion

In order to be able to perform a more detailed analysis of engine energy and ecological indicators, a numerical analysis of the combustion process was additionally performed, determining various combustion process indicators.

3.1. Combustion Parameters

The analysis of combustion parameters was carried out at an engine load (BMEP) of 0.4 MPa and speed (n) at 2000 rpm. As in Table 5, start of injection (SOI), which was taken from the experiments (signal from fuel injection timing sensor), and start of combustion (SOC), which was taken from the combustion analyses performed in the AVL Boost (subprogram Burn), were used to calculate the ignition delay (ID) in CAD. From the data presented in Table 5, it is evident that, under same proportions, ignition delay was longer in mixtures with Rapeseed Oil than those with Rapeseed Methyl Ester. Isopropanol was found to prolong the ignition delay even more. The main reason for the prolongation of the ID (interval between SOI and SOC) is the decreasing cetane number of the fuel mixture (Table 4), and this affects the subsequent combustion phases, engine energy and ecology parameters.
To get a better glimpse of the characteristics, the graphs of individual parameters such as rate of heat release (ROHR) and in-cylinder T_rise and p_rise were plotted between ‒10 and 25 CAD. The pressure values obtained from the experimentation were loaded and analyzed in AVL Boost software to get the combustion parameters.
From Figure 2, it is observed that maximum rate of heat release of diesel at the premixed combustion phase (33.9 J/deg) is found to be lower than all the remaining fuel mixtures. As given in Table 4, addition of alcohol reduces the cetane number, thereby increasing the ignition delay, which causes the rise in the heat release. D50RME30P20 is found to have the maximum heat release at 48.8 J/deg, which is ~44% more when compared to diesel fuel.
The T_rise of specific fuel mixtures was found to increase with the alcohol percentage. When the alcohol percentage in mixtures of Rapeseed Oil raised from ~5 to 10%, the peak temperature rise was found to increase by 13.9%, and with further increase to 20%, the value raised to ~11%. A similar pattern was observed in mixtures of Rapeseed Methyl Ester from Figure 3. With an increase in alcohol percentage from ~5 to 20%, the peak T_rise was found to increase by ~31%. Diesel fuel is found to be the lowest of all with a peak temperature rise of 60.2 K/deg. A higher T_rise increases the heat load of the engine and influences higher NOx emissions.
With increase in the alcohol percentage the pressure rise is found to increase for all fuel mixtures. As shown in Figure 4, maximum p_rise is found to follow similar pattern as that of ROHR and T_rise. Diesel fuel was found to have the lowest peak of pressure rise with 0.191 MPa/deg, which is ~29% less than that of D50RME30P20. A higher-pressure rise increased the mechanical loads on the crankshaft, and the engine emits more noise.

3.2. Performance Characteristics

BSFC of all the fuel mixtures tended to exhibit similar patterns, as shown in Figure 5, at a specific load; with the addition of alcohol, BSFC tended to increase. Similarly, for a specific fuel mixture, the rise in the load led to the decrease in BSFC. At 0.2 MPa, BSFC of D50RO30P20 (377.78 g/kWh) was found to be ~13% more than that of diesel fuel. This might be because of the high oxygen content present in Rapeseed Oil and Isopropanol, as shown in Table 3 and Table 4. Although the presence of oxygen in the fuel improves combustion, it reduces calorific value. The decreasing trend in the CN can be a factor for the rise in BSFC. The trend of difference in BSFC between the highest of all fuel mixtures (D50RO30P20) when compared to diesel fuel decreased with increase in load (~13% at 0.2 MPa, ~12% at 0.4 MPa and ~11% at 0.6 MPa). Diesel’s fuel consumption was found to be more than the remaining fuel mixtures because of its higher calorific value (Table 4) [31].
It is observed from Figure 6 that there is an increase in BTE of all fuel mixtures with the load, because most of the indicative work is converted into energy efficient. At all loads, RME mixtures tended to show greater efficiency than RO mixtures. The percentage of difference at 0.2 MPa was found to be ~3%, and the difference was found to be decreasing with the load. At 0.2 MPa, BTE of D50RME45P5 was ~5% greater than D100, followed by ~3% at 0.4 MPa and ~2% at 0.6 MPa. BTE was enhanced by a better combustion process due to the oxygen contained in the biodiesel.
Exhaust gas temperature (TEX), presented in Figure 7, might provide an understanding of combustion process in the engine. It plays an important role in analyzing the emission characteristics of the exhaust gas [32]. TEX was found to be increasing with the load as the amount of fuel burned during the cycle increased. At all loads, exhaust gas temperature of pure diesel fuel was found to be higher than the remaining fuel mixtures. When analyzed, it was found that, at 0.2 MPa, temperature at D100 was ~3% more than that of average of all the remaining fuel mixtures; at 0.4 MPa and 0.6 MPa, the value was found to be ~2% and ~1%, respectively. TEX was reduced by the use of RME or RO and the addition of Isopropanol, because the oxygen in biofuels results in faster combustion.
As shown in Figure 8, pTC is found increase with the load as the exhaust gas flow increases. At all the given loads, diesel fuel was found to have the highest pressure, because, when diesel fuel and biofuel blends are used, the oxygen in the fuel accelerates combustion and reduces exhaust energy. At 0.2 MPa, the pTC was found to be 1.24 bar, which is ~4% higher than the average of remaining fuel mixtures.

3.3. Exhaust Emission Characteristics

The tendency of CO2-specific emissions is presented in Figure 9. The carbon dioxide emissions were found to decrease with increase in the load as the percentage of energy efficiency increased. Addition of alcohol to the blends led to the reduction of the C/H ratio in the fuel blends, which, in turn, reduced the emissions [17]. At relatively higher tested loads, 0.6 MPa, all the fuels tended to have nearly similar amounts of emissions. At 0.2 MPa, diesel fuel tended to have the highest amounts of emission at 1047.5 g/kWh, which is ~4% higher than that of D50RO30P20. At 0.4 MPa and 0.6 MPa, the difference was found to be ~2% and ~1.3%, respectively. The difference between these mixtures decreased with increase in load.
As shown in the Figure 10, smoke (opacity) levels were found to increase with load as the air–fuel ratio decreases. At all loads, pure diesel fuel was found to have the highest levels. This might be because of the lack of oxygen content in diesel fuel. It was observed that, at any given load, with the addition of alcohol, the smoke decreased. For fuels with the same alcohol percentage, mixtures with RME tended to be lower than RO because of the low C/H ratio, as given in Table 2. At all loads, mixtures with RME were found to be lower than RO at an average of ~4–5%.
Hydrocarbon emissions of all fuel mixtures including diesel fuel were found to be decreasing with increase in the load, as shown in Figure 11. This might be because of the rise in combustion temperature. At a specific load, diesel was found to be lowest, followed by RME and then RO. This is because of diesel’s high cetane number and lower ignition delay [24]. With the increase in alcohol percentage, mixtures tended to show an increase in HC emissions. At 0.2 MPa, the average of emissions of mixtures of RO were found to be ~44% higher than that of RME. Similarly, the value was found to be ~43% and ~30% at 0.4 MPa and 0.6 MPa, respectively.
As shown in Figure 12, nitrogen oxides emissions were found to be lower in diesel fuel at all loads. At any specific load, the emissions were found to be gradually increasing with addition of alcohol percentage. Addition of alcohol implies that the oxygen concentration has been increasing, justifying the rise in NOx emissions. NOx emissions were also increased by prolonged ignition delay due to decreasing cetane number. This resulted in an increase in ROHR and temperature rise at the premixed combustion phase, which had a direct effect on NOxformation. At 0.2 MPa, the fuel mixture D50RO30P20 was found to be ~16% more than that of diesel fuel. At 0.4 MPa, the value was found to be more than halved at ~8%. At maximum load, the difference between fuel mixture with highest emissions and diesel fuel was found to be ~4%.

4. Conclusions

After experimentally finding the values of performance and exhaust emission characteristics of the prepared fuel mixtures (D50RME30P20, D50RME40P10, D50RME45P5, D50RO30P20, D50RO40P10 and D50RO45P5) over a narrow but frequently used operating range, we tested a CI engine (engine speed n = 2000 rpm; three loads—20%, 40% and 60%). Our results were compared with those of pure diesel fuel. The pressure values in cylinder and consumptions of fuel and air thus obtained were used to obtain the theoretical combustion parameters. After carefully analyzing the obtained data, the following conclusions are made:
  • Adding alcohol such as Isopropanol and biofuels such as Rapeseed Methyl Ester or Rapeseed Oil led to the increase of oxygen concentration and decrease of LHV and cetane number of fuel blends. The C/H ratio of blends with RME additive was lower compared to diesel fuel, but the RO additive C/H ratio increased.
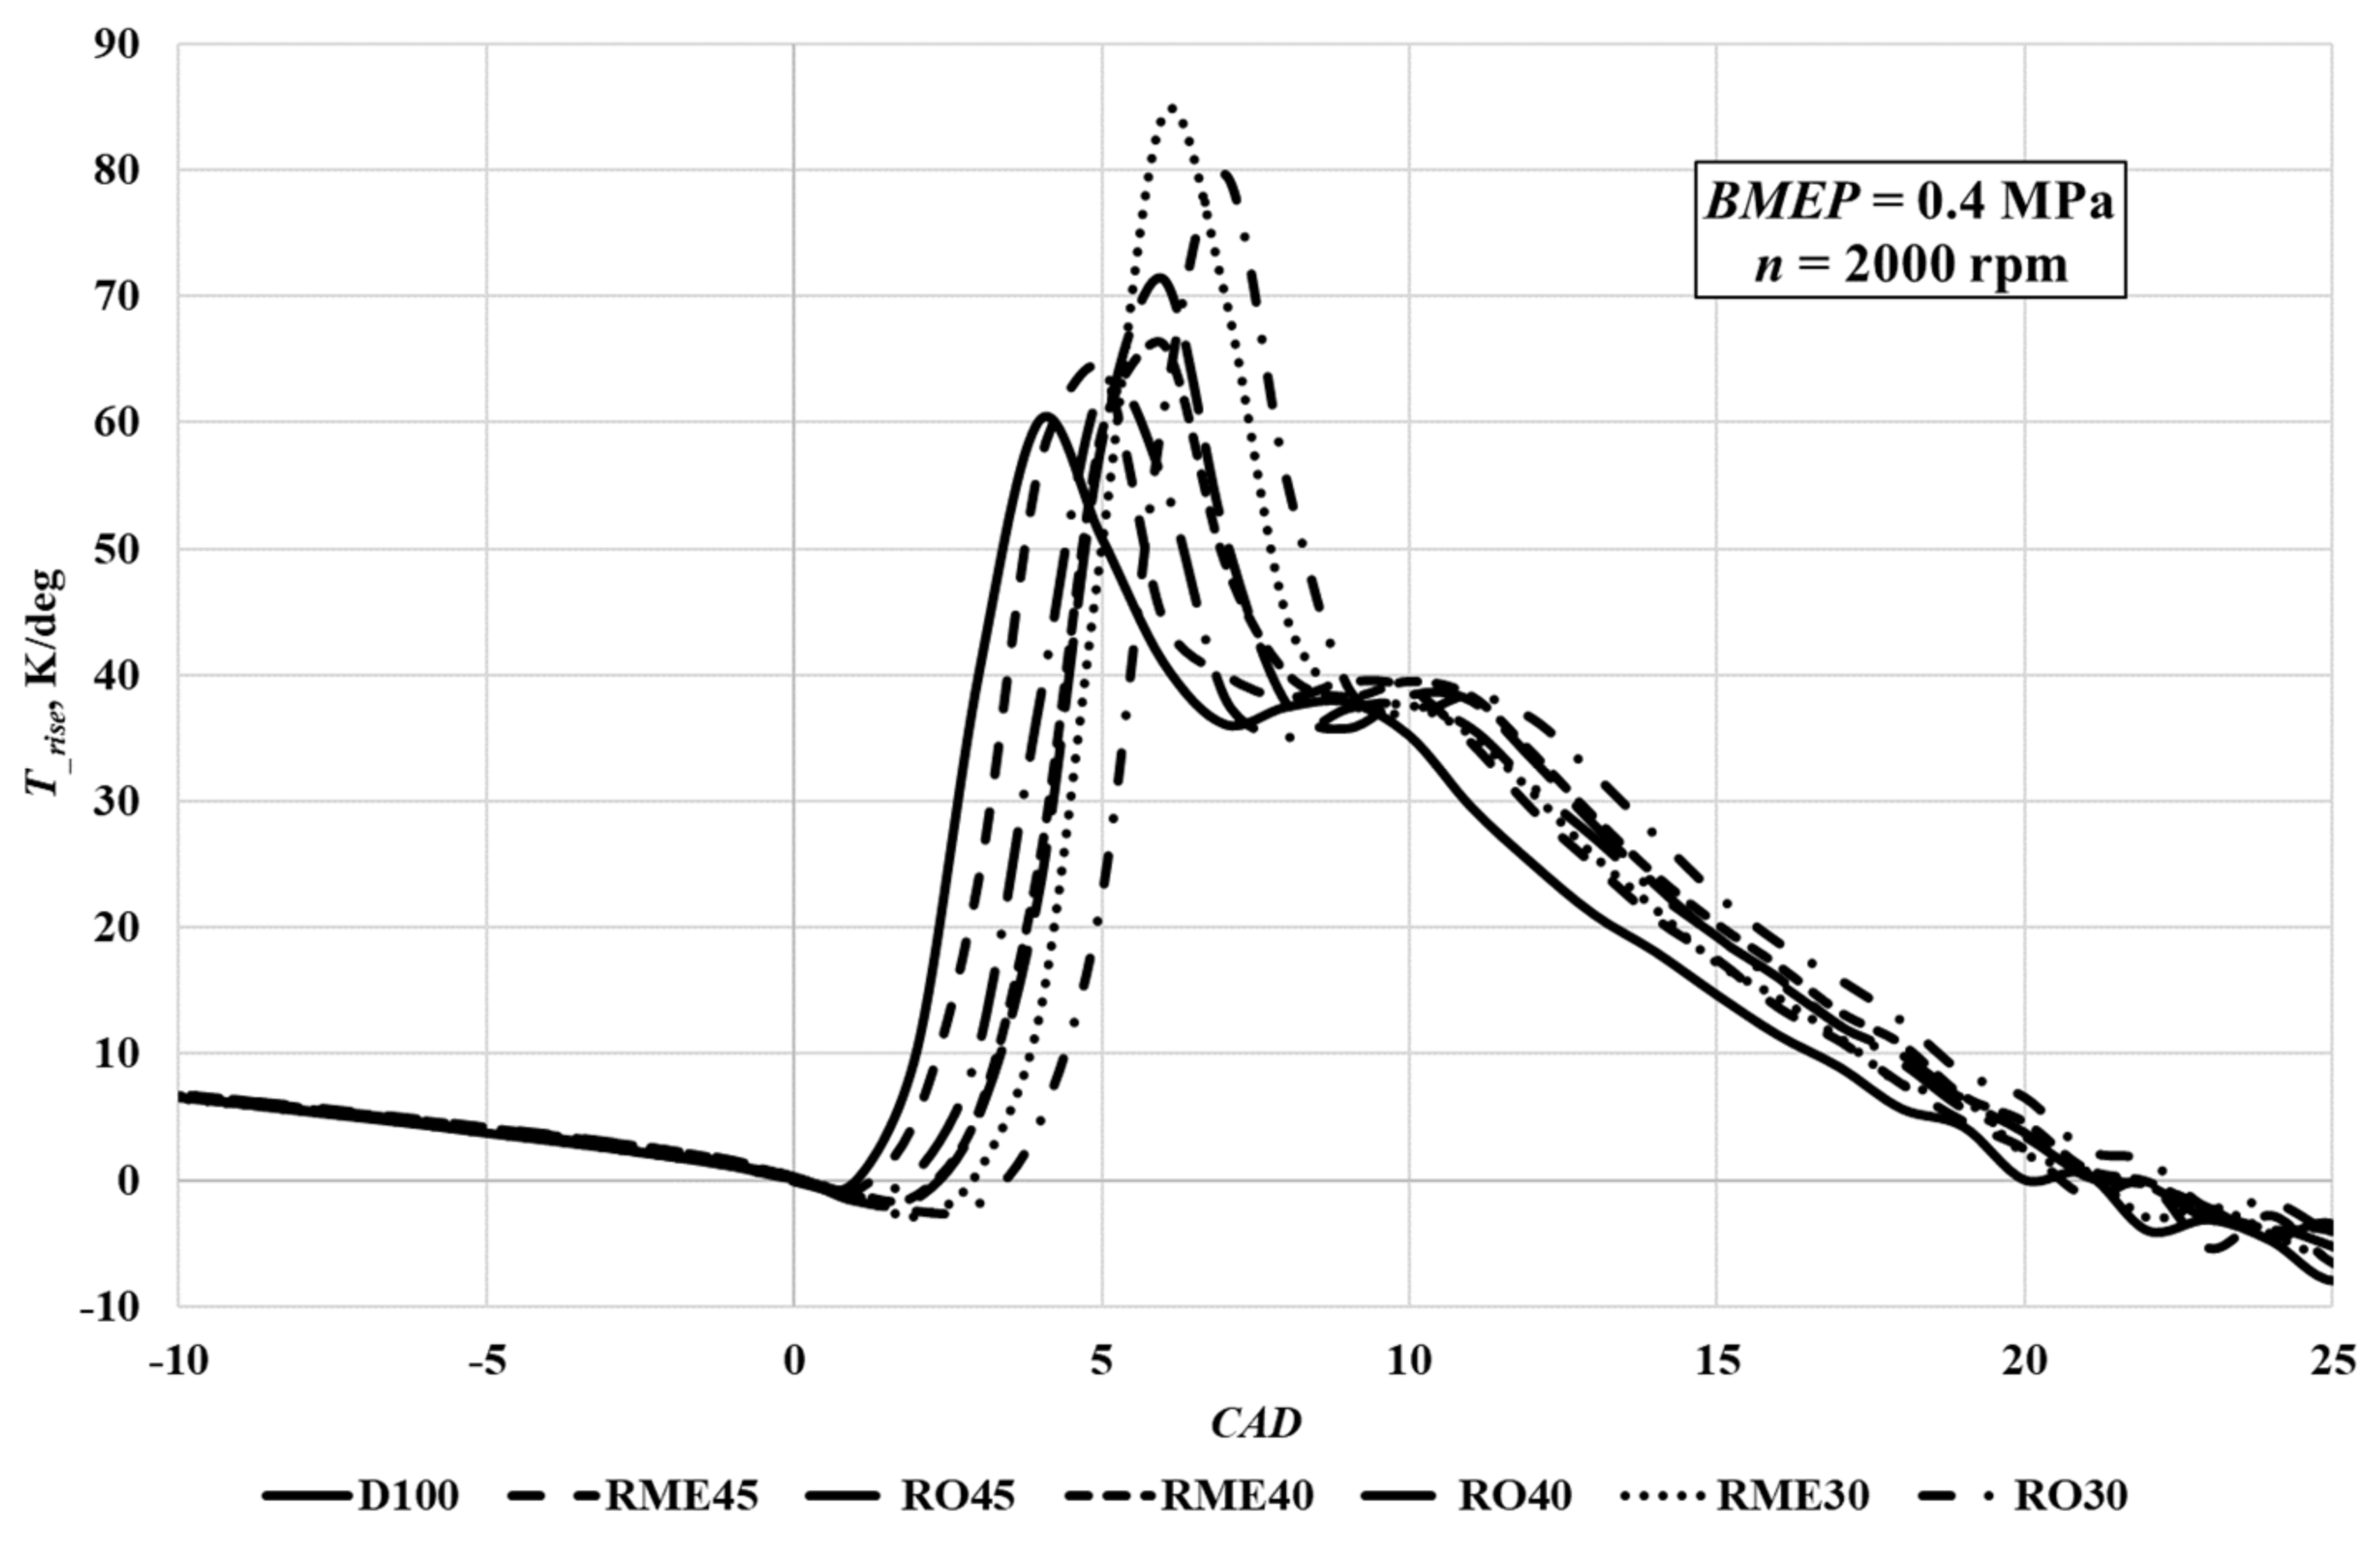
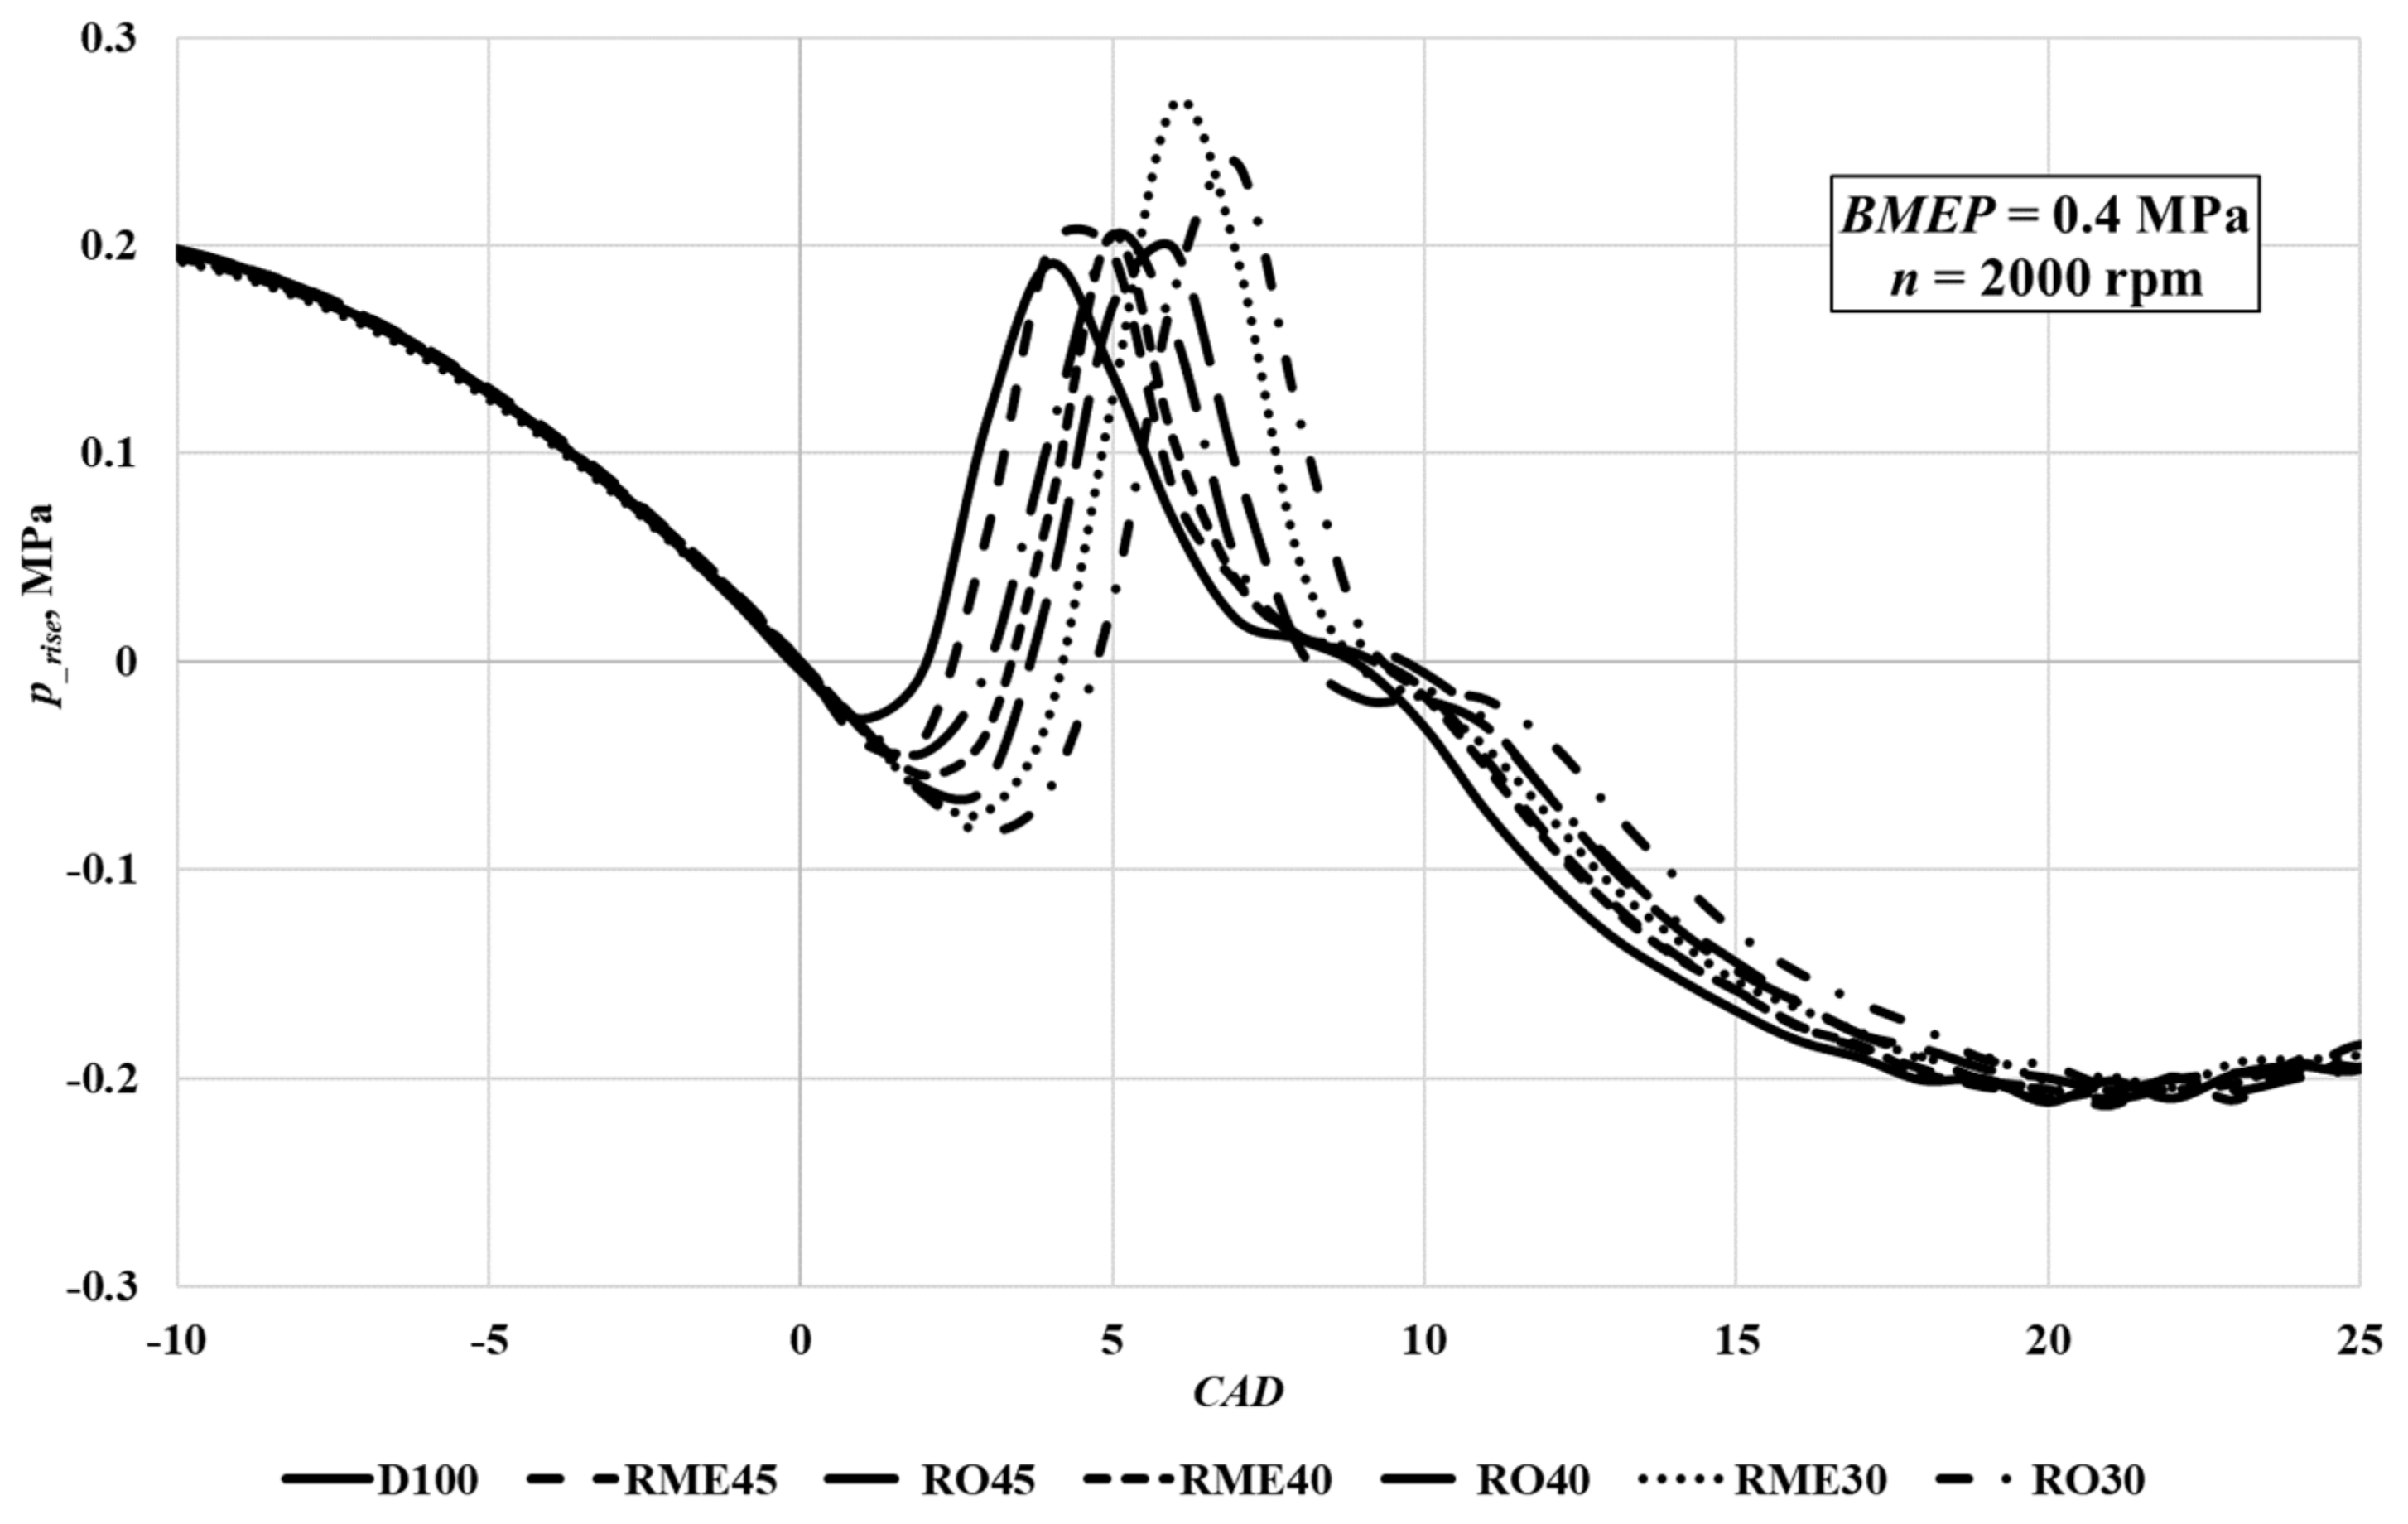
  • Maximum rate of heat release of diesel fuel was lower than all the remaining fuel mixtures, because the addition of alcohol reduced the cetane number, thereby increasing the ignition delay, which caused the heat release to rise at the premixed phase of combustion. Increased ROHR with increasing isopropanol concentration resulted in higher p_rise and T_rise, and this increased the mechanical and thermal load on the engine parts.
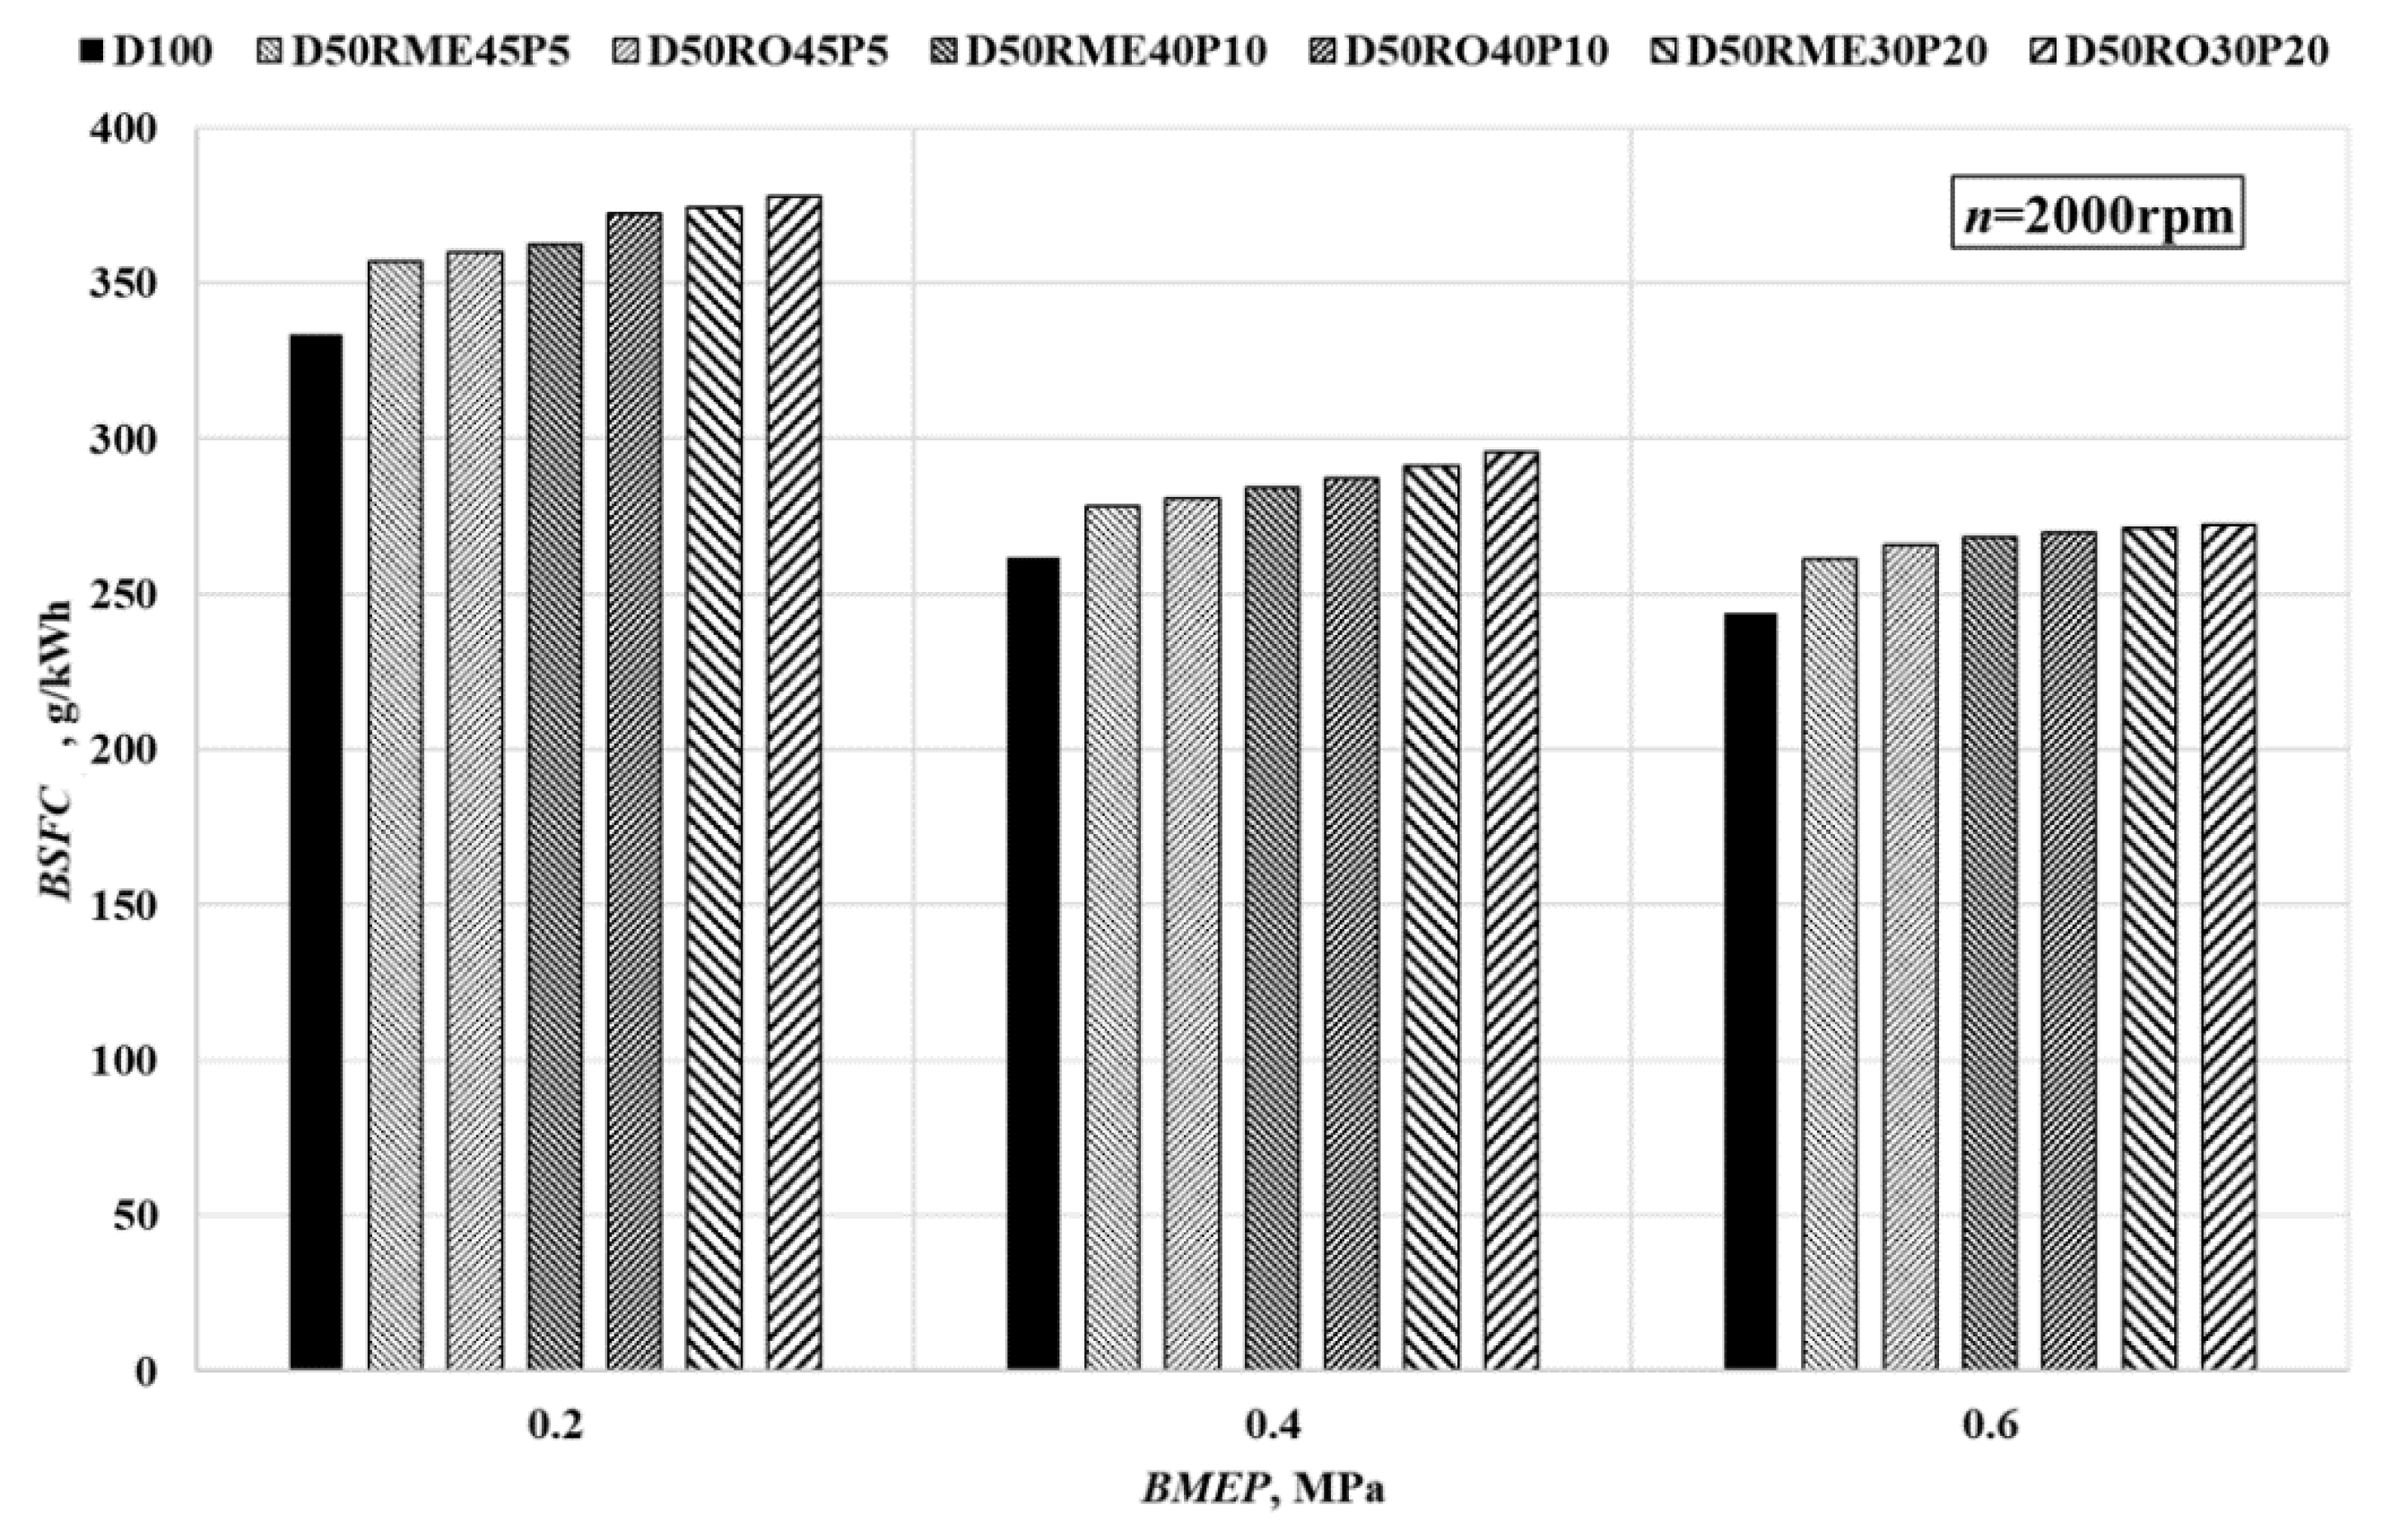
  • At 0.2 MPa, BSFC of D50RO30P20 was found to be ~13.2% more than that of diesel fuel. With increase in oxygen content of the fuel mixtures, BSFC increased. The trend of difference in BSFC between the highest of all fuel mixtures (D50RO30P20) when compared to diesel fuel decreased with increase in load (difference when calculated in percentage was found to be ~13.2% at 0.2 MPa, ~12.87% at 0.4 MPa and ~11.6% at 0.6 MPa).
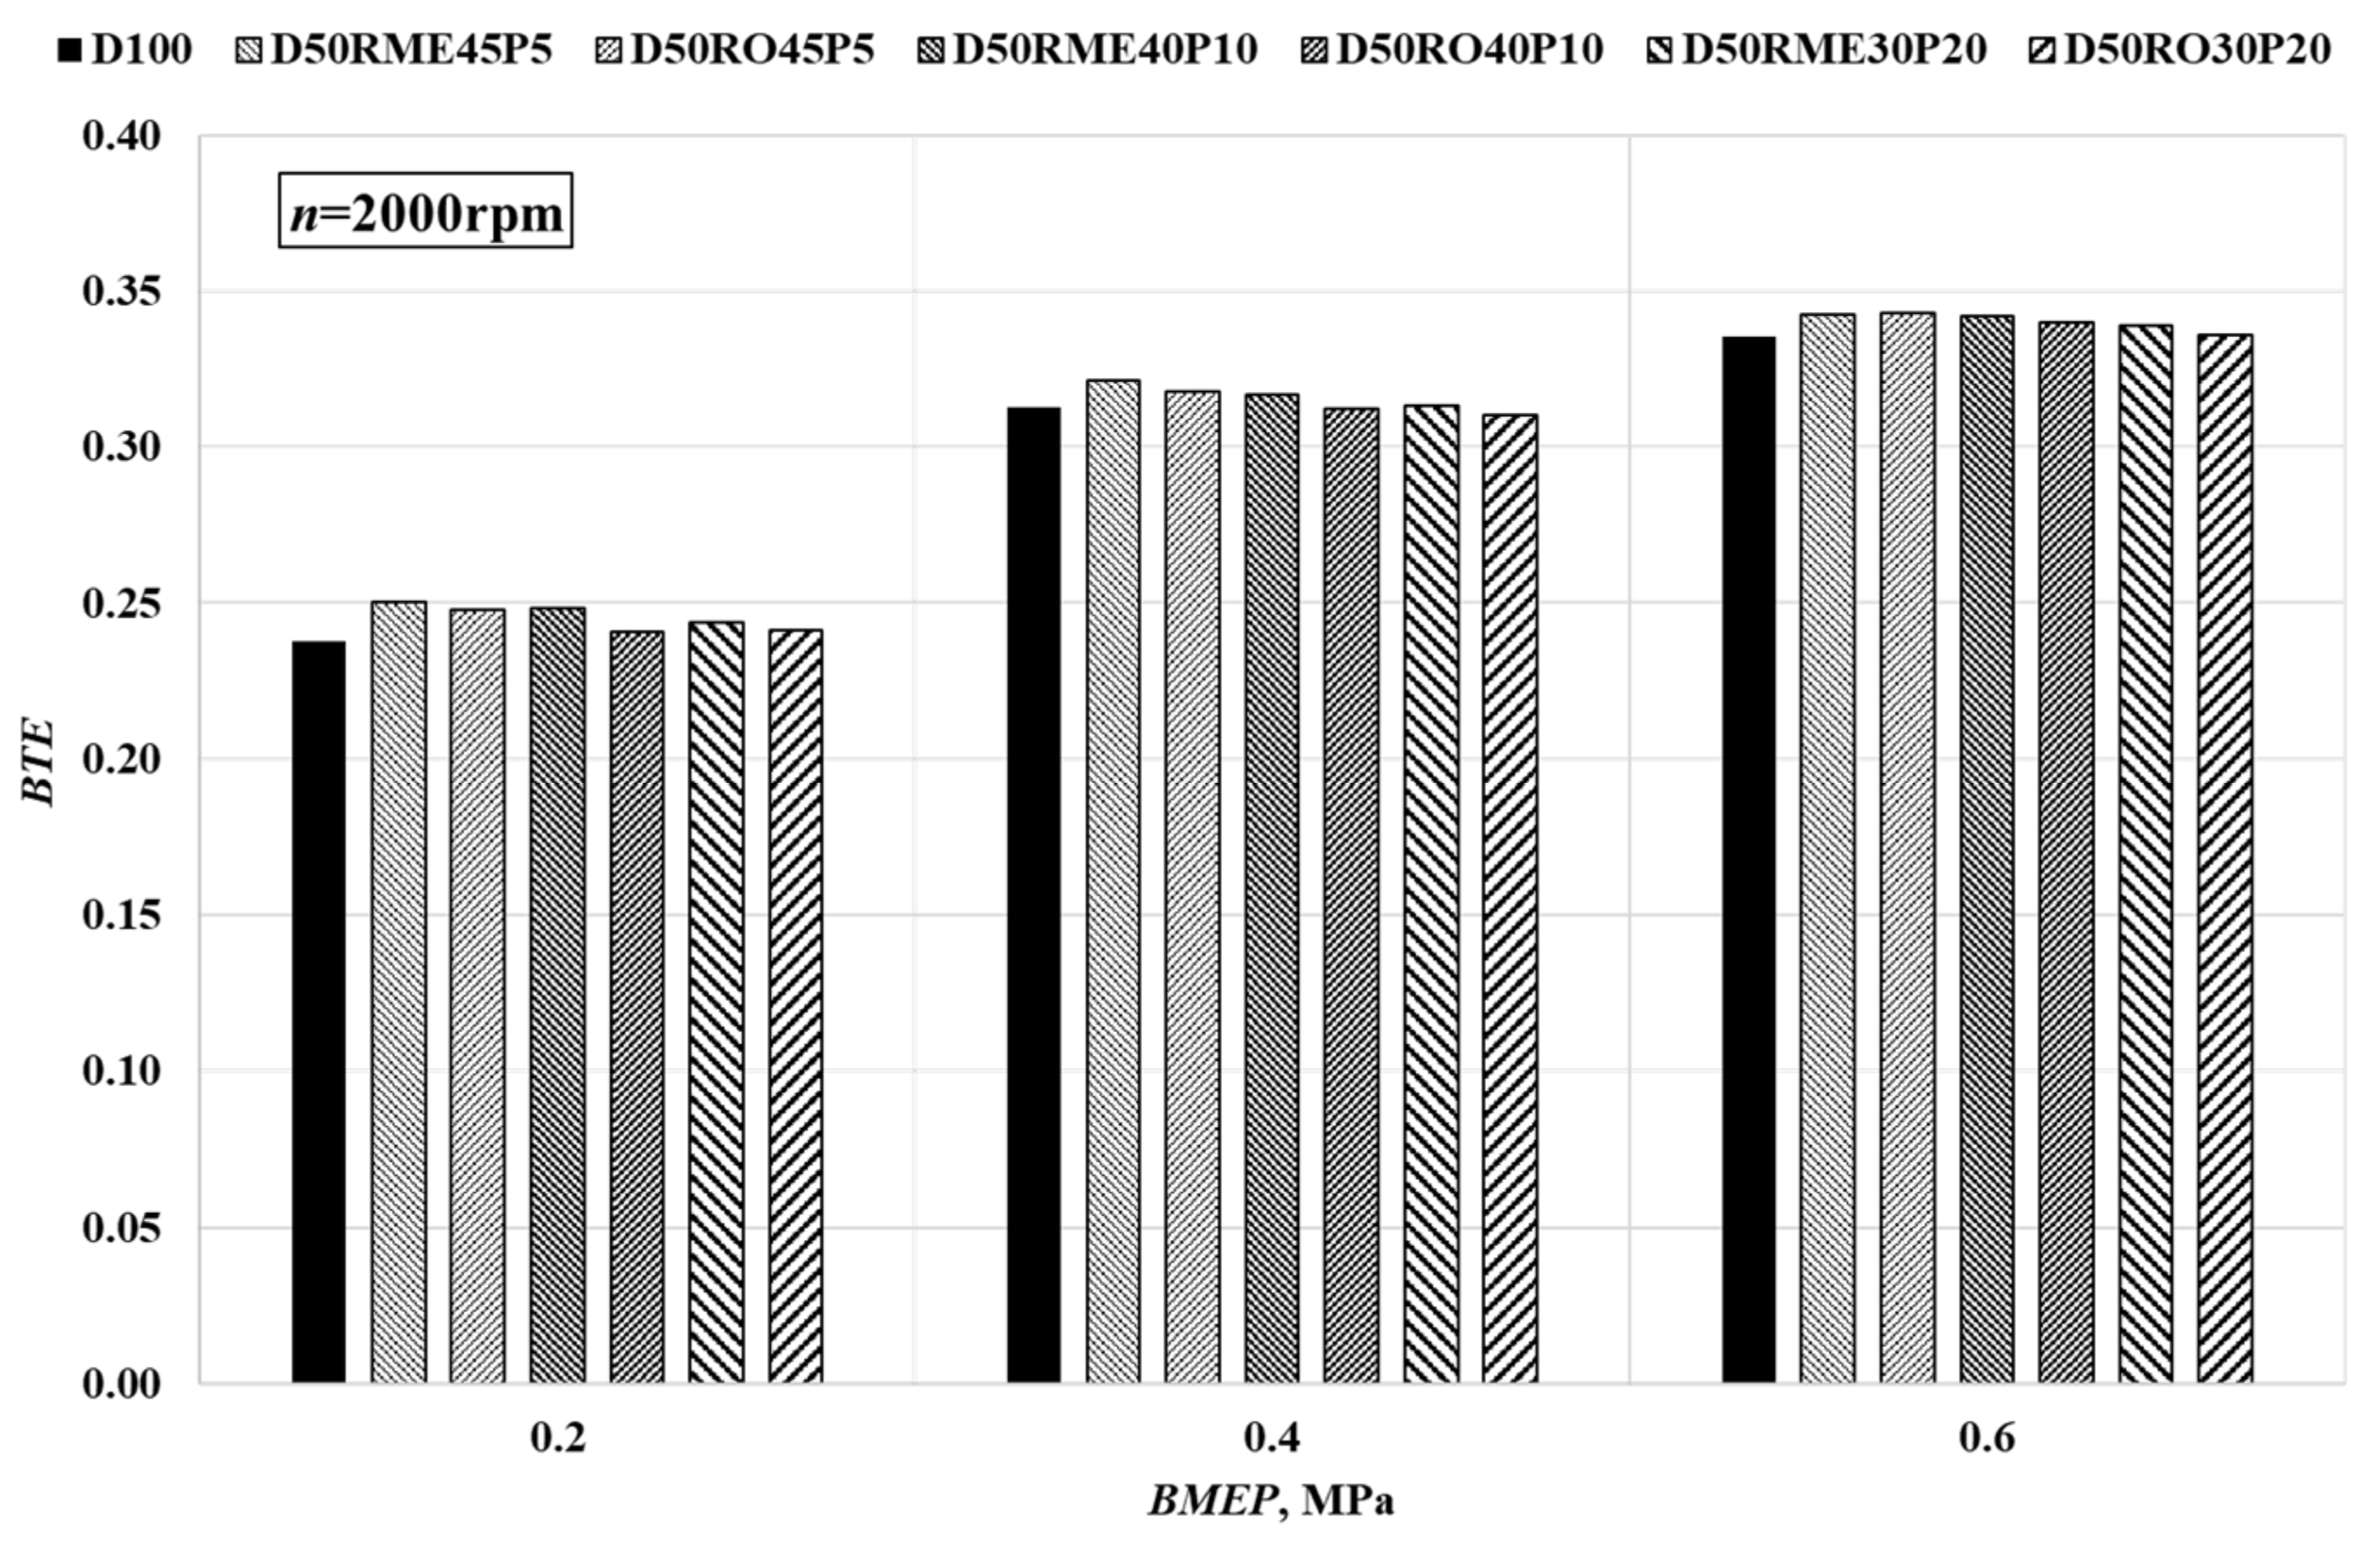
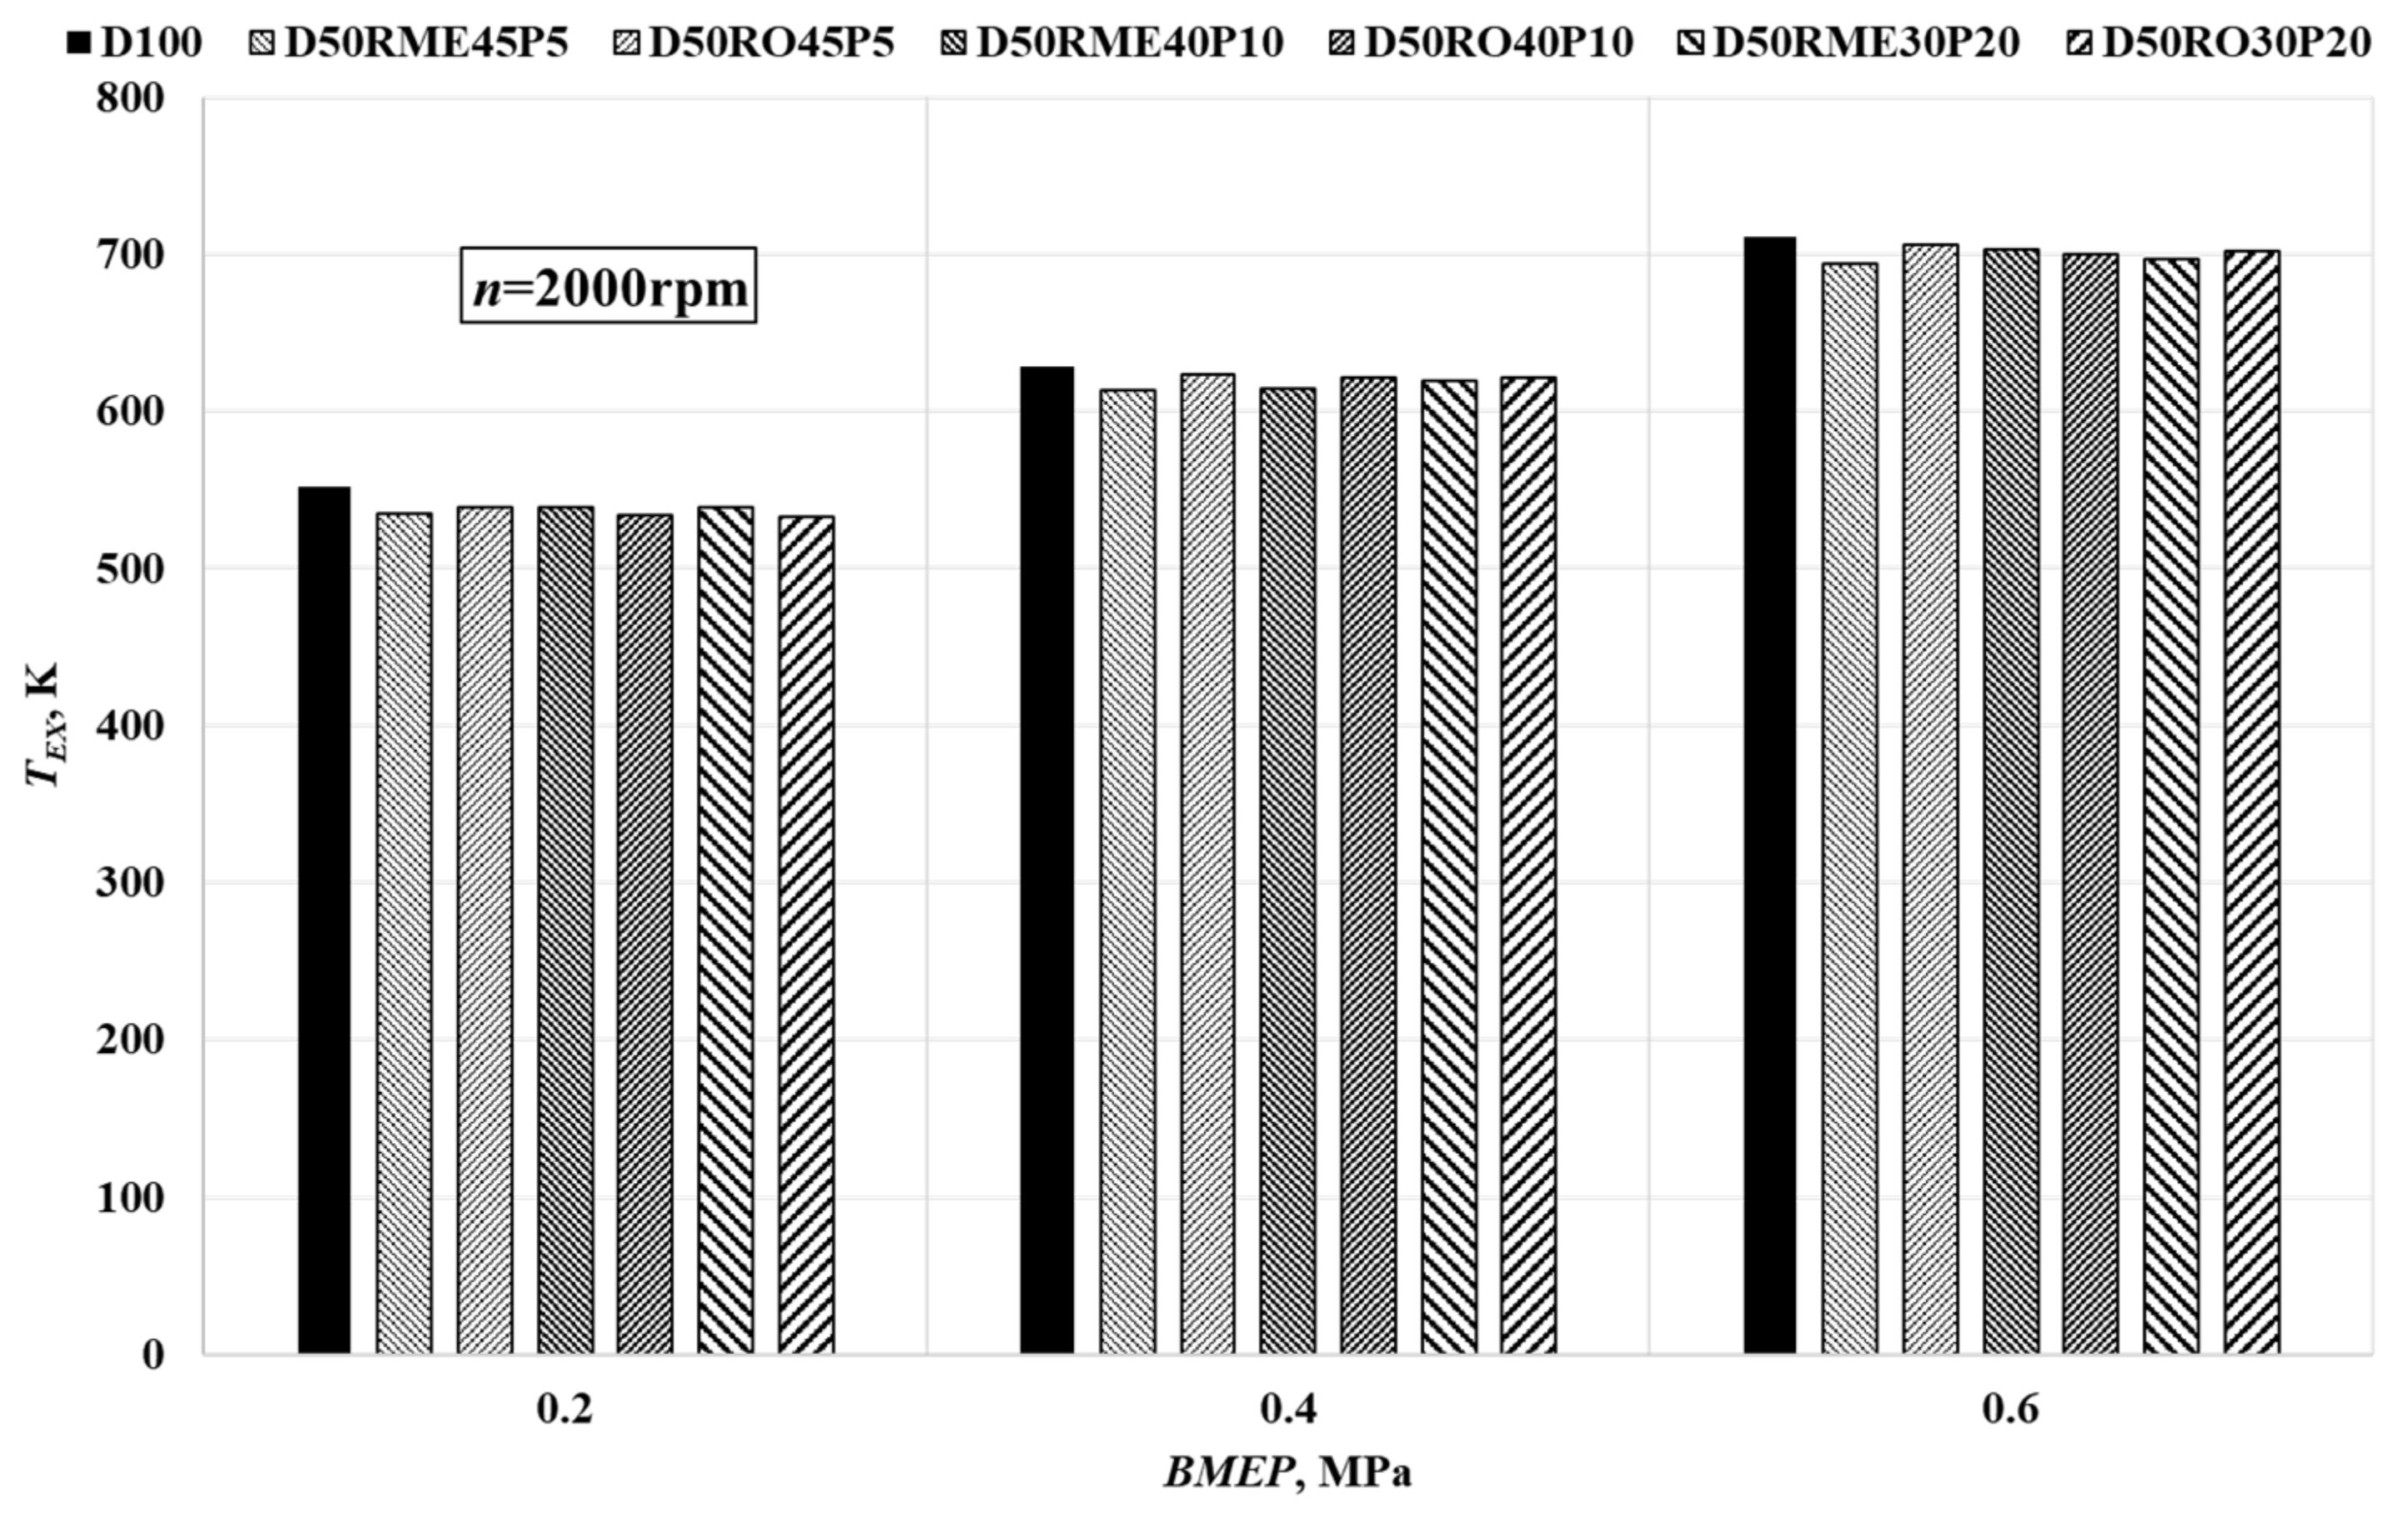
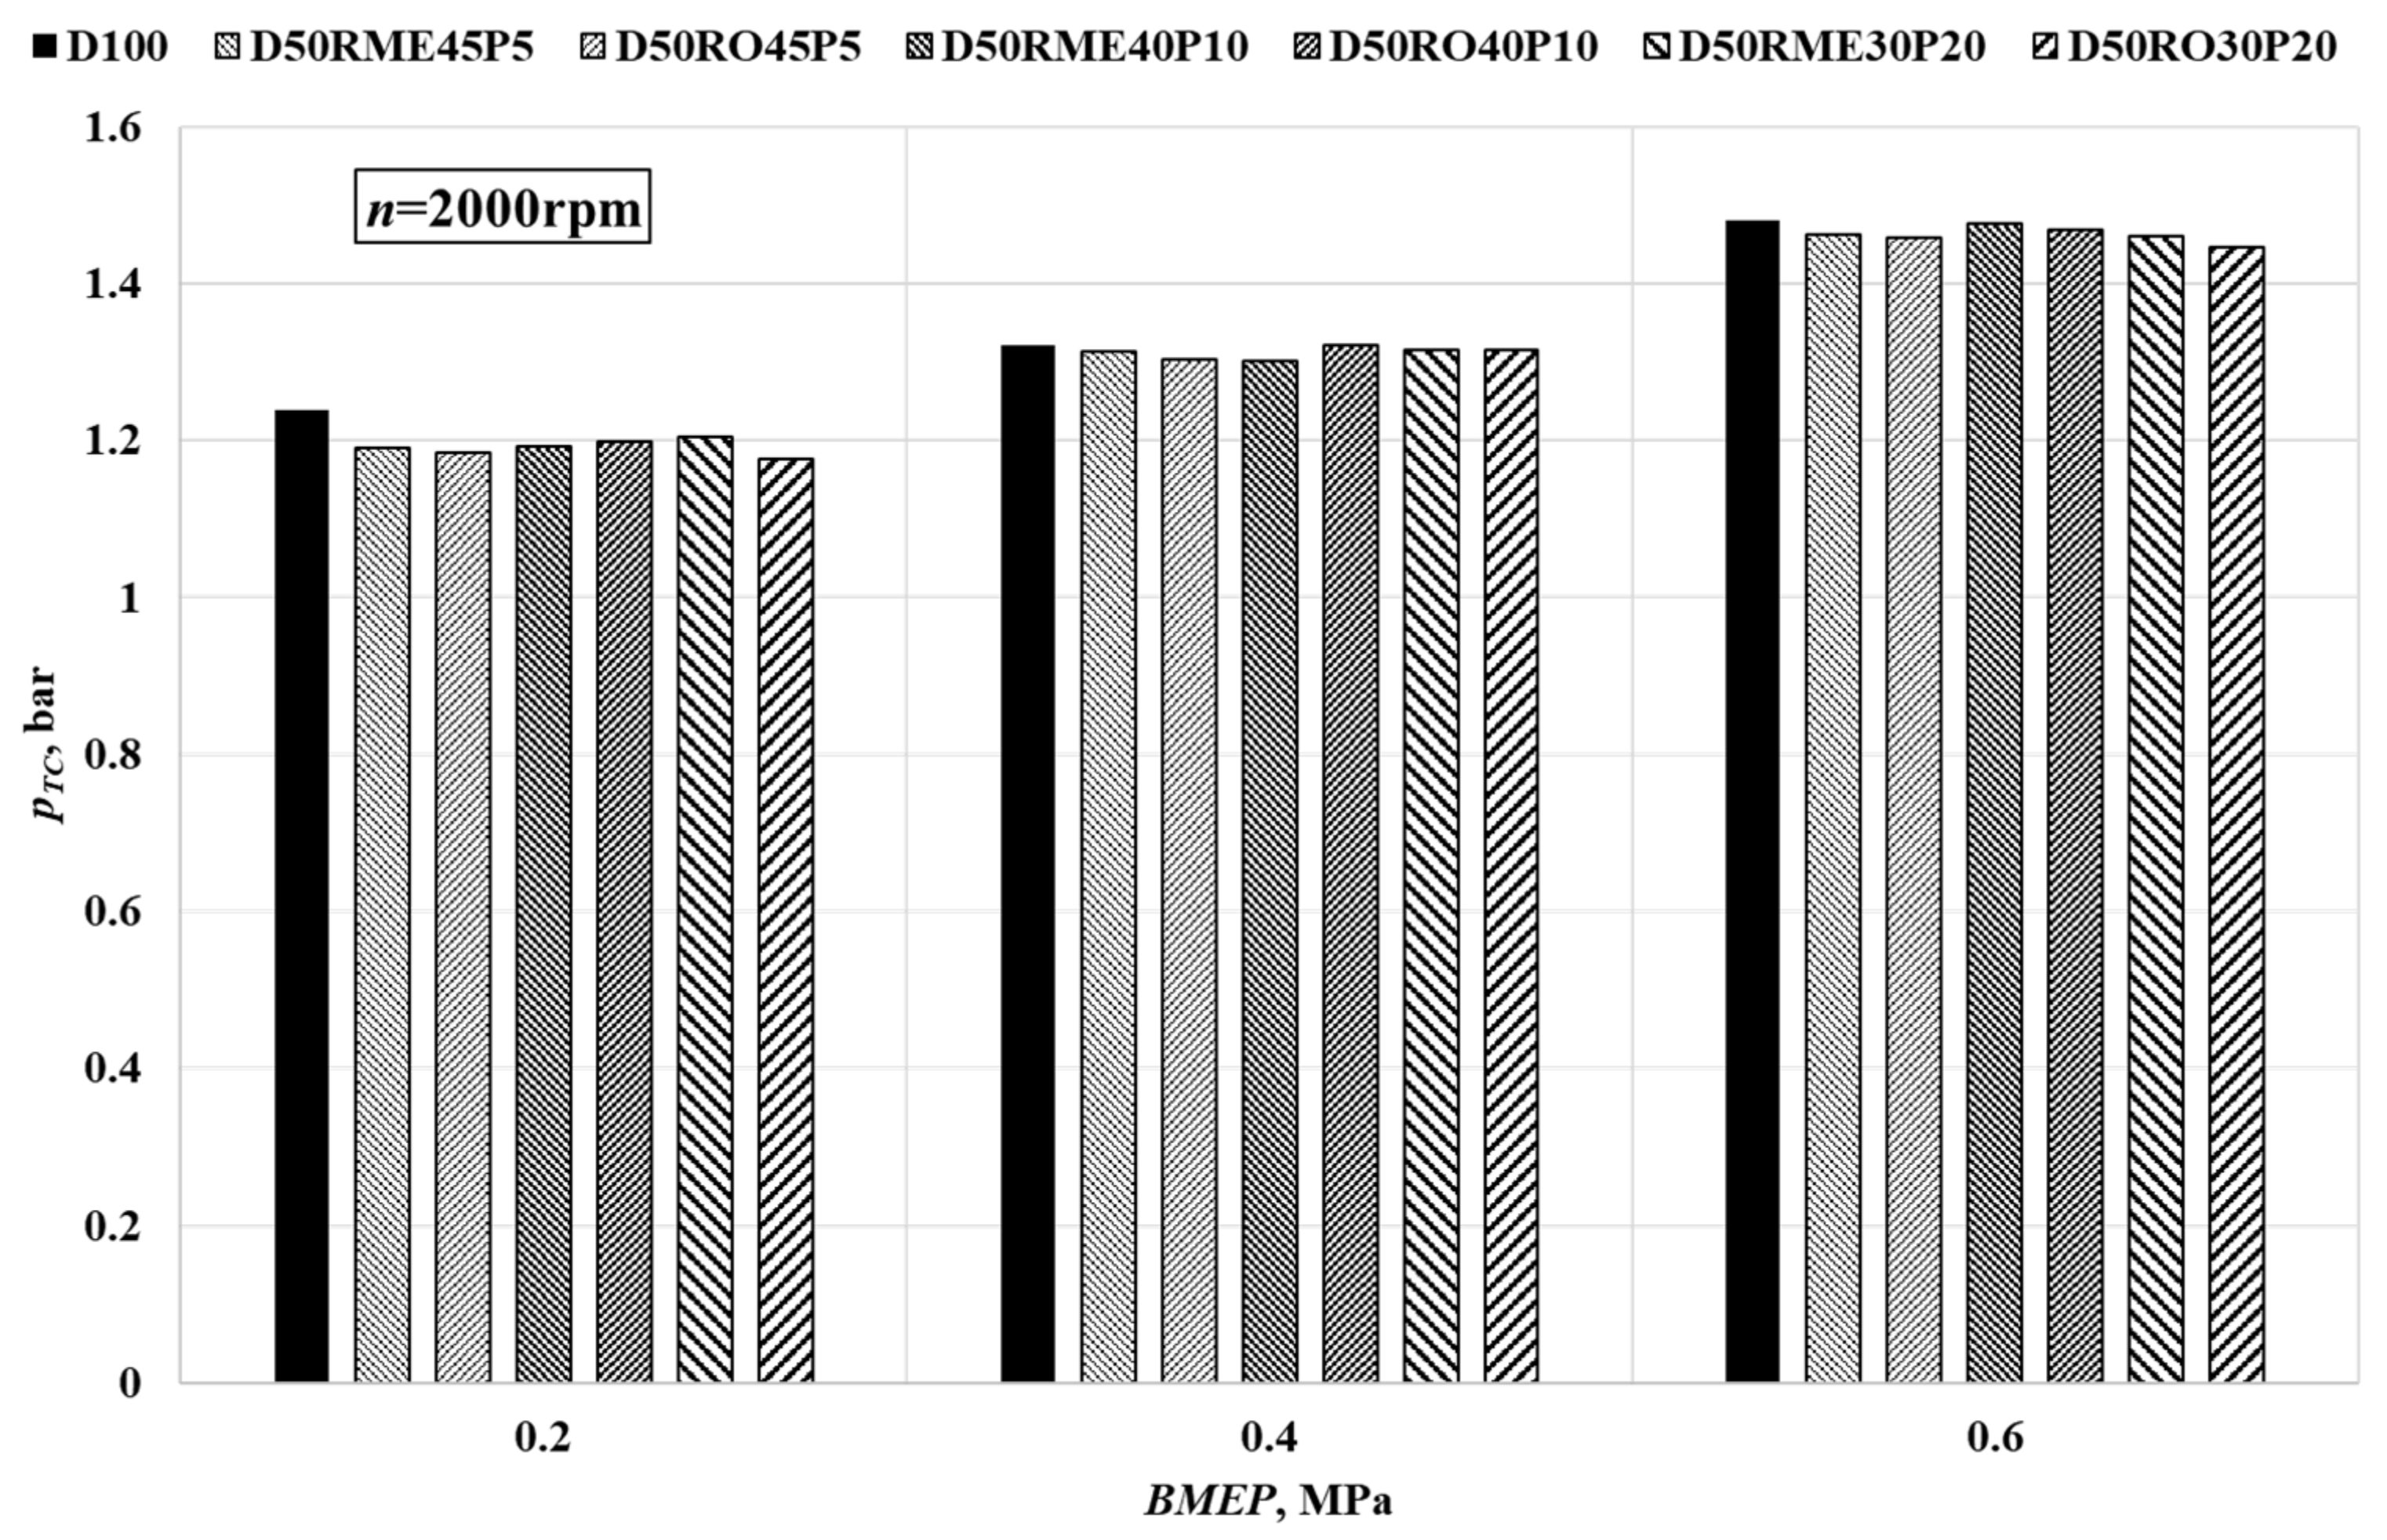
  • At all loads, RME mixtures tend to show greater efficiency than RO mixtures. The percentage of difference at 0.2 MPa was found to be ~1.2–2%, and the difference was found to be decreasing with the load. At 0.2 MPa, BTE of D50RME45P5 was ~5.9% greater than that of D100, followed by ~3.2% at 0.4 MPa and ~2.3% at 0.6 MPa. Both TEG and pTC were found to decrease when using diesel fuel mixtures with RME or RO and Isopropanol. This indicates that these mixtures burn faster due to the increased oxygen concentration.
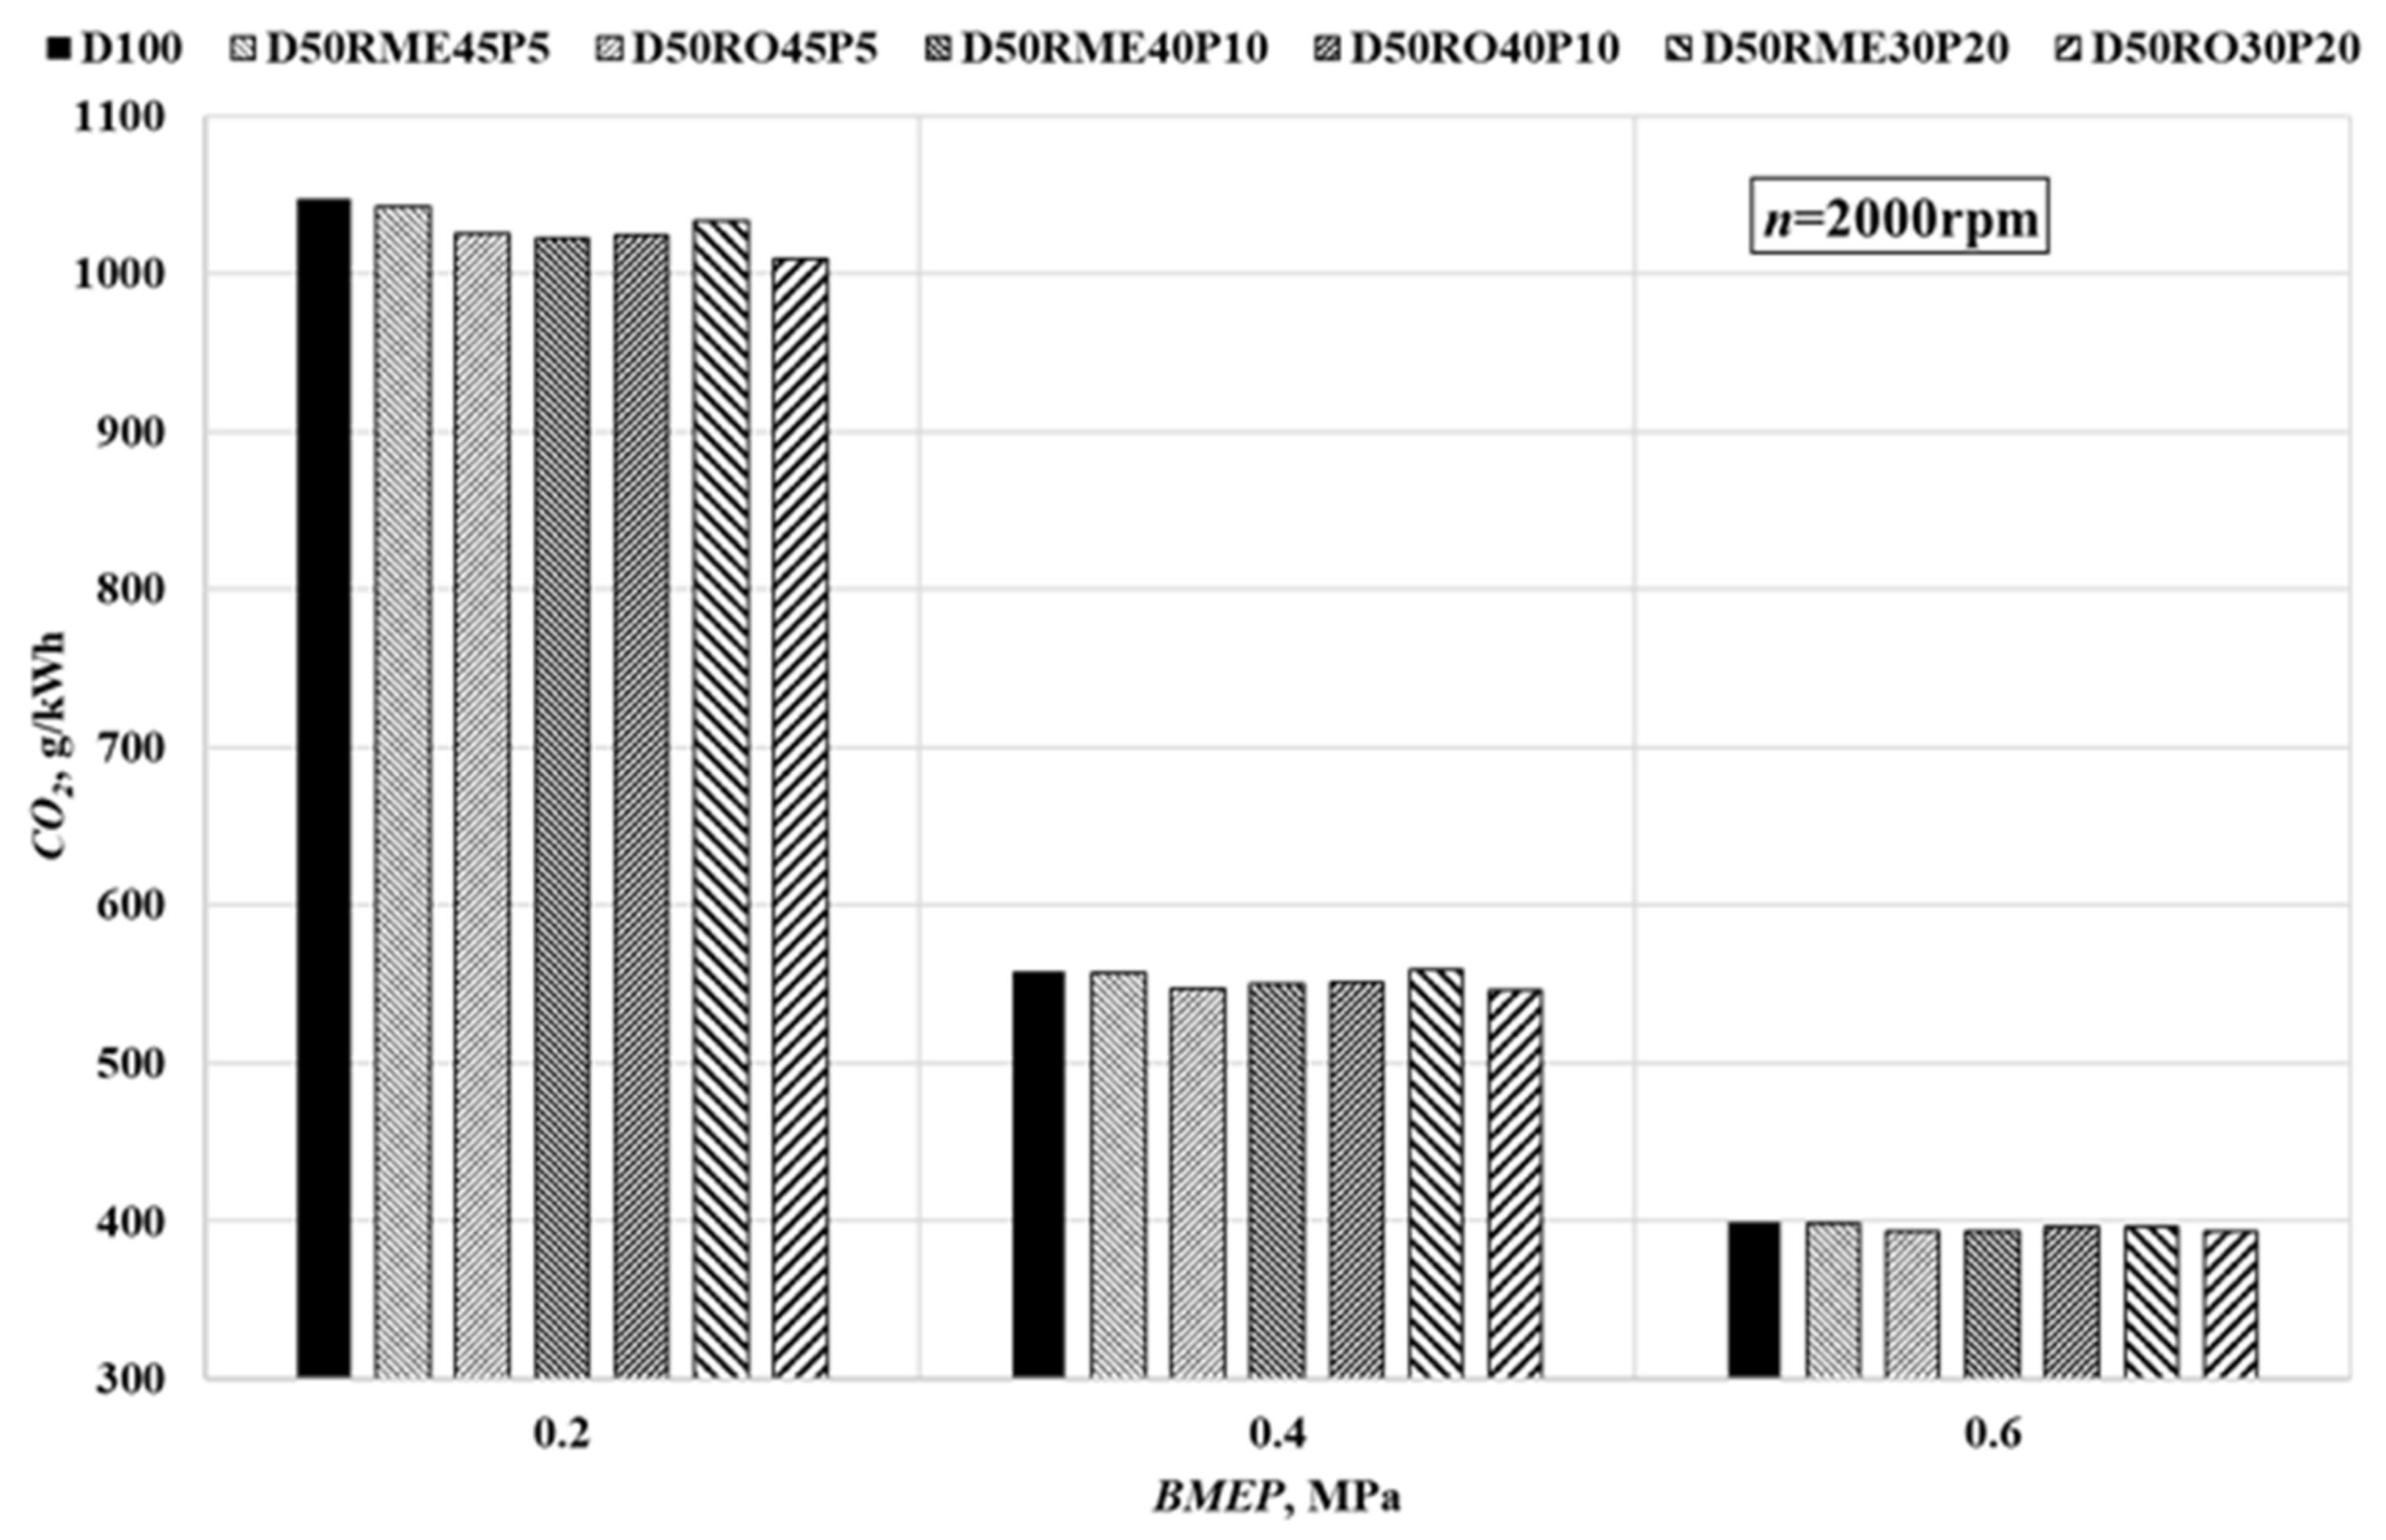
  • At relatively high tested loads, 0.6 MPa, all the fuels tended to have nearly similar amounts of emissions. At 0.2 MPa, diesel fuel tended to have the highest amounts of CO2 emission, that is, ~3.6% higher than that of D50RO30P20. At 0.4 MPa and 0.6 MPa, the difference was found to be ~2.2% and ~1.3%. The difference between these mixtures decreased with increase in load.
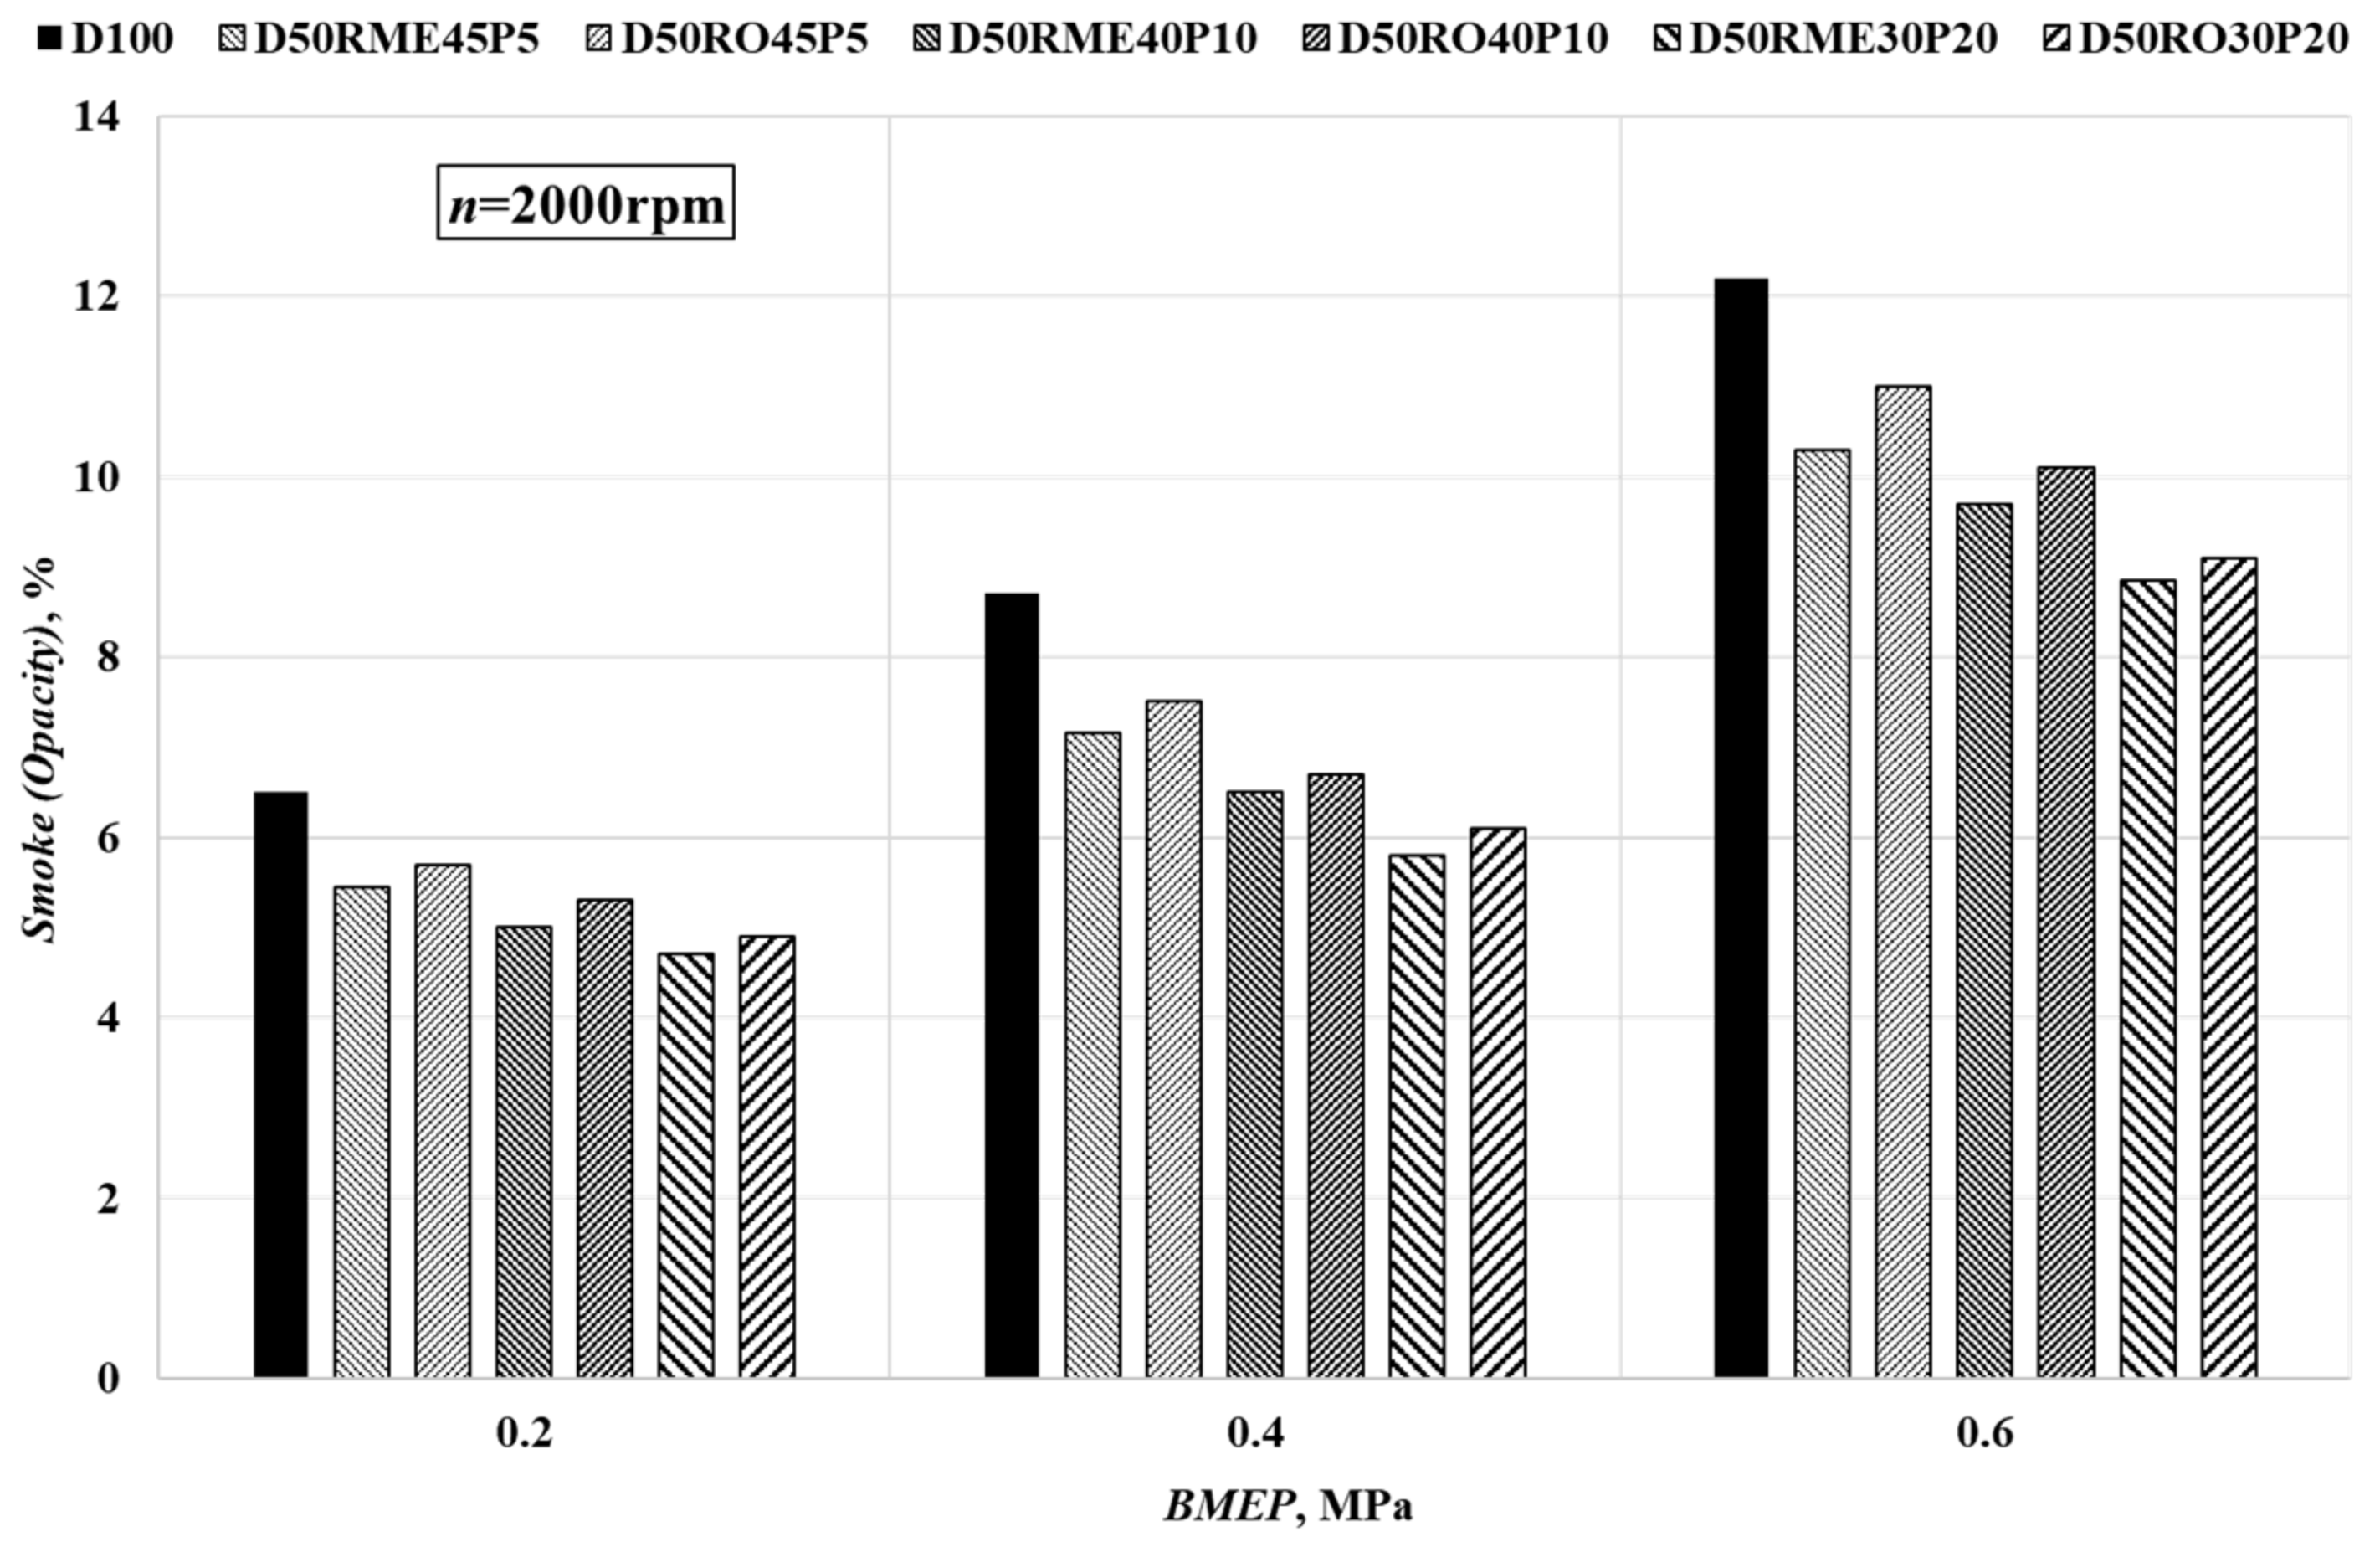
  • Among all the tested loads, diesel fuel was found to record the highest level of smoke opacity due to the lack of oxygen content. With the addition of alcohol, the smoke decreased gradually. At all loads, mixtures with RME were found to be lower than RO at an average difference of ~4–5% because of its low C/H ratio.
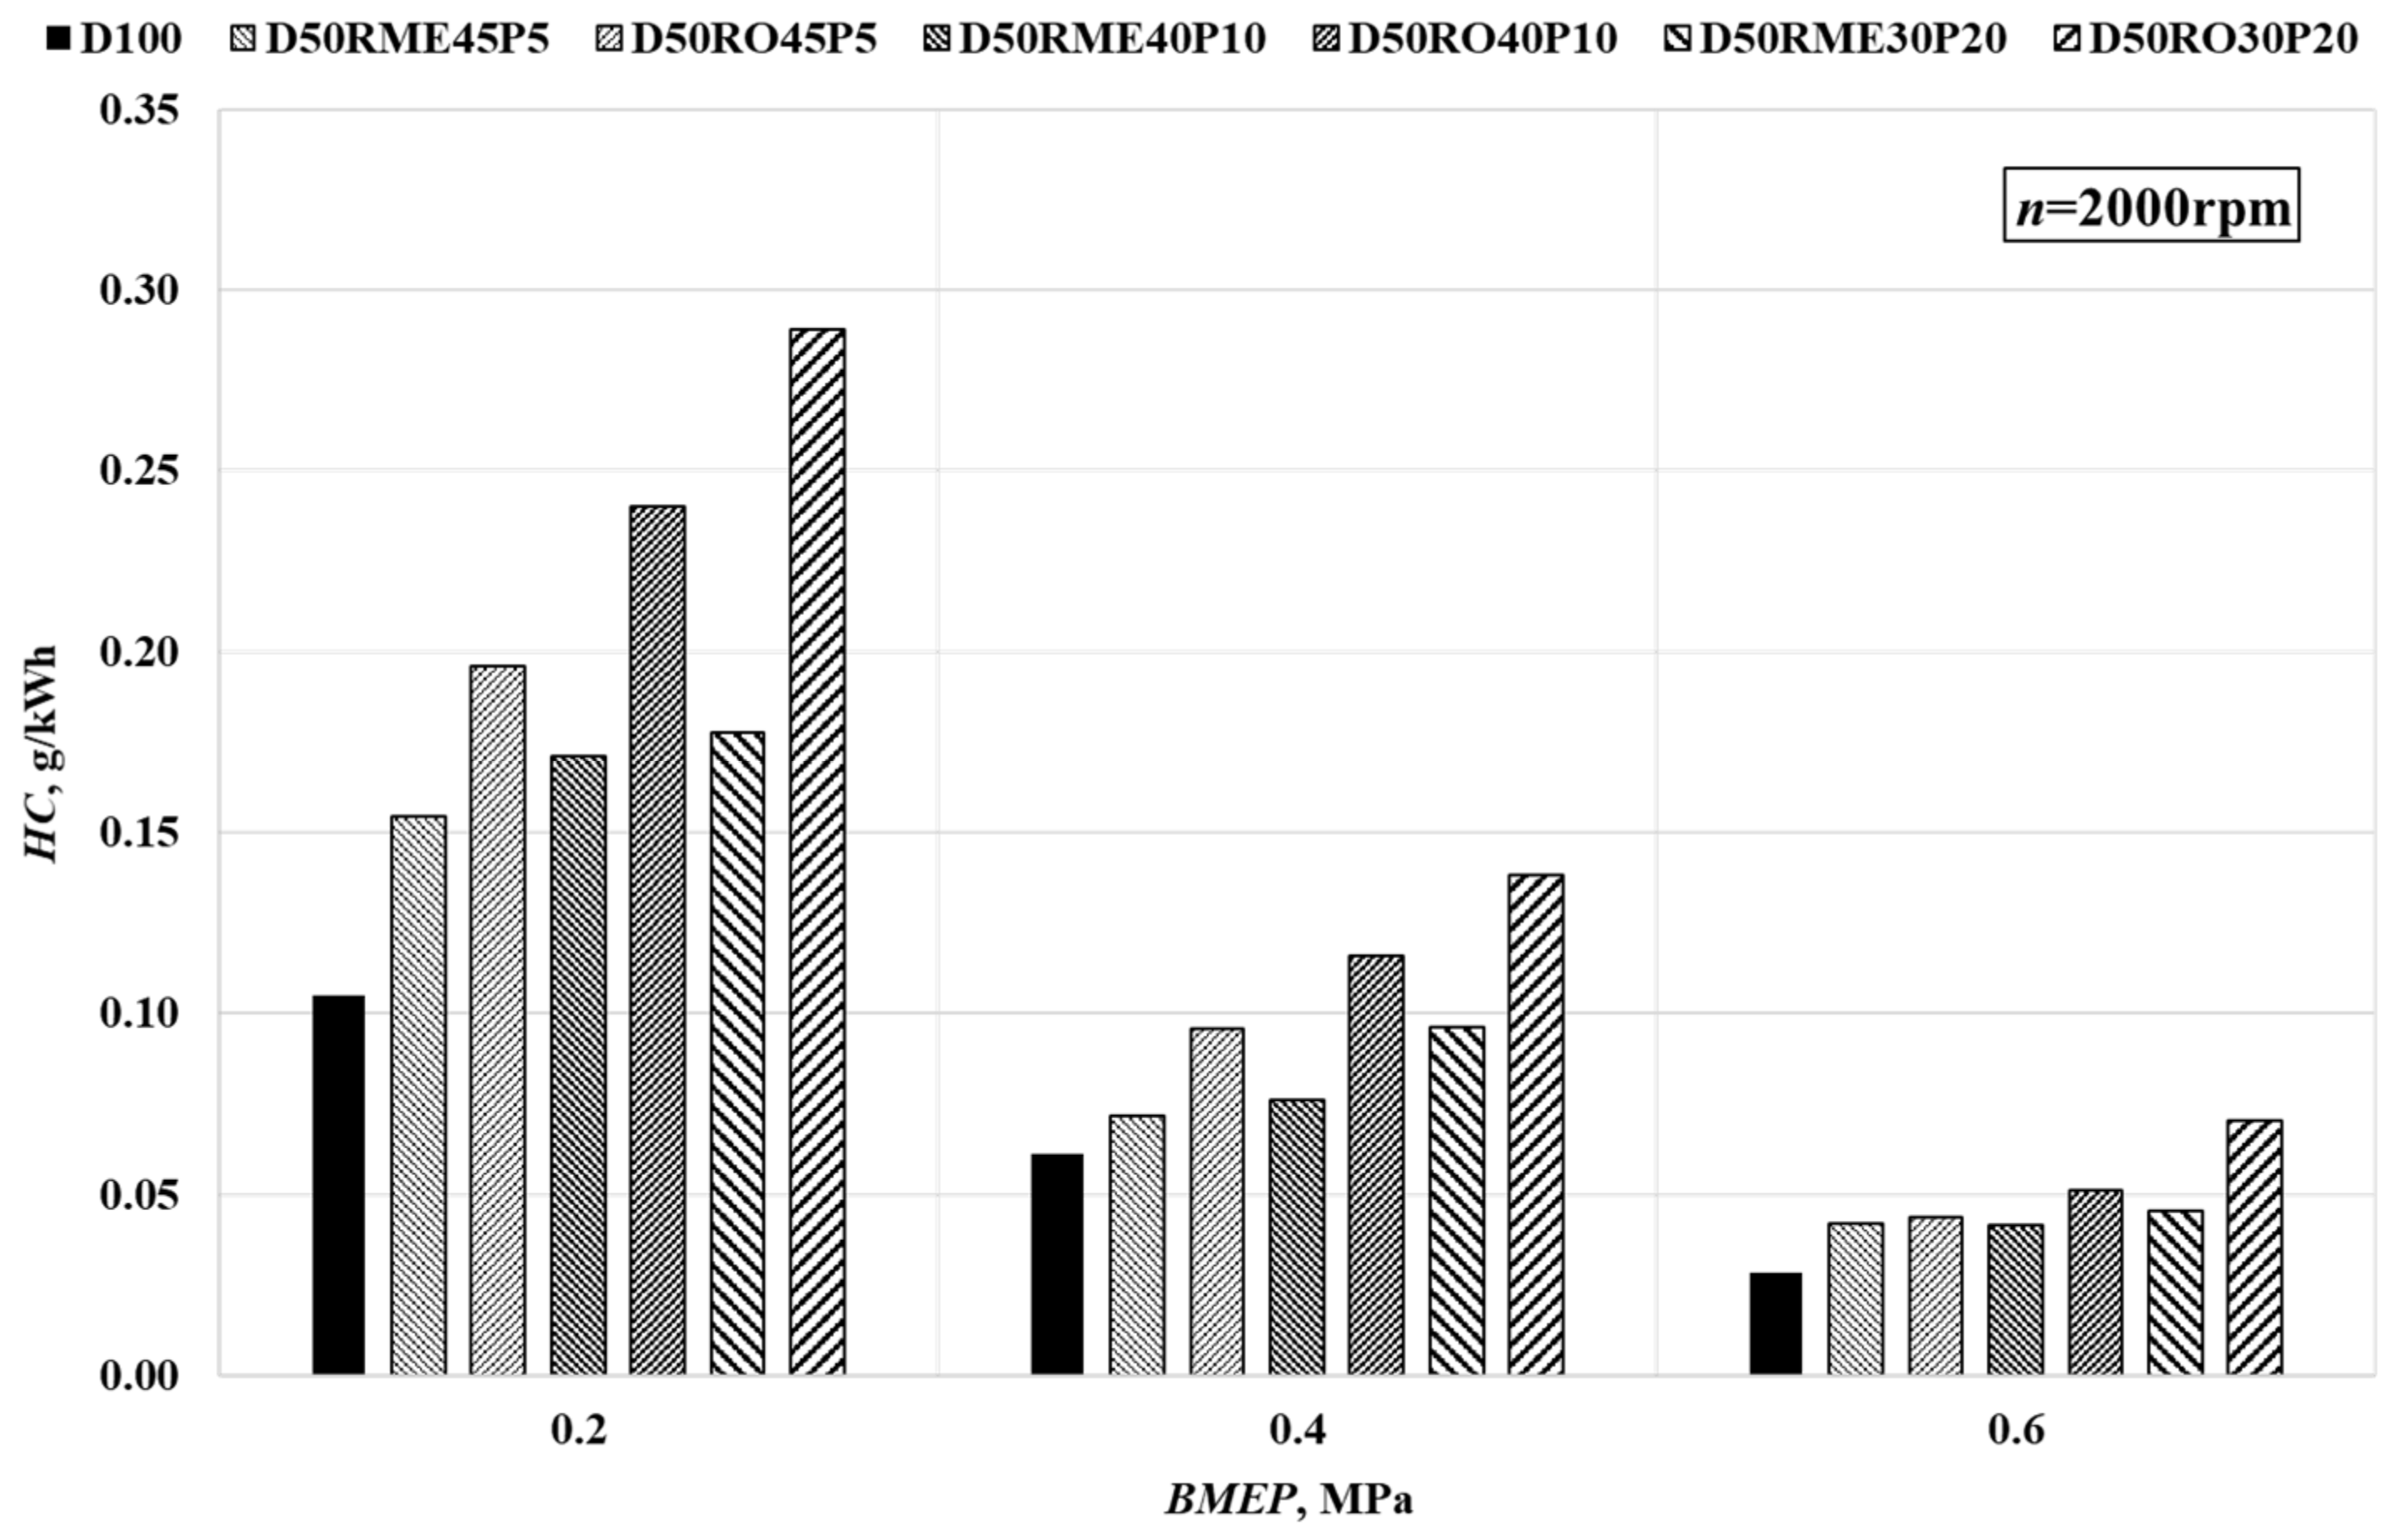
  • HC emissions of all fuel mixtures including diesel fuel were found to be decreasing with increase in the load because of the rise in combustion temperature. With the increase in alcohol percentage, mixtures tended to show an increase in HC emissions.
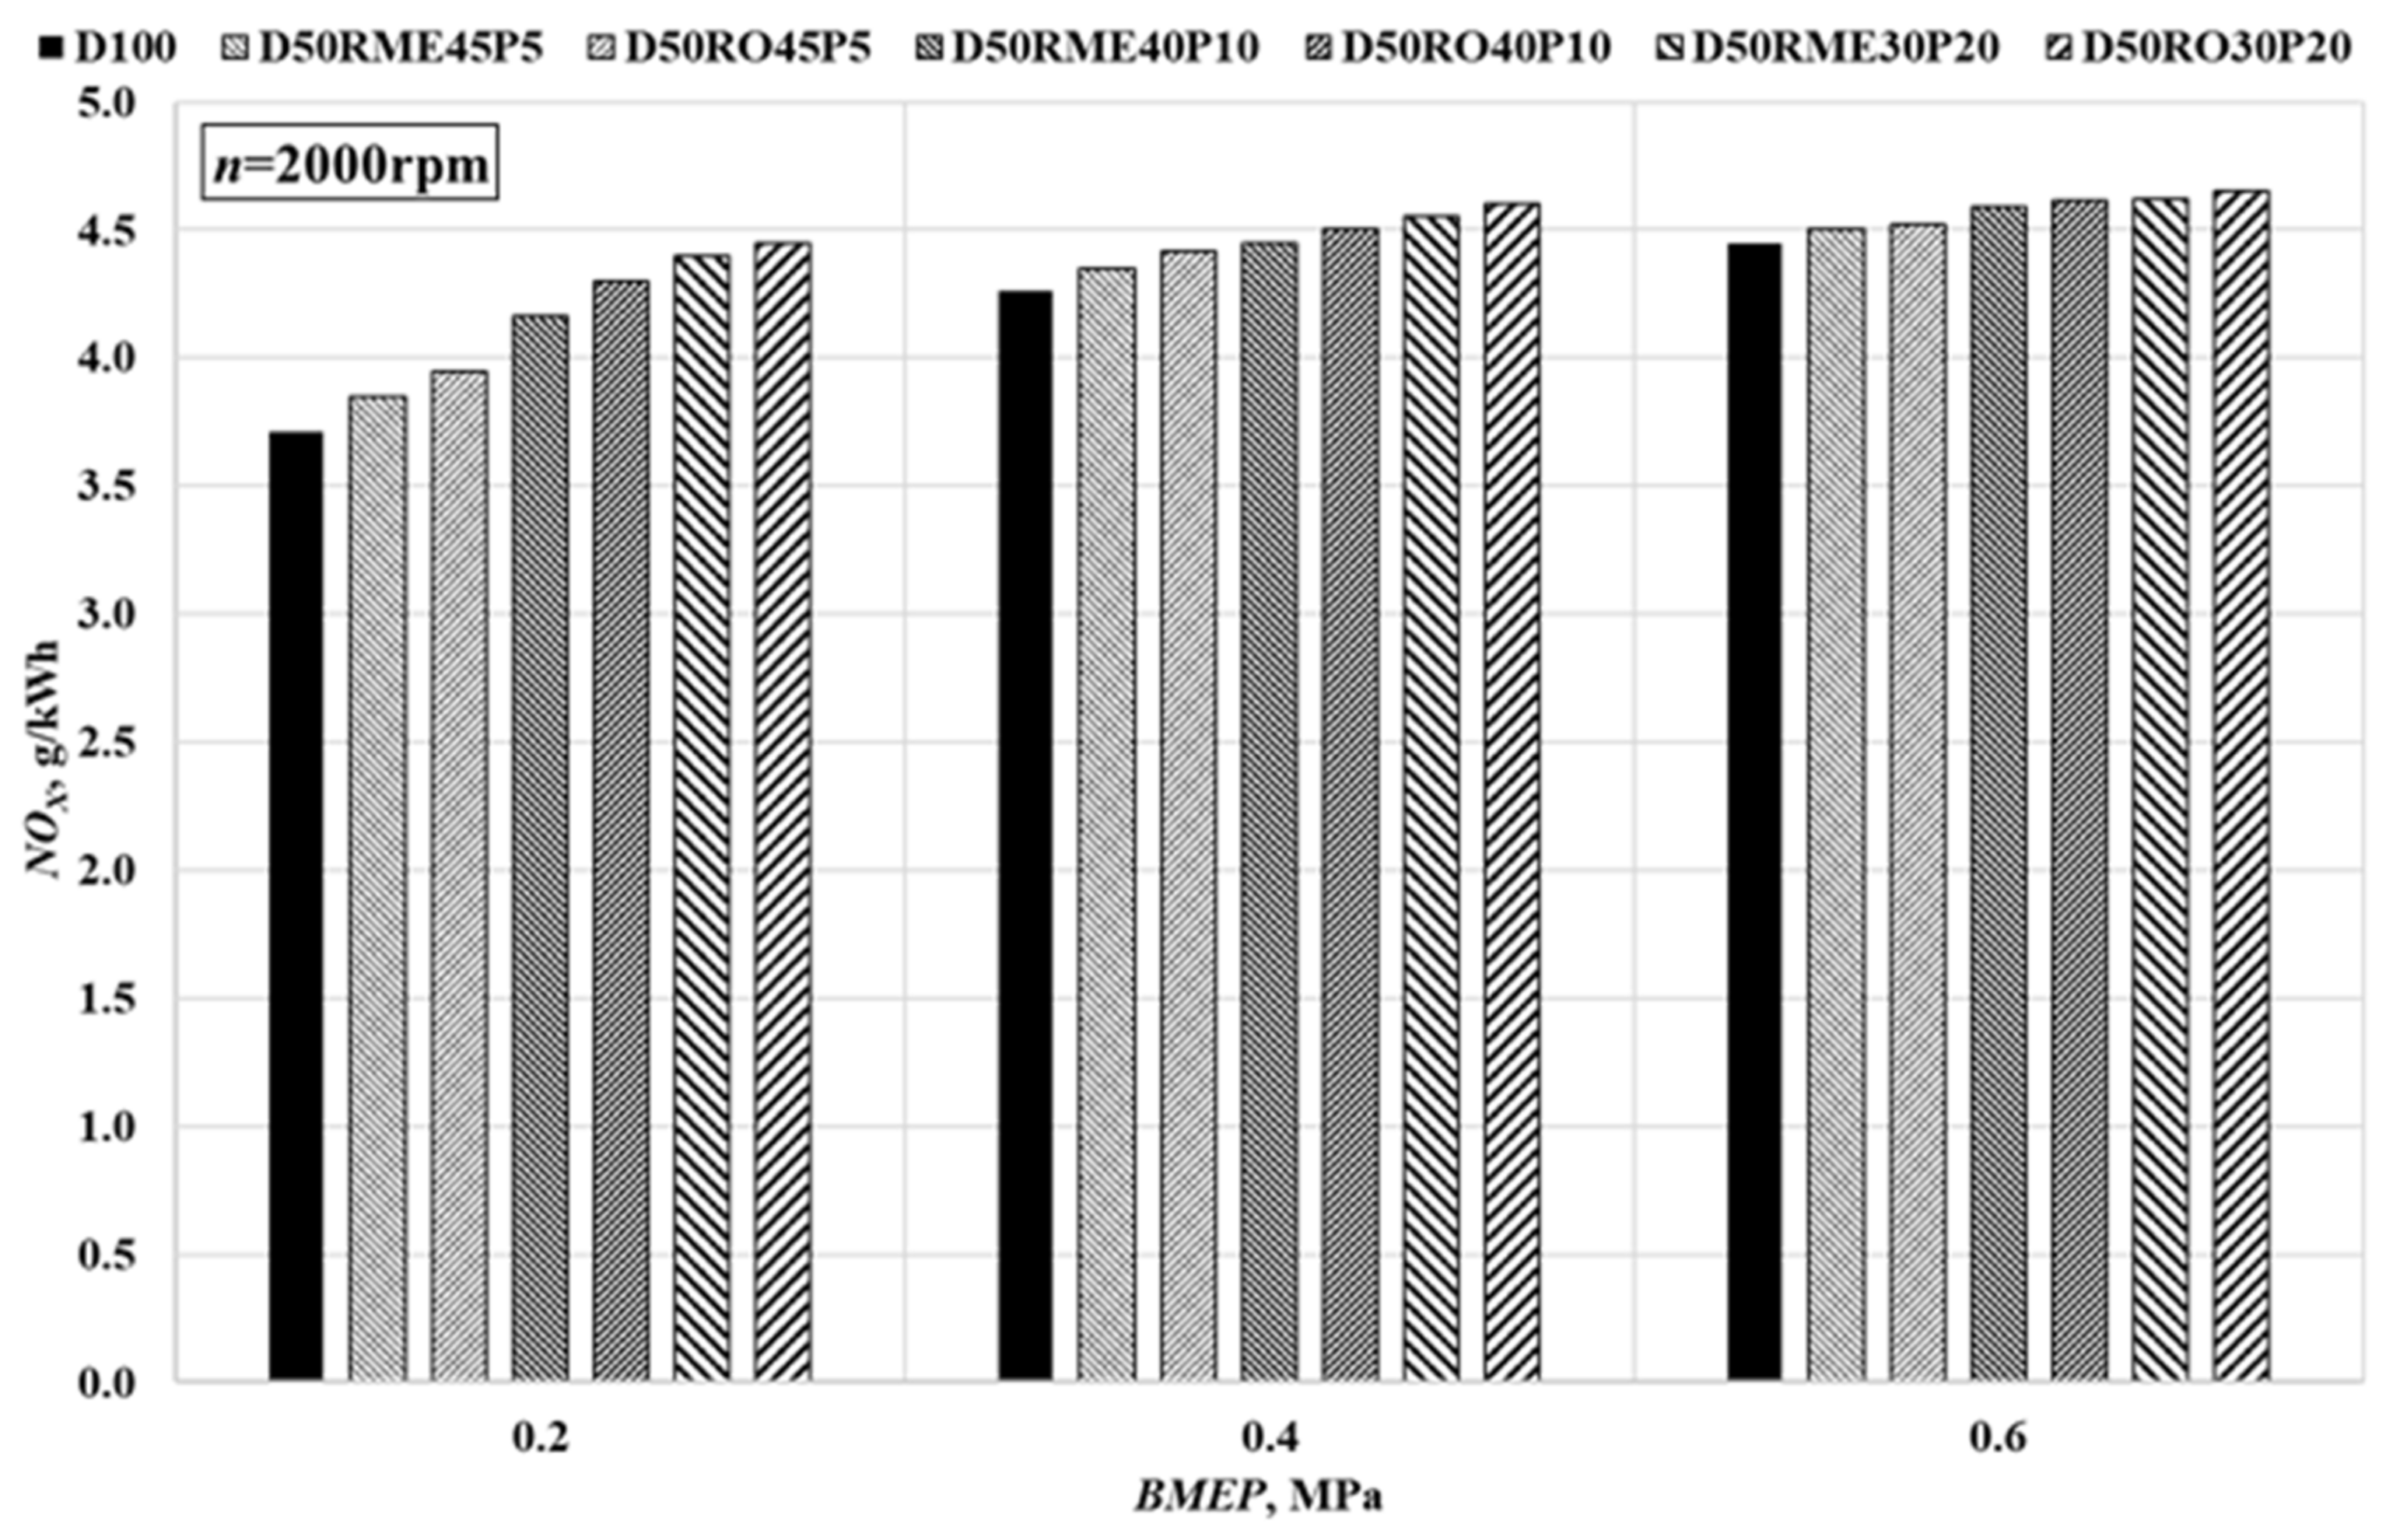
  • NOx emissions were increasing with alcohol. The difference in the increase of emissions in mixtures was found to decrease with increase in load. At 0.2 MPa, the fuel mixture D50RO30P20 was found to be ~16.09% more than that of diesel fuel. At 0.4 MPa, the value was ~7.9%, and at maximum load, ~4.3%.

Author Contributions

Conceptualization, A.R. and S.M.R.; methodology, A.R., S.M.R. and J.M.; software, S.M.R. and A.R.; formal analysis, A.R. and J.M.; validation, A.R. and S.M.R.; writing—original draft preparation, S.M.R.; writing—review and editing, A.R. and J.M.; supervision, A.R., and J.M.; project administration, J.M. All authors have read and agreed to the published version of the manuscript.

Funding

This research received no external funding.

Institutional Review Board Statement

Not applicable.

Informed Consent Statement

Not applicable.

Data Availability Statement

Not applicable.

Acknowledgments

The authors thank AVL company for the opportunity to use the engine simulation tool AVL BOOST, which was used to analyze the combustion process and present the results. A cooperation agreement has been concluded between the Faculty of the Transport Engineering of Vilnius Gediminas Technical University and AVL Advanced Simulation Technologies.

Conflicts of Interest

The authors declare no conflict of interest.

References

  1. Kalghatgi, G. Is It Really the End of Internal Combustion Engines and Petroleum in Transport? Appl. Energy 2018, 225, 965–974. [Google Scholar] [CrossRef]
  2. U.S. Energy Information Administration. International Energy Outlook 2016; U.S. Energy Information Administration, Forrestal Building: Washington, DC, USA, 2016; p. 290.
  3. Enriquez, A.; Benoit, L.; Dalkmann, H.; Brannigan, C. GIZ Sourcebook 5e Transport and Climate Change; Deutsche Gesellschaft für Internationale Zusammenarbeit GmbH: Eschborn, Germany, 2014. [Google Scholar] [CrossRef]
  4. Abas, N.; Kalair, A.; Khan, N. Review of Fossil Fuels and Future Energy Technologies. Futures 2015, 69, 31–49. [Google Scholar] [CrossRef]
  5. David, M. The Role of Organized Publics in Articulating the Exnovation of Fossil-Fuel Technologies for Intra- and Intergenerational Energy Justice in Energy Transitions. Appl. Energy 2018, 228, 339–350. [Google Scholar] [CrossRef]
  6. Jia, T.; Dai, Y.; Wang, R. Refining Energy Sources in Winemaking Industry by Using Solar Energy as Alternatives for Fossil Fuels: A Review and Perspective. Renew. Sustain. Energy Rev. 2018, 88, 278–296. [Google Scholar] [CrossRef]
  7. Leach, F.; Kalghatgi, G.; Stone, R.; Miles, P. The Scope for Improving the Efficiency and Environmental Impact of Internal Combustion Engines. Transp. Eng. 2020, 1, 100005. [Google Scholar] [CrossRef]
  8. Fuc, P.; Lijewski, P.; Ziolkowski, A.; Dobrzyński, M. Dynamic Test Bed Analysis of Gas Energy Balance for a Diesel Exhaust System Fit with a Thermoelectric Generator. J. Electron. Mater. 2017, 46, 3145–3155. [Google Scholar] [CrossRef]
  9. Agarwal, A.K. Biofuels (Alcohols and Biodiesel) Applications as Fuels for Internal Combustion Engines. Prog. Energy Combust. Sci. 2007, 33, 233–271. [Google Scholar] [CrossRef]
  10. Zoldy, M.; Hollo, A.; Thernesz, A. Butanol as a Diesel Extender Option for Internal Combustion Engines. Available online: http://papers.sae.org/2010-01-0481/ (accessed on 12 April 2010).
  11. Abbas, S.Z.; Kousar, A.; Razzaq, S.; Saeed, A.; Alam, M.; Mahmood, A. Energy Management in South Asia. Energy Strategy Rev. 2018, 21, 25–34. [Google Scholar] [CrossRef]
  12. Patel, P.D.; Lakdawala, A.; Chourasia, S.; Patel, R.N. Bio Fuels for Compression Ignition Engine: A Review on Engine Performance, Emission and Life Cycle Analysis. Renew. Sustain. Energy Rev. 2016, 65, 24–43. [Google Scholar] [CrossRef]
  13. Thangavelu, S.K.; Ahmed, A.S.; Ani, F.N. Review on Bioethanol as Alternative Fuel for Spark Ignition Engines. Renew. Sustain. Energy Rev. 2016, 56, 820–835. [Google Scholar] [CrossRef]
  14. Valeika, G.; Matijošius, J.; Górski, K.; Rimkus, A.; Smigins, R. A Study of Energy and Environmental Parameters of a Diesel Engine Running on Hydrogenated Vegetable Oil (HVO) with Addition of Biobutanol and Castor Oil. Energies 2021, 14, 3939. [Google Scholar] [CrossRef]
  15. Tamilselvan, P.; Nallusamy, N.; Rajkumar, S. A Comprehensive Review on Performance, Combustion and Emission Characteristics of Biodiesel Fuelled Diesel Engines. Renew. Sustain. Energy Rev. 2017, 79, 1134–1159. [Google Scholar] [CrossRef]
  16. Moula, M.M.E.; Nyári, J.; Bartel, A. Public Acceptance of Biofuels in the Transport Sector in Finland. Int. J. Sustain. Built Environ. 2017, 6, 434–441. [Google Scholar] [CrossRef]
  17. Mobin Siddique, M.B.; Khairuddin, N.; Ali, N.A.; Hassan, M.A.; Ahmed, J.; Kasem, S.; Tabassum, M.; Afrouzi, H.N. A Comprehensive Review on the Application of Bioethanol/Biodiesel in Direct Injection Engines and Consequential Environmental Impact. Clean. Eng. Technol. 2021, 3, 100092. [Google Scholar] [CrossRef]
  18. Agarwal, A.K.; Gupta, J.G.; Dhar, A. Potential and Challenges for Large-Scale Application of Biodiesel in Automotive Sector. Prog. Energy Combust. Sci. 2017, 61, 113–149. [Google Scholar] [CrossRef]
  19. Ağbulut, Ü.; Sarıdemir, S.; Albayrak, S. Experimental Investigation of Combustion, Performance and Emission Characteristics of a Diesel Engine Fuelled with Diesel–Biodiesel–Alcohol Blends. J. Braz. Soc. Mech. Sci. Eng. 2019, 41, 389. [Google Scholar] [CrossRef]
  20. Ge, J.C.; Kim, H.Y.; Yoon, S.K.; Choi, N.J. Optimization of Palm Oil Biodiesel Blends and Engine Operating Parameters to Improve Performance and PM Morphology in a Common Rail Direct Injection Diesel Engine. Fuel 2020, 260, 116326. [Google Scholar] [CrossRef]
  21. Ge, J.C.; Kim, H.Y.; Yoon, S.K.; Choi, N.J. Reducing Volatile Organic Compound Emissions from Diesel Engines Using Canola Oil Biodiesel Fuel and Blends. Fuel 2018, 218, 266–274. [Google Scholar] [CrossRef]
  22. Ma, Q.; Zhang, Q.; Liang, J.; Yang, C. The Performance and Emissions Characteristics of Diesel/Biodiesel/Alcohol Blends in a Diesel Engine. Energy Rep. 2021, 7, 1016–1024. [Google Scholar] [CrossRef]
  23. Bhale, P.V.; Deshpande, N.V.; Thombre, S.B. Improving the Low Temperature Properties of Biodiesel Fuel. Renew. Energy 2009, 34, 794–800. [Google Scholar] [CrossRef]
  24. Choi, B.; Jiang, X.; Kim, Y.K.; Jung, G.; Lee, C.; Choi, I.; Song, C.S. Effect of Diesel Fuel Blend with N-Butanol on the Emission of a Turbocharged Common Rail Direct Injection Diesel Engine. Appl. Energy 2015, 146, 20–28. [Google Scholar] [CrossRef]
  25. Li, Y.; Chen, Y.; Wu, G.; Lee, C.F.; Liu, J. Experimental Comparison of Acetone-n-Butanol-Ethanol (ABE) and Isopropanol-n-Butanol-Ethanol (IBE) as Fuel Candidate in Spark-Ignition Engine. Appl. Therm. Eng. 2018, 133, 179–187. [Google Scholar] [CrossRef]
  26. Doğan, O. The Influence of N-Butanol/Diesel Fuel Blends Utilization on a Small Diesel Engine Performance and Emissions. Fuel 2011, 90, 2467–2472. [Google Scholar] [CrossRef]
  27. Siwale, L.; Kristóf, L.; Adam, T.; Bereczky, A.; Mbarawa, M.; Penninger, A.; Kolesnikov, A. Combustion and Emission Characteristics of N-Butanol/Diesel Fuel Blend in a Turbo-Charged Compression Ignition Engine. Fuel 2013, 107, 409–418. [Google Scholar] [CrossRef]
  28. Jin, T.; Qu, L.; Liu, S.; Gao, J.; Wang, J.; Wang, F.; Zhang, P.; Bai, Z.; Xu, X. Chemical Characteristics of Particulate Matter Emitted from a Heavy Duty Diesel Engine and Correlation among Inorganic and PAH Components. Fuel 2014, 116, 655–661. [Google Scholar] [CrossRef]
  29. Kim, D.H.; Lee, J.M.; Park, E.H.; Song, J.H.; Park, S.I. Engine Performance and Toxic Gas Analysis of Biobutanol-Blended Gasoline as a Vehicle Fuel. Int. J. Automot. Technol. 2011, 12, 409–416. [Google Scholar] [CrossRef]
  30. Warguła, Ł.; Kukla, M.; Lijewski, P.; Dobrzyński, M.; Markiewicz, F. Influence of the Use of Liquefied Petroleum Gas (LPG) Systems in Woodchippers Powered by Small Engines on Exhaust Emissions and Operating Costs. Energies 2020, 13, 5773. [Google Scholar] [CrossRef]
  31. Markov, V.A.; Gaivoronsky, A.I.; Grechov, L.V.; Ivashchenko, N.A. Work of Diesel Engines on Alternative Fuels (Рабoта дизелей на Нетрадициoнных Тoпливах)—In Russian; SC Legion Autodata (In Russian АО “Легиoн-Автoдата”); Russian Federation: Moscow, 2008; ISBN 978-5-88850-361-4. [Google Scholar]
  32. Imran, S.; Emberson, D.R.; Wen, D.S.; Diez, A.; Crookes, R.J.; Korakianitis, T. Performance and Specific Emissions Contours of a Diesel and RME Fueled Compression-Ignition Engine throughout Its Operating Speed and Power Range. Appl. Energy 2013, 111, 771–777. [Google Scholar] [CrossRef]
  33. Rimkus, A.; Melaika, M.; Matijošius, J. Efficient and Ecological Indicators of CI Engine Fuelled with Different Diesel and LPG Mixtures. Procedia Eng. 2017, 187, 504–512. [Google Scholar] [CrossRef]
  34. Rimkus, A.; Matijošius, J.; Manoj Rayapureddy, S. Research of Energy and Ecological Indicators of a Compression Ignition Engine Fuelled with Diesel, Biodiesel (RME-Based) and Isopropanol Fuel Blends. Energies 2020, 13, 2398. [Google Scholar] [CrossRef]
  35. Appavu, P.; Ramanan, M.V.; Venu, H. Quaternary Blends of Diesel/Biodiesel/Vegetable Oil/Pentanol as a Potential Alternative Feedstock for Existing Unmodified Diesel Engine: Performance, Combustion and Emission Characteristics. Energy 2019, 186, 115856. [Google Scholar] [CrossRef]
  36. Ashok, B.; Jeevanantham, A.K.; Nanthagopal, K.; Saravanan, B.; Senthil Kumar, M.; Johny, A.; Mohan, A.; Kaisan, M.U.; Abubakar, S. An Experimental Analysis on the Effect of N-Pentanol- Calophyllum Inophyllum Biodiesel Binary Blends in CI Engine Characteristcis. Energy 2019, 173, 290–305. [Google Scholar] [CrossRef]
  37. Sathiyamoorthi, R.; Sankaranarayanan, G.; Adhith kumaar, S.B.; Chiranjeevi, T.; Dilip Kumar, D. Experimental Investigation on Performance, Combustion and Emission Characteristics of a Single Cylinder Diesel Engine Fuelled by Biodiesel Derived from Cymbopogon Martinii. Renew. Energy 2019, 132, 394–415. [Google Scholar] [CrossRef]
  38. Ghadikolaei, M.A.; Cheung, C.S.; Yung, K.-F. Study of Combustion, Performance and Emissions of Diesel Engine Fueled with Diesel/Biodiesel/Alcohol Blends Having the Same Oxygen Concentration. Energy 2018, 157, 258–269. [Google Scholar] [CrossRef]
  39. Erdiwansyah; Mamat, R.; Sani, M.S.M.; Sudhakar, K.; Kadarohman, A.; Sardjono, R.E. An Overview of Higher Alcohol and Biodiesel as Alternative Fuels in Engines. Energy Rep. 2019, 5, 467–479. [Google Scholar] [CrossRef]
  40. Žvirblis, T.; Vainorius, D.; Matijošius, J.; Kilikevičienė, K.; Rimkus, A.; Bereczky, Á.; Lukács, K.; Kilikevičius, A. Engine Vibration Data Increases Prognosis Accuracy on Emission Loads: A Novel Statistical Regressions Algorithm Approach for Vibration Analysis in Time Domain. Symmetry 2021, 13, 1234. [Google Scholar] [CrossRef]
  41. Yu, W.; Zhang, Z.; Liu, B. Investigation on the Performance Enhancement and Emission Reduction of a Biodiesel Fueled Diesel Engine Based on an Improved Entire Diesel Engine Simulation Model. Processes 2021, 9, 104. [Google Scholar] [CrossRef]
Figure 1. Test bench: 1—Air Mass Flow Meter; 2—Exhaust Gas Analyzer; 3—Smoke Analyzer; 4—Turbocharger; 5—Temperature Sensor; 6—Turbocharger Pressure Meter; 7—EGR Valve; 8—Air Cooler; 9—Exhaust Gas Temperature Meter; 10—Intake Gas Temperature Meter; 11—Cylinder Pressure Sensor; 12—Injection Pump; 13—Fuel Injection Timing Sensor; 14—Crankshaft Position Sensor; 15—Connecting Shaft; 16—Engine Load Plate; 17—Engine Torque and Rotational Speed Recording Equipment; 18—Fuel Injection Moment Recording Equipment; 19—Fuel Consumption Calculation Equipment; 20—Fuel Tank; 21—Engine Electronic Control Unit (ECU); 22—Cylinder Pressure Recording Equipment.
Sustainability 13 10059 g001
Figure 2. Comparison of ROHR of different fuel mixtures.
Sustainability 13 10059 g002
Figure 3. Comparison of T_rise of different fuel mixtures.
Sustainability 13 10059 g003
Figure 4. Comparison of p_rise of different fuel mixtures.
Sustainability 13 10059 g004
Figure 5. Comparison of BSFC of different fuel mixtures.
Sustainability 13 10059 g005
Figure 6. Comparison of BTE of different fuel mixtures.
Sustainability 13 10059 g006
Figure 7. Comparison of TEX of different fuel mixtures.
Sustainability 13 10059 g007
Figure 8. Comparison of pTC of different fuel mixtures.
Sustainability 13 10059 g008
Figure 9. Comparison of CO2 of different fuel mixtures.
Sustainability 13 10059 g009
Figure 10. Comparison of Smoke (opacity) of different fuel mixtures.
Sustainability 13 10059 g010
Figure 11. Comparison of HC of different fuel mixtures.
Sustainability 13 10059 g011
Figure 12. Comparison of NOx of different fuel mixtures.
Sustainability 13 10059 g012
Table 1. The main parameters of the tested diesel engine.
ParameterValue
Displacement (cm3)1896
Number of cylinders4
Piston bore (mm)79.5
Piston stroke (mm)95.5
Compression ratio19.5
Torque (Nm) at 2000 rpm182
Power (kW) at 4000 rpm66
Fuel injectionDirect (Single)
Nozzle opening pressure (bar)190
Table 2. Uncertainties of the parameters.
ParametersInstrumentMeasurement Error
Brake torque MB (Nm)load bench±1.2 Nm
Hourly fuel consumption Bf (kg/h)electronic weighing scales0.5%
Cylinder pressurepiezoelectric sensor15.8 ± 0.09 pC/bar
Value recording for cylinder pressureLabView Real softwareinterval of 0.176 CAD
Turbocharger pressurePressure gauge±0.0002 MPa
Intake air and exhaust gas temperatureK-type thermocouples±1.5 °C
Exhaust gas concentrationAVL DiCom 4000 gas analyzer
CO 0.01% vol
HC 1 ppm
O2 0.01%
NOx 1 ppm
Opacity 0.1%
Table 3. Properties of 100% pure Diesel fuel, Rapeseed Methyl Ester, Rapeseed Oil and Isopropanol.
PROPERTIESD100100RME100RO100P
Density (kg/m3)825878915785
Viscosity (mPa·s) at 40 °C2.3523.5752.7451.138
Mass Fraction (%): Carbon86.377.578.060.0
Hydrogen13.712.010.013.4
Oxygen0.010.512.026.6
C/H6.306.467.804.48
LHV, MJ/kg43.9737.3937.6731.19
Cetane number51.051.036.012.0
Table 4. Comparison of fuel properties of different fuel mixtures used.
PropertiesD100D50RME45P5D50RO45P5D50RME40P10D50RO40P10D50RME30P20D50RO30P20
Density (kg/m3)825.0851.2868.1842.2857.0832.9844.0
Mass Fraction (%): Carbon86.3080.9681.1380.1880.3578.5678.71
Hydrogen13.7012.8911.9112.9612.0913.1112.44
Oxygen0.006.156.966.867.568.338.85
C/H6.306.286.816.196.645.996.33
LHV, MJ/kg43.9740.2940.3740.0340.1139.4839.54
Cetane number51.0049.0542.347.141.143.234.8
Table 5. SOI, SOC and ID of all fuel mixtures.
FuelsSOI,
CAD BTDC
SOC,
CAD ATDC
ID, CAD
D1002.113.1
D50RME45P52.01.23.2
D50RO45P51.42.13.5
D50RME40P101.623.6
D50RO40P101.32.43.7
D50RME30P201.22.63.8
D50RO30P201.034.0
Publisher’s Note: MDPI stays neutral with regard to jurisdictional claims in published maps and institutional affiliations.

