1. Introduction
Between several critical issues linked to urban mobility, a crucial one that have always affected public administrations is related to the high quantity of conflicts in ordinary two-lane roundabouts, then interventions as lane reduction or diameter increasing have been avoided due to high costs, so it was necessary to find a solution that modified geometric layout and does not require elevated expenses. Studies showed that one of the most convenient solution for geometric layout is represented by the conversion of two-lane roundabout into a depressed right-hand turning one and consequently removing one circulatory lane, with such change implemented, the so called “Flower” roundabout is introduced. However, over the years, several roundabouts design has been created to address some specific road issues, such as separating vehicular movements to prevent priority conflicts at roundabouts and tackling road geometry constraints. These novel road designs shine a light on important questions regarding road safety, vehicular mobility, and the effects of the environment on different roadways and traffic flow conditions. Properly constructed roundabouts improve pedestrians’ road capacity and safety and assist in improving the air quality by reducing the greenhouse gas emissions that are supposed to be polluting the air if there is traffic congestion. Nevertheless, the systematic evolution in vehicular features means that the pre-existing road layouts have to be improved due to a broader range of driving scenarios at roundabouts. The introduction of connected non-human-driven vehicles in real-life traffic scenarios at roundabouts will lead to a roadblock and cause significant challenges for pedestrians and road users due to the limited understanding of connected automated vehicle operations. This challenge will have significant impacts on road transportation at roundabouts. However, it has been claimed, with evidence by transportation engineers and researchers, that CAVs will be in an appropriate position to address the problem of gas emissions, improve road safety, and the capacity of urban road networks. Ultimately, such conversion allows for separating traffic flows when they are still in the section that precedes circulatory carriageway, to facilitate driver perception curbs can be positioned. The fact that the “Flower” roundabout represses right hand turning for drivers that are in the circulatory lane could be considered a valid drawback. However, before implementing such a geometric layout, it has to be assumed that it results to be more suitable when quantity of right turners amount to 60%. Considering the micro simulation approach, treated in this paper regarding safety performance evaluation with co-presence of CVs and CAVs in a flower roundabout, studying thematic concerns with vehicle trajectory analyses, such as the one of Blumenthal (1968) [
1] or other sources [
2,
3,
4]. A general System Theory approach resulted to be more appropriate for “traffic safety” methodological and scientific discussion. In order to provide a correct explication and description of traffic system features such as: dynamic set, main properties, hierarchical structure, and interactive processes, traffic was considered an “open system” relying on System Theory of Von Bertalanffy [
5]. Relationships and interactions of system components in various structural levels create the necessity of a systematic evaluation of produced mechanisms such as “the emergency” whose degree of detail of analysis is linked to System Theory.
This study will provide indication concerning with:
Traffic simulation model approach, applied in this paper, provides two analysis types: simulation and forecasting. The first refers to the possibility that analysis gives to observe and evaluate traffic model behaviour in specific circumstances and scenarios like temporary lane closure. The second one is mainly useful for transport future planning but requires traffic monitoring operations more significantly. Finally, simulations represents a valid method whose models allow to get:
Costs reduction, avoiding directs applications and errors that can occur
High level of phenomena management, due to the possibility to repeat events sequence changing inputs keeping initial parameters, then repetition provides useful data to analyse various cases occurred
Time savings due to devices and platforms power and capabilities
Damages and risks reduction
2. Research Goals
As treated above, studies carried out in this paper assumed a general System Theory (suggested by Blumenthal [
1]) and considered traffic as an “open system” (Von Bertalanffy [
5]). From such premise, in the simulation the percentage of vehicles type that traffic flow is composed by will be 75% and 25% of CVs and CAVs respectively, so the flower roundabout performance and safety level can be evaluated when traffic flow is heterogeneous and has to interact with weak users. Ultimately, this paper will provide a comparison between a previous study carried out for a turbo roundabout and analysis [
6] of a flower roundabout with pedestrians present.
However, it is useful to illustrate model types that constitute traffic simulations, on the base of Federal Highway Administration (FHWA, Traffic Analysis Toolbox Volume II) [
7], they can be divided in macroscopic, mesoscopic, and microscopic models [
8,
9].
The case study proposed in this paper was conducted adopting a micro simulation model in addition to a human behaviour psycho-physiological approach based on Wiedemann’s model. The correspondence between real phenomenon and abstraction level has always been discussed in microscopic models. Then, to make the simulation as close as possible to reality, some basic behaviours were established on the basis of a previous paper [
6].
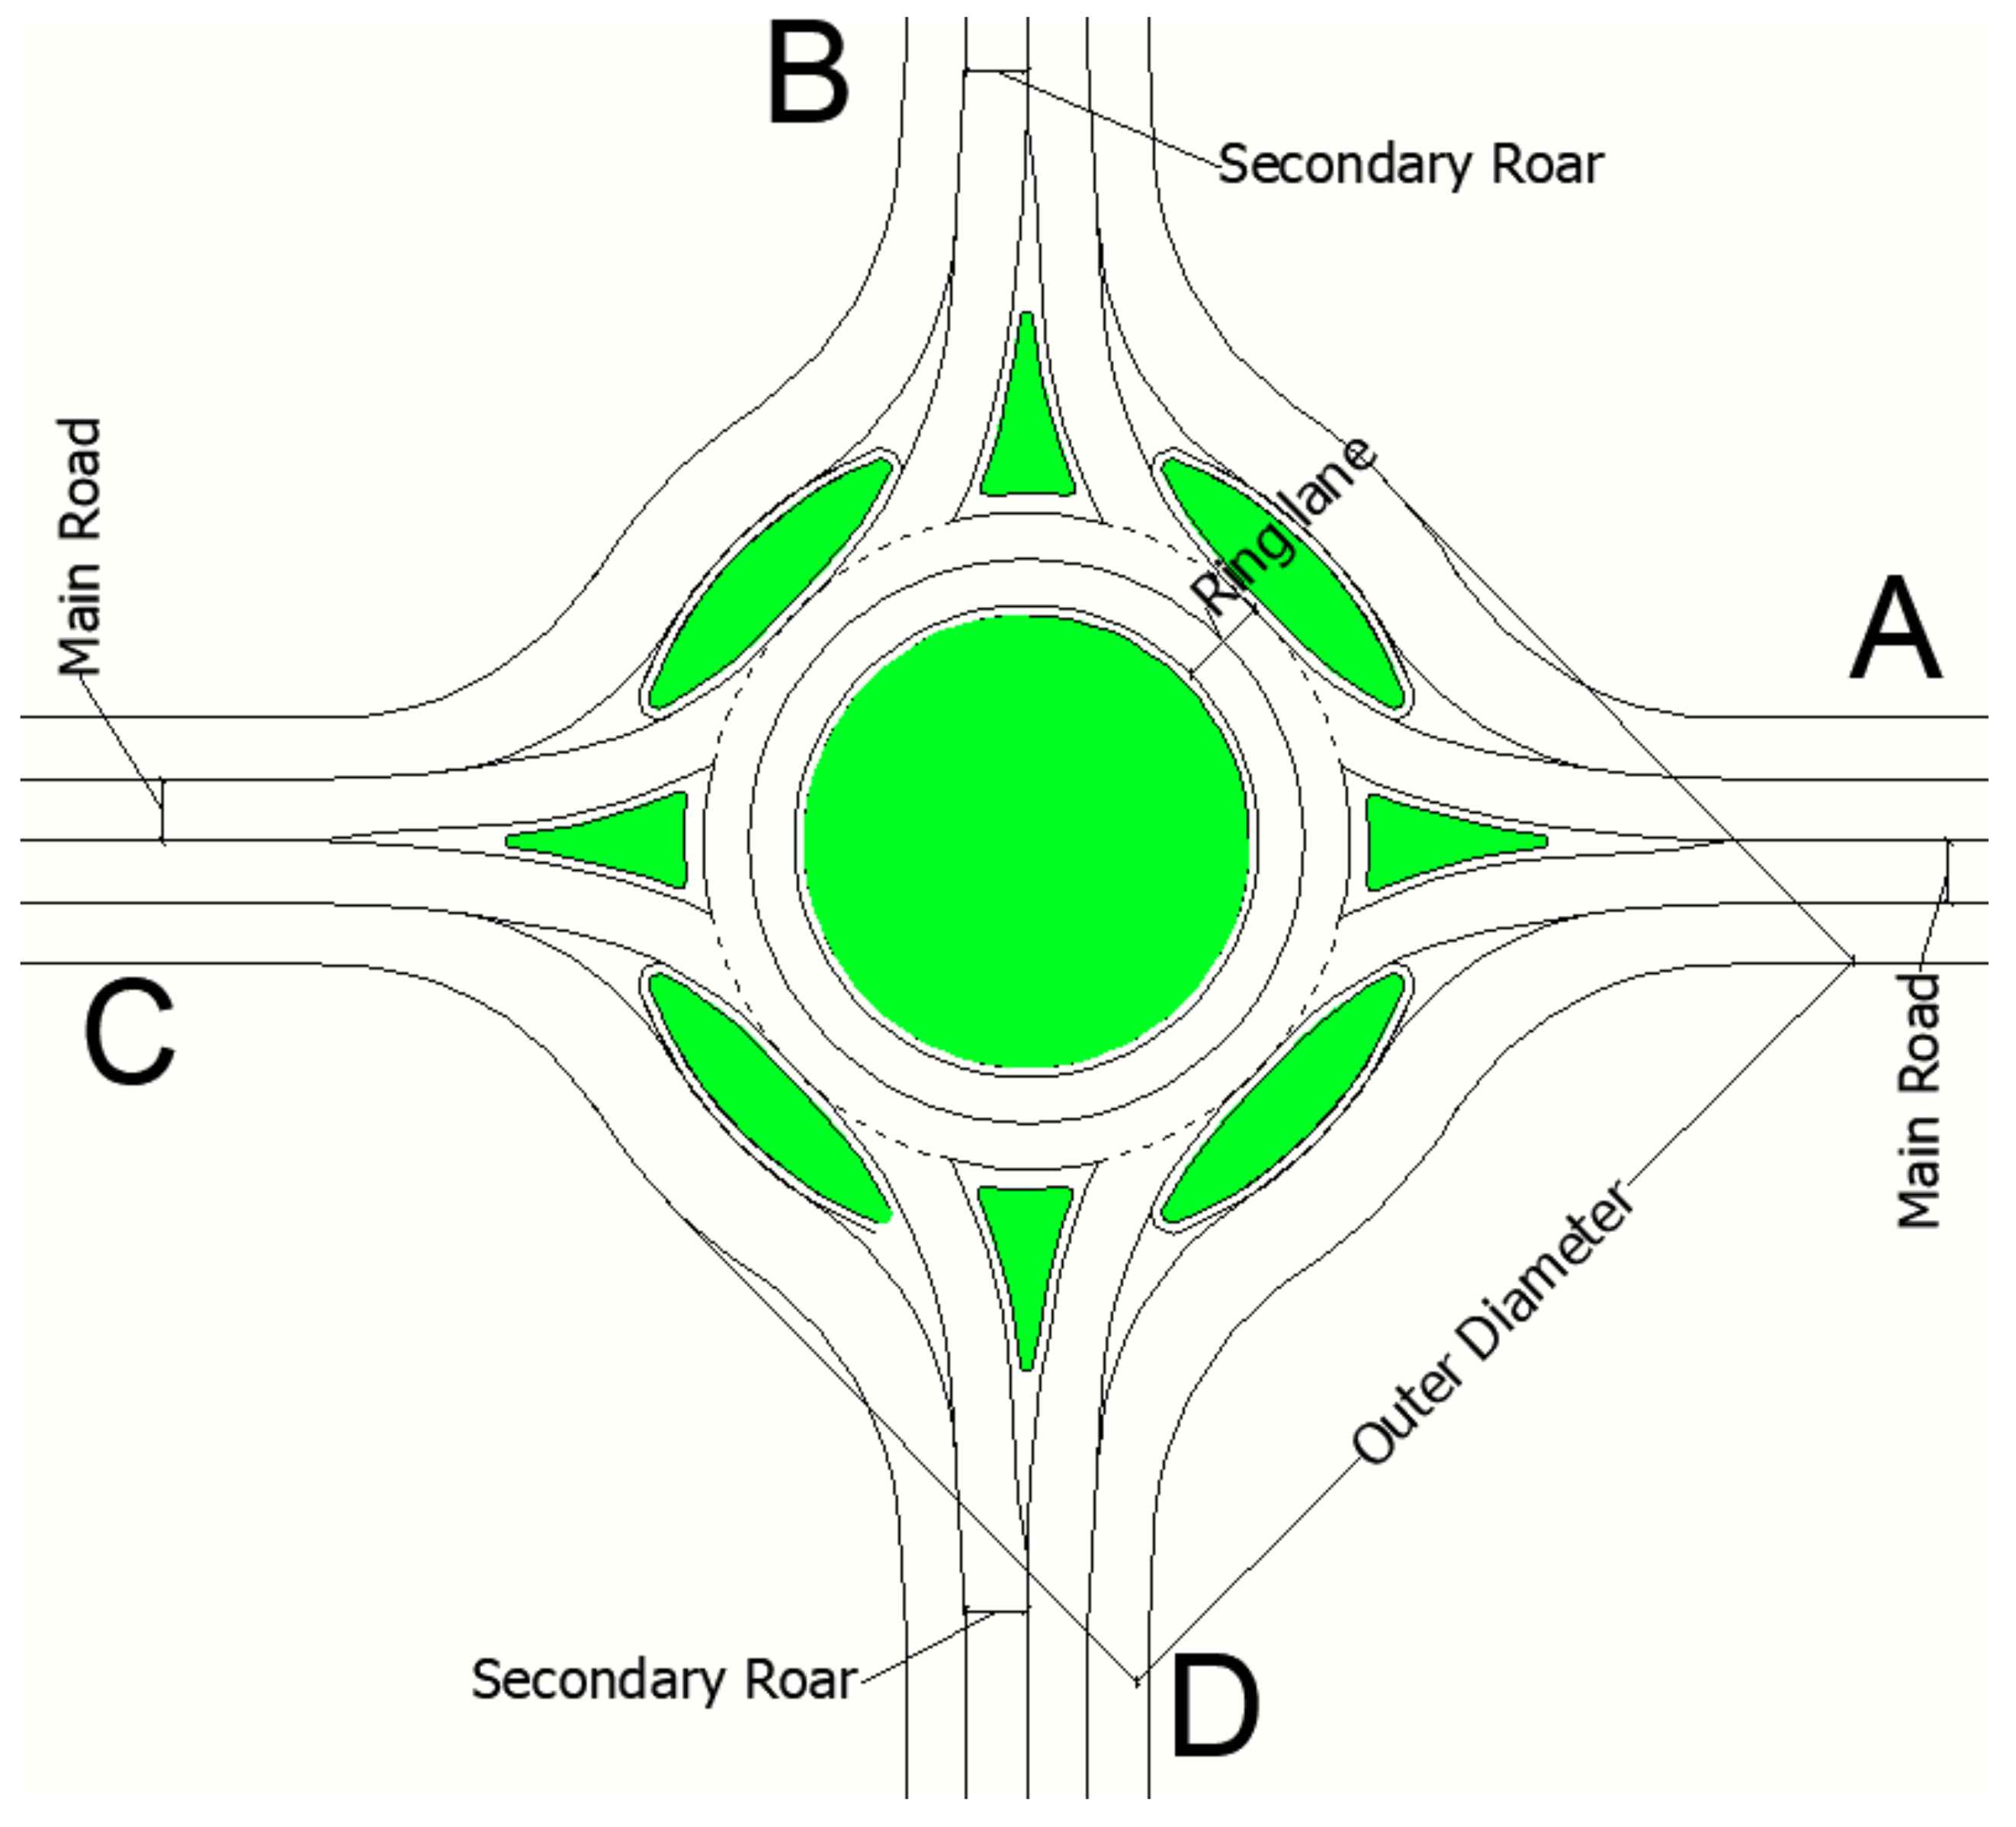
In
Figure 1, it is provided an example of flower roundabout scheme, and then a flower roundabout that was implemented on VISSIM was designed with following geometrical parameters:
Flower roundabout design parameters:
Outer Diameter = 40.00 m;
East-west main road width = 3.50 m;
North-south secondary road width = 3.00 m;
Ring lane width = 7.00 m.
It is considered a Origin–Destination matrix, as showed in
Table 1, whose characteristics are similar to the case study in which there is an intersection of two different levels of roadways. In this simulation, come-back manoeuvres were not considered due to their low quantity that does not affect final results.
Variables that were considered are average speed and queue duration in input section and entry section, respectively, for A, B, C, D legs. Then, through PTV-VISSIM, average variables value and standard deviation were calculated for each run. In this table, it has to be noted how assuming 95% confidence is attributing to ratio a value equal to 1.5 among DS (standard deviation) and CI (confidence interval) Through Equation (2) it was possible to calculate CI so that initial R value becomes statistically exact.
Ultimately, 12 runs will be applied on each scheme and final results will depend on considered variables average value. In
Table 2, has to be noted that ratio was assumed with a value equal to 1.5, which is between “CI” confidence interval and the “DS” standard deviation. The value of “CI” was obtained from Equation (2) considering a 95% desired confidence, and then, the number of runs that was obtained can be assumed statistically correct.
Then for each scheme there will be carried out 12 simulations where final results will be connected to average values of considered variables.
N = number of initial runs hypothesized;
x = variable of the model for which the sample variable is required;
= arithmetic average;
s = standard deviation;
CI1 − a% = interval of confidence, that is, the range of values within which the real average value can reside. The size of the interval is at the discretion of the analyst and may vary according to the purposes for which the results will be used.
t(1 − a/2), N − 1 = quantile of the t-Student distribution, it is set according to the value of a and the number of runs R.
3. Calibration of CV in the Flower Roundabout Model
Model calibration is a process consisting of uploading on VISSIM traffic predefined parameters. In this case study, each entry was set to a vehicle traffic flow assuming eastbound approach, as subject entrance is functional to access lanes capacity observation.
The calibration of the model consists of the uploading of traffic data, of the case study considered on VISSIM, on the basis of previous cited parameters [
10], and it was assumed conventionally to be the eastbound entrance to observe access lanes’ capacity. Criterion followed for O–D matrices assignment to the virtual environment implemented roundabout it was based, taking into account turn direction. In this way, with a subsequent step of 200 veh/h, it created a 1400 veh/h circulating traffic flow. Entrance lane capacities were obtained, achieving saturation condition, so it was observing the maximum number of vehicles getting close to roundabout.
In
Figure 1, it illustrated a flower roundabout model layout in which left approaching vehicles’ priority was assigned. The need of priority rules was due to right of way settings and collision possibilities decreasing among cornering vehicles. In relation to conflict schemes of entries, the flow in conflict is referred to a single ring carriageway both for right and left lanes, and then, capacity of both entry lanes were calculated through Hagring’s theory Equation (3).
Varying calibration parameters of Wiedemann 74 capacity is obtained by Equation (3) while through VISSIM a GEH [
11], an index higher than 85% is retrieved. GEH is an indicator functional to validate traffic simulation models, particularly when updated data are aggregate values, as input capacity and time-based station detected traffic flow [
12]. In
Table 3, manual calibration and sensitivity analysis results are illustrated, while in
Table 4, values of parameters used for Wiedemann 99 are provided. It is reported below a description of parameters in
Table 4, on the basis of [
6]:
CC0 is the front-to-rear spacing between stationary vehicles
CC1 is the time gap that a following vehicle wants to keep behind the lead vehicle
CC2 is the spacing that the following vehicle keeps in addition to the minimum safety distance before it intentionally accelerates
CC3 is a measure of number of seconds before reaching the safety distance when a vehicle starts decelerating while perceiving a slower vehicle ahead
CC4 and CC5 control the variation in relative velocity around zero during the unconscious following process
CC6 represents how the following vehicle’s speed oscillation varies as the distance to the lead vehicle changes
CC7 is the following vehicle’s acceleration during the unconscious following process
CC8 desired acceleration when starting from standstill (limited by maximum acceleration defined within the acceleration curves)
CC9 is the following vehicle’s acceleration rate at speed of 80 km/h
In
Figure 2, it illustrated the relation among safety distance and vehicle speed, set with Wiedemann’s 99 car-following model, not calibrated for CAVs. It has to be noted, especially, that the 30‘s of a simulation turns into a circular path where there are 12 CVs. Ultimately, the model used to study the effects on safety with pedestrian presence was based on paper [
13].
4. Method and Results
In this analysis, a distribution of ten matrices, as reported in
Table 5, was applied to a flower roundabout in addition to traffic flow data assigned in the same way in the four arms of each intersection, so that can be obtained as the traffic flow that causes minimum quantity of conflicts and maximum capacity. In relation to what was treated previously, this flower roundabout has a calculated capacity of at least 4100 veh/h and 4600 veh/h. Then, in order to avoid saturation scenarios, it was set to be decreased by 50% value. Traffic flow data were managed to calibrate microsimulation models parameters and achieve realistic and reliable results. In this case, as previously cited, simulation was carried out considering a context with the presence of zebra crossing and, consequently, pedestrians.
Considering the high number of simulations and matrices distribution, valid results were obtained in relation to the following parameters: stops and vehicle number, average and maximum tail length, and average speed. Through VISSIM, referring to average entrance speed (km/h) in the circulatory carriageway, it was obtained among the comparison. As evidenced in
Table 6, several matrices of traffic flows have an average constant trend, at least particularly in A8 matrix, is the achieved minimum speed value of 22 km/h and the maximum of 38.5 km/h in matrix A6.
Such results are confirmed with a flow characterized by 25% CAVs and 75% CVs. As reported in
Table 6, flow belonging to matrices 6 and 8 have an average velocity of 47 km/h and 23 km/h that cause an average queue length of a minimum 0.3 m for A6, maximum of 39.1 m for A8, and of 0.2 m and 33.2 m for mixed flow, respectively.
Once TRJ files were created from VISSIM output data, they were uploaded into SSAM in order to define conflict types. Conflict type identification was obtained on the basis of two main parameters set as following:
SSAM analysis provides the number of potential conflict related to interaction between vehicles divided into three categories:
rear end;
lane changing;
crossing.
For TTC value, it was assumed with a range between 0.1 and 1.5, while for PET, between 0.5 and 2.5 s. In
Table 6, there are potential conflicts in relation to conflict and vehicles category, while in
Table 7, conflicts obtained for each O/D matrix are illustrated as follows:
yellow: Rear end;
blue: Lane change;
red: Crossing.
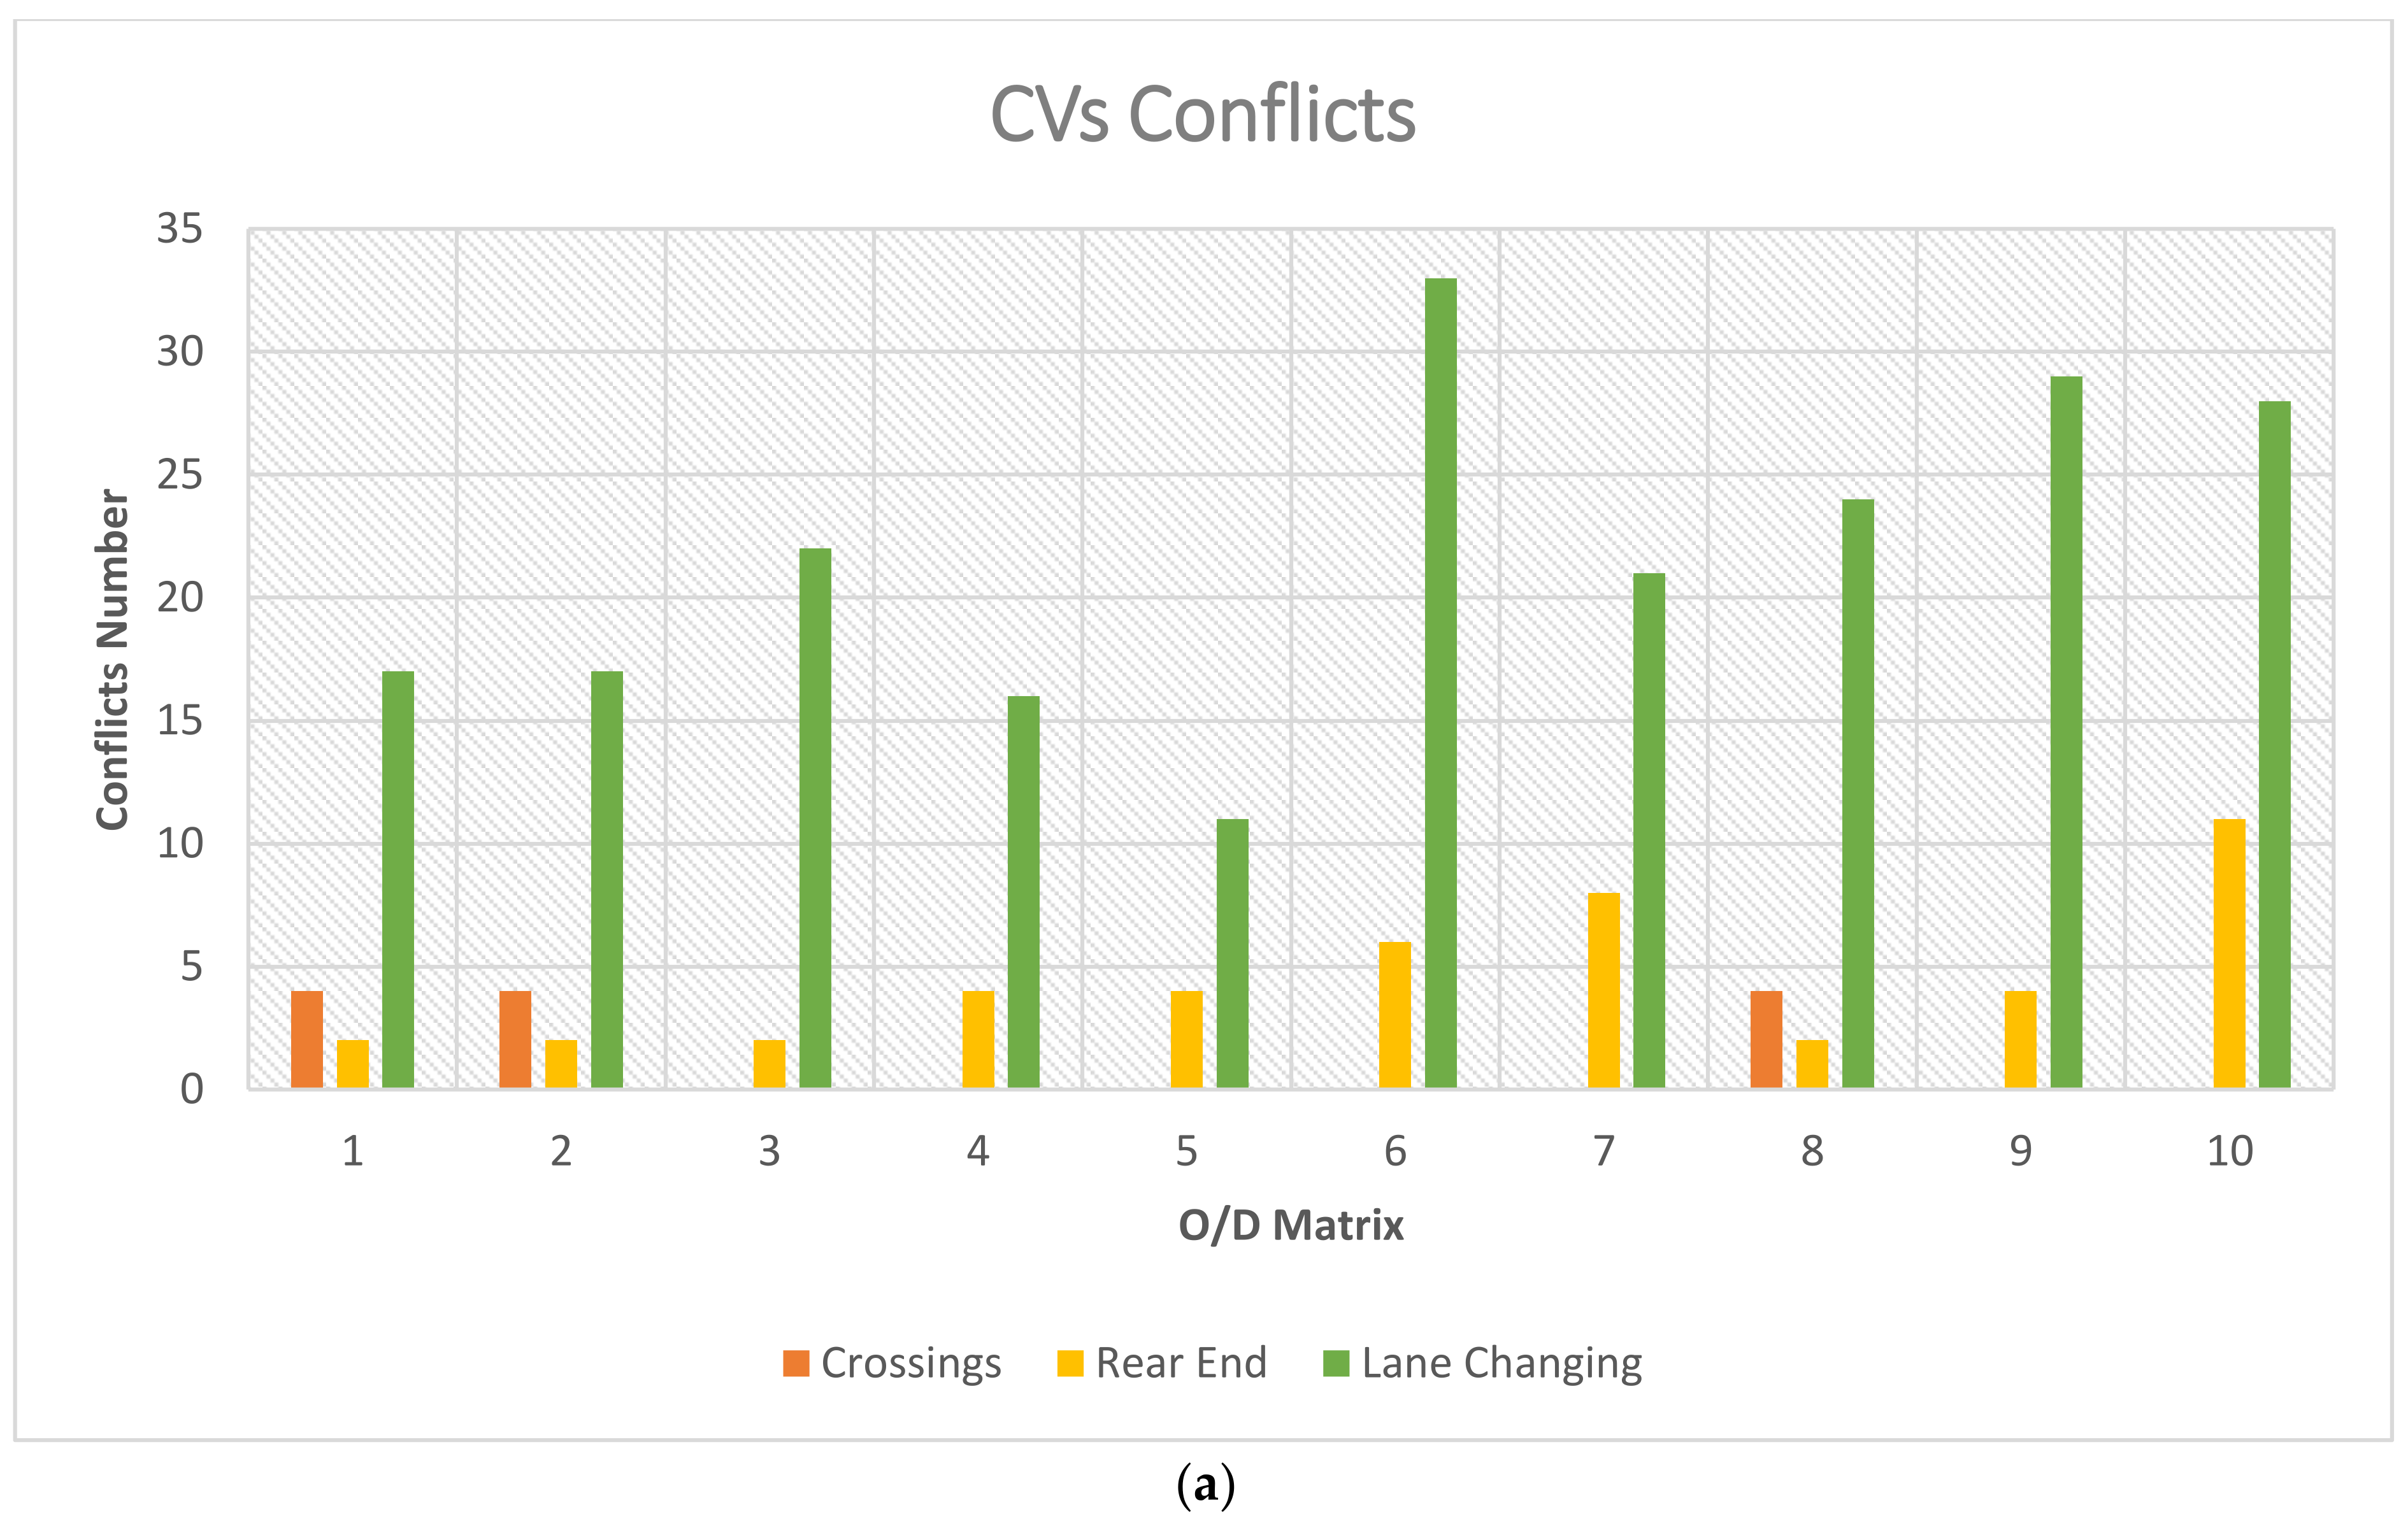
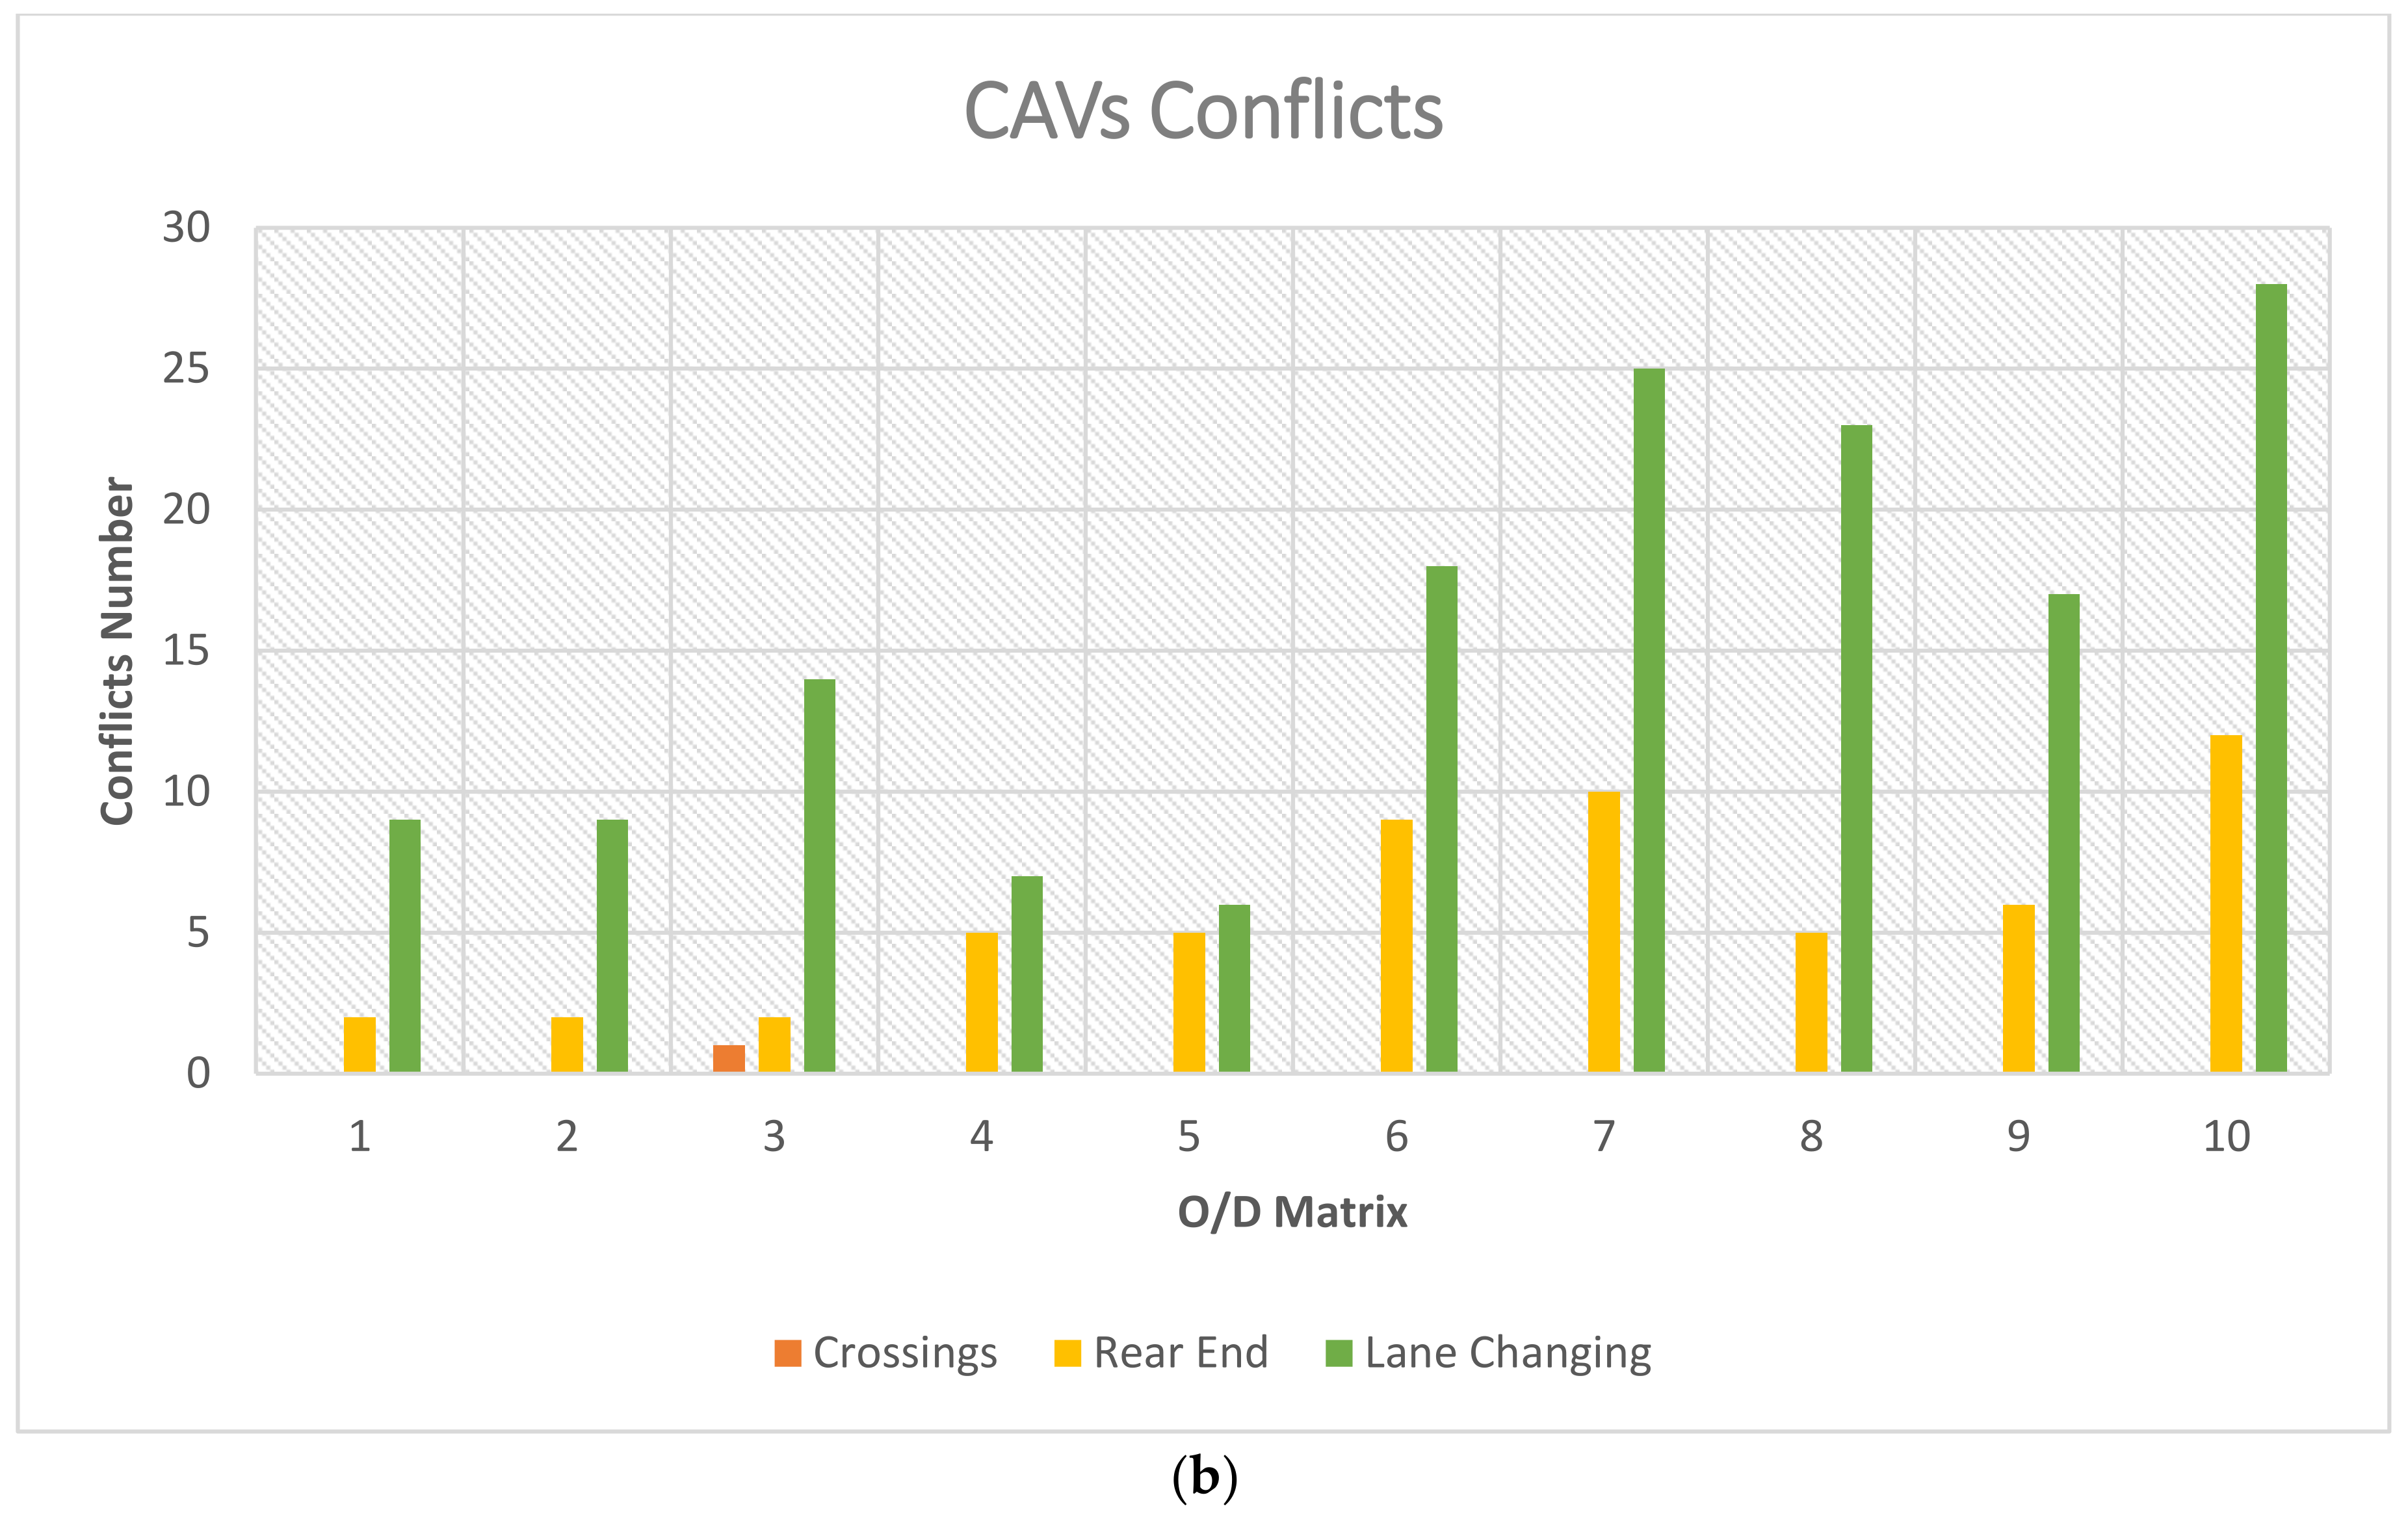
Ultimately, in
Figure 3, two plots were provided in order to allow an easier observation of differences between results obtained for CVs and CAVs, respectively. It can be noted that lane changing conflicts represent the higher quantity both for CVs and CAVs, and then a minimum quantity of crossings conflicts is obtained from CAVs, while the rear end conflicts trend is almost similar for both vehicles type.
Conflicts related to the CVs and CAVs flows were determined by applying a reduction of the TTC and PET through the equations shown below. When CAVs are interacting with the other vehicles in traffic, but the emergency braking system does not work and the vehicle cannot slow down to avoid the impact, it can be assumed by the formula for uniform motion:
s = 6 [m] = v∙t = v∙TTC, where 6 m is assumed as the system activation distance in the case studied. In the most serious situation, it follows that TTC = 6·[m]/8.33 [m/s] = 0.72 [s]. When traffic includes only CAVs, one can obtain 0 < TTC CAVs < 0.72 s. Considering a linear increase in TTC as the percentage of CVs increases, it is possible to assume following equation:
5. Discussion
In recent years, roundabouts have been recognized by transportation researchers as an important aspect of road transportation, and it plays a key role in addressing traffic congestions and ensuring safety of pedestrians on the road, in addition to playing a significant role in creating an efficient alternative to traditional/classical road intersections designs. Roundabouts provide an efficient solution to low traffic volume junctions at road intersections to reduce vehicular traffic delays and improve road and vehicular safety [
14,
15,
16,
17]. The most common road safety benefits of using roundabouts are usually because of the geometry designs of road intersections and the priority rules associated with roundabouts, which minimize the speed of vehicles approaching roundabouts and reduce the likelihood of collision of vehicles at roundabouts. The introduction and transportation planning of CAVs technology at roundabouts is still novel regarding the impacts on traffic flow and the infrastructure needs. Evidently, it is claimed that the introduction of autonomous vehicle operations in roundabouts will redefine the infrastructure of road transportation in terms of pedestrian safety [
18]. However, research on this aspect of road transportation and, most significantly, the impacts of the usage of connected automated vehicles on roundabouts is limited.
In the past few years, research in the design of road roundabouts has been a subject of interest to transportation researchers, emphasizing the evaluation of roundabout designs and operations of connected automated vehicle operations. This is because of the increase in innovative and non-conventional road designs. In this research study, the focus waas on prior research relevant to the various methods used by past researchers in assessing and comparing roundabout designs and connected automated vehicle operations at roundabouts taking into consideration the safety of pedestrians. Most research studies related to roundabouts adopted micro simulation software to evaluate and assess the performance of roundabouts, not excluding software such as [
19,
20,
21] and Aimsun [
22,
23]. Other prior research studies are dependent on experimental methods to conduct their evaluations of various roundabouts designs [
24,
25,
26]. Moreover, different evaluation benchmarks have been applied in assessing the performance of roundabouts when it comes to road safety, mobility as a service (MaaS), effects on the environment, and socio-economic impacts. Previous researchers such as [
25], investigated the assessment of road safety of designs of roundabouts by applying a before-after empirical Bayes observational method [
25], argued that no evidence supported the claims that old, aged drivers are experiencing difficulties adapting to the new types of roundabouts. Another study by [
27], investigated the trends of long-term vehicular crashes on roundabouts to isolate the increment in vehicular crashes because of the driver’s unfamiliarity with the geometry and designs of the roundabouts. The implications of [
27], research findings show that there is a drastic reduction of around 9% in the overall crashes of vehicles at double-lane roundabouts. However [
28], applied an approach called the automated traffic conflict technique in evaluating the safeness of modern roundabouts. They used a computer vision-based platform to evaluate video data collected over a certain period using a modern roundabout in Vancouver, Canada, as a case study. They also went further by extracting traffic flow conflicts at various locations in the modern roundabout. The findings from this research study unearth a few roundabouts design problems that severely affect the road safety of the roundabouts, including abysmal road pavement markings and road signage location. However, far little research has been done by transportation researchers when considering the comparison between different roundabouts in terms of road safety. Additionally, [
20] attempted to achieve this aim by comparing the road safety efficiency of elliptical and turbo roundabouts. They used a microsimulation software called VISSIM to try and simulate traffic in a two-roundabout scenario, and another microsimulation software called SSAM was used to extract the traffic conflicts. The findings from the research study showed a significantly higher frequency of rear-end and crossing conflicts at the elliptical roundabouts compared to the turbo roundabouts, which shows a significant number of lane change conflicts at the roundabouts. Additionally, the implication of the research study indicated that elliptical roundabouts experience a high amount of severity of traffic flow conflicts.
This research study has thrown up many questions in need of further investigation considering that a future study investigating different classes of vehicles such as heavy vehicles at flower roundabouts and the effects of such classes of vehicles on pedestrian safety would be very complementary and functional. Further research in exploring additional mixed traffic conditions at these roundabouts is recommended. Further research needs to examine, more closely, other geometrical configurations to evaluate the impact of geometric variables (such as the width of the circulating lanes, entry and exit lanes, etc.) on the determination of potential conflict and the consequent operational level-of-service.
6. Conclusions
In this paper, it was treated several times how road intersections must be considered as crucial parts of the road network. Therefore, they represent the critical areas where vehicle trajectory conflicts can take place. Hence, poorly designed intersections can easily lead to congestion phenomena (with the consequent formation of vehicle queues), and in several cases even to serious or very serious accidents. Therefore, the right choice of the intersection layout (such as Turbo-roundabout) becomes fundamental to offer a better level of service to users, giving them the opportunity to travel in the shortest time possible on the route of road they have chosen. The method of this article concerned the use of simulations of the road environment through the application of VISSIM software, and the use of simulations of potential traffic conflicts through the application of SSAM software, which respectively reproduce the behaviour of the vehicles inside a Turbo roundabout.
Some fundamental parameters represented in the 10 O/D matrices were analysed through VISSIM, such as average speed, average tail length, maximum tail length, number of vehicles, number of stops, time wasters. As a result of this analysis, it has been possible to identify those O/D matrices that determine maximum dynamic performances and minimum conflicts. Specifically, the maximum performance values are obtained from matrices A1, A, and A7. In terms of conflicts, the best values are obtained from matrix A1, A2, and A5, that is, when the crossing prevails, whereas the worst is from matrices A7 and A10.
In this view, the methodological approach presented in this paper through a several case studies and its application to more complex scheme of intersections and roundabouts can contribute to address further problems that transportation engineers—which usually apply microsimulation for real world case studies in the professional context—have to solve. Future developments also include that the criterion should be specified to consider more classes of heavy vehicles and explore further mixed traffic conditions. At the last, the analysis should also be extended to other geometrical configurations in order to evaluate the impact of geometric variables (such as the width of the circulating lanes, entry and exit lanes, etc.) on the determination of potential conflict and the consequent operational level-of-service.


 ,
, 


