
Improving Production Efficiency with a Digital Twin Based on Anomaly Detection


1
Laboratory of Product Development and Lightweight Design, Department of Mechanical Engineering, TUM School of Engineering and Design, Technical University of Munich, 85748 Munich, Germany
2
Hammerer Aluminum Industries Extrusion GmbH, 5282 Ranshofen, Austria
*
Author to whom correspondence should be addressed.
†
Shared co-first authorship. Both authors have contributed equally.
Sustainability 2021, 13(18), 10155; https://0-doi-org.brum.beds.ac.uk/10.3390/su131810155
Submission received: 30 July 2021
/
Revised: 3 September 2021
/
Accepted: 6 September 2021
/
Published: 10 September 2021
(This article belongs to the Special Issue The Role of Digitalization and Industry 4.0 Technologies for Product and Production Development in the Manufacturing Industry)
Abstract
:Industry 4.0, cyber-physical systems, and digital twins are generating ever more data. This opens new opportunities for companies, as they can monitor development and production processes, improve their products, and offer additional services. However, companies are often overwhelmed by Big Data, as they cannot handle its volume, velocity, and variety. Additionally, they mostly do not follow a strategy in the collection and usage of data, which leads to unexploited business potentials. This paper presents the implementation of a Digital Twin module in an industrial case study, applying a concept for guiding companies on their way from data to value. A standardized use case template and a procedure model support the companies in (1) formulating a value proposition, (2) analyzing the current process, and (3) conceptualizing a target process. The presented use case entails an anomaly detection algorithm based on Gaussian processes to detect defective products in real-time for the extrusion process of aluminum profiles. The module was initially tested in a relevant environment; however, full implementation is still missing. Therefore, technology readiness level 6 (TRL6) was reached. Furthermore, the effect of the target process on production efficiency is evaluated, leading to significant cost reduction, energy savings, and quality improvements.
1. Introduction
Companies of all sizes all around the world are affected by the ongoing digital transformation. One aspect of this digitalization is Big Data, which is defined by the three Vs: Volume, Velocity, and Variety [1]. All three attributes pose significant challenges to industry. Massive amounts of data are being produced. In 2020 alone, 59 zettabytes (59 × 1012 GB) of data were generated, and this figure is expected to reach 175 zettabytes by 2025 [2]. Some of these data are produced by cyber-physical systems, products with physical and computational functionalities, which are the drivers of the so-called fourth industrial revolution “Industry 4.0” [3,4]. These systems enable connectivity between physical products, which is expected to increase over the entire product lifecycle in the upcoming decades, leading to a large variety of different data from sensors, microprocessors, devices, etc. [5,6]. Due to this connectivity, it is possible to derive data produced by the system itself or related services in the use phase [7]. Consequently, despite the severe challenges that this transformation poses, it also offers new potentials such as increasing cost efficiency, improving decision making, and deriving new business opportunities [8]. Furthermore, it also offers possibilities to cope with other big challenges such as climate change. Over recent years, Industry 4.0 has become one of the main concepts for increasing the sustainability of production, machines, and processes [9].
To overcome the challenges and to achieve the benefits, several novel techniques and approaches have been developed by academia and industry. One of the most discussed terms in the context of Industry 4.0 is the “Digital Twin” (DT) [10]. This concept was first introduced in a presentation by Dr. Michael Grieves in 2002 [11]. Grieves and Vickers define a DT as “a set of virtual information constructs that fully describes a potential or actual physical manufactured product from the micro atomic level to the macro geometrical level.” [11]. Since then, several definitions have been published. In a literature review, Trauer et al. [12] derived three main characteristics of DTs:
- DTs are virtual dynamic representations of physical systems.
- DTs exchange data with the physical system automatically and bidirectionally.
- DTs cover the entire product lifecycle.
Another important aspect of DTs is that there is not just one application scenario for a DT. A DT is rather a collection of suitable use cases that can be assembled as modules of a DT [12]. Building a DT from specific modules also addresses the ambitious third characteristic: demands for covering the entire lifecycle. It can be solved by connecting the DT modules over the lifecycle to completely fulfill the definition [12]. In mechanical engineering, these use cases range from forecasts of cycle times in production, over enhanced simulation models through use phase data in engineering, towards predictive maintenance approaches for after-sales phases [10,12]. Thus, subtypes of DTs can be formulated, depending on the lifecycle phase to which a DT module is contributing the most. These subtypes are engineering twins for the product development phase, production twins in the production phase, and operation twins in the use phase [12].
In areas other than mechanical engineering, such as smart cities, construction, retail, or healthcare, DTs provide useful application opportunities (e.g., [13,14,15]). The use of DTs promises benefits, such as an increased efficiency throughout the whole lifecycle, improved transparency, reduced risk, increased quality, higher flexibility, and increased revenue as costs can be reduced and additional services offered [15]. The potential benefits are reasonable and appealing. However, it is important to carefully assess and, in the best case, quantify the benefit of DT use cases [16]. Otherwise, organizational and technical issues might occur, and potentials would not be realized to the full extent. Therefore, comparable to any other digitalization project, it is important to develop a comprehensive strategy, describing the objectives a company wants to achieve [8]. Furthermore, Neto et al. [16] identified a well-defined implementation plan and process standardization as the main enablers for DTs. To cope with these challenges, in this paper, a use case template and a procedure model, based on product development use cases from [17], were adapted and further developed to use cases in the production context.
Contribution of the paper. As companies are often overwhelmed by a large amount of data and mostly do not follow a strategy in the collection and usage of data, this paper presents a novel concept for guiding companies on their way from data to value by implementing a DT module in production. The innovation lies in two aspects: the procedure model applied to production processes and the developed algorithm for detecting anomalies in aluminum extrusion. The procedure model with its standardized use case template helps to formulate the value proposition and enables companies to analyze current processes and conceptualize the target process. The proposed concept is applied and evaluated for an aluminum profile extrusion process at a medium-sized company in Austria. A DT module was developed and initially tested in a relevant environment; however, it is not yet a complete DT prototype, as the realization of bidirectional data exchange is still missing. Based on this example, the paper reveals the possibilities and benefits of a DT and evaluates its usefulness in reducing cost. Furthermore, it demonstrates the potentials of an anomaly detection algorithm applied to a production process to improve its efficiency.
Structure of the paper. After this introduction section, the case study partner, the DT procedure model, and the anomaly detection algorithm are described in Section 2. The procedure model and the anomaly detection algorithm are applied to the extrusion of aluminum profiles in Section 3. In Section 4, the results and used methods are discussed. The last section summarizes the work, draws conclusions, and ends with an outlook for future work on DTs and anomaly detection algorithms.
2. Materials and Methods
2.1. Case Study Partner
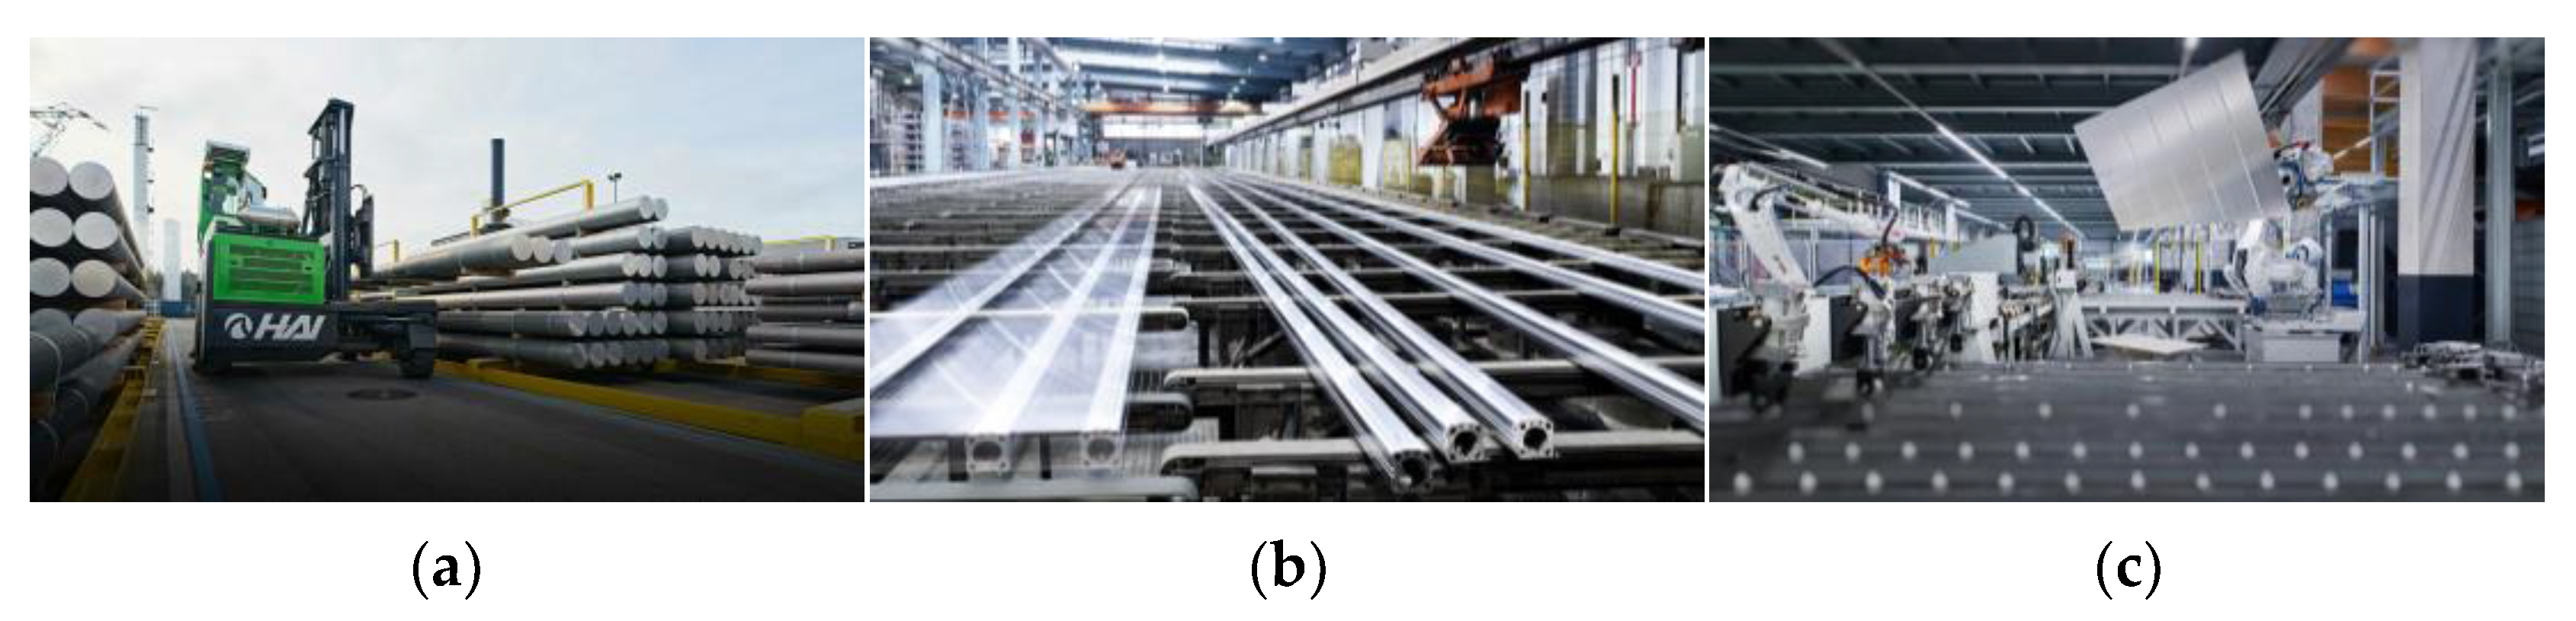
The presented case study was conducted with Hammerer Aluminium Industries Extrusion (HAI). HAI is an international company in the field of aluminum production. The company was founded in 2007 and has developed since then to an innovative group of companies, employing more than 1500 people, with a planned turnover of more than EUR 500 M in 2021. Within its operating field, the company focuses on three main technology areas: casting, extrusion, and processing (see Figure 1). The first entails the production of castings and wrought alloys with a capacity of ~220,000 t aluminum per year. The second area focuses on the extrusion of customized aluminum profiles, especially for the transport, production, and construction industries. The last technology field requires the processing of aluminum, ranging from friction stir welding to mechanical jointing and riveting to machining and forming processes. The described DT module was applied in the extrusion field, which has an approximate capacity of 100,000 t per year [18].
2.2. Aluminum Extrusion Processes
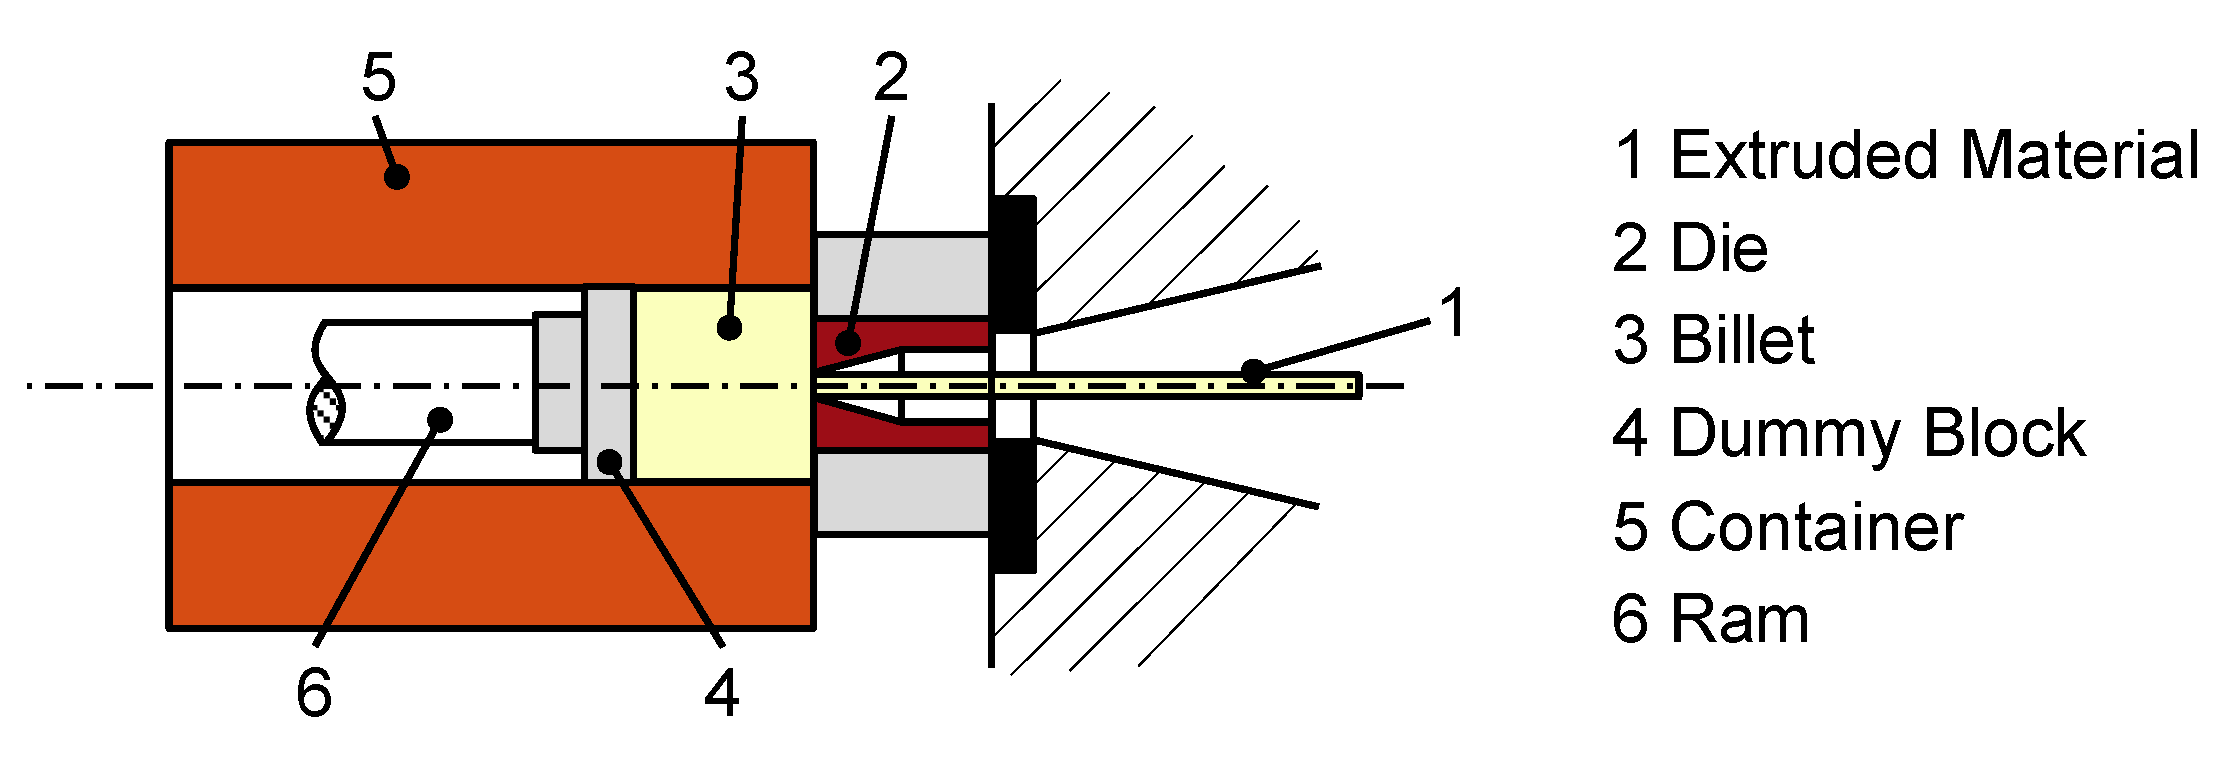
Nowadays, aluminum is one of the most frequently used materials in industry. Its applications range from architecture to transport, mechanical engineering, electrical engineering, and packaging to leisure and sports applications [19]. There are different manufacturing technologies for aluminum-based products, such as casting and extrusion. In particular, aluminum bar extrusion has been widely developed and discussed in industry and academia over the last century [20]. Bar extrusion, where a billet in a container is pushed through a die to form an extruded profile, can be categorized in direct, indirect, and hydrostatic bar extrusion [21]. In the present case study, direct bar extrusion is used, as depicted in Figure 2. Here, a ram (6) pushes a 350–500 °C hot aluminum billet (3) with a dummy block (4) against a die (2) to form an extruded profile out of the material (1). To take radial loads, billet, ram, and dummy are encased in a container (5) [20,21].
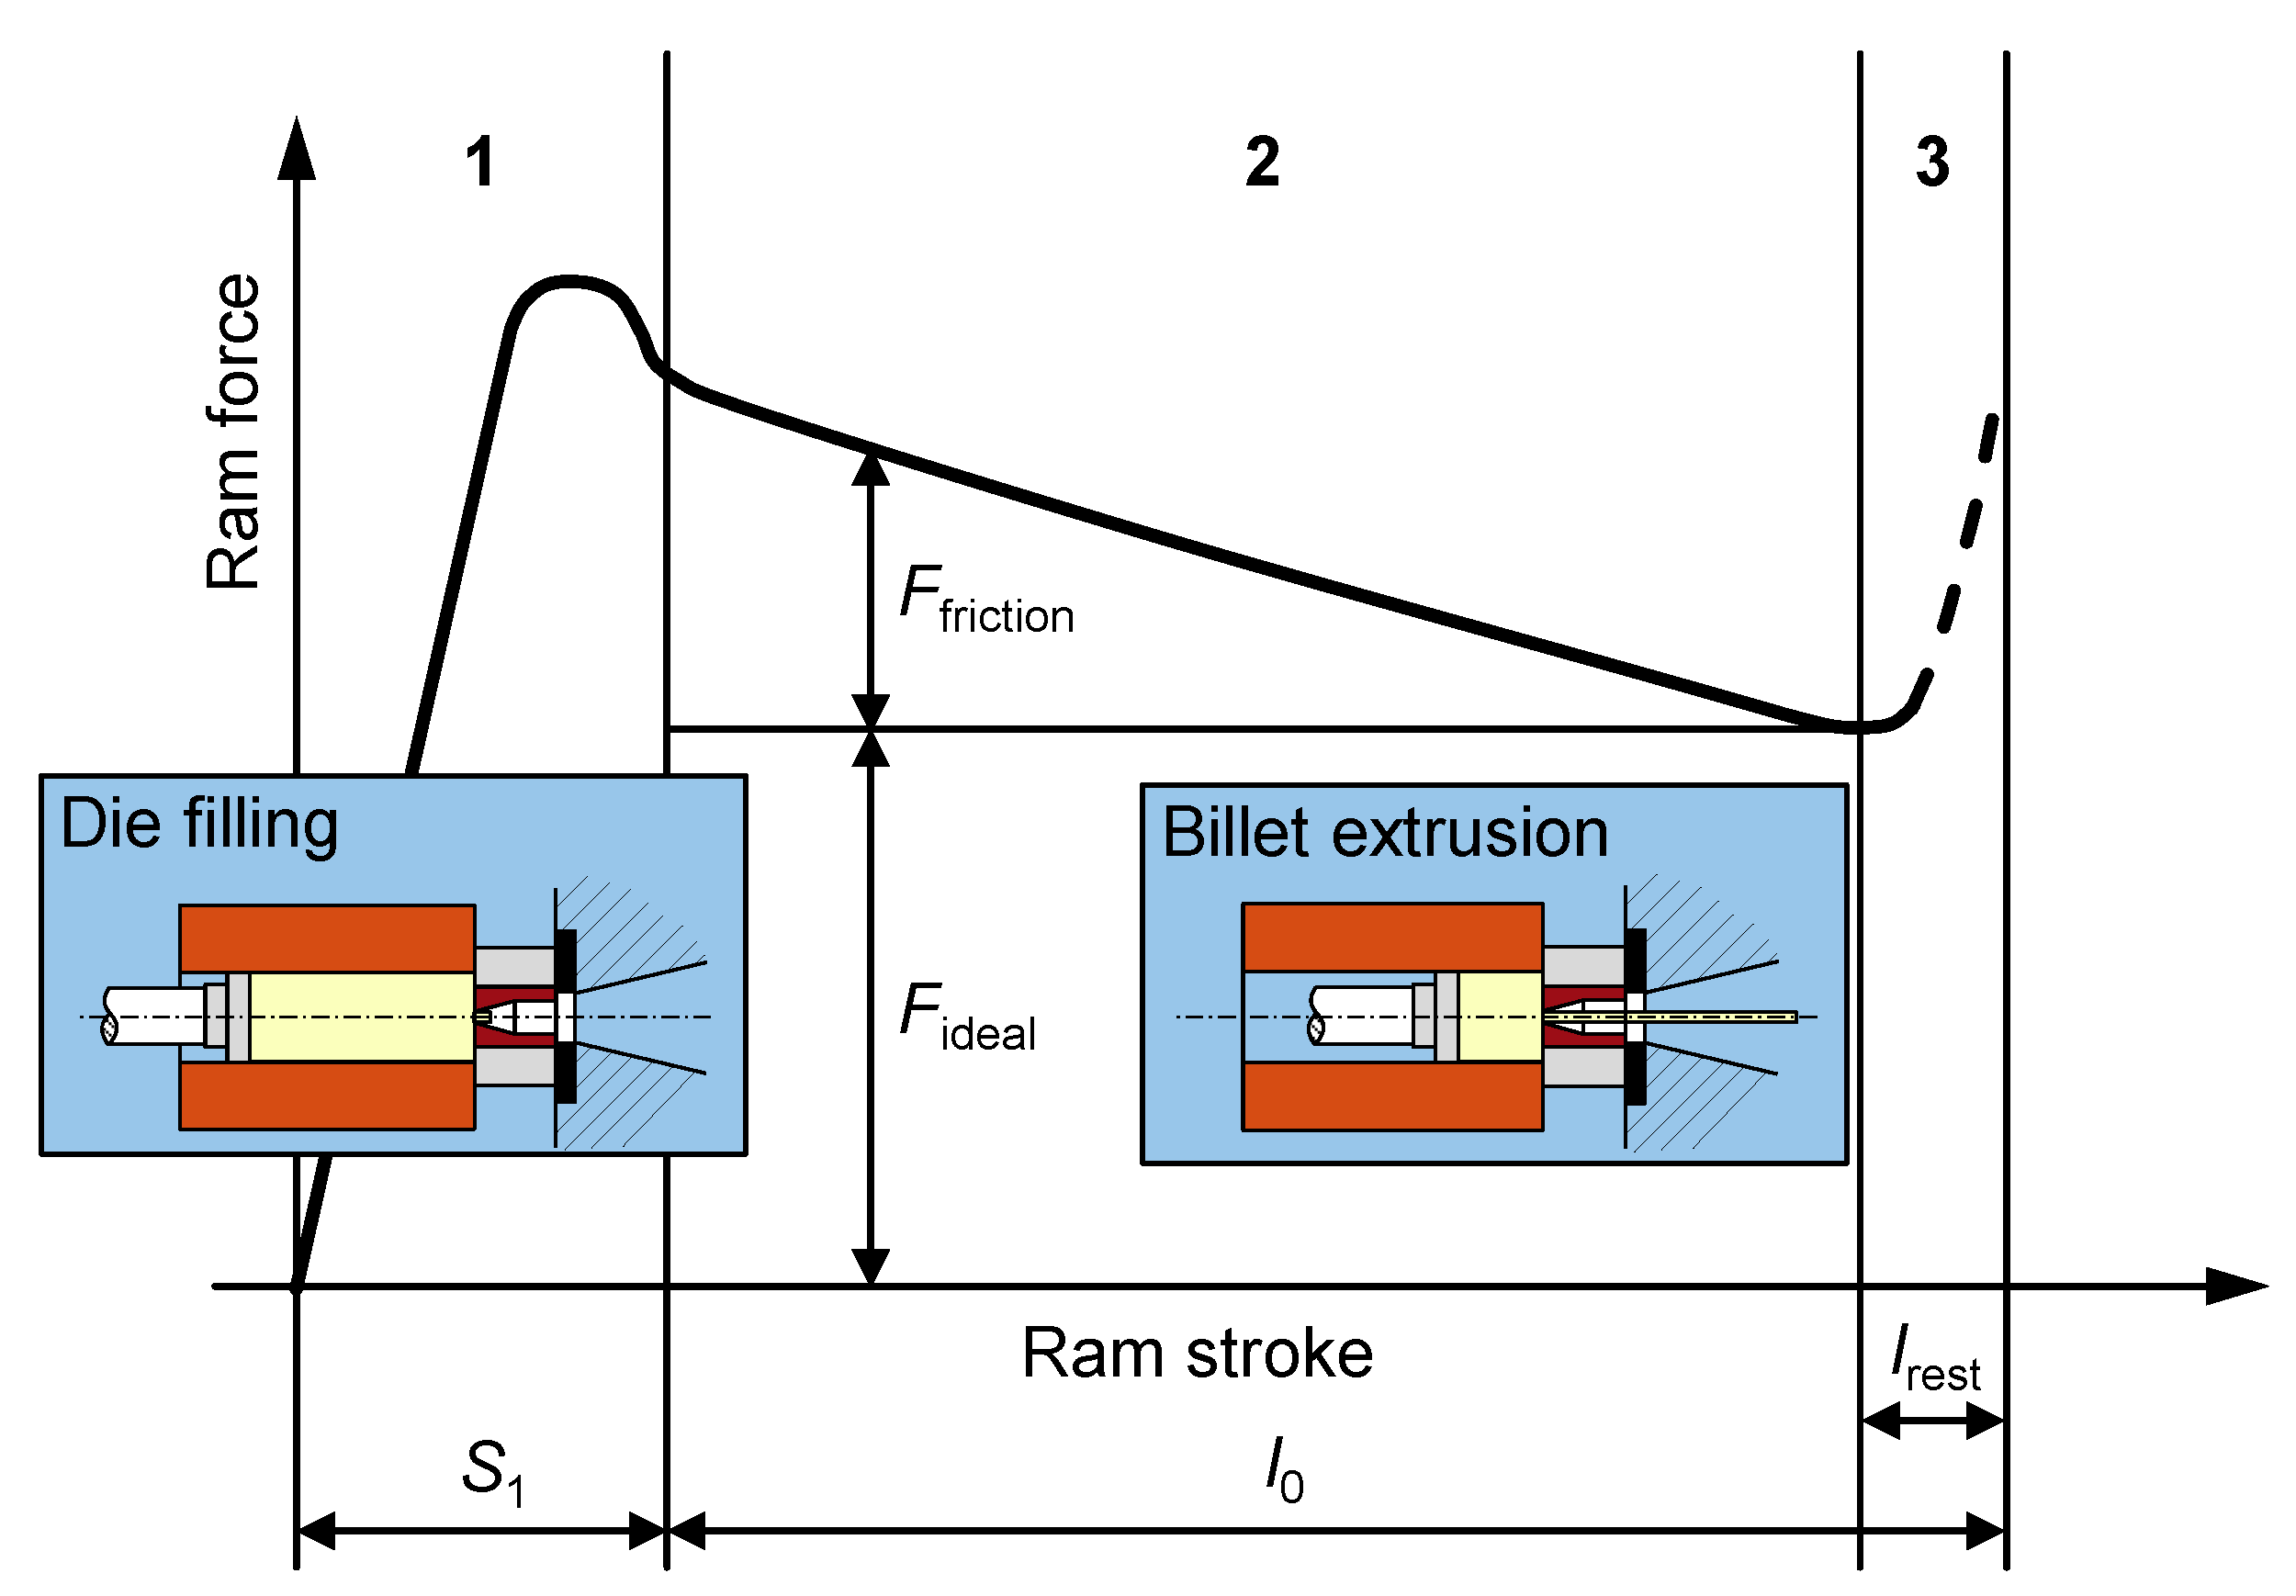
Direct bar extrusion usually has a very typical force–displacement curve, which is depicted in Figure 3. According to [20,21], the process can be subdivided into three phases:
- The billet is filled in and compressed against the die until the maximum force is reached.
- While the billet is pushed through the die, pressure decreases, and “steady-state” extrusion proceeds.
- After the minimum pressure is reached, the ram force again increases rapidly, as the discarded material is compressed. Most commonly, the process is interrupted at this point and the remaining material is discarded and recycled.
This standard curve can deviate depending on the temperatures of the container and die, the used material, and the extrusion temperature, speed, and ratio [21]. Thorough control and analysis of these parameters are inevitable, as the quality of the product depends on them. Especially in the extrusion industry, quality is a major marketing factor for these companies. Improving quality can increase market penetration, productivity, and revenue while lowering production and service costs [20]. Thus, in this case study, a use case was developed to improve production efficiency with respect to costs, energy, and quality, which is described in Section 3.
2.3. Procedure Model for the Conception and Implementation of Digital Twins
The conception and implementation of a DT strategy are a complex and interdisciplinary development process. Even for just one single use case, a systematic approach is needed in order to keep track of all necessary tasks and to execute a project as efficiently as possible. Therefore, a procedure model for the conception and implementation of DTs, consisting of five steps, was developed in [17] (see Figure 4). This model was applied in the case study of this paper up to Step 4.
In the first step of the model, relevant stakeholders are identified, a common understanding of the term “Digital Twin” is communicated, an overall DT strategy is formulated, and a set of relevant use cases is derived. These use cases are then analyzed and assessed regarding their value proposition and the estimated effort for their implementation. By doing so, a roadmap for the implementation of the use cases can be formulated based on their prioritization. Consequently, these activities aim at answering the question of where to start. In this case study, this step resulted in a set of user stories to formulate the objectives and needs of the stakeholders. The effort is assessed in the three categories: simulation, use phase data, and network. Value is evaluated with respect to quality improvements, time, and cost reductions. Without this step, the threat of not meeting the customer needs would be quite high.
After the scope of the project is set, the current situation needs to be analyzed. To implement the use cases as efficiently as possible, it is crucial not to start from scratch but to carefully assess the possible areas for implementing the DT module. For example, in this case study, first, the already used software and the produced data were documented to define where the data interface for the DT module could be. Furthermore, the extrusion process was analyzed to assess where the DT, based on its analyses, could automatically cause a change in the production process to improve it. This activity also reflects the maturity of the company regarding the implementation of a DT, which is vital for conceptualizing the target state in Step 3.
Target conception is the main task of the procedure model. Here, based on the documented initial situation of the use case, a target area is identified. In this part of the current process, the DT can add the most value, by creating an additional service, increasing quality, lowering costs, etc. For the different options, based on the process model and with respect also to further production steps, it is evaluated where the most significant improvement can be achieved. For example, in this case study, an analysis of how detected defective products could be marked and where they could be removed from the production line was performed. Subsequently, the required tasks of the DT are derived and implemented in the process model. At the end of this third step, a first specification of the DT can be documented to hand over to the supplier or the internal person responsible for implementing the use case.
The supplier or internal stakeholders for implementation are identified in Step 4. As the selection of these parties is directly affected by the previous steps, it is beneficial to already start the analysis and selection process from Step 2 onwards. For example, depending on the ecosystem that the implementation partner is using, other data or software need to be analyzed in Step 2. In the last step, the DT use case will be implemented. To support companies in executing this procedure model, a use case template for the systematic documentation of DT use cases was developed to guide engineers through this procedure. The specific application of this template is presented in Section 3.1.
The procedure model, depicted in Figure 4 was initially developed for the conception and implementation of an engineering twin. As the developed DT module in this paper is a production twin, the model was applied in a slightly adapted manner as described in Section 3.1.
2.4. Anomaly Detection
In general, anomaly detection is meant to detect a certain behavior that is unusual or abnormal to the expected one. In the literature, anomaly detection is classified as point, contextual, and collective anomalies [22,23]. A point anomaly is defined as a single occurrence in data that is different from the rest of the data points. Contextual anomalies consider the fact that single occurrences may be normal in general but abnormal in a certain context. For example, a daily temperature of 35 °C in Germany in summer can be seen as normal, whereas this temperature in winter is abnormal. Collective anomalies are similar to contextual anomalies. Here, however, a single data point is not anomalous but a particular collection is [24]. For an anomaly detection task, there are usually many good and only a few anomalous data points available. Therefore, this task is distinguished from a classification task where about the same number of data points is available for each category. For a comprehensive overview of the research on anomaly detection, please see [22].
Anomaly detection has been applied to various application fields such as detecting cracks in aircraft structures [25,26], fraud detection in commercial organizations [27], or finding anomalies in biological data [28], to name only a few. Often, researchers used Gaussian models in order to detect anomalous behavior. For example, Li et al. [29] used a Gaussian mixture model to detect abnormal flights, Liu et al. [30] applied anomaly detection to aircraft engines, and Pandit and Infield [31] used Gaussian processes for monitoring the condition of wind turbines. As researchers often use Gaussian models in order to detect anomalous behavior, we also use a statistical approach based on Gaussian distributions. The applied statistical approaches are based on parametric distributions, which are fitted on data. Usually, the fitted distribution describes the probability density function of good data, as they are predominantly available. With the learned probability density function, the likelihood or rather the probability density of a new data point can be evaluated and compared to a predefined threshold [32]. New data points with likelihood values smaller than the predefined threshold are marked as anomalies. In general, likelihood can be seen as a distance measure. A widely used parametric distribution is a normal distribution which is defined by its mean vector and covariance matrix where is the number of variables. Assuming that the data follows a multivariate normal distribution , the probability density function of is defined by
Given a set of realizations with variables , the mean vector and the covariance matrix can be estimated by the sample mean vector
and the sample covariance matrix
respectively. A generalization of this multivariate normal distribution is the Gaussian process [33]. Gaussian processes also have been used to detect anomalies (see [34,35,36]). We choose a model based on Gaussian processes, as it enables modeling functions with statistical indicators. A Gaussian process is a collection of random variables, where any finite subset follows a (multivariate) normal distribution [33]. It can be also seen as a distribution of the function values , which are dependent on the input variable . The Gaussian process is expressed by its mean function and covariance function
Usually, a Gaussian process is defined by a prescribed mean function and covariance function , which have some free parameters . However, choosing a suitable mean and covariance function can be difficult. A possible workaround is to train multiple different functions and proceed with the best model as shown in [37]. There, the authors trained nine different covariance functions for detecting damages in bearings. Choosing predefined functions, however, may result in the incorporation of incorrect assumptions. For example, assuming a squared-exponential covariance function implies that the realizations of the Gaussian process are infinitely differentiable. Therefore, in [38], the authors propose a workaround: if every trajectory with belongs to the same input , the mean and the covariance function can be fitted by the sample mean and the sample covariance matrix of Equations (2) and (3), respectively.
A simple model for the mean and covariance function can be, e.g., a linear interpolation scheme. However, one must guarantee that the resulting covariance matrix is positive definite. Therefore, a squared observation error might be added to the main diagonal. Another way to guarantee a positive definite covariance matrix is to use a linear combination of basis functions (see [39]). To use a Gaussian process model for detecting anomalies, a threshold must be defined. This threshold can be set based on another unseen data set. In machine learning tasks, the entire data set is usually split into three subsets: the training, validation, and test sets. In this paper, the subsets are the following:
- Training set with only good data → probability density function.
- Validation set with good and anomalous data → likelihood threshold.
- Training set with good and anomalous data → evaluate model.
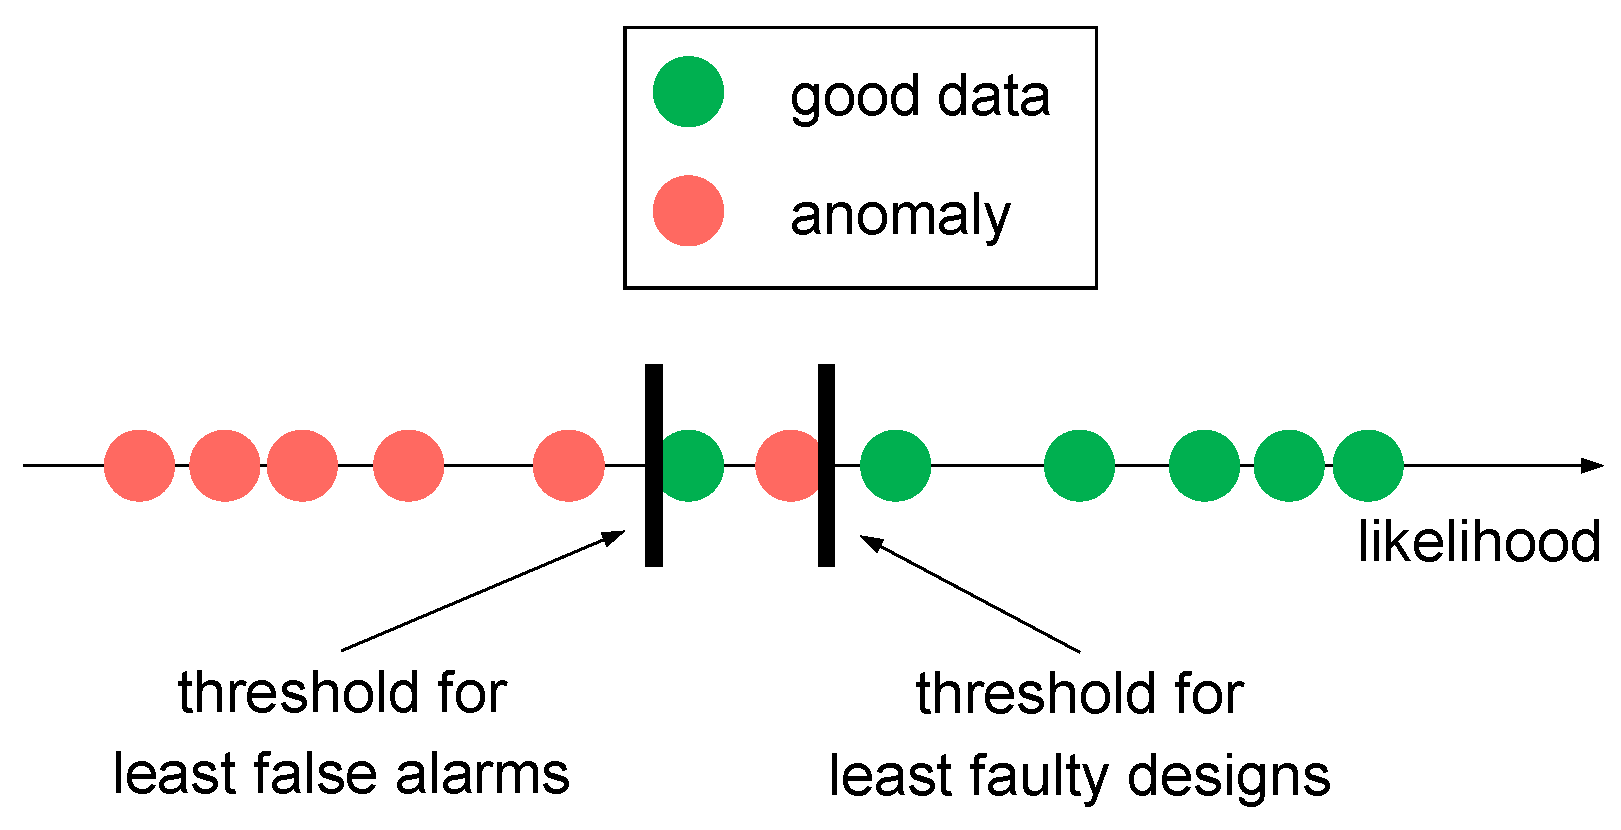
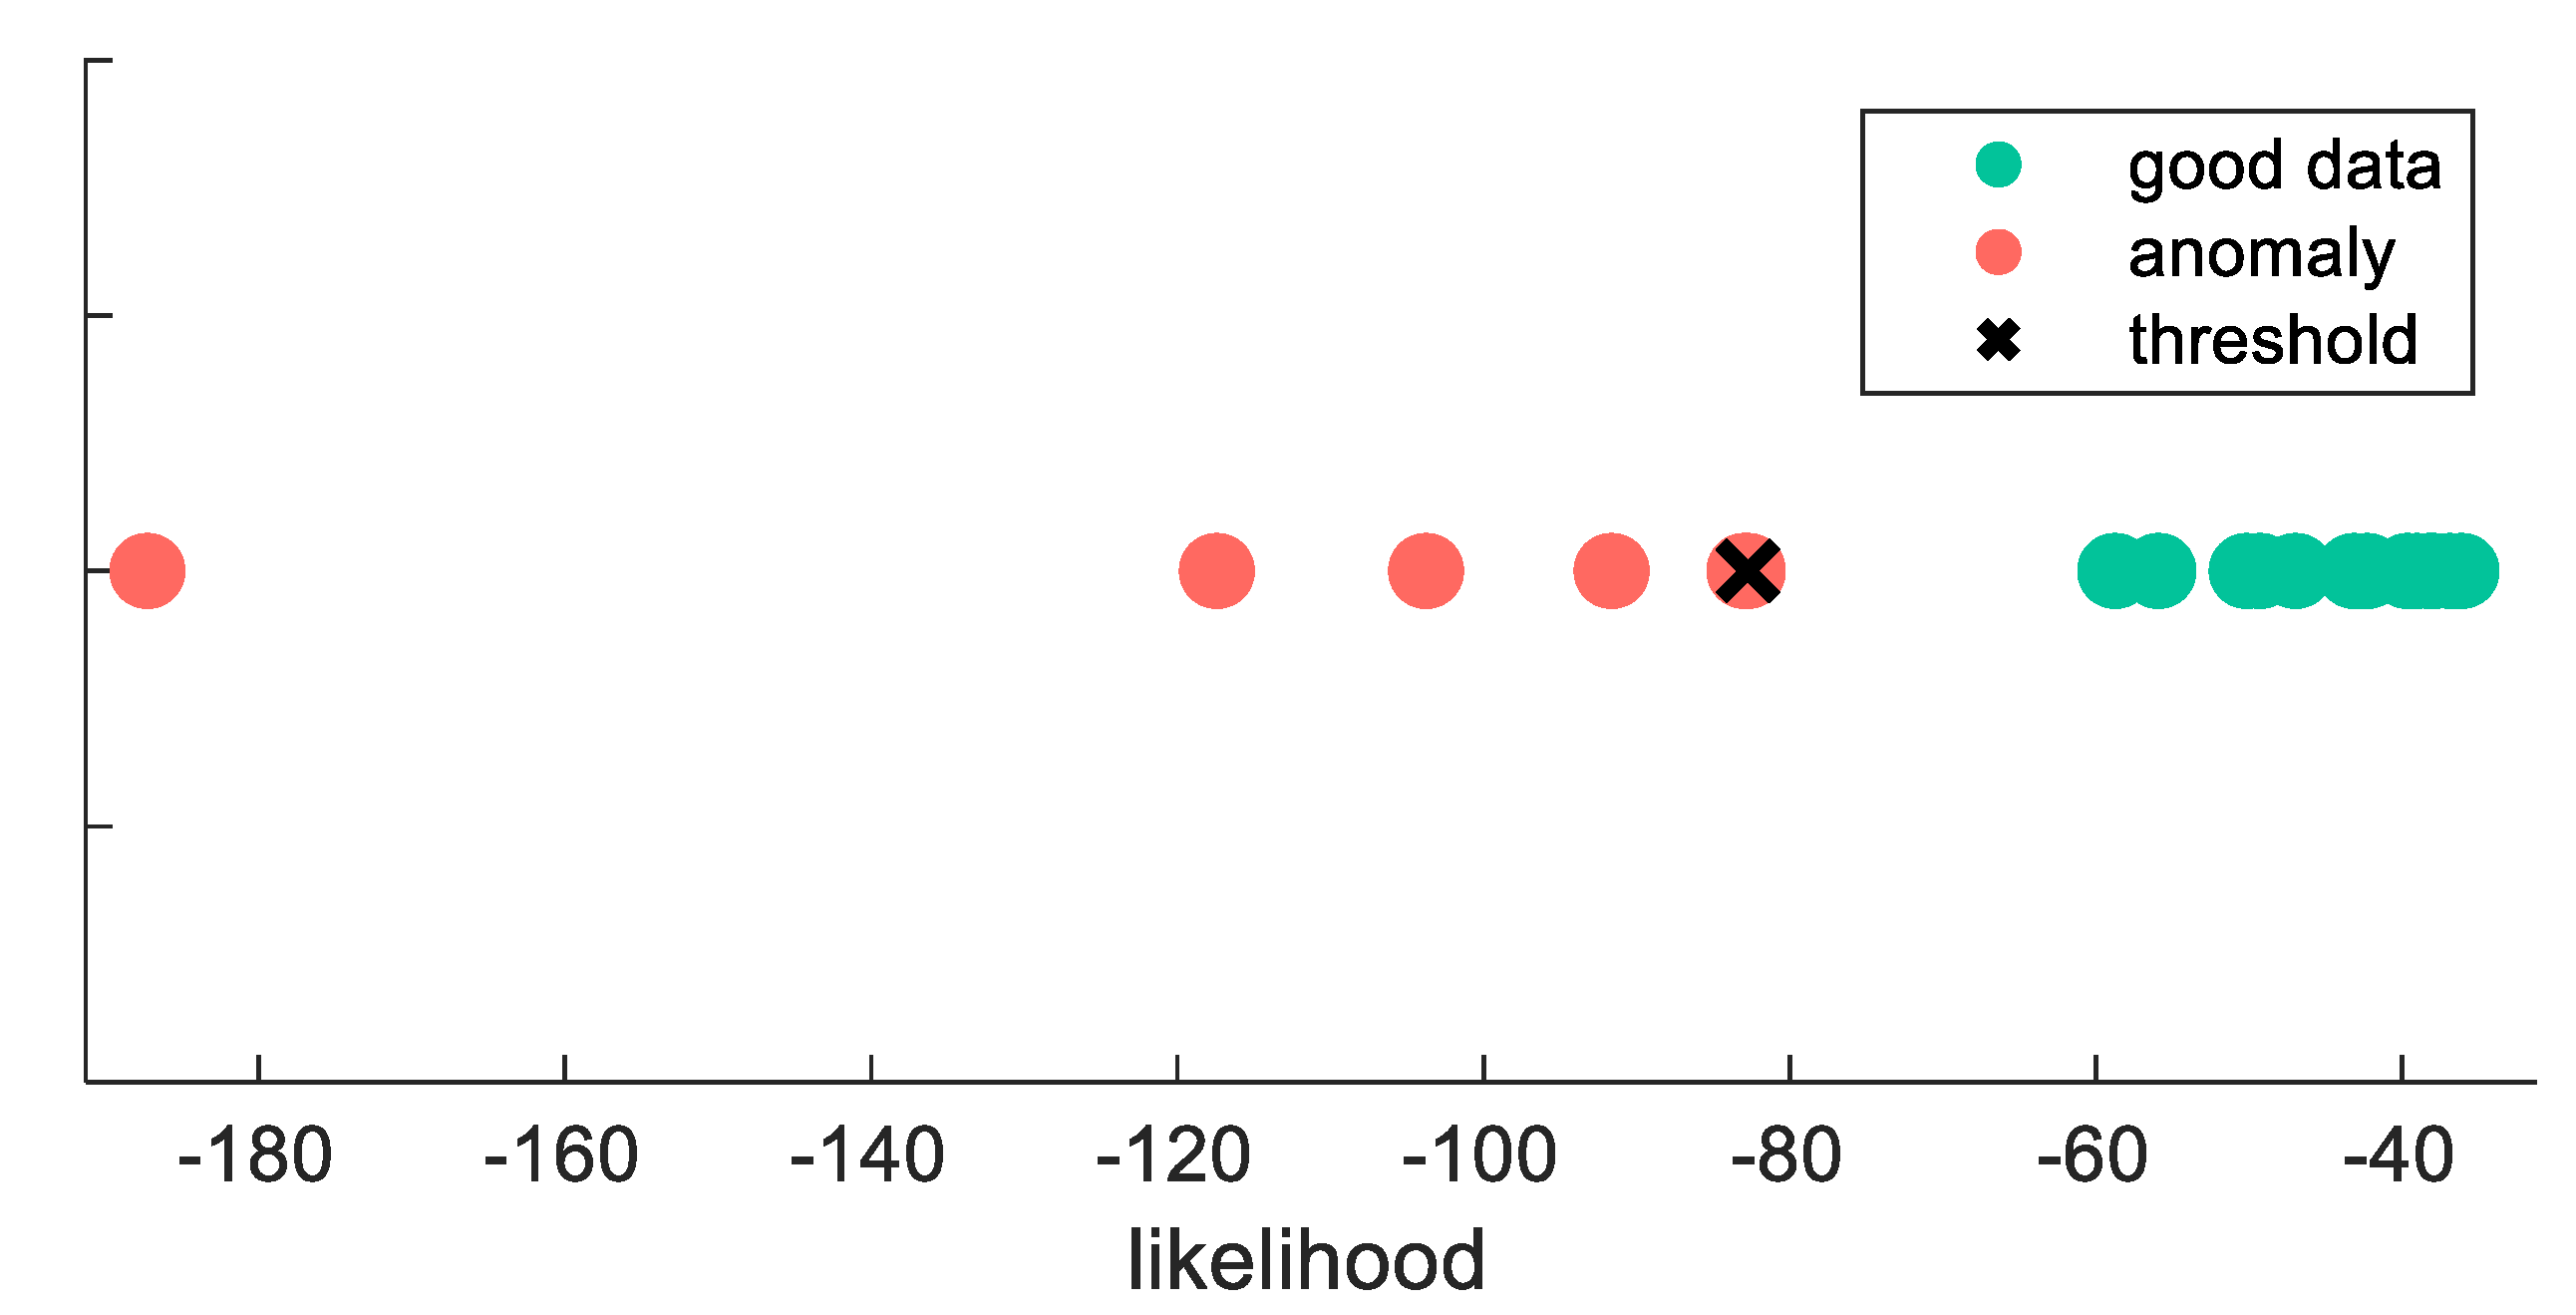
The training set, which contains only good data, is used to approximate the probability density function by estimating the mean and the covariance function (see Equation (5)). In order to set a threshold for dividing good and anomalous data based on likelihood, the validation set is used. Likelihood is computed for each validation line with the approximated probability density function from the training set. Then, the likelihood threshold is set such that the good data are separated from the anomalies. The data might be not perfectly separable as Figure 5 shows. Two main thresholds can be chosen: the threshold for least faulty designs which is the maximum of the smallest good and the biggest anomalous data point or the threshold for least false alarms, which is their minimum.
After the generation of the probability density function from the training set and the likelihood threshold from the validation set, the accuracy of the anomaly detection model can be evaluated on the unseen test set. An anomaly detection model can be evaluated based on the true positive rate (TPR), false negative rate (FNR), true negative rate (TNR), and false positive rate (FPR). In this paper, they are defined as the following:
- TPR: the rate of anomalies that are correctly declared as anomalies.
- FNR: the rate of anomalies that are wrongly declared as good data.
- TNR: the rate of good data that is correctly declared as good data.
- FPR: the rate of good data that is wrongly declared as anomalies.
3. Application and Results
3.1. Application of the DT Procedure Model and the Use Case Template
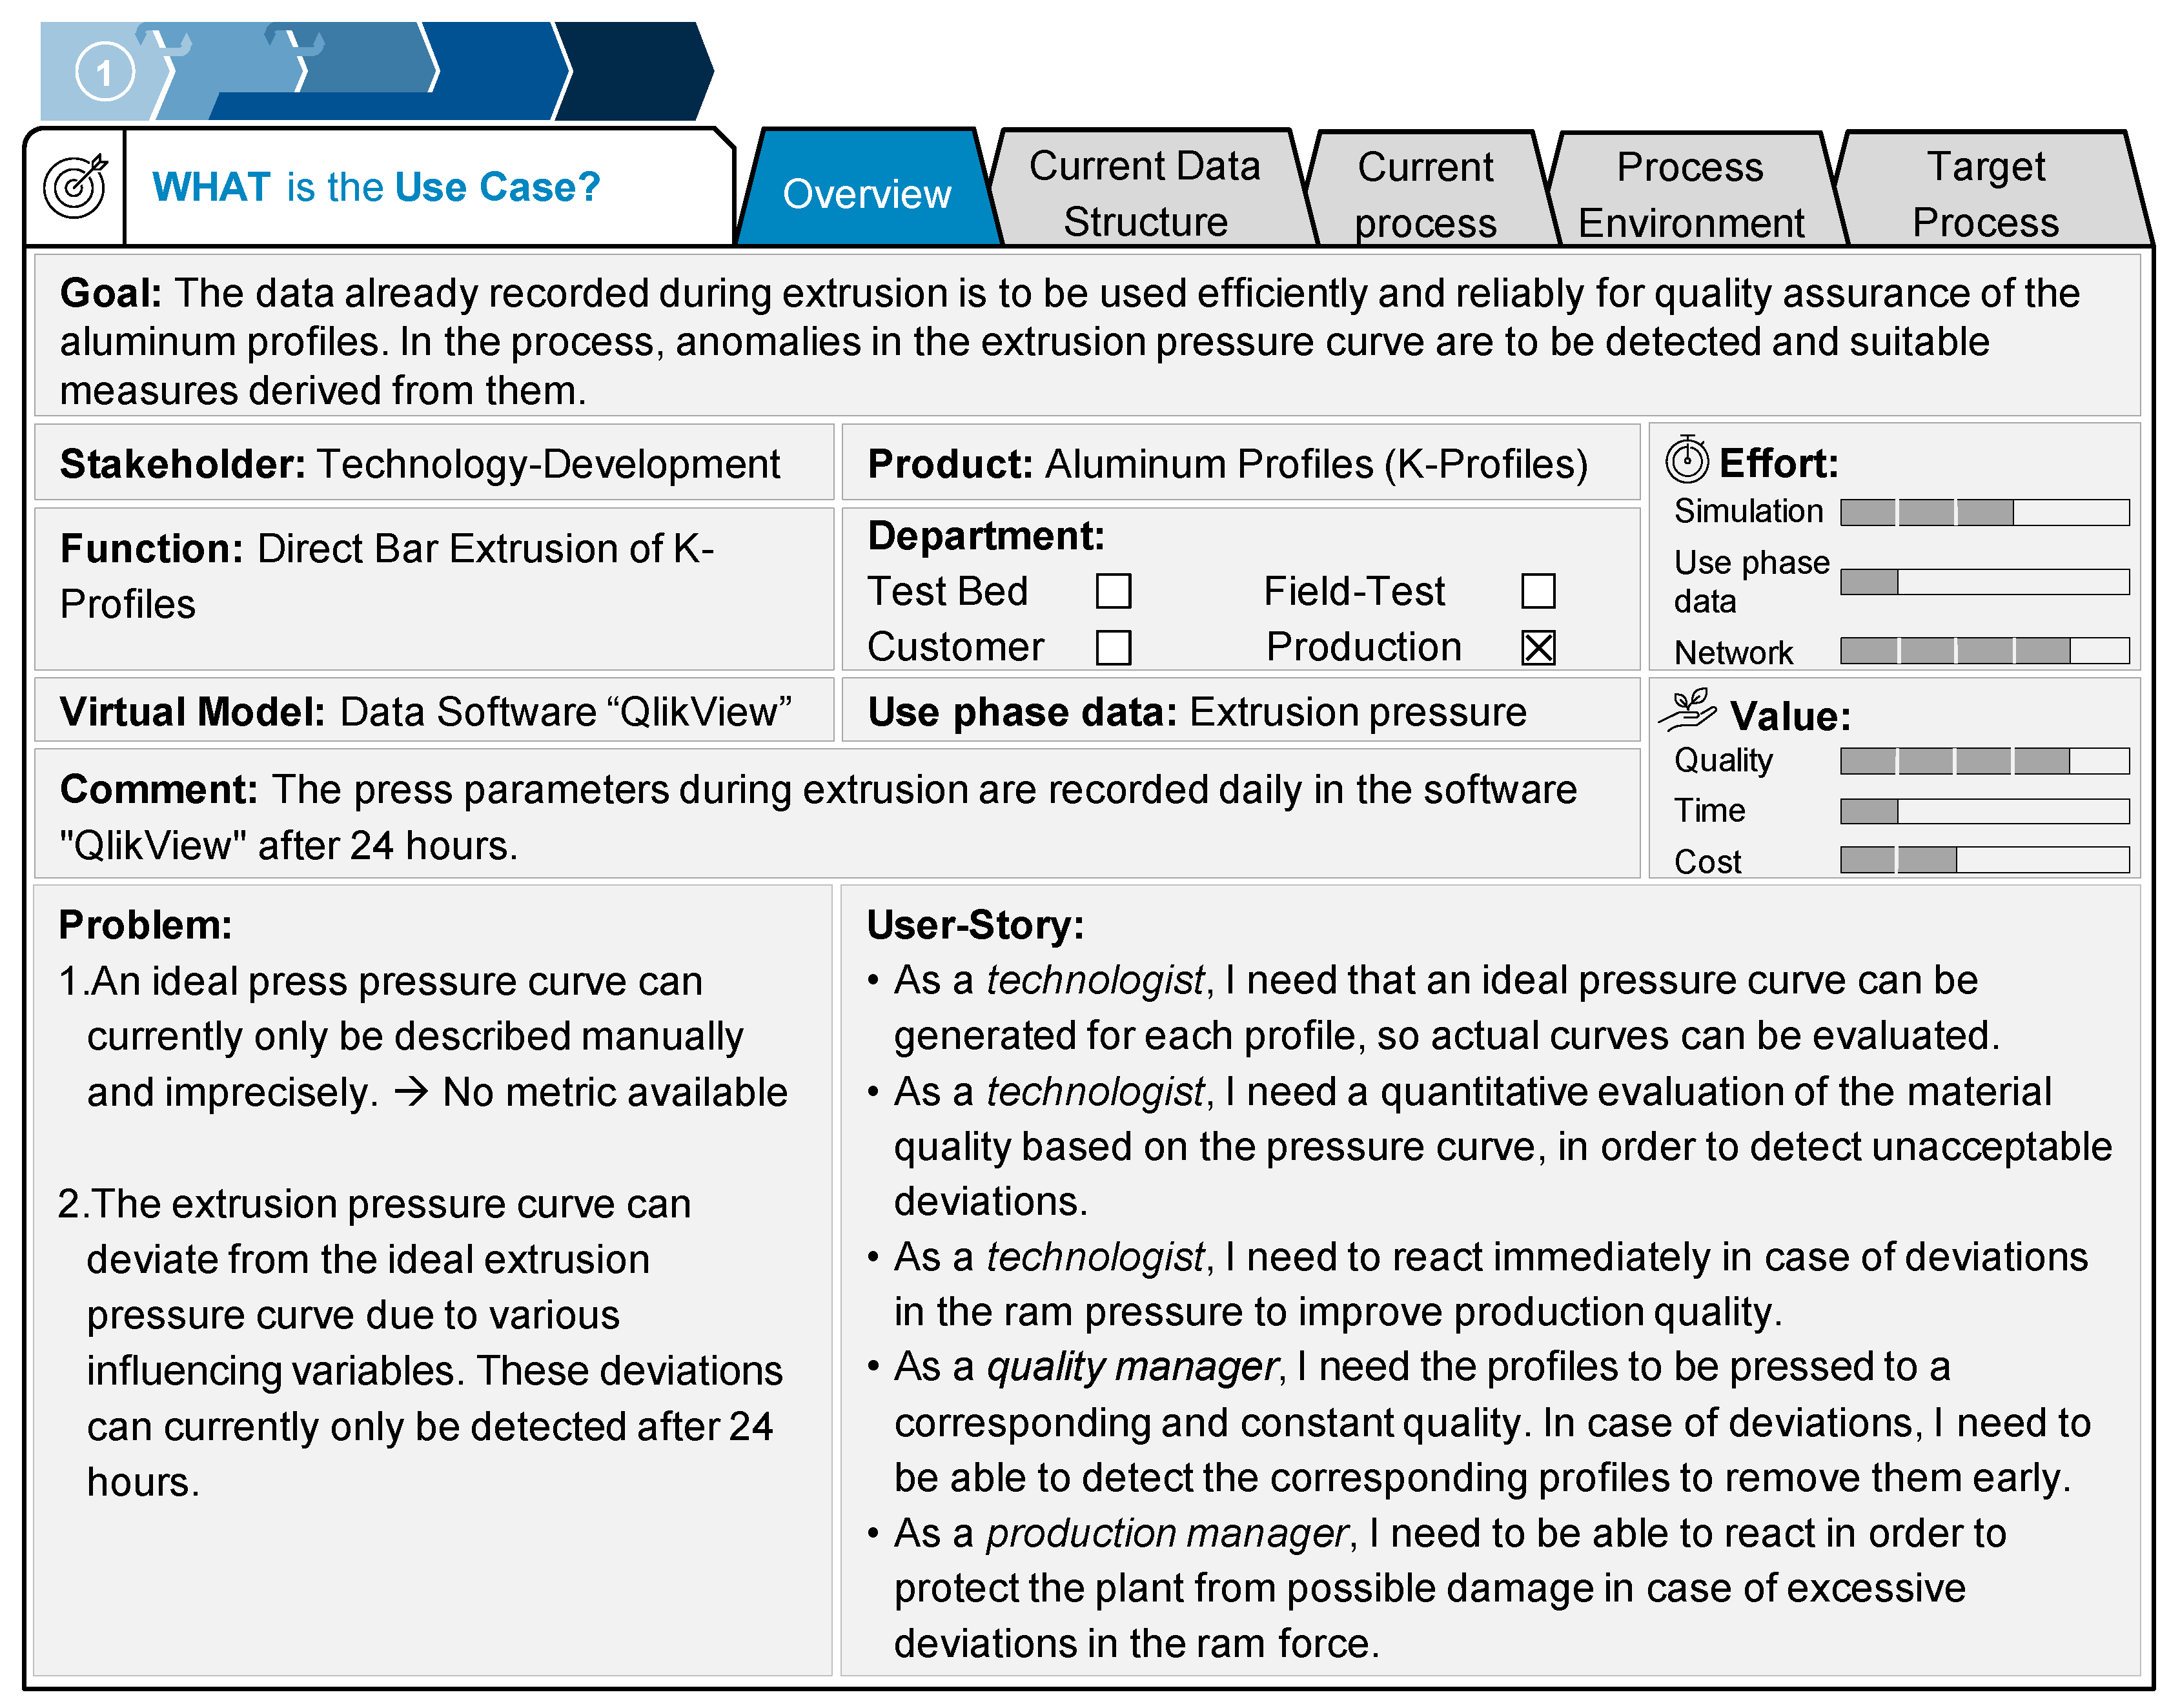
As described in Section 2.3, the presented case study was guided by the DT procedure model. The model is supported in all steps by a use case template, which is described in the following. In the first step of the procedure model, relevant stakeholders from engineering, quality production, and IT were identified. With the stakeholders, a use case description was formulated and documented using the use case template mentioned in Section 2.3 (see Figure 6). For several years, HAI had already been collecting data from their extrusion plants, including ram pressure, extrusion speed, container temperature, billet temperature, and much more. However, to date, the production process could only be improved based on retrospective, manually derived, and imprecise analyses, but not on active and predictive approaches. Therefore, the goal for this use case was formulated as, “The data already recorded during extrusion are to be used efficiently and reliably for quality assurance of the aluminum profiles. In the process, anomalies in the extrusion pressure curve are to be detected and suitable measures derived from them”. To achieve this goal, user stories were formulated, stating the needs and requirements of the case study partner. The partner wanted to have an ideal pressure curve generated, which can be used to evaluate the material quality of a produced profile quantitatively and qualitatively. Moreover, once an anomaly is detected, an immediate reaction should be triggered to increase production quality and to protect the press from severe damage. Based on the goal and the user stories, the effort and value of this use case were assessed qualitatively. Effort was evaluated using the dimensions simulation, use phase data, and network. The first dimension considers effort related to the development of the algorithm. As applications of anomaly detection for production control already exist in the literature, it was rated only as medium high. Gathering the use phase data was unproblematic, as all sensors and data management systems were already in place. The network aspect, however, is extensive. So far, there was no interface allowing for automated, real-time analysis of production data. The value is assessed by the three factors quality, time, and cost. As the major focus of this use case is to improve production quality, this dimension was rated high. Time was rated low, as detecting faulty products does not have a major effect on the cycle times. However, costs were rated higher, because identified, defective profiles can be discarded early in the production process and no further resources will be wasted on them.
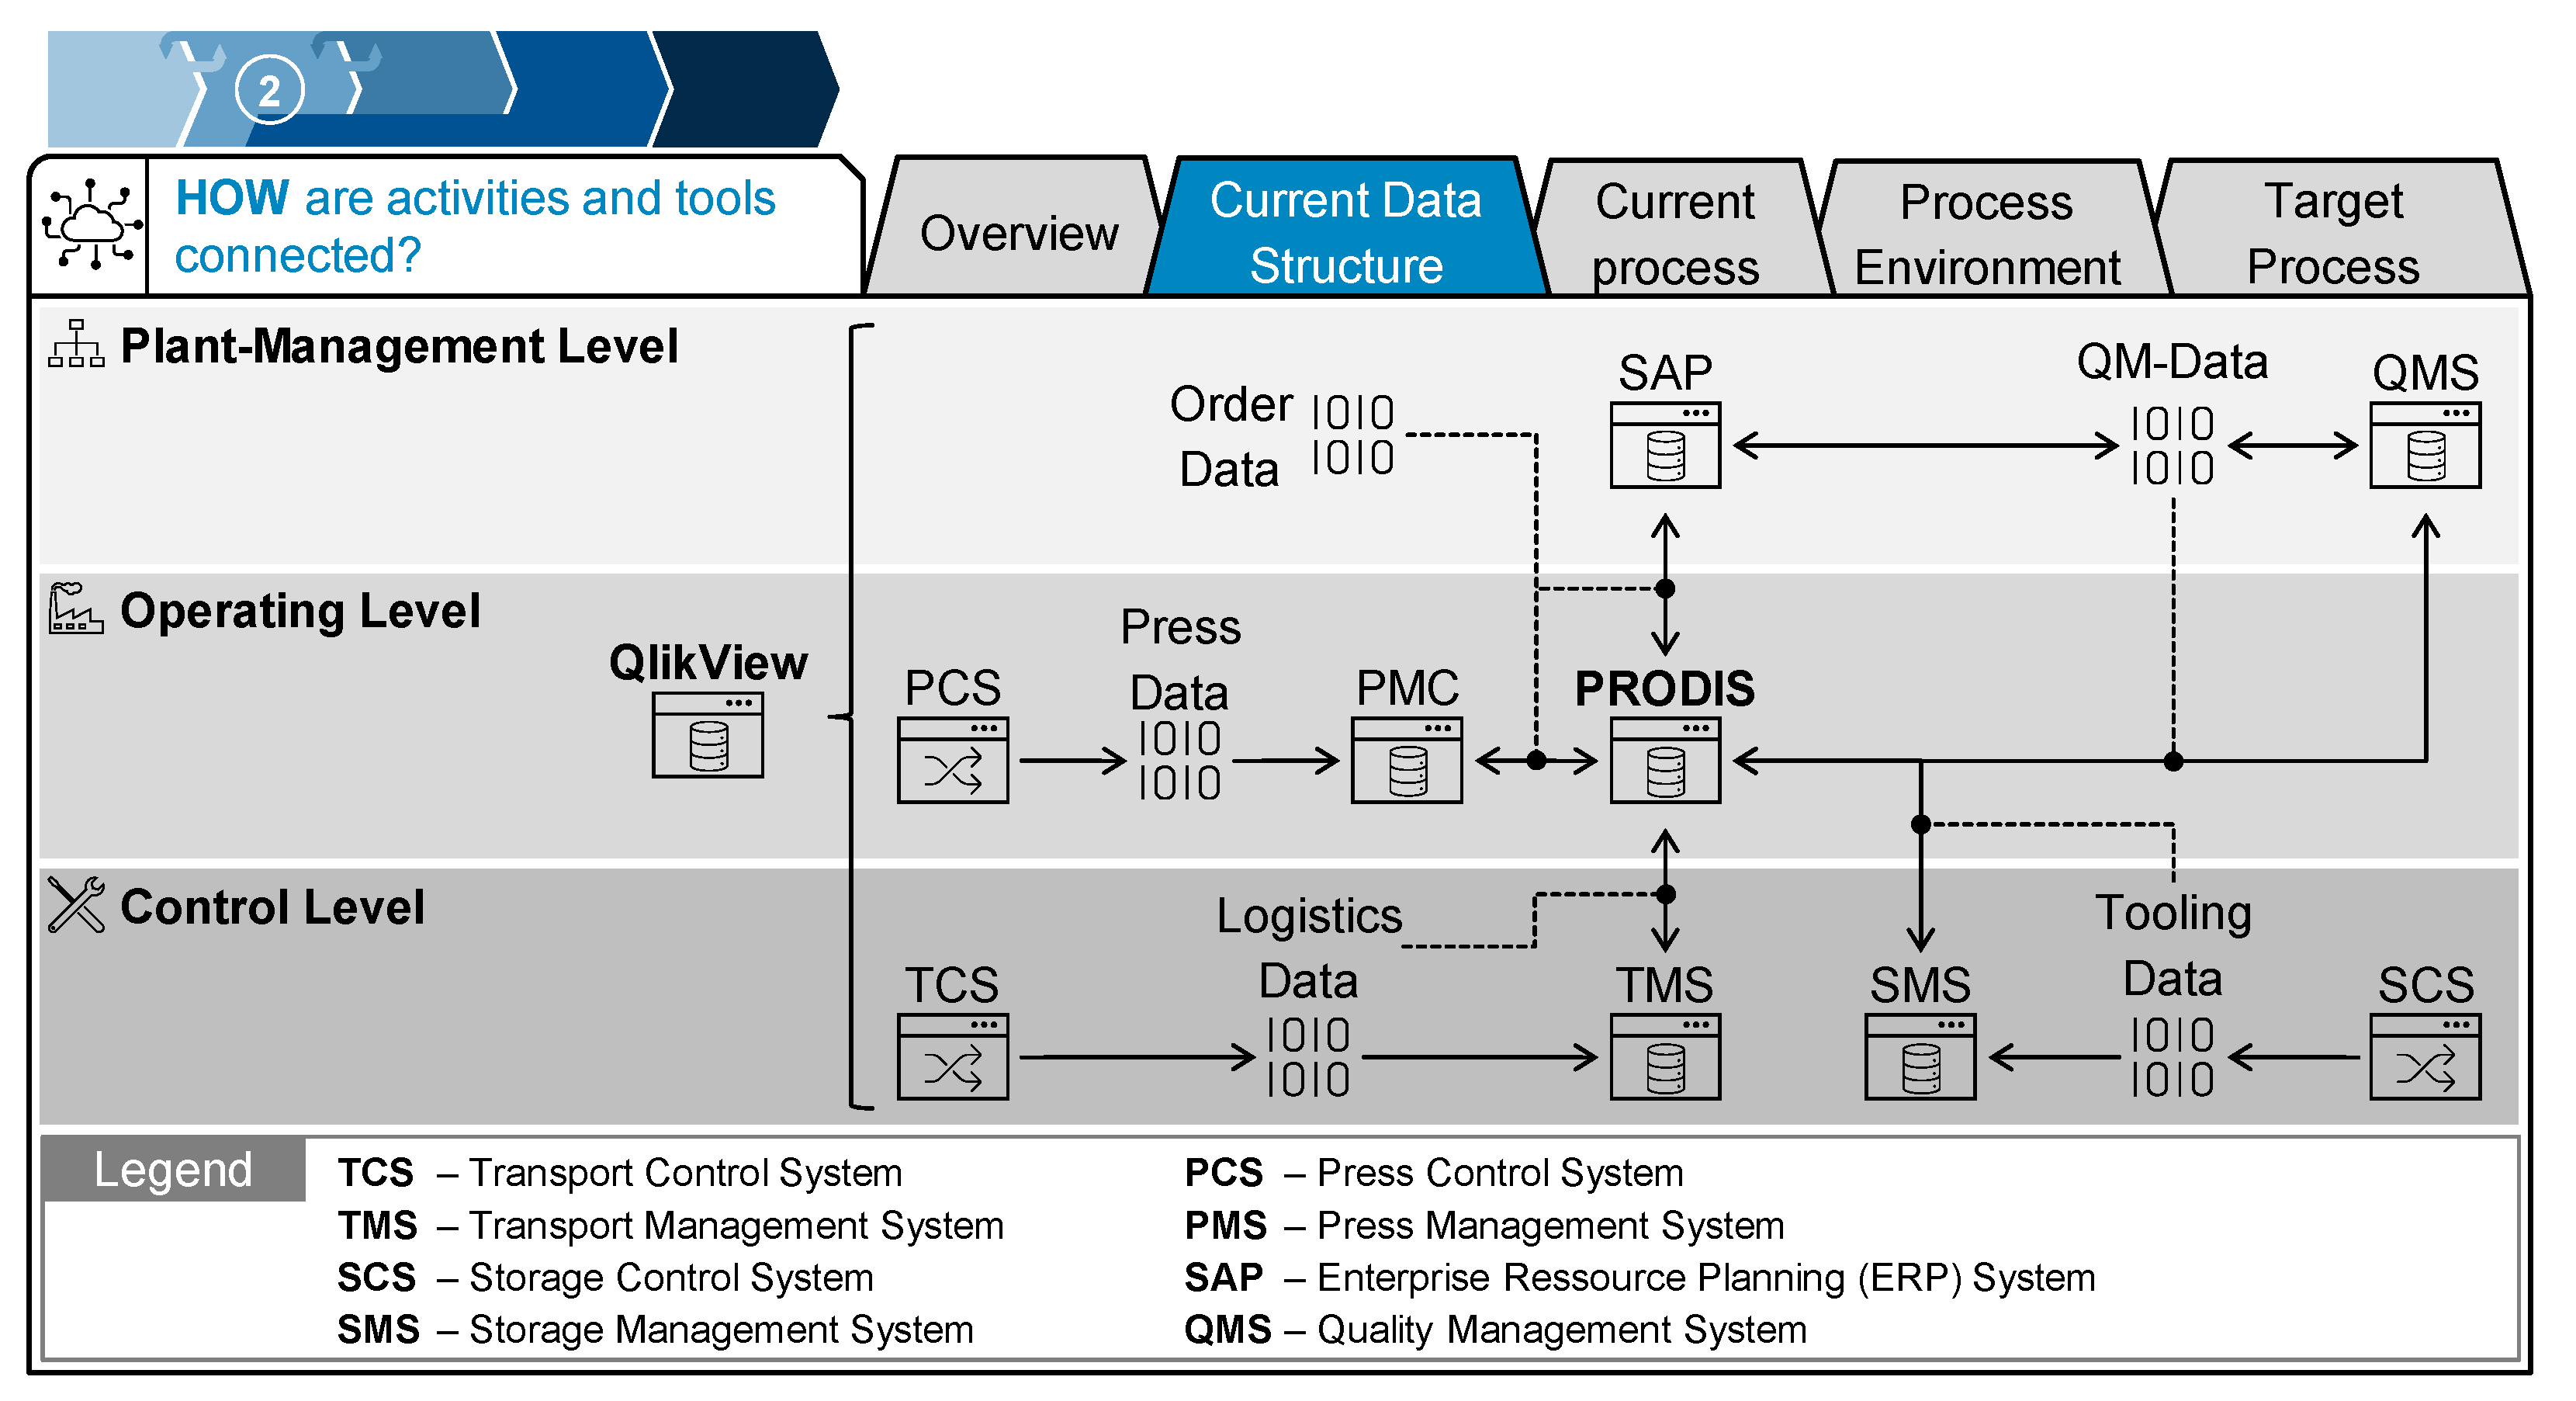
In Step 2 of the procedure model, the situation analysis, the current data structure and the current situation of the production process needed to be analyzed as a starting point. The analysis of the current data structure is necessary to identify the interface that can be connected with the developed DT solution (see Figure 7).
At the bottom, the control level is depicted with press control, control for the transport control system, and control of the die storage. These systems transmit press, logistics, and tooling data to the respective control station. The control level provides communication between the various control systems and enables a coordinated material flow in the technical process. The press management system (PMS), transport management system (TMS), and the management control system (SMS) forward the process data to the “PRODIS” software on the operating level, which is central to the data structure. It contains enterprise resource planning (ERP) data from SAP, quality-management data, tooling data, manufacturing data, and logistics data. This software is used for production flow and capacity planning in production. Subsequently, the relevant order and quality data are summarized at the plant management level and forwarded to the quality management system (QMS) and the corporate level.
In addition, a system for data visualization, “QlikView” is implemented. As all relevant data for this use case, namely ram pressure, cycle time, ram velocity, and logistics data, are sent to QlikView, this is the system identified as the data source for this use case.
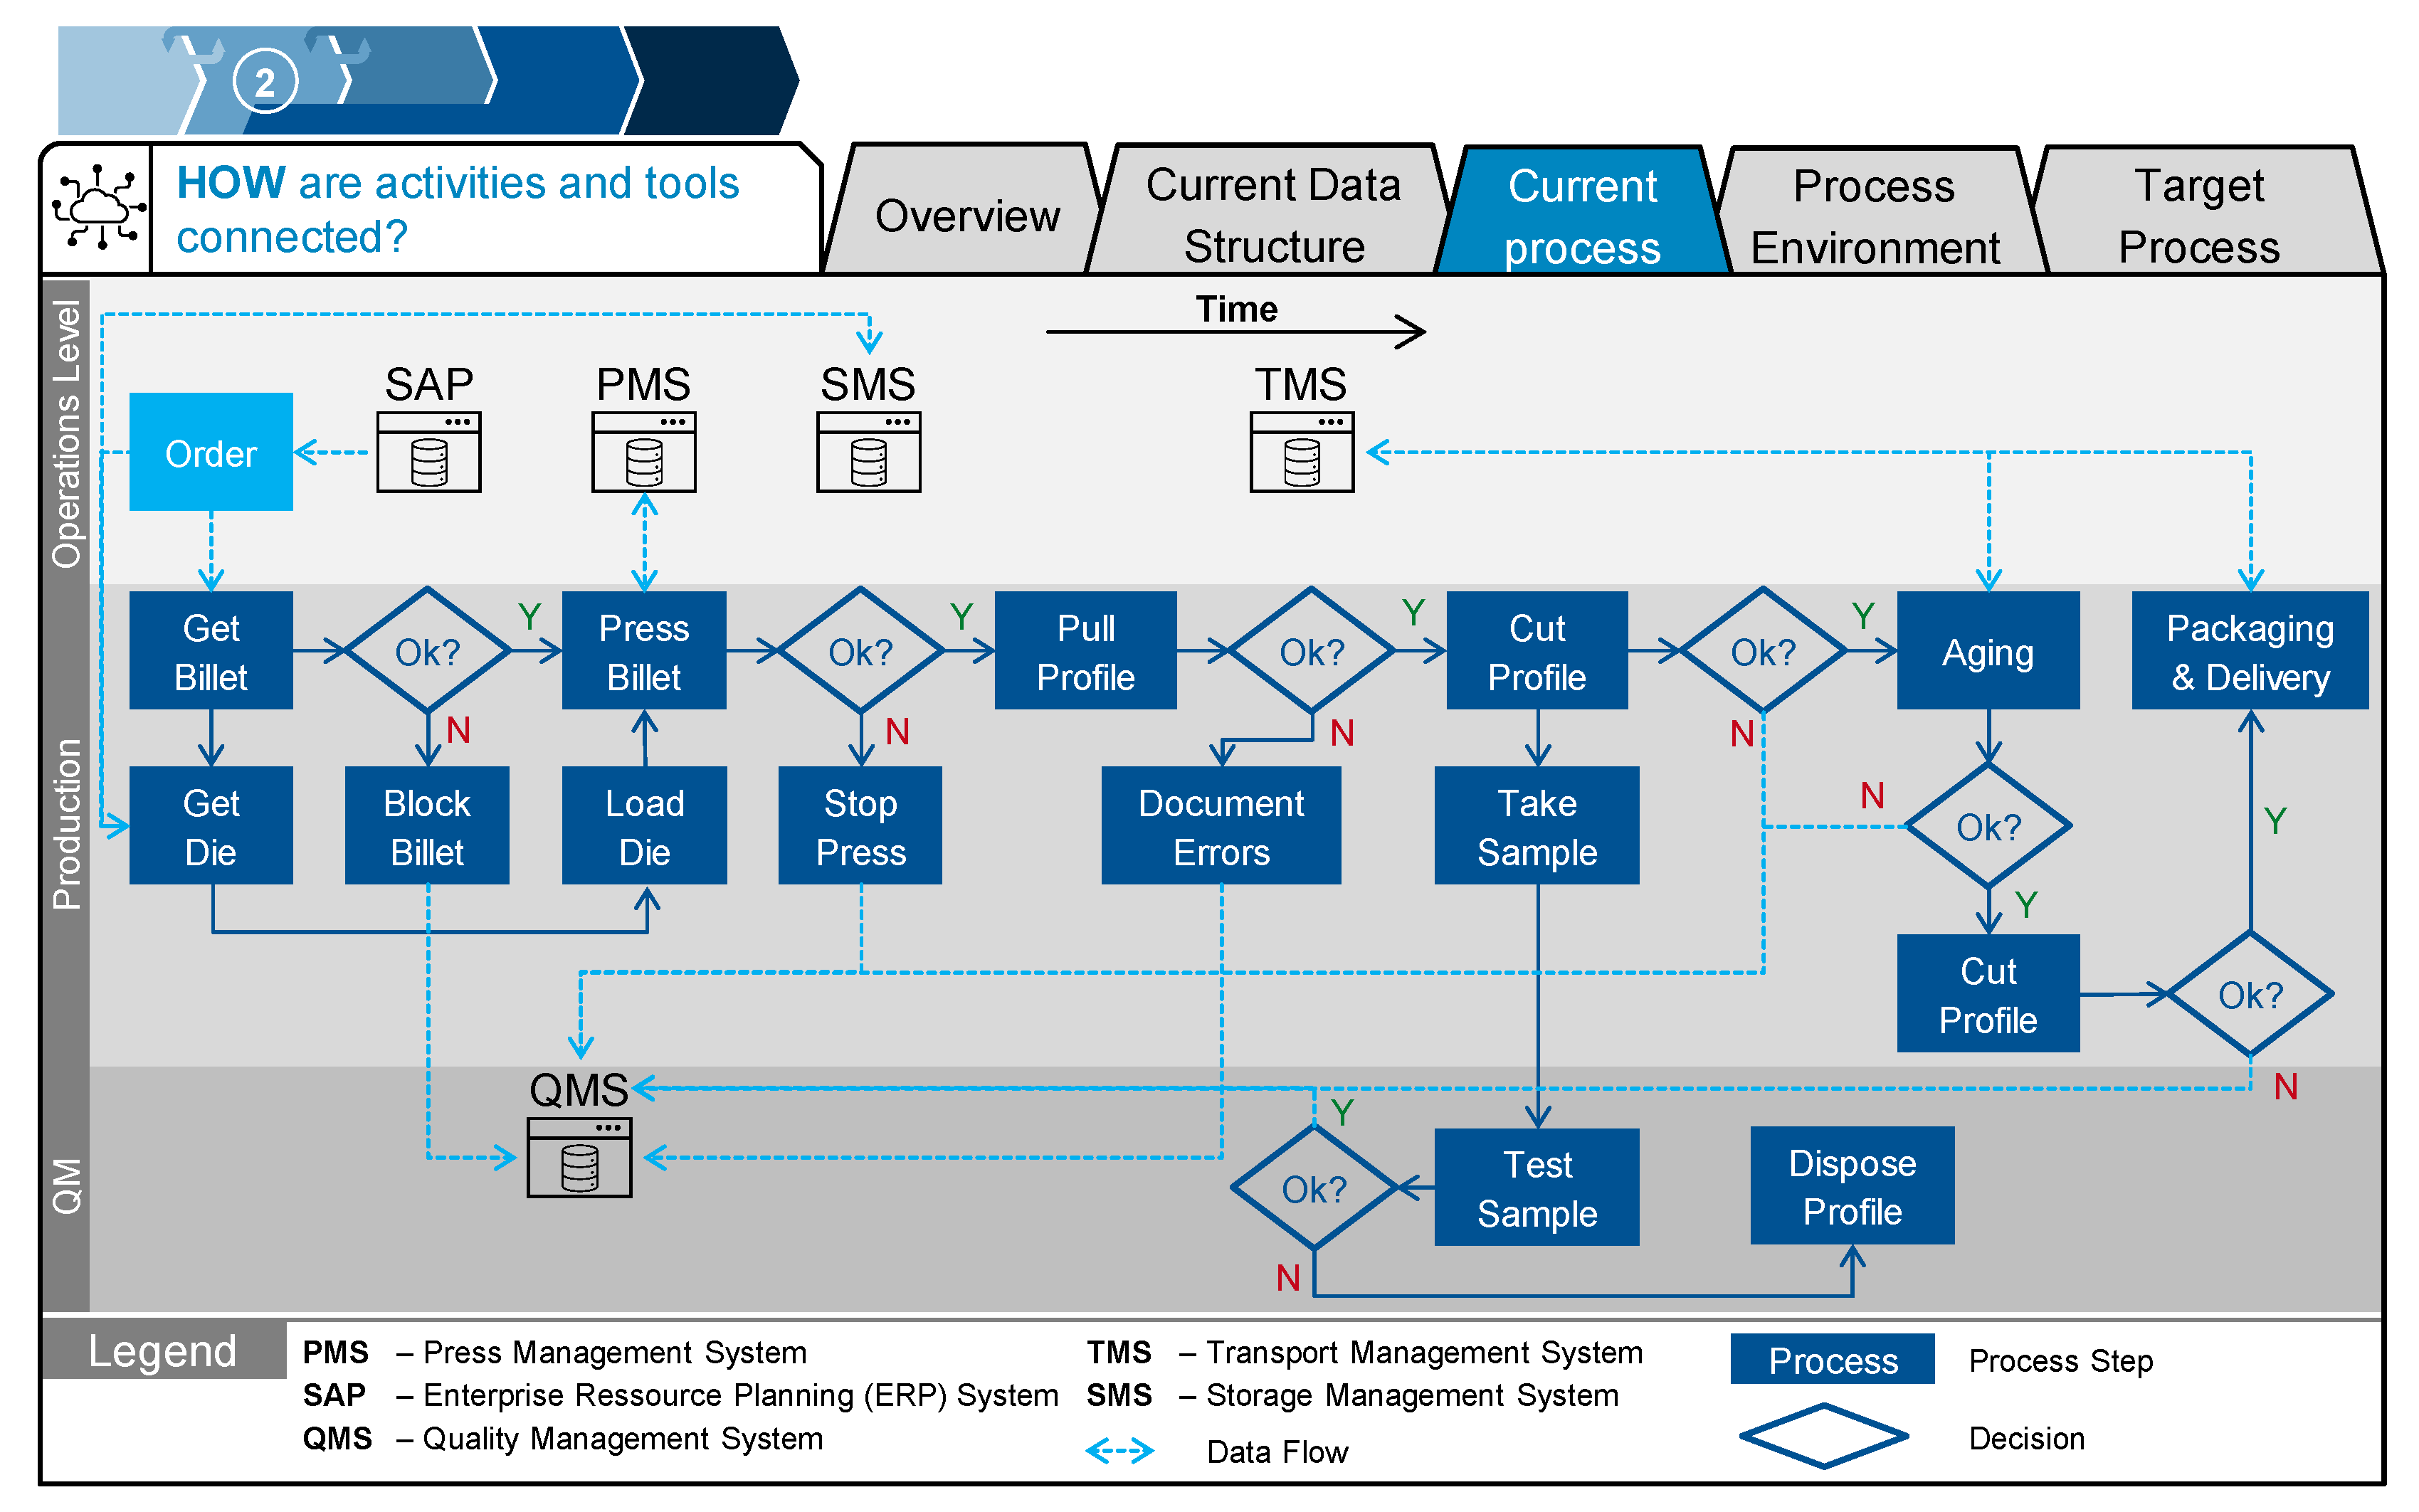
The structure of the current process is depicted in Figure 8. As described in Section 2.2, this case study is on improving a direct bar extrusion process. At HAI, first. a billet is taken from stock. After a first inspection, this billet and the die are transported to the press. Pressing entails preheating the material and the tool, as well as pushing the billet through the die and disposing of the remaining material of the billet. Next, the extruded material is stretched in order to avoid thermal displacements and to ensure dimensional accuracy. Subsequently, the ~50 m long profile is cut into ~3 m long pieces, which are transported to the aging oven. Here, small samples are taken for quality analysis. The samples can be traced back to the production order, but not to the billet or the final profile, which makes it hard to analyze correlations between process parameters and manufacturing errors. The processed profiles are then cut into the final, desired length, transferred to storage, packed, and delivered to the customer. It is important to cover the whole production process, not only the process step, where errors might occur (namely in pressing). There are two reasons for this. First, actions might need to be taken “outside” the process step to ensure the greatest process improvement. Second, it is necessary to analyze all steps in order to investigate the resulting changes that need to be taken for the following process steps and to quantitatively evaluate the success of the solution (see Section 3.3).
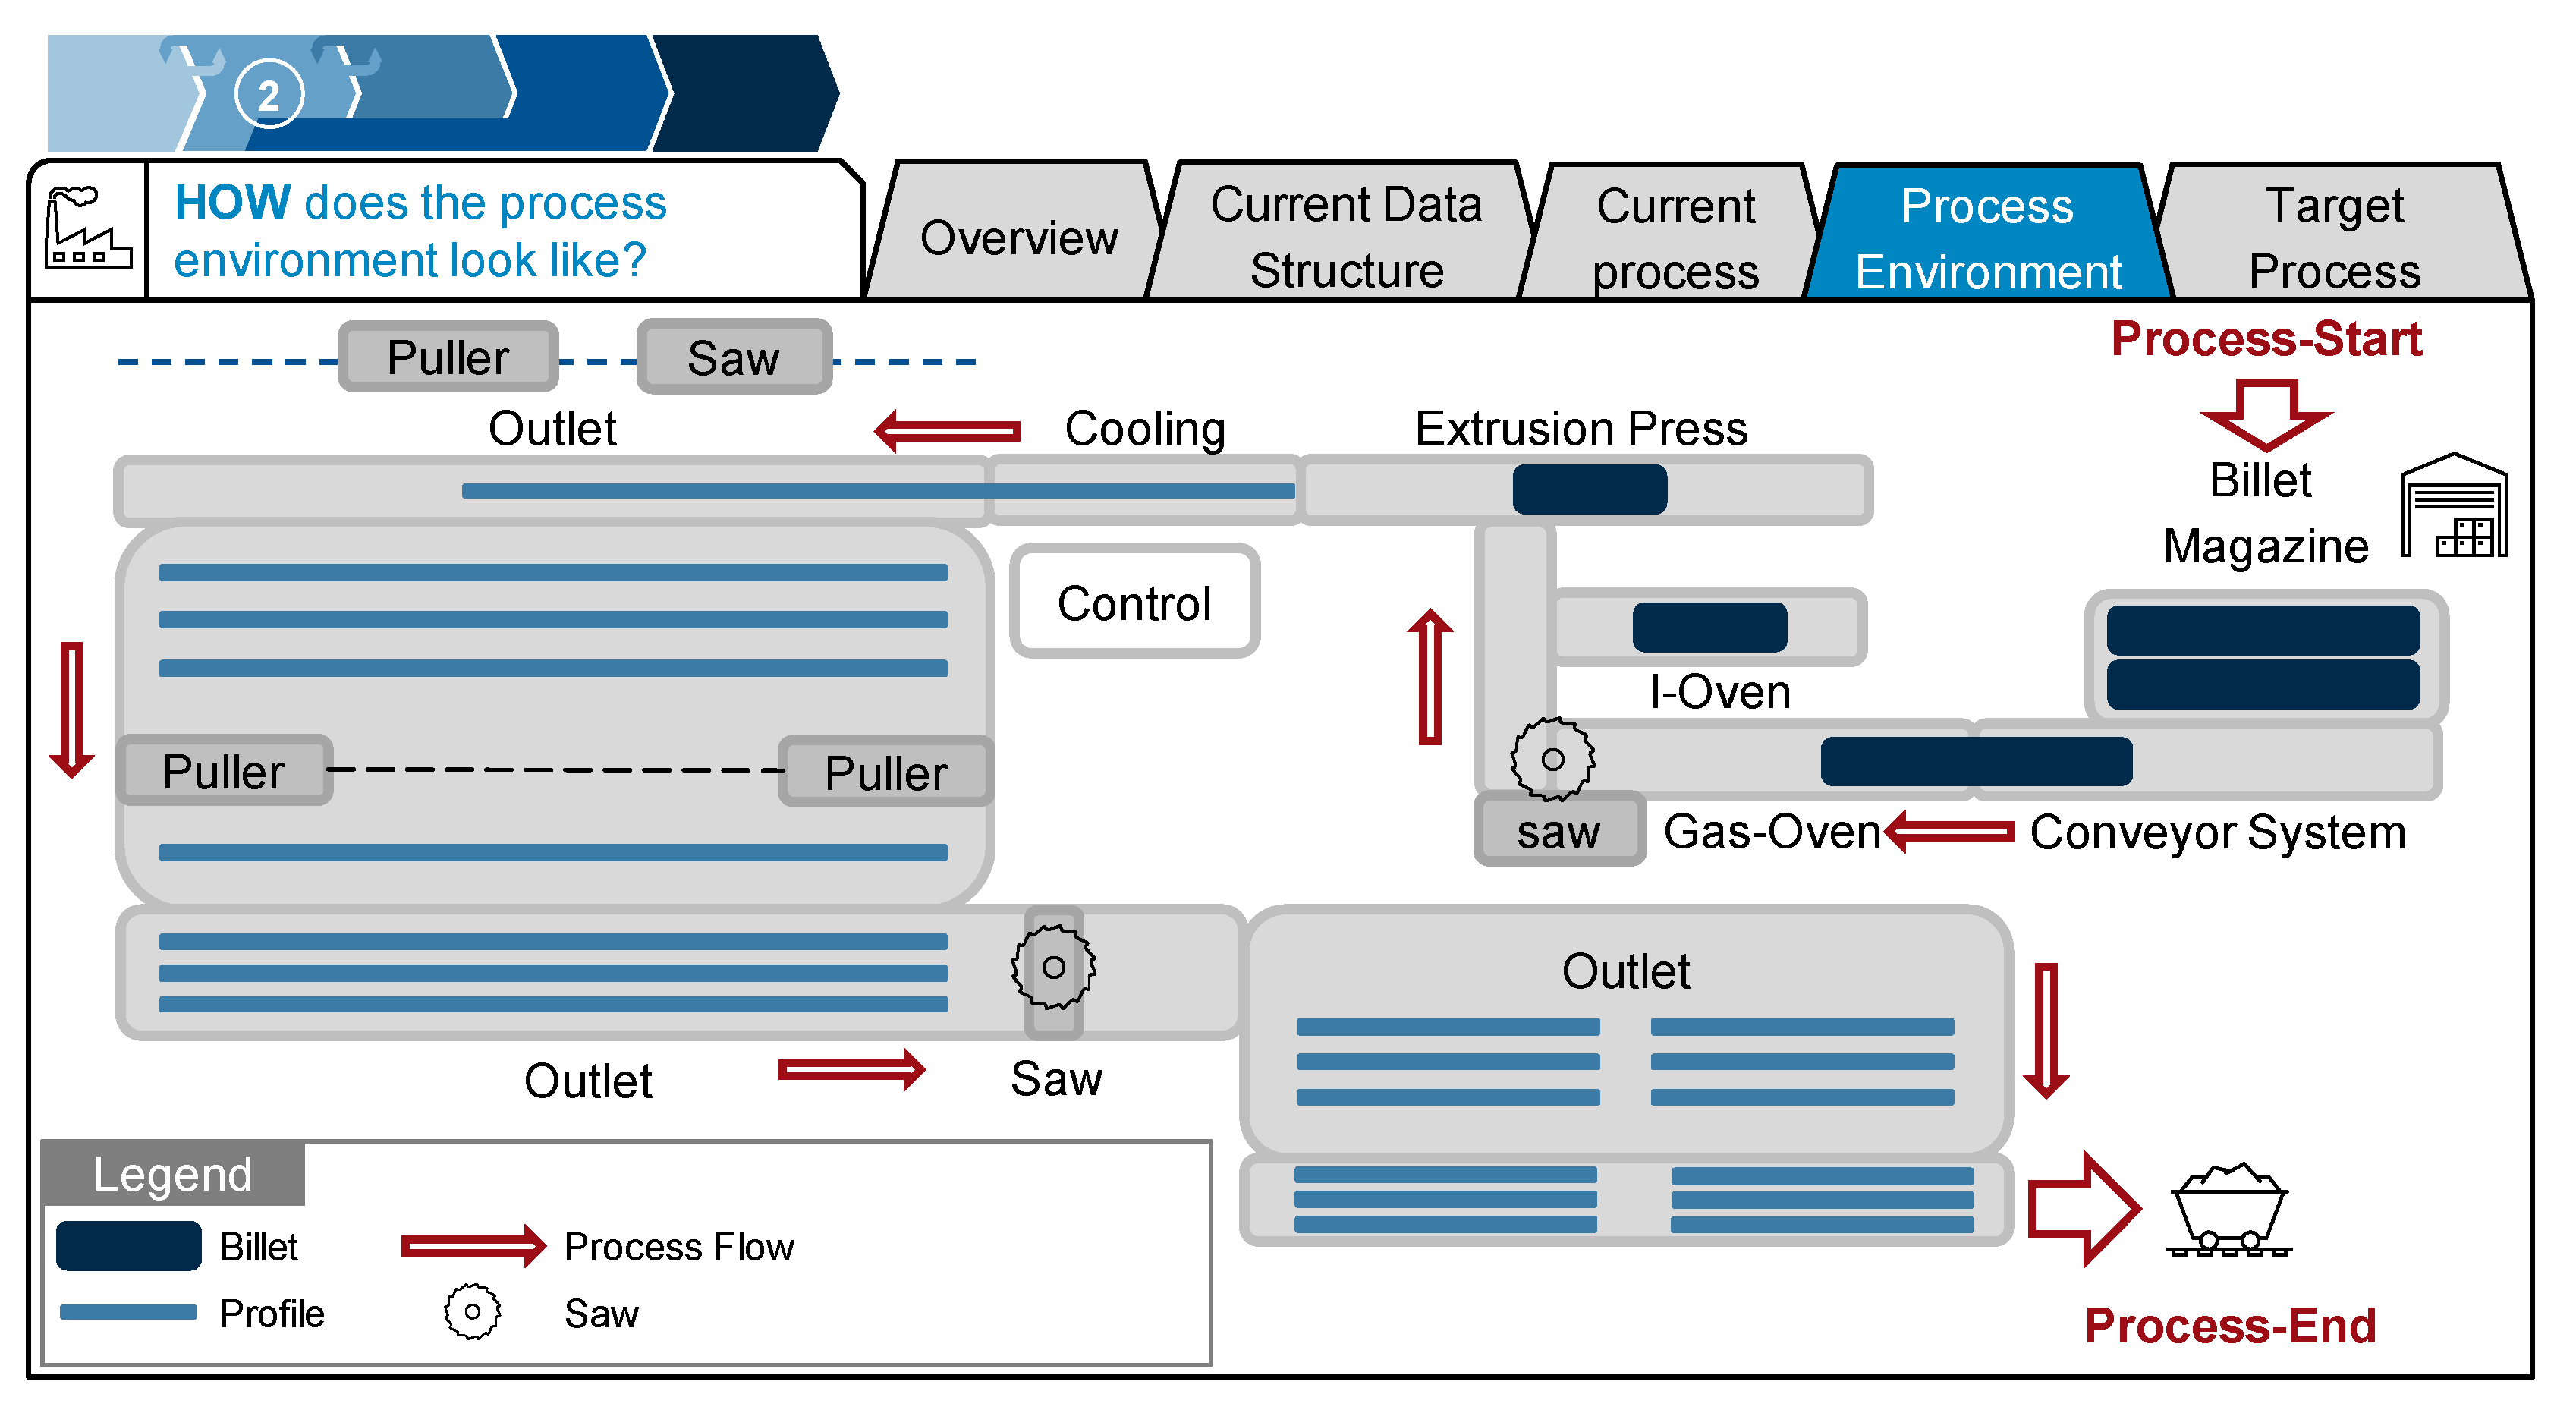
While analyzing the current process, the authors realized that just a flowchart is too generic to derive a target process. In the use case template of [17], an engineering twin was conceptualized, not a production twin. For an engineering twin, the current process was sufficient to identify the system’s structure. However, for a production use case, the physical layout of the process is important. Therefore, a section for documenting the “process environment” was added to the use case template. For this model of the physical layout, it was necessary to zoom in and focus just on the important areas of the process to keep it comprehensible. The respective process environment is shown in Figure 9. After the outlet and process end, the profiles are transported to the aging ovens, which is not depicted here, as only the first part of the process could be adapted.
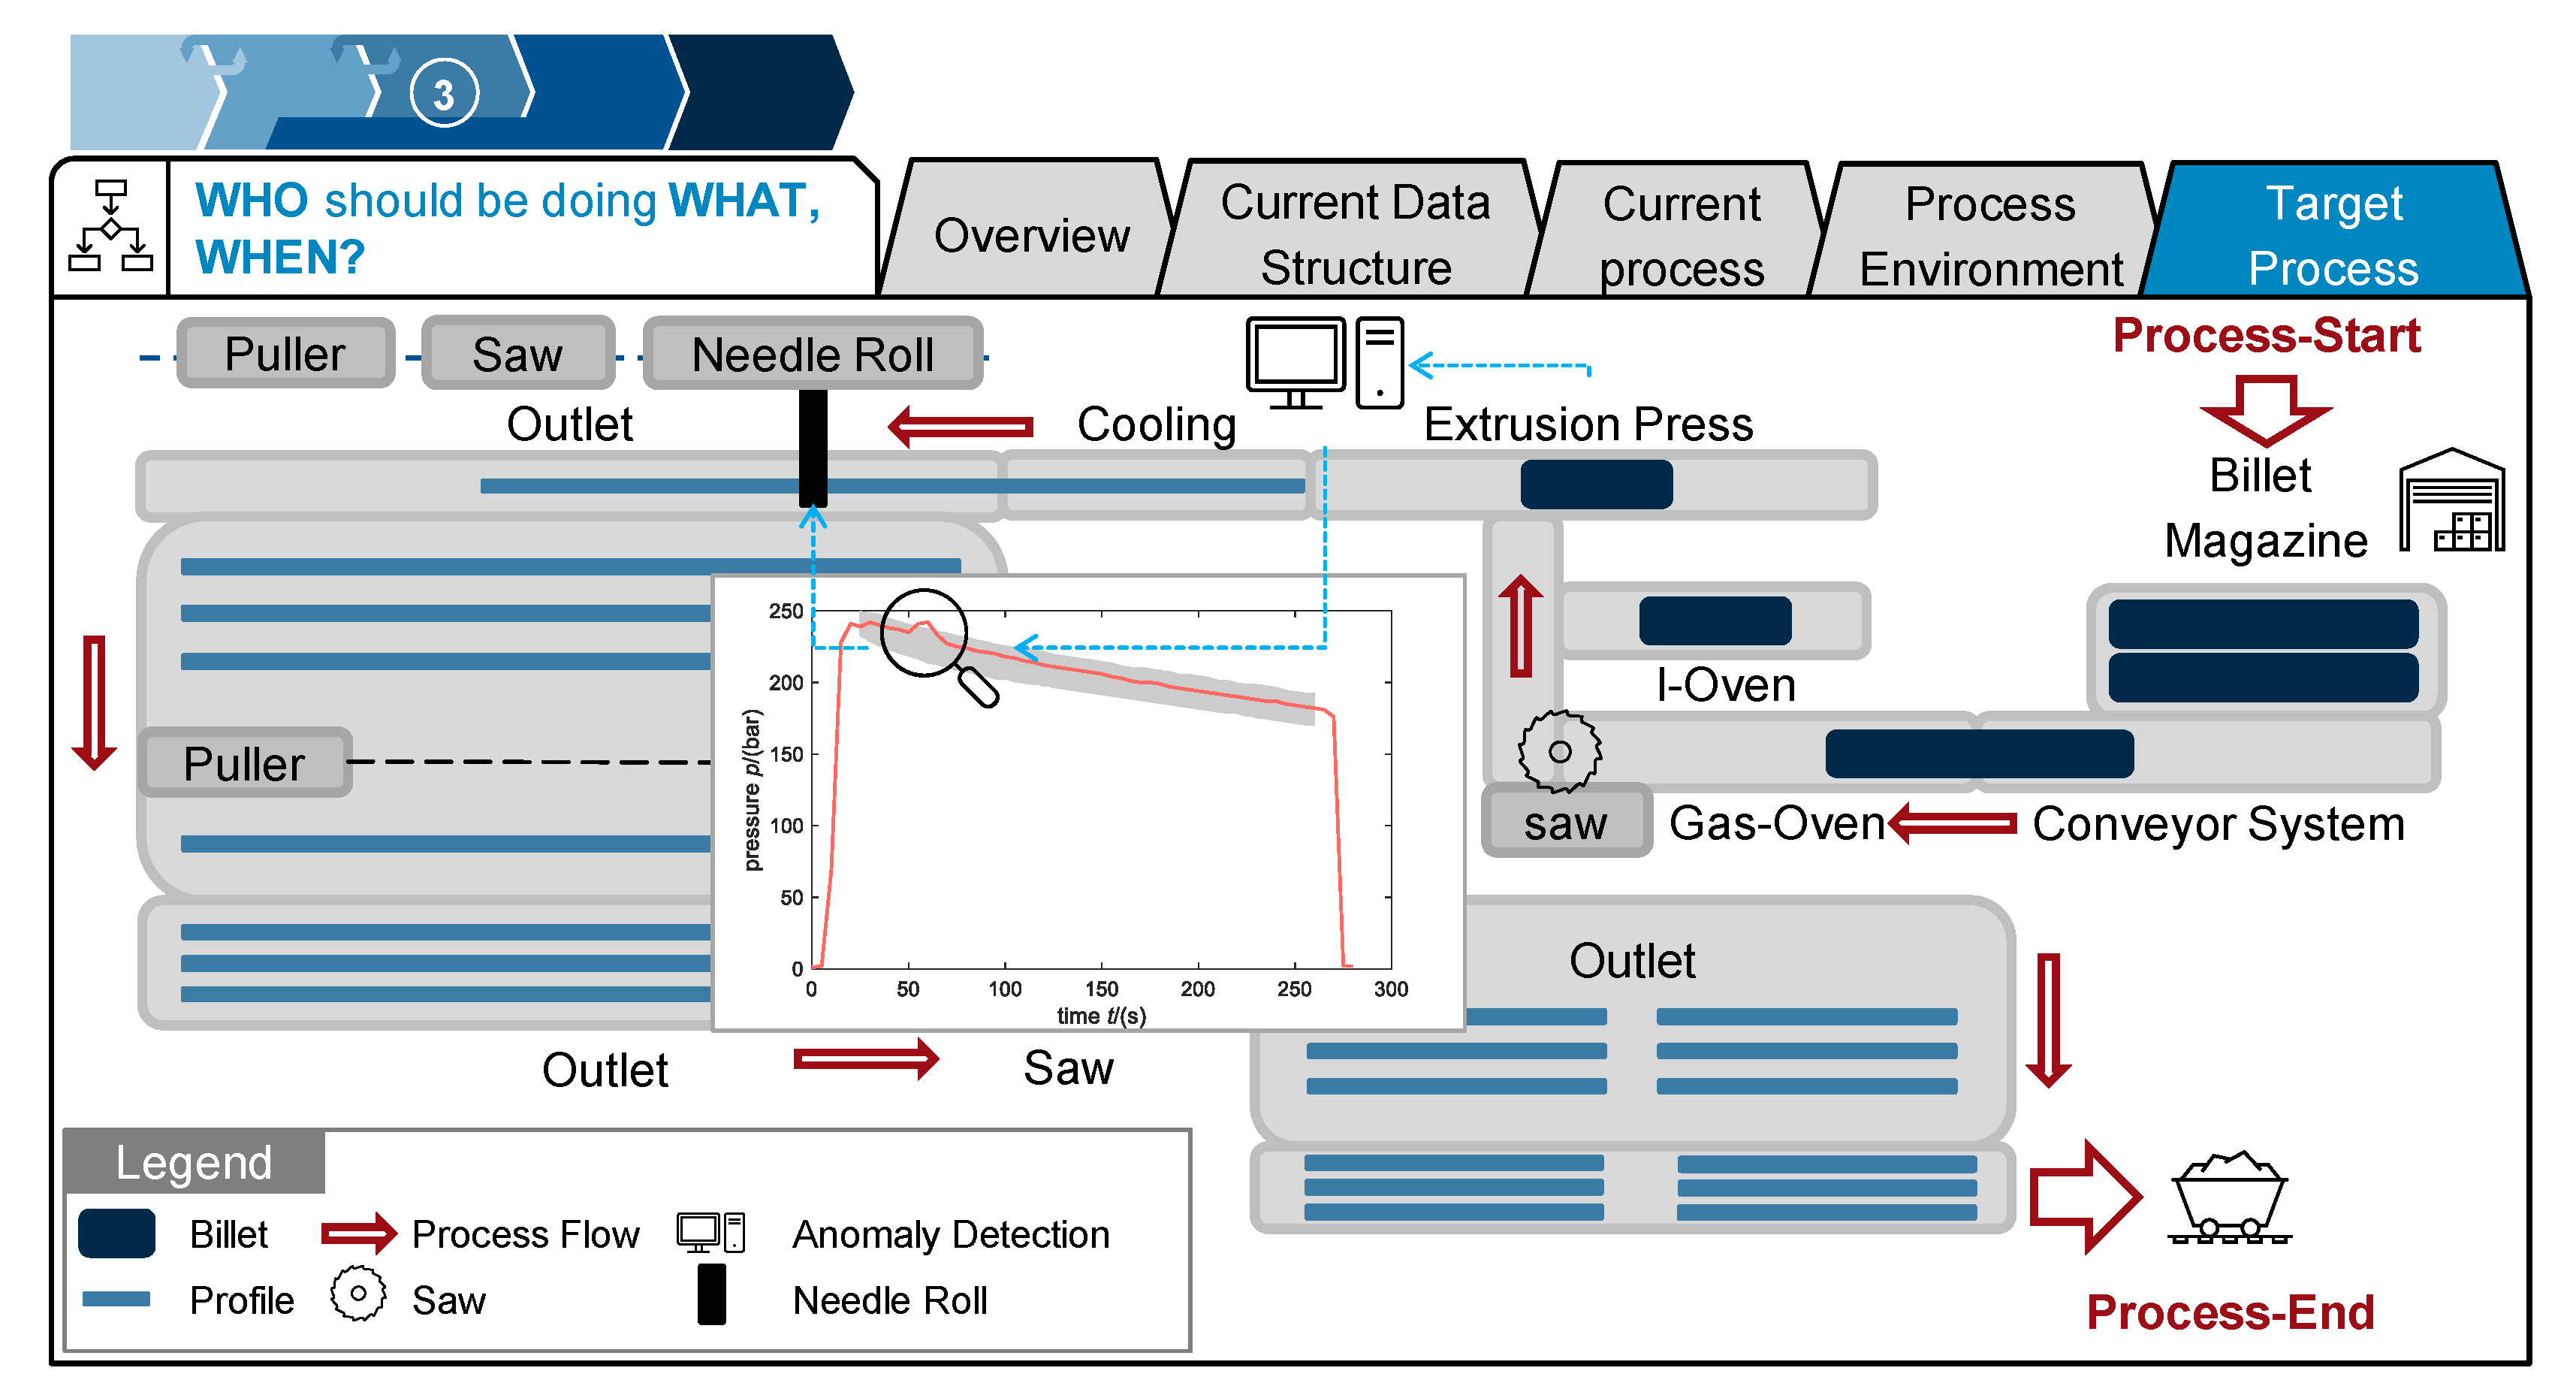
In the third step of the procedure model, the target process was developed. As described in the user stories of this use case, the case study partner wants to quantitatively evaluate product quality based on the pressure curve. In detecting anomalies in the curve, there should be the possibility of immediately reacting and removing the defective item. As the machine does not provide the possibility of spontaneously adapting the process parameters while pressing, it should be ensured that the defective product is discarded and recycled as early as possible and not sent to the customer. One simple idea to do so is to mark the profile as faulty, so it can be excluded from further process steps after sawing (see Figure 9). With the current plant layout, no other low-cost possibility could be identified to exclude the defective material earlier in the process. To mark the detected product, a needle roll can be applied. Such a needle roll is already placed in some production sites, but only actuated manually. The resulting target process is depicted in Figure 10. Consequently, once an anomaly is detected using machine learning algorithms, the needle roll will be activated to mark the defective profile. At the outlet, marked material will then be separated from the proper products and recycled in the billet casting. Therefore, costs for subsequent manufacturing steps are avoided, and the overall quality of the batch delivered to the customer will increase. In the following, the anomaly detection process and algorithm will be described in more detail.
Through application of the presented use case template, the project was structured, and all boundary conditions and requirements, as well as a clear goal, were defined. With this use case template, the case study partner was guided through the first three steps of the DT procedure model presented in Section 2.3. An anomaly detection algorithm to identify faulty press curves was developed and applied as described in Section 3.2.
3.2. Application of Anomaly Detection Algorithm
In order to apply the proposed anomaly detection algorithm, the data must be prepared beforehand. First, the good and anomalous data are collected by an employee of HAI and divided into training, validation, and test sets. In total, 604 good and 59 anomalous pressure lines are collected. Table 1 lists how the data are split into subsets. As the lines of the data set were collected by an employee of HAI, the decision of whether a chosen line is anomalous or not is dependent on the employee’s opinion.
As explained in Section 2.4, the Gaussian process is generated by the sample mean vector and the sample covariance matrix. As the mean and the covariance matrix can only be computed with test data on an equal time domain, the data are manipulated in order to establish the probability density function.
Three approaches referred to as manipulation schemes are considered to guarantee the same size:
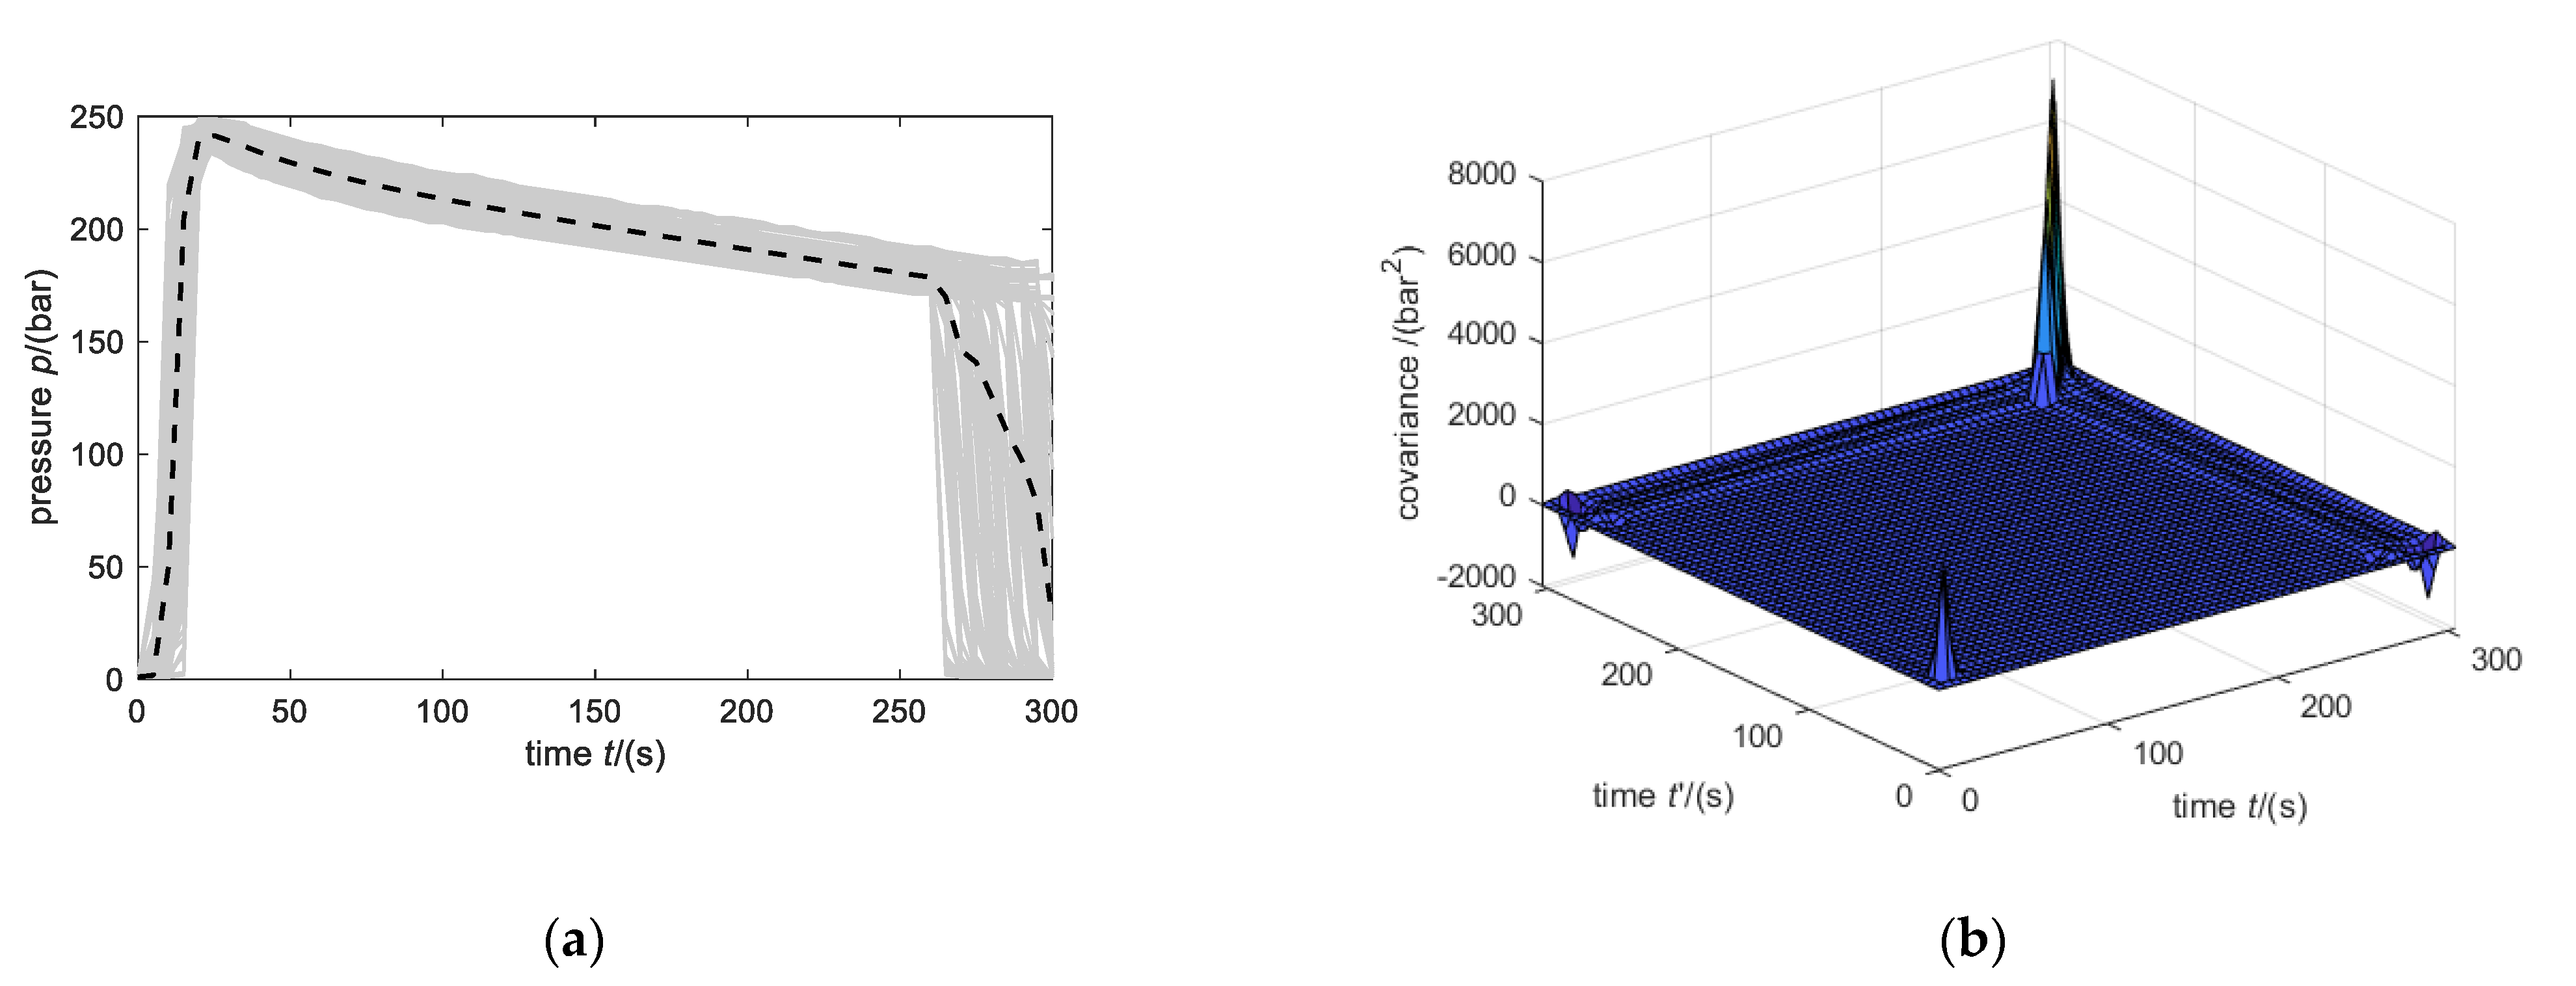
- The pressure lines are not manipulated, and missing data of incomplete vectors are ignored for computing the mean and variance (Figure 11a).
- The first values smaller than 5 bar and values after 260 s are erased. Additionally, missing data of incomplete vectors are ignored for computing the mean and variance (Figure 11c).
- Values before 25 s and after 260 s are erased (Figure 11e).
Figure 11 shows the manipulated training set of the pressure lines (gray lines), the approximated mean (dashed black lines), and the computed covariance matrices (surface plots). The peaks of the covariance matrices in Figure 11b,d result from the large variances at the beginning and towards the end of the lines. It must be noted that the pressure lines in these areas do not exhibit a Gaussian behavior. This might lead to weak anomaly detection, as the assumptions do not hold. In order to have a proper Gaussian process that can be evaluated at any time t, the covariance function is approximated by a linear interpolation scheme of the sample covariance matrix. To ensure that the resulting covariance matrix is always positive definite, the main diagonal is decreased by the smallest eigenvalue if it is negative.
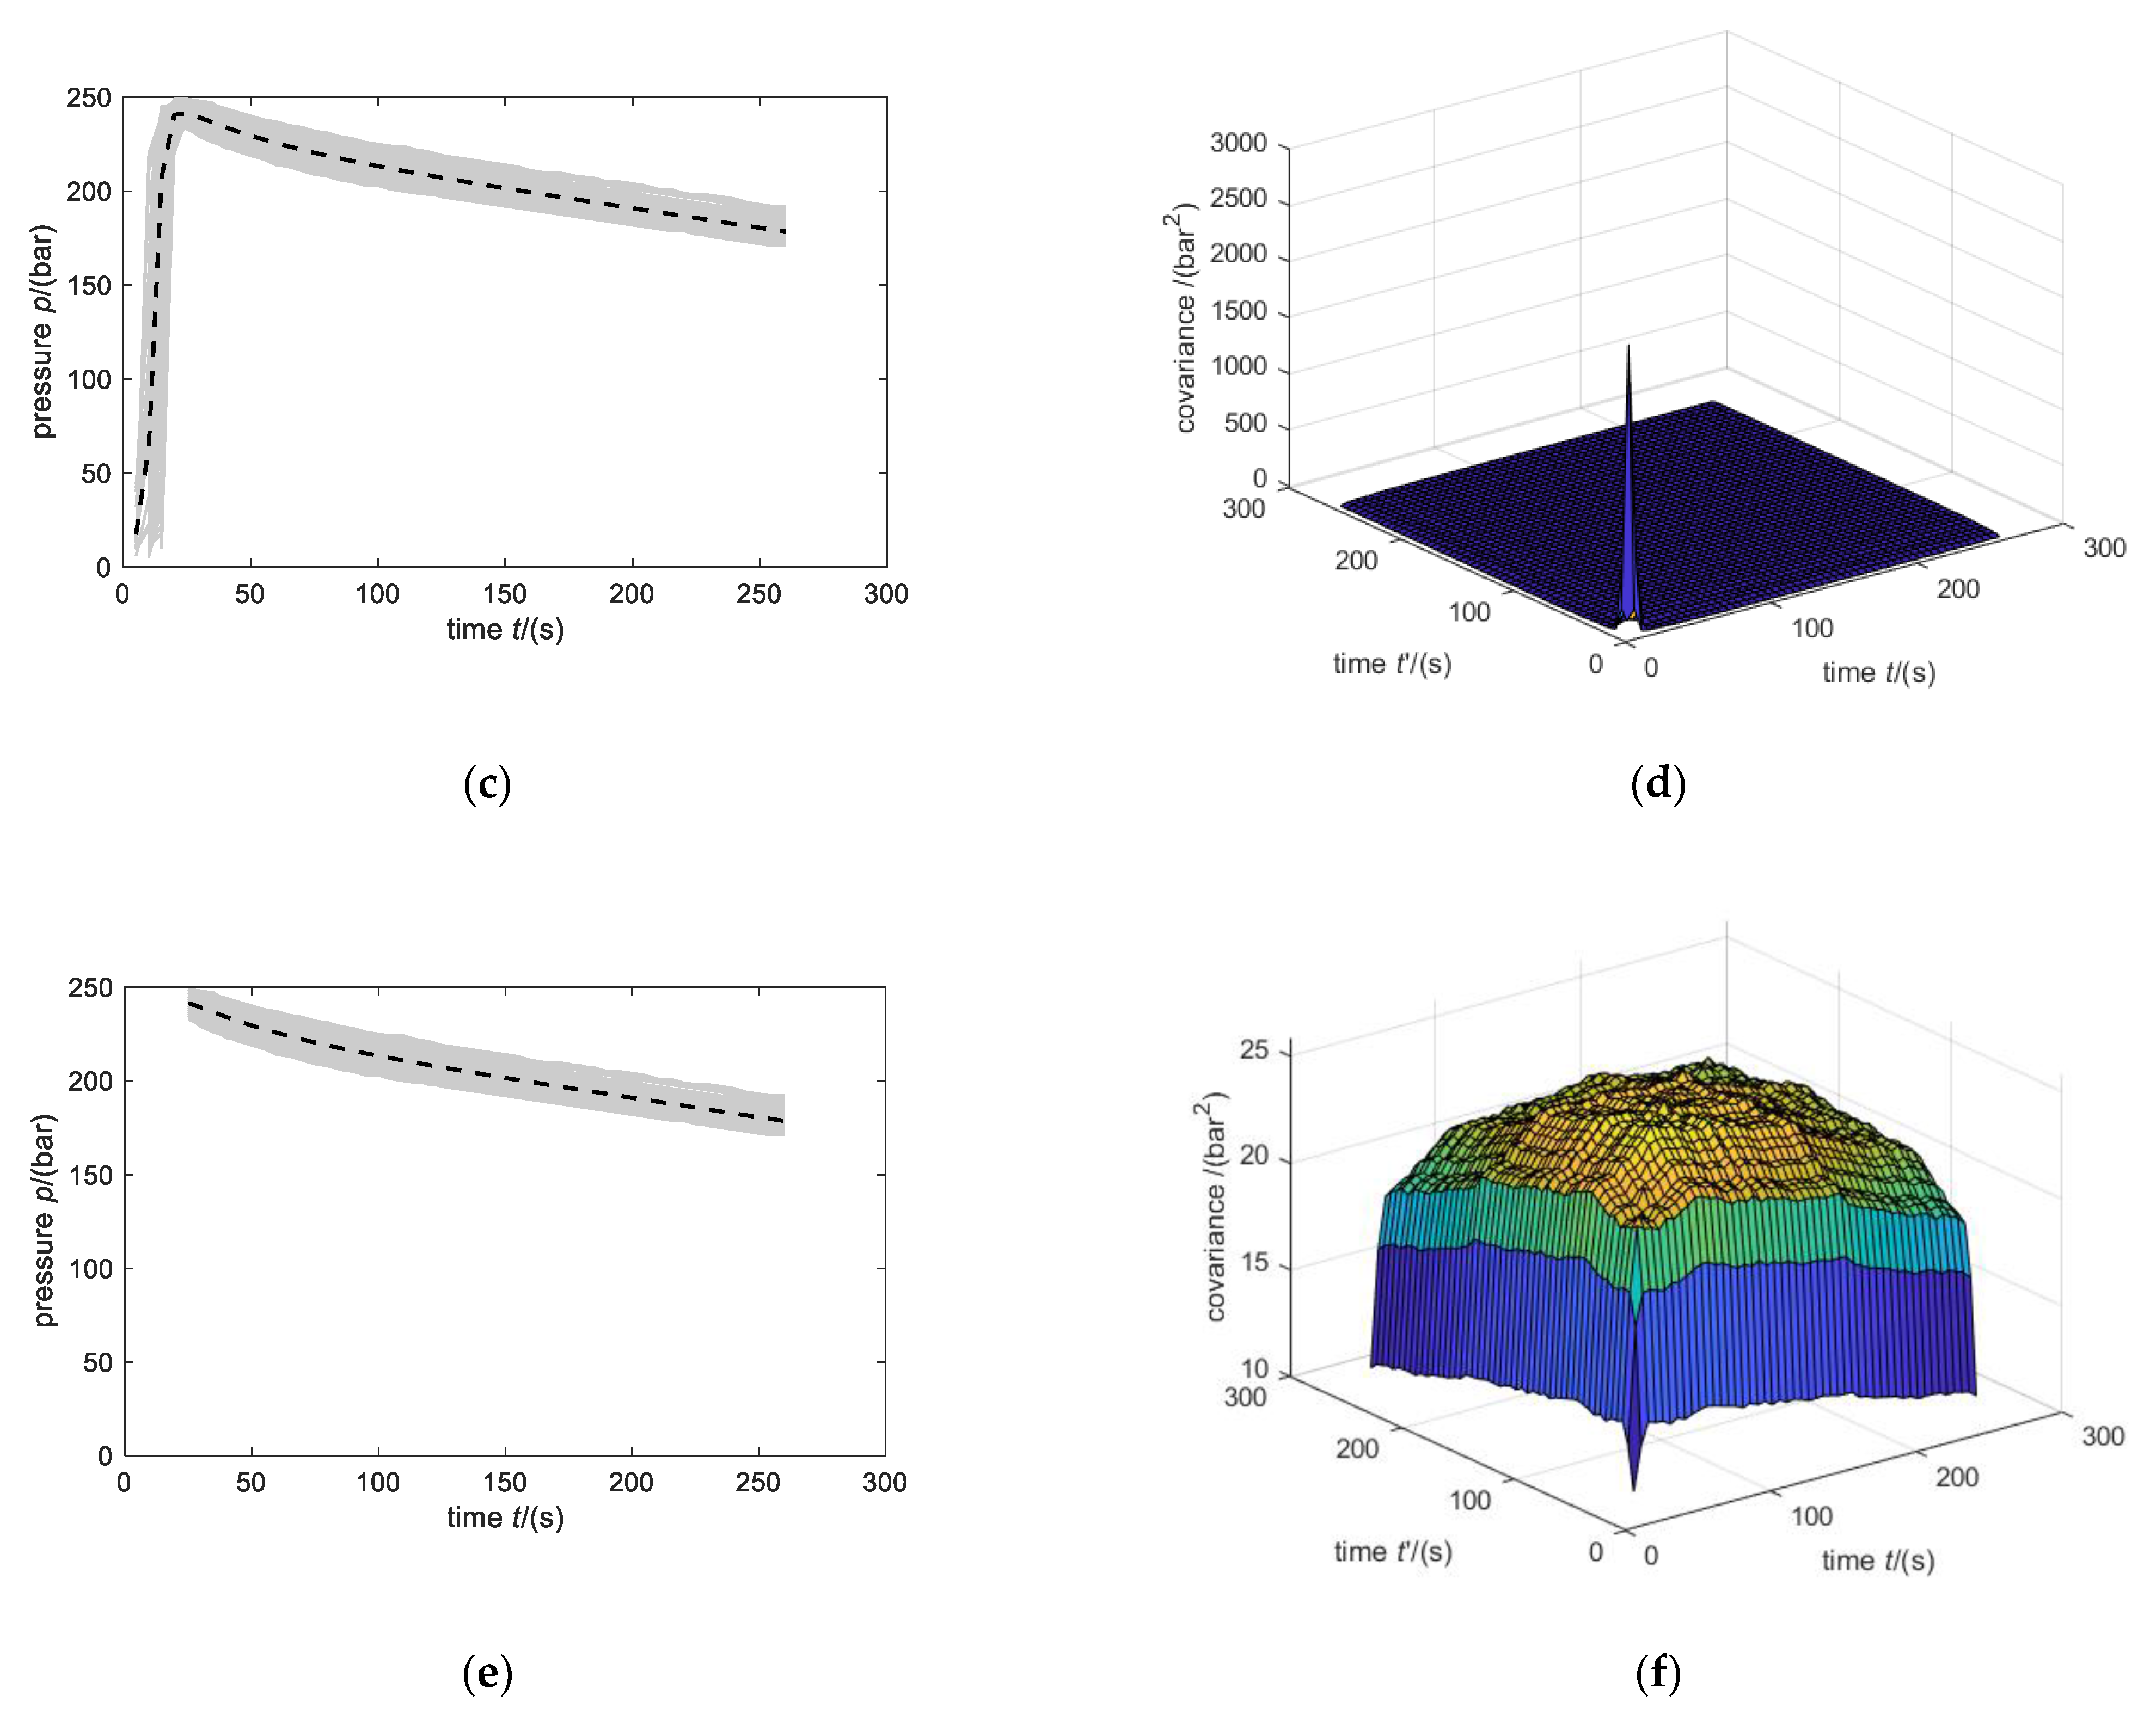
Another approach to ensure a positive definite covariance matrix is presented in [39], where the authors used a linear combination of basis functions. In this paper, we used a polynomial of degree 5 for manipulation Scheme 3 in order to approximate the covariance function. The resulting covariance function is compared with the computed sample covariance matrix in Figure 12. The approximated covariance function matches the computed sample covariance matrix and should therefore lead to similar anomaly detection performance. When this approach is used, the resulting covariance matrix is always positive definite. Therefore, the covariance matrix does not have to be warped as is the case for the approach based on interpolating the covariance matrix.
In addition to the Gaussian process model, the maximum value of the pressure line is reviewed. If this value exceeds 250 bar, an alarm is set in order to indicate that the die might be overloaded. Furthermore, it must be mentioned that due to the data manipulations schemes shown in Figure 11, not all anomalies can be detected. For example, if an anomalous behavior arises after 260 s, this anomaly cannot be detected in Scheme 2 or Scheme 3. However, this will be considered in the test phase.
After the mean and covariance function are trained on the validation set, the likelihood threshold is set. As the user wants to avoid false alarms, the threshold is set accordingly. Figure 13 shows the likelihoods of the validation set and the chosen threshold for manipulation Scheme 3 with the interpolated covariance matrix.
In order to find the best data manipulation scheme, all schemes are applied to the data sets, and the TPR, FNR, TNR, and FPR are evaluated based on the test set. First, all data are manipulated based on a certain manipulation scheme. Second, the mean vector and the covariance matrix are computed from the training set. After the likelihood threshold based on the validation set is computed, the performance measures can be evaluated. The results are shown in Table 2. It can be observed that the manipulation Scheme 3 with the interpolated covariance matrix (Figure 11e,f) is the best model with a 0% FPR and 97.8% TPR.
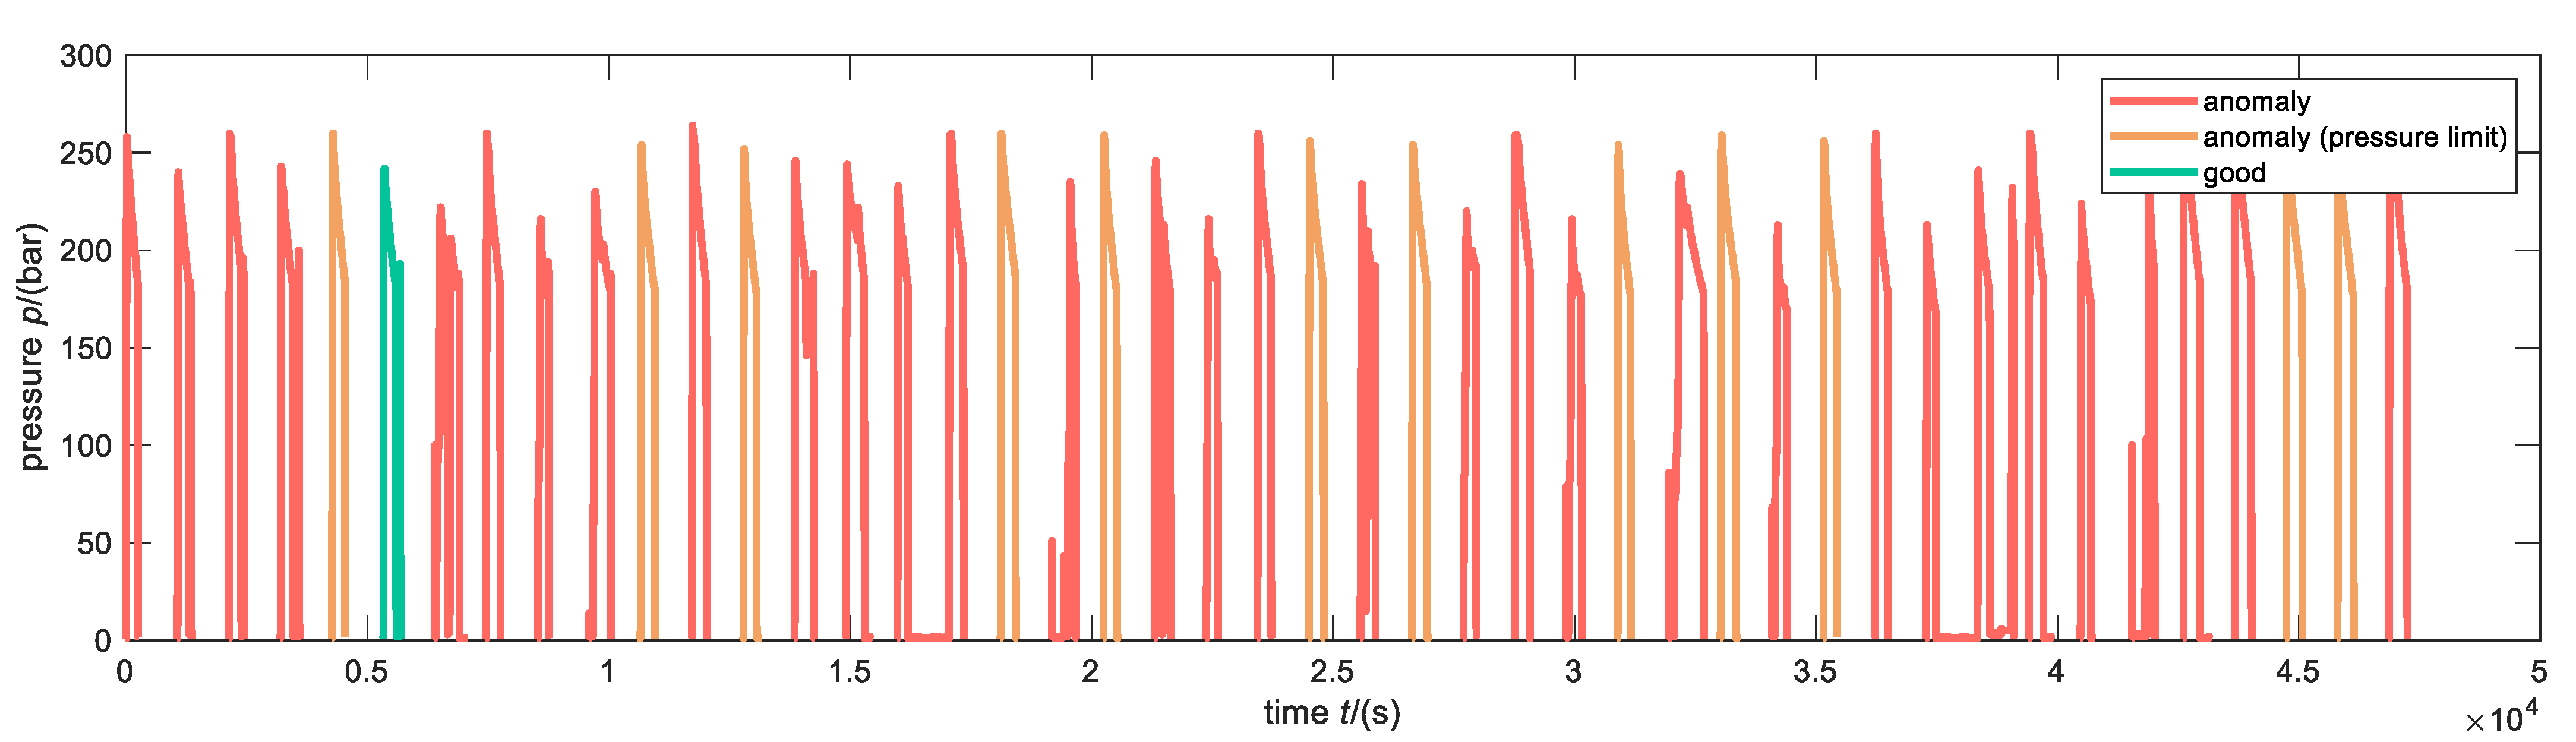
With the established anomaly detection model, a traffic light scheme is implemented in the company. Red means that the extrusion process is anomalous, orange indicates that the maximum pressure exceeds the limit and might damage the die, and green stands for a good extrusion process. Figure 14 shows the anomalous lines of the test set where the colors indicate the classification made by the model. Compared to the initial retrospective procedure this is a big help as the employees of HAI directly get a notification if something went wrong. They do not have to review all lines retrospectively. Moreover, anomalous billets can be directly discarded, and following manufacturing steps can be skipped.
3.3. Evaluation of the Success of the Developed Solution
After development of the detection algorithm, a success evaluation was conducted to assess the value proposition of the use case described in Figure 6. As described previously, a defective product is removed from the production process and recycled once an error is detected. Thus, the company can improve production efficiency in three aspects: costs will be reduced, energy will be saved, and the overall production quality will be improved. This is done by avoiding unnecessary process steps for defective products.
To quantify the potential cost savings, first, the step at which the profile will be removed must be identified. With the industry partner, two scenarios were derived: a “realistic” and an “idealistic” scenario. In the former scenario, the faulty profiles are sorted out before the last process step, packaging (see Figure 8). This scenario can be implemented right away, without adapting the current overall production process. In an idealistic setup, the detected products can be removed from the production line before entering artificial aging, i.e., at the process end depicted in Figure 9. Therefore, in comparison to the other scenario, cost savings for aging and sawing can also be considered for the success evaluation.
Table 3 presents the result of the cost accounting. For calculating the potential cost reductions for the scenarios, two categories of costs were considered: machine hour rate (MHR) and personnel expenses (PE). MHR entails the costs of energy, buildings, and maintenance. In the current system, only billets are tracked with unambiguous IDs. Thus, the costs per billet (EUR/B) were considered. This is also in line with the current implementation of the use case, as with the previously described approach, only complete billets can be removed from production after pressing, not only pieces of them. In the idealistic scenario, a small fraction of the pressing costs can already be reduced, as the profiles do not need to be transported to intermediate storage. In intermediate storage, costs can be reduced as less material needs to be transported, and the storage capacity would not be wasted. If the faulty products are removed before artificial aging, the oven would be used more efficiently, and thus the MHR would be lowered. In this calculation, it was assumed that resulting capacities in the oven could always be filled by other profiles. The last process step, packaging, includes both the material needed and personnel expenses. Thus, this is a relatively costly process step. The potential cost reductions refer to one specific type of profiles produced in 2020. Over this year, 822 billets were processed, 44 of which showed undetected production errors. Therefore, with the developed DT use case, 1051.16 EUR/a could have been saved in the realistic scenario for this one profile type. In the idealistic, 1549.24 EUR/a could have been saved. The use case could be applied to 52 further profiles without major changes, which leads to annual reductions of up to 80,560.48 EUR/a. In addition, in 2020, costs of >100,000 EUR resulted from customer claims. Detecting faulty products during production could avoid some of these claims.
The other two dimensions of efficiency, energy and quality, could only be described qualitatively, as not enough data are currently collected at the industrial partner. However, it is reasonable to assume an improvement. MHR already includes costs of energy for each process step. As energy consumption and energy costs are directly correlated, it can be stated that energy will be saved by removing faulty parts early in the production process. Overall production quality will be improved, as fewer defective products will be delivered to the customer. Of course, significant damage to the product is already recognized, leading to the removal of the part. However, smaller defects are not fully detected, leading to high claim costs. By applying the proposed DT module, it will be possible to detect and eliminate those products before delivery to the customer.
4. Discussion
Performance of the use case template and procedure model. In this paper, the application of a DT module containing anomaly detection for direct aluminum extrusion was presented. As a guide through the conception of the module, the DT procedure model and the use case template (described in Section 2.3) were applied. The use case template proved to be helpful in guiding an engineer from a vague idea to a clear description of a target process with a valid value proposition. As Neto et al. [16] investigated, a missing implementation pathway and no standardized process are among the main barriers to the implementation of DTs in manufacturing. The presented approach, consisting of the procedure model together with the use case template, aims at reducing this barrier. The main benefit of the template lies in the formalized structure, which ensures that the most important questions are covered in the conception and implementation of a DT use case. These questions are:
- What might be a promising use case?
- Who needs to contribute to the use case?
- What is the goal?
- Why is it worth doing?
- Where in the current data structure is an appropriate interface?
- Where in the current process does a DT provide the most benefit? How can it be incorporated into the current process structure?
- How should the target process look? How does this DT module affect following process steps?
All these questions could be answered during this case study. Furthermore, as already stated in [17], it is beneficial to start from the current process, not from scratch. A final evaluation of the procedure model is still missing. Moreover, it needs to be adapted further. As a result of this case study, it became clear that it is not beneficial to apply the same use case template to both engineering and production twins. Apart from those two subsections, Trauer et al. [12] defined operations twins as a further category of DTs covering use cases in the use phase (see Section 2.3). These differences in DT along the lifecycle are also claimed by others, such as [40]. Therefore, it needs to be investigated whether a more flexible template tailored to the specific application would be better suited. In addition to the state of the art, there are also other categories of DTs such as cost or process twins, which are under research as well. Additionally, more auxiliary methods will be required to enable companies to implement DTs. Possible directions could be a business modeling approach for DTs to assess the value proposition more formally in the early stages, a database for DT use cases to guide practitioners in the ideation phase of DT projects, or an approach to creating trust in this novel concept. Moreover, the barriers and enablers presented by [16] should be investigated in a broader context beyond manufacturing in order to develop more goal-oriented support for the implementation of DTs.
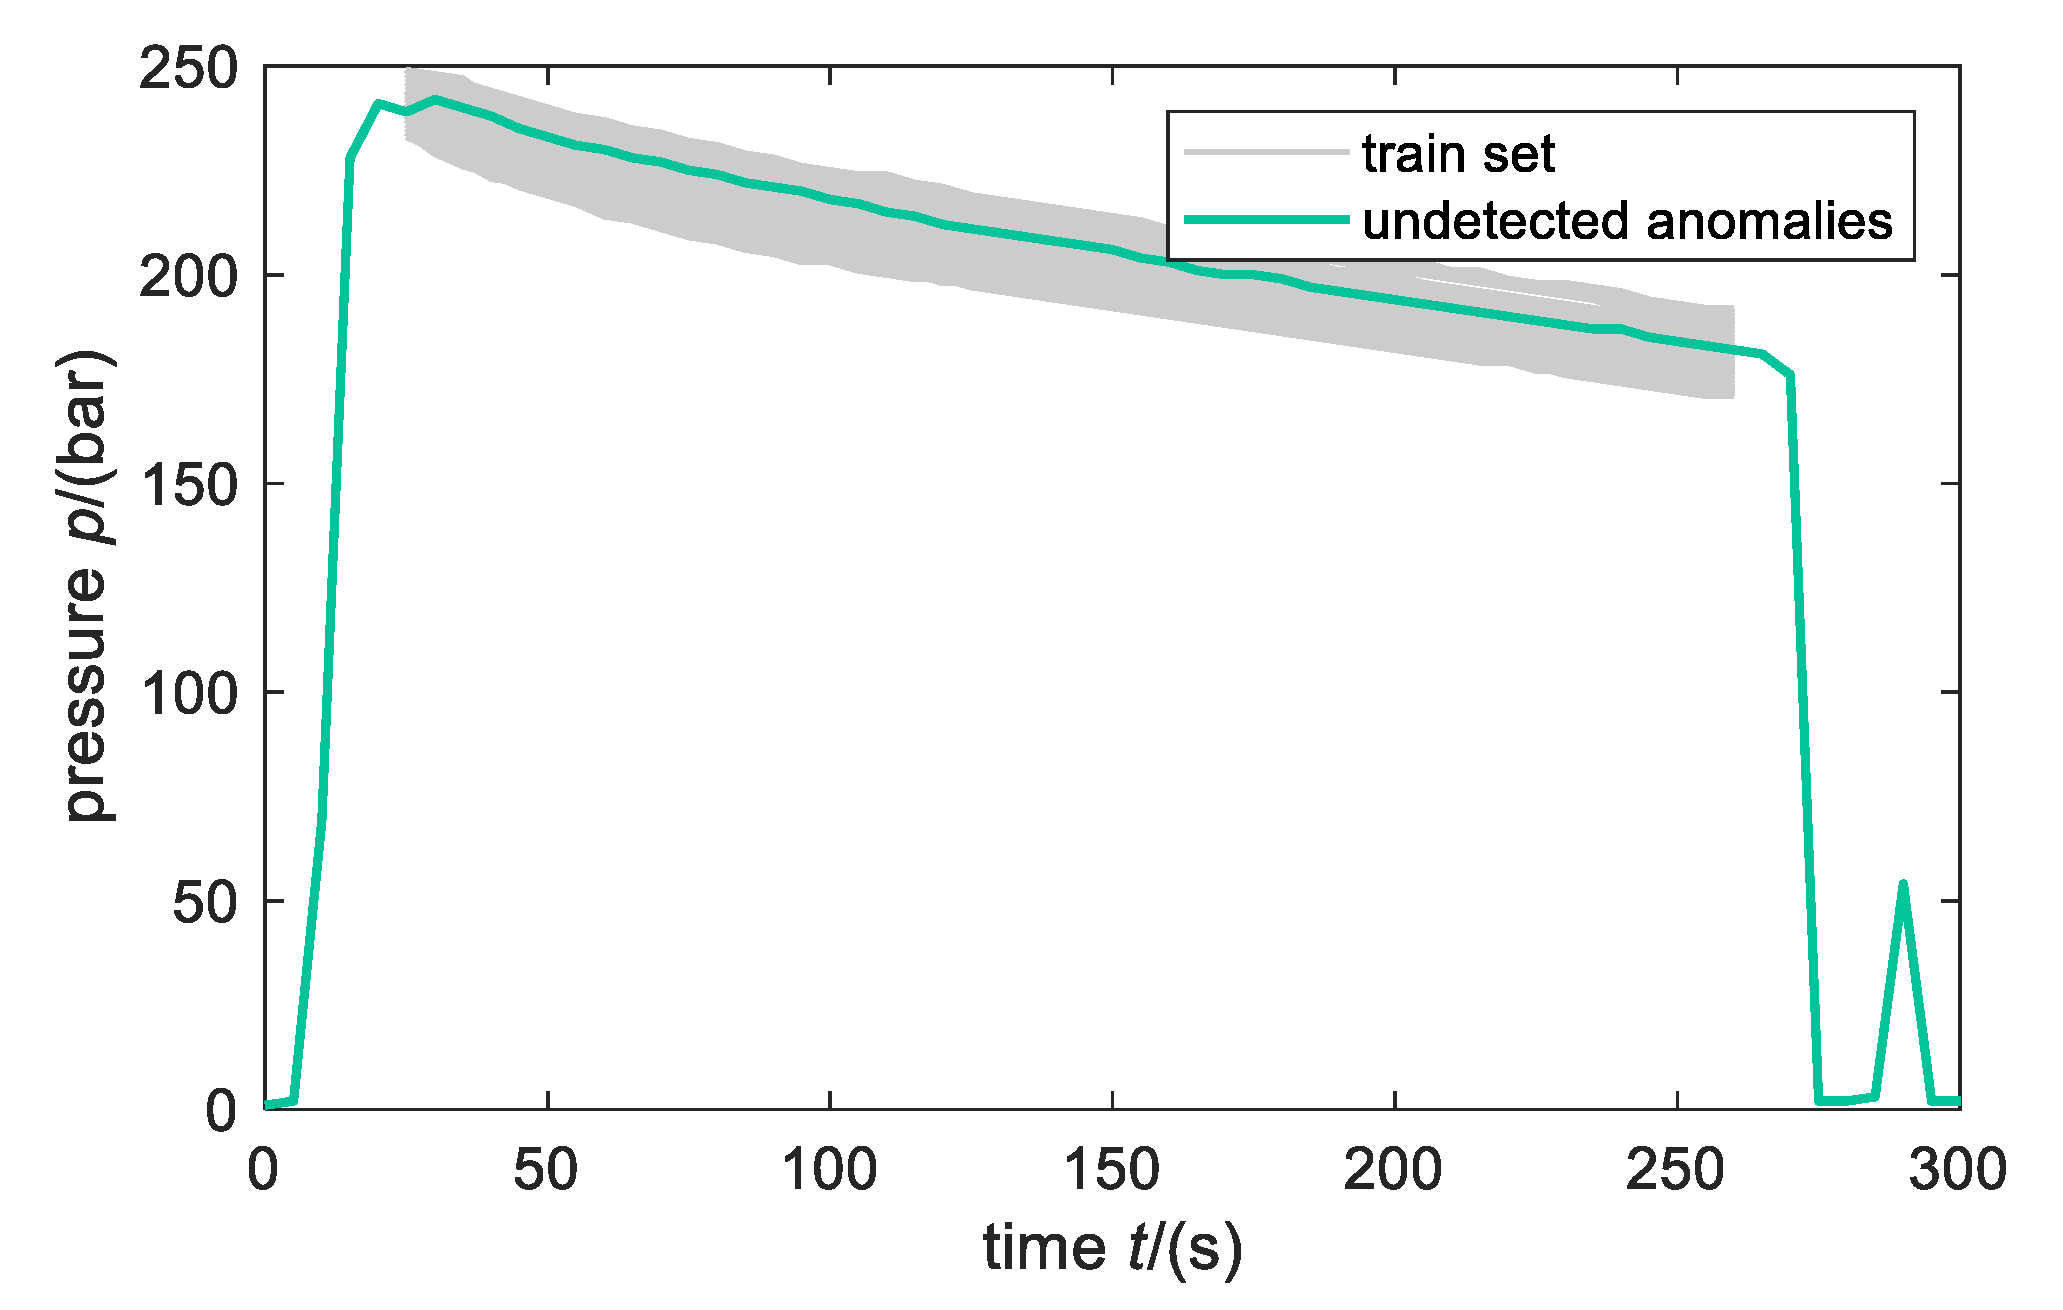
Performance of the anomaly detection model. As a result of this case study, not only was the methodology developed, but the concrete application was also shown and will be discussed in the following. In general, the high performance (0% FPR and 97.8% TPR) of the anomaly detection model with Gaussian processes could be reached. With the established model, only one anomaly, which is shown in Figure 15, could not be found. As the anomalous behavior appears after the cut-off time of the manipulation scheme, the anomaly could not be detected. However, one could argue that the extrusion process was conducted properly as the anomalous behavior occurs after the pressure reaches 0 bar. Since the pressure lines were classified by a human, it could be also possible that this extrusion process was in fact properly conducted. Therefore, the results are also highly dependent on the employee’s opinion. One could reduce this problem by asking more than one employee to classify the pressure lines. Another approach is to formulate certain criteria, which must hold for anomalous behavior.
One drawback of the current anomaly detection method is that only the entire extrusion process is classified as good or anomalous. Therefore, the entire billet has to be either rejected or accepted. Computing the likelihood not only for the entire line but also for steps in between could make the detection of billet sections possible. As the anomaly detection method relies on the likelihood of a pressure line, the method is dependent on the number of points per line. If the sample rate changes, the model has to be retrained.
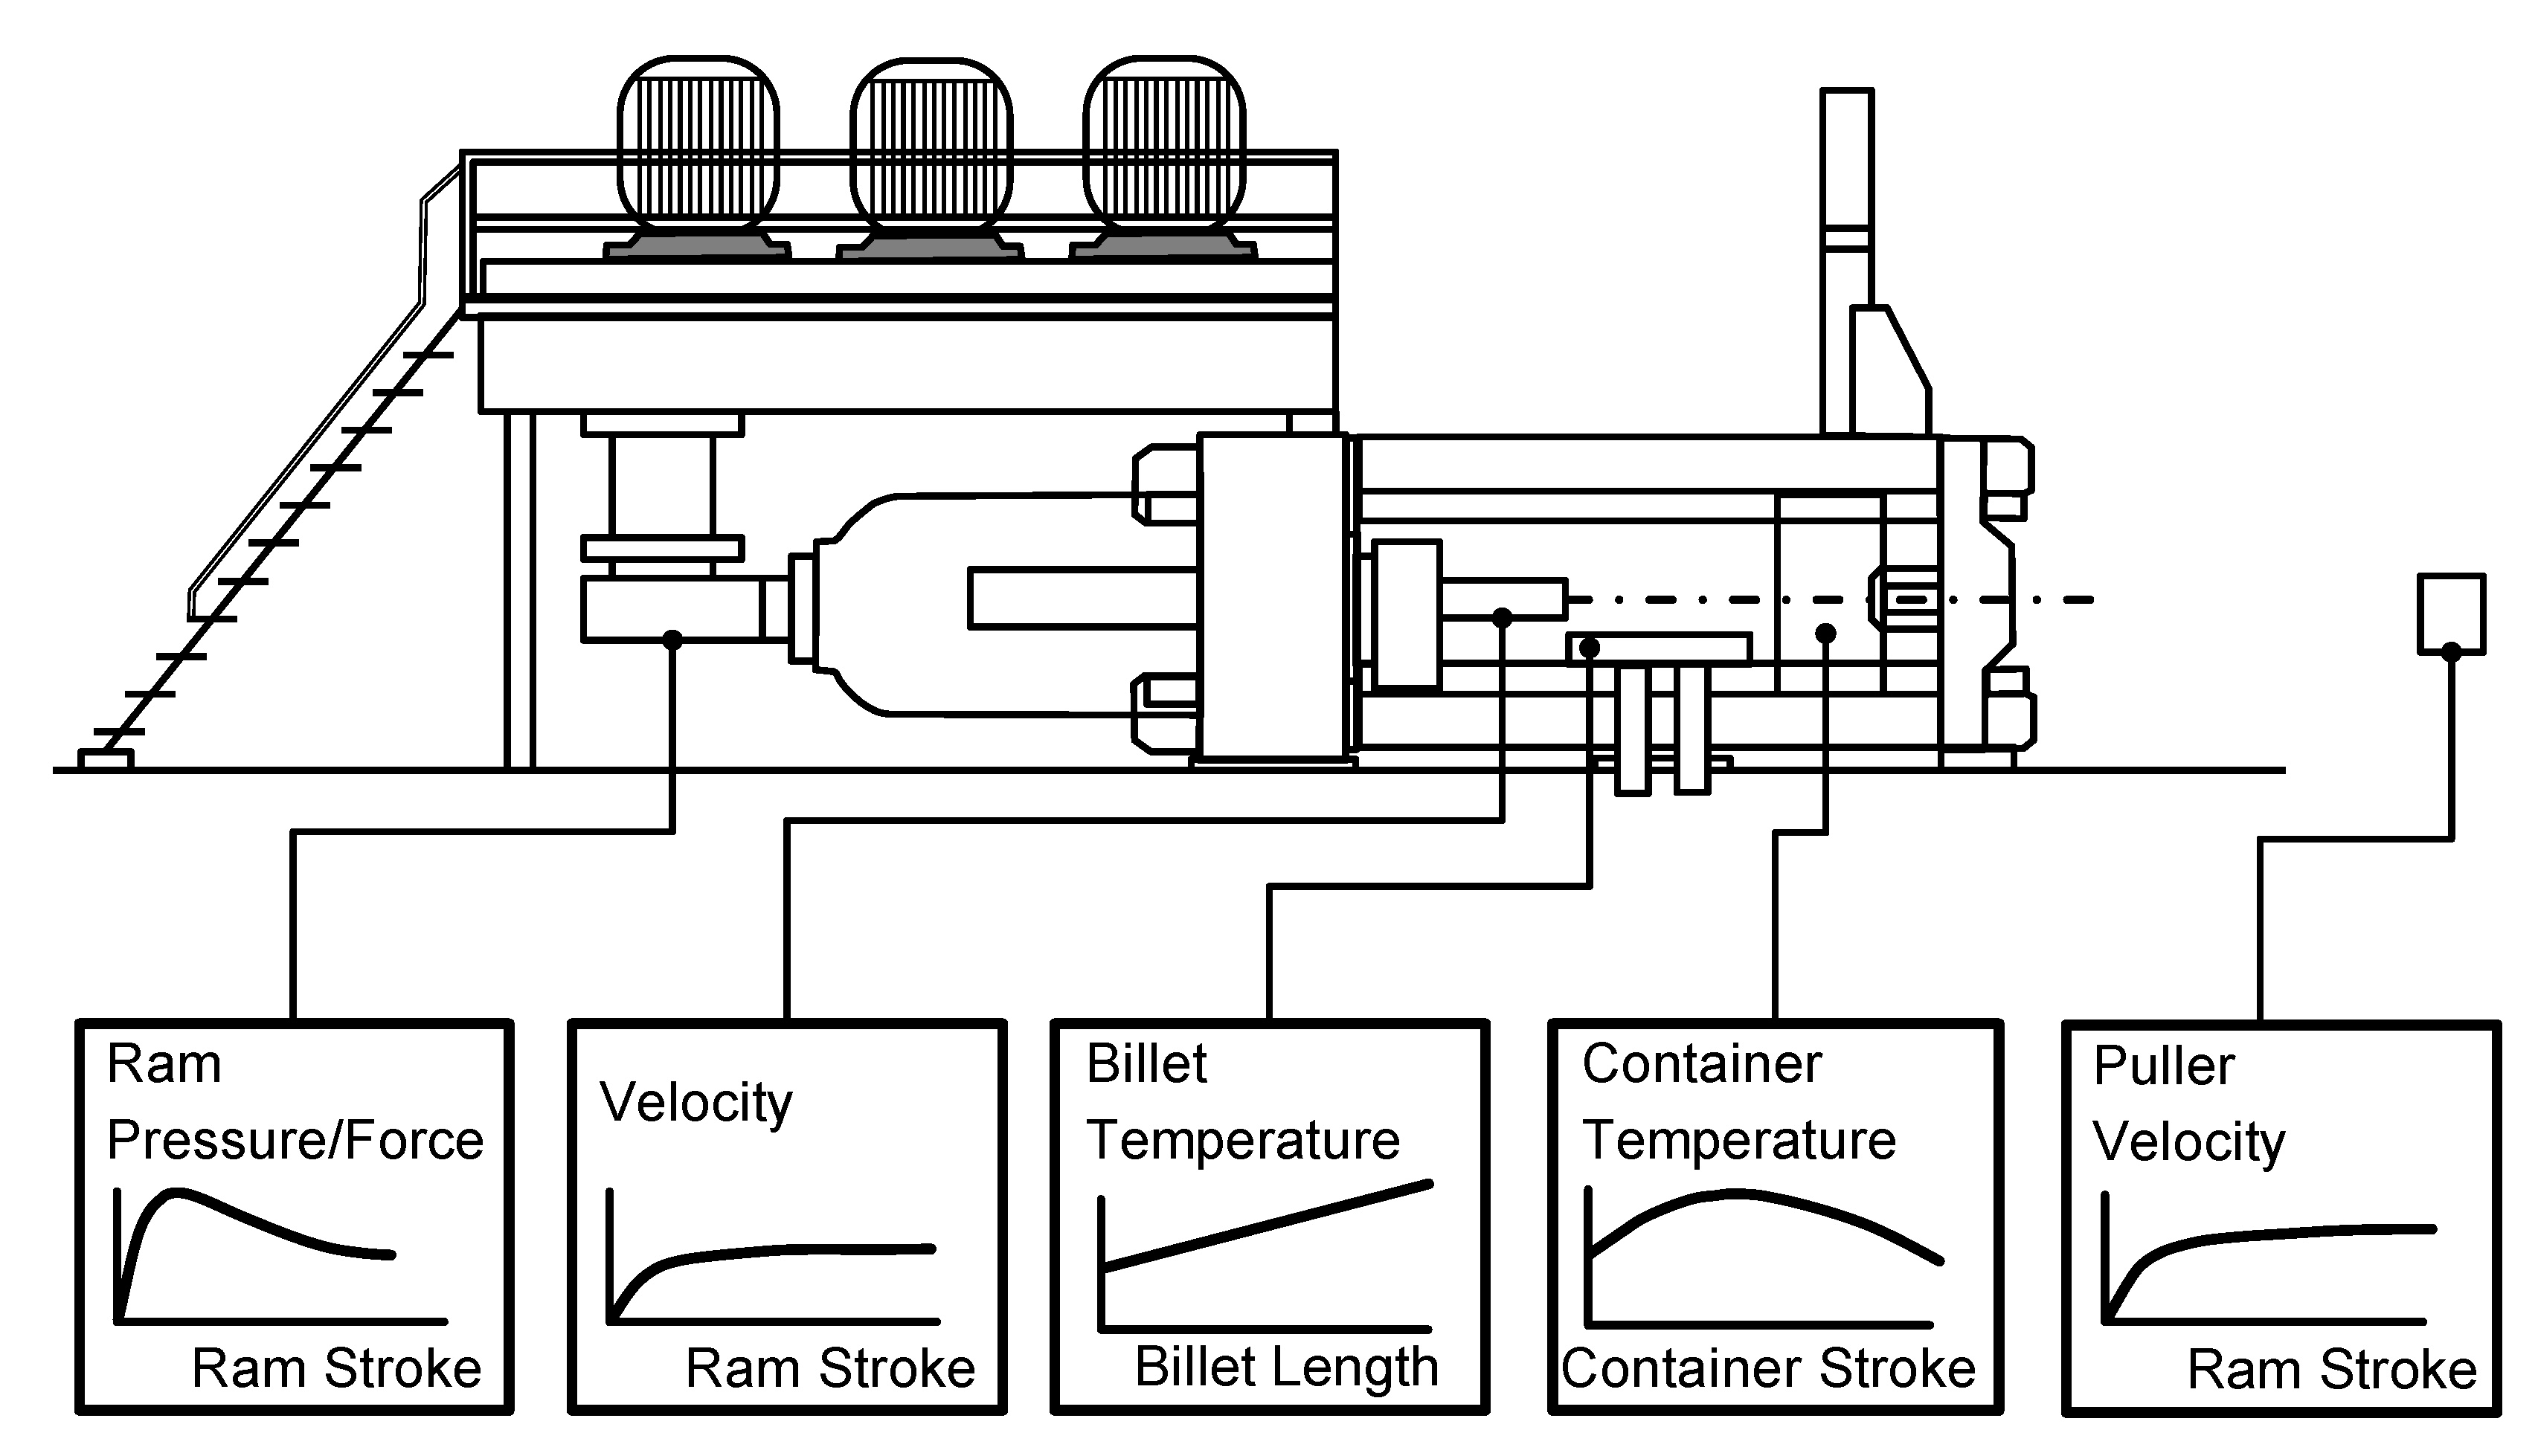
In this paper, a Gaussian process with one observed variable was trained. It would be interesting if additional variables such as temperature or velocity, as shown in Figure 16, could increase the performance of the anomaly detection model. To show this, a bigger test set should be used. Moreover, other models such as neural networks could be trained and compared to the established model. It would be interesting if other models such as neural networks could reach a similar performance while providing a simpler training procedure or less data manipulation (see, e.g., [41]). The Gaussian process anomaly detection method relies on the computed likelihood that can be seen as one certain distance measure. As in [21,42,43], other distance measures such as the Euclidean and the Manhattan distance could be compared to the established model.
Technology readiness. The developed DT module was trained and tested using historical data. However, first, actions were taken toward a comprehensive implementation of the solution approach. At the end, an interface was implemented to ensure the automated feeding of data from the production process into the algorithm. Doing this realized a near real-time analysis of ram pressure. Thus, a technology readiness level 6 (TRL6), “subsystem model or prototype in a relevant environment”, was reached [45]. Still missing is the automated bidirectionality. So far, the algorithm can be fed only automatically, but there is no interface to the press, which would be required to actuate the needle roll. This way, faulty products could directly be marked and discarded without additional manual process steps. All measurements are taken to proceed in this manner, but due to the restricted project time, this is not included within this contribution.
Efficiency Improvement. The developed solution improved production efficiency with respect to cost, energy, and quality. It resulted in estimated cost savings of up to ~80,000 EUR/a. Of course, this success evaluation also comes with some limitations. First, as the project was conducted in an academic setting, it is difficult to realistically estimate the costs for implementation. Thus, we did not succeed in calculating a return on investment, which would be needed for a holistic success evaluation. Second, a few simplifications had to be made, especially for the aging process; here, it was assumed that resulting capacities from removing faulty parts can always be filled with other unharmed products. However, this assumption cannot be ensured. Last, it was not possible to also consider claims and quality management costs as a measure of the quality dimension, because there is as yet no sufficient data base available. Once these data are available, it would also be possible to calculate the “overall equipment efficiency” (OEE) as a valuable success factor, especially in terms of sustainability, as shown by [46]. The energy reduction leading to an improved sustainability could also be described only qualitatively, as no sufficient data are available.
5. Conclusions
5.1. Summary
First, a procedure model for the conception and implementation of DTs was applied and further developed. In particular, the adaption to production twins is a key result. Based on the current process and the boundary conditions, a target process was derived, which laid the foundation for an anomaly detection algorithm to detect defective pressing processes. The algorithm uses Gaussian process models for the detection of anomalies in the pressure curves of the system. With the developed solution, it is possible to detect faulty products and too-high pressures at the machine. The developed solution resulted in a performance of 0% FPR and 97.8% TPR. With the use case implemented, the case study partner would have been able to save production costs of up to ~80,000 EUR/a. The DT module was successfully introduced up to TRL 6.
5.2. Outlook
As already argued in the discussion section, the presented procedure model and use case template need to be further adapted to different application scenarios, and additional supporting methods such as a business modeling approach for DTs or a use case database would be beneficial. Regarding the implemented DT module, a model that can detect an anomaly during the extrusion process could be helpful. Then, only billet sections can be discarded, and the loss of material could be minimized. Another interesting direction for better inspection and disposal could be reinforcement learning, as described in [47], where the algorithm can find the best strategy. However, much data and long training time are needed. The success evaluation still has some limitations and should be refined. Additionally, further metrics such as the overall equipment efficiency (OEE) should be applied to also consider sustainability improvements of such use cases. Finally, the presented use case needs to be fully implemented in the production process up to TRL9.
Author Contributions
Conceptualization, S.P. and J.T.; methodology, S.P. and J.T.; software, M.F.; validation, M.F., S.P. and J.T.; data curation, S.P. and M.F.; writing—original draft preparation, S.P. and J.T.; writing—review and editing, M.F. and M.Z.; visualization, S.P. and J.T.; supervision, M.Z.; project administration, M.Z. All authors have read and agreed to the published version of the manuscript.
Funding
This research received no external funding.
Institutional Review Board Statement
Not applicable.
Informed Consent Statement
Not applicable.
Acknowledgments
The authors would like to thank Andreas Schiffl for initiating this project. Further, we would like to thank our colleagues, Lukas Krischer, Sebastian Schweigert-Recksiek, and Markus Mörtl for their support in the project and in the preparation of this publication.
Conflicts of Interest
The authors declare no conflict of interest.
References
- De Mauro, A.; Greco, M.; Grimaldi, M. A formal definition of Big Data based on its essential features. Libr. Rev. 2016, 65, 122–135. [Google Scholar] [CrossRef]
- World Economic Forum. The World’s Data Explained: How Much We’re Producing and Where It’s All Stored. Available online: https://www.weforum.org/agenda/2021/05/world-data-produced-stored-global-gb-tb-zb (accessed on 18 May 2021).
- Lee, E.A. Cyber Physical Systems: Design Challenges. In Proceedings of the 2008 11th IEEE International Symposium on Object and Component-Oriented Real-Time Distributed Computing (ISORC), Orlando, FL, USA, 5 May–5 July 2008; IEEE: New York, NY, USA, 2008; pp. 363–369, ISBN 978-0-7695-3132-8. [Google Scholar]
- Rajkumar, R.; Lee, I.; Sha, L.; Stankovic, J. Cyber-physical systems. In Proceedings of the 47th Design Automation Conference, Anaheim, CA, USA, 13–18 June 2010; Sapatnekar, S.S., Ed.; IEEE: Piscataway, NJ, USA, 2010; p. 731, ISBN 9781450300025. [Google Scholar]
- Wilberg, J.; Fahrmeier, L.; Hollauer, C.; Omer, M. Deriving a Use Phase Data Strategy for Connected Products: A Process Model. In Proceedings of the 15th International Design Conference, Dubrovnik, Croatia, 21–24 May 2018; Faculty of Mechanical Engineering and Naval Architecture, University of Zagreb: Zagreb, Croatia; The Design Society: Glasgow, UK, 2018; pp. 1441–1452. [Google Scholar]
- Eckert, C.; Isaksson, O.; Hallstedt, S.; Malmqvist, J.; Öhrwall Rönnbäck, A.; Panarotto, M. Industry Trends to 2040. Proc. Int. Conf. Eng. Des. 2019, 1, 2121–2128. [Google Scholar] [CrossRef] [Green Version]
- Wilberg, J.; Triep, I.; Hollauer, C.; Omer, M. Big Data in Product Development: Need for a Data Strategy. In Proceedings of the PICMET ‘17, 2017Portland International Conference on Management of Engineering and Technology (PICMET), Portland, OR, USA, 9–13 July 2017; Kocaoglu, D.F., Anderson, T.R., Eds.; PICMET, Department of Engineering and Technology Management, Portland State University: Portland, OR, USA, 2017; pp. 1–10, ISBN 978-1-890843-36-6. [Google Scholar]
- Davenport, T.H. Big Data at Work: Dispelling the Myths, Uncovering the Opportunities; Data mining; Harvard Business Review Press: Boston, MA, USA, 2014; ISBN 9781422168172. [Google Scholar]
- Tavares-Lehmann, A.T.; Varum, C. Industry 4.0 and Sustainability: A Bibliometric Literature Review. Sustainability 2021, 13, 3493. [Google Scholar] [CrossRef]
- Barricelli, B.R.; Casiraghi, E.; Fogli, D. A Survey on Digital Twin: Definitions, Characteristics, Applications, and Design Implications. IEEE Access 2019, 7, 167653–167671. [Google Scholar] [CrossRef]
- Grieves, M.; Vickers, J. Digital Twin: Mitigating Unpredictable, Undesirable Emergent Behavior in Complex Systems. In Transdisciplinary Perspectives on Complex Systems: New Findings and Approaches, 1st ed.; Kahlen, F.-J., Flumerfelt, S., Alves, A., Eds.; Springer International Publishing: Cham, Switzerland, 2017; pp. 85–113. ISBN 978-3-319-38756-7. [Google Scholar]
- Trauer, J.; Schweigert-Recksiek, S.; Engel, C.; Spreitzer, K.; Zimmermann, M. What is a Digital Twin?—Definitions and Insights from an Industrial Case Study in Technical Product Development. Proc. Des. Soc. Des. Conf. 2020, 1, 757–766. [Google Scholar] [CrossRef]
- Pires, F.; Cachada, A.; Barbosa, J.; Moreira, A.P.; Leitao, P. Digital Twin in Industry 4.0: Technologies, Applications and Challenges. In 2019 IEEE 17th International Conference on Industrial Informatics (INDIN), Aalto University, Helsinki-Espoo, Finland, 22–25 July, 2019; IEEE: Piscataway, NJ, USA, 2019; pp. 721–726. ISBN 978-1-7281-2927-3. [Google Scholar]
- Jones, D.; Snider, C.; Nassehi, A.; Yon, J.; Hicks, B. Characterising the Digital Twin: A systematic literature review. Cirp J. Manuf. Sci. Technol. 2020, 29, 36–52. [Google Scholar] [CrossRef]
- Hinduja, H.; Kekkar, S.; Chourasia, S.; Chakrapani, H.B. Industry 4.0: Digital Twin and its Industrial Applications. Riet Ijset Int. J. Sci. Eng. Technol. 2020, 8, 1–7. [Google Scholar]
- Neto, A.A.; Deschamps, F.; da Silva, E.R.; de Lima, E.P. Digital twins in manufacturing: An assessment of drivers, enablers and barriers to implementation. Procedia Cirp 2020, 93, 210–215. [Google Scholar] [CrossRef]
- Schweigert-Recksiek, S.; Trauer, J.; Engel, C.; Spreitzer, K.; Zimmermann, M. Conception of a Digital Twin in Mechanical Engineering—A Case Study in Technical Product Development. Proc. Des. Soc. Des. Conf. 2020, 1, 383–392. [Google Scholar] [CrossRef]
- Hammerer Aluminium Industries. Hammerer Aluminium Industries. Available online: https://www.hai-aluminium.com/en/ (accessed on 14 June 2021).
- Stojanovic, B.; Bukvic, M.; Epler, I. Application of Aluminum and Aluminum Alloys in Engineering. Appl. Eng. Lett. 2018, 3, 52–62. [Google Scholar] [CrossRef]
- Saha, P.K. Aluminum Extrusion Technology; ASM International: Materials Park, OH, Canada, 2000; ISBN 1615032452. [Google Scholar]
- Tekkaya, A.E.; Chatti, S. Bar Extrusion. In CIRP Encyclopedia of Production Engineering, 2nd ed.; Chatti, S., Laperrière, L., Reinhart, G., Tolio, T., Eds.; Springer: Berlin, Germany, 2019; pp. 115–118. ISBN 978-3-662-53119-8. [Google Scholar]
- Chandola, V.; Banerjee, A.; Kumar, V. Anomaly detection. ACM Comput. Surv. 2009, 41, 1–58. [Google Scholar] [CrossRef]
- Goldstein, M.; Uchida, S. A Comparative Evaluation of Unsupervised Anomaly Detection Algorithms for Multivariate Data. PLoS ONE 2016, 11, e0152173. [Google Scholar] [CrossRef] [PubMed] [Green Version]
- Braei, M.; Wagner, S. Anomaly Detection in Univariate Time-Series: A Survey on the State-of-the-Art. 2020. Available online: https://arxiv.org/abs/2004.00433 (accessed on 18 August 2021).
- Pfingstl, S.; Steiner, M.; Tusch, O.; Zimmermann, M. Crack Detection Zones: Computation and Validation. Sensor 2020, 20, 2568. [Google Scholar] [CrossRef]
- Pfingstl, S.; Zimmermann, M. Strain-based Structural Health Monitoring: Computing Regions for Critical Crack Detection. In Structural Health Monitoring 2019, Enabling Intelligent Life-Cycle Health Management for Industry Internet of Things (IIOT), Lancaster, PA.; Chang, F.-K., Güemes, A., Kopsaftopoulos, F., Eds.; DEStech Publications, Inc.: Lancaster, PA, USA, 2019; ISBN 9781605956015. [Google Scholar]
- Fawcett, T.; Provost, F. Activity monitoring: Noticing interesting changes in behavior. In Proceedings of the Fifth ACM SIGKDD International Conference on Knowledge Discovery and Data Mining, San Diego, CA, USA, 15–18 August 1999; pp. 53–62. [Google Scholar]
- MacDonald, J.W.; Ghosh, D. COPA--cancer outlier profile analysis. Bioinformatics 2006, 22, 2950–2951. [Google Scholar] [CrossRef] [Green Version]
- Li, L.; Hansman, R.J.; Palacios, R.; Welsch, R. Anomaly detection via a Gaussian Mixture Model for flight operation and safety monitoring. Transp. Res. Part C Emerg. Technol. 2016, 64, 45–57. [Google Scholar] [CrossRef]
- Liu, L.; Liu, D.; Zhang, Y.; Peng, Y. Effective Sensor Selection and Data Anomaly Detection for Condition Monitoring of Aircraft Engines. Sensor 2016, 16, 623. [Google Scholar] [CrossRef] [PubMed] [Green Version]
- Pandit, R.K.; Infield, D. SCADA-based wind turbine anomaly detection using Gaussian process models for wind turbine condition monitoring purposes. IET Renew. Power Gener. 2018, 12, 1249–1255. [Google Scholar] [CrossRef] [Green Version]
- Markou, M.; Singh, S. Novelty detection: A review—part 1: Statistical approaches. Signal Process. 2003, 83, 2481–2497. [Google Scholar] [CrossRef]
- Rasmussen, C.E.; Williams, C.K.I. Gaussian Processes for Machine Learning, 3rd ed.; MIT Press: Cambridge, MA, USA, 2008; ISBN 9780262182539. [Google Scholar]
- Garnett, R.; Osborne, M.A.; Reece, S.; Rogers, A.; Roberts, S.J. Sequential Bayesian Prediction in the Presence of Changepoints and Faults. Comput. J. 2010, 53, 1430–1446. [Google Scholar] [CrossRef]
- Gu, M.; Fei, J.; Sun, S. Online anomaly detection with sparse Gaussian processes. Neurocomputing 2020, 403, 383–399. [Google Scholar] [CrossRef]
- Beecks, C.; Schmidt, K.W.; Berns, F.; Graß, A.; Papotti, P. Gaussian Processes for Anomaly Description in Production Environments. In Proceedings of the Workshops of the EDBT/ICDT 2019 Joint Conference (EDBT/ICDT 2019), Lisbon, Portugal, 26 March 2019; Papotti, P., Ed.; 2019. Available online: http://ceur-ws.org/vol-2322/dsi4-4.pdf (accessed on 18 August 2021).
- Aye, S.A.; Heyns, P.S. An integrated Gaussian process regression for prediction of remaining useful life of slow speed bearings based on acoustic emission. Mech. Syst. Signal Process. 2017, 84, 485–498. [Google Scholar] [CrossRef]
- Pfingstl, S.; Rios, J.I.; Baier, H.; Zimmermann, M. Predicting Crack Growth and Fatigue Life with Surrogate Models. arXiv 2020, arXiv:2008.02324. [Google Scholar]
- Pfingstl, S.; Zimmermann, M. On Integrating Prior Knowledge into Gaussian Processes (Submitted). 2021. Available online:. (accessed on 30 July 2021).
- Boschert, S.; Rosen, R. Digital Twin—The Simulation Aspect. In Mechatronic Futures; Hehenberger, P., Bradley, D., Eds.; Springer International Publishing: Cham, Switzerland, 2016; pp. 59–74. ISBN 978-3-319-32154-7. [Google Scholar]
- Omar, S.; Ngadi, A.; Jebur, H.H. Machine learning techniques for anomaly detection: An overview. Int. J. Comput. Appl. 2013. [Google Scholar] [CrossRef]
- Malkauthekar, M.D. Analysis of euclidean distance and manhattan distance measure in face recognition. In Proceedings of the Third International Conference on Computational Intelligence and Information Technology, 2013. CIIT 2013, Mumbai, India, 18–19 October 2013; The Institution of Engineering and Technology: Stevenage, UK, 2013. ISBN 9781849198592. [Google Scholar]
- Vadivel, A.; Majumdar, A.K.; Sural, S. Performance Comparison of Distance Metrics in Content-Based Image Retrieval Applications; Proc. of Internat. Conf. on Information Technology; Orissa Information Technology Society (OITS): Bhubaneswar, India, 2003. [Google Scholar]
- Grundlagen des Strangpressens: Mit 74 Literaturstellen; Müller, K.; Majumdar, A.K.; Sural, S. (Eds.) Expert-Verl.: Renningen-Malmsheim, Germany, 1995; ISBN 3-8169-1071-8. [Google Scholar]
- Mankins, J.C. Technology readiness assessments: A retrospective. Acta Astronaut. 2009, 65, 1216–1223. [Google Scholar] [CrossRef]
- Ghafoorpoor Yazdi, P.; Azizi, A.; Hashemipour, M. An Empirical Investigation of the Relationship between Overall Equipment Efficiency (OEE) and Manufacturing Sustainability in Industry 4.0 with Time Study Approach. Sustainability 2018, 10, 3031. [Google Scholar] [CrossRef] [Green Version]
- Pfingstl, S.; Schoebel, Y.N.; Zimmermann, M. Reinforcement Learning for Structural Health Monitoring based on Inspection Data. Mater. Res. Proc. 2021, 18, 203–210. [Google Scholar] [CrossRef]
Figure 1.
Technology areas covered by Hammerer Aluminium Industries: casting (a), extrusion (b), and processing (c) (retrieved from [18]).
Figure 1.
Technology areas covered by Hammerer Aluminium Industries: casting (a), extrusion (b), and processing (c) (retrieved from [18]).

Figure 2.
Direct bar extrusion (adapted from [21]).
Figure 2.
Direct bar extrusion (adapted from [21]).

Figure 3.
Force–displacement curve in direct extrusion (adapted from [21]).
Figure 3.
Force–displacement curve in direct extrusion (adapted from [21]).

Figure 4.
Procedure model for the conception and implementation of a Digital Twin in industry (adapted from [17]).
Figure 4.
Procedure model for the conception and implementation of a Digital Twin in industry (adapted from [17]).

Figure 5.
Schematic representation of validation set which cannot be separated perfectly.

Figure 6.
Overview of the use case “Detection of Defective Products Based on Ram Pressure Curves”.

Figure 7.
Current data structure of the use case.

Figure 8.
Current process of the use case.

Figure 9.
Process environment of the use case.

Figure 10.
Target process of the use case.

Figure 11.
Manipulated data according to Schemes 1–3 in (a,c,e) and the corresponding covariance matrices in (b,d,f). The gray lines represent the manipulated training data, and the black dashed line shows the computed mean function.
Figure 11.
Manipulated data according to Schemes 1–3 in (a,c,e) and the corresponding covariance matrices in (b,d,f). The gray lines represent the manipulated training data, and the black dashed line shows the computed mean function.


Figure 12.
Computed covariance matrix and approximated covariance function based on the approach presented in [39] with basis functions.
Figure 12.
Computed covariance matrix and approximated covariance function based on the approach presented in [39] with basis functions.

Figure 13.
Likelihoods of the validation set for manipulation Scheme 3 and chosen threshold.

Figure 14.
Test set (only anomalous test data) classified by the established anomaly detection model.
Figure 14.
Test set (only anomalous test data) classified by the established anomaly detection model.

Figure 15.
Training set and undetected anomalies based on data manipulation Scheme 4.

Figure 16.
Different measurement values saved during an extrusion process [44].
Figure 16.
Different measurement values saved during an extrusion process [44].


Table 1.
Separation of training, validation, and test set.
| Data Category | Training Lines | Validation Lines | Test Lines |
|---|---|---|---|
| Good | 533 | 14 | 57 |
| Anomalous | 0 | 14 | 45 |
Table 2.
TPR, FNR, TNR, and FPR of the anomaly detection model based on the six different data manipulation schemes.
Table 2.
TPR, FNR, TNR, and FPR of the anomaly detection model based on the six different data manipulation schemes.
| Scheme | TPR | FNR | TNR | FPR | ||||
|---|---|---|---|---|---|---|---|---|
| 1 | 43/45 | 95.6% | 2/45 | 4.44% | 40/57 | 70.2% | 17/57 | 29.8% |
| 2 | 44/45 | 97.8% | 1/45 | 2.22% | 53/57 | 93.0% | 4/57 | 7.02% |
| 3 | 44/45 | 97.8% | 1/45 | 2.22% | 57/57 | 100% | 0/57 | 0.00% |
| 3 * | 43/45 | 95.6% | 2/45 | 4.44% | 57/57 | 100% | 0/57 | 0.00% |
* with covariance function based on approach with basis functions.
Table 3.
Potential cost reductions for the two described scenarios, as well as the total potential. The costs are calculated in euro per billet (EUR/B).
Table 3.
Potential cost reductions for the two described scenarios, as well as the total potential. The costs are calculated in euro per billet (EUR/B).
| Scenario | Category | Pressing | Intermediate Storage | Artificial Aging | Packaging | Total (∑MHR + ∑PE) |
|---|---|---|---|---|---|---|
| Idealistic | MHR | - | - | 1.71 EUR/B | 2.99 EUR/B | 35.21 EUR/B |
| PE | 1.30 EUR/B | 8.31 EUR/B | - | 20.90 EUR/B | ||
| Realistic | MHR | - | - | - | 2.99 EUR/B | 23.89 EUR/B |
| PE | - | - | - | 20.90 EUR/B |
Publisher’s Note: MDPI stays neutral with regard to jurisdictional claims in published maps and institutional affiliations. |
© 2021 by the authors. Licensee MDPI, Basel, Switzerland. This article is an open access article distributed under the terms and conditions of the Creative Commons Attribution (CC BY) license (https://creativecommons.org/licenses/by/4.0/).
Share and Cite
MDPI and ACS Style
Trauer, J.; Pfingstl, S.; Finsterer, M.; Zimmermann, M. Improving Production Efficiency with a Digital Twin Based on Anomaly Detection. Sustainability 2021, 13, 10155. https://0-doi-org.brum.beds.ac.uk/10.3390/su131810155
AMA Style
Trauer J, Pfingstl S, Finsterer M, Zimmermann M. Improving Production Efficiency with a Digital Twin Based on Anomaly Detection. Sustainability. 2021; 13(18):10155. https://0-doi-org.brum.beds.ac.uk/10.3390/su131810155
Chicago/Turabian StyleTrauer, Jakob, Simon Pfingstl, Markus Finsterer, and Markus Zimmermann. 2021. "Improving Production Efficiency with a Digital Twin Based on Anomaly Detection" Sustainability 13, no. 18: 10155. https://0-doi-org.brum.beds.ac.uk/10.3390/su131810155
Note that from the first issue of 2016, this journal uses article numbers instead of page numbers. See further details here.