
Stochastic Particle Tracking Application in Different Urban Areas in Central Europe: The Milano (IT) and Jaworzno (PL) Case Study to Secure the Drinking Water Resources

 , ,
, ,  , , and
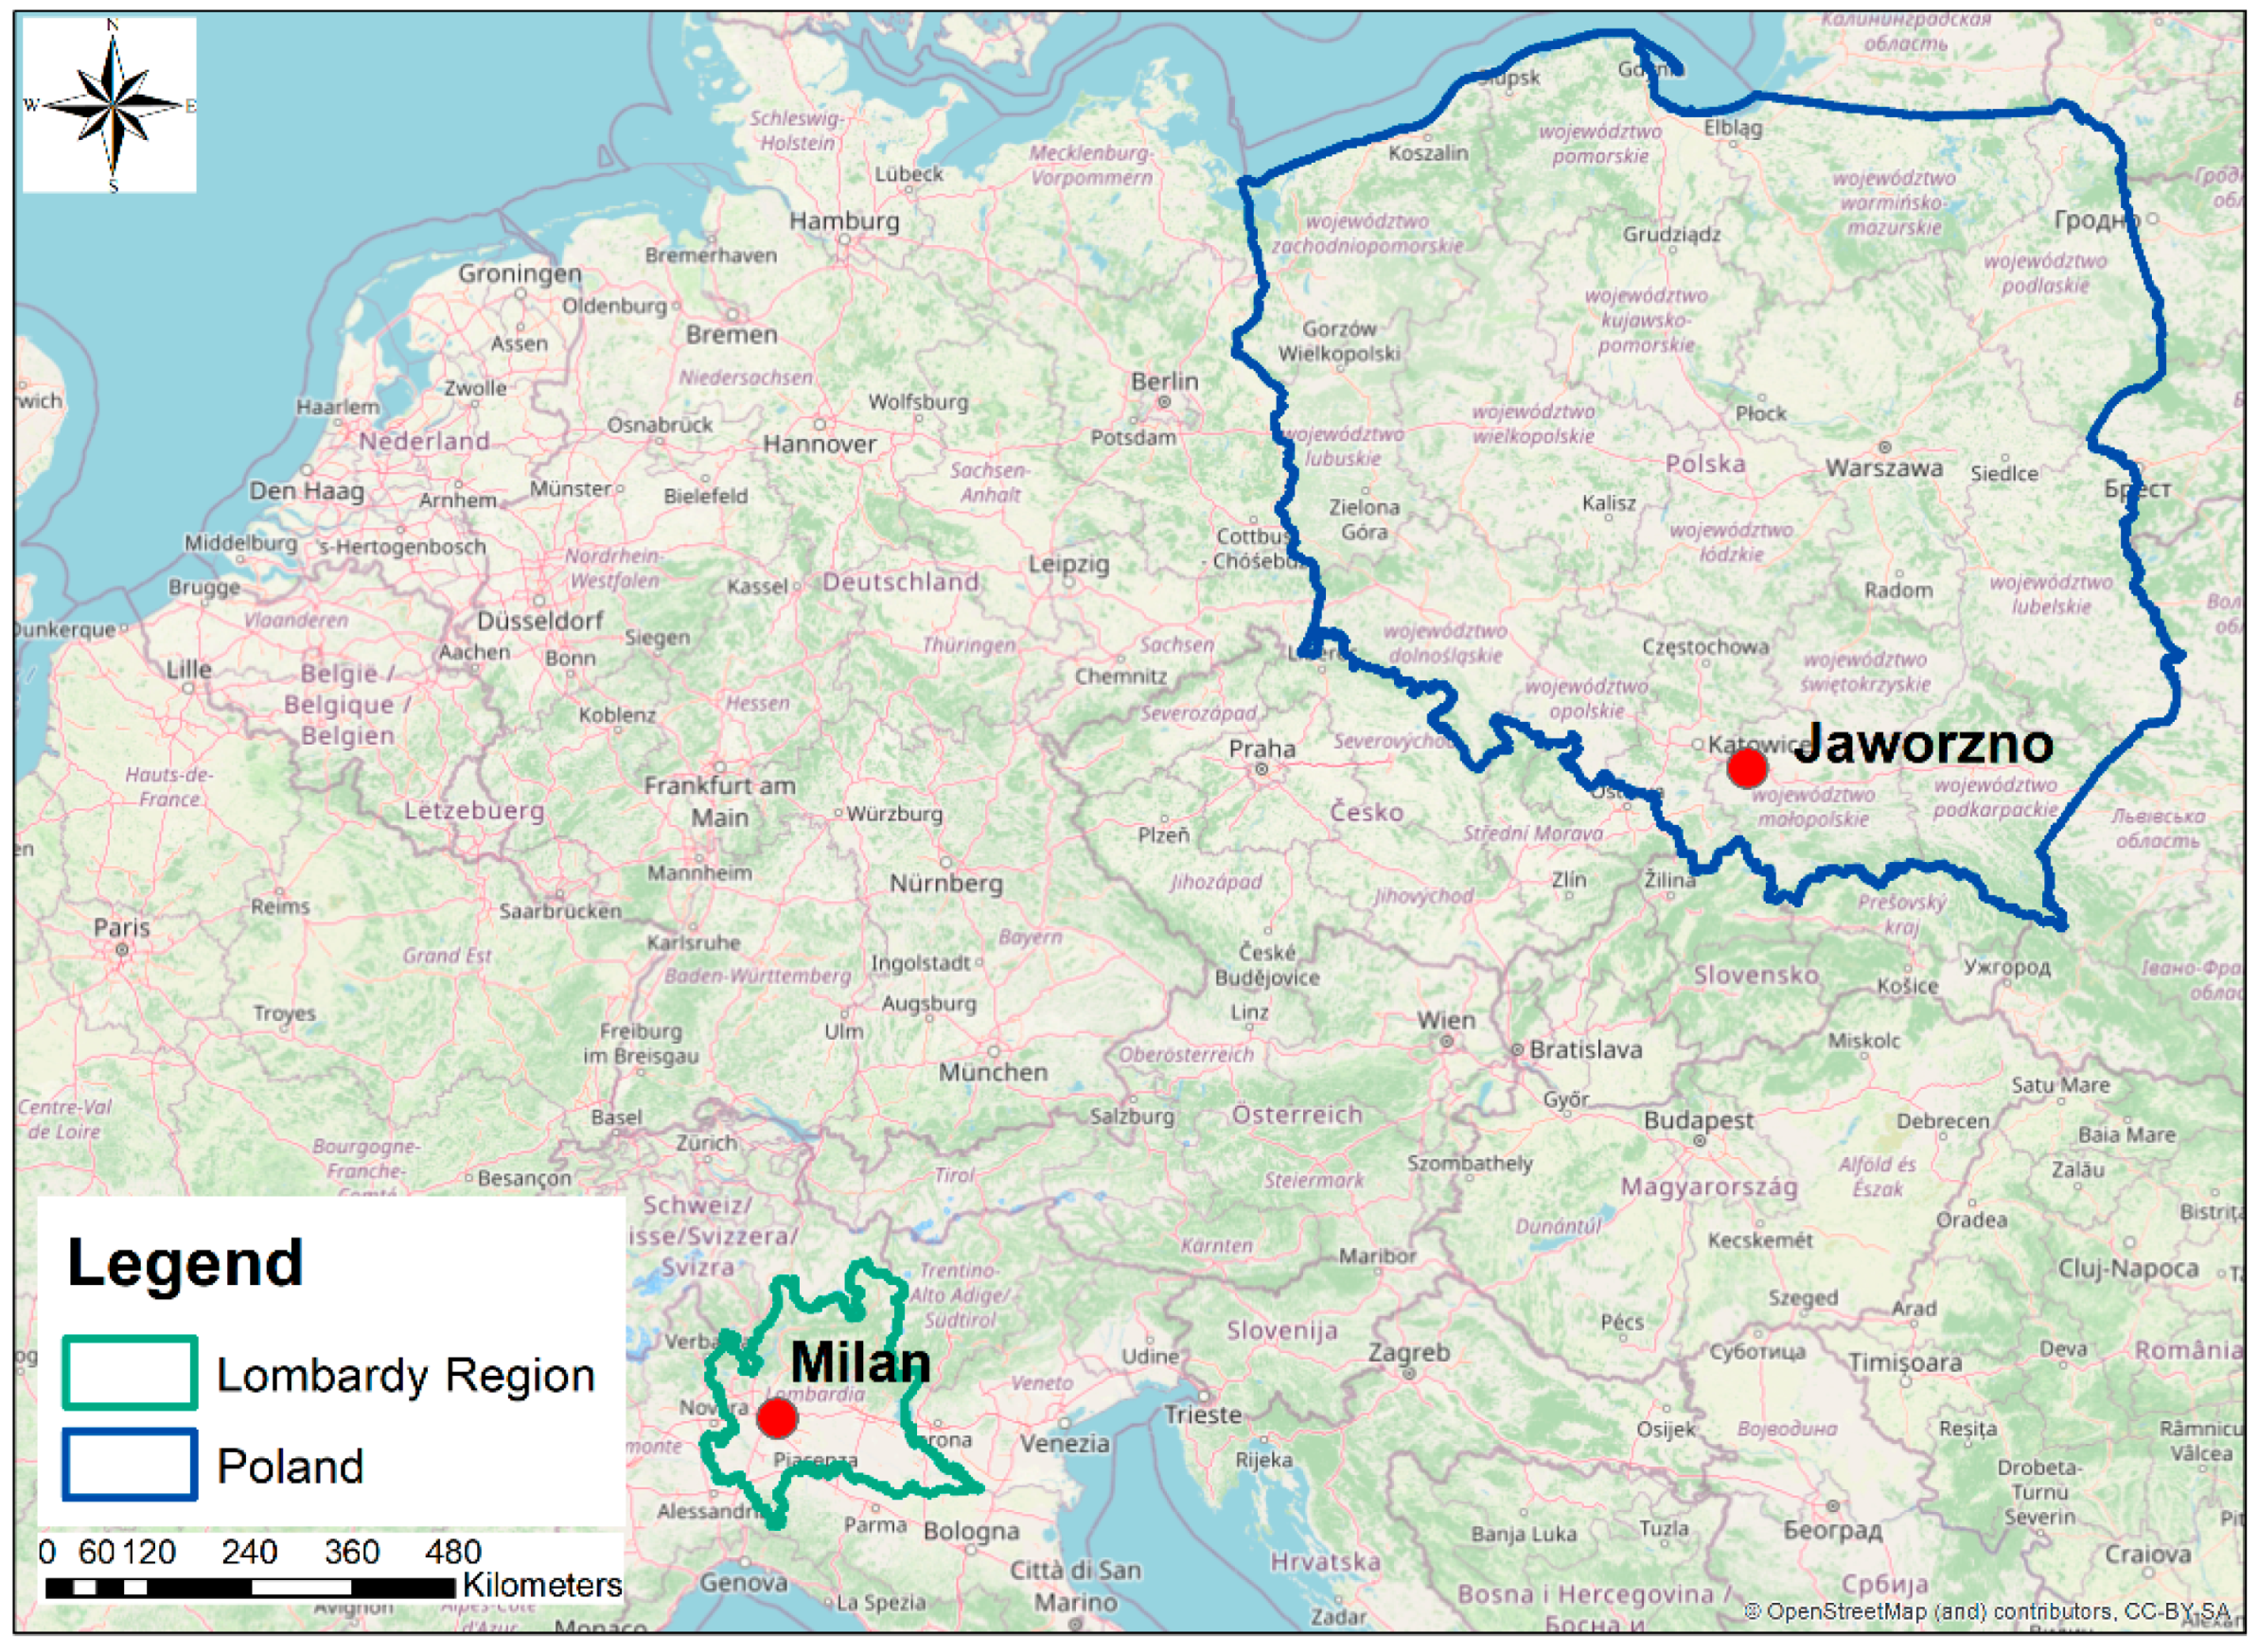
Abstract
:1. Introduction
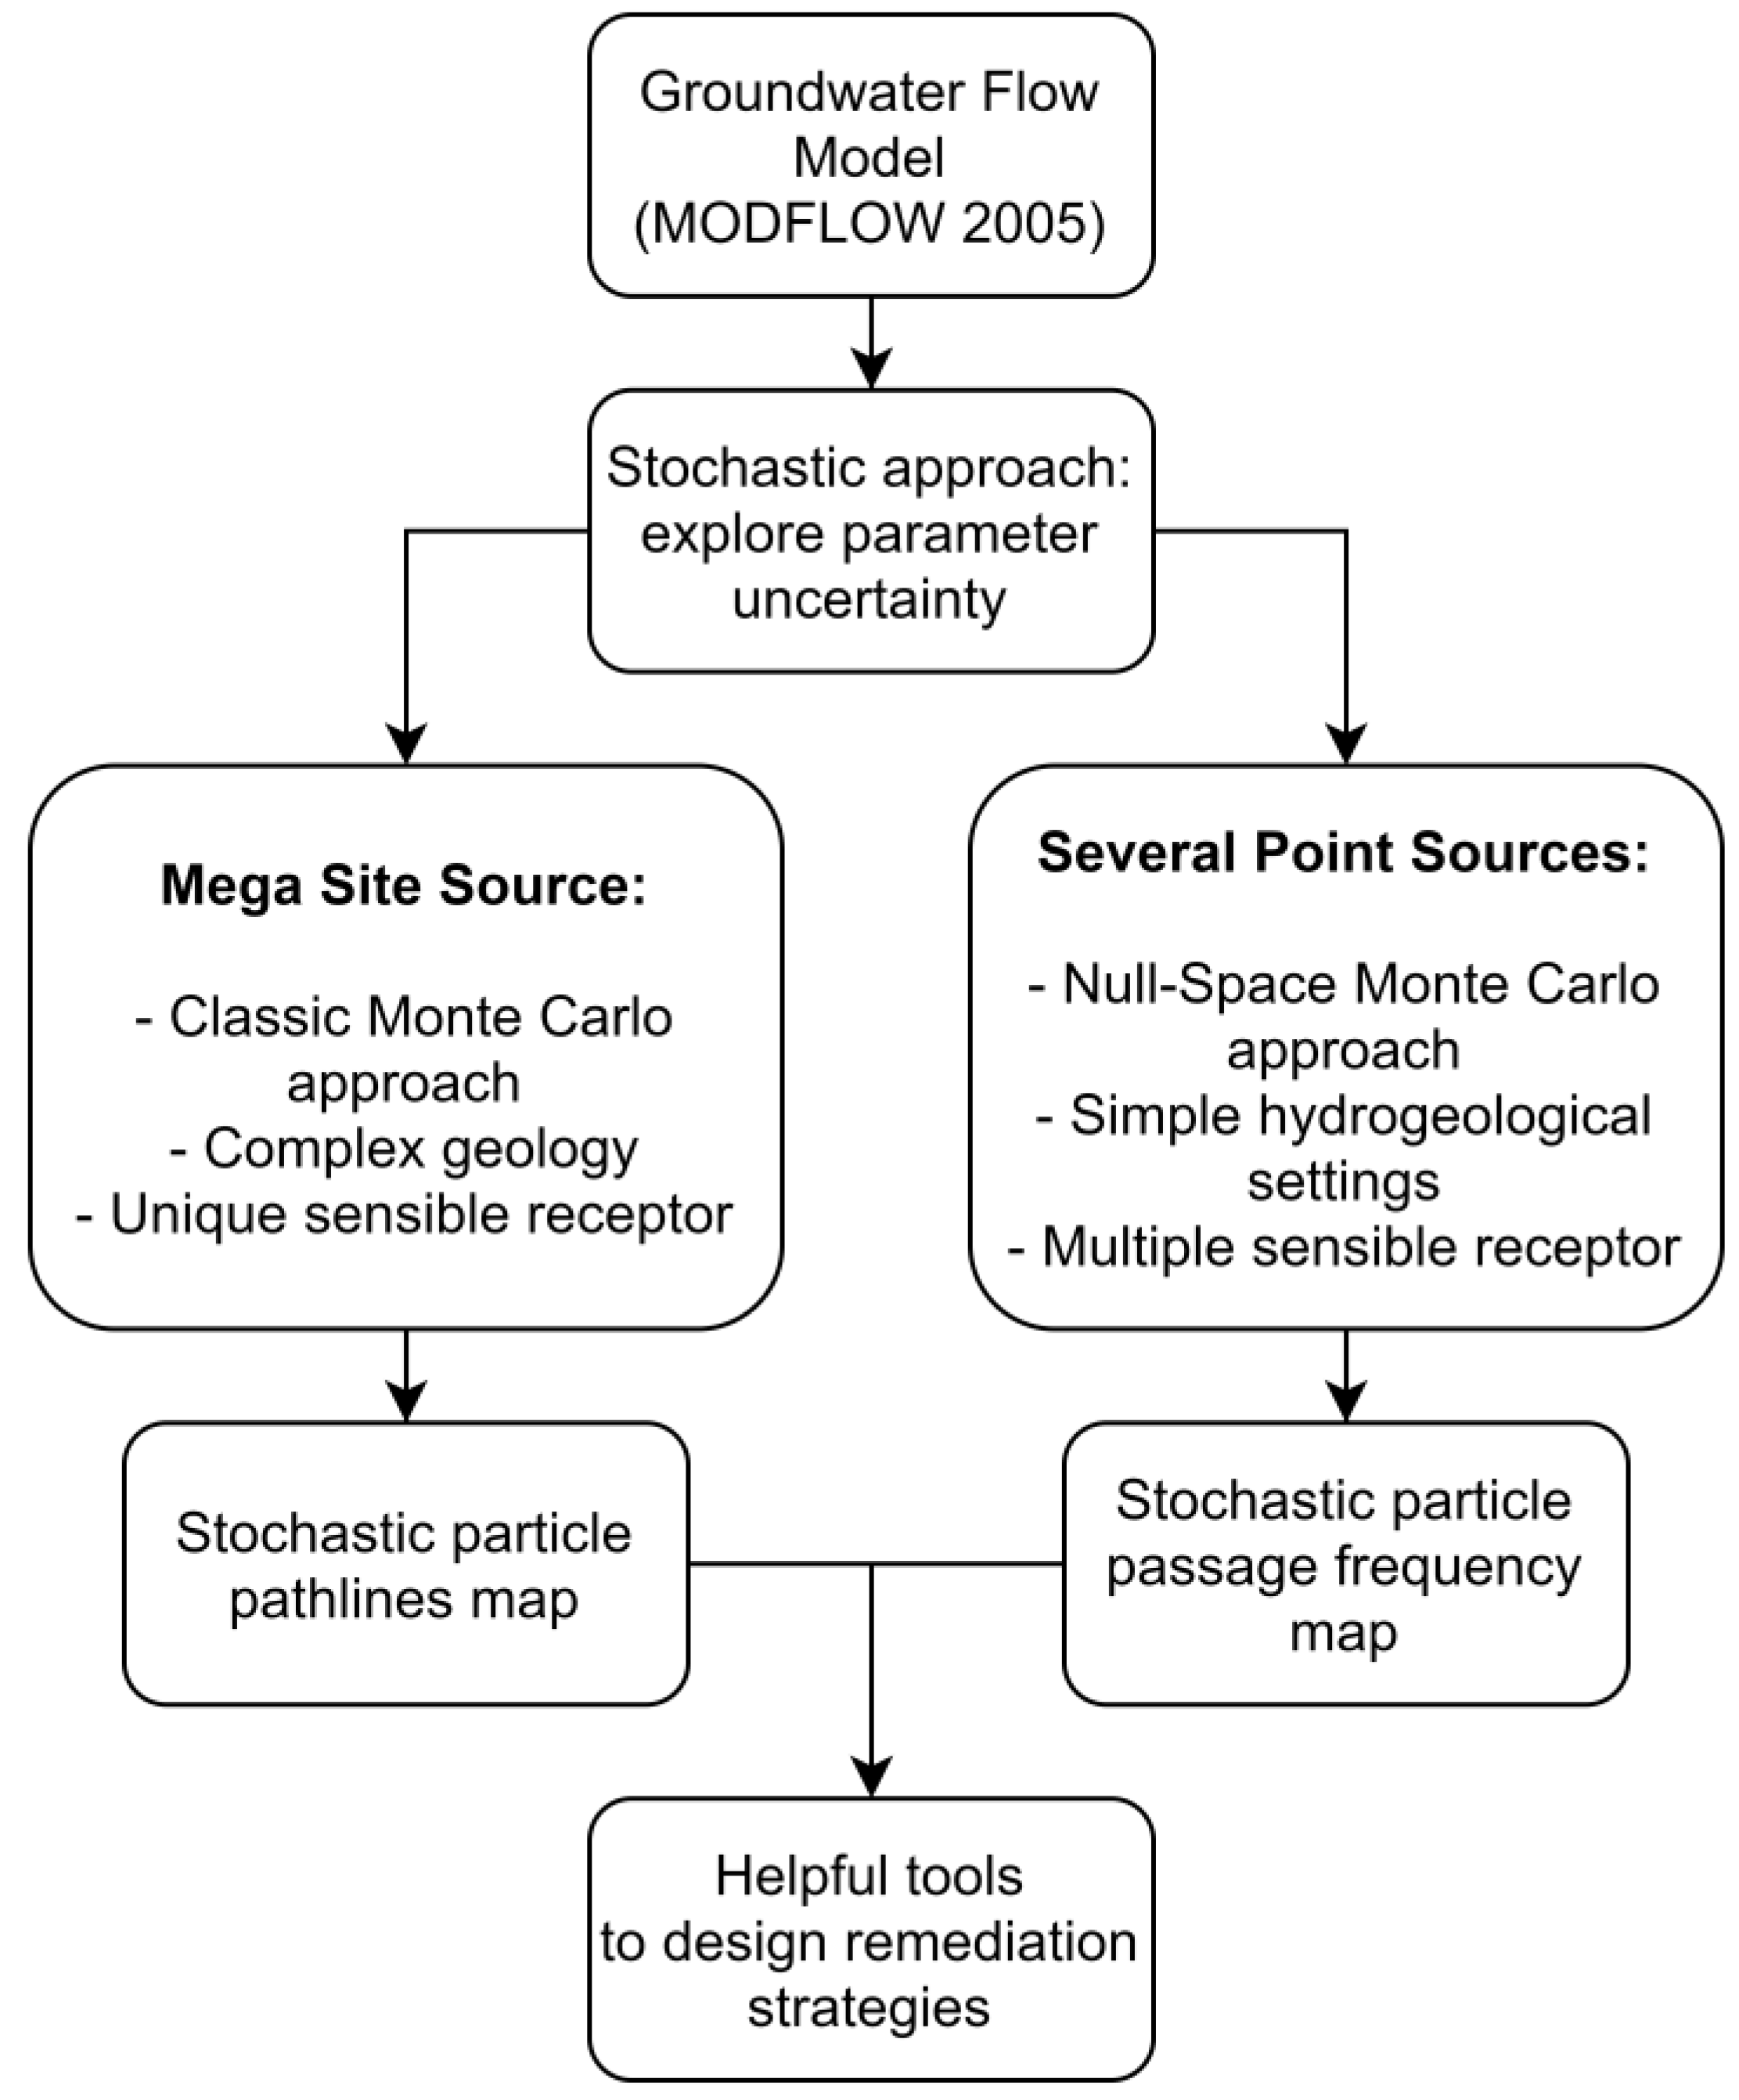
- -
- Large mega sites, which are located in a former industrial and often abandoned sub-region, historically known (sometimes in operation for more than half a century) and whose responsibility to groundwater contamination is well recognized. There are many cases in the literature [11,12,13] where groundwater contamination by chlorinated hydrocarbons (CHCs) or pesticides is a major cause of deteriorating drinking water quality. At a local scale, a mega site can be associated to several PSs but at a regional scale it should be considered as a unique large contaminated area.
- -
- Several point sources, which are corresponding to several industrial sites whose contribution has been discontinuous during time due to different industrial activity (i.e., change of final product, change of use of product). In this case, it is difficult to find the liable part as the contamination spreading from these sites can create a superimposition of different plumes [14,15].
2. Materials and Methods
2.1. Methodology Description: A Decisional Framework to Secure Water Supply Wells
2.2. Site 1 (S1)—Milano FUA: A PT-MC Approach to Assess the Area Involved by Several Point Sources
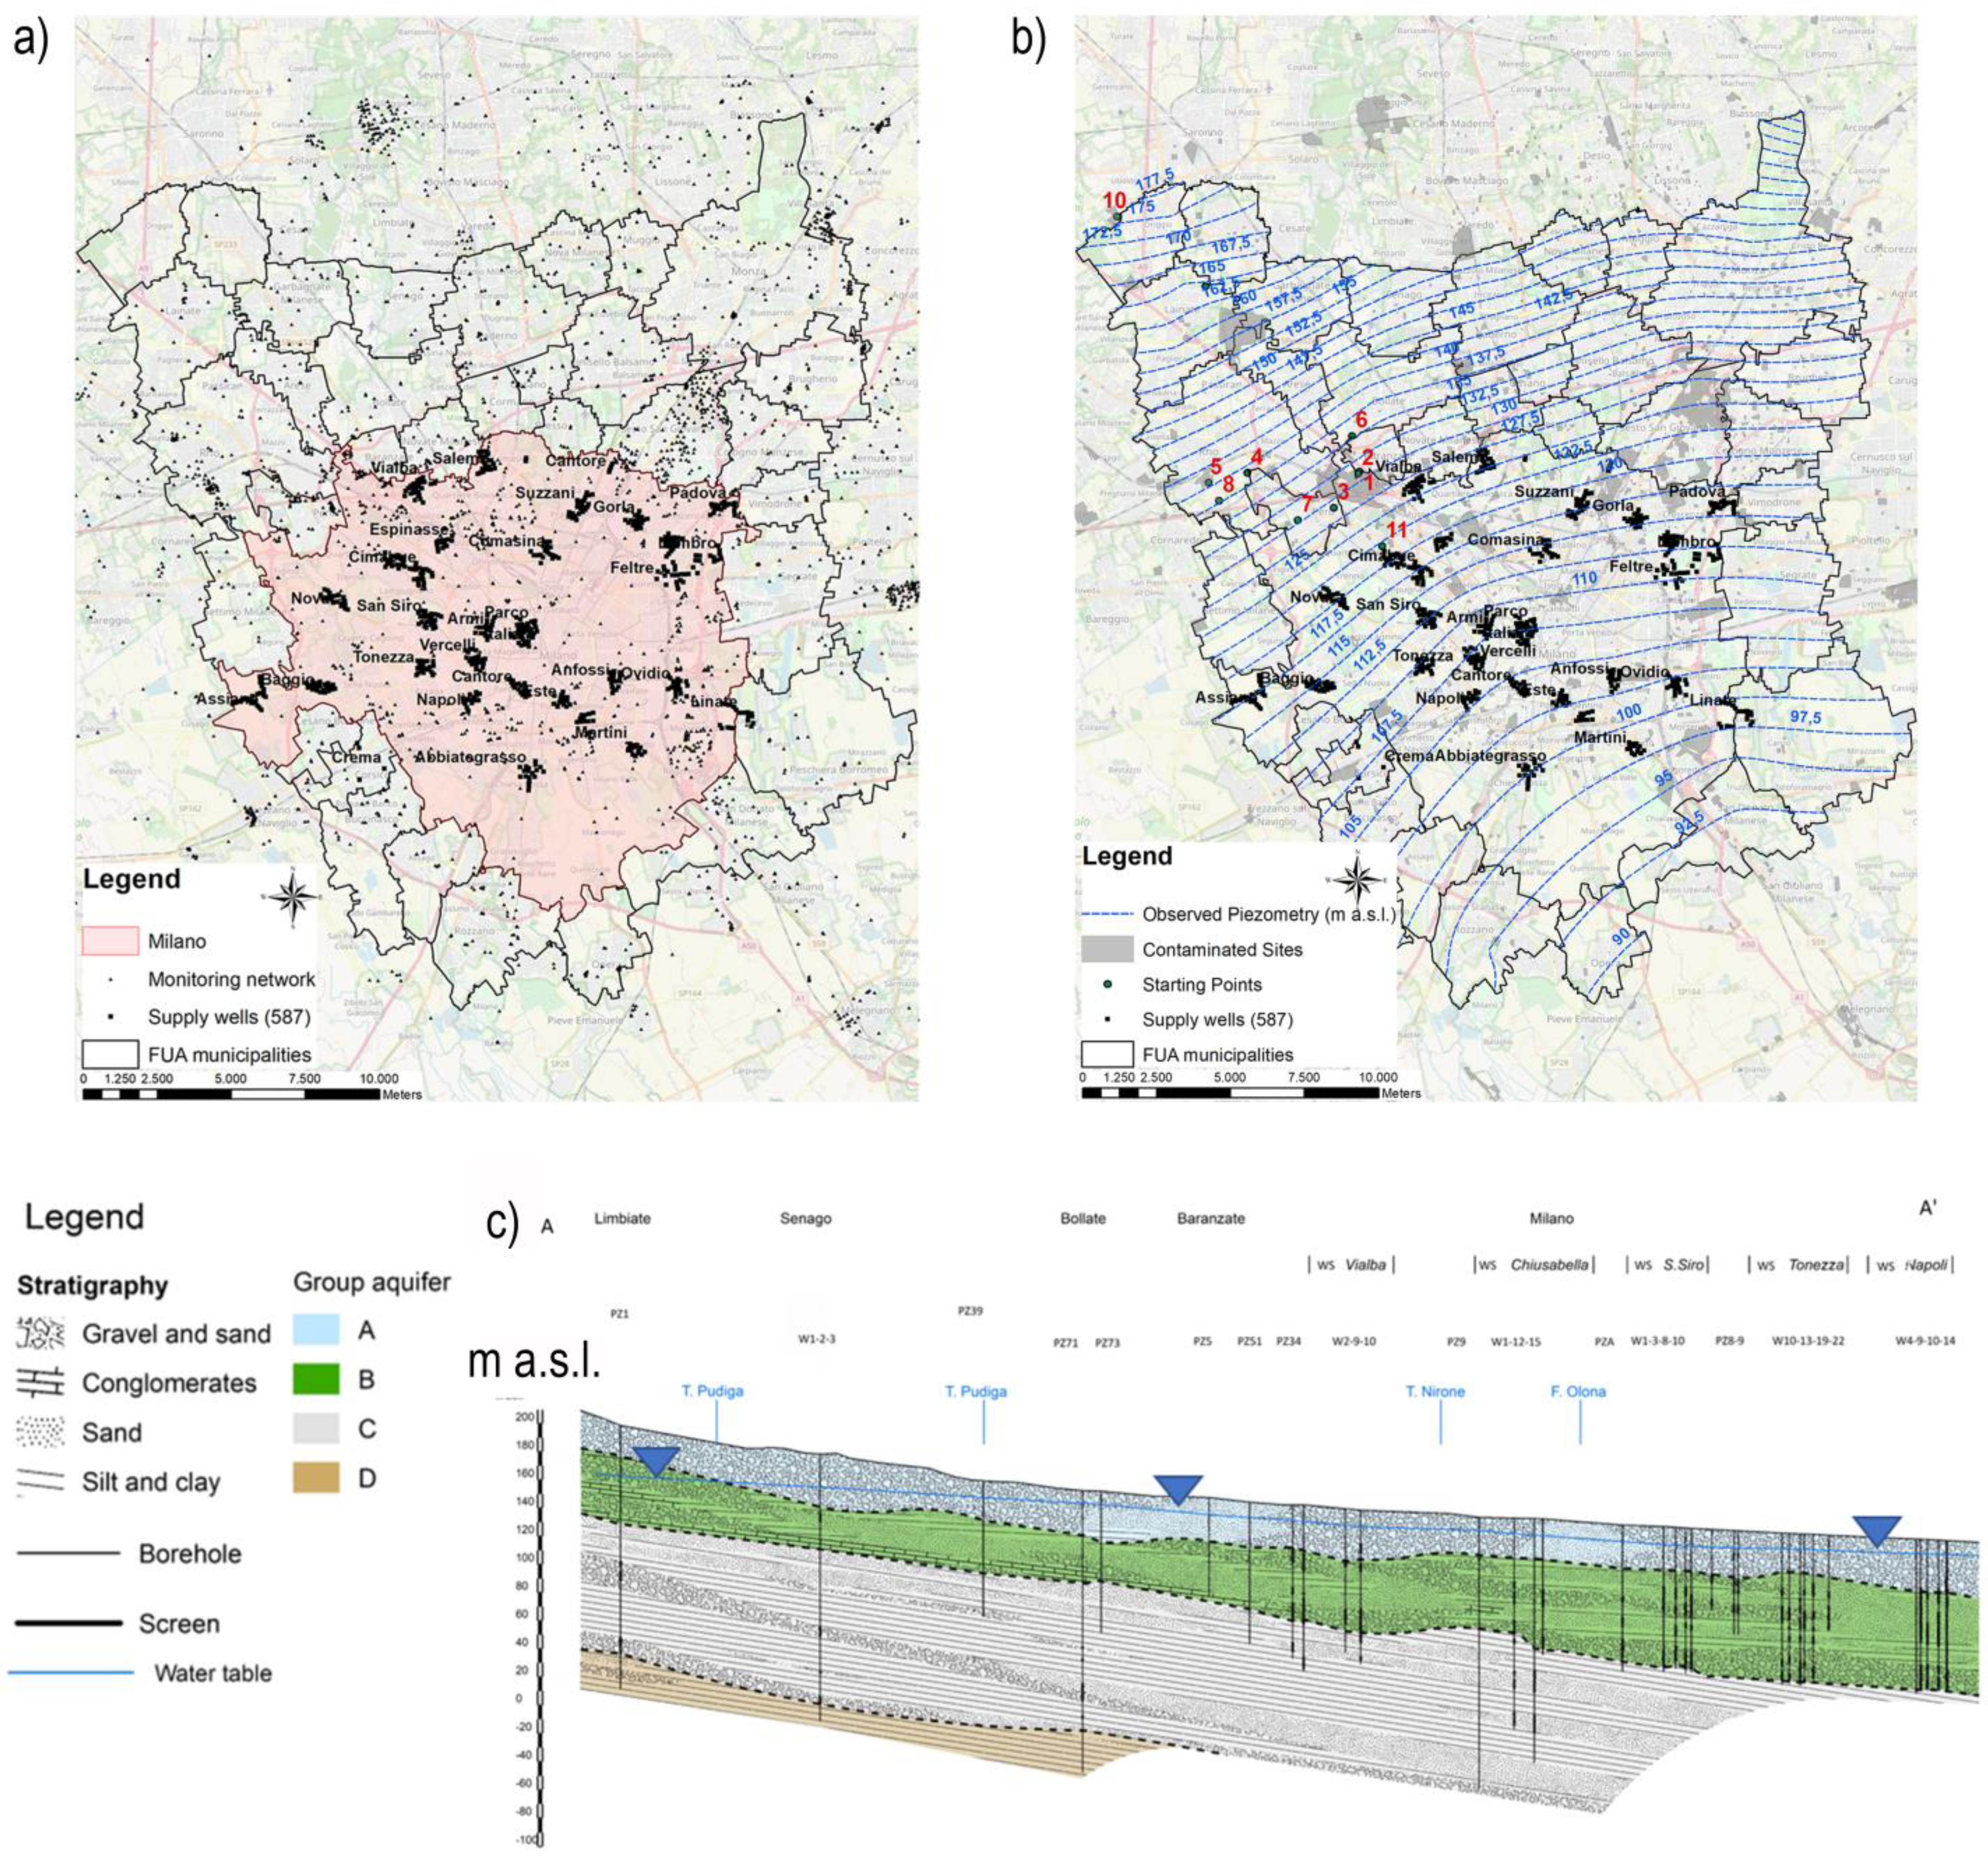
2.2.1. Study Area, Hydrogeology and Conceptual Model
2.2.2. Application of the NSMC Method
Procedure Overview
Stochastic PT Results
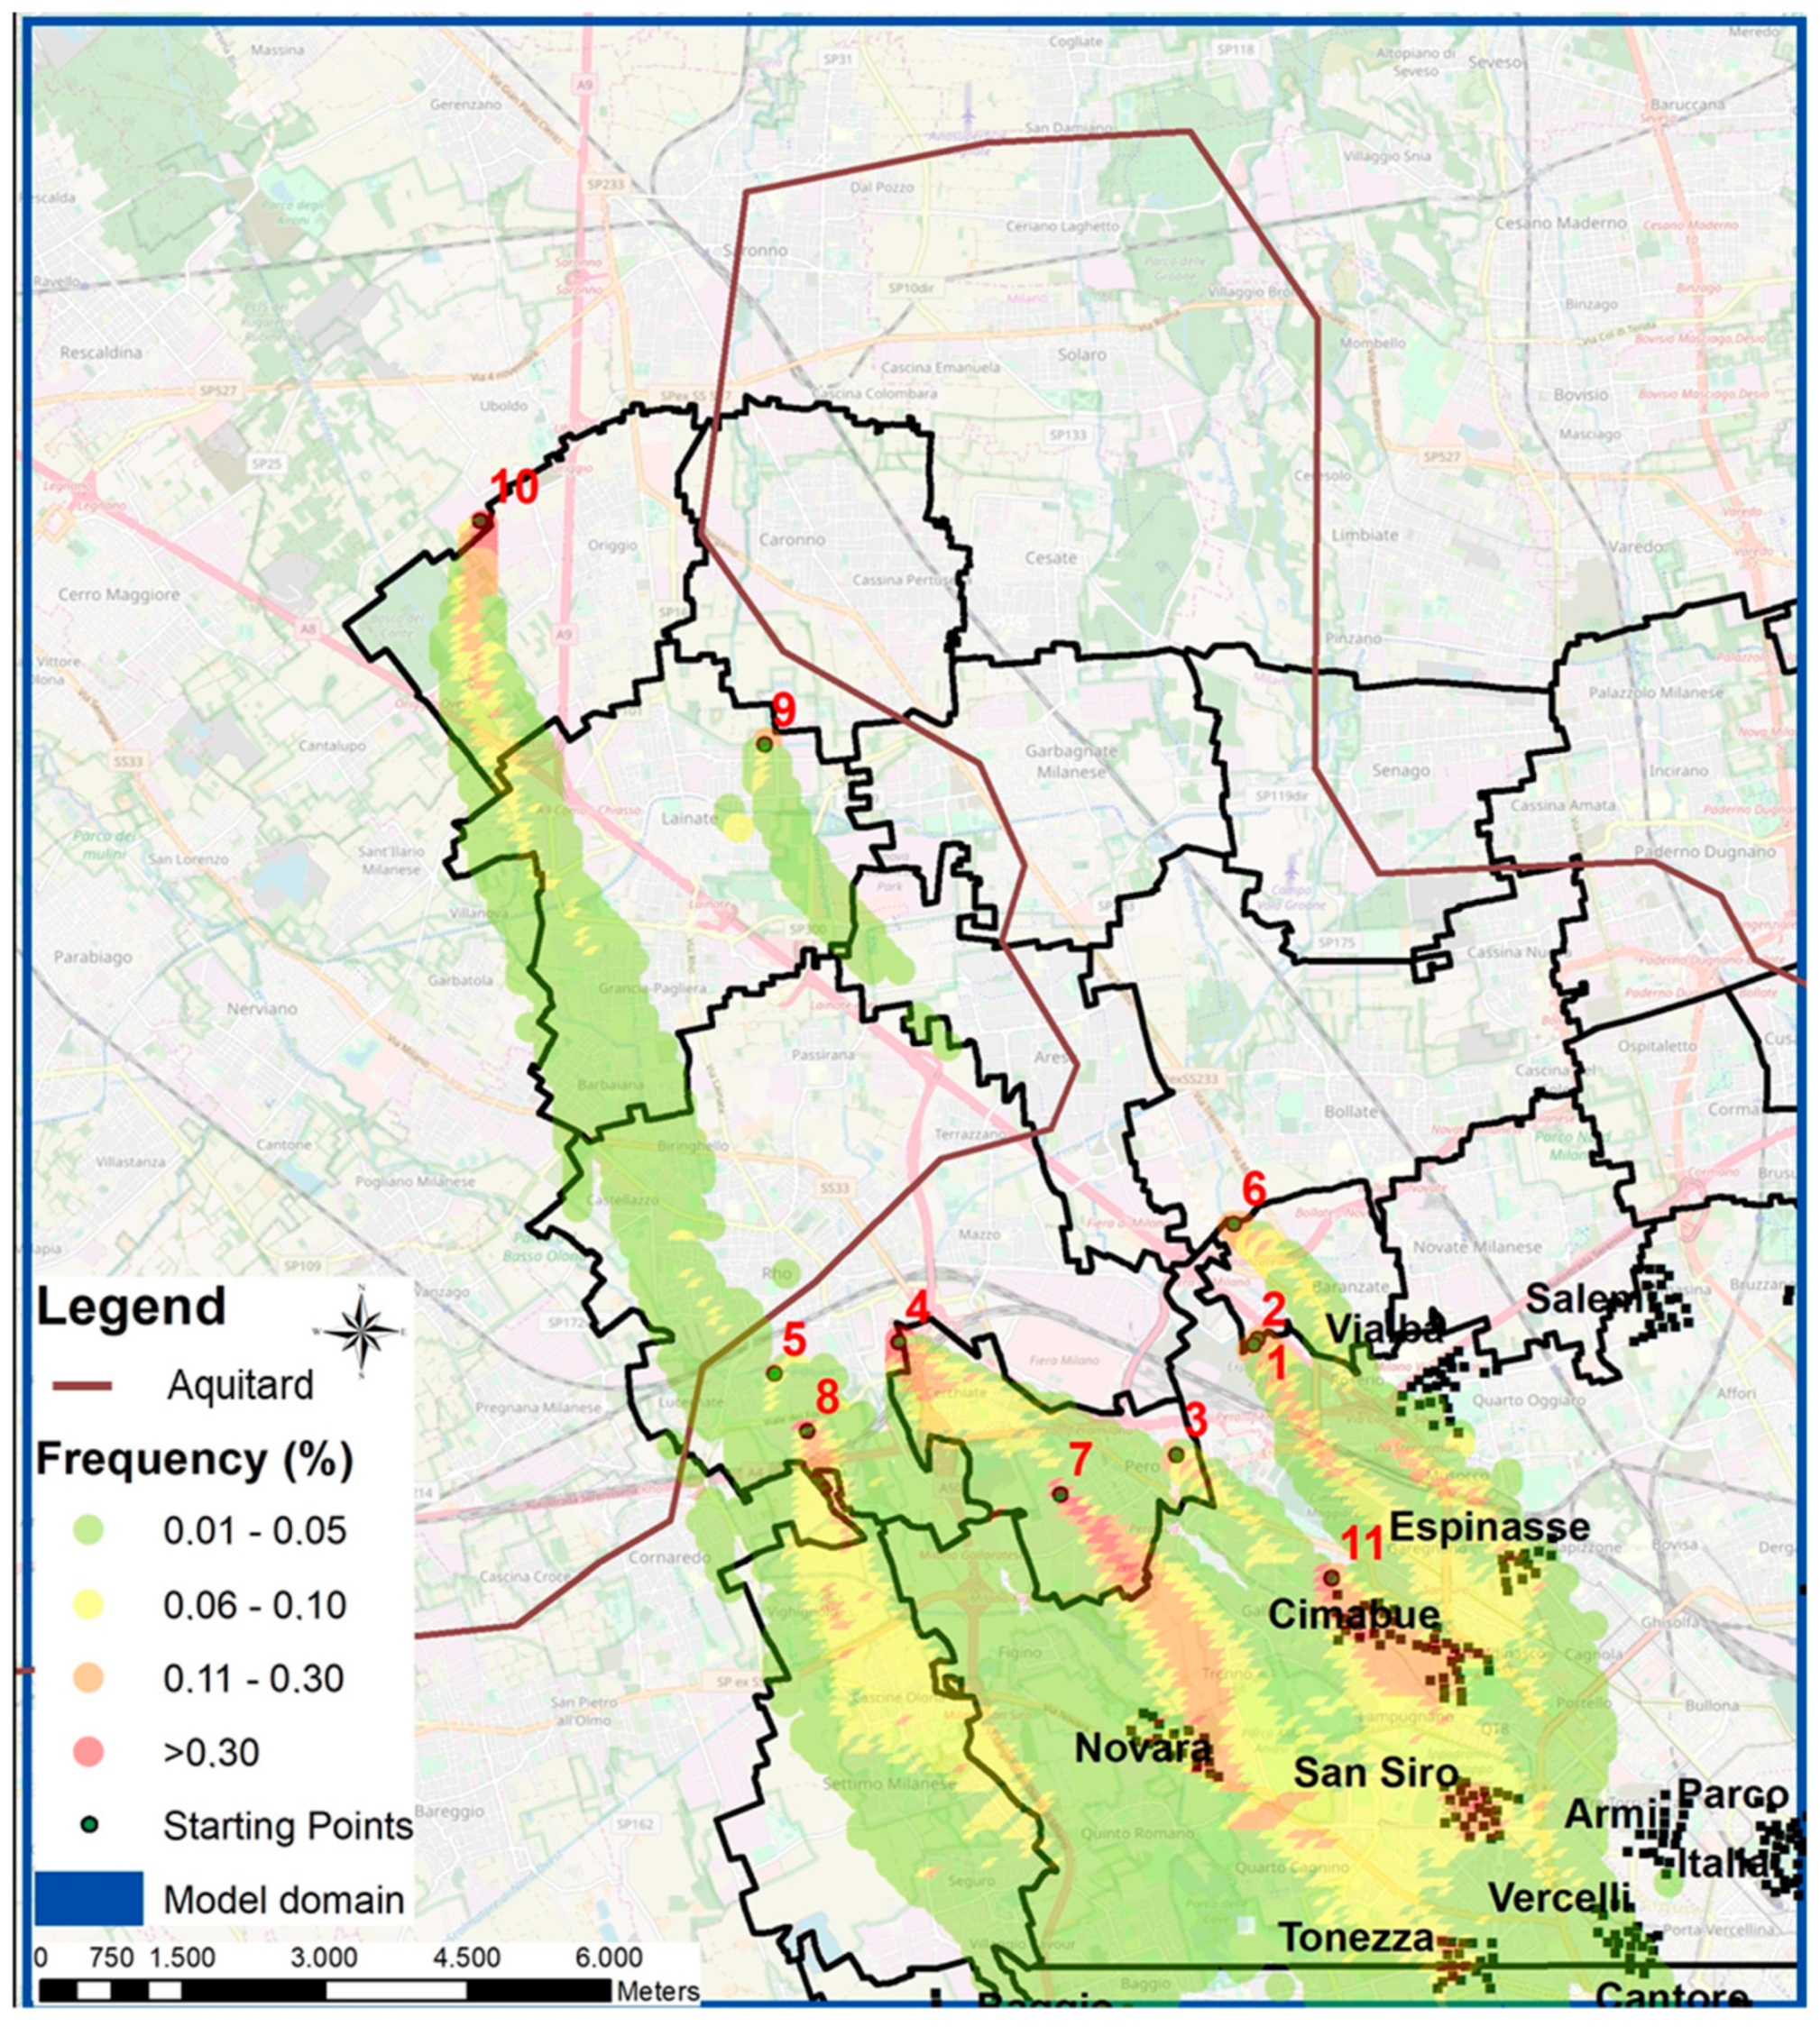
- (1)
- Northern part of Milano: there are 2 suspected sources. Source n°S10 heavily impacts the groundwater within 3 km from it (yellow area), then the impact decreases (with lower, but non-zero probability) but can be still tracked far as 7 km downgradient of the area. On the contrary, source n°S9 has a lower impact and the probability to affect the groundwater downgradient decreases quickly with distance (less than 1% within 3 km).
- (2)
- Municipalities near Milano: the presence of a large industrialized area immediately in the outer border of Milano involved many suspected sources (from n°S3 to n°S8). Sources n°S5 and n°S8 seem to not affect the water supply wells in Milano, as the yellow area (frequency of passage is about 10%, representing the main direction of particles) flows outside the city. The PT coming from sources n°S4 and S7 are superimposed: the probability that contamination coming from them can affect Novara, San Siro and Tonezza pumping stations is not negligible. The main direction of the plume from source n°S3 is towards Cimabue and Chiusabella pumping stations, with a frequency close to 30%. The last source (n°S6) causes a contamination of the very close Vialba pumping station (the yellow area has an extension no more than 2 km from the source), even if the dismissed Espinasse pumping station, closed in the 80’s for the highly contaminated waters, is also interested by the particle arrival.
- (3)
- Milano municipality: some brownfields are located inside the city borders. The source n°S11 highly affects Cimabue pumping station, being just upgradient of this well field. The high frequency of passage (around 30%, orange area) is due to the superimposition with source n°S3, located immediately upgradient outside the city borders. Source n°S1 and S2 may affect both the Cimabue and the dismissed Espinasse Stations with a relatively high frequency (10–20%).
2.3. Site 2 (S2)—Jaworzno FUA: A Deterministic PT Approach to Assess the Area Involved by a “Mega Site” Source
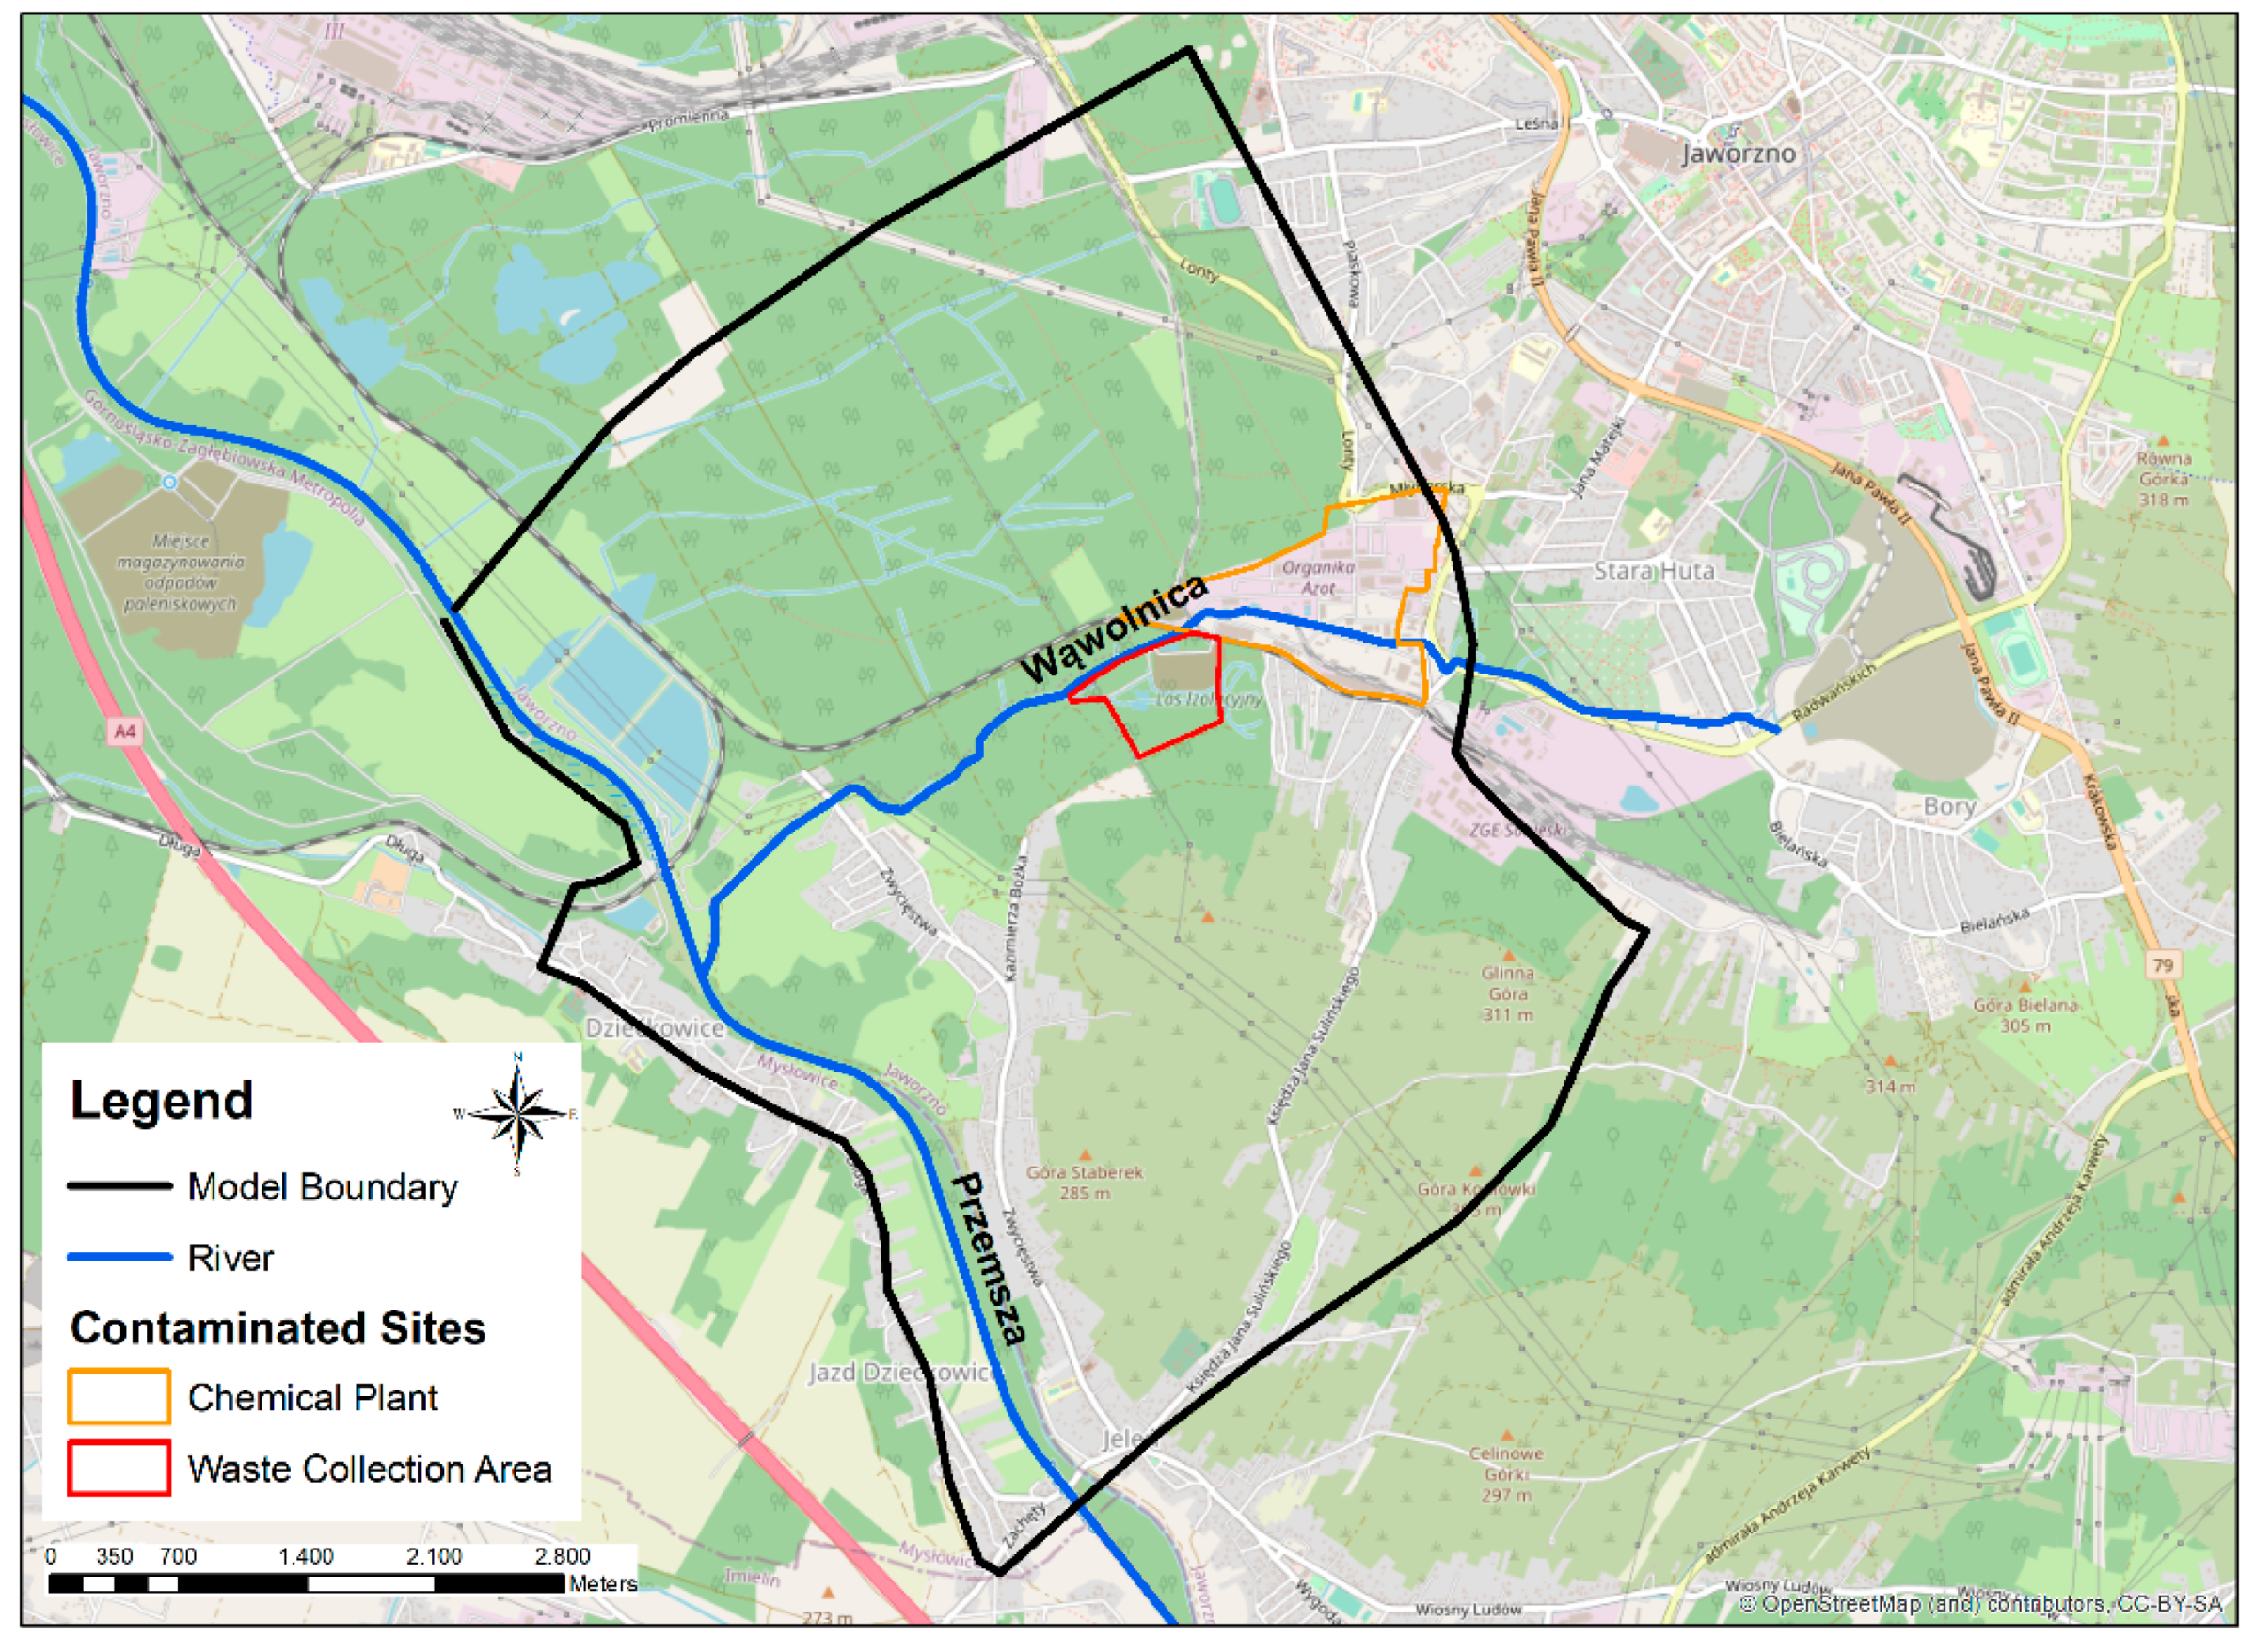
2.3.1. Study Area, Hydrogeology and Conceptual Model
- (1)
- Quaternary valley of Wąwolnica river, starting from the Chemical Plant Organika-AZOT and further downstream to the Przemsza river valley
- (2)
- Triassic hills located south of the Wąwolnica valley
- (3)
- Quaternary valley of Przemsza river, located above and below its confluence with Wąwolnica.
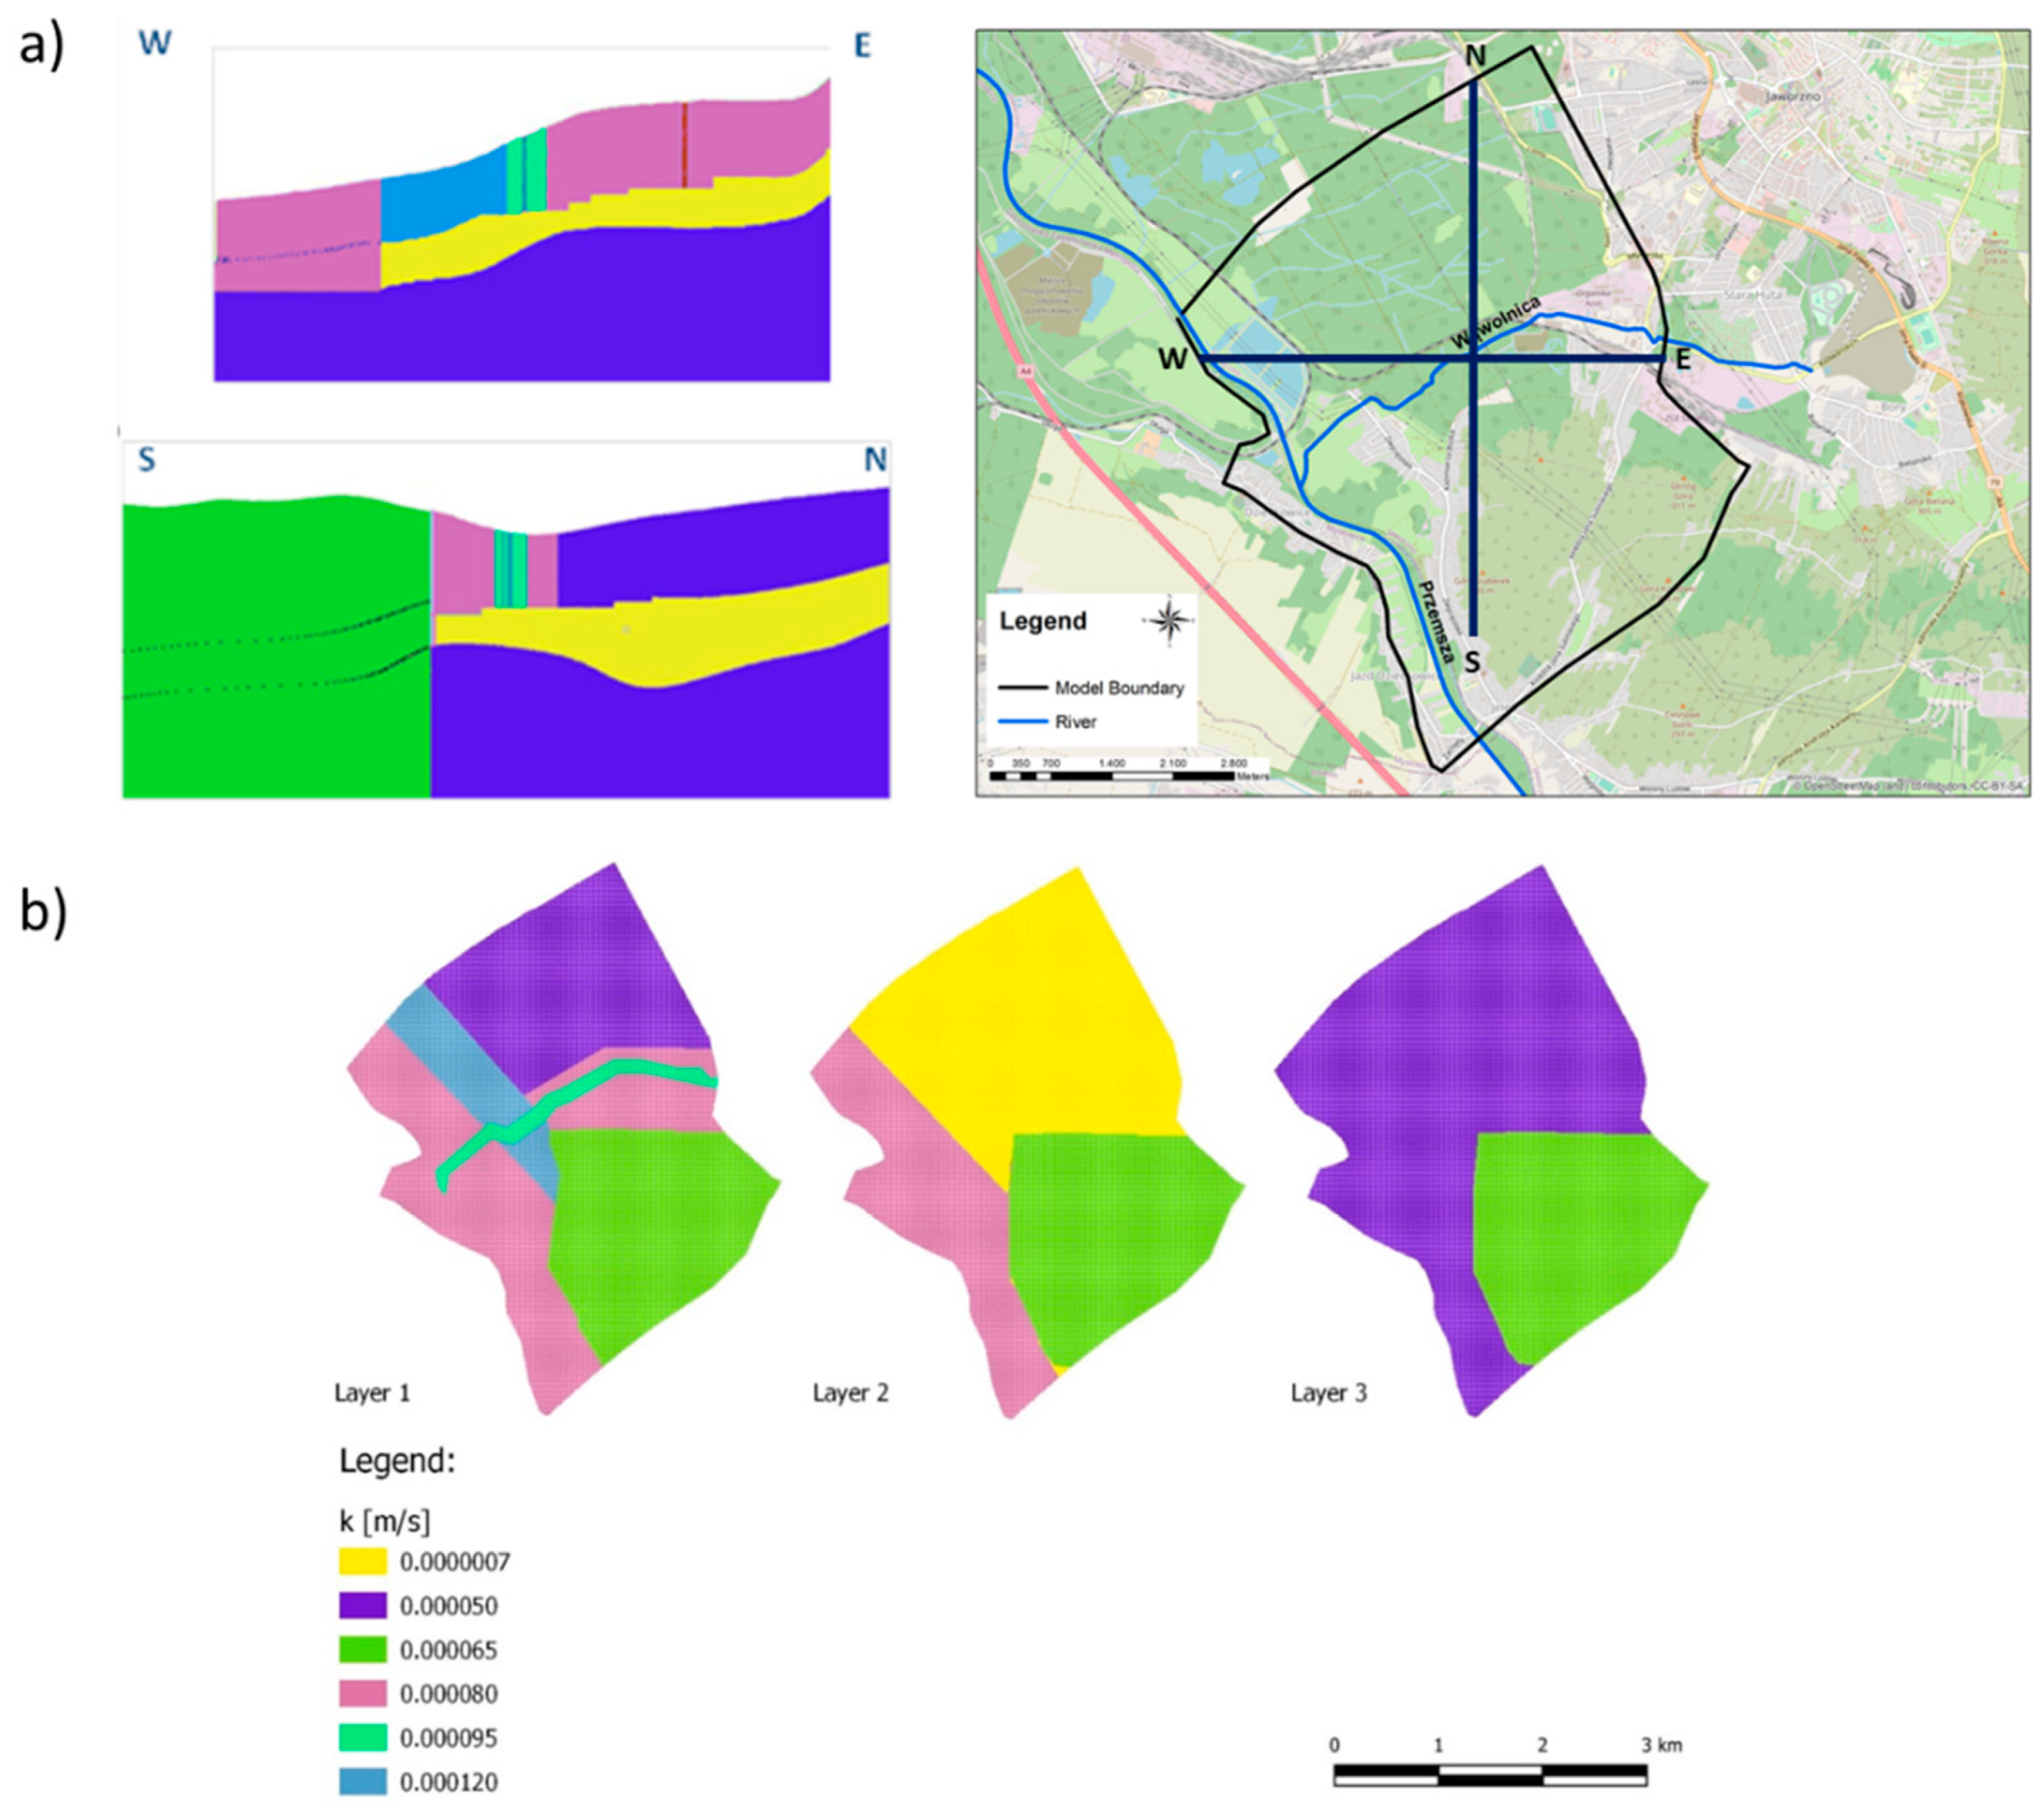
- •
- •
- Neogen—glacifluvial sands and gravels forming Quaternary aquifers interbedded with discontinuous impermeable clay layers–variable thickness, in post-glacial buried valleys up to a few tens of meters (in Figure 6b is represented by various zones of K-field marked by all other colors except green).
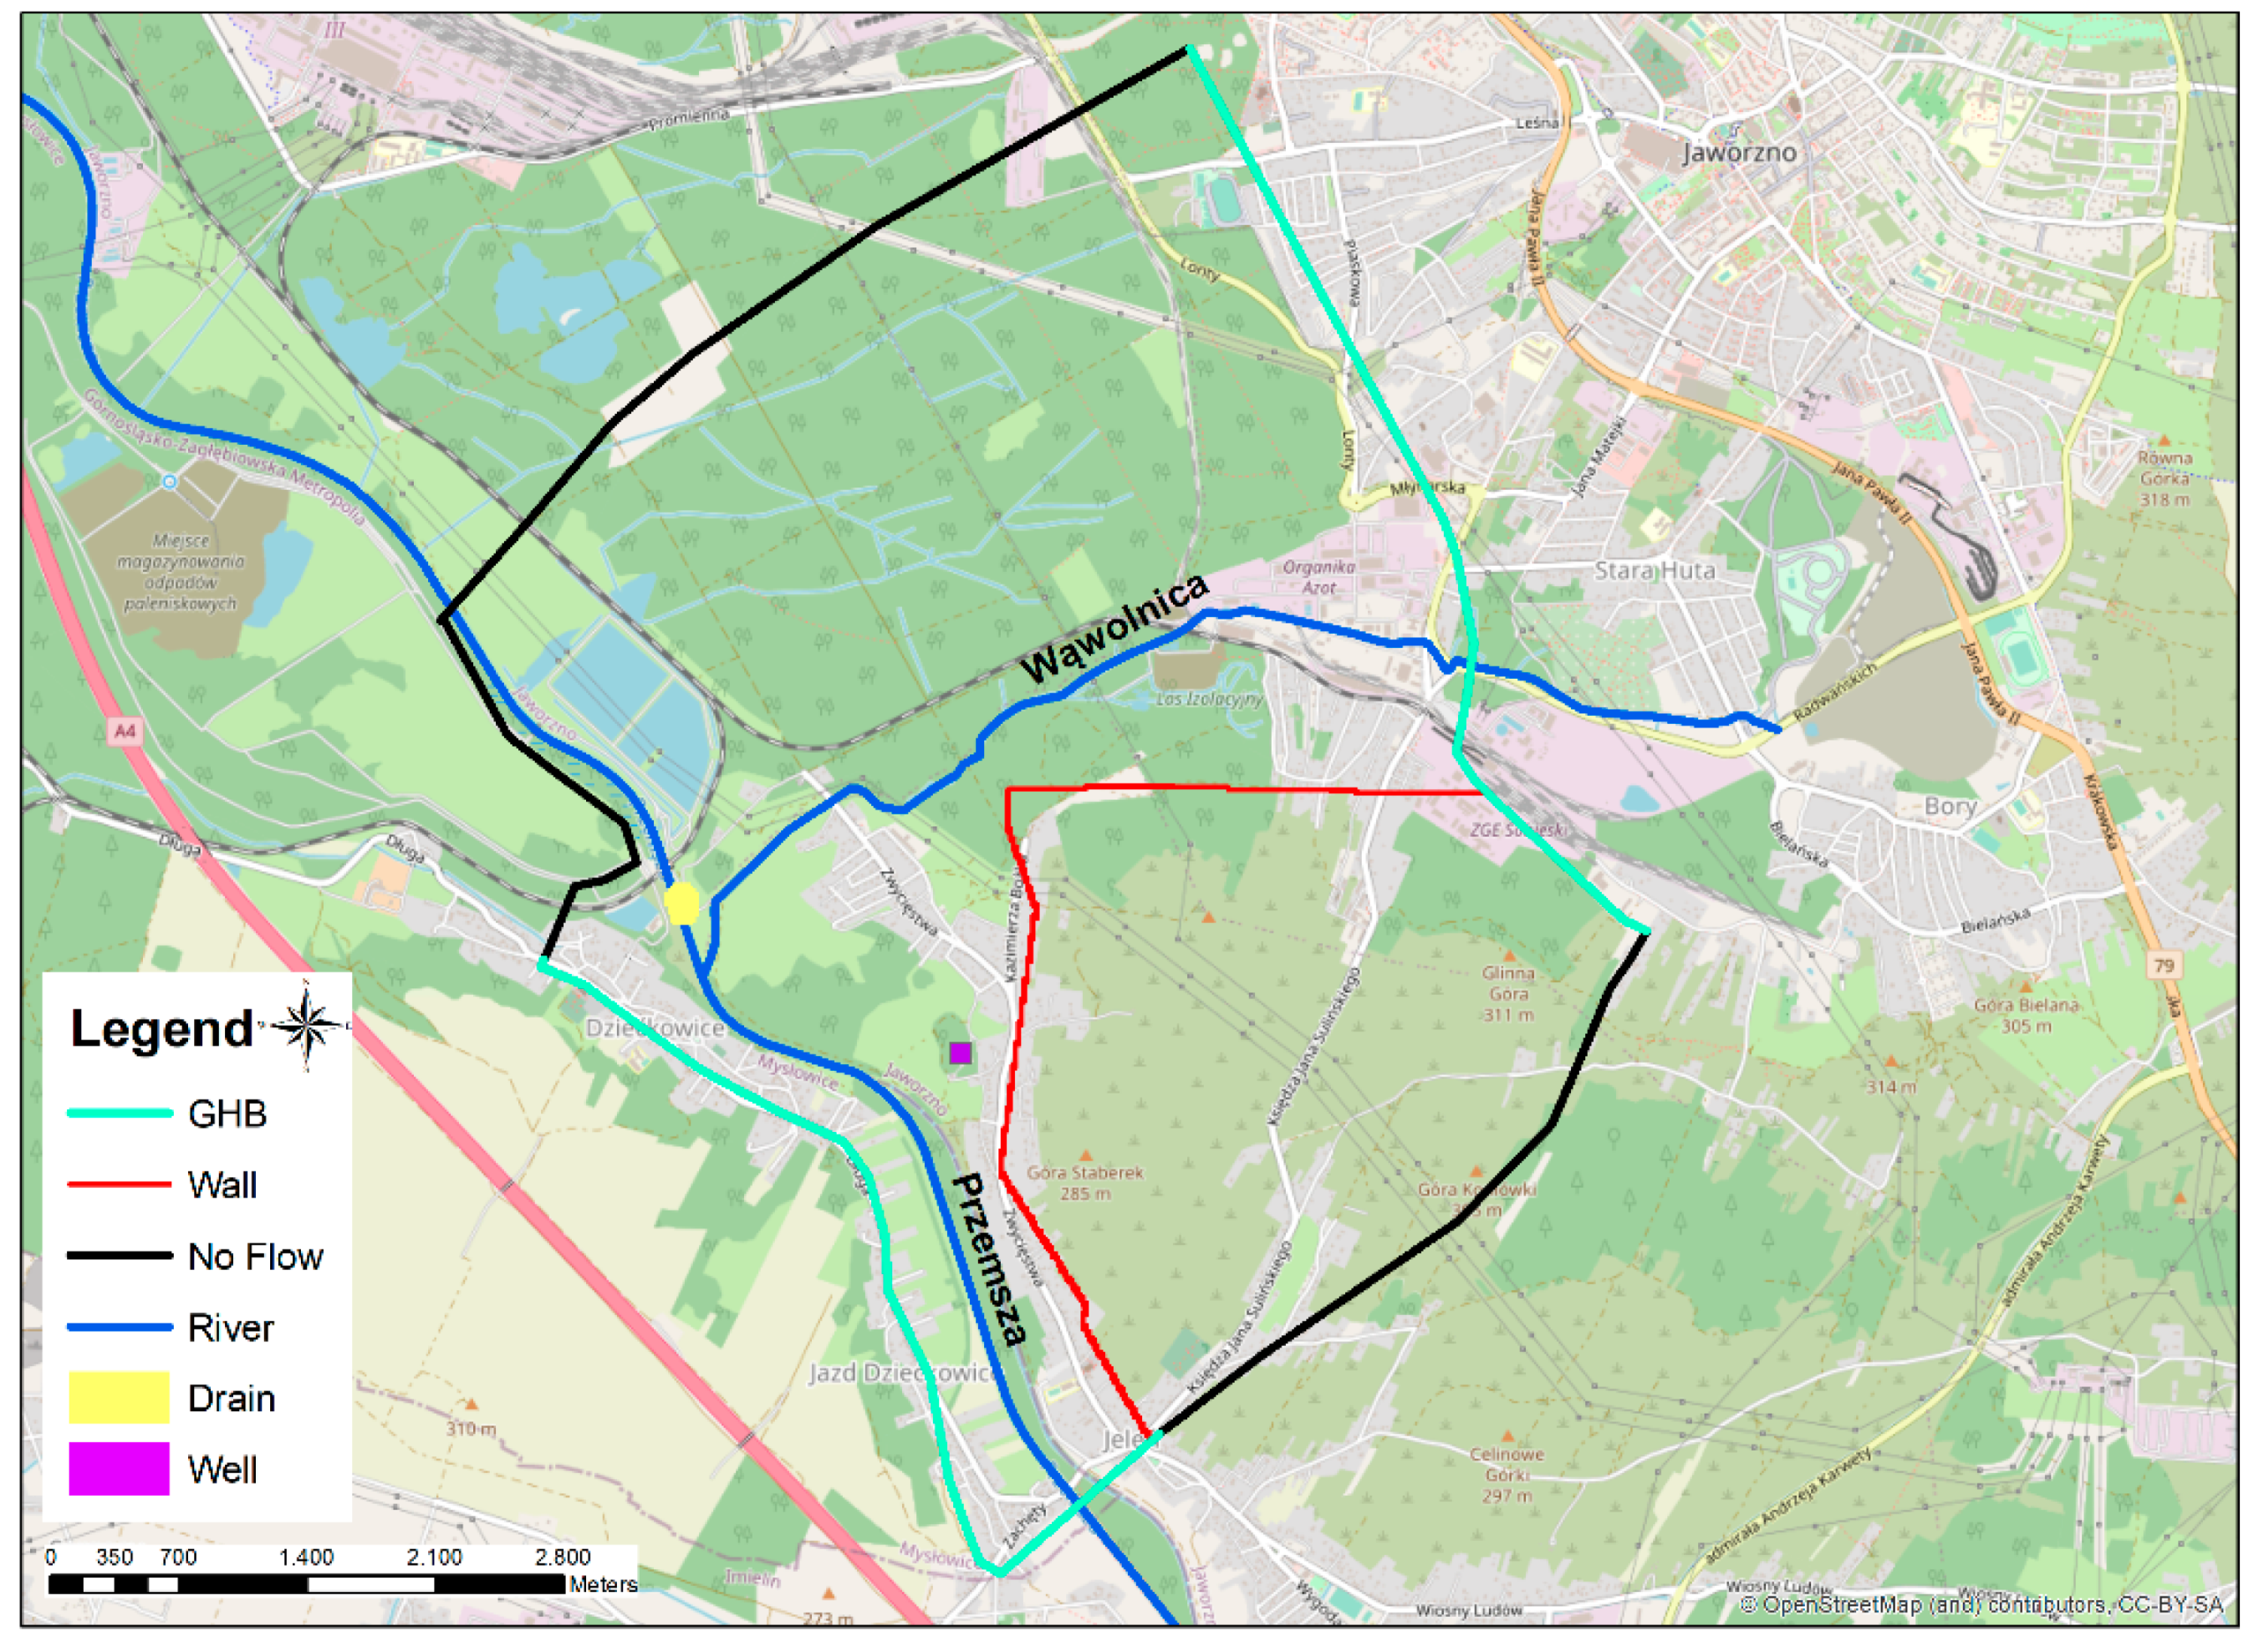
2.3.2. MC PT Procedure and Results
- •
- •
- •
- •
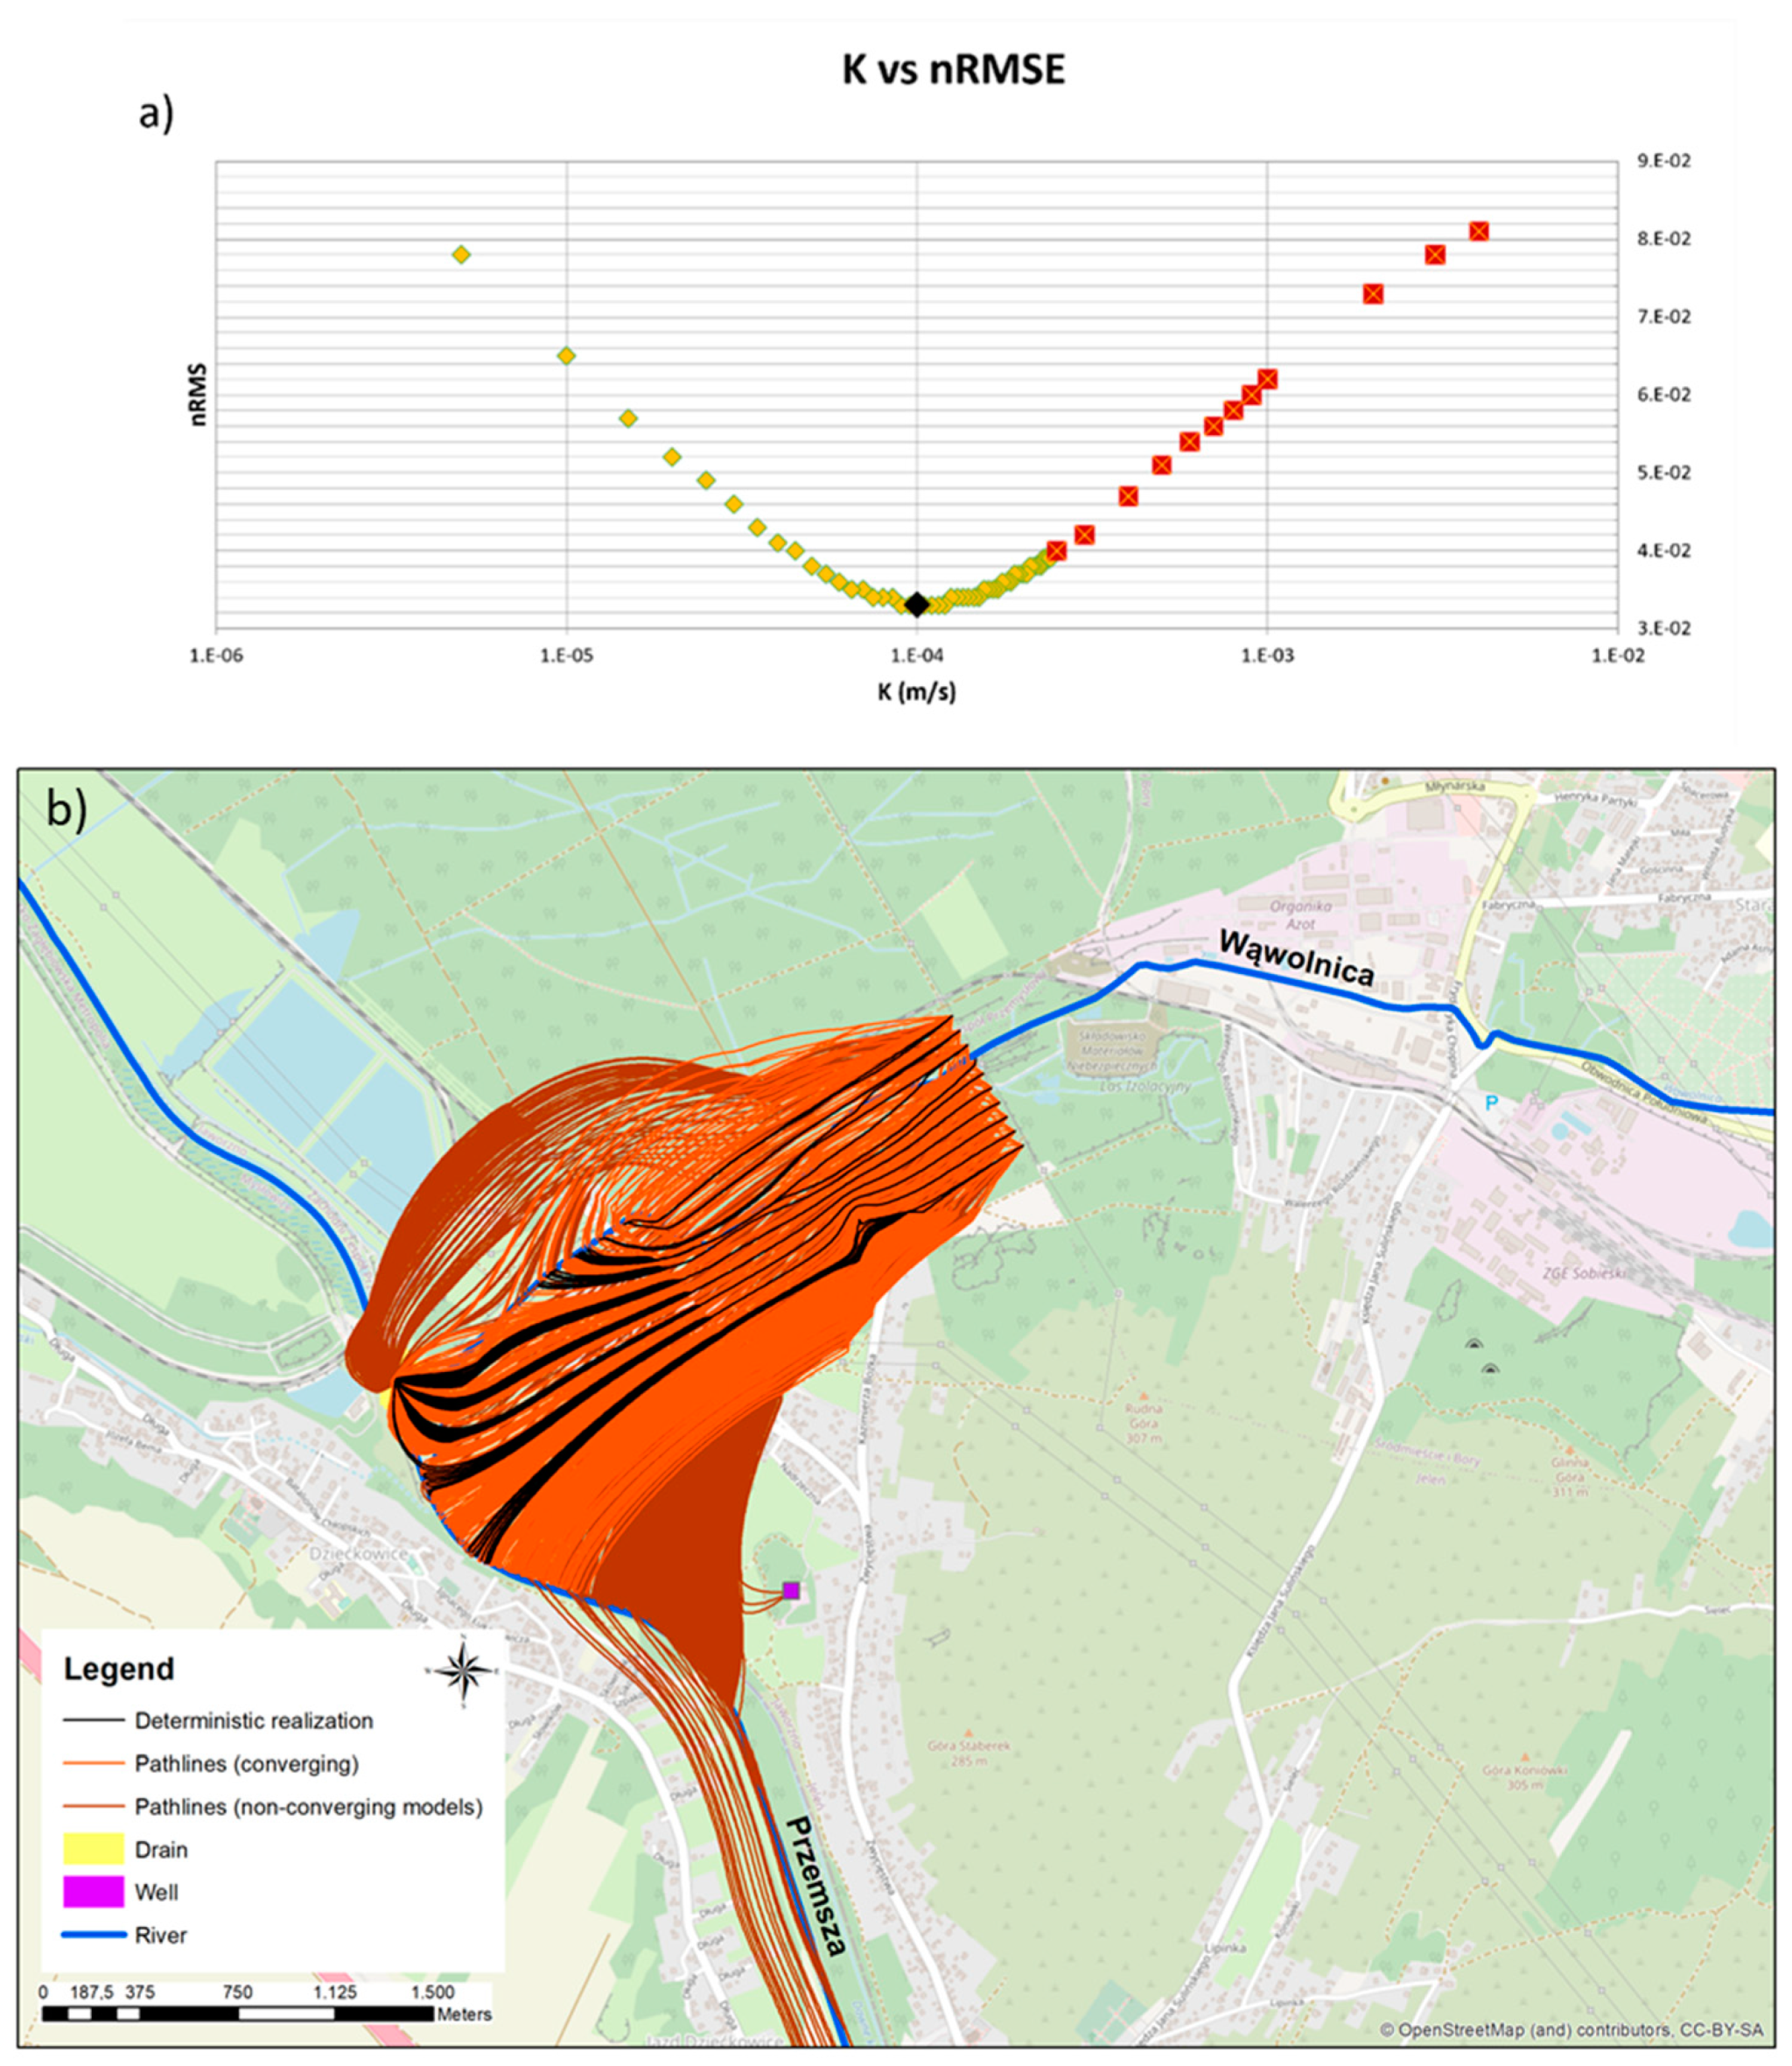
- The Figure 9a presents the normalized root mean square error (nRMSE) for all collected 61 model variants vs the K-field of Quaternary deposits in Przemsza valley downstream the contaminated site. The native model (i.e., the best calibrated model) conductivity value is represented by the black dot in Figure 9a.
3. Discussion and Conclusions
Supplementary Materials
Author Contributions
Funding
Institutional Review Board Statement
Informed Consent Statement
Data Availability Statement
Conflicts of Interest
References
- EU-Directive 2006/118/CE Groundwater Directive 2006/118/CE. Directive of the European Parliament and of the Council on the Protection of Groundwater Against Pollution and Deterioration. Off. J. Eur. Union 2006, 19, 19–31. Available online: http://eur-lex.europa.eu/legal-content/EN/TXT/?uri=CELEX:32006L0118 (accessed on 31 August 2021).
- European Environment Agency. Annual Report 2012 and Environmental Statement 2013; European Environment Agency: København, Denmark, 2013. [Google Scholar]
- Brezzi, M. Redefining “Urban”: A New Way to Measure Metropolitan Areas; OECD Publ.: Paris, France, 2012; Volume 9789264174, ISBN 9789264174108. [Google Scholar]
- Alberti, L.; Colombo, L.; Formentin, G. Null-space Monte Carlo particle tracking to assess groundwater PCE (Tetrachloroethene) diffuse pollution in north-eastern Milan functional urban area. Sci. Total Environ. 2018, 621, 326–339. [Google Scholar] [CrossRef]
- Barilari, A.; Quiroz Londoño, M.; del Paris, M.C.; Lima, M.L.; Massone, H.E. Groundwater contamination from point sources. A hazard index to protect water supply wells in intermediate cities. Groundw. Sustain. Dev. 2020, 10. [Google Scholar] [CrossRef]
- Stefania, G.A.; Rotiroti, M.; Buerge, I.J.; Zanotti, C.; Nava, V.; Leoni, B.; Fumagalli, L.; Bonomi, T. Identification of groundwater pollution sources in a landfill site using artificial sweeteners, multivariate analysis and transport modeling. Waste Manag. 2019. [Google Scholar] [CrossRef]
- Azzellino, A.; Colombo, L.; Lombi, S.; Marchesi, V.; Piana, A.; Merri, A.; Alberti, L. Groundwater diffuse pollution in functional urban areas: The need to define anthropogenic diffuse pollution background levels. Sci. Total Environ. 2019, 656, 1207–1222. [Google Scholar] [CrossRef]
- Alamdar, R.; Kumar, V.; Moghtaderi, T.; Naghibi, S.J. Groundwater quality evaluation of Shiraz City, Iran using multivariate and geostatistical techniques Groundwater quality evaluation of Shiraz City, Iran using multivariate and geostatistical techniques. SN Appl. Sci. 2019. [Google Scholar] [CrossRef] [Green Version]
- Colombo, L.; Alberti, L.; Azzellino, A.; Bellotti, M. Multi-methodological integrated approach for the assessment of diffuse pollution background levels (DPBLs) in functional urban areas: The pce case in milano NW sector. Front. Environ. Sci. 2020, 8. [Google Scholar] [CrossRef]
- Stevenazzi, S.; Masetti, M.; Nghiem, S.V.; Sorichetta, A. Groundwater vulnerability maps derived from a time-dependent method using satellite scatterometer data. Hydrogeol. J. 2015, 23, 631–647. [Google Scholar] [CrossRef]
- Fu, S.; Cheng, H.X.; Liu, Y.H.; Xu, X.B. Levels and distribution of organochlorine pesticides in various media in a mega-city, China. Chemosphere 2009. [Google Scholar] [CrossRef] [PubMed]
- Vijgen, J.; de Borst, B.; Weber, R.; Stobiecki, T.; Forter, M. HCH and lindane contaminated sites: European and global need for a permanent solution for a long-time neglected issue. Environ. Pollut. 2019. [Google Scholar] [CrossRef] [PubMed]
- Filippini, M.; Parker, B.L.; Dinelli, E.; Wanner, P.; Chapman, S.W.; Gargini, A. Assessing aquitard integrity in a complex aquifer – aquitard system contaminated by chlorinated hydrocarbons. Water Res. 2020. [Google Scholar] [CrossRef] [PubMed]
- Alderuccio, M.; Cantarella, L.; Ostoich, M.; Ciuffi, P.; Gattolin, M.; Tomiato, L.; Zambon, M. Identification of the operator responsible for the remediation of a contaminated site. Environ. Forensics 2019. [Google Scholar] [CrossRef]
- Ostoich, M.; Mason, L.; Gattolin, M.; Alderuccio, M.; Cantarella, L.; Cavinato, C.; Tomiato, L.; Zambon, M. Contamination of groundwater: Obligations of non-responsible parties. Environ. Forensics 2019, 20, 316–338. [Google Scholar] [CrossRef]
- Alberti, L.; Colombo, L.; Formentin, G.; Oberto, G. Assessment of sources of PCE contamination in groundwater using a Monte Carlo method in the Functional Urban Area of Milano. Rend. Online Soc. Geol. Ital. 2017, 42, 62–65. [Google Scholar] [CrossRef]
- Moeck, C.; Molson, J.; Schirmer, M. Pathline Density Distributions in a Null-Space Monte Carlo Approach to Assess Groundwater Pathways. Groundwater 2020. [Google Scholar] [CrossRef] [PubMed]
- Colombo, L.; Alberti, L.; Mazzon, P.; Antelmi, M. Null-Space Monte Carlo Particle Backtracking to Identify Groundwater Tetrachloroethylene Sources. Front. Environ. Sci. 2020, 8. [Google Scholar] [CrossRef]
- Harbaugh, A.W. MODFLOW-2005, The U.S. Geological Survey Modular GROUND-Water Model—The Ground-Water Flow Process; US Geological Survey: Reston, Virginia, USA, 2005. [Google Scholar]
- Pollock, D.W. User Guide for MODPATH Version 6—A Particle-Tracking Model for MODFLOW. U.S. Geological Survey, Techniques and Methods 6-A41; US Geological Survey: Reston, Virginia, USA, 2012. [Google Scholar]
- Troldborg, M.; Nowak, W.; Tuxen, N.; Bjerg, P.L.; Helmig, R.; Binning, P.J. Uncertainty evaluation of mass discharge estimates from a contaminated site using a fully Bayesian framework. Water Resour. Res. 2010, 46. [Google Scholar] [CrossRef]
- Kunstmann, H.; Kastens, M. Determination of stochastic well head protection zones by direct propagation of uncertainties of particle tracks. J. Hydrol. 2006. [Google Scholar] [CrossRef]
- Butera, I.; Tanda, M.G.; Zanini, A. Use of numerical modelling to identify the transfer function and application to the geostatistical procedure in the solution of inverse problems in groundwater. J. Inverse Ill-Posed Probl. 2006, 14, 547–572. [Google Scholar] [CrossRef]
- Cupola, F.; Tanda, M.G.; Zanini, A. Contaminant release history identification in 2-D heterogeneous aquifers through a minimum relative entropy approach. Springerplus 2015, 4, 1–19. [Google Scholar] [CrossRef] [Green Version]
- Anderson, M.P.; Woessner, W.W.; Hunt, R.J. Applied Groundwater Modeling (Second Edition). In Applied Groundwater Modeling, 2nd ed.; Anderson, M.P., Woessner, W.W., Hunt, R.J., Eds.; Academic Press: San Diego, CA, USA, 2015; p. lxiii. ISBN 978-0-12-058103-0. [Google Scholar]
- Colombo, L.; Alberti, L.; Mazzon, P.; Formentin, G. Transient flow and transport modelling of an historical CHC source in North-West Milano. Water 2019, 11, 1745. [Google Scholar] [CrossRef] [Green Version]
- Stefania, G.A.; Rotiroti, M.; Fumagalli, L.; Zanotti, C.; Bonomi, T. Numerical modeling of remediation scenarios of a groundwater Cr(VI) plume in an alpine valley aquifer. Geosciences 2018, 8, 209. [Google Scholar] [CrossRef] [Green Version]
- Sikdar, P.K.; Ghosal, U.; Chakraborty, S. Groundwater modeling to understand the impact of pumping in the deep Late Pleistocene aquifers of the western Bengal Basin on arsenic migration. Arab. J. Geosci. 2018. [Google Scholar] [CrossRef]
- Doherty, J.; Brebber, L.; Whyte, P. PEST: Model-independent parameter estimation. Watermark Comput. Corinda Aust. 2005, 2005, 122. [Google Scholar] [CrossRef]
- Herckenrath, D.; Langevin, C.D.; Doherty, J. Predictive uncertainty analysis of a saltwater intrusion model using null-space Monte Carlo. Water Resour. Res. 2011, 47. [Google Scholar] [CrossRef]
- Frind, E.O.; Molson, J.W. Issues and Options in the Delineation of Well Capture Zones under Uncertainty. Groundwater 2018. [Google Scholar] [CrossRef]
- Formentin, G.; Rigamonti, D.S.; Francioli, A.; Terrenghi, J.; Giambelli, G.; Bonfanti, M. Modello stocastico per il barrieramento idraulico basato su metodi sostenibili per il calcolo dei parametri idrodinamici. Rend. Online Soc. Geol. Ital. 2019. [Google Scholar] [CrossRef]
- Bini, A. L’apparato Glaciale Wurmiano di Como. Unpublished. Ph.D. Thesis, University of Milan, Milan, Italy, 1987. [Google Scholar]
- Carcano, C.; Piccin, A. Padans Aquifer Geology of the Lombardy Plain; SELCA: Firenze, Italy, 2002. [Google Scholar]
- Francani, V.; Beretta, G. Pietro Preliminary Survey about Sustainable Use of Deeper Groundwater in Milano Province; CAP: Milan, Italy, 1995. [Google Scholar]
- Pedretti, D.; Masetti, M.; Beretta, G.P.; Vitiello, M. A revised conceptual model to reproduce the distribution of chlorinated solvents in the Rho Aquifer (Italy). Groundw. Monit. Remediat. 2013. [Google Scholar] [CrossRef]
- Alberti, L.; Francani, V. Studio idrogeologico sulle cause del sollevamento della falda nell’area milanese. Geoing. Ambient. Min. 2001, 104, 257–264. [Google Scholar]
- Alberti, L.; Cantone, M.; Colombo, L.; Lombi, S.; Piana, A. Numerical modeling of regional groundwater flow in the Adda-Ticino Basin: Advances and new results. Rend. Online Soc. Geol. Ital. 2016, 41. [Google Scholar] [CrossRef]
- Alberti, L.; Azzellino, A.; Colombo, L.; Lombi, S. Use of cluster analysis to identify tetrachloroethylene pollution hotspots for the transport numerical model implementation in urban functional area of Milan, Italy. In Proceedings of the International Multidisciplinary Scientific GeoConference Surveying Geology and Mining Ecology Management, SGEM, Albena, Bulgaria, 30 June–6 July 2016; Volume 1, pp. 723–730. [Google Scholar]
- Tonkin, M.; Doherty, J. Calibration-constrained Monte Carlo analysis of highly parameterized models using subspace techniques. Water Resour. Res. 2009, 45. [Google Scholar] [CrossRef] [Green Version]
- Doherty, J. Ground water model calibration using pilot points and regularization. Ground Water 2003, 41, 170–177. [Google Scholar] [CrossRef]
- Motyka, J. A conceptual model of hydraulic networks in carbonate rocks, illustrated by examples from Poland. Hydrogeol. J. 1998. [Google Scholar] [CrossRef]
- Kowalczyk, A.; Witkowski, A.J. Groundwater recharge of carbonate aquifers of the Silesian-Cracow Triassic (southern Poland) under human impact. Environ. Geol. 2008. [Google Scholar] [CrossRef]
- Gzyl, G.; Zanini, A.; Fra̧czek, R.; Kura, K. Contaminant source and release history identification in groundwater: A multi-step approach. J. Contam. Hydrol. 2014. [Google Scholar] [CrossRef]
- Anderson, M.P.; Woessner, W.W. Applied groundwater modeling: Simulation to flow and advective transport. J. Contam. Hydrol. 1992, 10, 339–340. [Google Scholar] [CrossRef]
- Delbar, A.; Chapuis, R.P. Tracer movements in a straight uniform flow: New equations for the advective part considering the distortion of flow lines around the well. J. Contam. Hydrol. 2021. [Google Scholar] [CrossRef]


Publisher’s Note: MDPI stays neutral with regard to jurisdictional claims in published maps and institutional affiliations. |
© 2021 by the authors. Licensee MDPI, Basel, Switzerland. This article is an open access article distributed under the terms and conditions of the Creative Commons Attribution (CC BY) license (https://creativecommons.org/licenses/by/4.0/).
Share and Cite
Colombo, L.; Gzyl, G.; Mazzon, P.; Łabaj, P.; Frączek, R.; Alberti, L. Stochastic Particle Tracking Application in Different Urban Areas in Central Europe: The Milano (IT) and Jaworzno (PL) Case Study to Secure the Drinking Water Resources. Sustainability 2021, 13, 10291. https://0-doi-org.brum.beds.ac.uk/10.3390/su131810291
Colombo L, Gzyl G, Mazzon P, Łabaj P, Frączek R, Alberti L. Stochastic Particle Tracking Application in Different Urban Areas in Central Europe: The Milano (IT) and Jaworzno (PL) Case Study to Secure the Drinking Water Resources. Sustainability. 2021; 13(18):10291. https://0-doi-org.brum.beds.ac.uk/10.3390/su131810291
Chicago/Turabian StyleColombo, Loris, Grzegorz Gzyl, Pietro Mazzon, Paweł Łabaj, Robert Frączek, and Luca Alberti. 2021. "Stochastic Particle Tracking Application in Different Urban Areas in Central Europe: The Milano (IT) and Jaworzno (PL) Case Study to Secure the Drinking Water Resources" Sustainability 13, no. 18: 10291. https://0-doi-org.brum.beds.ac.uk/10.3390/su131810291