Article

Spatial Pattern Simulation of Land Use Based on FLUS Model under Ecological Protection: A Case Study of Hengyang City

College of Geography and Tourism, Hengyang Normal University, Hengyang 421002, China
*
Author to whom correspondence should be addressed.
Sustainability 2021, 13(18), 10458; https://0-doi-org.brum.beds.ac.uk/10.3390/su131810458
Submission received: 13 August 2021 / Revised: 15 September 2021 / Accepted: 16 September 2021 / Published: 20 September 2021

Abstract

:
With rapid economic development in China, the excessive expansion of cities has led to the imbalance of land use structure, and then the ecological regulation function of the land ecosystem experiences problems, which has become an obstacle to sustainable development. Therefore, in order to protect the ecological environment, regulate urban development and pursue the maximization of ecological benefits, it is necessary to analyze, simulate and predict land use change. In this study, Hengyang City was taken as the study area, and based on the current land use data of Hengyang City in 2010, 2015, and 2018, the land use type transfer during 2010–2015 and 2015–2018 was analyzed. Then, starting from 2010, the FLUS model was used to simulate the spatial distribution of land use in 2015 and 2018, and then the spatial distribution of land use in Hengyang City in 2025 was predicted with the Markov prediction method under the premise of ecological protection priority. The results show that the change in ecological land in Hengyang City is mainly distributed in the surrounding and marginal areas, because the topography of Hengyang City is a basin. Changes in land type in Hengyang City in 2015 were subtle and difficult to observe. However, in 2018, the transformation of non-ecological land into ecological land was obvious, and the distribution area of ecological land expanded significantly. The Kappa index of the results simulated by the FLUS model based on neural network is above 0.72, and overall accuracy is above 0.9, which is highly consistent with the actual situation. It is reasonable and convincing to predict the spatial distribution of land use in the context of ecological protection. The predicted results can be useful for urban planning and land use distribution and provide a reference for relevant decision-makers.

1. Introduction

Land provides a variety of products and services for human beings, and the sustainable use of land is the key link to sustainable development. Land resources are not renewable, and changes in utilization mode will have a serious impact on the ecological environment, society, and economy [1,2]. In recent years, the acceleration of urbanization has led to the rapid expansion of construction land [3,4], the imbalance of land use, over-exploitation, and extensive use of land resources, which have seriously affected the regional water and soil resources and ecological environment [5,6], and further threatened regional sustainable development. This issue has aroused wide and common concern all over the world [7,8]. Given the irrational use of land resources, how to effectively distribute the limited land resources, coordinate the relationship between ecological benefits and economic benefits, and achieve a harmonious relationship between man and land has become a hot topic and difficult problem in land optimal allocation, and an important issue in geographical research [9]. At present, scholars at home and abroad have made a series of explorations in the field of optimal allocation of land use from different perspectives and taken into account various factors affecting land spatial distribution. A large number of research results have been obtained [10], which have laid the theoretical basis and reference materials for this study.
Model simulation and scenario analysis are important tools to achieve land use optimization [11]. Scholars are trying to use different models and algorithms to describe and predict the development dynamic of urban land. The quantitative prediction models include the gray (GM) model [12,13], system dynamic (SD) model [14,15], Markov model [16], linear programming (LP) [17], Multi-objective planning (MOP) [18], etc. Spatial simulation models include the cellular automaton (CA) model [19], minimum cumulative resistance (MCR) model [20,21,22], Agent-based System (ABM) [23], CLUE-S model [24,25], FLUS model [26,27,28,29,30,31,32,33,34,35,36], etc. The mixed models include the Markov-CA model [37,38,39], SD-CA model [40,41], GM-CA model [42], MOP-CA model [43], ABM-CA model [23], SD-CLUE-S model [44], MCR-CLUE-S model [45], Markov-CLUE-S model [46], MCR-FLUS model [47], SD-FLUS model [48], LP-CA model [49], etc. In addition, there are computer algorithms such as the Artificial Neural Network (ANN) algorithm [50,51], ant colony (ACO) algorithm [52,53], genetic (GA) algorithm [54,55,56], simulated annealing (SA) algorithm [57], particle swarm optimization (PSO) algorithm [58], and so on. Land use/land cover change (LUCC) is an important issue in urban form distribution [59]. Different LUCC models have different functional mechanisms and have specific characteristics in the evolution of urban spatial patterns. For example, the ABM model can simulate both single-use land type and multi-use land type, but it cannot conduct spatial optimization [23]. The CLUE-S model is generally used to simulate land layout change and is occasionally used for layout optimization, but the optimization ability is limited [24,25]. MOP model can optimize land allocation on the basis of the consideration of economic benefits and ecological benefits [43]. Markov-CA assumes that land-use change was a random process, and the land transfer matrix is established to judge the transfer probability between different land types. In addition, some traditional mathematical models can also be used, but their limitations are significant [37,38,39]. The CA model is favored by many scholars because of its two-dimensional space-time integration ability. Its technical core is a conversion between cells. Commonly used CA models include Logistic-CA [37], ANN-CA [50,51], SD-CA [40,41], Markov-CA [37,38,39], and Random Forest (RF) CA [60]. However, most of these models can only simulate the dynamic change of single land use, and in many cases different land use change processes occur simultaneously and interact with each other. Therefore, the simulation of multiple LUCC change is more effective for determining a realistic future land use pattern. As one of the commonly used CA models, ANN-CA has outstanding ability in simulating the complex expansion of cities [51].
In recent years, the Future Land Use Simulation (FLUS) model proposed by Liu Xiaoping integrates the advantages of several traditional models, coupling SD and CA models [28]. It also considers the dual characteristics of top-down macroscopic drive and bottom-up micro-evolution, and can effectively deal with the uncertainty and complexity of the transformation of various land-use types under the influence of natural and human activities. It not only simplifies the program of SD model system mechanism construction, but also overcomes the limitation of the CA model when simulating a nonlinear system, and makes up for the problem that the Markov GM model is not compatible with driving factors [28,29]. Especially, it has a significant effect on the feedback of the interaction mechanism of the multi-factor driving factors in the human-land coupling system and the complex principle of the transformation of different land types, which can provide the results of spatial land-use change with high simulation accuracy [28,29,30,31,32,33]. To sum up, most of the current simulation of land use distribution is still based on the traditional CA model, while the FLUS model improves on the CA model by introducing a neural network algorithm, which can more effectively reflect the process of land-use change under a real situation. Some scholars adjust the quantity and spatial layout of different land use types by setting different goals and constraints, to take into account different needs and benefits of optimal allocation of land use [11]. Some regard economic benefits or the comprehensive benefits of the economic environment as the main objectives of land use simulation [32], and some scholars have carried out corresponding studies in Beijing [61], Hubei [62,63], Guangzhou [26], Jiangxi [27], Jilin [35], and other places. For example, Yang Lu et al. simulated and optimized land use for the next 25 years by setting four scenarios of prioritizing natural development, ecological protection, economic development, and balanced ecology–economy development [11]. Peifeng simulated land use by setting three scenarios of cultivated land protection, ecological protection, and urban development, and discussed the optimal allocation of land use while considering both ecological environment protection and social and economic development [26]. He believed that the spatial layout of land use under different scenarios is reasonable. Based on the production-living-ecological space theory, Yingqing set up four scenarios of production space priority, living space priority, ecological space priority, and production-living space coordination priority. He supposed that in terms of spatial and temporal distribution, the core area of ecological space changed slightly, while the marginal area changed significantly [36]. However, at present, many researchers study the optimal allocation of land use from the perspective of comprehensive consideration of social, economic, and ecological benefits. Few researchers focus on ecological protection and take environmental protection as the leading goal. There is still little research in this field and further work is needed. In this paper, the FLUS model is applied to the simulation and forecast for Hengyang city to understand the change in land distribution pattern and its influencing factors in the future. This study was designed to address the following questions: How will Hengyang develop land use in the future? Under the situation of ecological security protection priority, how does land use type change in Hengyang City? How does it differ from the actual natural development scenario? The aim is to provide scientific information for the sustainable development of land in Hengyang City, in order to make reasonable use of land resources. In the selection of research regions, most domestic researchers tend to choose regions with a good economic foundation and a higher level of social development, such as the Beijing-Tianjin-Hebei region [61], coastal cities [31,46], Pearl River Delta [26], and Yangtze River Delta [34,62], and other urban agglomerations, while ignoring a large number of developing third and fourth-tier underdeveloped cities with a relatively backward economy and society. However, the current situation of land use in these less developed areas may be more worrying, requiring more scientific assessment and improvement. At present, under the constraint of environmental protection, there is almost no research on the optimal allocation of land use structures in Hengyang City. There are few studies on land use quantitative structure, spatial structure, combination structure, and spatial–temporal variation in land structure. As the core city of Hunan Province, Hengyang city is one of the most important centers of politics, economy, and culture. It has a radiative effect on surrounding areas in its land development mode. The research perspectives of scholars on Hengyang City mainly focus on the spatial–temporal changes of land structure [64,65], environmental benefits of land use and ecosystem service value (ESV) [66,67], construction land and economic development [68], evaluation of land ecological security [69,70,71], urban expansion/growth boundaries [72], etc. Their main research methods include linear programming [64], land use transfer matrix [67], grey correlation degree [68], PSR model [69,70,71], ESV accounting [66,67], FLUS model [72], etc. Among them, Miao [65] coupled the BFAST algorithm and RFC to carry out a dynamic analysis of the time series change of arable land in Hengyang. Therefore, choosing Hengyang city as the research area is a new attempt to focus on urban agglomerations around the Two River Basins in China, as well as a new attempt to localize and utilize a LUCC model in different regions. Globally, there are many large, medium, and small cities like Hengyang city. This study has important reference value and significance for China and a large number of underdeveloped cities elsewhere in the field of land pattern change and future land use planning [1].

2. Materials and Methods
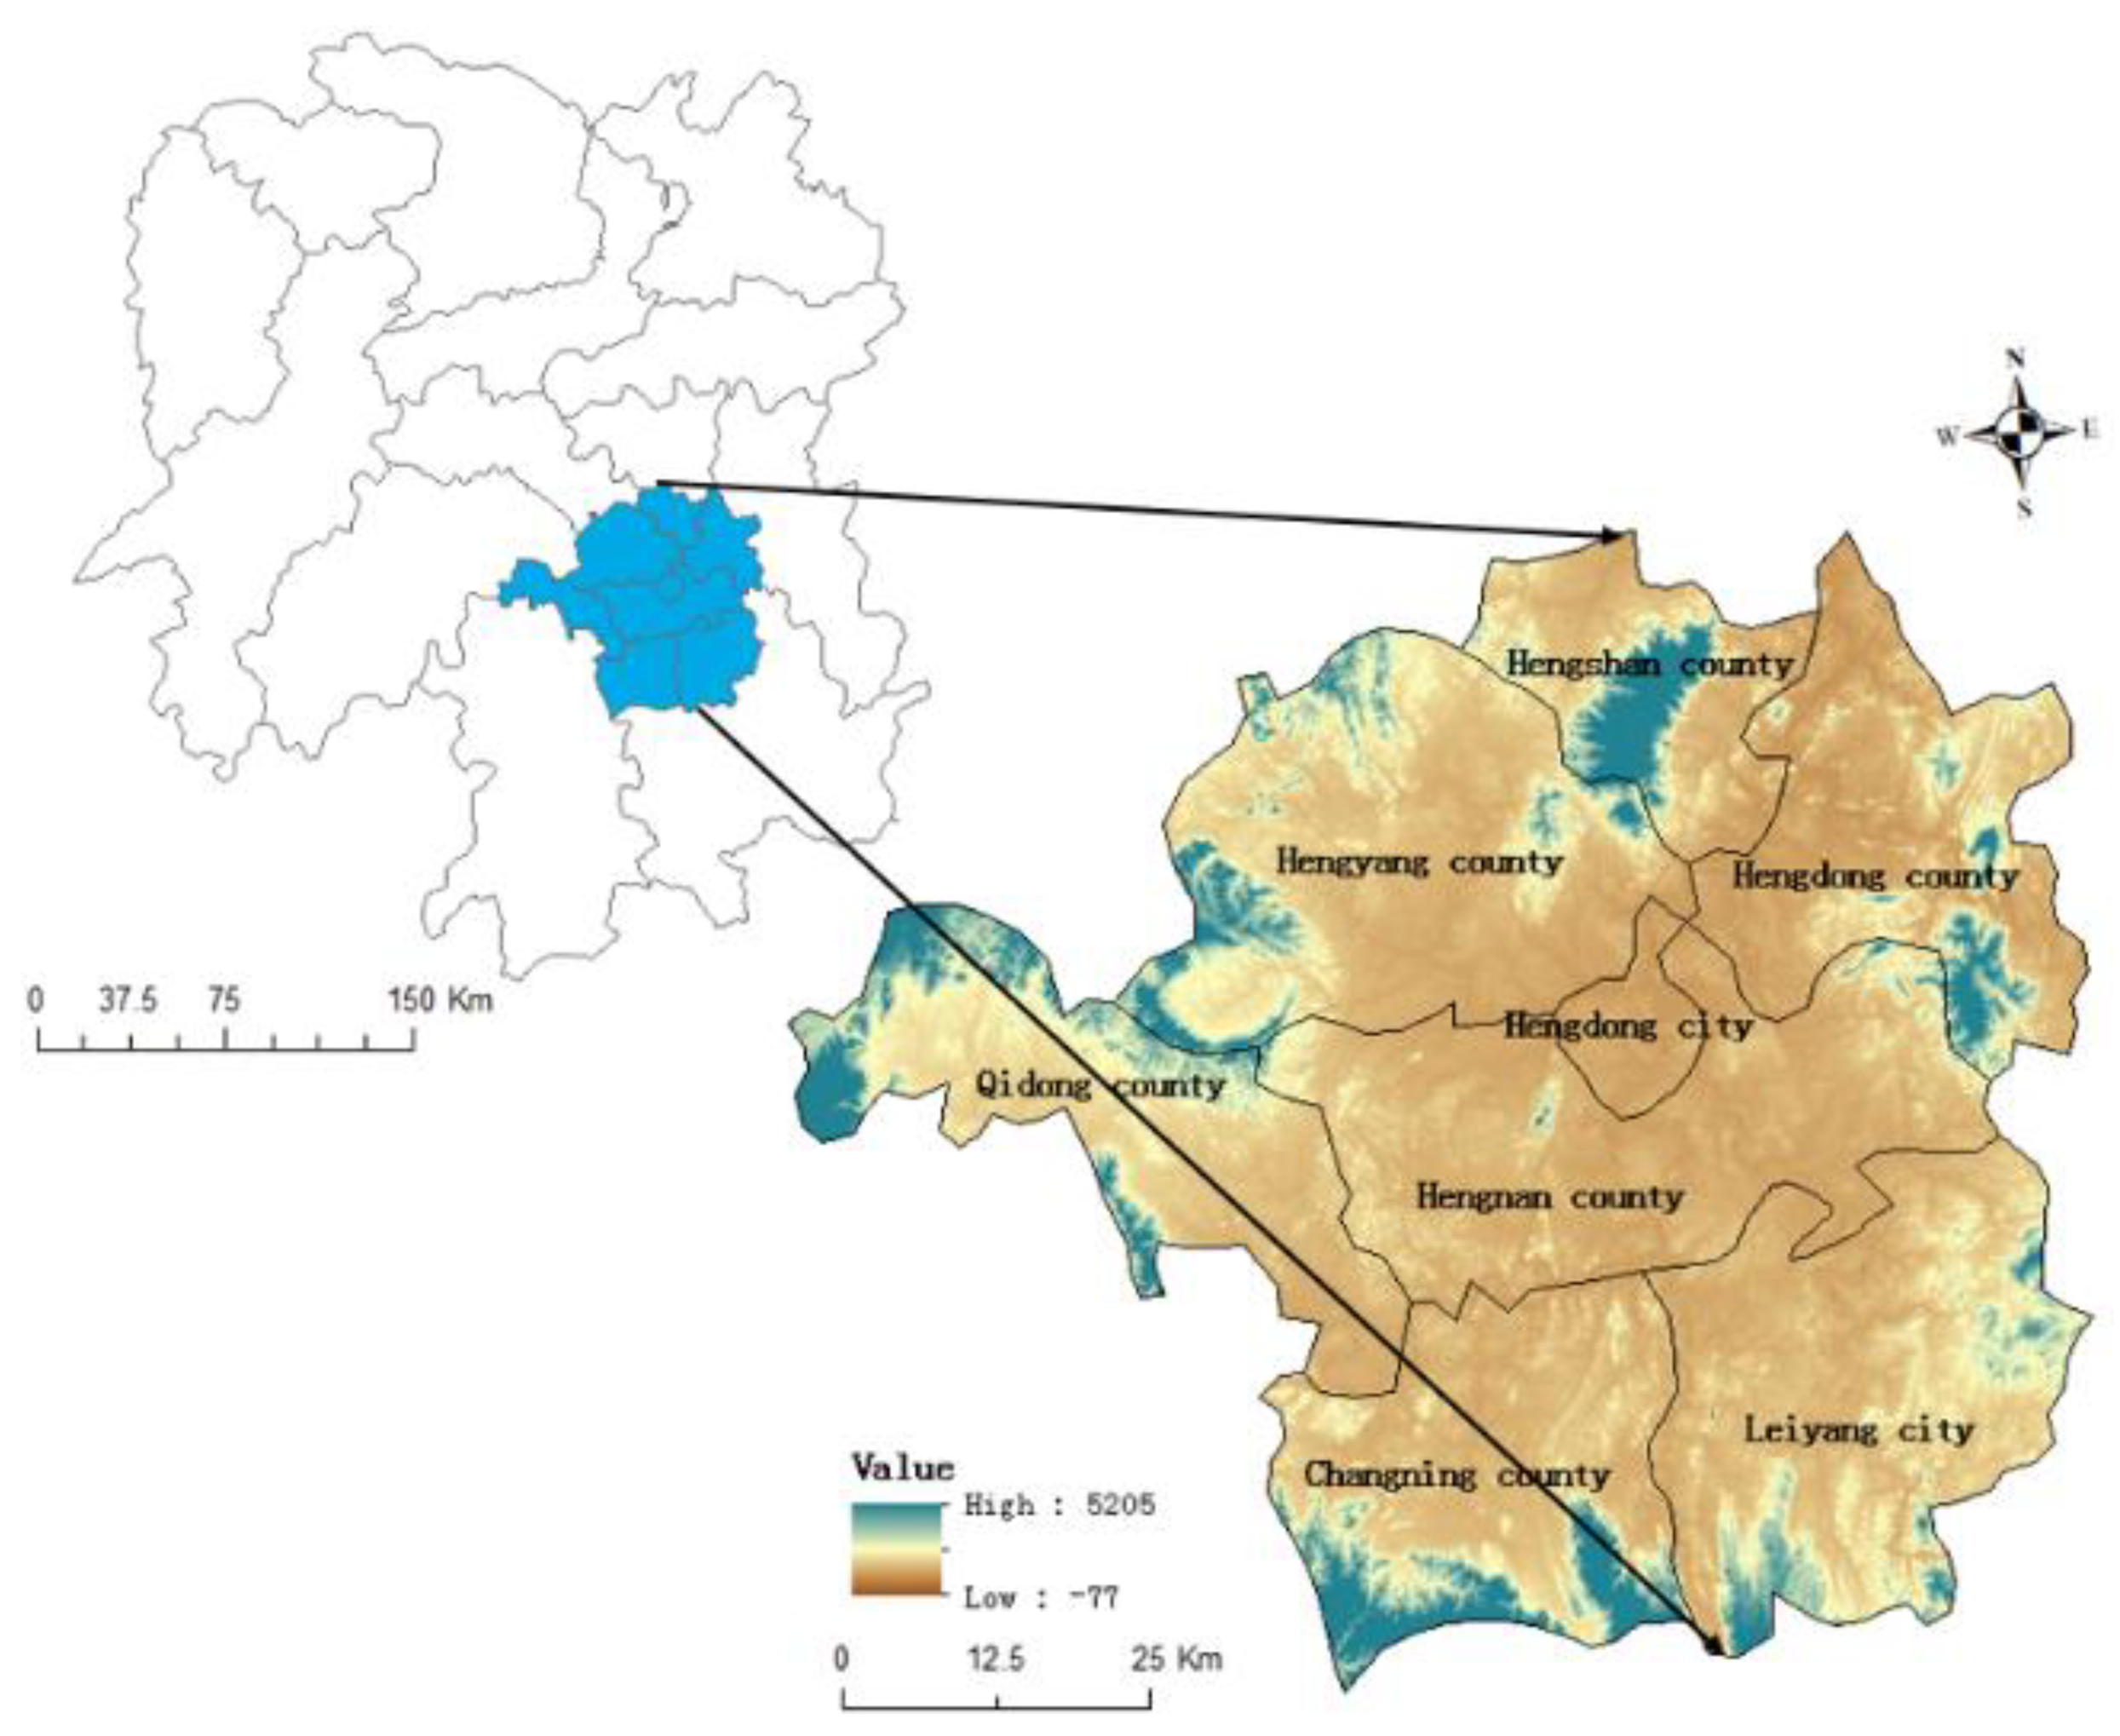
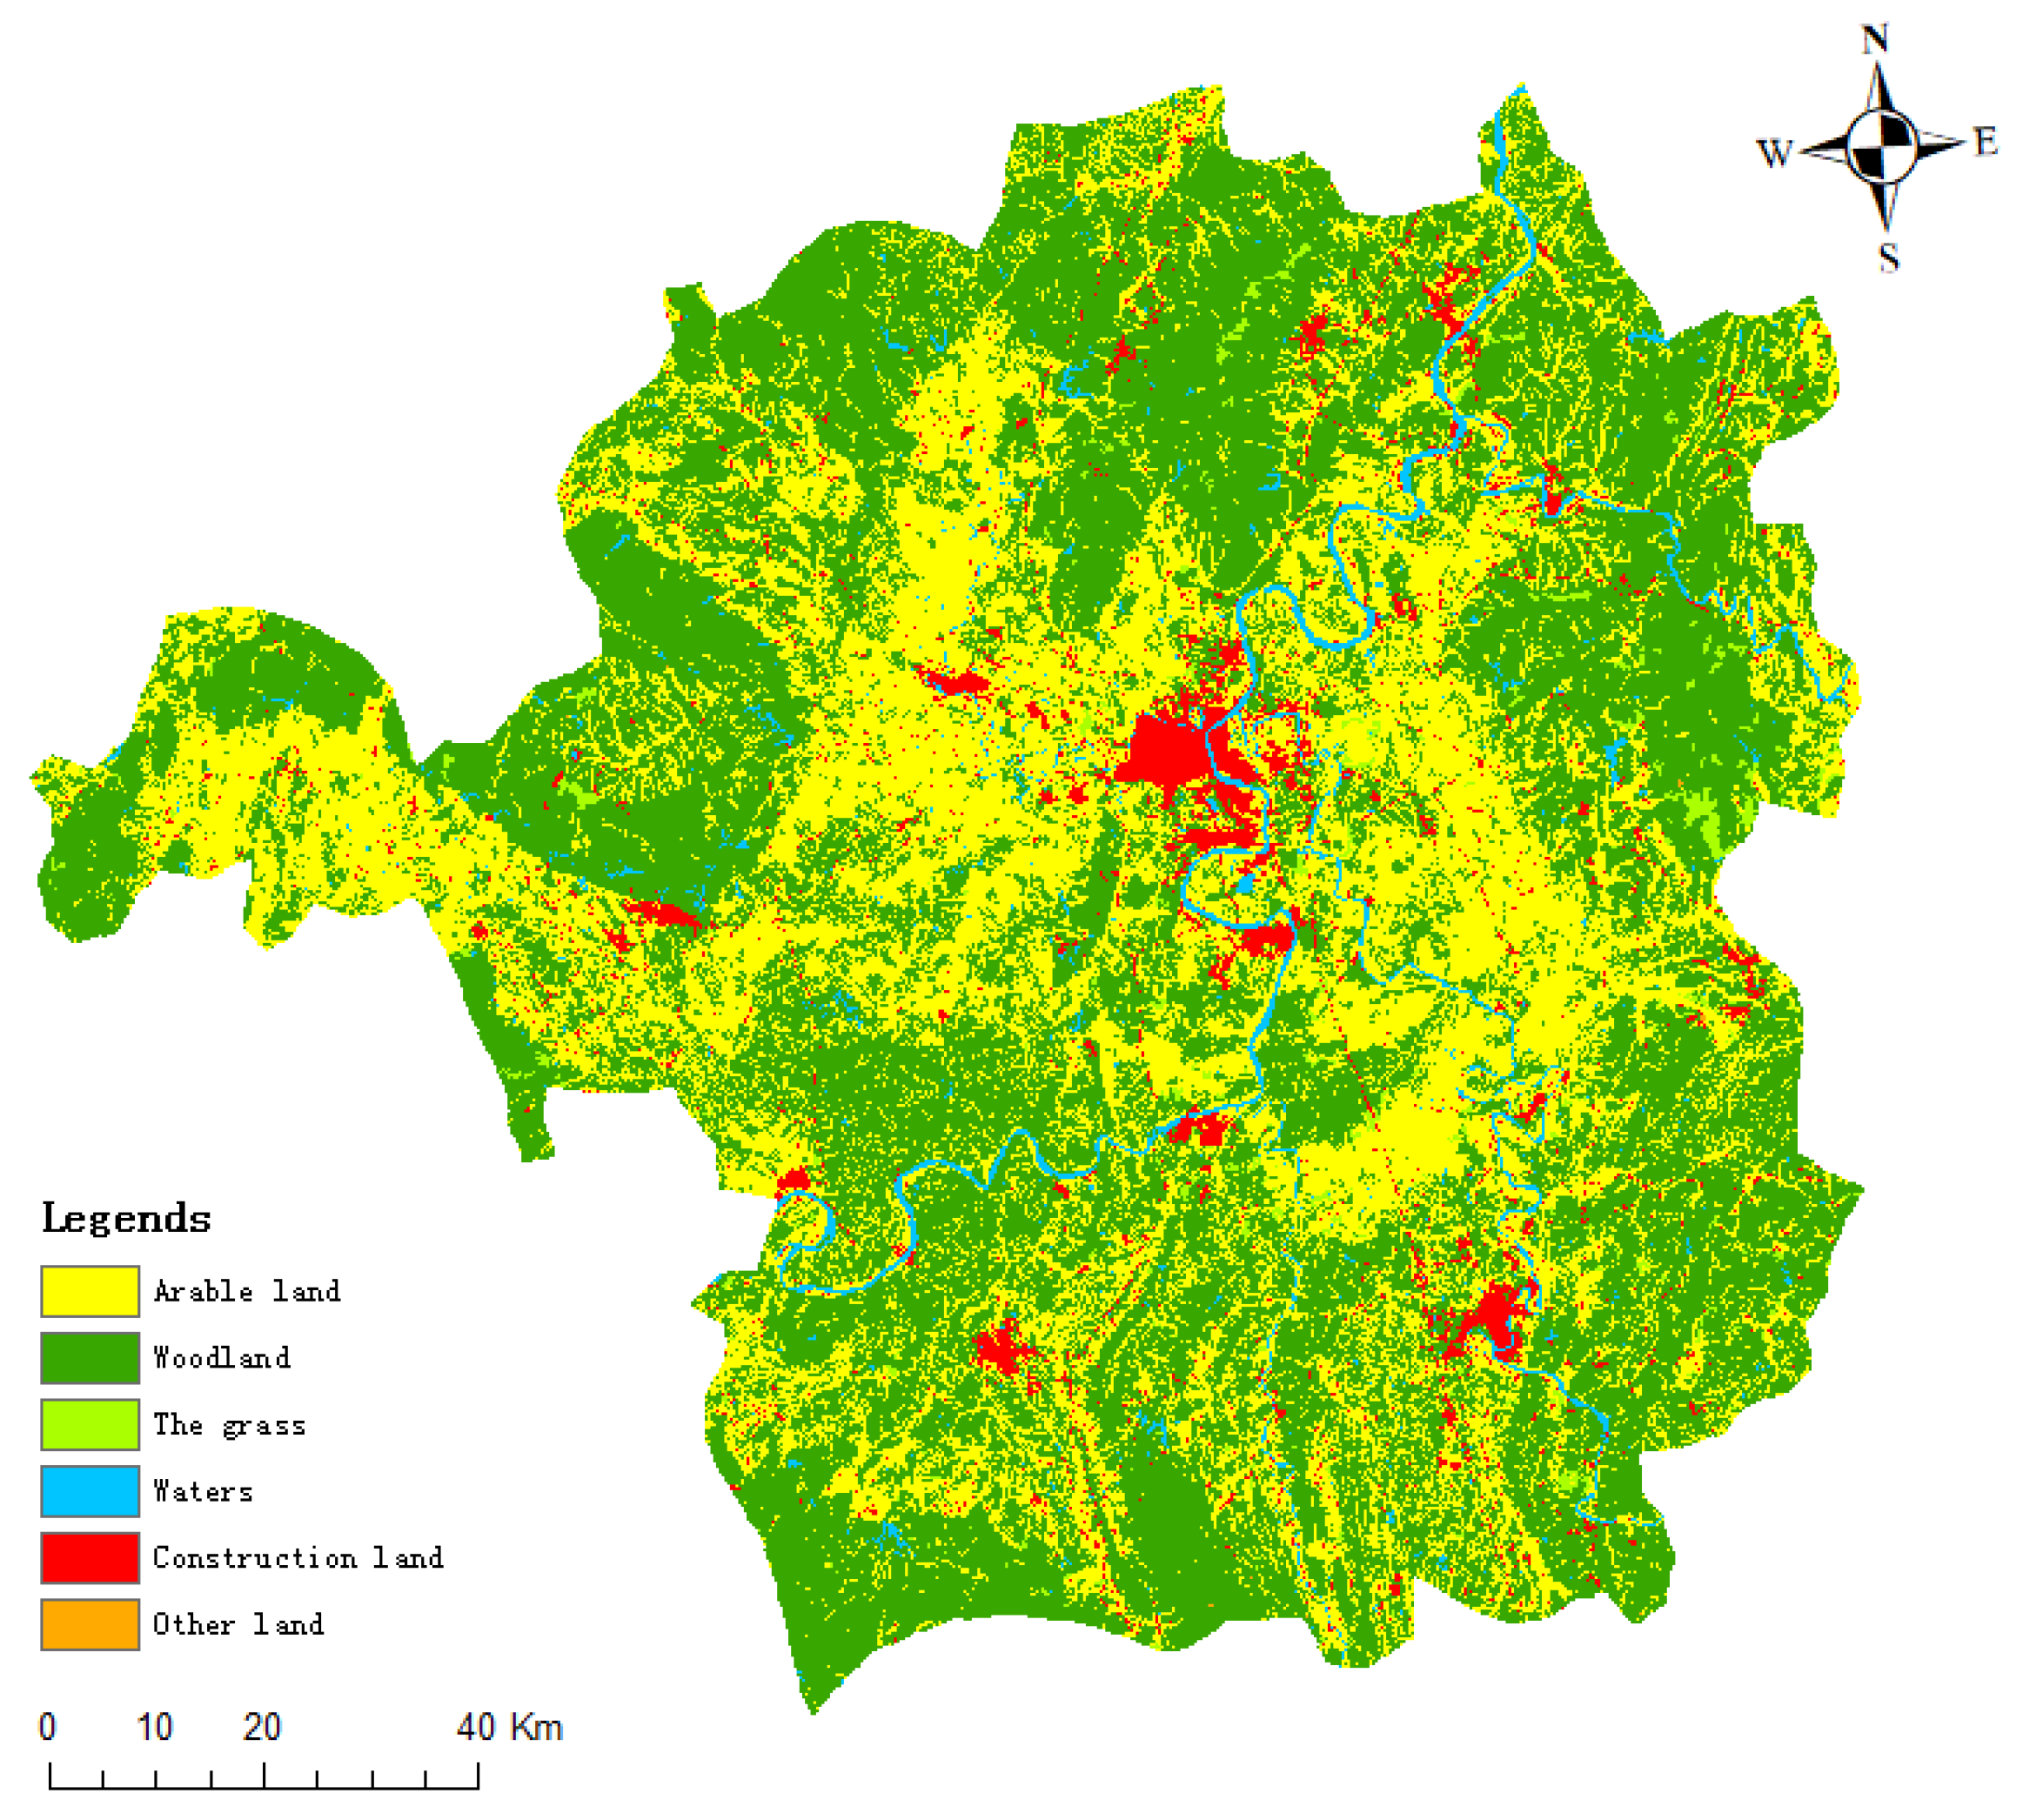
2.1. Study Area

Hengyang City is located in the south-central part of Hunan Province, China. (110°32′ E–113°16′ E, 26°07′ N–27°28′ N). It has jurisdiction over 5 counties, 2 cities, and 5 districts, covering an area of 15,310 km2. Hengyang City is in the Hengyang Basin, the surrounding terrain is high, but low in the middle, the landform mainly consists of mountains, but the overall terrain is relatively low and flat, tilted southwest to northeast (Figure 1). At present, the contradiction between supply and demand for land resources in Hengyang City is increasingly sharp, and it is very necessary to research the optimization of land use structure and layout based on the restriction of ecological security land for the construction of an ecological civilization in Hengyang City.

2.2. Data Source and Processing

The data types used in this study include land use data, road data (County Road, Provincial Road, National Road, Railway High Speed), river data, city point data, DEM data, and administrative boundary data (Table 1). All have a resolution of 30 m. DEM data is downloaded from Geospatial Data Cloud (www.gscloud.cn, accessed on 29 March 2021) FLUS model is downloaded from http://www.geosimulation.cn/FLUS.html (accessed on 29 March 2021).
Land use data has two functions: one is to convert into vector data, which is used as the basic data for land use conversion analysis; the other is basic data to simulate and predict the spatial distribution of land use in Hengyang City. A reclassification process is then performed to change the secondary classification to the primary classification, which is mainly divided into the following six categories: cultivated land, woodland, grassland, water area, urban land, and other land (Table 2).

2.3. Analysis of Driving Factors

The administrative boundary data is used to extract the boundary vector data of Hengyang City, and then this data is used to extract the road (county road, provincial road, national highway, highway, and railway) data of Hengyang City’s (county) point data and river data. The nature reserve data, river and lake data, are consolidated and rasterized, and then reclassified into two categories. 1 represents the area where land use type conversion can be carried out (non-nature reserves and non-water areas); 0 represents the area where land use type conversion cannot be carried out (nature reserves and water areas), and this data is taken as a limiting factor (Figure 2).
Some influential factors with higher scores were selected by an expert scoring method, which mainly included topographic factors and spatial accessibility variables, such as DEM, slope, distance from city center, and distance from the road (national highway, provincial highway, county road, freeway, and railway). Firstly, slope data is generated by the DEM data of Hengyang City, the Euclidean distance tool of ArcGIS is used to extract the distance from the road and the distance from the city center, then they are standardized to 0–1. Then the resolution of all the above raster data is unified to 30 m, and finally all the data are uniformly projected to the Albers projection coordinates (Figure 3).

2.4. FLUS Model

The FLUS model is used to simulate land-use change and future land use scenarios under the influence of human activities and nature. Firstly, the FLUS model uses a neural network algorithm (ANN) to obtain the suitability probabilities of various land-use types, within the research scope, from land use data, and various driving factors including human activities and natural effects. Secondly, the FLUS model is put forward based on a roulette wheel selection of adaptive inertia competition mechanisms, which can effectively deal with the uncertainty and complexity of the transformation of various land-use types under different influences, giving the FLUS model higher precision which can obtain a result similar to the real distribution of land use.
(1)
Suitability Probability
An ANN consists of three layer types: an input layer, a hidden layer, and an output layer. In the input layer, each neuron corresponds to an input variable, which can be mathematically expressed as
s g ( g , k , t ) = n w n , k × s i g m o i d ( n e t j ( g , t ) ) = n w n , k × 1 1 + e n e t n ( g , t )
where g is the grid cell, t is training time, k is land-use type, s g ( g , k , t ) is suitability probability; s i g m o i d ( ) is an activation function; and w n , k is an adaptive weight between the input layer and the hidden layer, which is calibrated during the training process. n e t n ( g , t ) is the signal received by neuron n in the hidden layer. The probability-of-occurrence of land use type k on grid cell g at training time t is denoted as s g ( g , k , t ) , and the sum of suitability probability is constant as 1, estimated according to the following equation
k g ( g , k , t ) = 1
The Uniform sampling method is used to extract 10% of the grid as samples to ensure the same sampling points for all types of land. Normalized processing is carried out and then imported into the ANN model to obtain the suitability probability of each category.
(2)
Self-adaptive inertia coefficient
The adaptive inertia coefficient reflects the difference between the amount of existing land and the amount of expected land and adaptively adjusts this in the iterative process to make the amount of all kinds of land develop towards the predetermined target.
I n t e r t i a k t { I n t e r t i a k t 1 | D k t 2 | | D k t 1 | I n t e r t i a k t 1 × D k t 2 D k t 1 0 > D k t 2 I n t e r t i a k t 1 × D k t 2 D k t 1 D k t 1 > D k t 2 > 0
where I n t e r i a k t denotes the inertia coefficient for land use type k at iteration time t . D k t 1 , D k t 2 denotes the difference between the macro demand and the allocated amount of land use type k until iteration time t 1 , t 2 .
(3)
Combined probability and neighborhood effects
By considering the probability-of-occurrence, neighborhood effect, inertia coefficient, and conversion cost, the combined probability of a cell being occupied by a specific land-use type is estimated using the following equation:
T p g , k t = s g ( g , k , t ) × Ω g , k t × I n t e r t i a k t × ( 1 s p p k )
where T p g , k t denotes the combined probability of grid cell g to covert from the original land-use type to the target type K at iteration time t ; s g ( g , k , t ) denotes the probability-of-occurrence of land use type K on grid cell g ; Ω g , k t denotes the neighborhood effect of land use type K on grid cell g at iteration time t ; I n t e r i a k t denotes the inertia coefficient of land-use type K at iteration time t ; and s p p k denotes the conversion cost from the original land use type p to the target type K .
Ω g , k t = N × N c o n ( p g t 1 = k ) N × N 1 × W k
This equation N × N c o n ( p g t 1 = k ) represents the total number of grid cells occupied by the land use type K at the last iteration time t 1 within the N × N window. W k is the variable weight among the different land-use types because of different neighborhood effects for different land-use types. N = 3 and the number of iterations is 300 in this calculation.

2.5. Accuracy Verification

The simulation of land use in 2015 and 2018 based on land use data of Hengyang City in 2010 was compared respectively. The total accuracy (OA) and Kappa coefficient are used to verify the validity. The range of the two values is between 0 and 1, and the closer the value is to 1, the higher the degree of the simulation will be. When Kappa is greater than or equal to 0.7, the simulation of the model shows a high degree of consistency with the actual situation.
As can be seen from the two indexes of accuracy verification (Table 3), the overall accuracy in 2015 and 2018 is higher than 0.95, and the Kappa coefficient is higher than 0.7, indicating the high accuracy of this model. Therefore, the FLUS model is suitable for simulating the future spatial distribution of land use in Hengyang City with high precision.

3. Results

3.1. Land Use Change Matrix

The land use transfer matrix is an important tool to analyze land use and cover change. It can not only reflect the structural characteristics of land use and quantitatively explain the conversion between different land types in the same region at the beginning and end of a certain period of time, but also reveal the conversion rate and information on the transfer between different land types. The analysis of land-use change in this study is based on three pieces of land use data of Hengyang City in 2010, 2015, and 2018. As can be seen from Table 4, on the whole, from 2010 to 2018, the area of grassland and woodland showed a decreasing trend, while the area of the water area of construction land showed an increasing trend. From 2010 to 2018, the woodland decreased from 56.17% to 55.56%, the grassland decreased from 0.94% to 0.91%, the utilization rate of construction land increased from 2.59% to 3.85% in 2010, and the water area increased from 1.98% to 2.03%. From a local point of view, compared with the conversion results from 2010 to 2015, the total occupancy rate of ecological land (forest land, grassland and water area) in Hengyang City from 2015 to 2018 decreased slightly, while the utilization rate of construction land showed an increasing trend.
To describe the land use type conversion rate from 2010 to 2018 and from 2015 to 2018, the Intersect tool in ArcGIS is used to generate the land-use change detection conversion matrix, which aims to quantitatively monitor the land use transfer situation in different periods. It can be seen from Table 5 and Table 6 that, in the past eight years, the general trend is that other land types transfer more to construction land, and less to ecological land (forest land/grassland/water area). Construction land increased from 39,931.0 hectares in 2010 to 59,307.9 hectares in 2018, while ecological land decreased from 911,110.2 hectares to 901,736.4 hectares.
Since this study focuses on the transfer of ecological land (woodland/grassland/water area), the following five combinations related to the transfer of ecological land are selected for discussion, so that no transfer of ecological land, conversion of arable land to ecological land, conversion of construction land to ecological land, etc., and other transfer situations are combined into one category (Table 7).
From 2010 to 2015, and then from 2015 to 2018, the proportion of unconverted ecological land in the total area of the study area decreased from 58.31% to 56.13%. Among other land types, the percentage of conversion from arable land to ecological land was higher, rising from 0.43% to 1.7%, the percentage of construction land converted to ecological land increased from 0.03% to 0.15%, and the percentage of ecological land conversion increased from 0.05% to 0.19%. By comparison, compared with 2010 to 2015, the conversion rate of various land-use types to ecological land in Hengyang City from 2015 to 2018 has increased as a whole.

3.2. Simulation Results

In this study, the land use data of Hengyang City in 2010 are used as the initial data to obtain the suitability probability of each land use category. As can be seen from Figure 4, the darker the color, the weaker the suitability, and the lighter the color, the stronger the adaptability. The adaptability of arable land is stronger at the bottom of the basin, where the land is flat and near the river. The adaptability of woodland is strong at higher elevations at the edge of Hengyang city but weak at the bottom of the central basin and the population settlement area. The distribution of grassland is similar to that of woodland but more dispersed also on the flat terrain. Construction land presents a discrete distribution, that is, a core city in the central part and several urban agglomerations around it. It is mainly distributed in urban or township agglomerated areas, etc., characterized by strong adaptability, in a place with flat terrain, convenient transportation, and abundant water sources. The waters with strong adaptability are mainly distributed in the Xiangjiang River and its banks. The unused land with strong adaptability is mainly distributed to the east and south of Hengyang City with a large number of tall mountains, and a small amount in the middle of the basin. It can be seen from Figure 4 that the suitability of different land-use categories is consistent with the natural and social status of Hengyang, which is relatively reasonable.
By comparing the number of pixels of each land-use type in the two phases (Table 8), it can be seen that the simulated situation in 2015 is consistent with the current situation, the land use structure is very stable, and there is no significant change in the quantitative structure of the six land-use types. The simulation results in 2018 are slightly different from the current situation. According to the forecast results in 2018, the area of cultivated land, woodland, grassland, and water area is 2817, 2154, 49, 74 pixels less than the actual area, with a range of −0.04%, −0.02%, −0.03%, and −0.01%, respectively. The area of construction land is 897 pixels more than the actual area, with an increase of 0.26%, and other land shows no change. The order of land-use change is as follows: Arable land > Woodland > Construction land > Waters > The grass > Other lands. The order of variable amplitude is: Construction land > Arable land > The grass > Woodland > Waters > Other lands.
By comparing the simulation results in 2018 with the real situation, it is found that, although there are slight changes in the land use pixel, the overall situation does not change greatly.
The FLUS model was used to simulate the land spatial distribution for Hengyang City in 2015 and 2018, and the results obtained are shown in Figure 5.
As can be seen from Figure 5, the ecological land change in Hengyang is mainly distributed in the surrounding and marginal areas, and the main reason for this phenomenon is the topography of Hengyang. This is a basin topography, low in the middle of surrounding higher areas, so the central region is suitable for urban development and the surrounding ecological condition is better, thus leading to Hengyang city’s land distribution overall characteristics. It can be seen from Figure 5 that the simulation result (a1) in 2015 is highly similar to the actual situation (a2) in 2015, and there are slight changes in the spatial layout of various types of land in the simulated results, but these are not obvious. By comparing the simulation results (b1) in 2018 with the current situation (b2) in 2018, it can be seen that the ecological land of Hengyang City presents an increasing trend, in which the area of the ecological land in the central urban area of Hengyang City has slightly decreased, and the distribution area of the ecological land in Hengyang County, Hengdong County, Hengyang County, and Qidong County has significantly expanded. Regarding the increase of ecological land and the reduction of construction land in Leiyang City, through the comparison chart (b1 and b2), it is found that from 2015 to 2018, Leiyang has added a piece of construction land. On the whole, ecological land increased while construction land decreased in Leiyang. However, according to the comparison figure (b1, b2), construction land increased sharply in Leiyang from 2015 to 2018. The main reason is that, according to the urban development planning of Leiyang, a planning area was built in the northeast corner of Leiyang, i.e., the northern new town of Leiyang. In Hengnan County, part of the construction land has been transformed into ecological land, and part of the ecological land transformed into building land. The root of this phenomenon lies in the contradiction between urban development and economic protection. The transformation of ecological land to construction land in Changning County is obvious, which is related to the development of urbanization in Changning County.

3.3. Forecast Results

This study uses the Markov method to calculate the land-use transfer probability of Hengyang City from 2010 to 2015 and 2015 to 2018 and calculates the number of pixels of each land-use type in 2025. The forecast results are shown in Table 9.
Based on the ecological protection scenario, this study takes rivers, lakes and natural ecological protection areas as restrictive factors to obtain the distribution pattern of land use under ecological conservation priority in 2025 (Figure 6). Under the policy of ecological protection, the ecological environment in the north and south of Hengyang City is excellent, and the diversity of natural resources is rich. The area also contains national nature reserves, such as the Mount Hengshan national nature reserve, three Yang nature reserve, Tianguang Mountain Nature Reserve, Dayi Mountain Nature Reserve, and so on. The establishment of nature reserves and the existence of surrounding forests has a positive impact on the ecological environment in Hengyang City.
As can be seen from Figure 6, the spatial distribution of construction land, cultivated land, woodland, and grass almost experienced no change, while the spatial distribution of construction land and water area changed relatively significantly. On the whole, there is more ecological land around and more construction land at the bottom of the basin. Under the policy of “strictly protecting ecological land and prohibiting arable land from occupying ecological land”, the area of arable land increased only slightly. The change in woodland showed a decreasing trend. Grass grows sporadically in different places in terms of diffusion, mainly spreading to the periphery by means of filling and edge expansion. The distribution of construction land is relatively concentrated, mainly in places near cities and towns with convenient transportation, characterized by a slow expansion rate and a relatively small growth rate. The main reason is the implementation of the policy of prohibiting excessive development. The water area shows an obvious trend towards expansion, which is beneficial to the construction of an ecological environment. However, other land uses showed an obvious regression phenomenon. Other areas have been converted to other land types, such as economic land and ecological land. In conclusion, the spatial distribution pattern of each land type in the study area is reasonable under the constraint of ecological protection, which is conducive to the sustainable development of the ecological environment. The prediction results can be used as the basis for urban layout and land use planning, and can provide a reference for relevant decision-makers.

4. Discussion

There is no doubt that cities will continue to be the main carrier of human life [73], and the construction of sustainable cities is of great importance to sustainable development [73,74]. Generally speaking, urban intensive land use is usually considered in the later stages of urban development, but in fact, ecological security should be paid attention to at any stage of urban development. The unscientific planning of land in the early stage of urbanization will bring great pressure on the urban ecological environment [75]. To put ecological protection into practice in land-use optimization, this study is no longer guided by economic goals, but takes the maximization of ecosystem service benefits as the dominant goal, trying to find the most suitable decision for the study region. This is an optimization method that can not only protect the ecological environment but also ensure the needs of economic development. Our study results provide useful insights for the development of land-use management and environmental protection policies in Hengyang city, and the research results have important reference significance for the formulation of land use policies and ecological protection practices of urban agglomerations at home and abroad in the future [76].
By comparison, the conclusion of this paper is roughly equivalent to that of the research of Lu et al. under the ecological protection situation, i.e., the quantitative structure and spatial layout of land use types under the ecological protection priority situation are reasonable, and their long-term comprehensive benefits are considerable. On the one hand, the research direction of optimal allocation of land use patterns in the future is to predict and analyze the future development direction of land use through various research methods and to formulate appropriate urban development strategies. Currently, most studies focus on the optimal layout of urban construction land, mainly on the layout of current land, but there is no in-depth discussion on how to develop and optimize the layout of land use in the future, and few studies on the prediction of future land use. On the other hand, combining the optimization of land use quantity, space and benefit is the development trend for land use structure optimization in the future [77].
The possible limitations of this study are as fellows. First, due to the numerous factors affecting the spatial layout of land use, this study only selected some important natural factors, and some factors that are not easy to be quantified, such as cultural and economic factors, policies, and regulations, have not been fully considered in this simulation. These factors can be analyzed in future studies. Second, the research object is limited to only one province of China, thus the national and international implications and the conclusions of this study may be different with an increase in the number of samples. Therefore, to further expand this study, it is suggested to research more cities.
How to comprehensively consider all kinds of factors affecting land change in future research and make more objective and scientific calculations for future land use demand will also be the focus of future research on the optimal allocation of land use [11]. In addition, various artificial intelligence algorithms emerge in an endless stream. In addition to the traditional mathematical and computer models, artificial intelligence algorithms are an advanced and novel research method. A consistent, comprehensive, and continuous monitoring framework, remotely sensed data sets, and a relevant statistical machine learning algorithm can effectively govern the changes in land-use patterns and play an important role in smart city governance [59], e.g., the scene simulation of GA can be based on historical data of land use to predict the development of different land-use conditions, to suggest how to optimize the number of land resources and space allocation in a particular scenario [77]. Therefore, various artificial intelligence algorithms can be extended to the research field of urbanization. The sustainable development of land use affects biodiversity, food security, carbon storage, and other issues [59]. Taking these influencing factors as variables in various algorithms will also be a research focus in the future.

5. Conclusions

Firstly, this study uses the land use transfer matrix to analyze the transfer of various types of land use in Hengyang, especially the transfer of other lands to ecological land. Next, the FLUS model was used to obtain the suitability probability from land-use data, impact factors, and limiting factors. Then, the changes in ecological land use in Hengyang City in 2015 and 2018 were simulated and verified by the accuracy coefficient (OA value and Kappa coefficient). Finally, the Markov chain was used to calculate the number of land use types in Hengyang City in 2025.
(1)
According to the analysis of the land use transfer matrix, in the past 8 years there has been a general trend in conversion of various land-use types to ecological land (woodland/grassland/water). Compared with the period from 2010 to 2015, the conversion rate of various land-use types to ecological land in Hengyang City from 2015 to 2018 is higher.
(2)
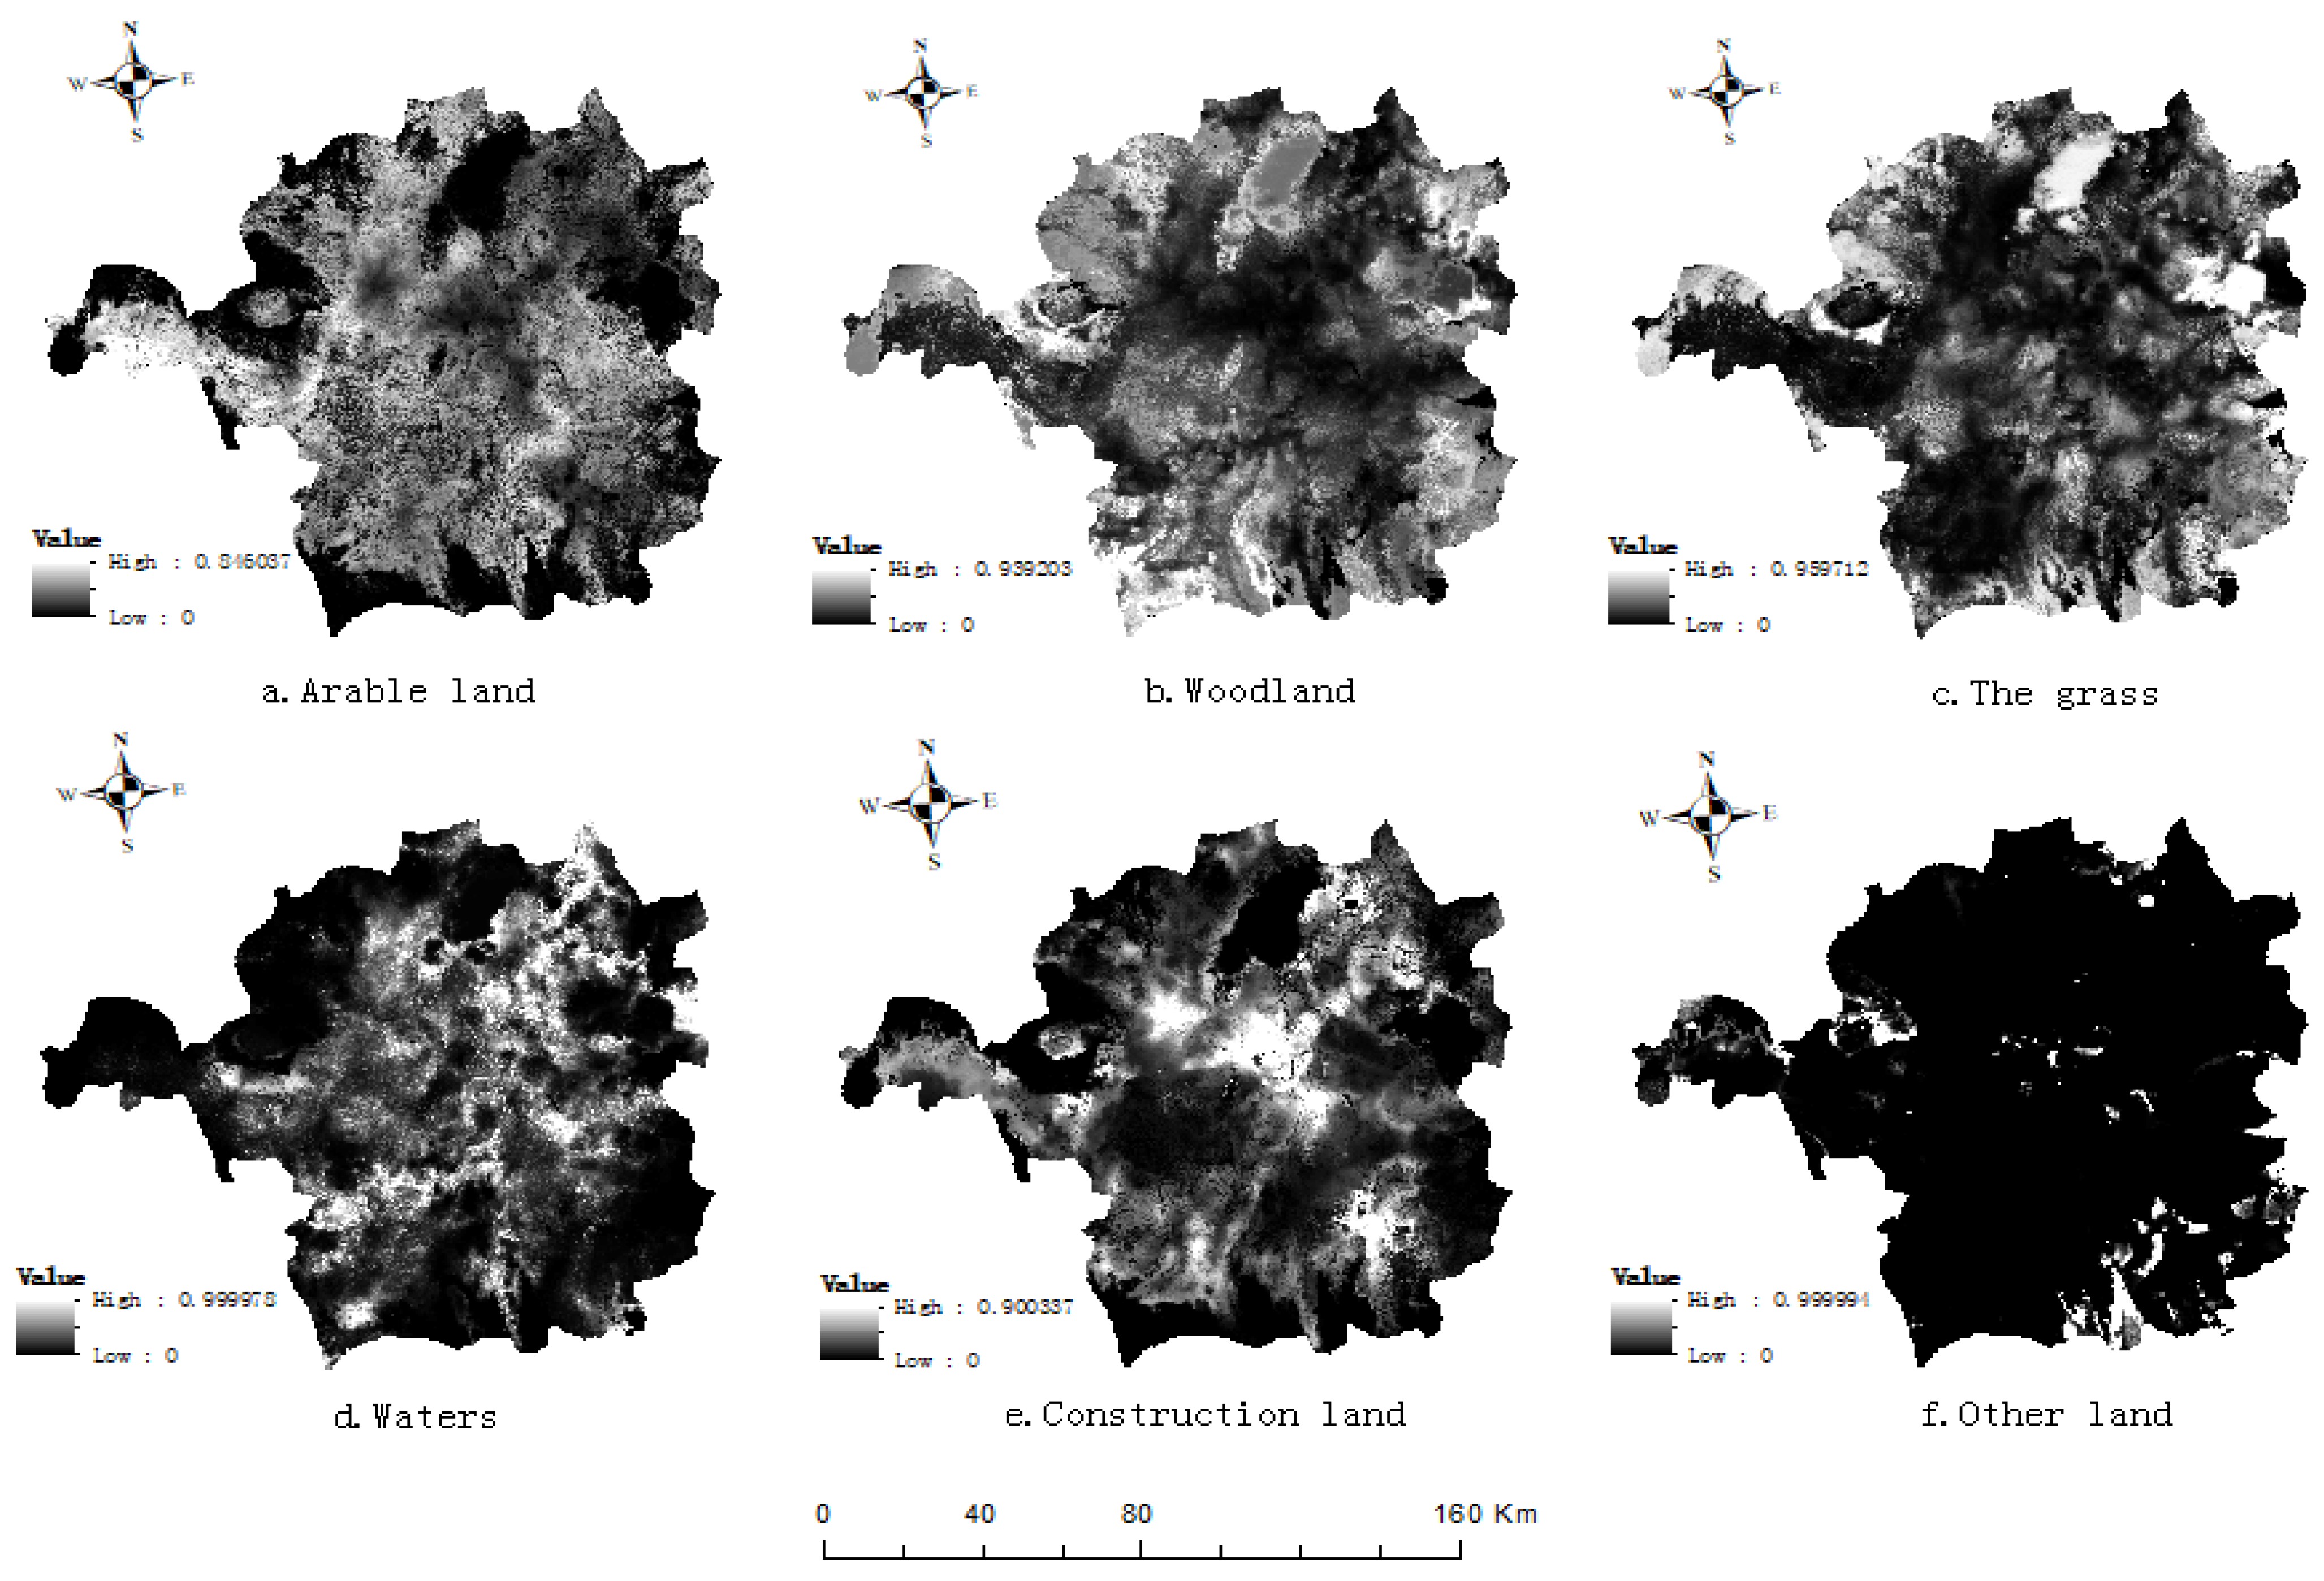
Driving factors and limiting factors with good explanatory power were selected, and the suitability probability of each land use type calculated by using a uniform sampling method and ANN model, and the spatial distribution pattern of land use under ecological constraints analyzed, consistent with the social and natural conditions of Hengyang. The results are convincing.
(3)
The accuracy of the FLUS model is verified by two indicators of the OA index, Kappa coefficient: the overall accuracy in 2015 and 2018 is higher than 0.95, and the Kappa coefficient is higher than 0.7, which proved that the simulation accuracy of the model is high.
(4)
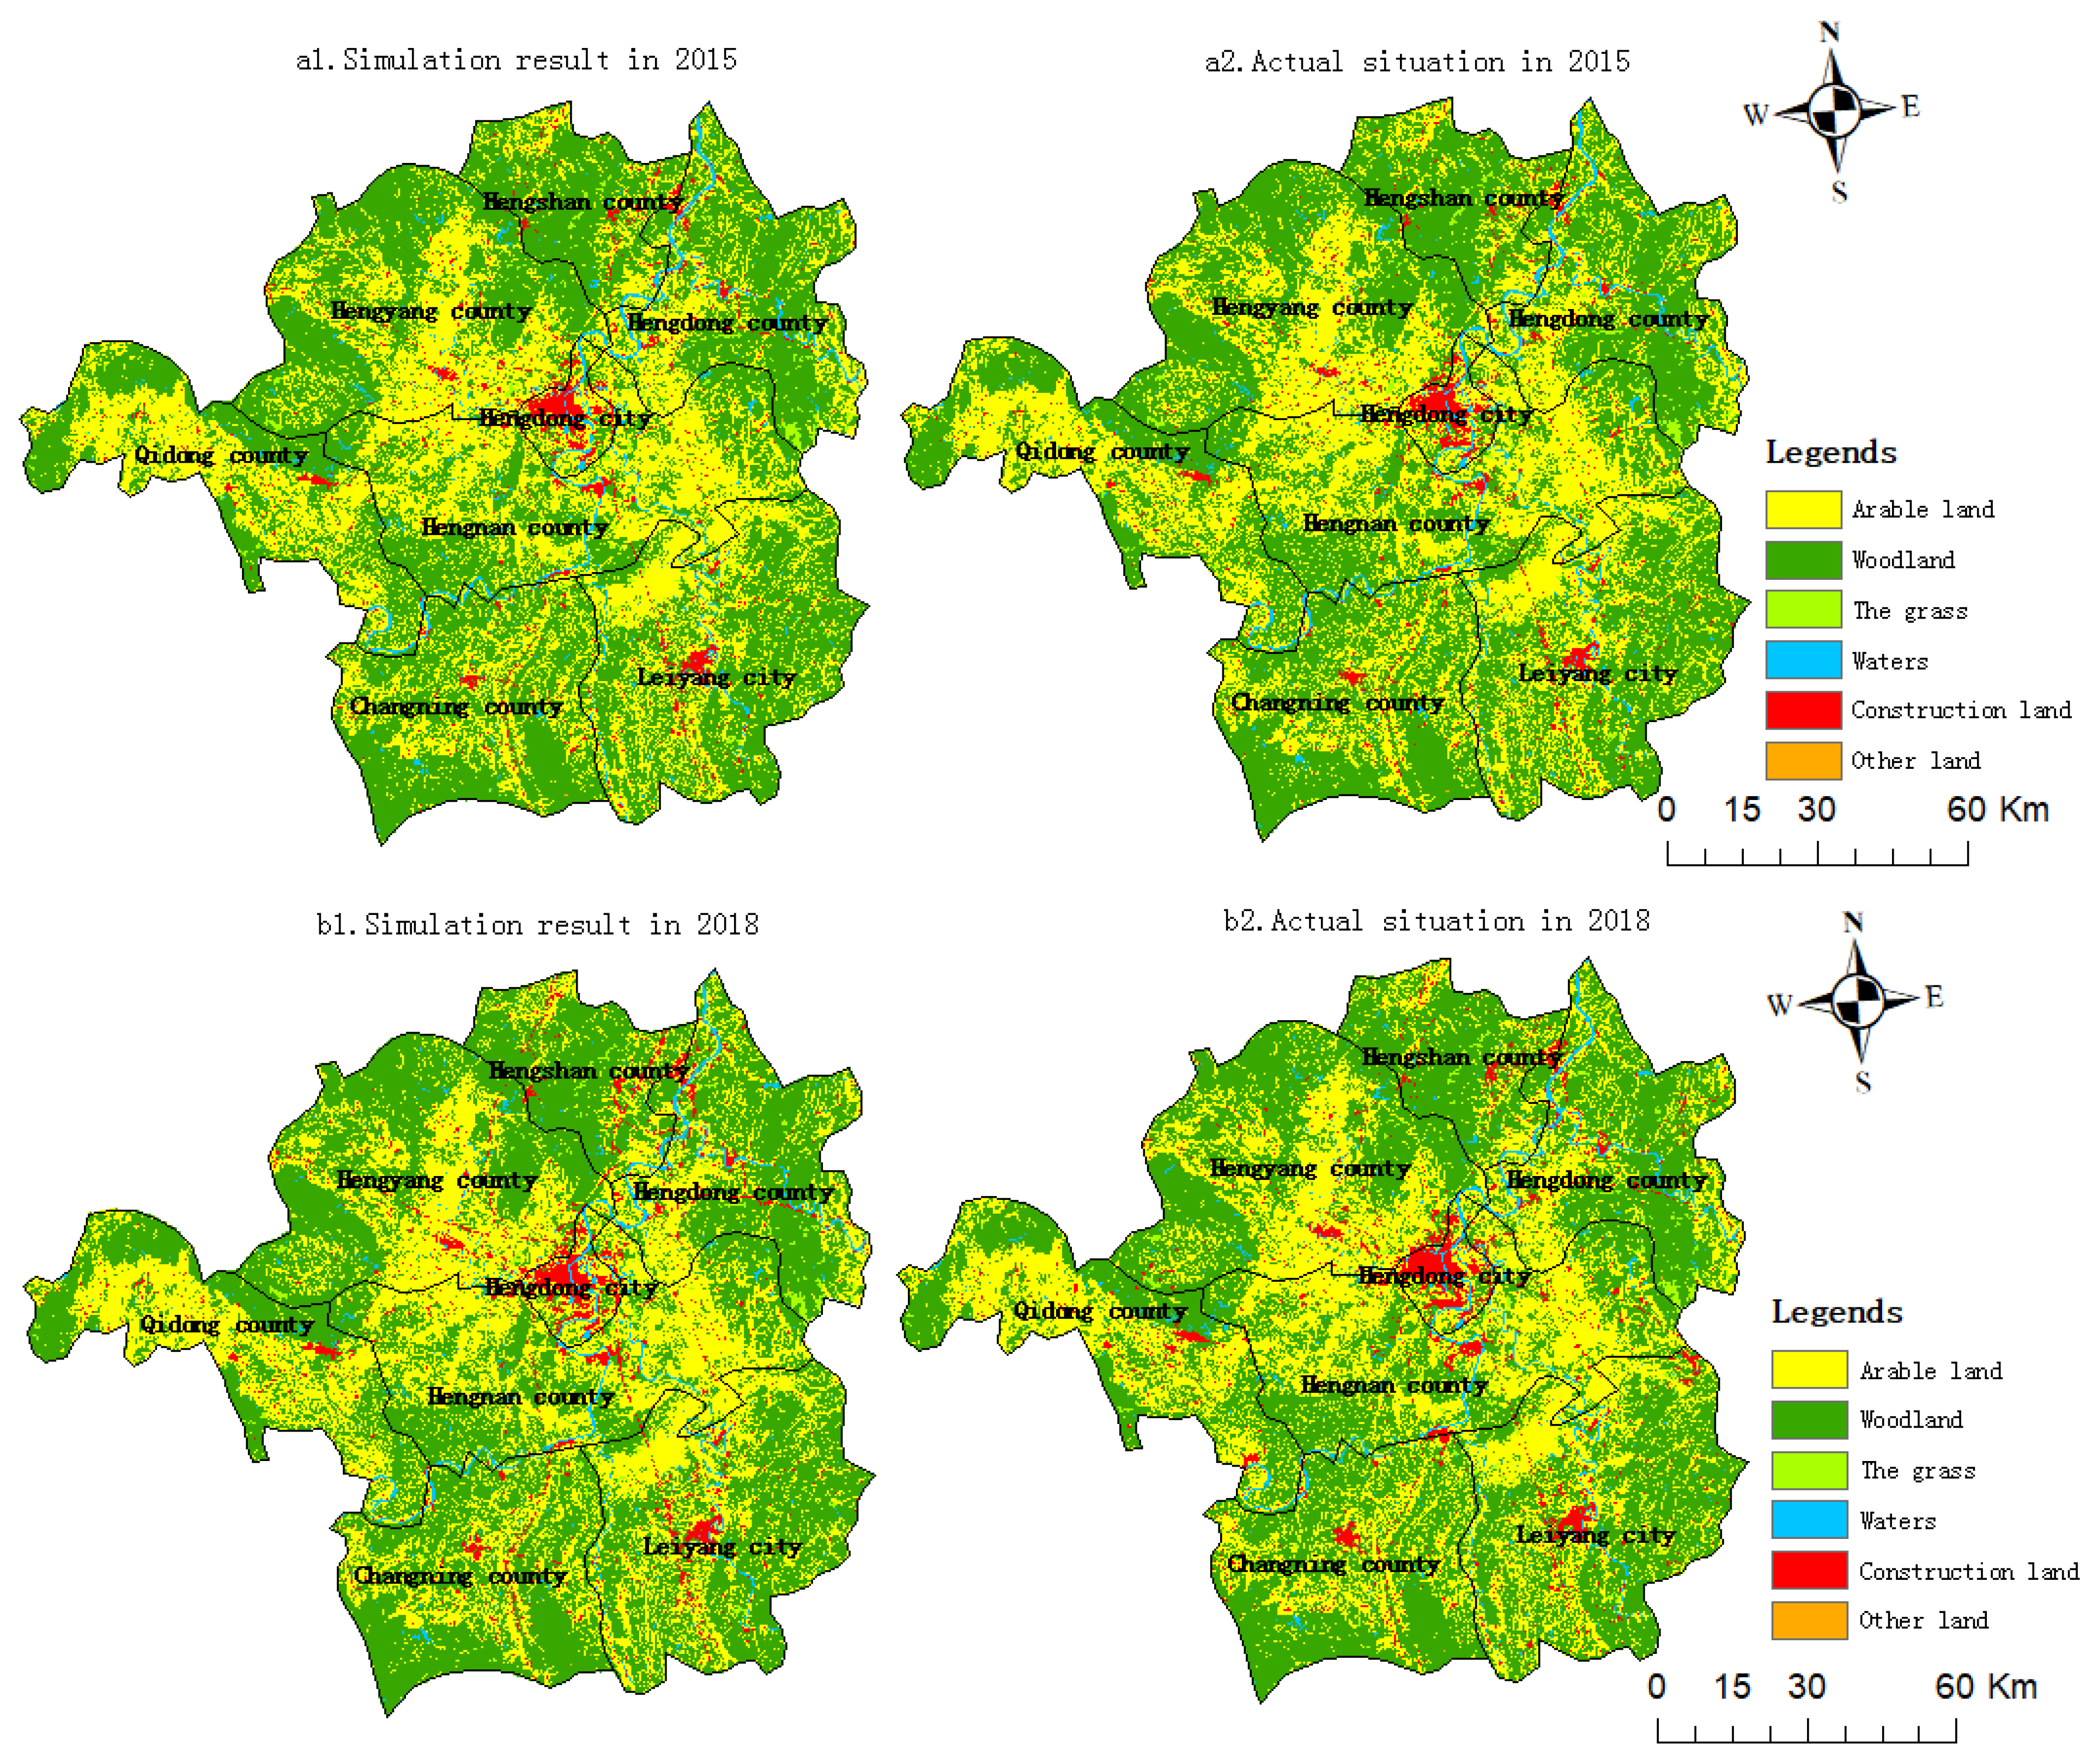
The change of ecological land in Hengyang is mainly distributed in the surrounding and marginal areas. The main reason for this phenomenon is the topography of Hengyang City. According to the comparison diagram of the land-use status and simulation results in Hengyang City in 2015 and 2018 (Figure 5), it can be seen that the changes of various land types in 2015 are subtle and difficult to observe. However, in 2018, the transformation of non-ecological land to ecological land is obvious in Hengyang City, and the distribution area of ecological land has expanded significantly.
(5)
The Markov chain can be used to predict the quantity of land use of different types in Hengyang in 2025, and to simulate the spatial layout of land use in the perspective of environment protection priority. The results show that there is more ecological land in the surrounding areas of Hengyang city, with forest land as the mainland type, and more construction land at the bottom of the basin.

Author Contributions

Conceptualization, P.W. and P.X.; methodology, C.Z. and B.Q.; software, C.Z.; validation, C.Z. and P.X.; formal analysis, P.W. and P.X.; investigation, C.Z.; resources, P.W. and B.Q.; data curation, C.Z. and C.L.; writing–original draft, C.Z.; writing–review & editing, C.Z., C.L. and B.Q. visualization, C.Z.; supervision, P.X. and C.L.; project administration, C.Z. and P.W.; funding acquisition, P.W.; All authors have read and agreed to the published version of the manuscript.

Funding

This research was supported by Hunan Postgraduate Scientific Research Innovation Project in 2019 (No. CX20201164).

Institutional Review Board Statement

Not applicable.

Informed Consent Statement

Not applicable.

Data Availability Statement

Not applicable.

Acknowledgments

Many thanks to three anonymous reviewers and the editors for their insightful and constructive comments and suggestions.

Conflicts of Interest

The authors declare no conflict of interest.

References

  1. Cao, L.D.; Li, J.L.; Ye, M.Y.; Pu, R.L.; Liu, Y.C.; Guo, Q.D.; Feng, B.X.; Song, X.Y. Changes of ecosystem service value in a coastal zone of Zhejiang province, China, during rapid urbanization. Int. J. Environ. Res. Public Health 2018, 15, 1301. [Google Scholar] [CrossRef] [PubMed] [Green Version]
  2. Costanza, R.; de Groot, R.; Sutton, P.; der Ploeg, S.; Anderson, S.J.; Kubiszewski, I.; Farber, S.; Turner, R.K. Changes in the global value of ecosystem services. Glob. Environ. Chang. 2014, 26, 152–158. [Google Scholar] [CrossRef]
  3. Grimm, N.B.; Faeth, S.H.; Golubiewski, N.E.; Redman, C.L.; Wu, J.G.; Bai, X.M.; Briggs, J.M. Global change and the ecology of cities. Science 2008, 319, 756–760. [Google Scholar] [CrossRef] [Green Version]
  4. Folke, C.; Jansson, A.; Larsson, J.; Costanza, R. Ecosystem by cities appropriation. Ambio 1997, 26, 167–172. [Google Scholar]
  5. Hu, S.; Chen, L.Q.; Li, L.; Wang, B.Y.; Yuan, L.N.; Cheng, L.; Yu, Z.Q.; Zhang, T. Spatiotemporal dynamics of ecosystem service value determined by land-use changes in the urbanization of Anhui province, China. Int. J. Environ. Res. Public Health 2019, 16, 5104. [Google Scholar] [CrossRef] [PubMed] [Green Version]
  6. Yuan, J.; Bian, Z.; Yan, Q.; Pan, Y. Spatio-temporal distributions of the land use efficiency coupling coordination degree in mining cities of western China. Sustainability 2019, 11, 5288. [Google Scholar] [CrossRef] [Green Version]
  7. Ji, X.M.; Wang, K.; Ji, T.; Zhang, Y.H.; Wang, K. Coupling analysis of urban land use benefits: A case study of Xiamen city. Land 2020, 9, 155. [Google Scholar] [CrossRef]
  8. Yu, J.; Zhou, K.; Yang, S. Land use efficiency and influencing factors of urban agglomerations in China. Land Use Policy 2019, 88, 104143. [Google Scholar] [CrossRef]
  9. Gao, P.; Niu, X.; Wang, B. Land use changes and its driving forces in hilly ecological restoration area based on gis and rs of northern china. Sci. Rep. 2015, 5, 11038. [Google Scholar] [CrossRef] [Green Version]
  10. Su, S.L.; Xiao, R.; Jiang, Z.L.; Zhang, Y. Characterizing landscape pattern and ecosystem service value changes for urbanization impacts at an eco-regional scale. Appl. Geogr. 2012, 34, 295–305. [Google Scholar] [CrossRef]
  11. Yang, L.; Xie, Y.W.; Zong, L.L.; Qiu, T.; Jiao, J.Z. Land use optimization configuration based on multi- objective genetic algorithm and FLUS model of agro-pastoral ecotone in Northwest China. J. Geo-Inf. Sci. 2020, 22, 568–579. [Google Scholar]
  12. Deng, J.L. Grey dynamic model (GM) and its application in long-term grain forecasting. Nat. Explor. 1984, 3, 37–43. [Google Scholar]
  13. Deng, J.L. Grey System Forecast and Decision; Huazhong University of Science and Technology Press: Wuhan, China, 1986; pp. 45–109. [Google Scholar]
  14. Wang, Q.F. System Dynamics, 2nd ed.; Tsinghua University Press: Beijing, China, 1994; pp. 26–90. [Google Scholar]
  15. Forrester, J.W. Industrial dynamics: A major breakthrough for decision makers. Harv. Bus. Rev. 1958, 36, 37–66. [Google Scholar]
  16. Atkinson, R.C. A markov model for discrimination learning. Psychometrika 1958, 23, 4. [Google Scholar] [CrossRef]
  17. Chuvieco, E. Integration of linear programming and GIS for land-use modelling. Int. J. Geogr. Inf. Sci. 1993, 7, 1. [Google Scholar] [CrossRef]
  18. Zhang, H.H.; Zeng, Y.N.; Jin, X.B.; Shu, B.Y.; Zhou, Y.K.; Yang, X.H. Simulating multiobjective land use optimization allocation using Multiagent system: A case study in Changsha, China. Ecol. Model. 2016, 320, 334–347. [Google Scholar] [CrossRef]
  19. Li, X.; Ye, J.A. Cellular automata based on neural network and simulation of complex land use system. Geogr. Res. 2005, 1, 19–27. [Google Scholar]
  20. Zhang, Y.X.; Wei, H.; Na, J.M.; Ou, W.X.; Lan, J.; Lu, X. Construction of urban ecological security pattern based on MCR model: A case study of Pingliang, Gansu Province. J. Nanjing Norm. Univ. Nat. Sci. Ed. 2021, 624, 1–13. [Google Scholar]
  21. Yang, K.; Cao, Y.G.; Feng, Z.; Geng, B.J.; Feng, Y.; Wang, S.F. Research progress of ecological security pattern construction based on minimum cumulative resistance model. J. Ecol. Rural. Environ. 2021, 3705, 555–565. [Google Scholar]
  22. Yu, C.L.; Liu, D.; Feng, R.; Tang, Q.; Guo, C.L. Construction of ecological security pattern in Northeast China based on MCR model. Acta Ecol. Sin. 2021, 4101, 290–301. [Google Scholar]
  23. Chen, B.F.; Zhang, Y.M.; Jiang, D. Research on urban land expansion in fuzhou based on ca-abm model. Prog. Geogr. 2017, 3605, 626–634. [Google Scholar]
  24. Li, X.; Ma, X.D.; Xiao, C.J.; Ou, M.H. The Regional Land Use Layout Optimization Based on CLUE-S Model. Econ. Geogr. 2015, 3501, 162–167. [Google Scholar]
  25. Liu, X.; Zhao, Y.X.; Feng, X.M.; Wu, A.B.; Li, R.H. Simulation and Optimization of Multi-objective Land Use on CLUE-S model: A case study of the Three Northern Counties of Langfang in Hebei Province. Geogr. Geo-Inf. Sci. 2018, 3405, 92–98. [Google Scholar]
  26. Lin, P.F.; Zheng, R.B.; Hong, X.; Zheng, X.; Zheng, W.L. Simulation of land use spatial layout based on FLUS model A case study of Huadu District, Guangzhou. Land Nat. Resour. Res. 2019, 2, 7–13. [Google Scholar]
  27. Zhang, Z.M.; Liu, P.H.; Zhu, S.H. Delimitation of Urban Land Growth Boundary Based on FLUS Model: A Case Study of Linchuan District. Acta Agric. Jiangxi 2018, 3005, 117–123. [Google Scholar]
  28. Liu, X.P.; Liang, X.; Li, X.; Xu, X.C.; Ou, J.P.; Chen, Y.M.; Li, S.Y.; Wang, S.J.; Pei, F.S. A future land use simulation model (FLUS) for simulating multiple land use scenarios by coupling human and natural effects. Landsc. Urban Plan. 2017, 168, 96–116. [Google Scholar] [CrossRef]
  29. Zhao, L.F.; Liu, X.P.; Liu, P.H.; Chen, G.Z.; He, J.L. Urban Expansion Simulation and Early Warning based on Geospatial Partition and FLUS Model. J. Geo-Inf. Sci. 2020, 2203, 517–530. [Google Scholar]
  30. Huang, K.; Dai, W.Y.; Huang, W.L.; Ou, H. Study on the Delimitation of Urban Growth Boundary based on FLUS Model and kinetic energy theorem. J. Geo-Inf. Sci. 2020, 2203, 557–567. [Google Scholar]
  31. Wang, B.S.; Liao, J.F.; Zhu, W.; Qiu, Q.Y.; Wang, L.; Tang, L.N. The weight of neighborhood setting of the FLUS model based on a historical scenario: A case study of land use simulation of urban agglomeration of the Golden Trangle of Southern Fujian in 2030. Acta Ecol. Sin. 2019, 3912, 4284–4298. [Google Scholar]
  32. Zhang, J.D.; Mei, Z.X.; Lu, J.H.; Chen, J.Z. Simulating Multiple Land Use Scenarios based on the FLUS Model Considering Spatial Autocorrelation. J. Geo-Inf. Sci. 2020, 2203, 531–542. [Google Scholar] [CrossRef]
  33. Lin, W.B.; Sun, Y.M.; Nijhuis, S.; Wang, Z.L. Scenario-based flood risk assessment for urbanizing deltas using future land-use simulation (FLUS): Guangzhou Metropolitan Area as a case study. Sci. Total Environ. 2020, 739, 139899. [Google Scholar] [CrossRef] [PubMed]
  34. Zhu, S.H.; Shu, B.R.; Ma, X.D.; Liang, X.; Yao, Q. The Delineation of Urban Growth Boundary Based on the Idea of “Anti-planning” and FLUS Model: A Case Study of Jiawang District, Xuzhou City. Geogr. Geo-Inf. Sci. 2017, 3305, 80–86. [Google Scholar]
  35. Zhang, S.Y.; Liu, X.P.; Yan, S.Z.; Zhan, Q.; Liu, T.Q. Delineation of Urban Development Boundaries Using Two Basic Evaluations and FLUS-UGB: A Case Study of Changchun. Trop. Geogr. 2019, 3903, 377–386. [Google Scholar]
  36. Su, Y.Q.; Liu, G.; Zhao, J.B.; Niu, J.J.; Zhang, E.Y.; Guo, L.G.; Lin, F. Multi-scenario simulation prediction of ecological space in the Fenhe River Basin using the FLUS model. Arid Zone Res. 2021, 3804, 1152–1161. [Google Scholar]
  37. He, D.; Jin, F.J.; Zhou, J. The Changes of Land Use and Landscape Pattern Based on Logistic-CA-Markov Model—A Case study of Beijing-Tianjin-Hebei Metropolitan Region. Sci. Geogr. Sin. 2011, 3108, 903–910. [Google Scholar]
  38. Yue, D.X.; Yang, C.; Jiang, B.H.; Guo, J.J.; Xu, X.F. Spatial-temporal Prediction of the biocapacity in the Shiyang River on the basis of the CA-Markov model. Acta Ecol. Sin. 2019, 3906, 1993–2003. [Google Scholar]
  39. Sun, D.Z.; Liang, Y.J. Multi-scenario simulation of land use in the Loess Plateau based on improved Markov-CA model. J. Geo-Inf. Sci. 2021, 2305, 825–836. [Google Scholar]
  40. Lauf, S.; Haase, D.; Hostert, P.; Lakes, T.; Kleinschmit, B. Uncovering land-use dynamics driven by human decision-making-combined model approach using cellular automata and system dynamics. Environ. Model. Softw. 2012, 27–28, 71–82. [Google Scholar] [CrossRef]
  41. Xu, X.M.; Du, Z.Q.; Zhang, H. Integrating the system dynamic and cellular automata models to predict land useand land cover change. Int. J. Appl. Earth Obs. Geoinf. 2016, 52, 568–579. [Google Scholar] [CrossRef]
  42. Wang, L.P.; Jin, X.B.; Du, X.D.; Zhou, Y.K. Land use scenario simulation of Foshan City based on grey model and cellular automata model. Trans. Chin. Soc. Agric. Eng. 2012, 2803, 237–242. [Google Scholar]
  43. Wang, H.; Liu, Y. Optimal Allocation of Land Resources Based on MOP-CA. Geomat. Inf. Sci. Wuhan Univ. 2009, 3402, 174–177. [Google Scholar]
  44. Wu, M.; Ren, X.Y.; Che, Y.; Yang, K. A coupled SD and CLUE-S model for exploring the impact of land use change on eco-system service value: A case study in Baoshan district, Shanghai, China. Environ. Manag. 2015, 5602, 402–419. [Google Scholar] [CrossRef] [PubMed]
  45. Wei, W. Land use optimal allocation based on CLUE-S and MCR model in Shiyang River Basin. Ph.D. Thesis, Lanzhou University, Lanzhou, China, 6 June 2018. [Google Scholar]
  46. Zhu, C.J.; Tian, B.; Zhou, Y.X.; Fan, Z.Q. Wetland Change Analysis and Forecasting in Pudong New Area Using Markov and CLUE-S Model. J. Fudan Univ. Nat. Sci. 2015, 5404, 431–438. [Google Scholar]
  47. Lin, Y.L.; Zhao, J.S.; Chen, G.P.; Zhang, M. Optimization of regional Territory Space pattern Based on MCR-FLUS-Markov Model. Trans. Chin. Soc. Agric. Mach. 2021, 5204, 159–170. [Google Scholar]
  48. Zhang, X.R.; Li, A.N.; Wang, C.B.; Lei, G.B. Multi-scenario Simulation of Land Use Change Along China-Pakistan Economic Corridor through Coupling FLUS Model with SD Model. J. Geo-Inf. Sci. 2020, 2212, 2393–2409. [Google Scholar]
  49. Pan, J.H.; Shi, P.J.; Zhao, R.F. Research on Optimal Allocation Model of Land Use Structure Based on LP-MCDM-CA model: The Case of Tianshui. J. Mt. Sci. 2010, 2804, 407–414. [Google Scholar]
  50. Zhang, M.M.; Zhang, R.Q.; Hao, J.M.; Ai, D. The Scenarios Simulation Analysis of Driving Forces of Wetland Landscape Evolution Using ANN-CA in Yinchuan Plain. J. Geo-Inf. Sci. 2014, 1603, 418–425. [Google Scholar]
  51. Yan, Y.H.; Guo, Z.J.; Wang, W.Y.; Xu, Y.Z. Research on Landscape Pattern Changes and Prediction in port City Based on ANN-CA Model: A Case Study of the West Coast of Jiaozhou Bay. Resour. Environ. Yangtze Basin 2020, 2907, 1507–1514. [Google Scholar]
  52. Lu, J.H.; Mei, Z.X.; Zhao, S.F.; Xiao, Y.Y. Land Use Optimization Allocation Based on Chaos Ant Colony Algorithm. J. Geo-Inf. Sci. 2017, 1908, 1026–1035. [Google Scholar]
  53. Liu, X.P.; Li, X.; Shi, X.; Huang, K.N.; Liu, Y.L. A multi-type ant colony optimization (MACO) method for optimal land use allocation in large areas. Int. J. Geogr. Inf. Sci. 2012, 2607, 1325–1343. [Google Scholar] [CrossRef]
  54. Stewart, T.J.; Janssen, R.; Van Herwijnen, M. A genetic algorithm approach to multiobjective land use planning. Comput. Oper. Res. 2004, 3114, 2293–2313. [Google Scholar] [CrossRef]
  55. Liu, Y.; Yuan, M.; He, J.H.; Yuan, F.L. Regional land-use allocation with a spatially explicit genetic algorithm. Landsc. Ecol. Eng. 2015, 1101, 209–219. [Google Scholar] [CrossRef]
  56. Cao, K.; Huang, B.; Wang, S.W.; Hui, L. Sustainable land use optimization using Boundary-based Fast Genetic Algorithm. Comput. Environ. Urban. Syst. 2012, 3603, 257–269. [Google Scholar] [CrossRef]
  57. Liu, Y.L.; Xia, Y.; Liu, D.F.; Hong, X.F. Optimization of Land Use Zoning based on Programming and Simulated Annealing. Geomat. Inf. Sci. Wuhan Univ. 2012, 3707, 762–765. [Google Scholar]
  58. Wang, D.W.; Li, F.X.; Chen, D. Eesearch on Optimal Land Use Allocation Based on Pareto optimal and Multi-particle Swarm Algorithm. Resour. Environ. Yangtze Basin 2019, 2809, 2019–2029. [Google Scholar]
  59. Ul Din, S.; Mak, H.W.L. Retrieval of Land-Use/Land Cover Change (LUCC) Maps and Urban Expansion Dynamics of Hyderabad, Pakistan via Landsat Datasets and Support Vector Machine Framework. Remote Sens. 2021, 13, 3337. [Google Scholar] [CrossRef]
  60. Zhang, D.C.; Liu, X.P.; Yao, Y.; Zhang, J. Simulation Spatiotemporal Change of Multiple Land Use Types in Dongguan City by using Random Forest Based on Cellular Automata. Geogr. Geo-Inf. Sci. 2016, 3205, 29–36. [Google Scholar]
  61. Ma, B.Y.; Huang, J.; Li, S.C. Optimal allocation of land use types in the Beijing-Tianjin-Hebei urban agglomeration based on ecological and economic benefits trade-offs. Prog. Geogr. 2019, 3801, 26–37, (In Chinese with English abstract). [Google Scholar]
  62. Zhao, X.; Peng, J.D.; Fan, Z.Y.; Yang, C.; Yang, H. Land Use Simulation and Urban Growth Boundaries Delineation in Wuhan Metropolitan Area based on FLUS model and “Dual Environment Evaluation”. J. Geo-Inf. Sci. 2020, 2211, 2212–2226. [Google Scholar]
  63. Wang, X.; Ma, B.; Li, D.; Chen, K.; Yao, H.S. Multi-scenario simulation and prediction of ecological space in Hubei Province based on FLUS model. J. Nat. Resour. 2020, 3501, 230–242. [Google Scholar]
  64. Luo, S. Study on Optimization for the Land Use Structure in the Process of Urbanization in Hengyang City. Master’s Thesis, Hunan Agricultural University, Changsha, China, 7 June 2011. [Google Scholar]
  65. Yu, M. Study on Cropland Spatio-temporal Dynamics Change Detection in Hengyang Basin on Remote Sensing Time Series Analysis. Master’s Thesis, China University of Geosciences, Beijing, China, 2 June 2020. [Google Scholar]
  66. Wang, K.; Cai, Z.H.; Qi, Z.X.; Chen, J.; Li, H.; Li, T.; Feng, Q. The impact of land use pattern change on ecosystem services in Hengyang City in 2000 and 2013. Chin. J. Eco-Agric. 2017, 2507, 1060–1070. [Google Scholar]
  67. Shi, L.; He, Q.H.; Xiao, X. Study on the Eco-environmental Effect of Land Use Change in the Main Urban Area of Hengyang City. Anhui Agric. Sci. Bull. 2019, 25Z1, 119–124. (In Chinese) [Google Scholar]
  68. Bai, J.J.; Wang, Z.Y.; Qi, Z.X. Research on Grey Correlation Degree between Construction Land Structure and Economic Development in Hengyang City. Chin. Foreign Archit. 2020, 10, 113–116. [Google Scholar]
  69. Wang, P.; Kuang, F.M.; Deng, Y.W.; Tian, Y.P.; Ouyang, S.L. Assessment of Land Ecological Security in Red Soil Hilly Region of South Hunan: A Case Study of Hengyang City. Res. Soil Water Conserv. 2013, 2003, 243–248. [Google Scholar]
  70. Wang, P.; Xu, W.D.; Deng, Y.W.; Tian, Y.P. On Dynamic Evaluation of Land Ecological safety in the Process of Urbanization: A case study of Hengyang City. J. Hengyang Norm. Univ. 2016, 3703, 81–86. [Google Scholar]
  71. Zhang, C.C.; Wang, P.; Xiong, P.S.; Zhang, Y. Evaluation and Dynamic Analysis of Land Ecological Security Based on PSR Model—Taking Hengyang City as An Example. J. Hengyang Norm. Univ. 2020, 4103, 111–116. [Google Scholar]
  72. Huang, F.Q.; Wang, Z.Y.; Liu, H.; Qi, Z.X.; Wu, X.X. Delimitation of Urban Growth Boundaries Based on Ecosystem Service Value: A Case Study of Hengy- ang Central Area. J. Ecol. Rural. Environ. 2020, 3609, 1115–1125. [Google Scholar]
  73. Yiftachel, O.; Hedgcock, D. Urban social sustainability: The planning of an Australian city. Cities 1993, 10, 139–157. [Google Scholar] [CrossRef]
  74. Brelsford, C.; Lobo, J.; Hand, J.; Bettencourt, L.M. Heterogeneity and scale of sustainable development in cities. Proc. Natl. Acad. Sci. USA 2017, 114, 8963–8968. [Google Scholar] [CrossRef] [Green Version]
  75. Peng, L.; Chen, T.; Wang, Q.; Deng, W. Linking Ecosystem Services to Land Use Decisions: Policy Analyses, Multi-Scenarios, and Integrated Modelling. ISPRS Int. J. Geo-Inf. 2020, 9, 154. [Google Scholar] [CrossRef] [Green Version]
  76. Chang, B.; Chen, L. Land Economic Efficiency and Improvement of Environmental Pollution in the Process of Sustainable Urbanization: Case of Eastern China. Land 2021, 10, 845. [Google Scholar] [CrossRef]
  77. Ding, X.; Zheng, M.; Zheng, X. The Application of Genetic Algorithm in Land Use Optimization Research: A Review. Land 2021, 10, 526. [Google Scholar] [CrossRef]
Figure 1. The location of Hengyang city.
Sustainability 13 10458 g001
Figure 2. Limiting Factors.
Sustainability 13 10458 g002
Figure 3. Influence Factors.
Sustainability 13 10458 g003
Figure 4. Adaptability probability of each land use type.
Sustainability 13 10458 g004
Figure 5. Land use simulation results and actual situation of Hengyang City in 2015 and 2018.
Sustainability 13 10458 g005
Figure 6. Prediction results of the spatial distribution of land use in Hengyang city in 2025.
Sustainability 13 10458 g006
Table 1. Data Resources.
AttributeTypesData Sources
Raster dataLand use dataResources and Environment Science and Data Center (www.resdc.cn (accessed on 26 March 2021))
Vector dataThe road dataNational Catalogue Service For Geographic Information (www.webmap.cn (accessed on 26 March 2021))
City point dataNational Catalogue Service For Geographic Information (www.webmap.cn (accessed on 29 March 2021))
Administrative district dataNational Platform for Common Geospatial Information Services (www.tianditu.cn (accessed on 29 March 2021))
Data on rivers and lakesNational Catalogue Service For Geographic Information (http://www.webmap.cn/ (accessed on 9 April 2021))
natural reserve dataData on Hengyang National Nature Reserve
Table 2. LUCC Classification System.
TypesNameTypesName
Arable Land Paddy Field Glacial Permanent Snow
The Try LandTidal Marsh
WoodlandForest LandBeaches
Shrub LandConstruction LandCities and Towns
Open Forest LandRural Settlements
Other WoodlandsConstruction Land for Industry and Transportation
The GrassGrassland with High CoverageOther LandsThe Sand
Moderate Grass CoverageThe Gobi
Low Coverage GrassSaline-alkali Land
WatersGraffMarsh Land
LakesBare Land
Reservoir and PondsBare Rock and Gravel Fields
Table 3. OA value and Kappa value of FLUS model.
YearOAKappa
20150.9640.76
20180.950.72
Table 4. Land-use change table.
Types
(ha)
201020152018
AreaPercentageAreaPercentageAreaPercentage
Arable Land 590,321.438.29%589,971.938.28%580,106.737.64%
Woodland865,887.656.17%861,770.755.91%856,449.655.56%
The Grass14,564.80.94%14,293.00.93%13,982.20.91%
Waters30,566.71.98%30,760.92.00%31,304.62.03%
Construction Land39,927.02.59%44,315.92.88%59,307.93.85%
Other Lands271.90.02%271.90.02%233.00.02%
Table 5. Land-use change matrix in 2010 and 2015.
To 2015Total
Arable Land WoodlandThe GrassWatersConstruction LandOther Lands
From 2010
Arable Land 581,427.26408.538.8233.02213.90.0590,380.5
Woodland7573.7854,663.0116.5388.43146.00.0865,974.2
The Grass271.9155.414,137.60.00.00.014,566.3
Waters233.0155.40.030,139.438.80.030,569.7
Construction Land621.4388.40.00.038,917.20.039,931.0
Other Lands0.00.00.00.00.0271.9271.9
Total590,127.2 861,770.7 14,292.9 30,760.9 44,315.9 271.9 1,541,539.4
Table 6. Land-use change matrix in 2015 and 2018.
To 2018Total
Arable Land WoodlandThe GrassWatersConstruction LandOther Lands
From 2015
Arable Land 553,773.5 24,313.5 388.4 1514.7 9981.7 0.0 590,030.9
Woodland22,138.5 82,8601.7 349.6 1281.7 9399.2 0.0 861,856.8
The Grass466.1 427.2 13,244.3 0.0 155.4 0.0 14,294.4
Waters1126.3 893.3 0.0 28,352.8 388.4 0.0 30764.0
Construction Land2563.4 2213.9 0.0 155.4 39,383.2 0.0 44,320.3
Other Lands38.8 0.0 0.0 0.0 0.0 233.0 271.8
Total580,106.7 856,449.6 13,982.2 31,304.6 59,307.9 233.0 1,541,384.1
Table 7. Conversion of land types to ecological land (woodland/grassland/water area) from 2010 to 2015 and from 2015 to 2018.
Conversion Types (ha)2010–20152015–2018
AreaPercentageArea Percentage
No conversion of ecological land898,94058.31%865,198.856.13%
Ecological land conversion815.70.05%2951.80.19%
Conversion of arable land to ecological land6680.30.43%26,216.61.7%
Conversion of construction land to ecological land388.40.03%2369.30.15%
Conversion of other lands to ecological land00%00%
Other conversion conditions599,352.438.88%670,952.241.49%
Table 8. The number of pixels for land use type of Hengyang City in 2015 and predicted results in 2015.
YearCultivated LandWoodlandThe GrassWaters Construction LandOther Lands
Actual quantity in 20156,554,6209,554,202164,375493,918348,3052973
Forecast quantity in 20156,554,6209,554,202164,375493,918348,3052973
Actual quantity in 20186,457,8149,499,920161,201653,065348,3142276
Forecast quantity in 20186,454,9979,497,766161,152652,991349,2112276
Error between predicted and actual quantities in 2018 (%)−0.04%−0.02%−0.03%−0.01%0.26%0%
Table 9. Number of pixels predicted by Markov chain.
YearArable LandWoodlandThe GrassWatersConstruction LandOther Lands
20186,454,9859,497,788161,147349,214652,9832276
20256,454,9979,497,766161,152349,211652,9912267
Publisher’s Note: MDPI stays neutral with regard to jurisdictional claims in published maps and institutional affiliations.

