
A Novel Emergency Evacuation Model of Subway Station Passengers Considering Personality Traits


1
The Key Laboratory of Road and Traffic Engineering, Ministry of Education, Tongji University, Shanghai 200092, China
2
College of Design, Construction and Planning, University of Florida, Gainesville, FL 32611, USA
3
Urban Transport Institute, China Academy of Urban Planning and Design, Beijing 100044, China
*
Authors to whom correspondence should be addressed.
Sustainability 2021, 13(18), 10463; https://0-doi-org.brum.beds.ac.uk/10.3390/su131810463
Submission received: 30 June 2021
/
Revised: 6 September 2021
/
Accepted: 16 September 2021
/
Published: 20 September 2021
(This article belongs to the Special Issue Sustainable Public Transportation and Accident Prevention)
Abstract
:Subway station emergencies have caused serious casualties in recent years, so the aim of this research was to develop and establish an evacuation model that considers the OCEAN personality psychological traits to improve the credibility of the emergency pedestrian evacuation simulation. Firstly, the relationship between the personality and psychological stress was established based on the reconstruction of a passenger’s personality traits. Secondly, the relationship between the expected speed and a passenger’s personality traits was modified based on the social force model. Finally, the simulation was carried out using the Anylogic software. The results show that as the value of the personality increases, the evacuation time of personalities and gradually increases, but the opposite effect is observed for personalities and. Similarly, as the value of personality traits increases, the speed of personalities and gradually decreases, but the opposite effect is observed for personalities and. Only during peak periods, as the value of personality traits increases, the density of the connecting area of passengers with personality traits and gradually increases; on the contrary, that of passengers with personality traits and gradually decreases. The conclusion of this study is that different personality traits have different effects on evacuation behavior, which enriches the model of pedestrian evacuation further.
1. Introduction
With developing urbanization in China, a total of 3394 stations had been put into operation by 2018, and the annual amount of passengers on the urban rail transit reached 21.07 billion [1]. However, the number of deaths and injuries caused by subway accidents is gradually increasing around the world such as the Austrian Metro accident (150 people killed) and a terrorist attack in the Moscow Metro (41 people killed) [2]. Therefore, the evacuation model of subway station crowds has always been a research hotspot. There has been a number of studies on emergency evacuation in China and abroad. The most classic evacuation models are the social force model [3] and the cellular automata model [4].
According to the classic models above, different improved models are proposed based on different rules [5,6,7]. However, these models are all used to describe simulation of the evacuation behavior, which lacks a comprehensive analysis of the evacuation environment and the evacuees’ psychological action. What happens when the personality traits of passengers are introduced into the classic evacuation model?
The purpose of this paper was to establish an evacuation model combined with the passengers’ personality traits to simulate the passengers’ emergency evacuation behavior more accurately and truly and provide a basis for a more reasonable evacuation plan. The scope of this study was the evacuation of passengers with different personality traits during peak and off-peak periods of the passenger flow at subway stations. Firstly, the passengers’ personality traits were modeled. Secondly, the quantitative relationship between the passengers’ personality traits and psychological stress was established. Thirdly, the relationship between the expected speed and the social force model was modified based on the passengers’ personality traits. Finally, the simulation evaluation was carried out with the Anylogic software to verify the difference in evacuation indexes of the passengers with different personality traits in an emergency evacuation.
In the remainder of this paper, Section 2 provides a summary of literature findings on the personality traits and the evacuation model and highlights literature limitations. The method of the study is presented in Section 3, including the personality model, the simulation method and the calculation method for psychological stress. The results of the analysis and the findings are shown in Section 4. Section 5 concludes with a discussion of our findings and suggestions for further research in the future.
2. Literature Review
At present, the most widely used evacuation models are the social force model and the cellular automata model. The social force model is a continuous model proposed by Helbing [3], which considers the social interaction forces from other pedestrians and the forces from obstacles and the desired force of a pedestrian. However, the social force model assumes that the expected speed of pedestrians is fixed. With the change in a pedestrian’s psychological state, the expected speed changes accordingly. The cellular automata model is a representative discrete model proposed by Blue [4], which establishes rules for the evacuees’ movement and makes them more homogeneous. The cellular automata model takes less consideration of the evacuees themselves, thus neglecting the differences between the evacuees.
Based on the above classic models, many scholars put forward improved models according to different rules. Lei [8] used the agent model to analyze the effects of evacuation density, exit width, and automatic ticket gates on evacuation time. It was found that adequately increasing the number of exits and widening the exit width could effectively improve the evacuation efficiency. Zhou [9] studied the emergency pedestrian evacuation during terrorist attacks based on the fuzzy logic model. Jingjing Chen [10] combined the field survey data to set the subway scene and pedestrian parameters and built a subway station model based on the social force model and the agent model’s hybrid model. Saboia et al. [11] introduced a mobile grid to improve the social force model. Nishinari [12] considered the optimal path selection in the process of dense crowd movement and established a cellular automata model of the dense crowd flow. Steffen [13] added the visual field factor to the social force model to study the influence of the visual field on the pedestrian evacuation process. These models are all used to describe the simulation of the evacuation behavior, which lacks a comprehensive analysis of the evacuation environment and the evacuees’ psychological action.
In recent years, the correlation between the evacuees’ psychological state and the evacuation behavior characteristics has also been studied in-depth. Shaokuan Chen [14] studied the expected evacuation speed under psychological pressure, established the modified representative speed model, and made changes to the social force model. Jinlong Sun [15] constructed an evacuation model under panic conditions by analyzing people’s behavior characteristics in the state of panic and the factors influencing crowd panic during subway evacuation. Mingliang Xu [16] provided a formula to calculate the panic level considering the influence of physical consumption. Helbing [17] introduced the concept of the panic degree into the social force model to reflect the psychological characteristics of passengers in the passenger movement state. Fruin [18] introduced the concept of panic parameters when studying the evacuation behavior. Although the model above studies the evacuation behavior from the perspective of the psychological state, it takes the crowd as a whole, which ignores the differences in the personality traits of evacuees.
The research on the relationship between personality traits and behavior is also increasing. Costa [19] proposed the Big Five personality model including five personality traits called Openness, Conscientiousness, Extraversion, Agreeableness and Neuroticism, which is referred to as the OCEAN model for short. OCEANOrtony [20] proposed the widely recognized OCC (Ortony, Clore, Collins) emotional cognition model. The Pleasure–Arousal–Dominance Temperament Model was described by Mehrabian (the PAD model) [21]. Durupinar [22,23] established a typical mathematical model between crowd behavior and personality traits and then used the Laban movement analysis theory to map the relationship between personality traits and exercise parameters. Gebhard [24] used the PAD emotional model and the OCEAN personality model to quantify psychological characteristics. Based on the OCC and OCEAN models in psychology, Margaux [25] established a dynamic infection model based on individual personality and interpersonal relationships to deduce the agents’ microbehavior. Zhuxin Xue [26] established the personality behavior model through quantitative personality attributes. The studies above have established the relationship between personality characteristics and some actions, but the research on subway station emergency evacuation has not been carried out.
At present, most of the research on evacuation describes the simulated evacuation behavior, but the descriptions of the evacuees’ psychological state are few. In recent years, a small number of scholars have researched the correlation between the evacuees’ psychological state and the characteristics of evacuation behavior. Still, they regard the crowd’s psychological state as the same and ignore the differences caused by their personality traits [19].
3. Methods
3.1. Analysis of the Passenger Emergency Evacuation Process
In behavioral psychology [27], psychology is the guidance of behavior, and behavior is the embodiment of psychology. Different psychological states produce different actions. Differences in people’s psychological conditions can be described by the “OCEAN” personality traits (“Big Five” personality traits) [26]. When an emergency occurs, passengers are affected by the external environment, and passengers with different personality traits have different psychological states and exhibit different evacuation behaviors. The emergency evacuation process considering the passengers’ personality traits is shown in Figure 1.
In an evacuation, passengers perceive other passengers, obstacles and emergencies and then calculate , and , representing the social interaction forces from other pedestrians, the forces from obstacles and the desired force of a pedestrian. Figure 2 shows the calculation flow of various points. As shown in Figure 3, when an emergency occurs, the psychological stress of passengers changes. This paper calculates the psychological stress of passengers based on their personality traits.
3.2. Modeling of the Passengers’ Personality Traits
3.2.1. Summary of the OCEAN Personality Theory
Several generations of psychologists have found that five traits can cover all aspects of personality description. The five characteristics are openness, conscientiousness, extraversion, agreeableness and neuroticism. Based on the English initials of the five dimensions, the model is called the “OCEAN personality model” [26,28], also known as the “Big Five” personality model. Openness, conscientiousness, extraversion, agreeableness and neuroticism reflect the individual’s imagination and curiosity, organization and motivation of the object-oriented behavior, the degree of the individual’s active involvement in the external world, the differences in individual cooperation and social harmony, and the tendency to experience negative emotions, respectively. As the most influential personality theoretical model globally, the OCEAN personality model has been widely studied by psychology researchers in the past 50 years and has been proved to be consistent and stable across languages, cultures, situations and evaluators. At present, the definition from Costa and McCrae’s [28] test manual is highly accepted around the world. The traits of various personality dimensions are shown in Table 1. Each trait has positive and negative poles, indicating different degrees of traits.
3.2.2. Quantification of Personality Traits
It is difficult to quantify the passengers’ psychological state, but it is affected by personality traits, so that the psychological state can be regarded as a function of personality traits. To quantify the mental state, the five dimensions of the OCEAN model were quantified and classified according to the degree of traits in the personality test manual. The corresponding relationships are as follows: extremely weak = ±0–0.2, weak = ±0.2–0.4, moderate = ±0.4–0.6, strong = ±0.6–0.8, extremely strong = ±0.8–1. The passenger’s personality traits function P can be formulated as follows:
where , are openness, conscientiousness, extraversion, agreeableness and neuroticism, respectively.
3.2.3. Method of Calculating Psychological Stress Based on Personality Traits
Psychological stress is the result of the change in the passengers’ psychological state. In the process of an emergency evacuation, the behavior of passengers is affected by psychological pressure. In past research, most authors calculated psychological stress based on external environmental factors but did not explore the reasons for passengers’ personality traits. In psychology, personality is a long-term fixed characteristic of a human being [29]. When an emergency occurs, passengers are affected by the surrounding environment, have different psychological pressure due to their personality traits and exhibit different evacuation behaviors. Therefore, this paper establishes a method of calculating psychological stress based on the personality traits of passengers.
Panic is a deep psychological reaction state in the face of an emergency [2]. To a certain extent, panic makes people lose the decision-making power and the action power; people’s psychological stress changes with the degree of panic. Patience is an important indicator of whether a person is steady or not, which affects the change of psychological pressure [26]. Based on the research above, the method of calculating a passenger’s psychological stress was developed to realize the quantitative analysis of a passenger’s psychological stress in an evacuation. Generally, a passenger’s psychological stress can be defined as a value between 0 and 1, where 0 and 1 are, respectively, the state of no pressure and absolute pressure. The relationship between psychological pressure and the psychological state is as follows:
where the psychological pressure of passengers and andare weight coefficients of the panic degree and the patience degree, respectively, with + = 1, and the average value is taken; andare functions of a passenger’s panic and a passenger’s patience, respectively.
According to the existing research [22], a passenger’s panic psychology depends on such personality traits as conscientiousness and neuroticism. The function to calculate the degree of panic is as follows:
where and and are weight coefficients of neuroticism and conscientiousness, respectively, with + = 1; the average value is taken.
In previous studies [22], the degree of a passenger’s patience depends on extroversion, agreeableness and conscientiousness. The function for calculating the degree of patience is as follows:
where and and are weight coefficients of extroversion, agreeableness and conscientiousness, respectively, with + + = 1; the average value is taken.
3.3. Expected Speed Model Considering Personality Traits
The social force model is widely used in the analysis of pedestrian movement characteristics. Its walking mechanism is realized by analyzing the change process of the pedestrians’ behaviors. The basic model [3] is as follows:
In the social force model, pedestrians are subjected to three different types of forces, which are the desired force of a pedestrian , the social interaction forces from other pedestrians and the forces from obstacles .
In Equations (8)–(10), , , , and are the pedestrian mass, the expected speed at time t, the expected walking direction, the actual walking speed and the movement relaxation time, respectively.
During an evacuation, the social force model assumes that the pedestrians’ expected speed is constant, which is inconsistent with the actual situation. In the process of an emergency evacuation, the passengers’ expected speed changes due to psychological pressure. However, the psychological stress of passengers is affected by personality traits, so the passengers’ expected speed can be expressed as a function of personality traits. The equation of the modified expected velocity is as follows:
and are the revised expected speed of passengers and the expected speed before modification.
Affected by the passengers’ psychological pressure when the passengers cannot reach the free walking speed corresponding to the psychological state, passengers can adjust their motion to reach it. Therefore, the free walking speed can be regarded as the passengers’ expected speed to assign the expected speed in the simulation process [30]. According to Kholshevnikov’s research, Table 2 [30] shows the quantitative relationship between psychological stress and free walking speed.
3.4. Evacuation Simulation Experiment
In this paper, the Chengdu Shuangliu Airport Station and the Shanghai Hongqiao Terminal Station were simplified to build a physical simulation model. The simulation input data refer to the Shanghai Hongqiao Terminal Station’s passenger flow data, and the Anylogic software constructed the simulation environment. In the simulation, according to the survey data, 4000 passengers were evacuated in peak periods and 2000 people are evacuated in off-peak periods. The passengers mentioned in this study are “imaginary”. We directly defined the personality traits of the “imaginary passengers”. According to Section 4 of this article, four personality traits mainly affect passenger evacuation and psychological pressure: conscientiousness, extraversion, agreeableness and neuroticism. Extroversion and neuroticism are positively correlated with the passengers’ psychological stress. Conscientiousness and agreeableness are negatively correlated with the passengers’ psychological pressure. Therefore, the passengers with the extraversion ( and neuroticism ( personality traits were considered one research group. The passengers with the conscientiousness ( and agreeableness ( personality traits were taken as another comparative study group.
The steps of the simulation experiment were as follows:
Step 1: A physical simulation model was developed with the Anylogic simulation software.
Step 2: The passengers were divided into two groups based on their personality traits, Group 1 with the extraversion ( and neuroticism ( personality traits and Group 2 with the conscientiousness ( and agreeableness ( personality traits.
Step 3: For the two groups of passengers, the indexes of an emergency evacuation in off-peak periods (2000 persons/h) and peak periods (4000 persons/h) were studied, including evacuation time, evacuation speed and evacuation density in the connecting area.
Step 4: Analysis of the influence of different personality traits on the evacuation behavior.
The subway station’s layout is shown in Figure 4. The length is about 160 m, and the width is about 50 m. The passengers were randomly distributed on the platform floor and the station hall floor. In emergencies, passengers evacuate to exits A, B, C and D using escalators and turnstiles.
4. Results
4.1. Analysis of the Average Evacuation Time
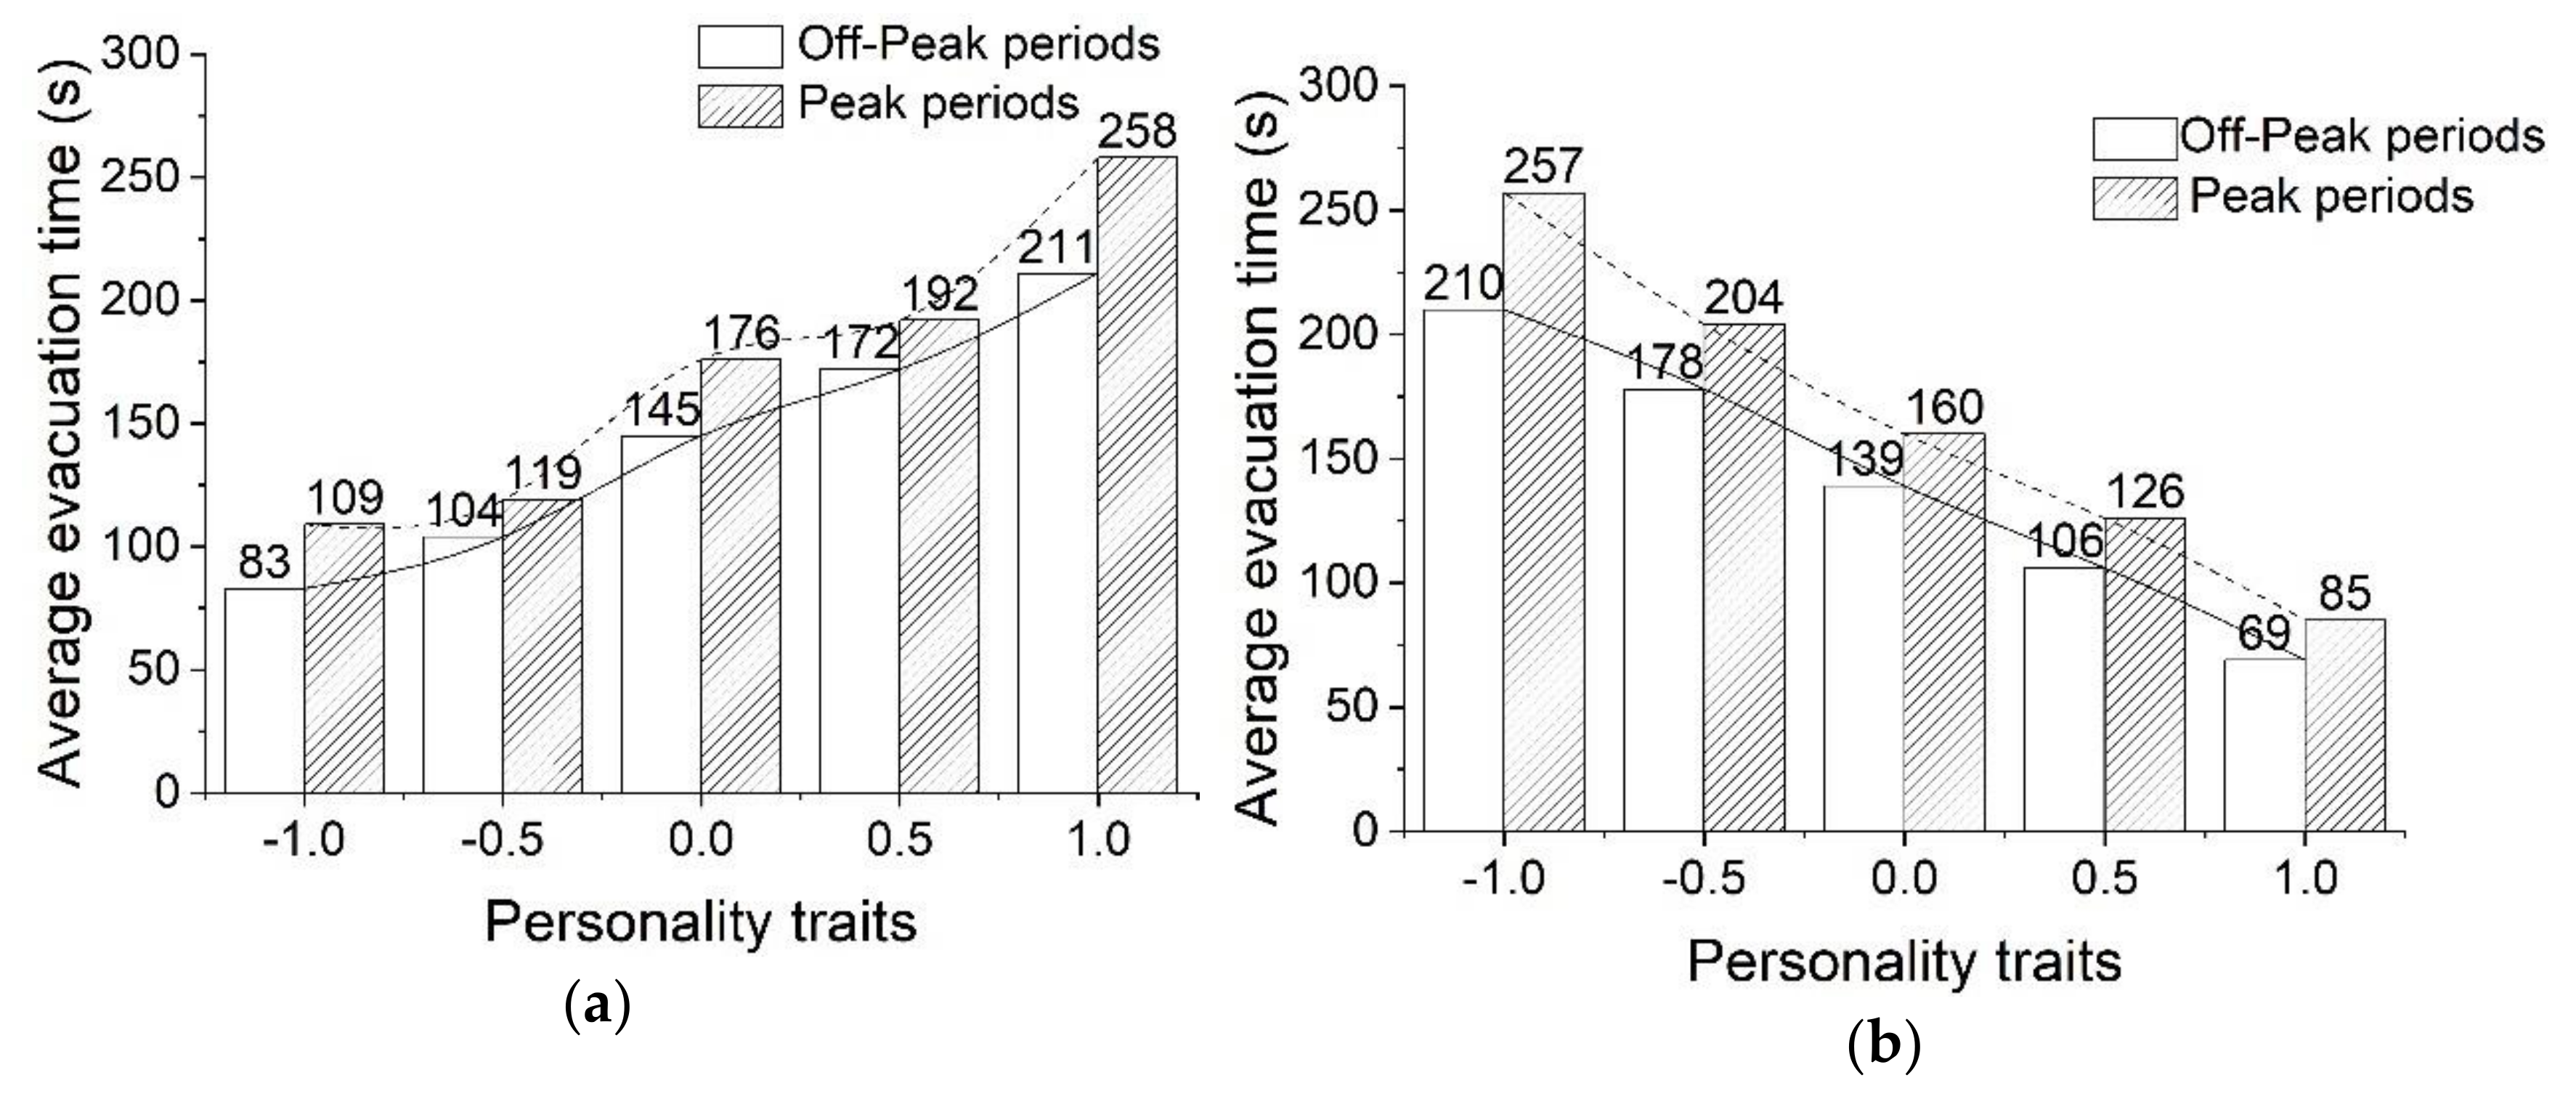
In this study, two groups of passengers with personality trait values of −1, −0.5, 0, 0.5 and 1 were selected to conduct simulation evacuation experiments. The evacuation time simulation results time are shown in Figure 5a,b. The average evacuation time increases with the value of agreeableness (and conscientiousness (. It decreases with the value of neuroticism (and extroversion (.
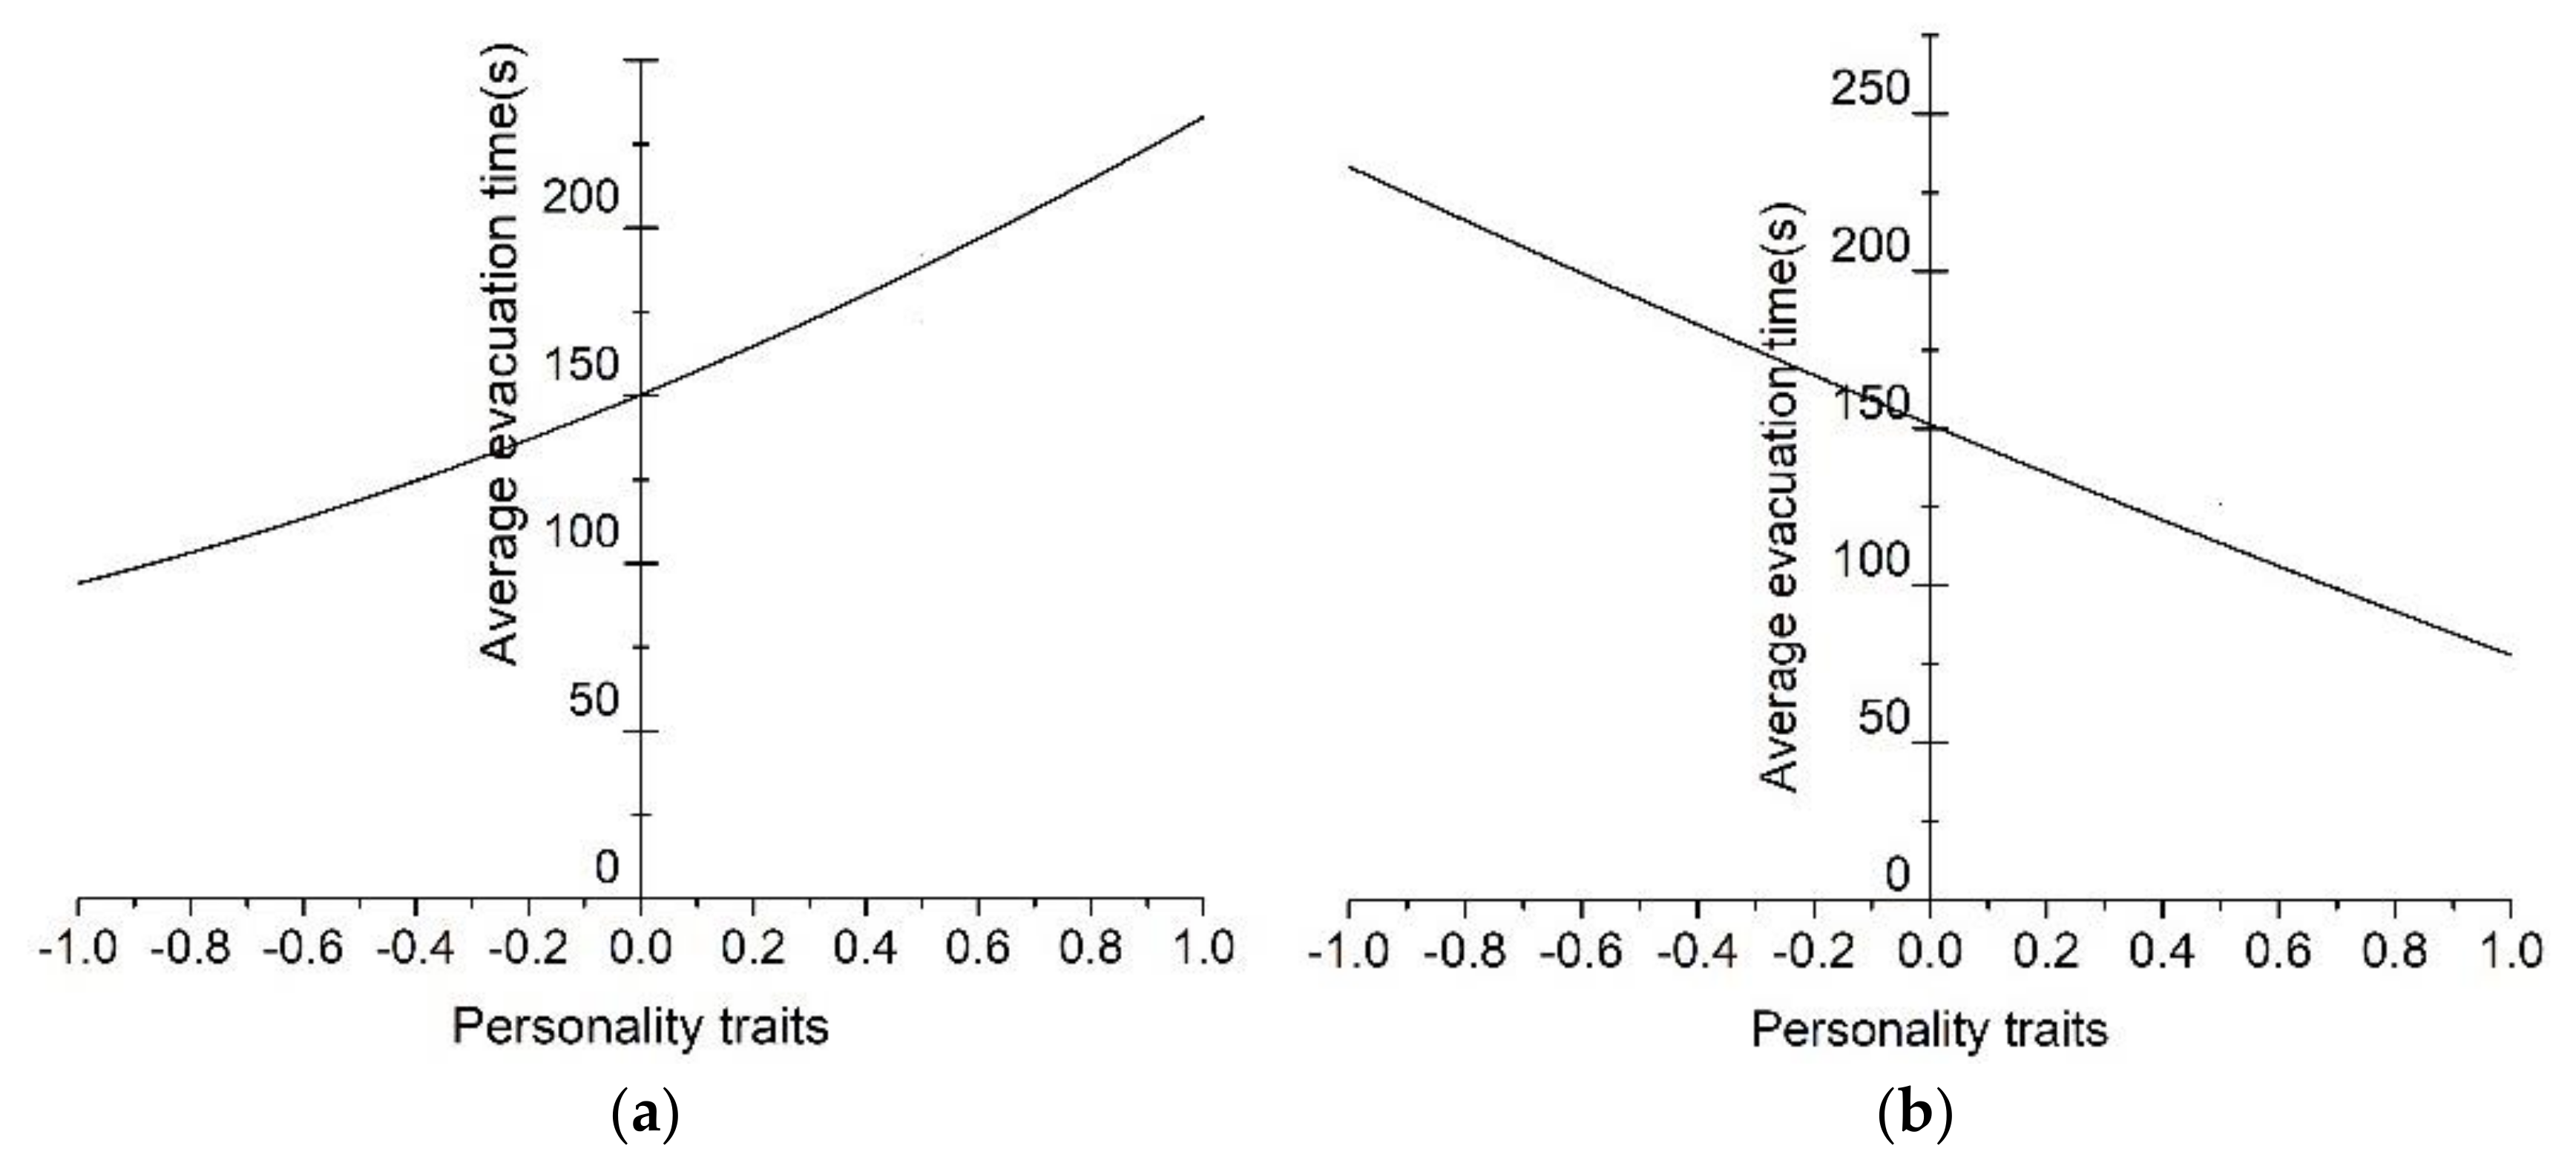
Using the simulation results, we conducted the sensitivity analysis of the passengers with or personality traits regarding the evacuation time, as shown in Figure 6a,b. We found that the evacuation time increased by 6.4 s for every 0.1 unit increase in the personality traits value of ; similarly, the evacuation time decreased by 7.1 s for every 0.1 unit increase in the personality traits value of . The results show that evacuation time is more sensitive to personality traits .
4.2. Analysis of the Average Evacuation Speed
According to the usual assumption, the more significant the difference in personality traits, the more significant the difference in behavior. Based on this assumption, the maximum and minimum values of the personality traits of the two groups of passengers, namely = ±1 and = ±1, were selected to test this hypothesis in this study. The simulated evacuation results are shown in Figure 7, Figure 8, Figure 9 and Figure 10.
4.2.1. Analysis of the Evacuation Speed of Passengers with Personality Traits
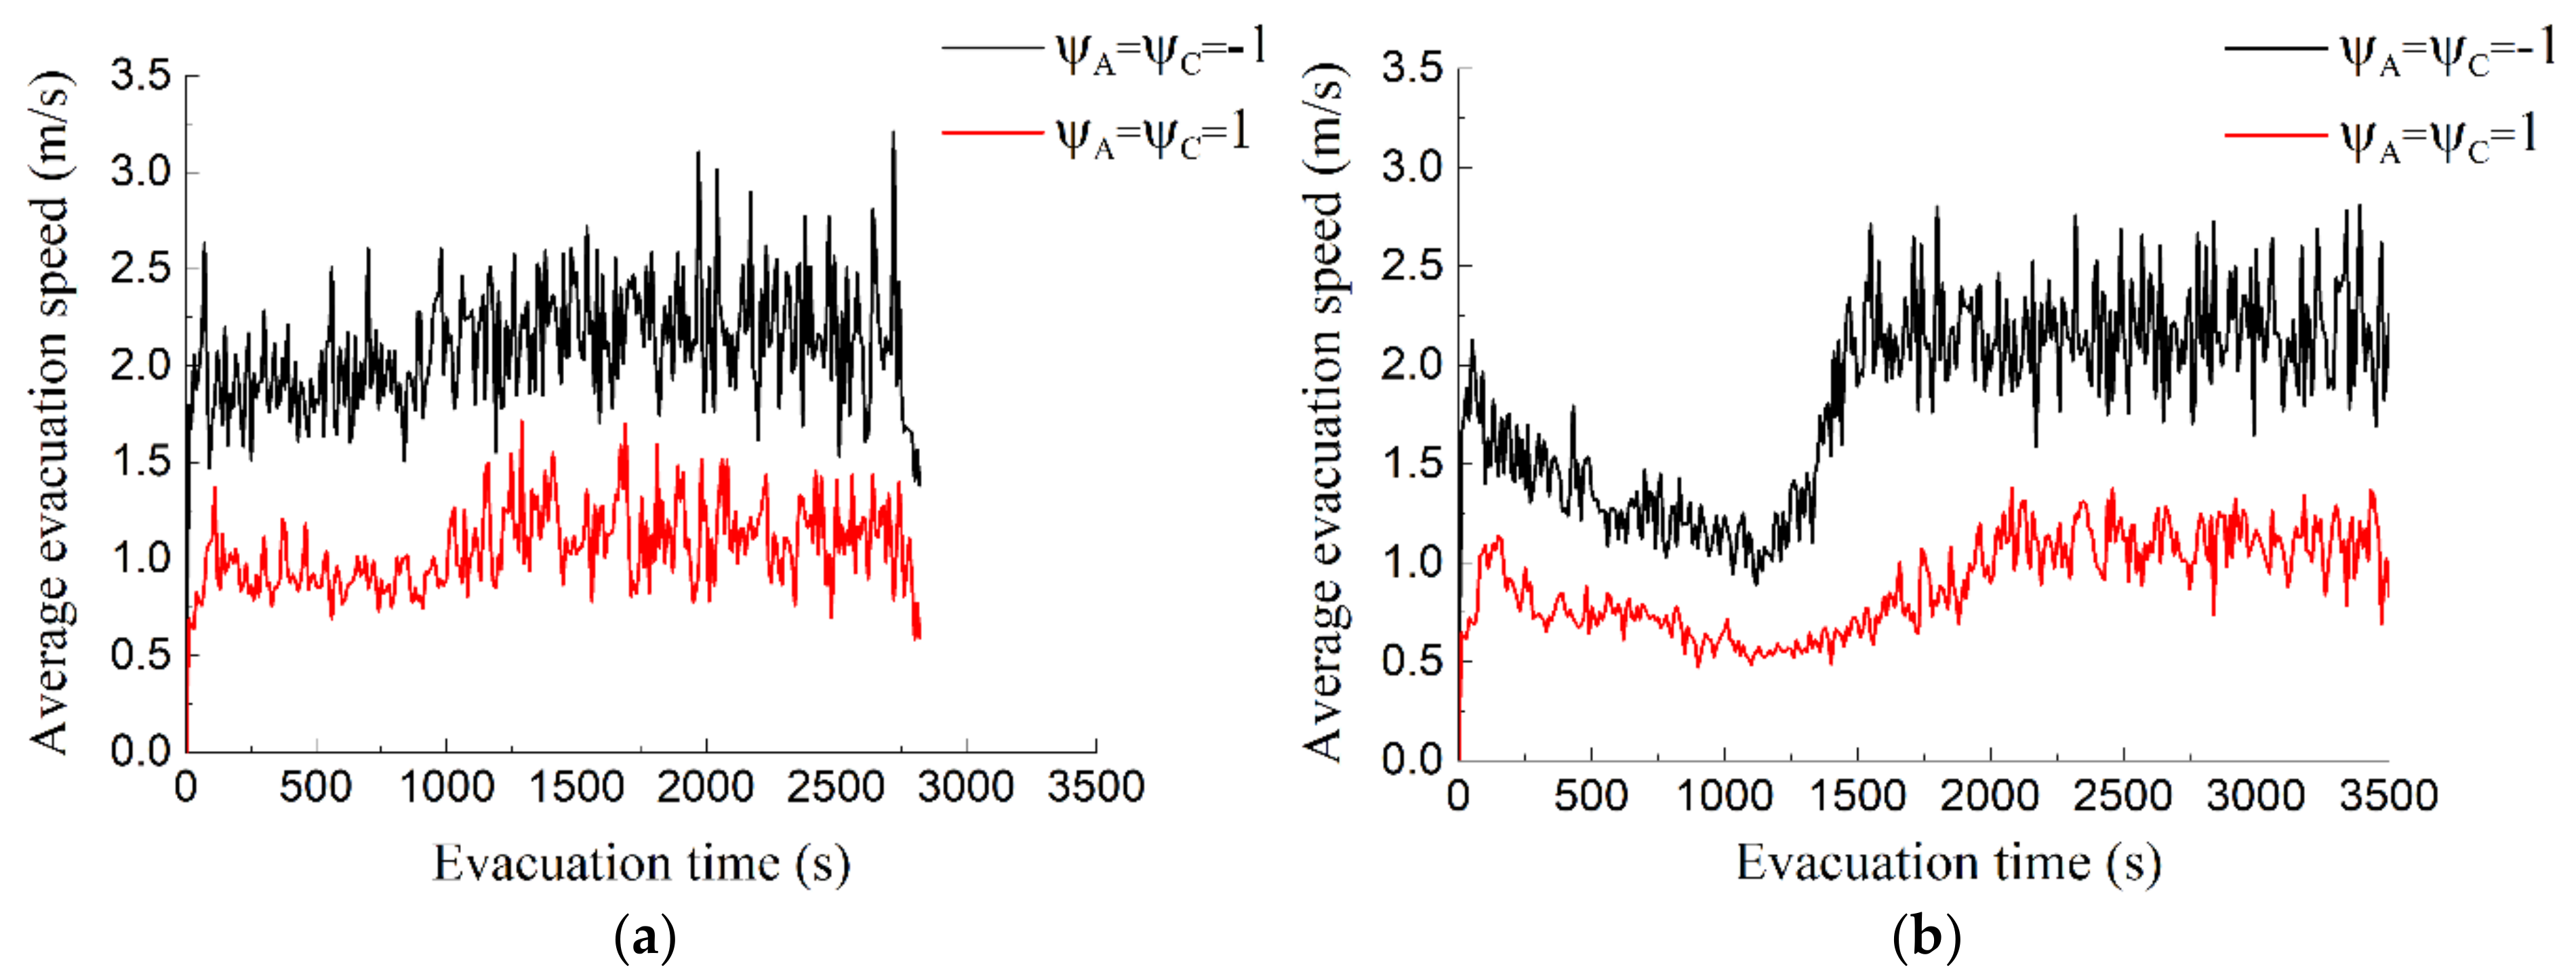
During an evacuation in off-peak periods, the average passenger evacuation speed of the group with personality traits was 2.08 m/s, and that of the group with personality traits was 1.02 m/s. During the evacuation in peak periods, the two groups’ average passenger evacuation speed was 1.84 m/s and 0.87 m/s, respectively. The simulation results show that the average evacuation speed of passengers with was significantly higher than that of passengers with in both peak and off-peak periods. The details are shown in Figure 7a,b.
According to the analysis of variance of the evacuation speed, there was no significant difference in the fluctuation of evacuation speed between the passengers with and the passengers with during an off-peak period passenger evacuation. However, during a peak-period passenger evacuation, the speed variance of the passengers withwas 0.53, and that of the passengers with was 0.30. The fluctuation of the evacuation speed of the passengers with is more considerable. The average evacuation speed of the passengers with decreased obviously around 1100 s, forming a wave trough, as shown in Figure 7b.
The reason for the phenomenon above is that passengers with are more cautious and docile than those with . In the face of an emergency, the psychological pressure of passengers with is significant, which leads to the high expected evacuation speed. During a peak-period evacuation, it is expected that the passengers with high speed will arrive at the connecting area faster. However, due to the large number of evacuees, it is easy to form an evacuation bottleneck so that the evacuation speed drops rapidly and creates a wave trough.
): (a) evacuation of passengers during off-peak periods; (b) evacuation of passengers during peak periods.
4.2.2. Analysis of the Evacuation Speed of Passengers with Personality Traits
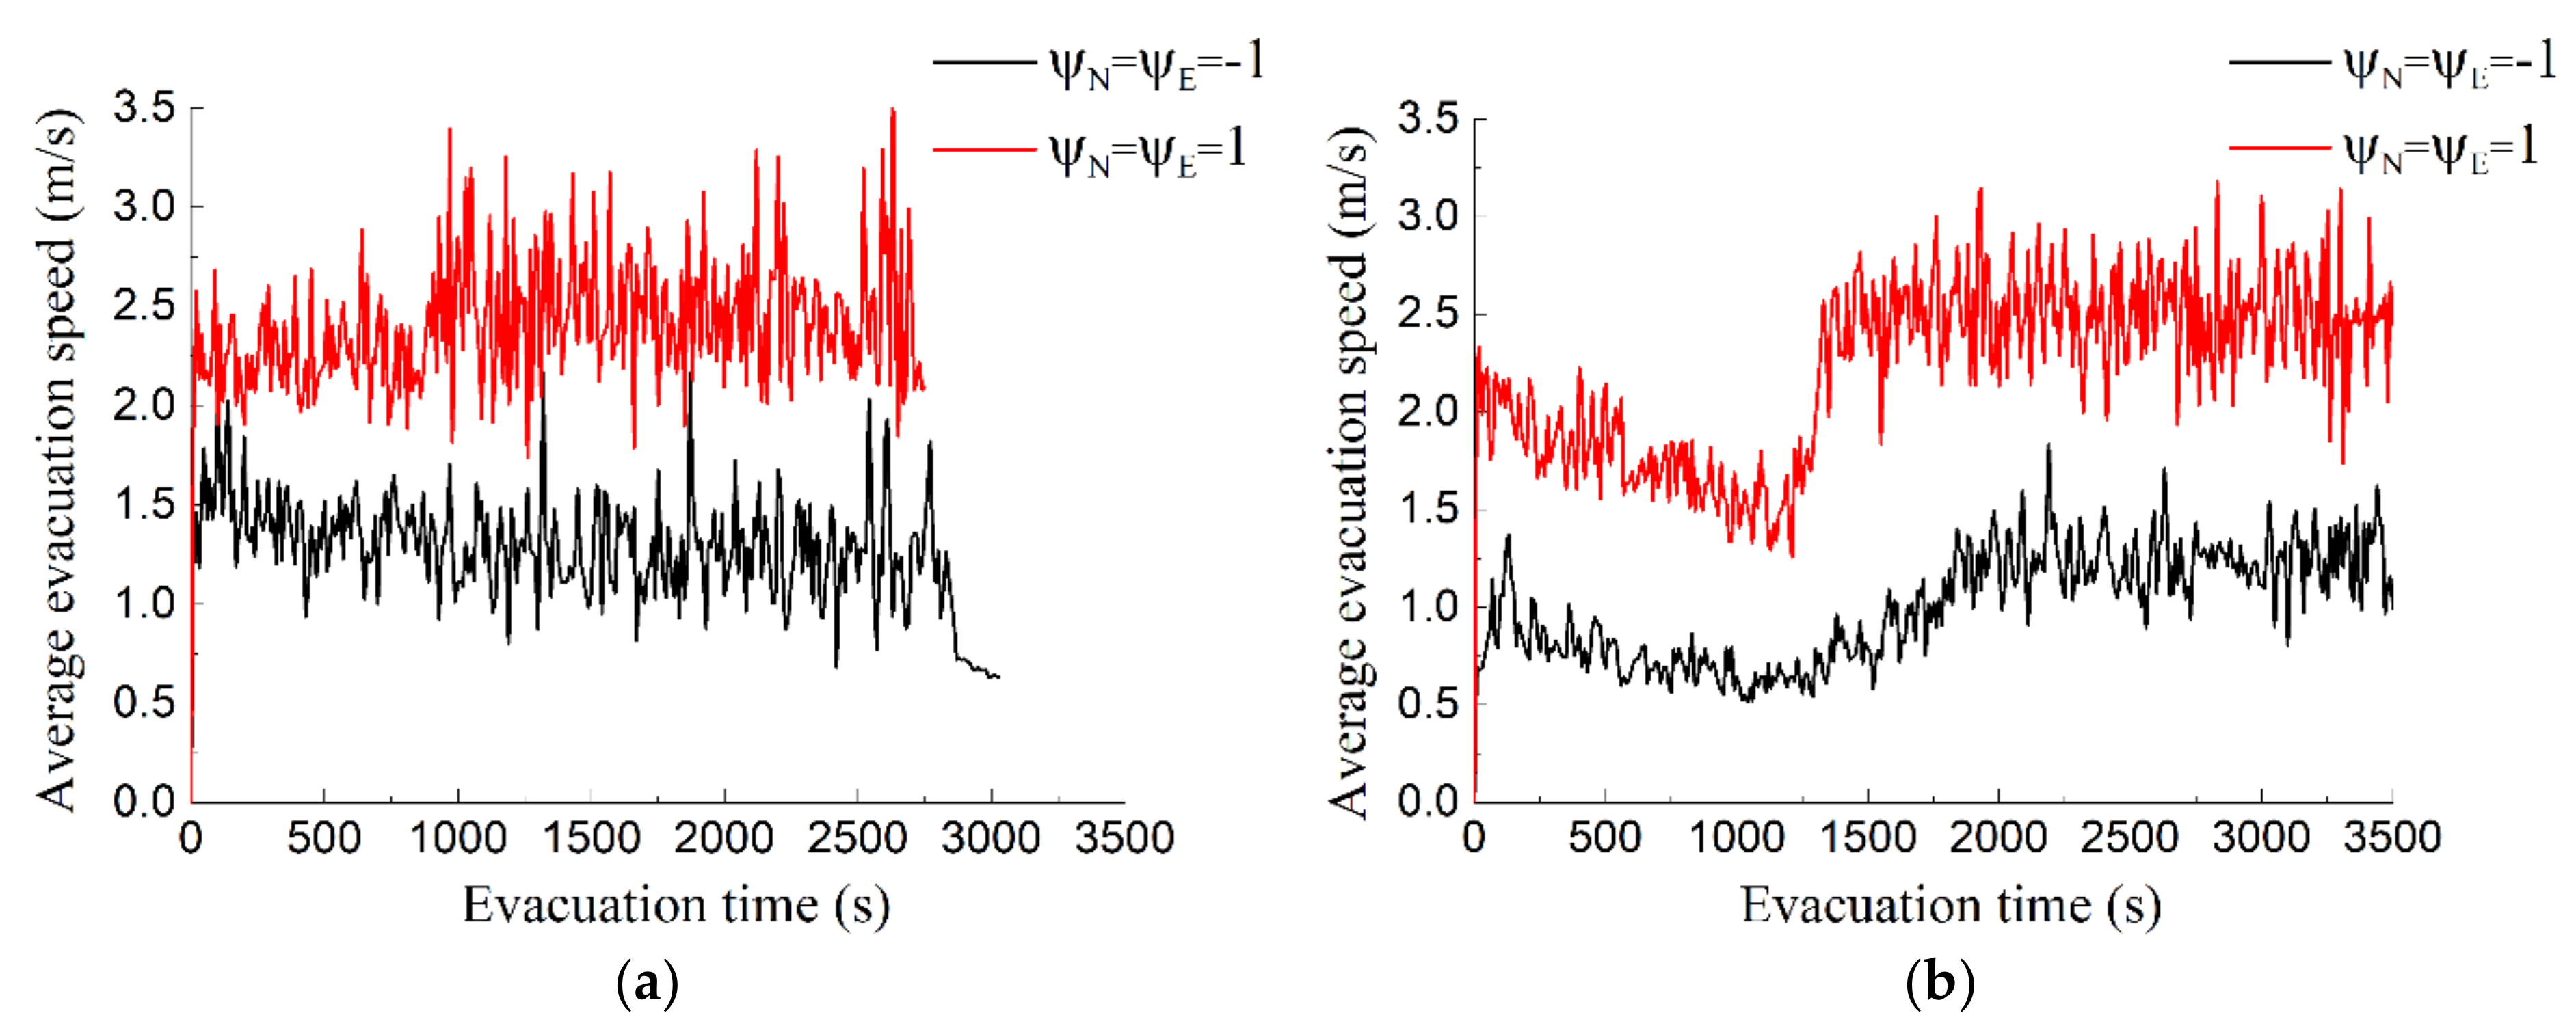
During a peak- and off-peak-period evacuation, the evacuation speed of the passengers with was 2.39 m/s and 2.21 m/s, and that of the passengers with was 1.27 m/s and 1.00 m/s, respectively. The simulation results show that the evacuation speed of the passengers with was significantly higher, as shown in Figure 8a,b.
The speed variance of the passengers with was significantly different from that of the passengers with only during an evacuation in peak periods. The speed variance of the passengers with was 0.55, and that of the passengers with was 0.39. The average evacuation speed of the passengers with decreased significantly around 1200 s, forming a wave trough, as shown in Figure 8b.
Passengers with are more impulsive and anxious than those with , therefore, passengers with have higher psychological pressure in the face of emergencies. During an evacuation in peak periods, the expected speed of the passengers with increases because of the increased psychological pressure. At the same time, because of the large number of evacuees, it is easier to cause an evacuation bottleneck in the connecting area and then form a speed wave trough, as shown in Figure 8b.
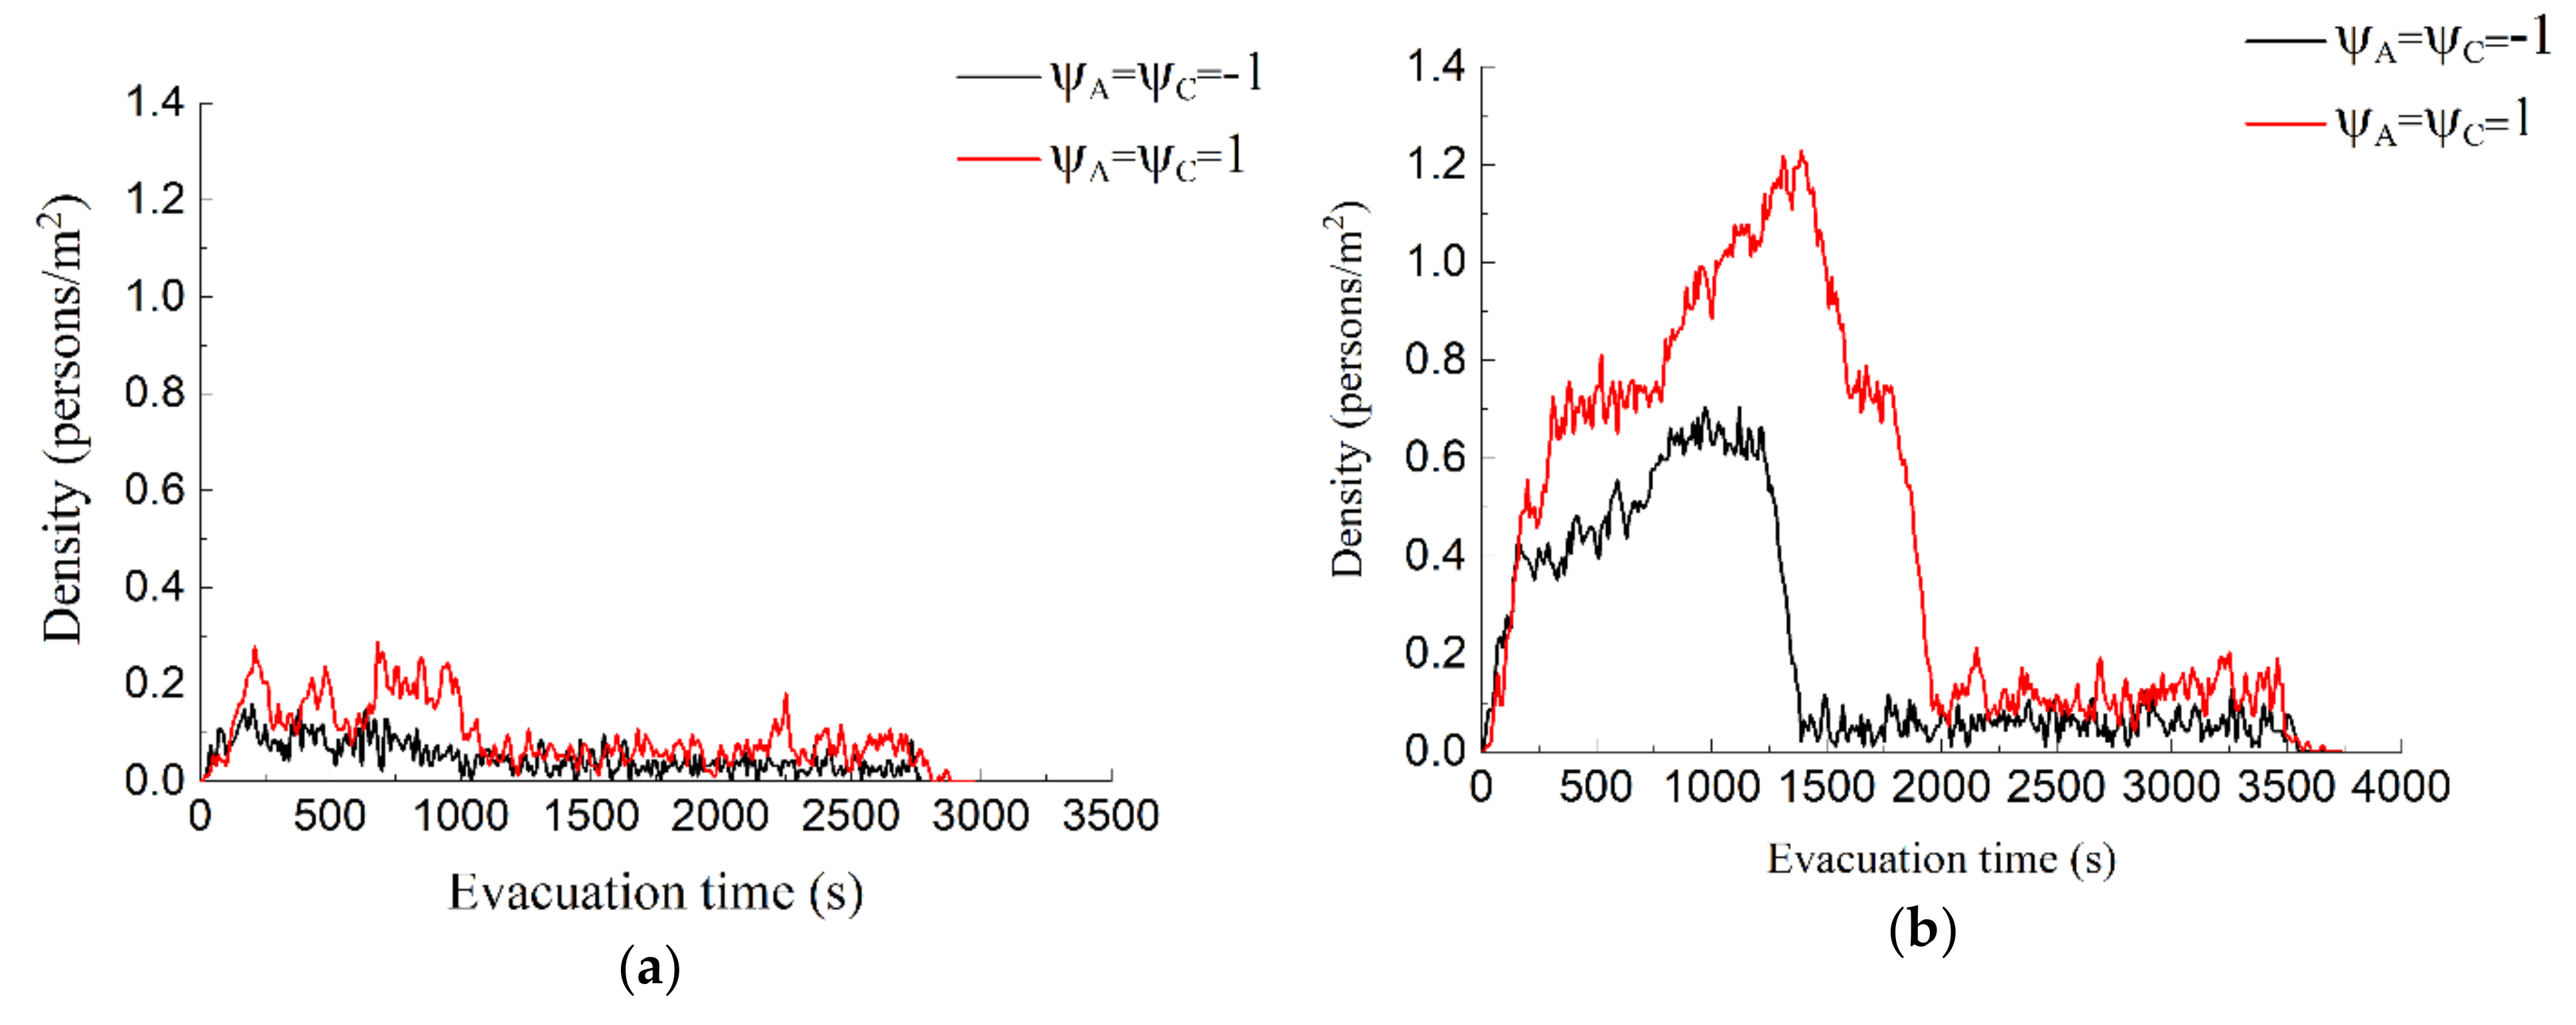
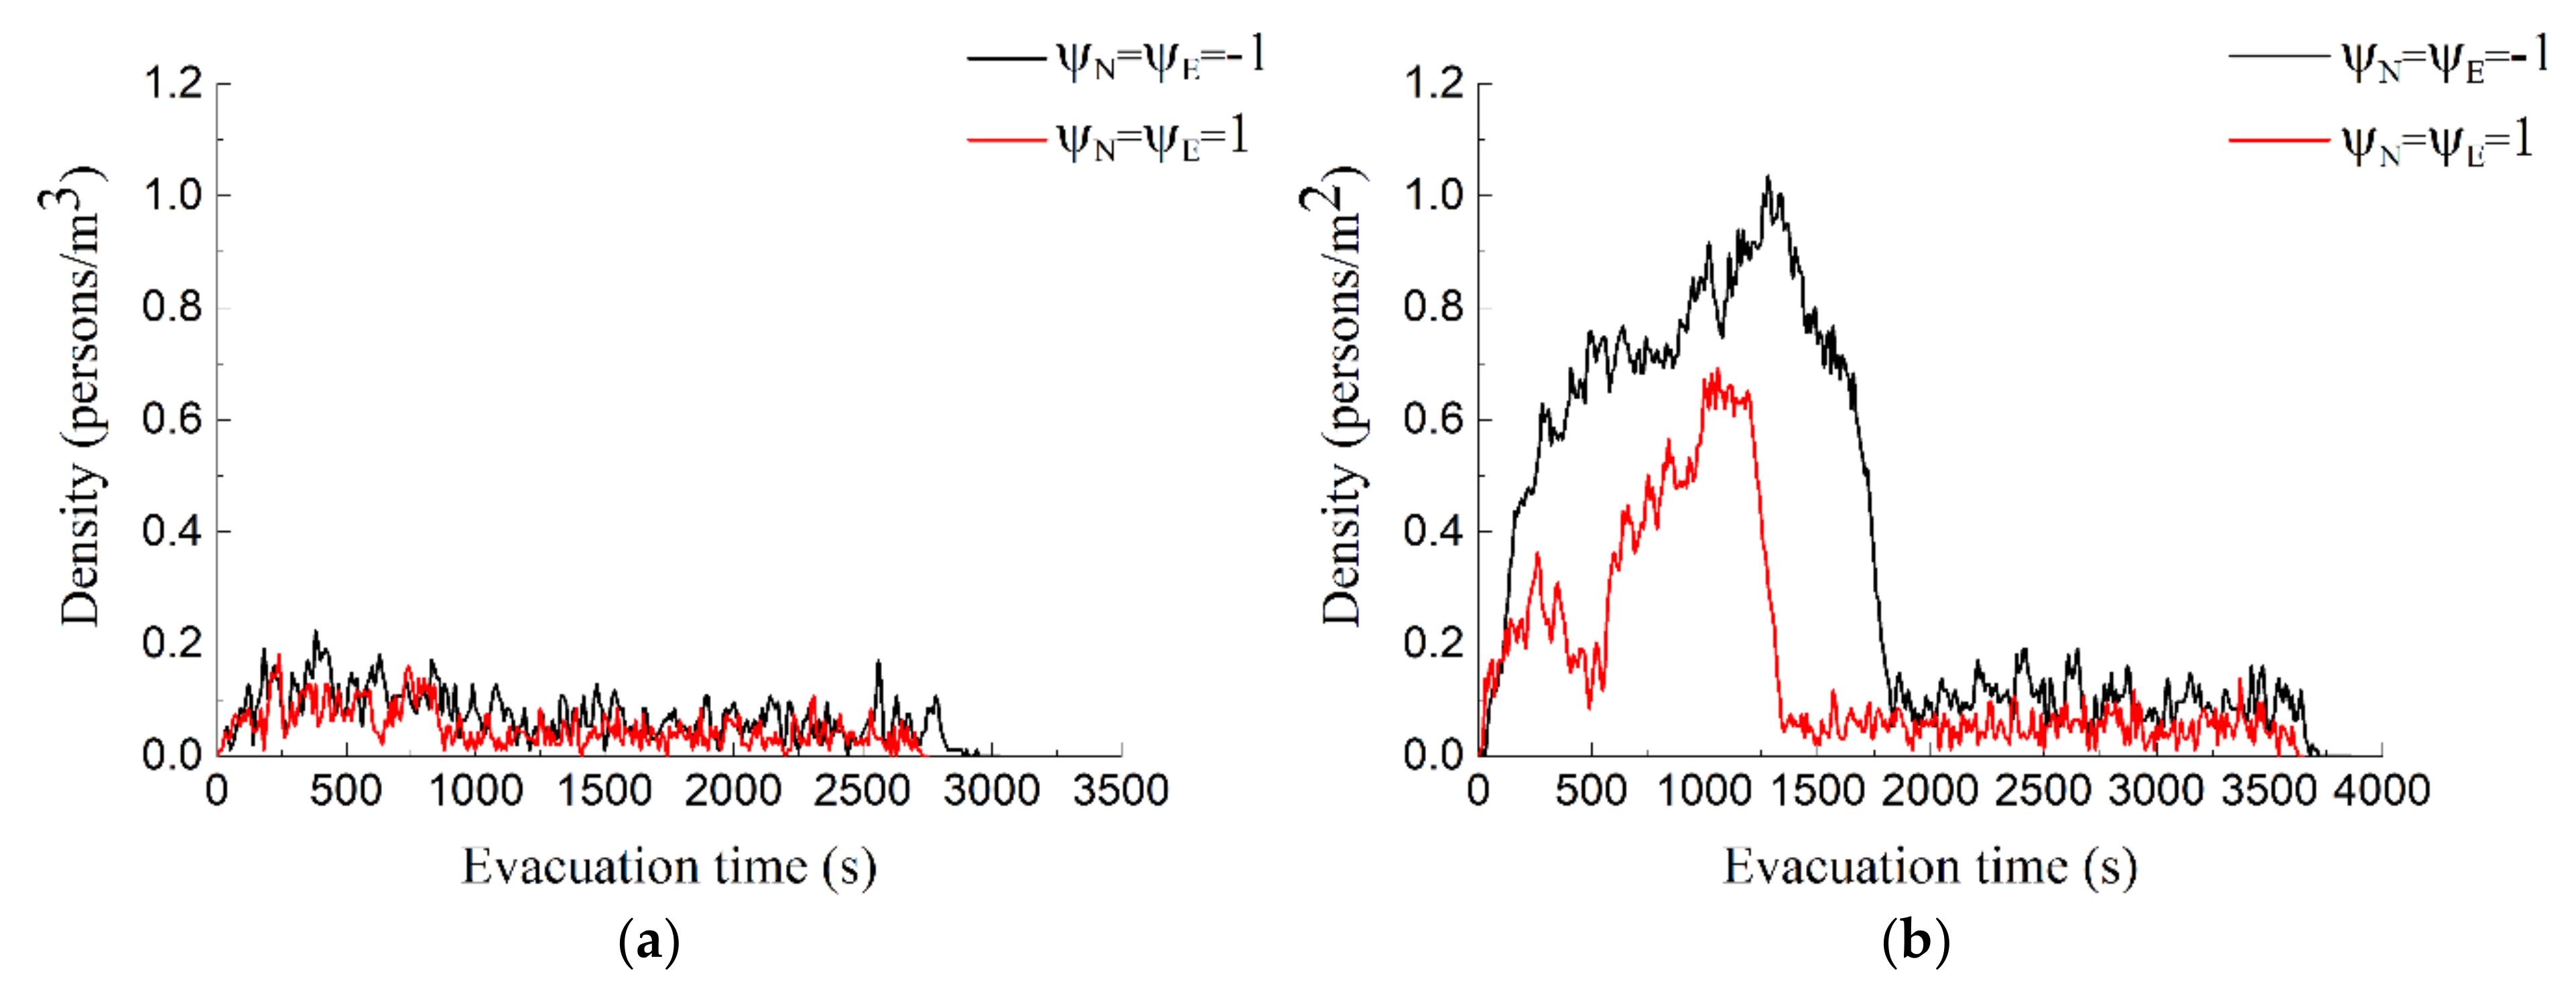
4.3. Density Analysis of the Connecting Area
During an evacuation in off-peak periods, the difference in passenger density in the connecting area was small, as shown in Figure 9a and Figure 10a.
However, the density in the connecting area was significantly different during an evacuation in peak periods. The maximum density of the passengers with was 1.23 persons/m2, and that of the passengers with was 0.71 persons/m2. The reason for the phenomenon above is that passengers with are more cautious and docile than passengers with . When an emergency occurs, their psychological pressure value is relatively small, so their expected speed is little, resulting in a longer evacuation time after forming a bottleneck, as shown in Figure 9b. The maximum density of the passengers with was 1.04 persons/m2, and that of the passengers with was 0.69 persons/m2. The reason for the phenomenon above is that passengers with are more impulsive and anxious than passengers with . When an emergency occurs, psychological pressure of passengers with is relatively large, and their expected speed is also more considerable. After a bottleneck is formed, it dissipates quickly, and the density in the connecting area is relatively small, as shown in Figure 10b.
5. Discussion
Similar results for the evacuation time were obtained by Chen et al. [14] who concluded that the overall evacuation time is reduced by 24.03% under the condition of psychological pressure. Our results are as follows: the higher the value of and , the more docile and cautious the passengers are. Therefore, the psychological pressure caused by the emergency is relatively small, which makes the expected speed smaller, and the average evacuation time increases. However, the higher the value of and , the more anxious and impulsive the passengers are, which leads to the increase in psychological pressure and the growth of expected speed that leads to the reduction in evacuation time. Regarding prediction of the evacuation time, our results are basically consistent with [14].
Our simulation results show that the evacuation speed of the passengers with (passengers with high psychological pressure) during a peak-period evacuation was 1.84 m/s, and that of the passengers with was 2.21 m/s. The result obtained in [30] is that when a pedestrian’s psychological pressure is high, the walking speed is 2–2.5 m/s. Through the research in Section 3, we know that passengers with or are passengers with high psychological pressure, that is to say, our simulation results are very close to the results in [30]. During an evacuation in peak periods, the evacuation speed of the passengers with or decreased sharply in a short time, similarly to the results reported in [14]. At the same time, this phenomenon can also be explained by the herding effect in classic literature [31]. We also simulated the evacuation speed during an off-peak-period evacuation, which did not decrease sharply in a short time. This has not been studied in the available literature [14].
Regarding the density of the connecting area, the results of this study show that the density reached the peak in a short time during a peak-period evacuation, similarly to the results reported in [14]. The results show that the maximum density of the connecting area was 1.23 persons/m2, while the maximum regional density in [14] is 9.5 persons/m2; this is the largest deviation from the available literature. The main reason for this gap may be the difference between the input passenger flow data and the size of the connecting area.
The results of this study are helpful in improving the accuracy of the crowd evacuation model and improve the credibility of the simulation software. Passengers with different personalities may have different evacuation behaviors. Considering the personality traits of different passengers can help to formulate more efficient and safer evacuation schemes for subway managers. In this study, to highlight the influence of personality traits on a subway station’s emergency evacuation, the single factor variable control method was used in the experiment, so that other influencing factors are regarded as the same. In the follow-up study, gender, age, physical strength and other passenger parameters can be combined to improve the simulation model’s accuracy further. In the future research, we can also try mixing different personality traits to simulate the evacuation situation more true to life.
6. Conclusions
We propose an emergency evacuation model considering personality traits based on the social force model in this study, reflecting the diversity of the passengers’ evacuation behaviors during an emergency evacuation from the psychological point of view and improving the accuracy of the emergency subway station pedestrian evacuation model to a certain extent. The model describes the influence of the passengers’ personality traits on the evacuation behavior.
The evacuation behavior of passengers is affected by personality traits, in which the value of personality traits and is inversely proportional to the evacuation time, and the value of personality traits and is proportional to the evacuation time.
During an evacuation in off-peak periods, the average speed of the passengers with personality trait was 50.96% lower than that of the passengers with personality trait , the average speed of the passengers with personality trait was 46.86% lower than that of the passengers with personality trait. Similarly, during an evacuation in peak periods, the average speed of the passengers with personality trait was 52.72% lower than that of the passengers with personality trait , the average speed of the passengers with personality trait was 54.75% lower than that of the passengers with personality trait. However, only in a peak-period evacuation, the density of the passengers with and in the connecting area was significantly smaller than that of the passengers with and , respectively.
Author Contributions
Conceptualization, H.W., T.X. and F.L.; methodology, H.W. and F.L.; writing—original draft preparation, H.W.; writing—review and editing, H.W., T.X. and F.L. All authors have read and agreed to the published version of the manuscript.
Funding
This research was supported by the National Natural Science Foundation of China (71671109).
Institutional Review Board Statement
Not applicable.
Informed Consent Statement
Not applicable.
Data Availability Statement
The data presented in this study are available upon request from the corresponding author. The data are not publicly available as the participants of this study did not agree for their data to be shared publicly.
Conflicts of Interest
The authors declare no conflict of interest.
References
- China Urban Rail Transit Association. Report on Statistics and Analysis of Urban Rail Transit in 2018; Urban Rail Transit: Beijing, China, 2019; pp. 16–34. [Google Scholar]
- Li, Y. Simulation Analysis of Evacuation Passengers Flow in Subway Station under Fire Condition. Master’s Thesis, Southwest Jiaotong University, Chengdu, China, 2017. [Google Scholar]
- Helbing, D.; Buzna, L.; Johansson, A.; Werner, T. Self-organized pedestrian crowd dynamics: Experiments, simulations, and design solutions. Oper. Res. 2005, 39, 1–24. [Google Scholar] [CrossRef] [Green Version]
- Blue, V.; Adler, J. Emergent Fundamental Pedestrian flows from cellular automata microsimulation. Transp. Res. Rec. 1998, 1644, 29–36. [Google Scholar] [CrossRef]
- Yang, L.; Zhao, D.; Li, J.; Fang, T. Simulation of the kin behavior in building occupant evacuation based on Cellular Automaton. Build. Environ. 2005, 40, 411–415. [Google Scholar] [CrossRef]
- Ko, M.; Kim, T.; Sohn, K. Calibrating a social-force-based pedestrian walking model based on maximum likelihood estimation. Transportation 2013, 40, 91–107. [Google Scholar] [CrossRef]
- Zhao, D.; Yegenmammedov, B.; Liu, P.; Zhang, M. Comparative Study on Occupant Evacuation with Building EXODUS and a Cellular Automaton Model. Open J. Saf. Sci. Technol. 2017, 7, 42–57. [Google Scholar] [CrossRef] [Green Version]
- Lei, W.; Li, A.; Gao, R.; Hao, X.; Deng, B. simulation of pedestrian crowds' evacuation in a huge transit terminal subway station. Phys. A Stat. Mech. Its Appl. 2012, 391, 5355–5365. [Google Scholar] [CrossRef]
- Zhou, M.; Dong, H.; Wen, D.; Yao, X.; Sun, X. Modeling of Crowd Evacuation with Assailants via a Fuzzy Logic Approach. IEEE Trans. Intell. Transp. Syst. 2016, 17, 2395–2407. [Google Scholar] [CrossRef]
- Chen, J. Modeling and Simulation of Subway Station Pedestrian Behavior Based on the Hybrid Model. Master’s Thesis, Beijing Jiaotong University, Beijing, China, June, 2017. [Google Scholar]
- Saboia, P.; Goldenstein, S. Crowd simulation: Applying mobile grids to the social force model. Vis. Comput. 2012, 28, 1039–1048. [Google Scholar] [CrossRef]
- Steffen, B. A Modification of the Social Force Model by Foresight; Springer: Berlin/Heidelberg, Germany, 2010. [Google Scholar]
- Nishinari, K.; Kirchner, A.; Namazi, A.; Schadschneider, A. Extended Floor Field CA Model for Evacuation Dynamics. IEICE Trans. Inf. Syst. D 2003, 87, 726–732. [Google Scholar]
- Chen, S.K.; Di, Y.; Li, F.; Xu, Q.; Liu, H.D. Passenger evacuation model of metro platform considering psychological pressure. J. Transp. Eng. 2017, 17, 114–120. [Google Scholar]
- Sun, J.L.; Wang, S.; Chen, W.Y. A simulation study of metro emergency evacuation based on crowd panic. Safety 2017, 38, 8–11. [Google Scholar]
- Xu, M.; Li, C.; Lv, P.; Chen, W.; Deng, Z.; Zhou, B.; Manocha, D. Emotion-Based Crowd Simulation Model Based on Physical Strength Consumption for Emergency Scenarios. IEEE Trans. Intell. Transp. Syst. 2017, 1, 1–16. [Google Scholar]
- Helbing, D.; Johansson, A.; Mathiesen, J.; Jensen, M.H.; Hansen, A. Analytical Approach to Continuous and Intermittent Bottleneck Flows. Phys. Rev. Lett. 2006, 97, 168001. [Google Scholar] [CrossRef] [PubMed] [Green Version]
- Fruin, J.J. Pedestrain Planning and Design; Elevator World: New York, NY, USA, 1971. [Google Scholar]
- Costa, P.T., Jr.; McCrae, R.R. Personality in Adulthood: A Five-Factor Theory Perspective; Guilford Press: London, UK; New York, NY, USA, 2003. [Google Scholar]
- Ortony, A.; Clore, G.L.; Collins, A. The Cognitive Structure of Emotions. Contemp. Sociol. 1988, 18, 2147–2153. [Google Scholar]
- Mehrabian, A. Pleasure-arousal-dominance: A general framework for describing and measuring individual differences in Temperament. Curr. Psychol. 1996, 14, 261–292. [Google Scholar] [CrossRef]
- Durupinar, F.; Pelechano, N.; Allbeck, J.M.; Gudukbay, U.; Badler, N.I. How the Ocean Personality Model Affects the Perception of Crowds. IEEE Comput. Graph. Appl. 2011, 31, 22–31. [Google Scholar] [CrossRef] [PubMed] [Green Version]
- Durupinar, F.; Kapadia, M.; Deutsch, S.; Neff, M.; Badler, N.I. PERFORM: Perceptual approach for adding OCEAN personality to human motion using laban movement analysis. ACM Trans. Graph. 2016, 36, 1–16. [Google Scholar] [CrossRef]
- Gebhard, P. ALMA: A layered model of effect. In Proceedings of the 4th International Joint Conference on Autonomous Agents and Multiagent Systems (AAMAS 2005), Utrecht, The Netherlands, 25–29 July 2005. [Google Scholar]
- Lhommet, M.; Lourdeaux, D.; Barthès, J.-P. Never Alone in the Crowd: A Microscopic Crowd Model Based on Emotional Contagion. In Proceedings of the IEEE/WIC/ACM International Conference on Web Intelligence & Intelligent Agent Technology, Lyon, France, 22–27 August 2011. [Google Scholar]
- Xue, Z.X.; Fan, X.T. Population Simulation Research Based on five factor personality model. Comput. Appl. Softw. 2015, 32, 46–50. [Google Scholar]
- Wang, M. Behavioral Psychology: Body Language Interpretation and Psychological Analysis; Chemical Industry Press: Beijing, China, 2015. [Google Scholar]
- John, O.P.; Naumann, L.P.; Soto, C.J. Paradigm shift to the integrative big five trait taxonomy: History, measurement, and conceptual issues. In Handbook of Personality: Theory and Research, 3rd ed.; Guilford Press: London, UK, 2008. [Google Scholar]
- Allport, G.W. What units shall we employ? In Assessment of Human Motives; Lindzey, G., Ed.; Holt, Rinehart & Winston: New York, NY, USA; Gardner, MA, USA, 1958. [Google Scholar]
- Kholshevnikov, V.; Shields, T.; Boyce, K.; Samoshin, D. Recent developments in pedestrian flow theory and research in Russia. Fire Saf. J. 2008, 43, 108–118. [Google Scholar] [CrossRef]
- Helbing, D.; Farkas, I.; Vicsek, T. Simulating dynamical features of escape panic. Nature 2000, 407, 487–490. [Google Scholar] [CrossRef] [PubMed] [Green Version]
Figure 1.
Emergency evacuation process considering personality traits.

Figure 2.
Calculation process of various forces during the evacuation.

Figure 3.
The calculation process of the psychological stress value based on personality traits.

Figure 4.
The layout of the subway station.

Figure 5.
(a) Average evacuation time of the passengers with the personality traits; (b) average evacuation time of the passengers with the personality traits.
Figure 5.
(a) Average evacuation time of the passengers with the personality traits; (b) average evacuation time of the passengers with the personality traits.

Figure 6.
(a) Sensitivity analysis of the passengers with the personality traits; (b) sensitivity analysis of the passengers with the personality traits.
Figure 6.
(a) Sensitivity analysis of the passengers with the personality traits; (b) sensitivity analysis of the passengers with the personality traits.

Figure 7.
Average evacuation speed (passengers with ): (a) evacuation of passengers during off-peak periods; (b) evacuation of passengers during peak periods.
Figure 7.
Average evacuation speed (passengers with ): (a) evacuation of passengers during off-peak periods; (b) evacuation of passengers during peak periods.

Figure 8.
Average evacuation speed (passengers with ): (a) evacuation of passengers during off-peak periods; (b) evacuation of passengers during peak periods.
Figure 8.
Average evacuation speed (passengers with ): (a) evacuation of passengers during off-peak periods; (b) evacuation of passengers during peak periods.

Figure 9.
The density in the connecting area (passengers with ): (a) evacuation of passengers during off-peak periods; (b) evacuation of passengers during peak periods.
Figure 9.
The density in the connecting area (passengers with ): (a) evacuation of passengers during off-peak periods; (b) evacuation of passengers during peak periods.

Figure 10.
The density in the connecting area (passengers with ): (a) evacuation of passengers during off-peak periods; (b) evacuation of passengers during peak periods.
Figure 10.
The density in the connecting area (passengers with ): (a) evacuation of passengers during off-peak periods; (b) evacuation of passengers during peak periods.


Table 1.
Personality dimensions in the OCEAN model.
| Personality | Personality Traits (+) | Personality Traits (−) |
|---|---|---|
| O (openness) | Willing to try new things, autonomous, imagination | Conservative, submissive, pragmatic |
| C (conscientiousness) | Orderly, cautious, self-disciplined | Disorderly, careless, weak-willed |
| E (extraversion) | Enthusiastic, gregarious, dominating | Implicative, shy, serious |
| A (agreeableness) | Reliable, docile, collaborative | Skeptical, imperious, obstinate |
| N (neuroticism) | Anxious, impulsive, sensitive | Calm, confident, adamant |
Table 2.
The relationship between the psychological pressure of pedestrians and the free walking speed.
Table 2.
The relationship between the psychological pressure of pedestrians and the free walking speed.
| Psychological State | Pressure Value | Free Walking Speed (m/s) | |
|---|---|---|---|
| Horizontal Tunnel | Stairs | ||
| Comfortable | 0.00 | 0.83 | 0.45 |
| Peaceful | 0.00–0.45 | 0.83–1.10 | 0.45–0.63 |
| Active | 0.45–0.68 | 1.10–1.50 | 0.63–0.92 |
| Mild tension | 0.68–0.70 | 1.50–2.00 | 0.92–1.25 |
| Panic or high psychological pressure | >0.70 | 2.00–2.50 | 1.25–1.75 |
Publisher’s Note: MDPI stays neutral with regard to jurisdictional claims in published maps and institutional affiliations. |
© 2021 by the authors. Licensee MDPI, Basel, Switzerland. This article is an open access article distributed under the terms and conditions of the Creative Commons Attribution (CC BY) license (https://creativecommons.org/licenses/by/4.0/).
Share and Cite
MDPI and ACS Style
Wang, H.; Xu, T.; Li, F. A Novel Emergency Evacuation Model of Subway Station Passengers Considering Personality Traits. Sustainability 2021, 13, 10463. https://0-doi-org.brum.beds.ac.uk/10.3390/su131810463
AMA Style
Wang H, Xu T, Li F. A Novel Emergency Evacuation Model of Subway Station Passengers Considering Personality Traits. Sustainability. 2021; 13(18):10463. https://0-doi-org.brum.beds.ac.uk/10.3390/su131810463
Chicago/Turabian StyleWang, Heng, Tiandong Xu, and Feng Li. 2021. "A Novel Emergency Evacuation Model of Subway Station Passengers Considering Personality Traits" Sustainability 13, no. 18: 10463. https://0-doi-org.brum.beds.ac.uk/10.3390/su131810463
Note that from the first issue of 2016, this journal uses article numbers instead of page numbers. See further details here.