Case Report

Transmission Expansion Planning for the Optimization of Renewable Energy Integration in the Sulawesi Electricity System

1
Department of Electrical and Information Engineering, Universitas Gadjah Mada, Grafika Street No. 2, Yogyakarta 55281, Indonesia
2
PT PLN (Persero), Trunojoyo Street, Blok M-I No.135, South Jakarta, DKI Jakarta 12160, Indonesia
*
Author to whom correspondence should be addressed.
Sustainability 2021, 13(18), 10477; https://0-doi-org.brum.beds.ac.uk/10.3390/su131810477
Submission received: 24 May 2021 / Revised: 27 July 2021 / Accepted: 9 September 2021 / Published: 21 September 2021
(This article belongs to the Section Energy Sustainability)

Abstract

:
In order to meet the growth in demand and the renewable energy integration target, the Sulawesi Electricity System (SES) should be expanded. Currently, the SES is divided into two systems, namely South and North Sulawesi. These two systems have different characteristics, such as the system size, reliability and operational cost. North Sulawesi is smaller, weaker and more expensive than the South System. In order to improve the system reliability, generation and transmission expansion planning should be executed simultaneously to meet the economical investment cost and satisfy the reliability standard. For this purpose, the necessity of a backbone system with a higher voltage level than the existing 150 kV system should be considered, including the interconnection option between the two existing systems in Sulawesi. A methodology based on economic and technical criteria was developed to determine the backbone voltage level. Two voltage level options were considered, namely 275 and 500 kV. Several criteria were considered in order to determine the backbone voltage level, including the economic voltage, the line-loading limit, N-1 contingency, short circuiting, transient stability, voltage stability and small signal stability. The backbone voltage candidates should fulfil all of the criteria. The simulation was conducted in base- and high-demand scenarios, considering the fluctuation of future economic growth. The load flow and the dynamic analysis were simulated in a DIgSILENT Power Factory environment. The results showed that the 275 kV backbone, which was built in 2022, would violate three criteria: the economic voltage, N-1 contingency and voltage stability. On the other hand, the 500 kV backbone voltage level fulfills all of the criteria. The result of this research was considered in the electricity planning documents in Sulawesi. From a technical and economical perspective, the 500 kV backbone was chosen for the SES.

1. Introduction

Indonesia is the fourth largest country in the world, with almost 268 million residents in 2018 [1]. This population is expected to grow at a rate of 1.1%, which is the same as the world’s population growth rate [
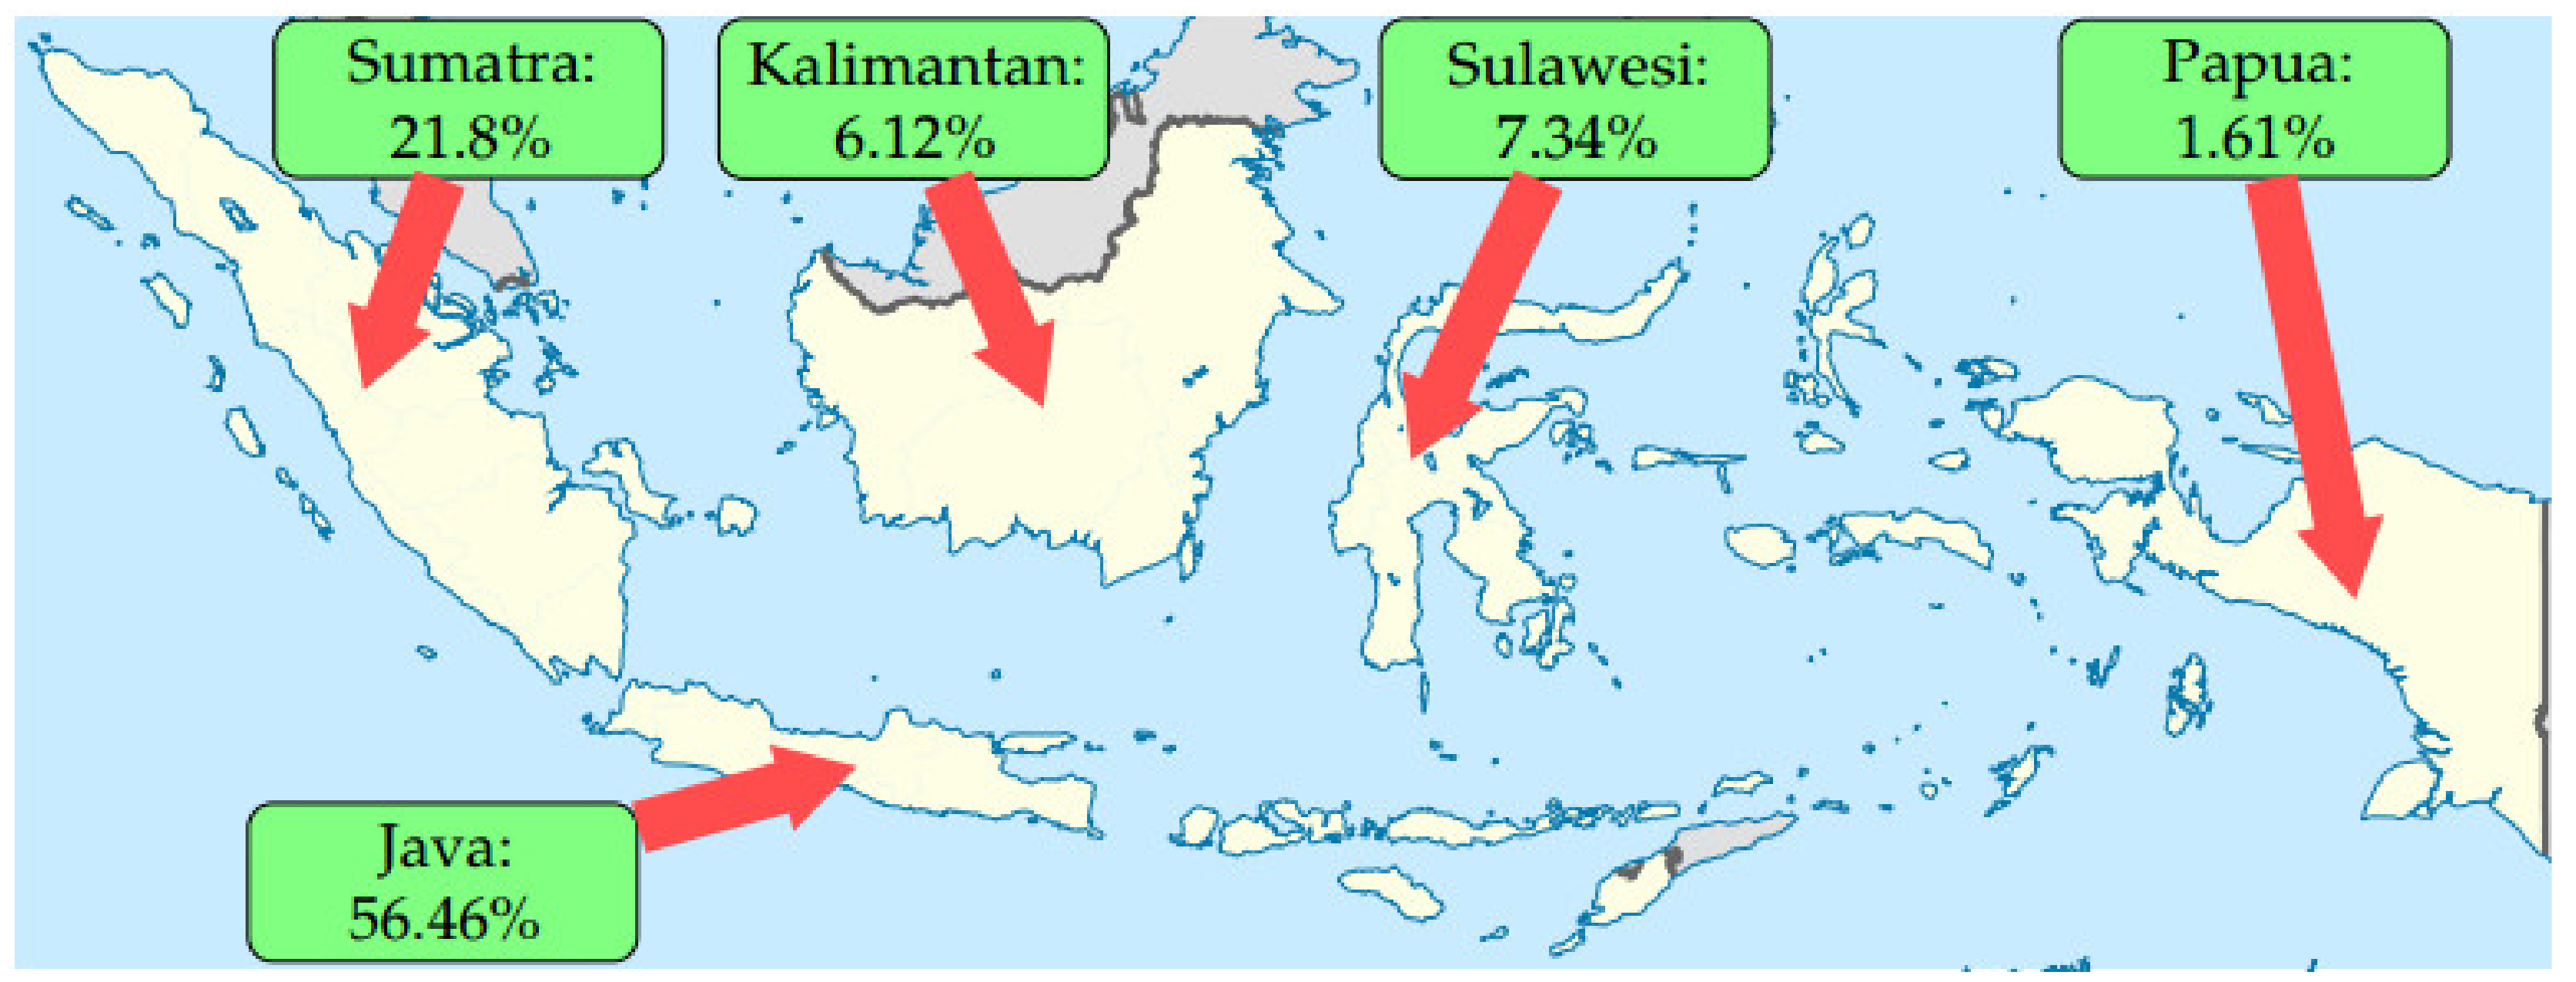
2]. Although there are at least 17,000 islands in Indonesia, around 85% of the population are living on three islands: Java (56%), Sumatra (21%) and Sulawesi (7%), as shown in Figure 1 [3]. The development of infrastructure, which supports business growth, is focused mostly on Java, where the government and business capitals are based.
Access to electricity and its reliability are among the decisive factors for investors to establish a new business [4]. Currently, not all of the residents of Indonesia have access to electricity, especially outside Java. It is only in Java that the electrification rate, which represents the number of households that have been provided with some form of electricity supply divided by the total number of households, reaches 100% [5]. However, outside Java, the electrification rate reaches up to 90.54% [5]. In terms of the system average interruption duration index (SAIDI) and the system average interruption frequency index (SAIFI), each costumer in Java has an SAIDI of 9.46 h and an SAIFI of 6.27 interruptions, whereas outside Java, the SAIDI number reaches 26.36 h/costumer and 15.7 interruptions/costumer [5].
As one of the world’s emerging markets, Indonesia has the highest Gross Domestic Product (GDP) among the members of the Association of Southeast Asian Nations (ASEAN), i.e., the 16th largest nominal GDP in the world, or the seventh largest in the world if based on Purchasing Power Parity (PPP) [6]. In addition to the fact that its industries are mainly located in Java, in 2018, most of the electricity in Indonesia was sold to residential customers (41.7% or 97,832.28 GWh), while only 32.8%—or 76,946.50 GWh—was sold to industries [5]. Hence, Indonesia’s energy per capita is among the lowest in the ASEAN. In 2014, a total of 811 kWh/capita was consumed in Indonesia, while Singapore’s electricity consumption was 10 times larger than this or Malaysia, which is 5 times larger [7].
In order to accelerate the industrial development to the entire territory of Indonesia, ten Industrial Development Areas were established in 2015 [8]. Seven of them are in the eastern part of Indonesia (i.e., Kalimantan, Sulawesi, Papua, Bali and Nusa Tenggara), two are in Sumatra and one area is in Java. Furthermore, 14 industrial estates have also been developed in these areas outside Java. They occupy a total of 28,854 hectares, and 40% of these are located in Sulawesi [9].
Sulawesi is expected to become the center for stainless steel-based industries [8]. At least three large smelters to purify nickel are currently being built (becoming part of the 14 industrial estates), i.e., Morowali, Konawe and Bantaeng. With these three estates, it is expected that Indonesia will be able to export more than 6 million tons of stainless steel per year [9]. Furthermore, Sulawesi also plays an important role as the hub between the eastern part of Indonesia and the rest of the world. Therefore, developing the infrastructure in Sulawesi is necessary in order to enhance the contribution of the eastern part of Indonesia to the national GDP [8,9].
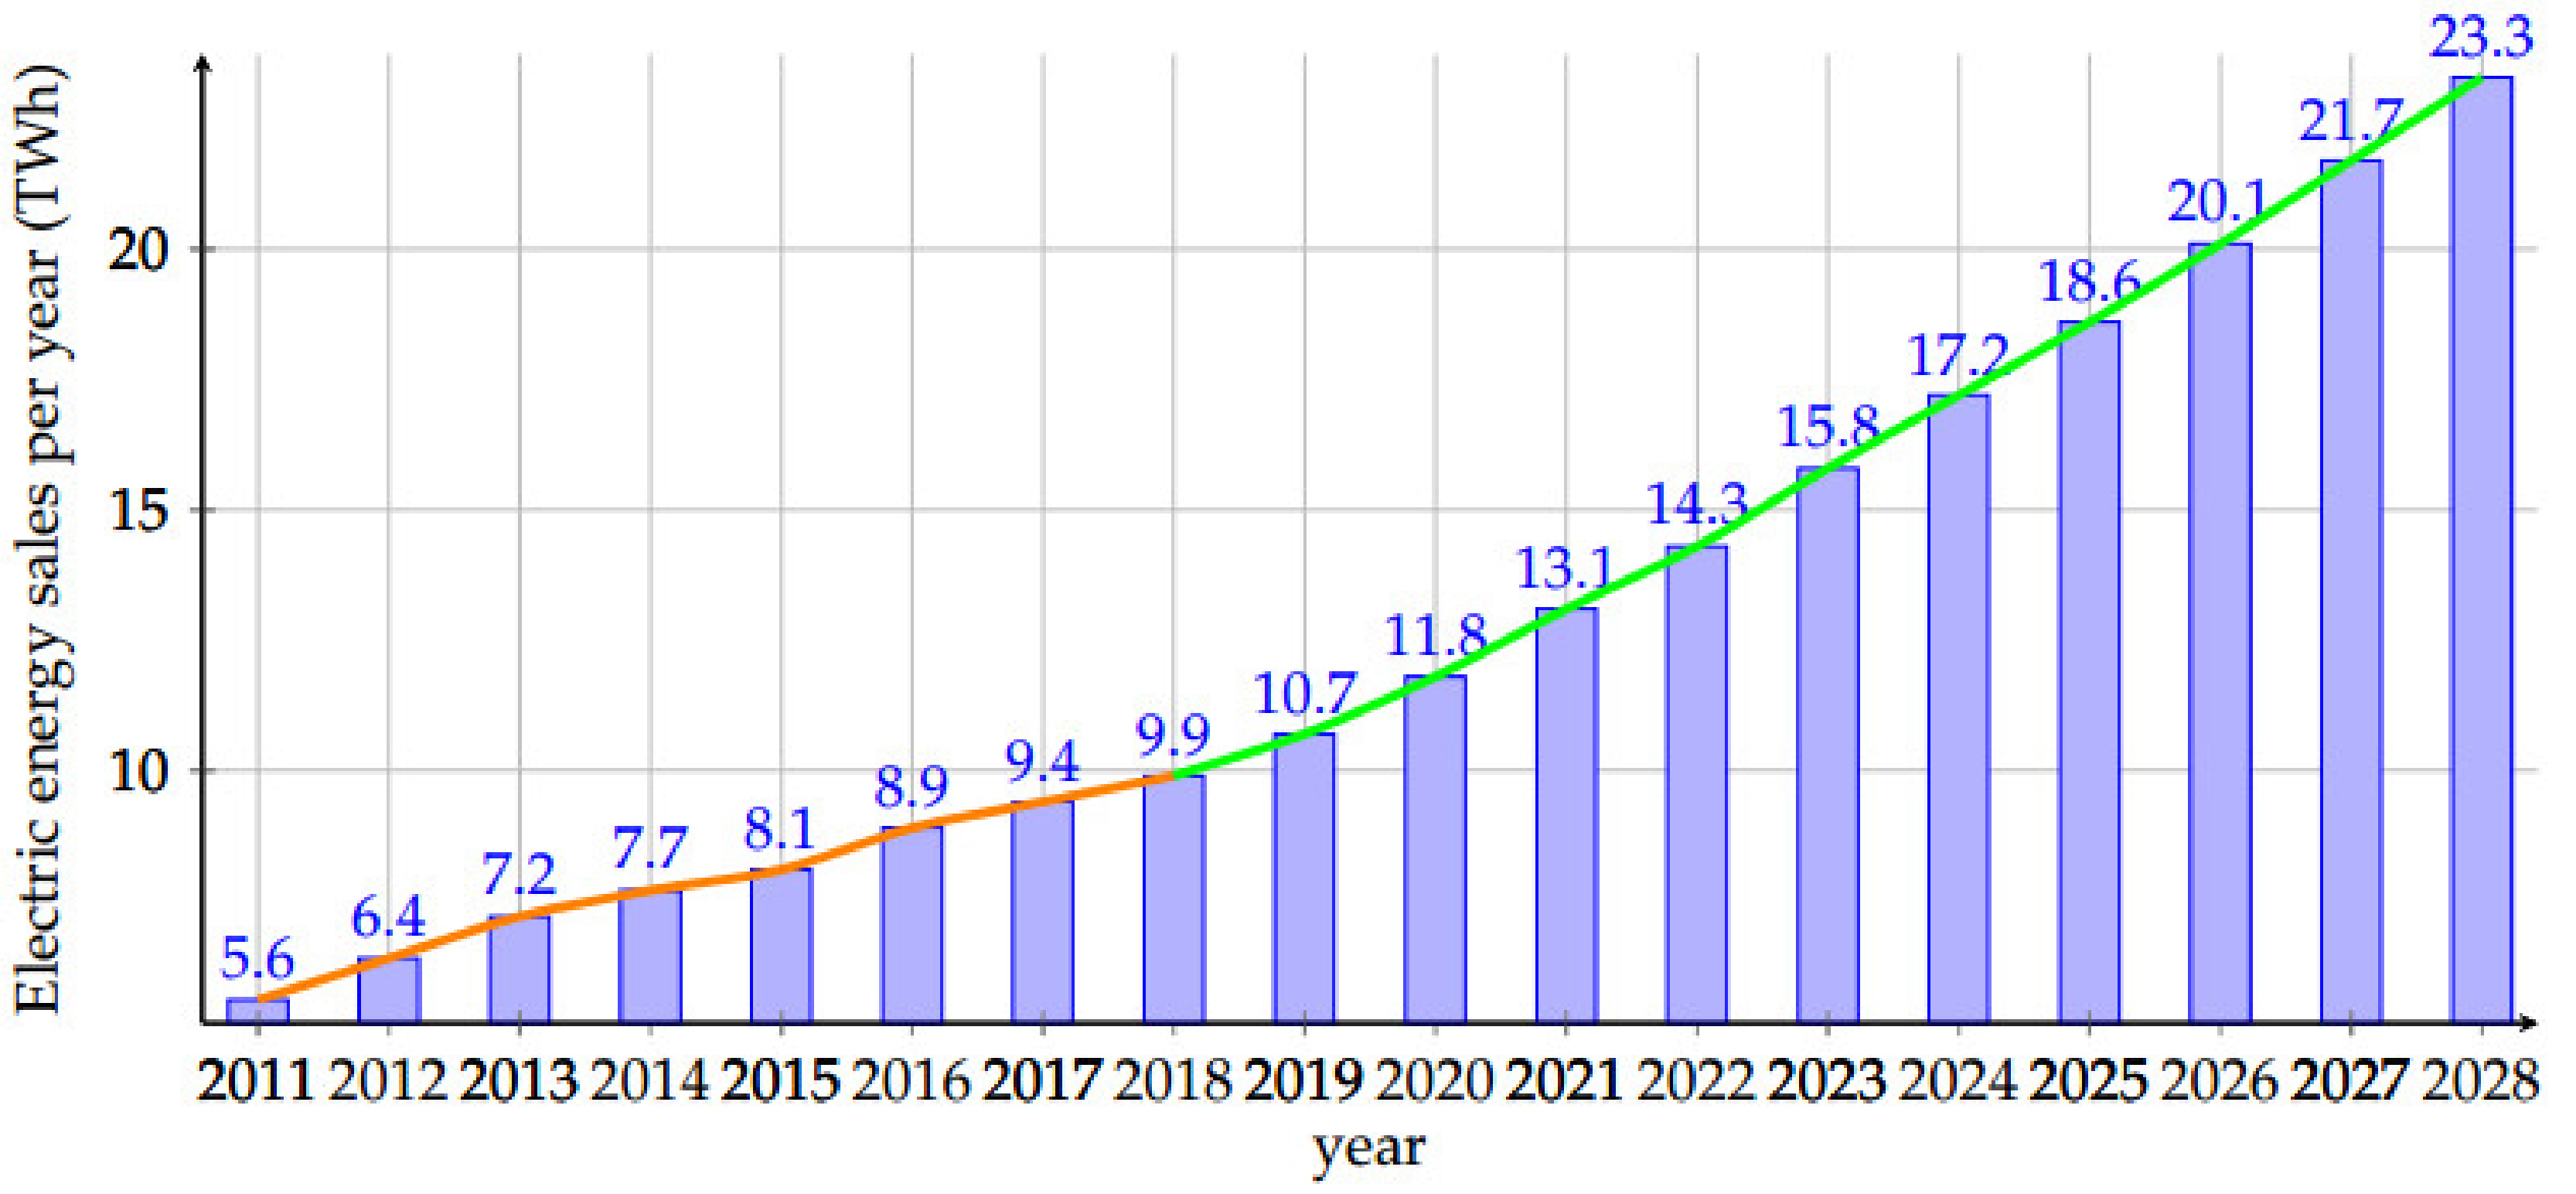
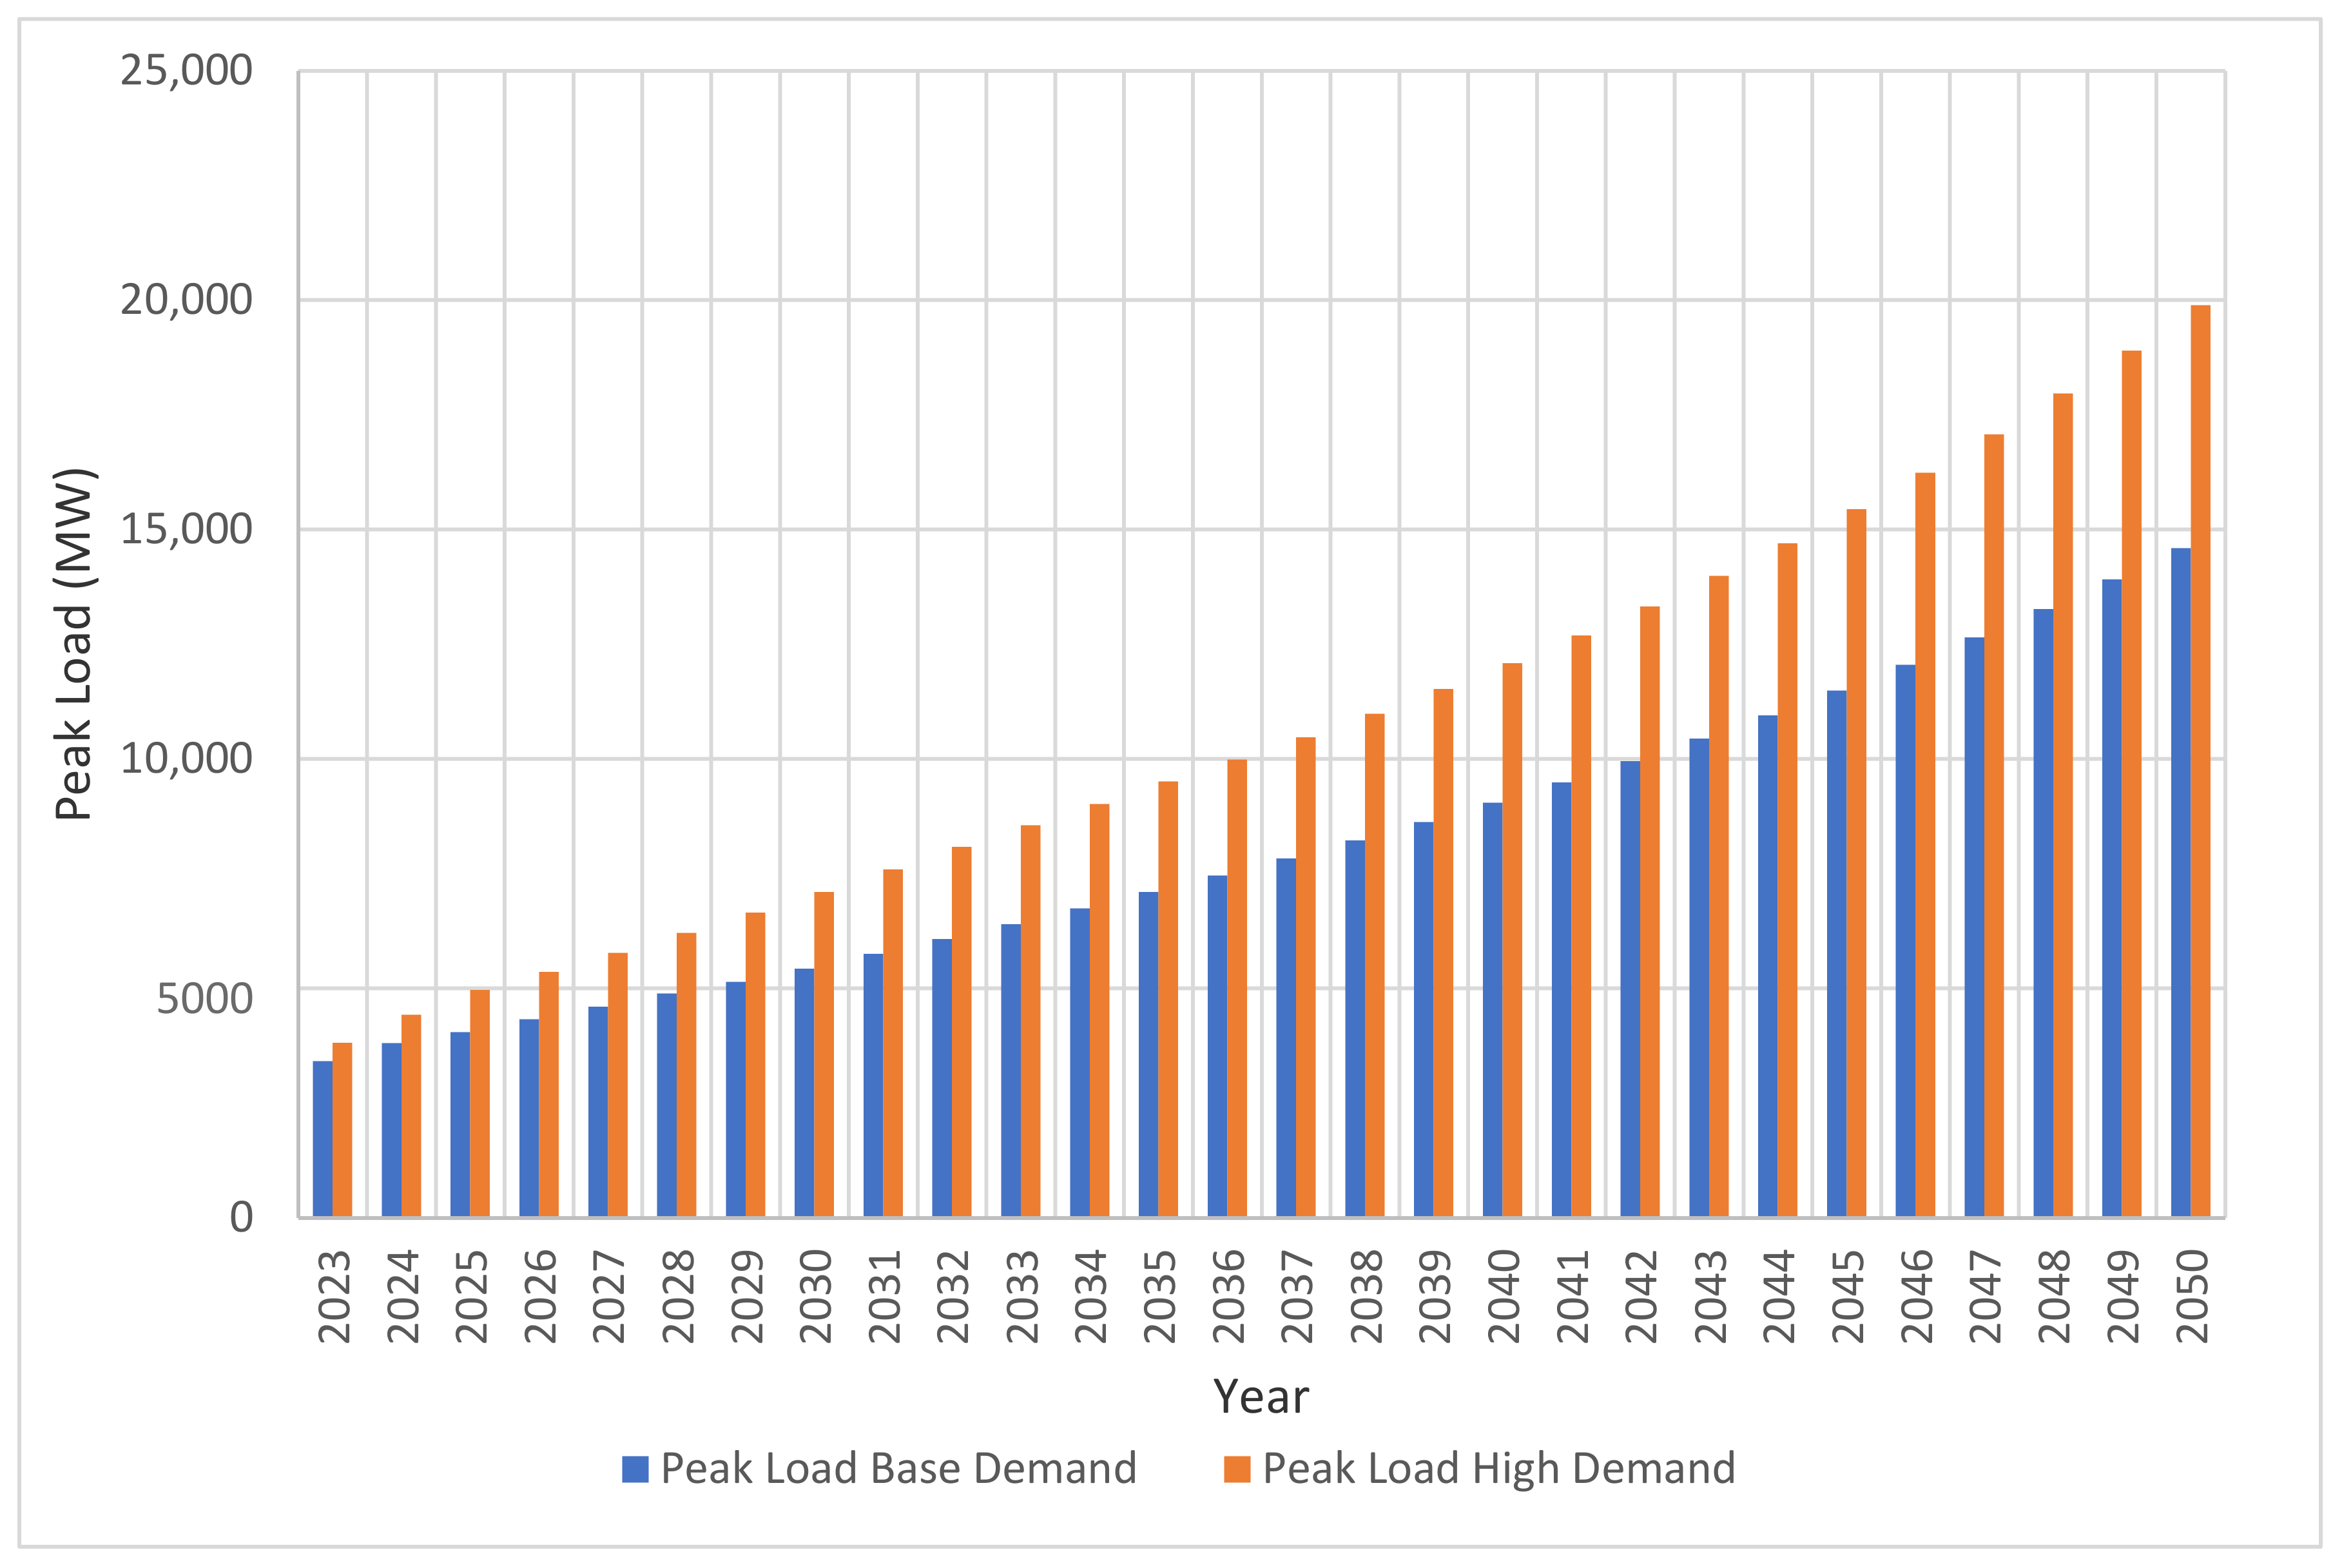
These industrial estates are expected to attract new workers from different parts of Indonesia, i.e., they demobilize the people from going to Java. Hence, apart from supplying the industrial estates, the electricity is also required to supply residents. In the last 7 years, the electric energy sales in Sulawesi increased at a rate of 9%, i.e., from 5.6 TWh in 2011 to 9.9 TWh in 2018 [10]. Based on this number, it is expected that the electrical energy sales will reach 23 TWh in 2028. The realization and estimation of the electrical energy sales in Sulawesi are shown in Figure 2.
In order to meet the demand, both the generation and transmission systems need to be expanded. Currently, renewable energy resources are important in expansion planning, not only to generate green energy but also to maximize the local natural resources. Various studies have been conducted regarding the integration of renewable energy into generation expansion planning. Solar, wind and biomass energy are some examples of the renewable energy that is integrated in the Brazilian, European and German systems [11,12,13]. However, the integration of renewable energy can cause uncertainty, such as fluctuation, as most of the renewable energy has an intermittent nature. Therefore, in [12,14], this problem is discussed in order to provide better results in generation expansion planning.
Furthermore, the transmission line can also be used to maximize the deliverability of potential renewable energy. In [13], the development of renewable integration in Europe is discussed from a transmission network perspective. However, the integration of renewable energy resources is not only limited in the transmission network but can also be integrated into the distribution network. In [15], the integration of renewable energy into the distribution network is discussed.
In the period of 2019–2028, it is expected that the installed capacity of the generating units in Sulawesi will increase by 5423 MW (or 542 MW per year) [10]. These new generating units are hydro/mini-hydro (34.9%), coal (34.7%), gas (26.1%), solar and wind (2.6%), and others (1.7%). This composition met the renewable energy mix target of 23% by 2025 [16]. This generation expansion planning follows a resource-based approach, which means that the generating unit is installed near to its primary source [10]. This means that the electricity needs to be transmitted to the load centers using a transmission system. The option to build a new power plant near the load center might not be taken, due to, for example, land availability and the distribution chain of the raw energy (such as coal) to this power plant location.
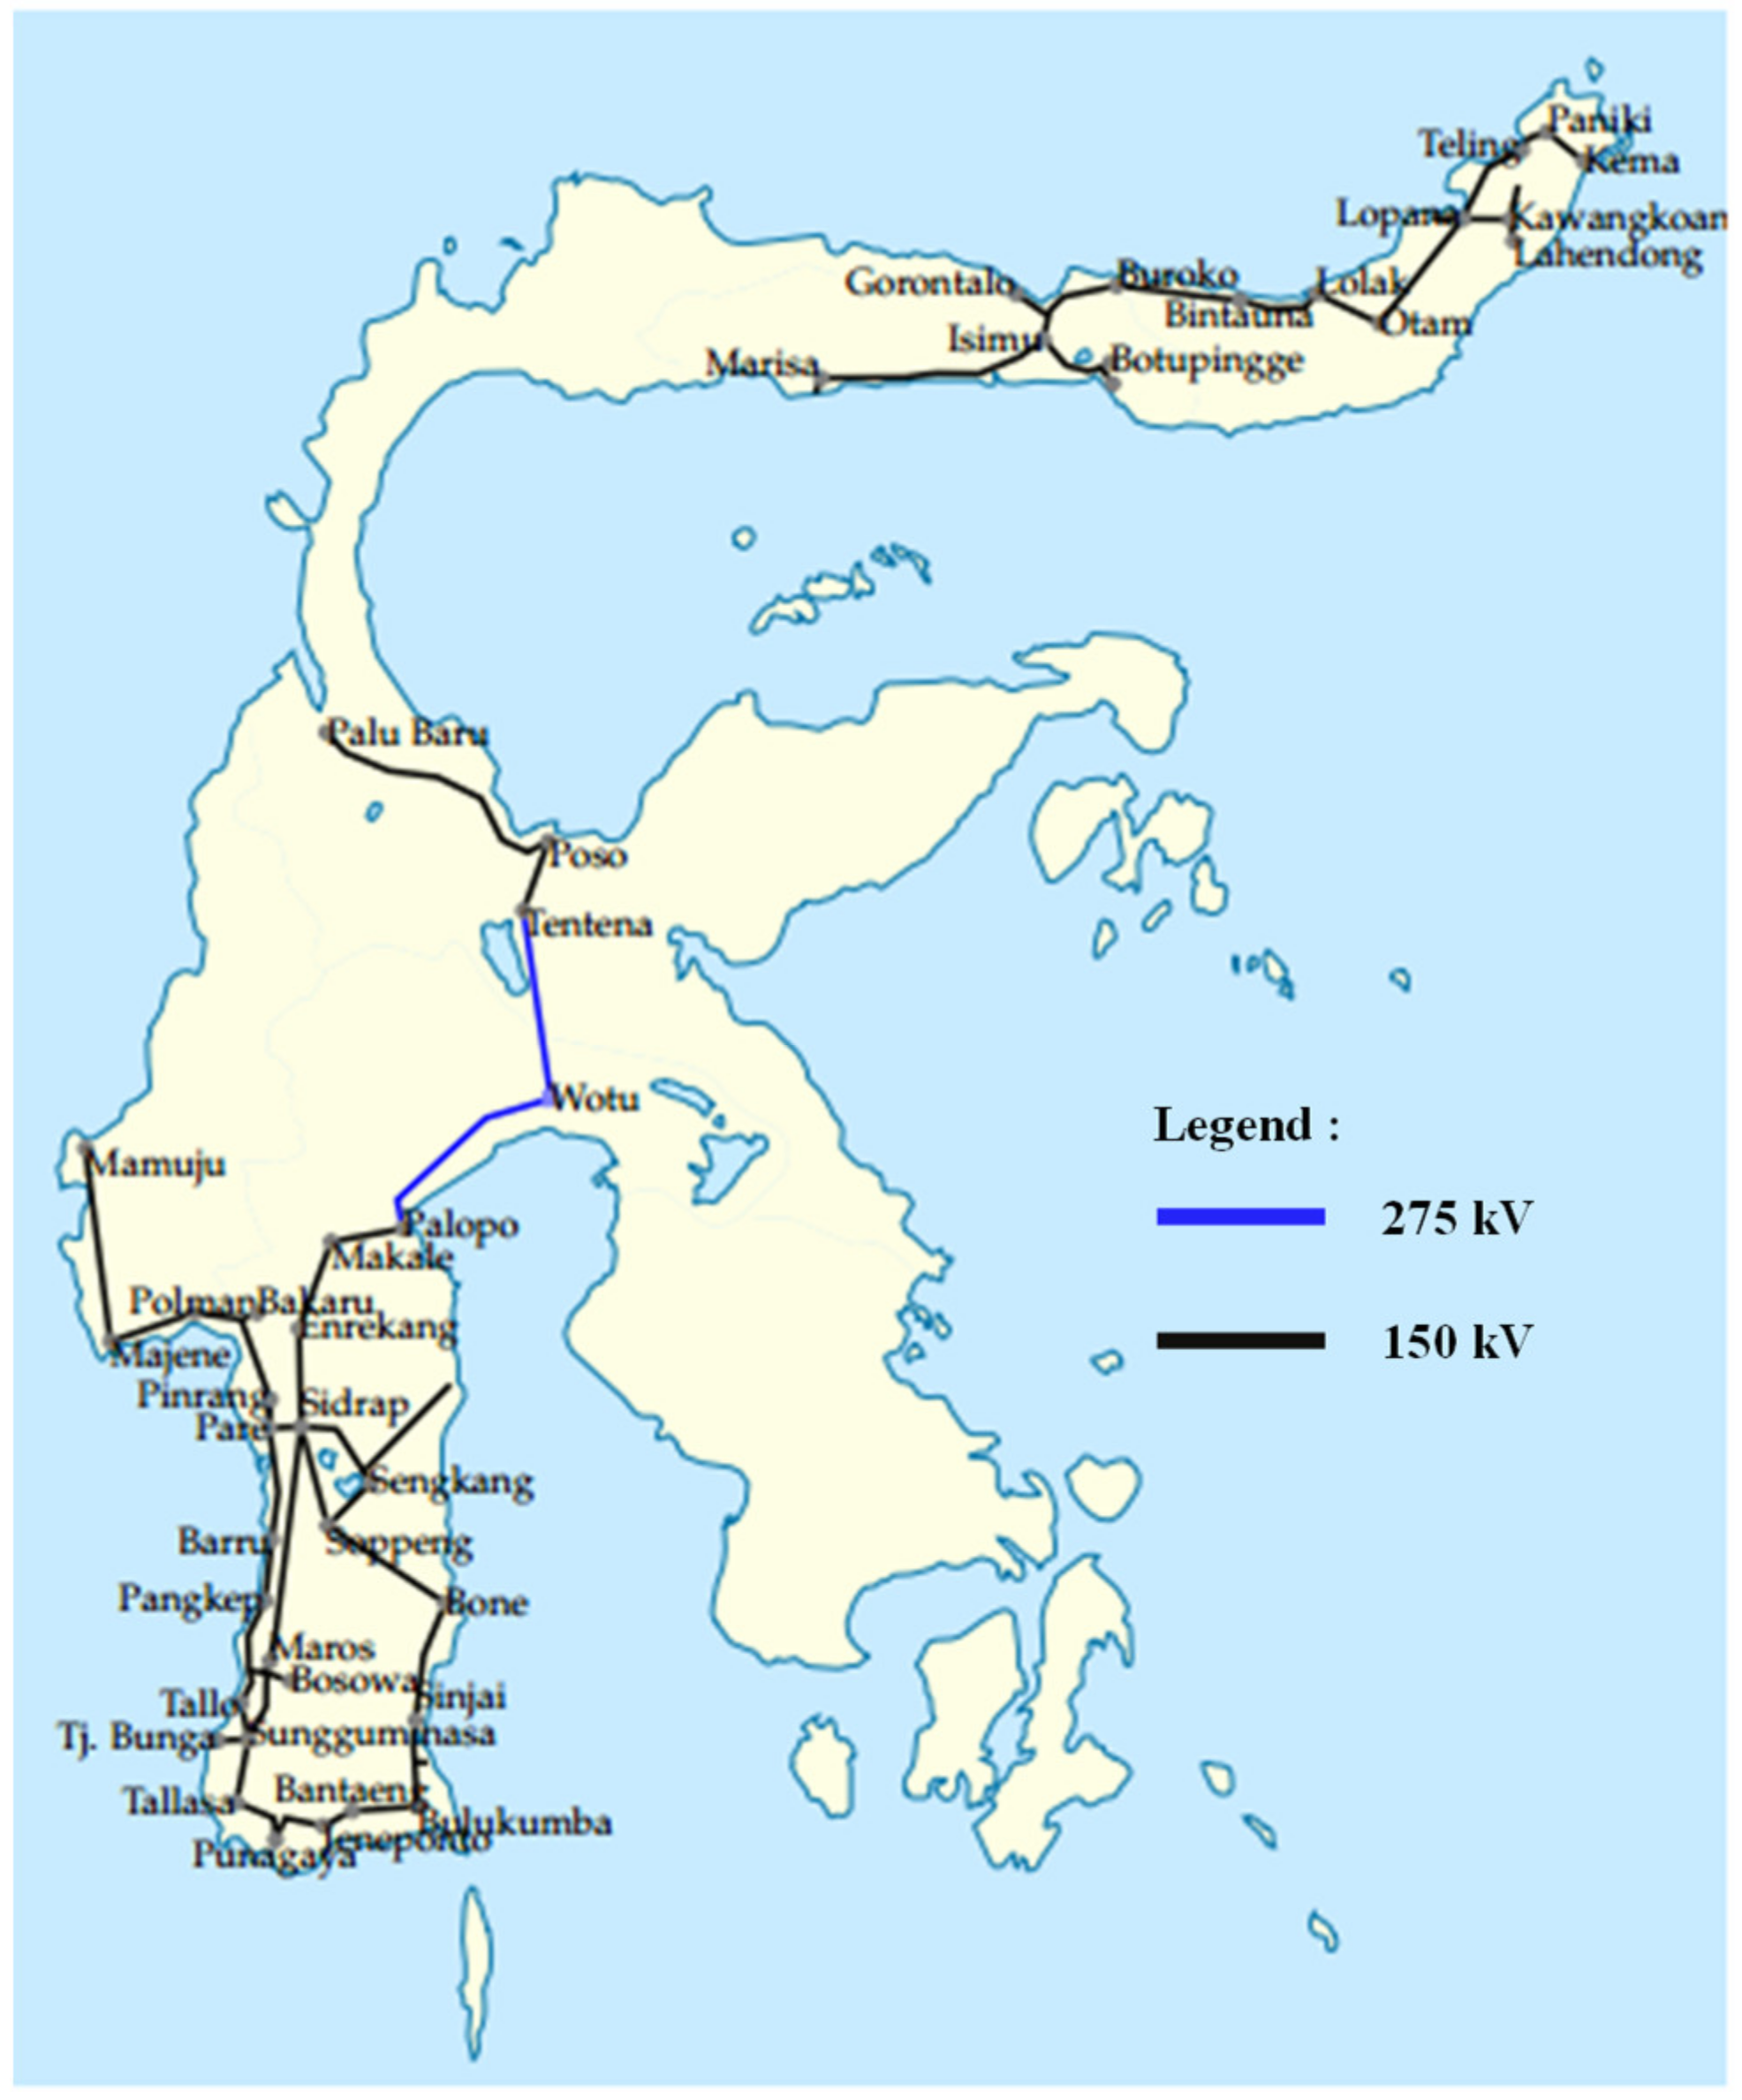
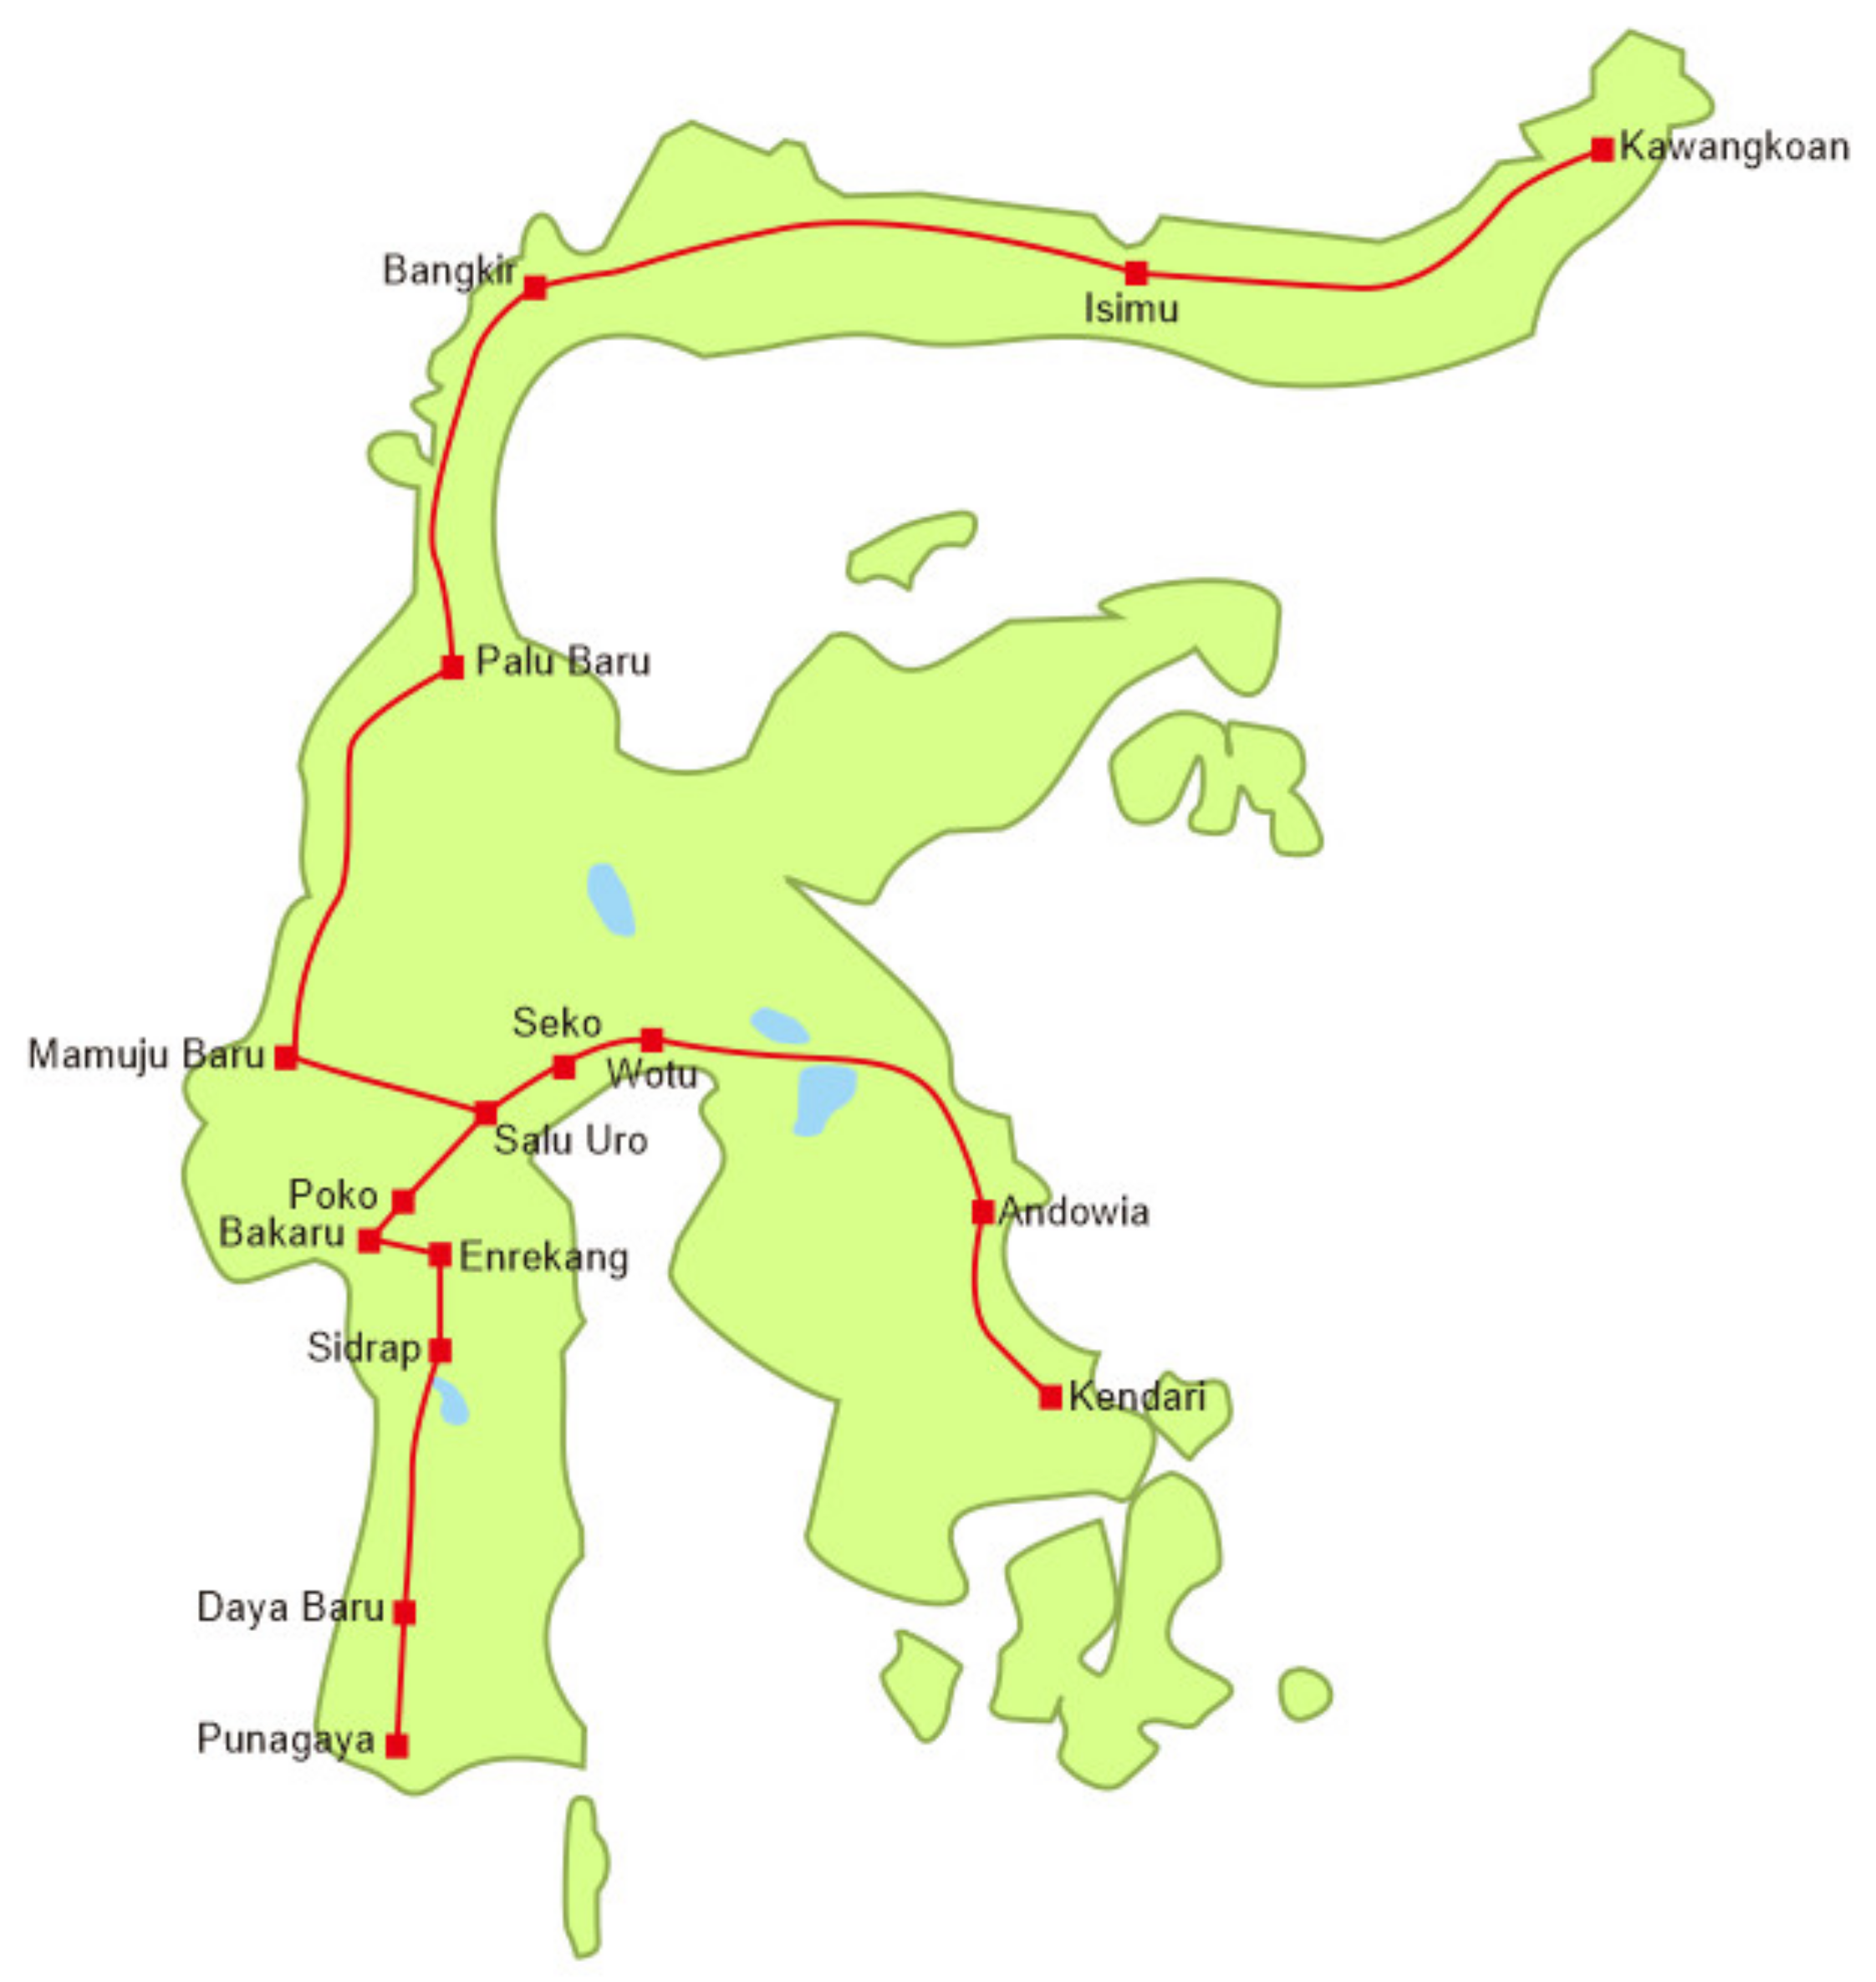
In Sulawesi, currently, there are two systems: Northern Sulawesi and Southern Sulawesi [10]. The existing transmission systems are presented in Figure 3, and consist of 150 and 275 kV lines. The Southern System is bigger than the Northern System; the peak loads are 1413 and 421 MW, and the current generation capacities are 1977 and 573 MW [17,18]. On the other hand, the electricity growth is also high, and the location of the green energy resources is far away. For this reason, the government planned to connect these two systems, allowing the transmission of green natural energy resources on this island. With the interconnection of the system, the system reliability will increase. In addition, the levelized cost of electricity (LCOE) will become cheaper due to the sharing of energy between the interconnected systems.
To interconnect the two systems using a backbone transmission system, a transmission expansion planning procedure is necessary. The procedure is carried out in order to develop or improve the ability of the transmission system so that it can meet the demand for electrical energy and optimize the power plant’s utilization [19,20]. In the planning procedure, it is necessary to identify when and where a new transmission line will be built. This also depends on the capacity and voltage level of the transmission system, which is influenced by several factors, such as the electricity demand, the location of the power plants, and the reliability target of the electrical system [21]. Various studies related to transmission planning have been carried out [19,20,22,23,24,25,26,27,28,29]. From the previous research, the reliability of the transmission system is important to consider in transmission planning. The N-1 contingency reliability criteria must be considered in transmission planning to ensure that energy is delivered to the costumer [23,28]. Moreover, the procedure would minimize the generation cost while providing sustainable and affordable energy, such that the increasing growth of the electricity system encourages economic growth in the region [20]; take, for example, the project conducted in [24], which conducts research related to the inter-regional power grid in China.
A methodology based on economic and technical criteria was developed to determine the backbone voltage level, by considering several criteria of the transmission line. This paper also shows different development scenarios based on the load projections and generator expansion planning in Sulawesi. Furthermore, several criteria to quantify the choice of the voltage level were used to evaluate the choice of the voltage level. As a result, the backbone voltage level would be 500 kV, which would initially be installed in 2021. The existing 150 and 275 kV system would no longer be sufficient to transmit the power. With this design, the Sulawesi electricity system will be more reliable, economical and environmentally friendly. The result of this study was considered in electrical planning documents in Indonesia [10], especially for the transmission line development design in Sulawesi for the next 30 years.

2. Primary Energy Resources and Load Demand

Sulawesi Island has abundant primary energy resources, both non-renewable—such as coal and natural gas—and renewable, such as geothermal, hydro, solar, wind and biomass. The amount of primary energy potential in Sulawesi Island is presented in Table 1. The non-renewable primary energy sources of coal and natural gas have potentials of 2049 and 795 MW, respectively. Meanwhile, renewable energy sources, including geothermal, wind, hydro, solar and biomass, have potentials of 1148 MWe, 4105, 5174, 27,821 and 2086 MW, respectively [18].
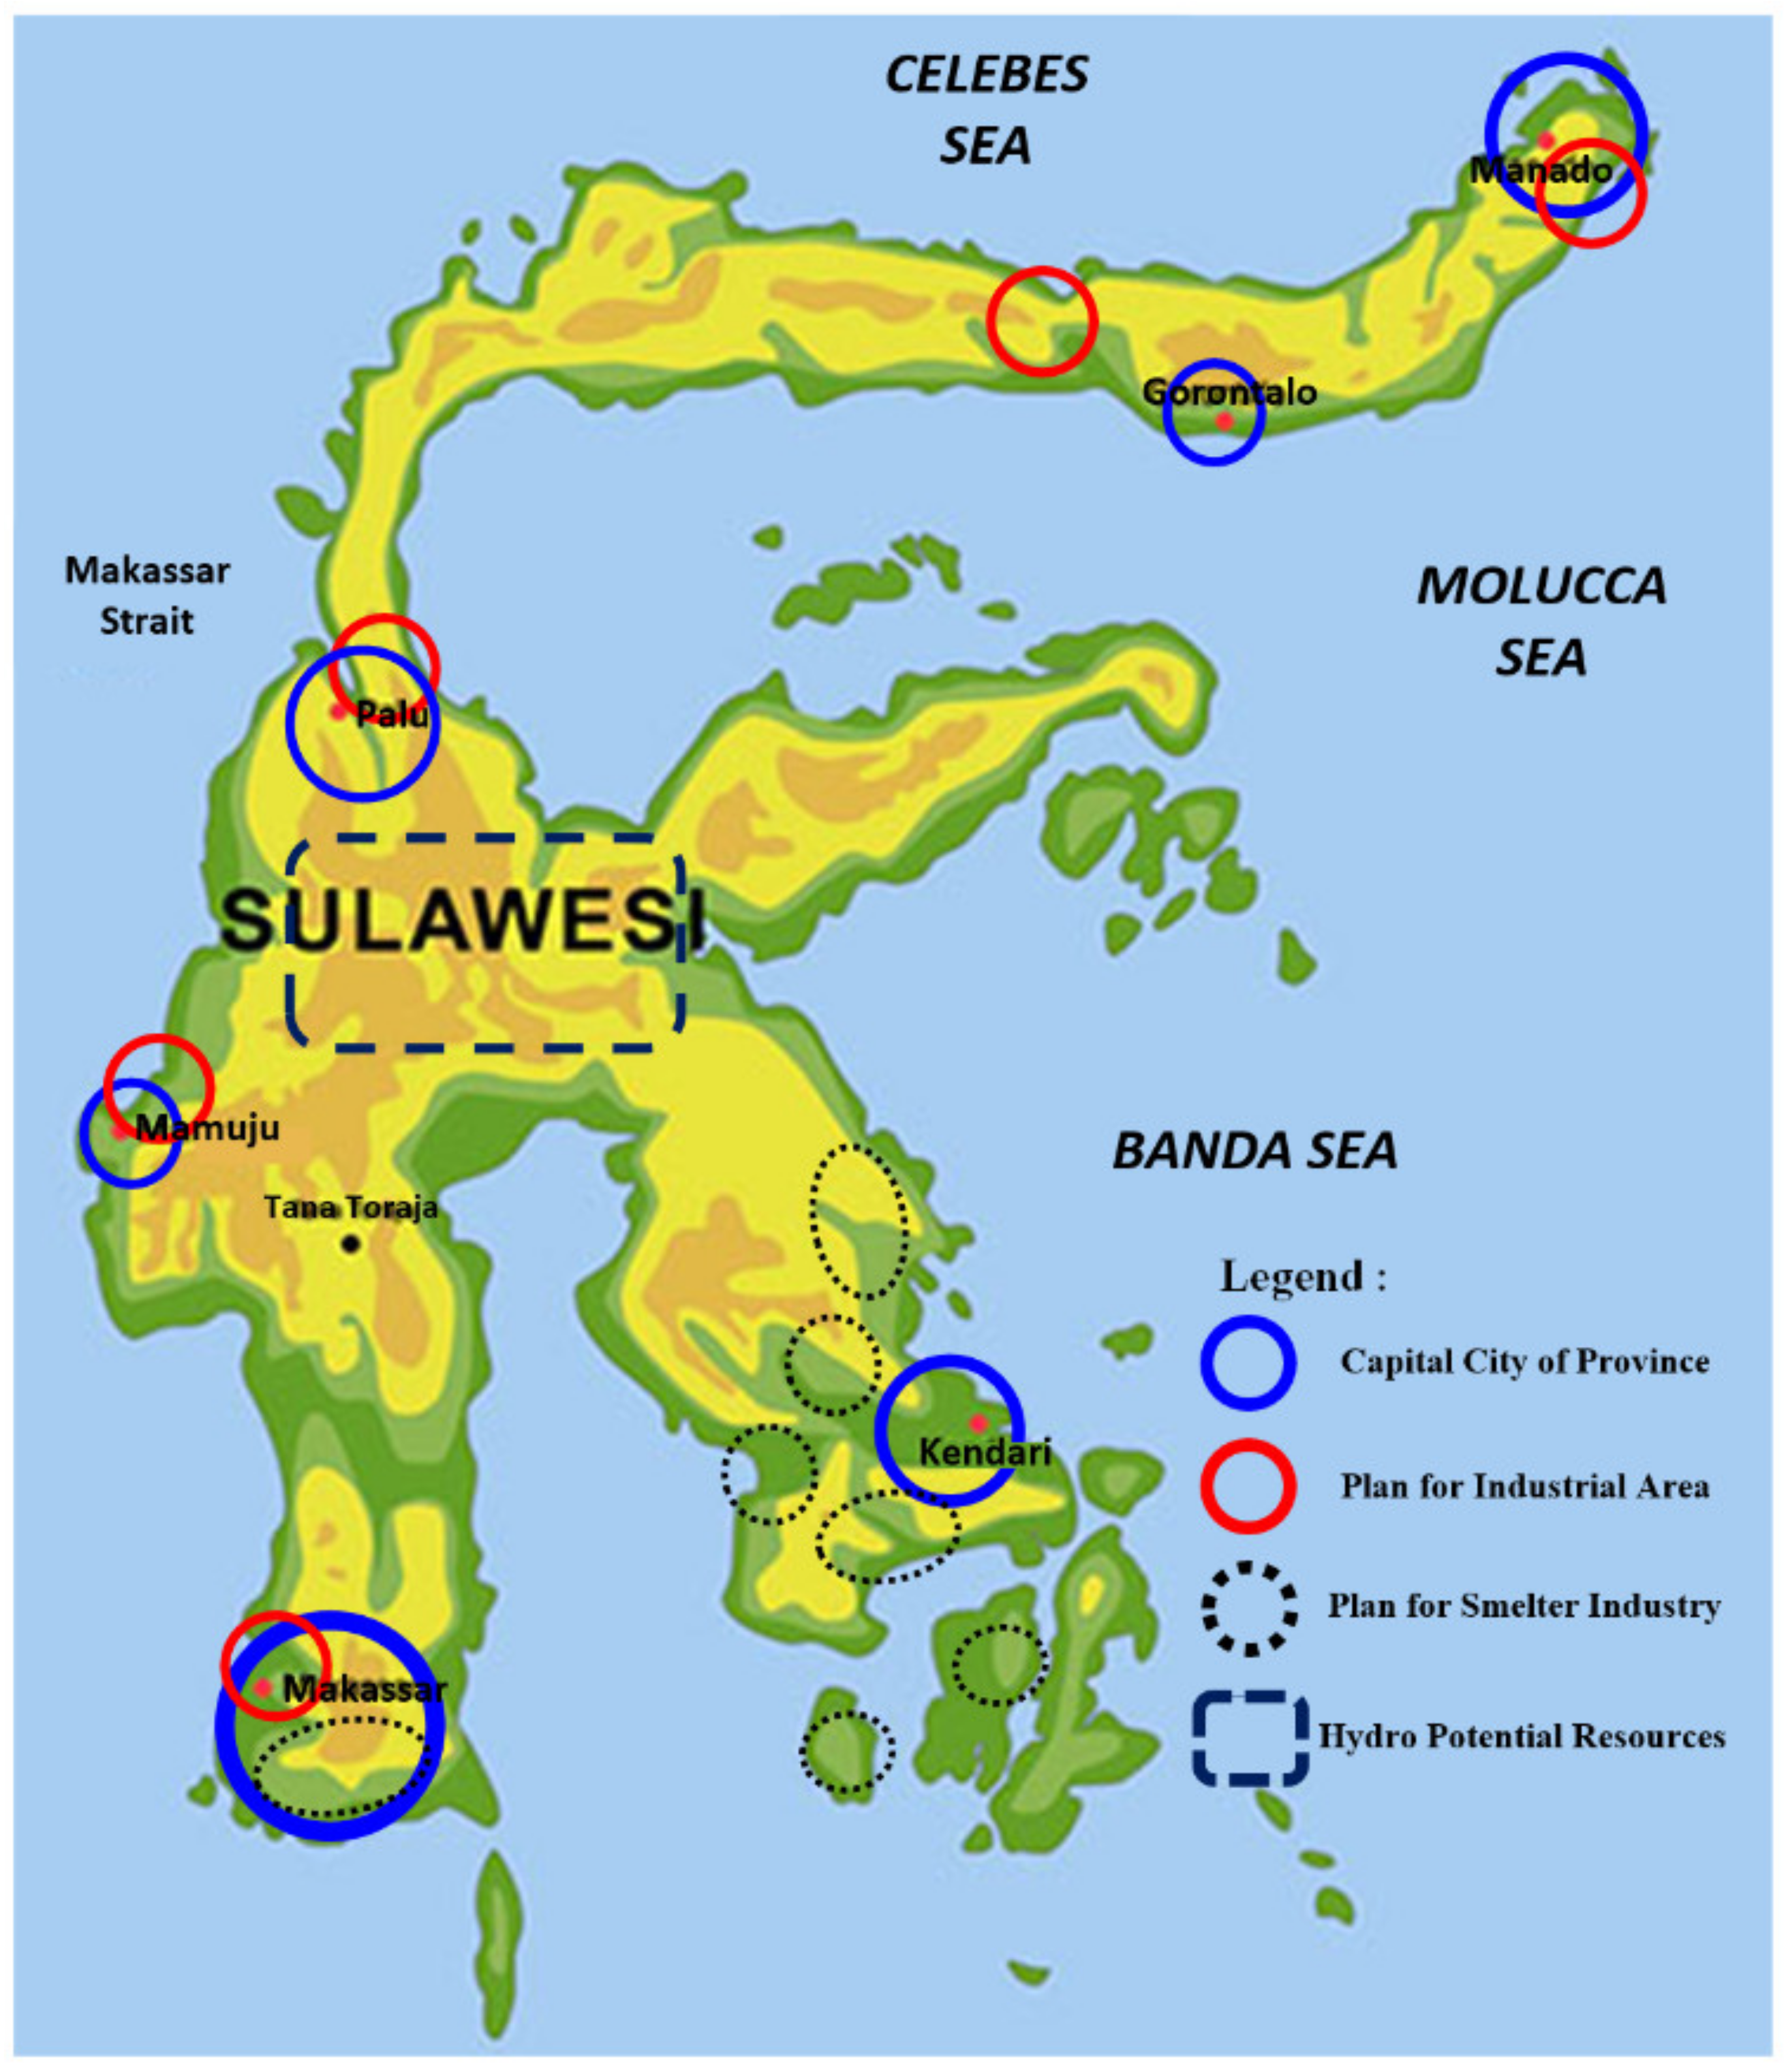
These primary energy resources can generate electricity in order to meet the demand. Considering the renewable energy source (RES) mixed target, an RES generating unit should be installed in the system. Hydro and wind energy are the most suitable options due to the potential and matureness of the technology. Solar generation was not chosen due to its high capital cost and the land use issue. However, the long distance between the load centers and resources is an issue, as shown in Figure 4. For example, the load center is located in Makassar City, while the hydro energy resources are located around Pinrang District, which is 240 km away, and the wind energy resources are located in Sidrap, which is 175 km away.
Therefore, it is necessary to build an interconnection system connecting Northern Sulawesi and Southern Sulawesi to deliver RES generation to the load center. Furthermore, the RES location is far from the load center. Another consideration for interconnection is that the total cost of the system would be more economical and reliable than isolated systems. These interconnection and generation costs are also considered into the expansion planning process. Hence, transmission expansion planning is needed to maximize the deliverability of the RES generation.

3. Transmission Expansion Planning Methodology

The transmission voltage level is the critical issue to be decided. At the time, there were two options to choose from, 275 and 500 kV. The selection of the voltage levels on the transmission line considers various criteria, including load growth factors, capital investment costs, land acquisition costs, power flow analysis, short circuiting, stability dynamics and reliability, as presented in Figure 5. Seven criteria were considered in the determination from the technical aspects, namely the economic voltage, voltage angle, contingency N-1, short circuiting, transient stability, voltage stability and small signal stability, which were evaluated in every time slice. Considering only the economic perspective, low-level voltage would be chosen as the solution due to the low investment cost. On the other hand, the high-level voltage has better technical requirements than the low-level voltage. In order to address these concerns, the procedure was simulated for these two voltage levels, starting from the low-level voltage. If the low-level voltage satisfied the technical and economic procedures, the simulation could be stopped.
The details of several criteria used in the simulation procedure are presented in the following.

3.1. Economic Voltage

The economic voltage is the voltage level when the total cost of the conductors, transformers, switchgear, insulators and other equipment is at a minimum. The relationship between the capital cost and the transmission voltage level is shown in Figure 6. Point Z is the minimum point, and the voltage at OX is the optimum transmission voltage [30].
However, the method of locating the economical transmission line voltages, as described above, is rarely used due to difficulties in determining the initial cost of the equipment associated with the transmission line. Therefore, it is calculated using an empirical formula to determine the economical transmission line voltage for the three-phase AC power system. The equation is formulated in Equation (1). Based on this equation, the economical transmission line voltage (V in kV) depends on the length of the transmission line (L in km) and the power transferred by the transmission line (P in kW) [30].
V = 5.5 0.62   L + P 150

3.2. Voltage Profile and Loading

The voltage angle in the phasor diagram shows the sine wave phase of the corresponding voltage. When electric power is transferred through the transmission line, there is a difference in the voltage angles at the two ends of the transmission line; this is due to the impedance in the conducting wire. In the transmission line planning evaluation, the difference in the voltage angle between the two ends of the transmission line must not exceed 30°. The allowable values of the line loading and voltage profile in the normal condition and N-1 condition are shown in Table 2. The voltage angle value can be obtained from the load flow results; then, the voltage angle difference can be calculated for each transmission line. Besides the voltage angle, the results of the load flow also show the voltage magnitude, active power and reactive power. The allowable voltage magnitude limit is ±5%, while the maximum power flow limit is 80% [31,32,33]. In the transmission line planning, it should be noted that when an N-1 contingency occurs, the system should withstand it to supply power to the load. The voltage magnitude limit when an N-1 contingency occurs is ±5%, while the power flow limit is 100%.

3.3. Short Circuit

Short circuiting on the transmission line can be caused by various factors, which result in an uncontrolled flow of current and can cause equipment damage. There are two types of short circuits, namely symmetrical short circuits caused by three-phase faults, and asymmetric short circuits caused by a line to line fault, single line to ground or double line to ground. Transmission lines with different voltage levels have different short-circuit currents, so it should be noted that the short-circuit current must not exceed the limits shown in Table 3.

3.4. Transient Stability

A transient event is a change in states that occurs suddenly; in electric power transmission, a transient event can be caused by a fault, such as a short circuit. It is necessary to evaluate whether, when a transient event occurs, the system can return to a stable condition or not. The generator is the component most affected when a transient event occurs, especially in the balance of mechanical power and electrical power, which will affect the angle of the rotor (δ). When a fault occurs, δ will increase; if δ continues to increase, it will result in a loss of synchronism; it is, therefore, necessary to conduct interference before δ reaches the critical point, called the critical clearing angle (δC) [33].
The critical clearing time (CCT) is the time needed from the occurrence of the fault until it reaches the critical clearing angle (δC). Interference must be conducted before the CCT time is exceeded; the greater the CCT, the better, as there is more time for interference. The minimum CCT limits for each voltage level are shown in Table 4 [33].

3.5. Voltage Stability

The voltage stability on a bus/station depends on the amount of power transferred through the bus/station, and the relationship between the power transfer and the voltage, as shown in Figure 7. Figure 7 shows that the greater the power transfer, the smaller the voltage, up to the critical point (Pcrit); if the power transfer exceeds Pcrit, then voltage collapse will occur. Voltage collapse is a condition in which the power transfer reaches the limit that causes the system to collapse, as shown by a decrease in the power transfer coupled with a significant voltage drop. In order to avoid the voltage collapse, the operating point of the power transfer is limited to a maximum of 90% of the Pcrit based on [33].

3.6. Small Signal Stability

Small signal stability is the stability of the system when faced with minor disturbances such as sudden load changes. When load changes occur, the generator must be able to respond by changing the power produced. In response to load changes, the generator is usually equipped with equipment such as a Load Frequency Control (LFC), an Automatic Voltage Regulator (AVR) and a Power System Stabilizer (PSS). In the small signal stability analysis, the generator is modeled as a block diagram. Based on the block diagram, state equations can be formulated in a general form, as shown in Equation (2) [33,34]. The variable u in the equation is the input, which includes the excitation voltage, turbine power and torque input, while variable x is the state variable, which includes the rotor current and rotor flux [35]. The linearized dynamic model of the Sulawesi system was modeled using the Equation (2). The system is stable if the eigenvalue of matrix A is negative in its real component, as illustrated in Figure 8 [33].
x ˙ t = A   x t + B   u ( t ) y t = C   x t + D   u ( t )
With:
  • A = the state matrix,
  • B = the input matrix,
  • C = the output matrix,
  • D = the direct transmission matrix,
  • x t = a state variable,
  • y t = an output variable,
  • u ( t ) = the input data.

4. Initial Data and Assumption

This study only discusses the transmission voltage levels, namely 275 and 500 kV. Therefore, transmission and distribution facilities that have voltage levels below these were modelled as a lump load (aggregated load).
Some initial data were required to execute the transmission expansion planning, which were the load forecast, the required generating unit for the whole-time horizon, and the transmission line routes.

4.1. Load Forecast

There are two scenarios in the load forecast, namely the base-demand scenario and the high-demand scenario. The base-demand scenario uses the business-as-usual concept, meaning that growth runs normally and there are no large increases in the load. Meanwhile, the high-demand scenario refers to high economic growth and a large increase in loads, especially from new industries, such as smelters, that consume a large amount of electrical energy.
The forecast results for the peak load of the SES are shown in Figure 9. The average peak load growths for the Sulawesi system were 5.53% and 6.33% annually for the base-demand scenario and the high-demand scenario, respectively. In the final year of the planning period of 2050, the peak load reached 14,597 MW for the base-demand scenario and 19,887 MW for the high-demand scenario.

4.2. Generation Expansion Planning Result

In generation expansion planning (GEP), there are several types of power plant candidates, namely steam turbines, gas turbines, combined cycles, geothermal and hydro. The choice of which plant to build and when to build is determined based on the least-cost optimization procedure. These costs consider capital, operation and maintenance, and fuel costs. The GEP data in 5-year intervals are shown in Table 5.
Based on Table 5, the capacity of hydro generating units for the base demand and the high demand is the same. This is due to the fact that the planning of hydro plants was carried out separately from thermal plants, and hydro plants were determined deterministically based on [17,36]. The compositions of the non-RE generating units (Steam, Gas and Combined Cycle) for the base-demand scenario for 2025, 2040 and 2050 were 62.6%, 65.17% and 69.84%, respectively. Meanwhile, the compositions of the RE generating units were 37.4%, 34.83% and 30.16%. For the high-demand scenario, the compositions of the non-RE generating units were 71.21%, 75.17% and 78.54% for 2025, 2040 and 2050, respectively. The compositions of the RE generating units for this scenario were 28.79%, 24.83% and 21.46% in 2025, 2040 and 2050.

4.3. Backbone System Route

The backbone line route was determined by considering the transmission, interconnection time and generation costs. The interconnection system will be built in 2025, as it took 7 years starting from 2018 for the planning, project auction, site and feasibility studies to the construction of the transmission system. The backbone route of the SES in the high-demand scenario is shown in Figure 10. In Figure 10, only the backbone line route is presented, while the existing 150 kV transmission system is aggregated into the backbone. In addition, the year of construction and the length of the transmission line candidates can be seen in Table 6.

5. Results and Discussion

This section discusses the result of the backbone transmission line development plan in the SES until 2050. There are two options for the transmission voltage level: 275 and 500 kV voltage level backbones. In the simulation, two load forecast and interconnection options were considered.

5.1. Criteria Evaluation

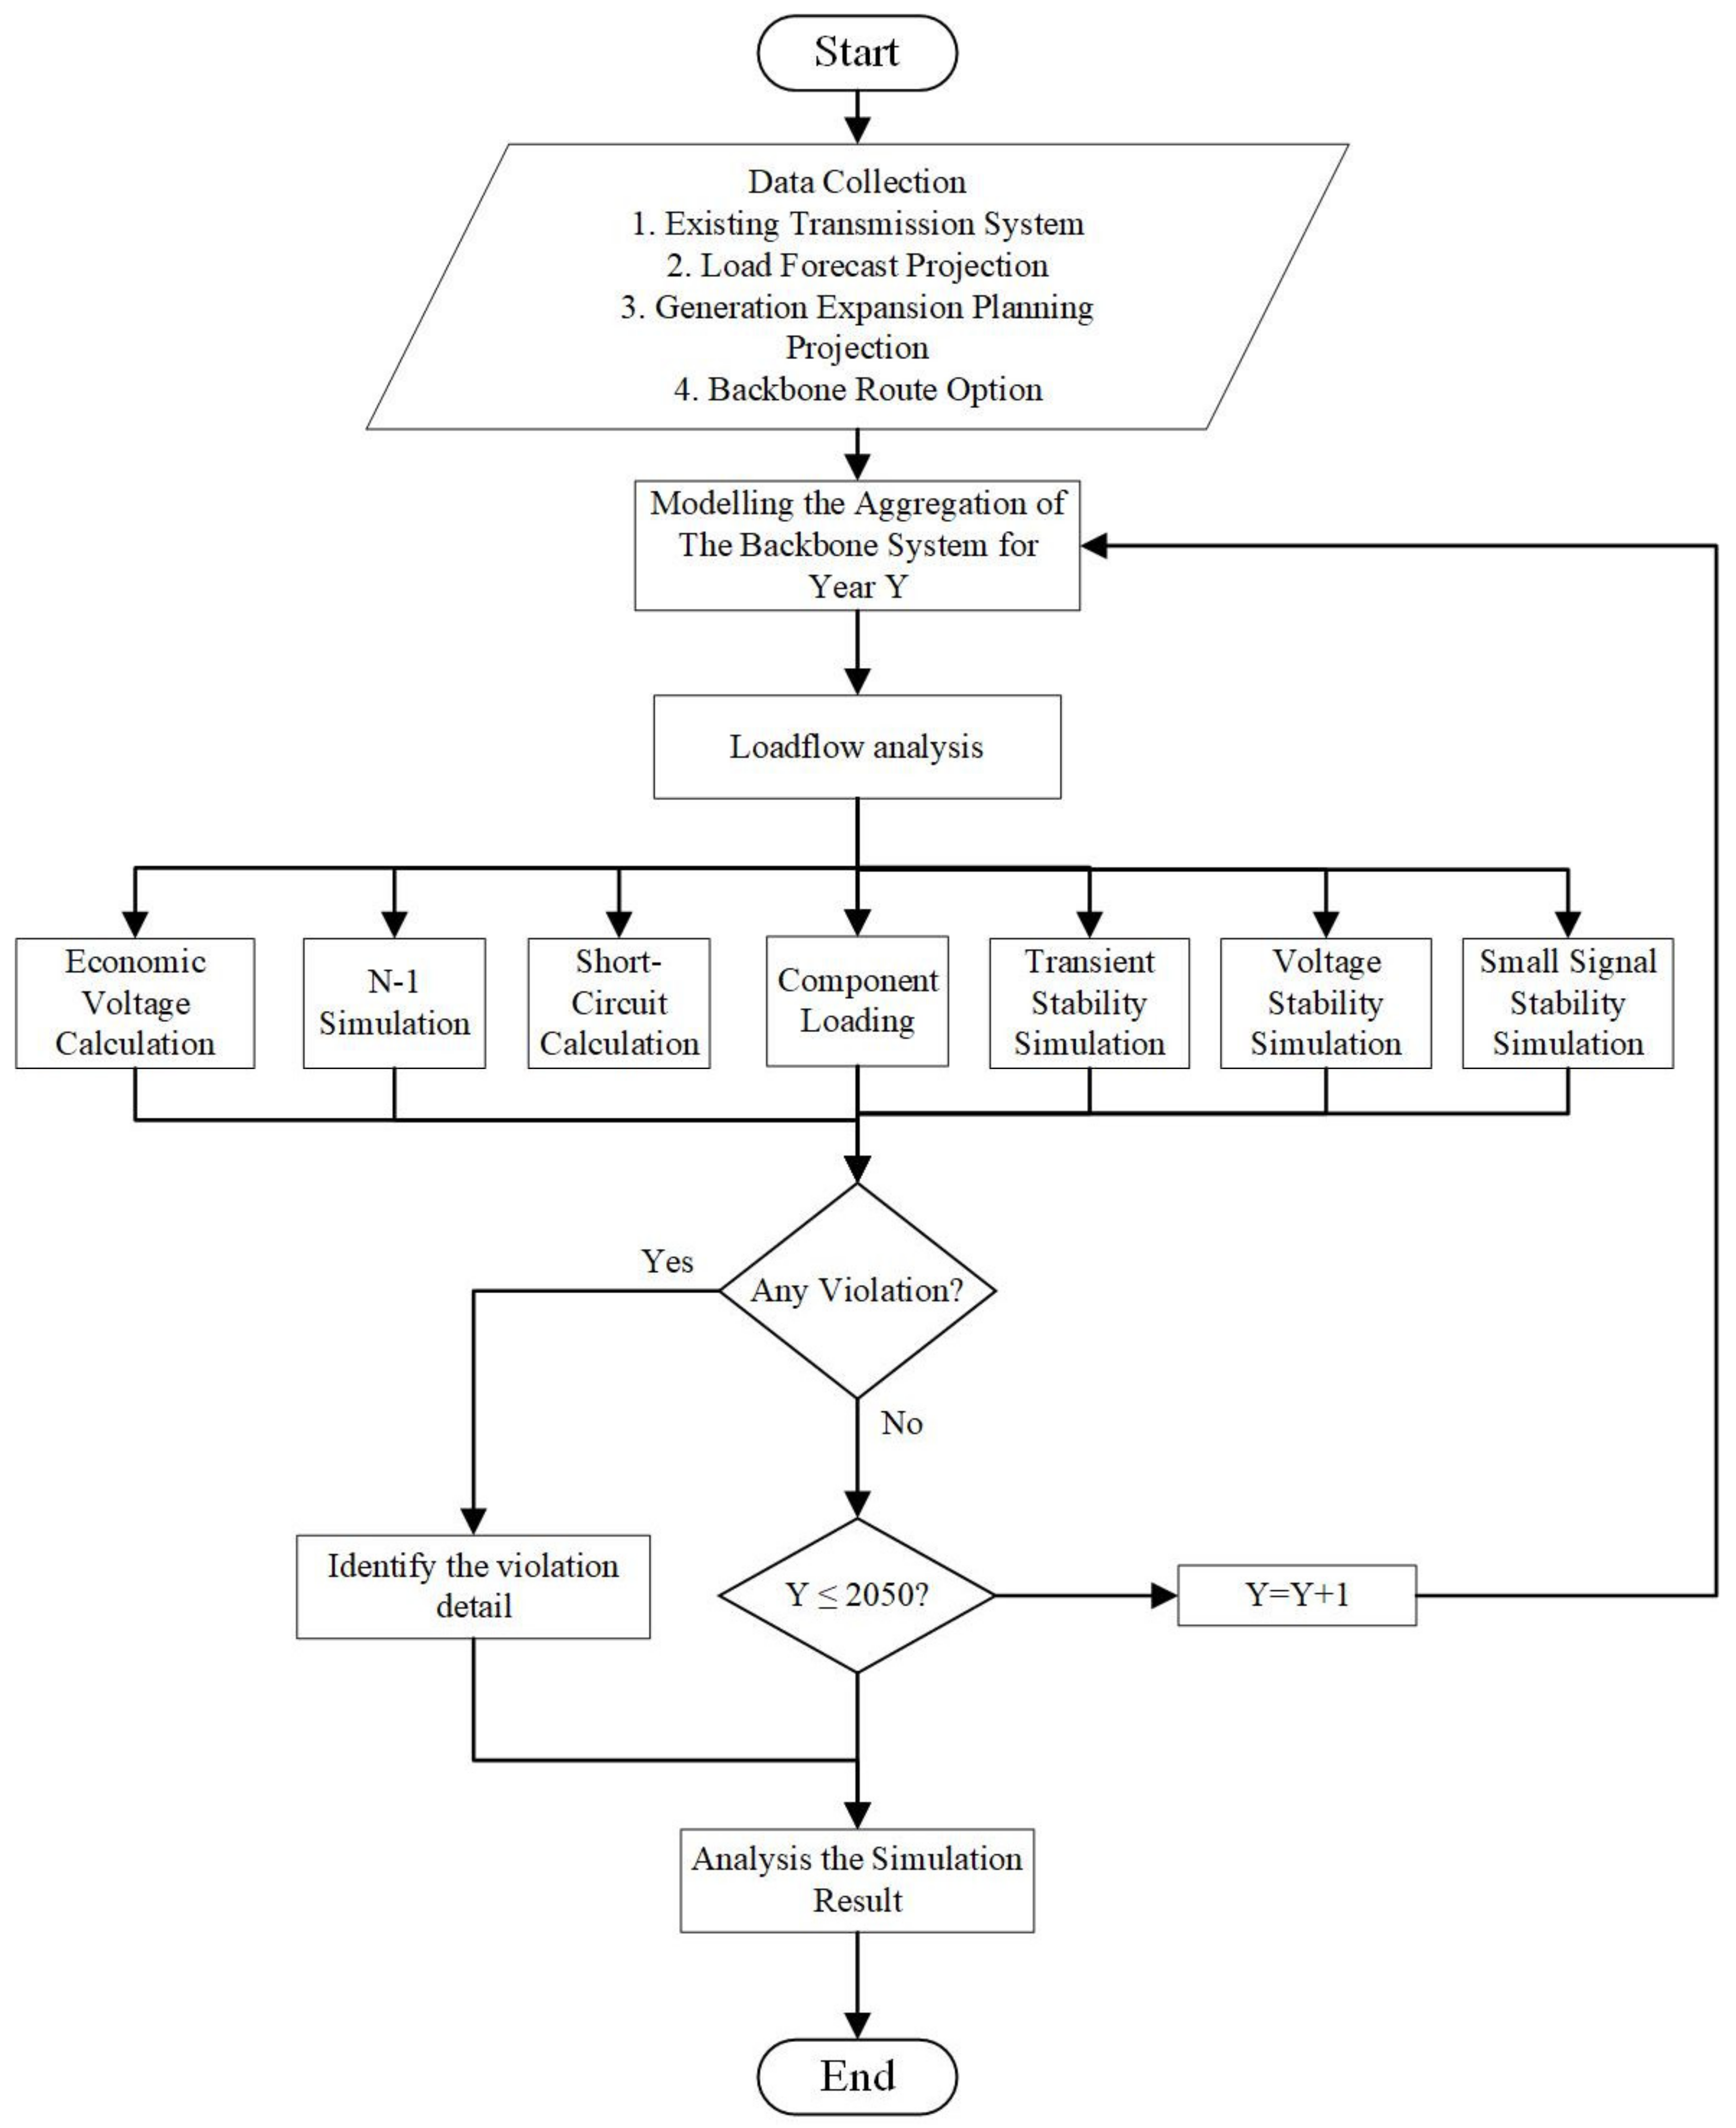
Simulations to ensure the economical and technical criteria were executed in the DIgSILENT Power Factory software environment. This simulation aimed to determine whether there are criteria that are violated or not; based on the simulation, the results were obtained as shown in the Table 7.
Based on the load flow analysis, the economic voltage can be calculated for each transmission line using the line-length data and the amount of power that is transferred by the line. The economic voltage calculation results for the high-demand scenarios show that the standard economic voltage exceeded 275 kV in 2029. The transmission line exceeding the standard is Wotu– Tentena, which requires a transmission voltage of 302.3 kV.
In the N-1 contingency criteria, the most congested line would be simulated. The simulation would show the system condition when the outage occurred. This N-1 contingency criterion is similar to the load flow, i.e., the voltage magnitude limit is between 0.95 and 1.05 p.u.; the maximum voltage angle difference is 30°, and only differs by the loading limit of 100%. The simulation results show that at the voltage level of 275 kV in 2034 for the high-demand scenario, the voltage magnitude limit was violated at Tentena Station, which was equal to 0.939 p.u. Meanwhile, the 500 kV voltage level still met the requirements.
A voltage stability simulation was performed on the bus/station with the highest load in two conditions, namely the normal condition and N-1 contingency conditions. At the 275 kV level voltage base-demand scenario, the voltage stability criterion was violated in 2037 in the Daya Baru Station; this violation occurred when a contingency occurred in the transmission line of Sidrap–Daya Baru. In the high-demand scenario, a violation occurred in the same place as the base demand, but the violation occurred in 2034. Meanwhile, for the 500 kV voltage level, both the base demand and high-demand scenarios still met the voltage stability requirements.

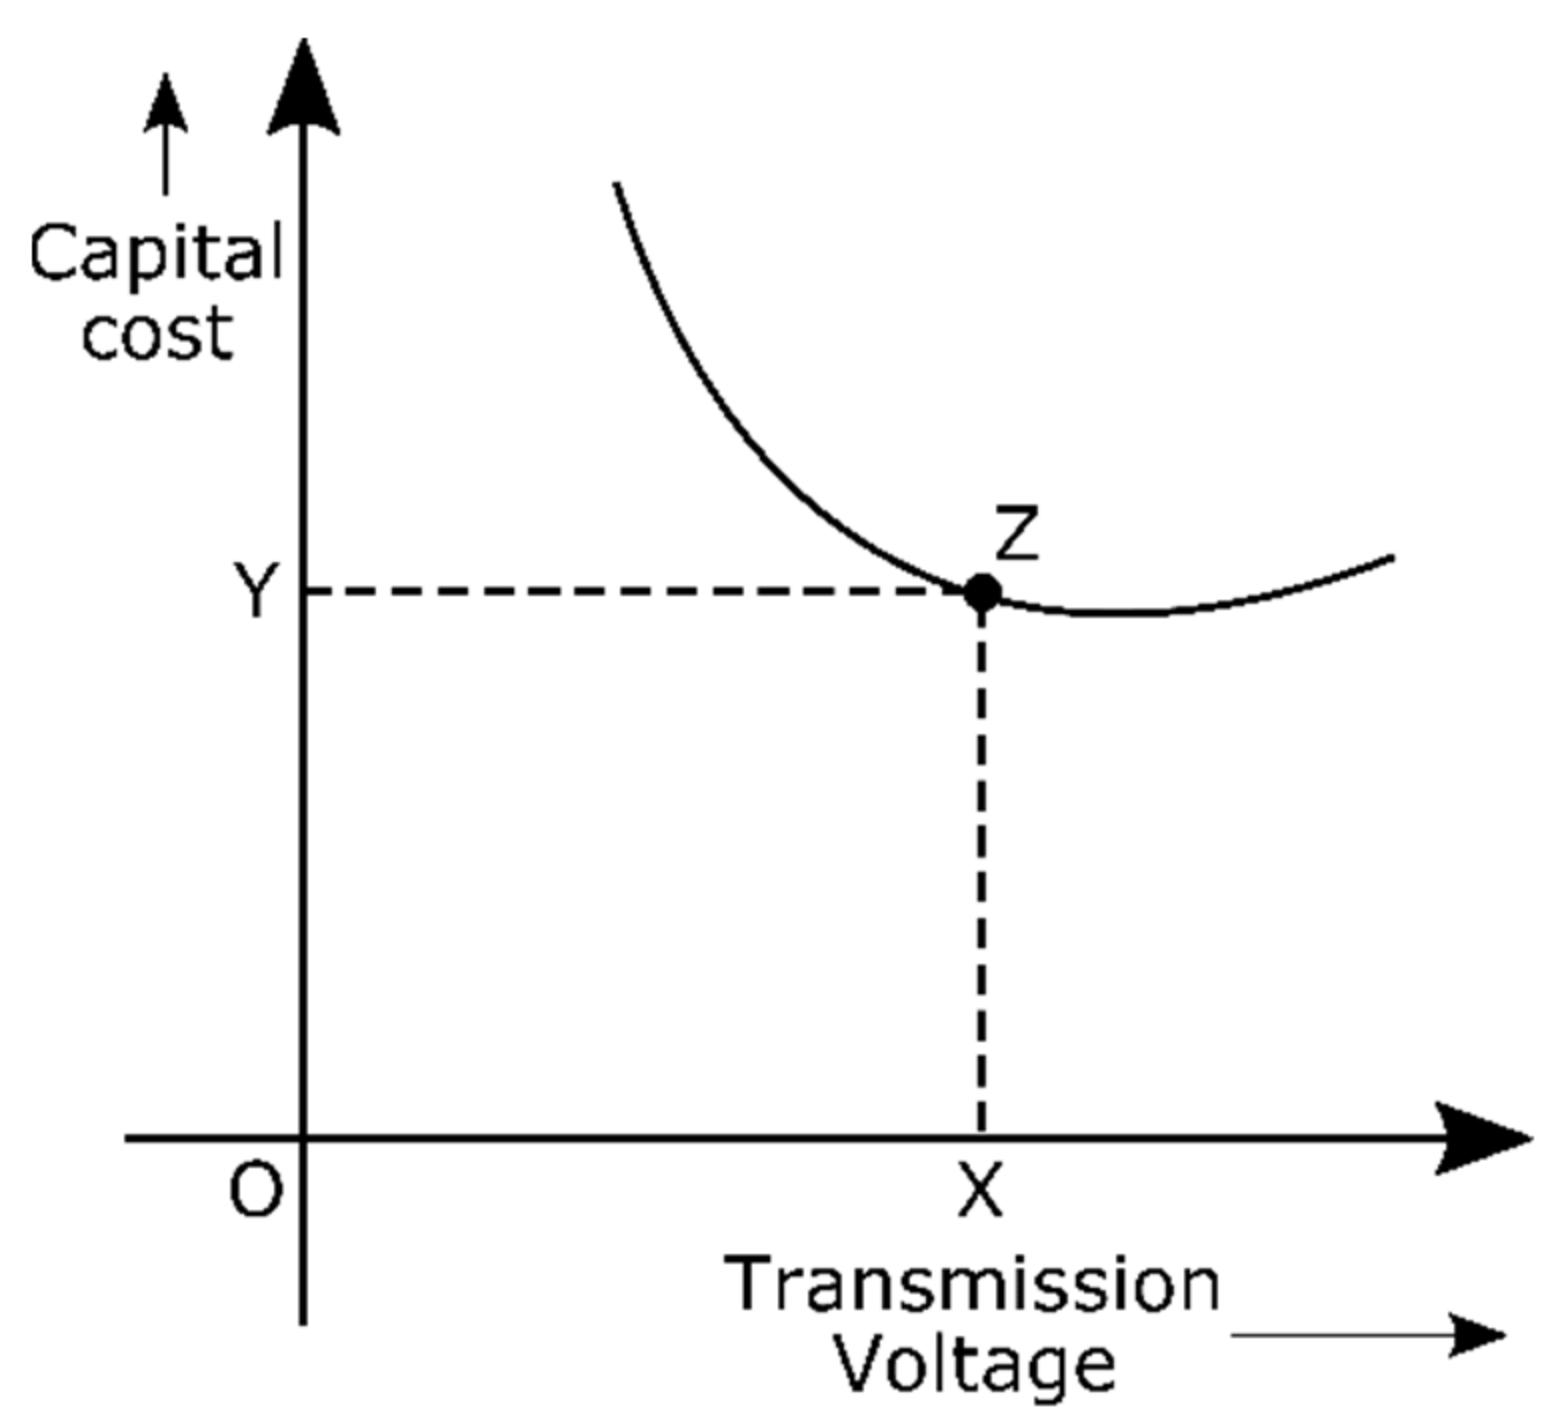
5.2. Economic Voltage

Based on Equation (1), economic voltage is affected by two parameters, namely the length of the transmission line and the power transferred by the transmission line. The longer the transmission line, the greater the economic voltage; therefore, the greater the power transferred, the greater the economic voltage. Economic voltage calculation results are declared “safe” if they are smaller than the backbone voltage. The economic voltage limit was broken in 2029 at the 275 kV backbone with the high-demand scenario, and the transmission line that exceeded the limit was Wotu–Tentena 2a. The complete calculation results of the economic voltage on the Wotu–Tentena 2a lines are presented in Table 8.
The length of the Wotu–Tentena 2a line is 104.5 km, and there was no change in length during the transmission planning period. This means that the amount of power transferred affects the economic voltage value. Table 8 shows that the power transferred increased over time until 2029, when there was a limit break of the economic voltage. Meanwhile, in 2031, there was a decrease in the power transferred, such that the economic voltage remained safe; this happens because the power is transferred through another transmission line.
In fact, the violation of the economic voltage was not fatal, as although the economic voltage was violated, the load flow could still run normally. In order to avoid the violation of the economic voltage, the power transferred can be reduced by dividing it into other transmission lines, as occurred in 2031.

5.3. N-1 Contingency

In the N-1 contingency condition, two parameters were evaluated, namely the voltage magnitude on each bus and the loading of each transmission line. The simulation results show that the N-1 contingency criteria were violated in 2034 when the Wotu–Tentena 1a line incurred a loss precisely at the 275 kV backbone during high-demand scenarios. The details of the parameters that were evaluated in these conditions can be seen in Table 9.
The Wotu–Tentena transmission line that incurred a loss during the contingency had the largest loading compared to the other lines. This transmission line is also an important line because it connects the Northern Sulawesi subsystem and the Southern Sulawesi subsystem. The loss in the Wotu–Tentena 1a line will certainly affect the system, especially regarding components located close to the line. Based on Table 9, it is shown that the Tentena Station experienced an undervoltage of 0.939 p.u., whereas before the contingency, the Tentena Station voltage magnitude was 0.979 p.u. Meanwhile, other stations near the Wotu–Tentena 1a line also experienced a voltage drop, namely the Palu Baru Station, from 0.966 to 0.957 p.u. and the Daya Baru Station, from 0.967 to 0.954 p.u.
The voltage drop in the stations around the loss line occurred because the power that should pass through the line must be diverted through another line. As a result, the voltage drop in the other lines increased, such that the bus voltage decreased. In addition, the increase in the voltage drop also caused an increase in power losses in the transmission line.
In addition, the contingency also influenced the line loading. The Wotu–Tentena 2a line was the most affected; this line loading before the contingency was 24.47%, and increased to 49.36% after the contingency. In addition, other lines also experienced a slight increase in loading due to the addition of power losses, as described previously.

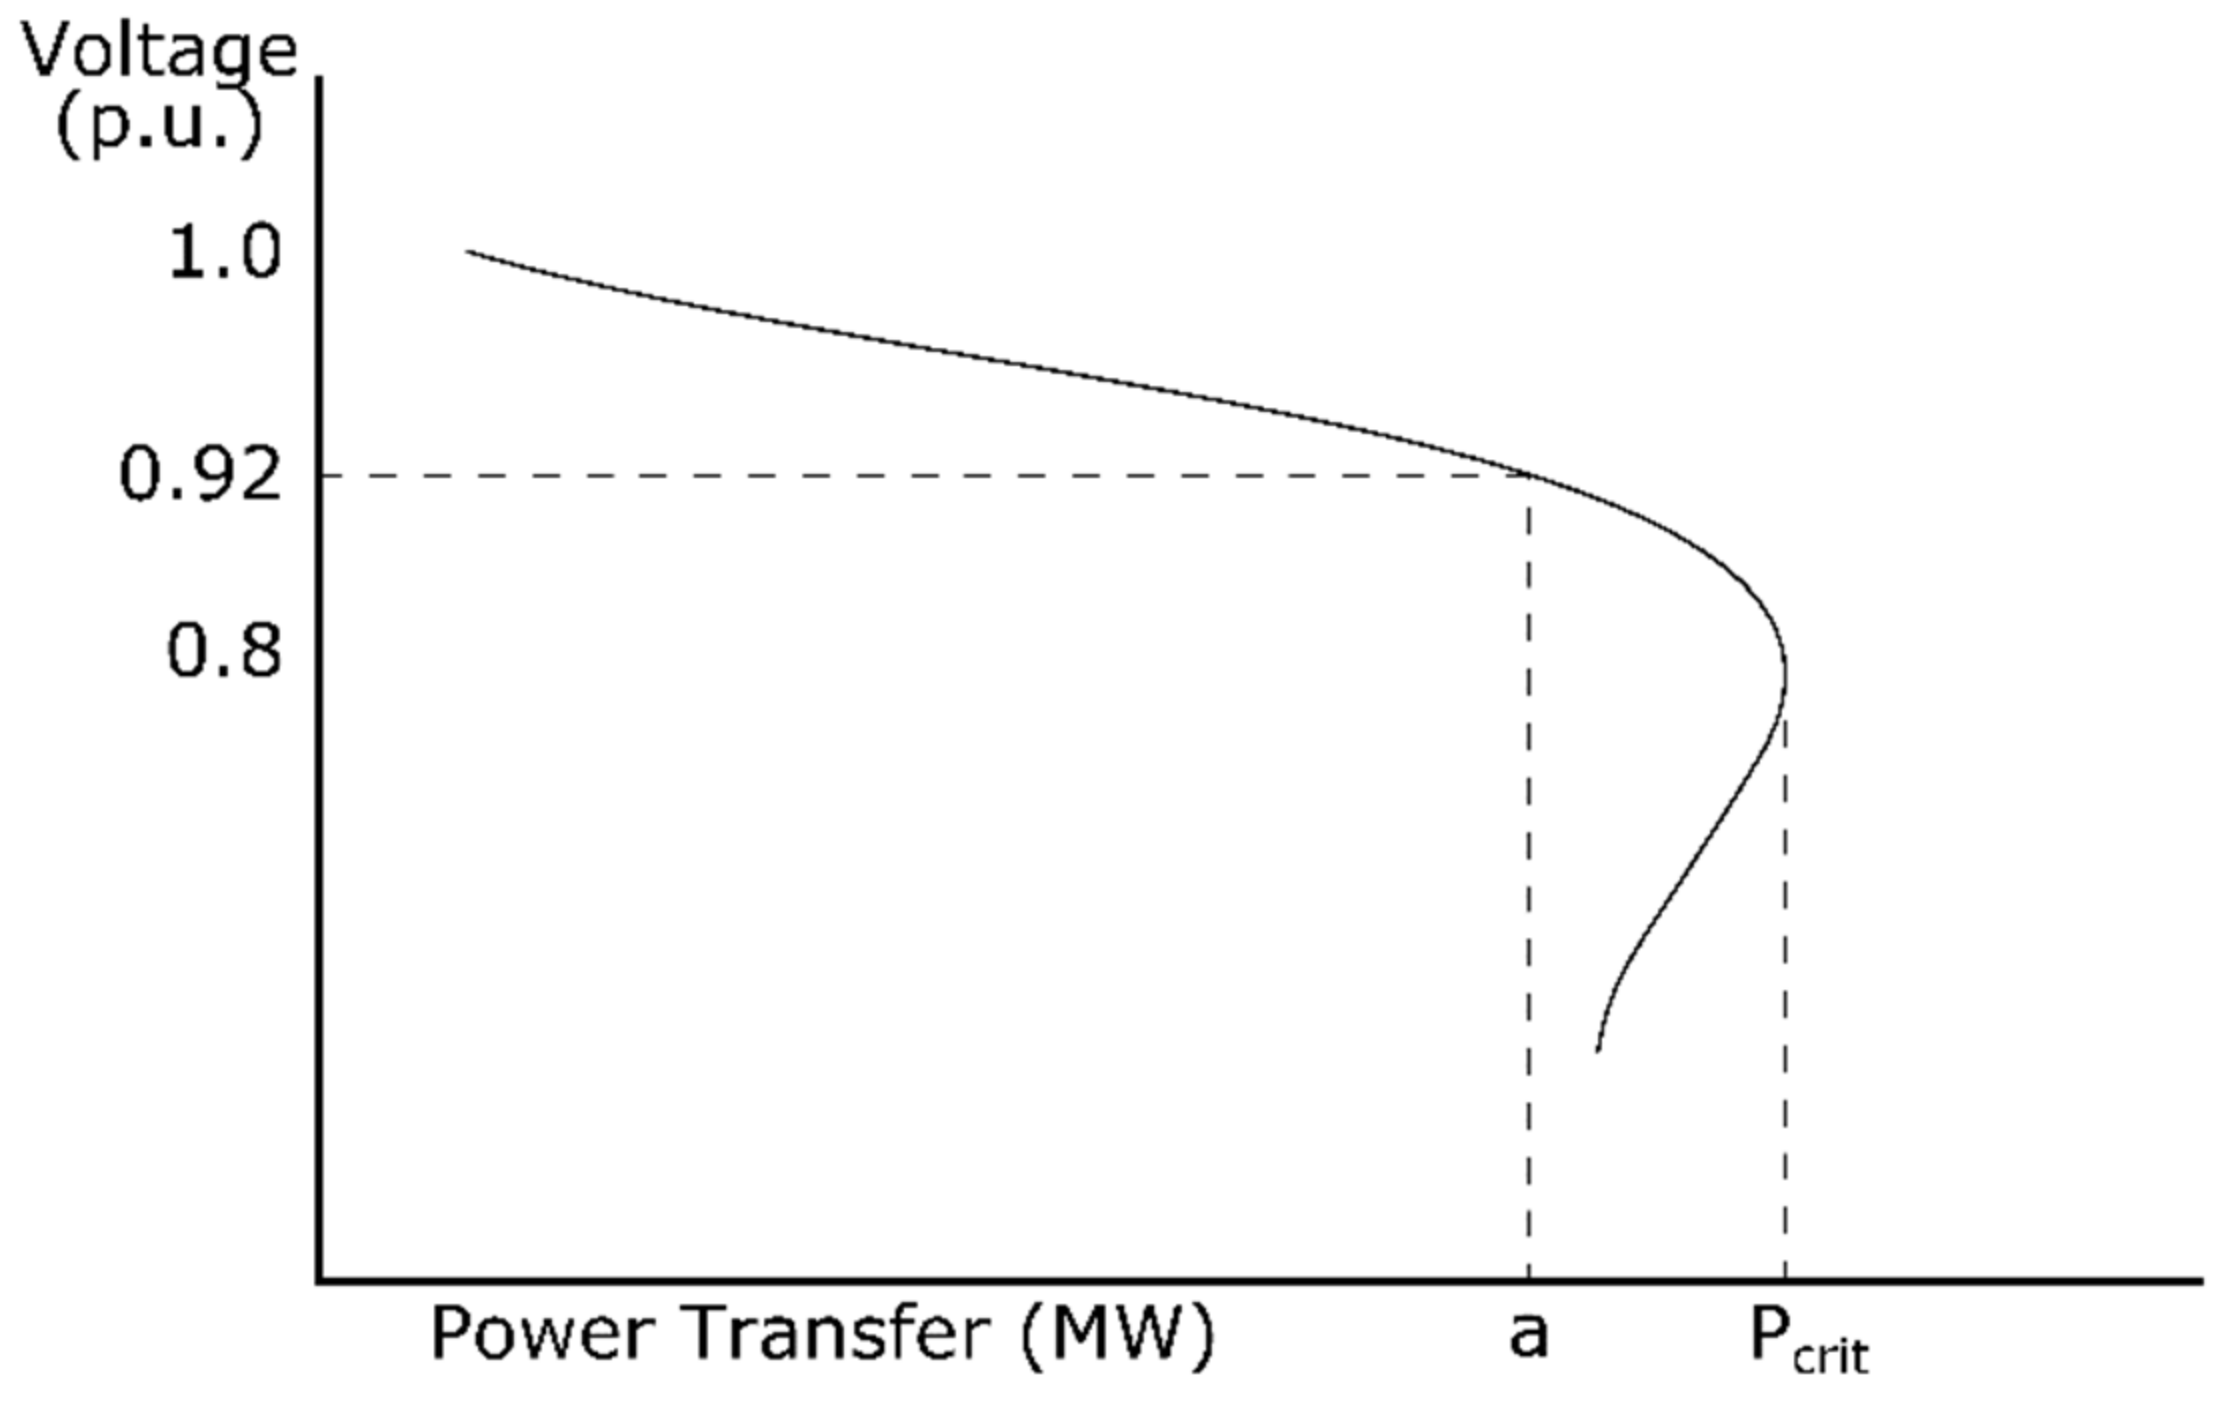
5.4. Voltage Stability

The voltage stability on a bus was evaluated by considering the load connected to the bus and the point of critical power (Pcrit). Pcrit is the maximum power that can be handled by the bus; if the power exceeds Pcrit, then voltage collapse will occur. The Pcrit value itself was obtained from voltage stability simulation using a continuation power flow; if the bus load exceeds 90% of the Pcrit value, then the bus is unstable. The selected stations for the voltage stability simulation were those connected to the biggest load. Based on the simulation results, a voltage stability violation occurred in the 275 kV backbone both in the base-demand and high-demand scenarios. Meanwhile, in the 500 kV backbone, the voltage stability was still safe in both scenarios.
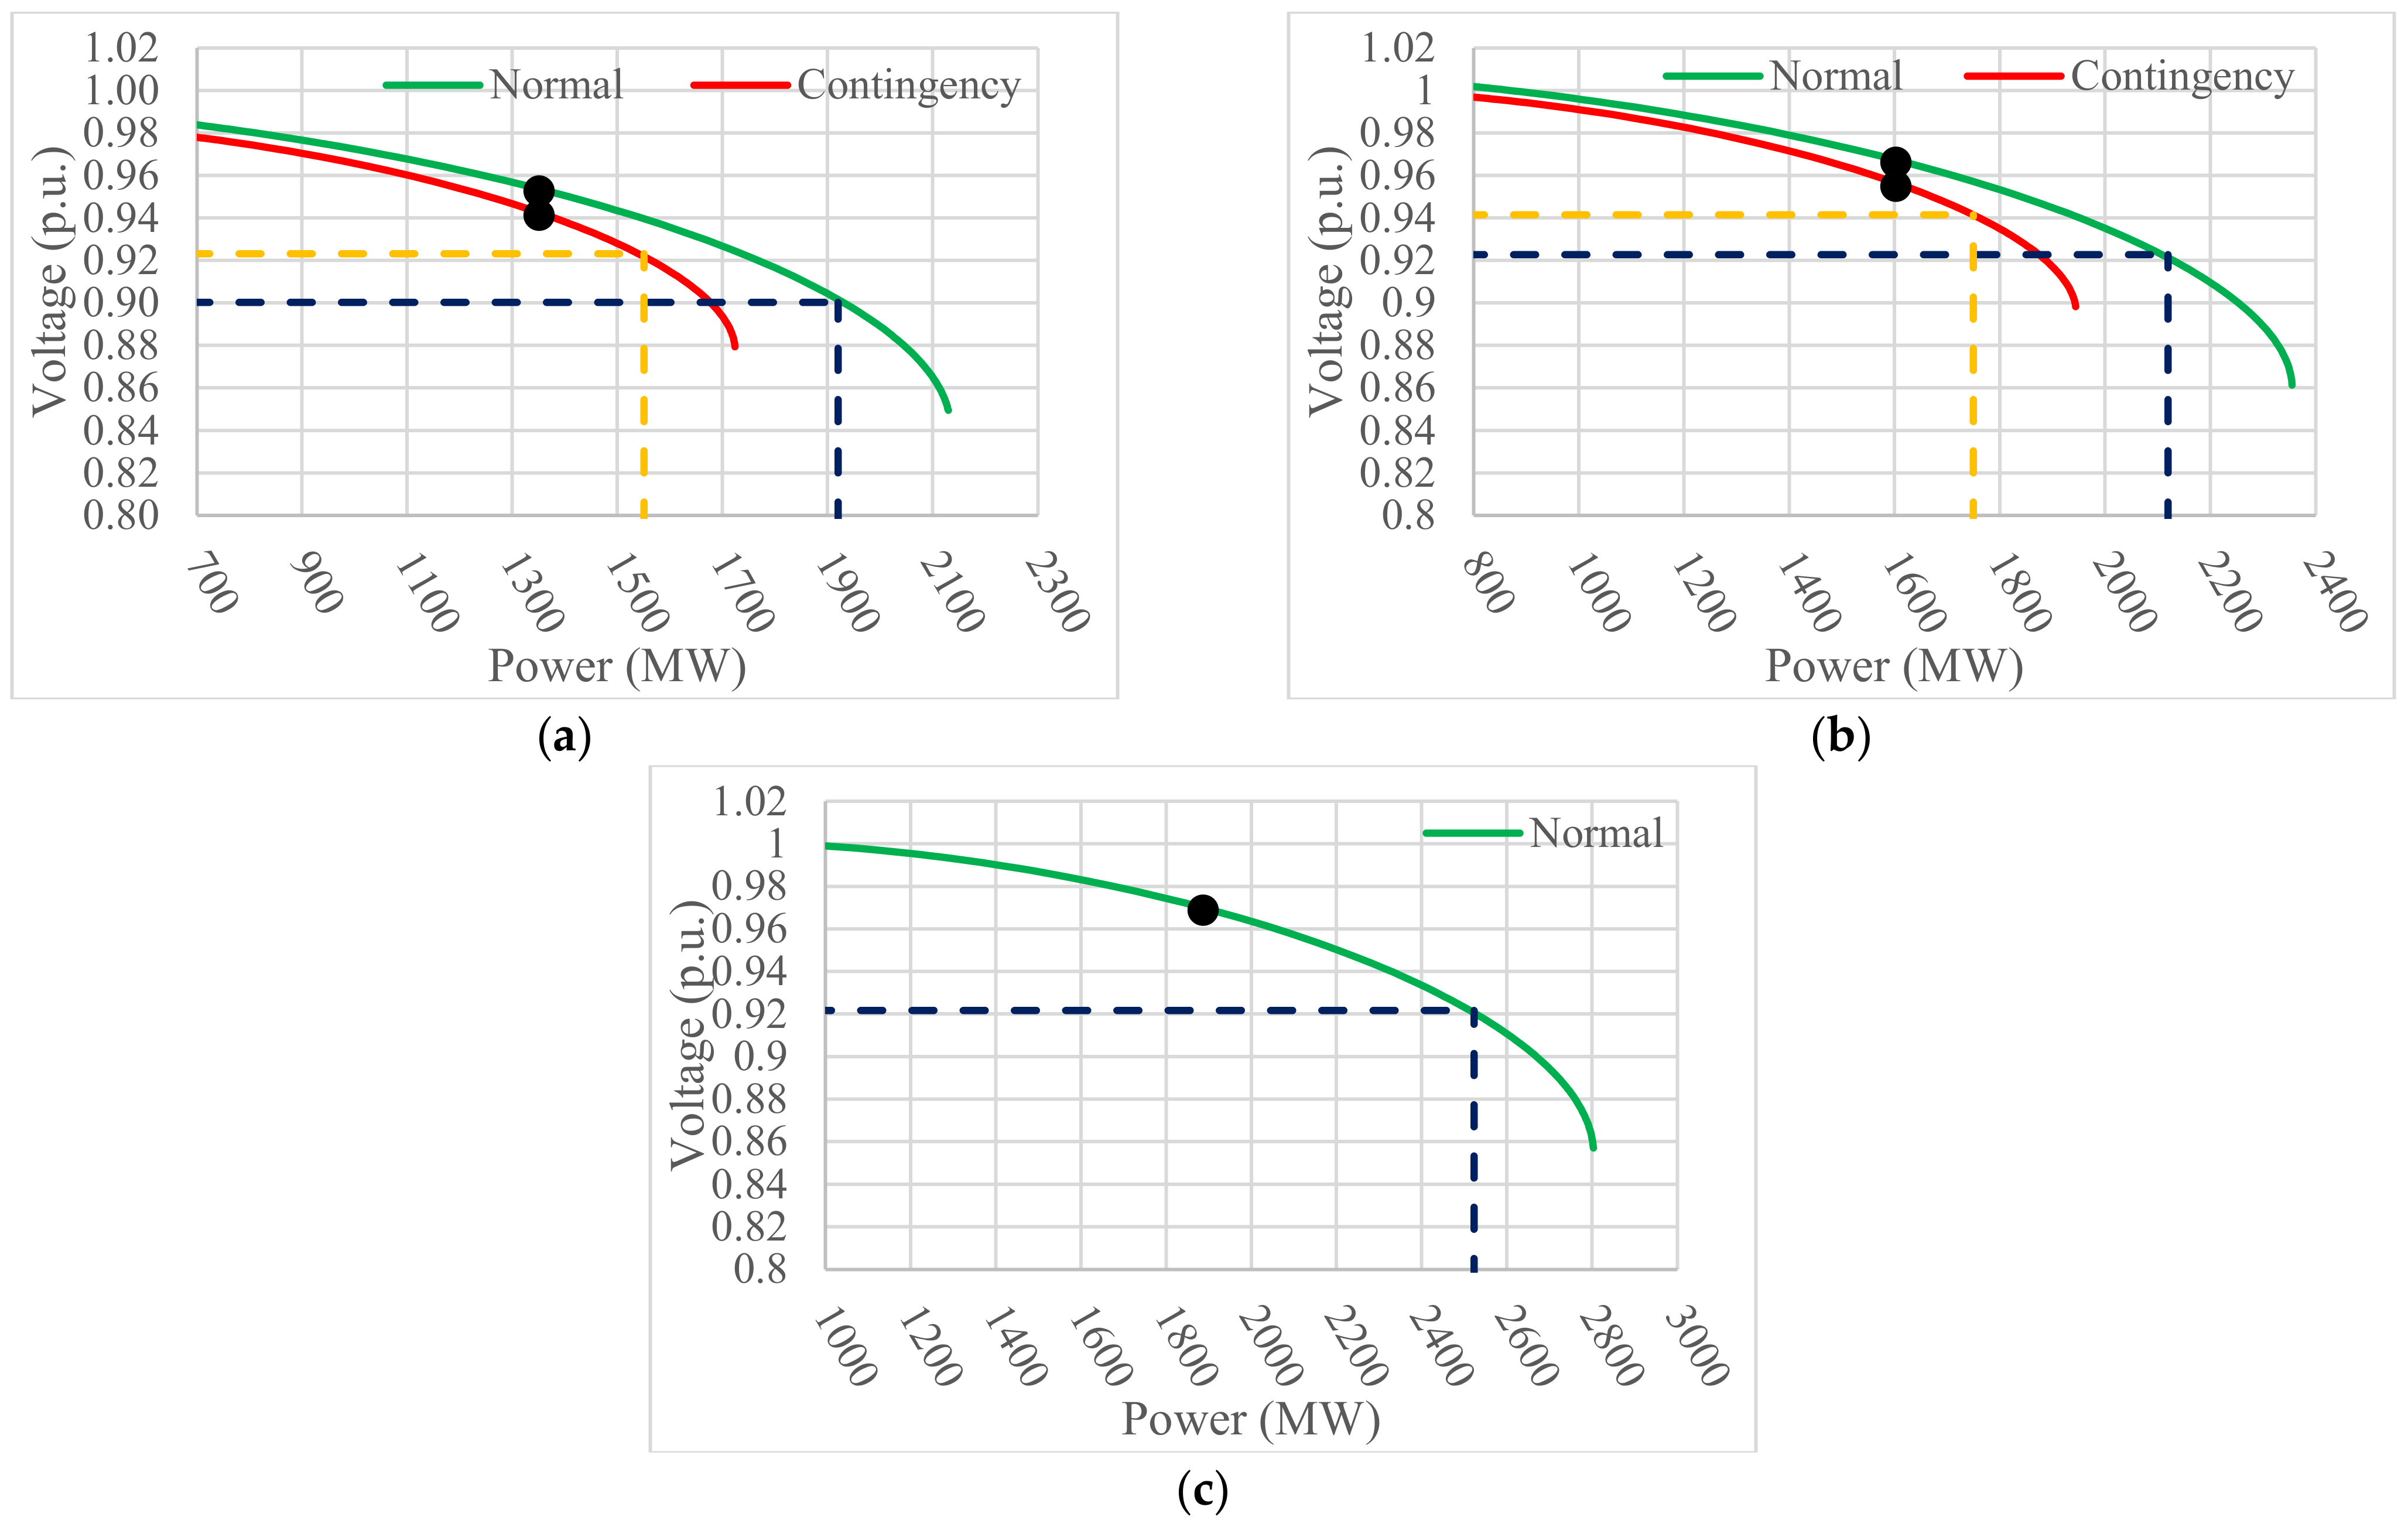
In the 275 kV backbone in the base-demand scenario, the voltage stability was violated in the Daya Baru Station; details of the changes in the PV curve from 2031, 2034 and 2037 are shown in Figure 11. In 2031, the load connected to the Daya Baru Station was 1352 MW, and the Pcrit result obtained by the simulation was 2133 MW. This shows that the voltage stability is still safe as the load is smaller than 90% Pcrit. Furthermore, when a contingency occurred in the line of Daya Baru–Sidrap 2, the Pcrit decreased to 1723 MW; this was still in accordance with the standard where the load was less than 90% Pcrit. The decrease in Pcrit in this contingency is due to the bus becoming more vulnerable, meaning that a slight increase in power will cause a bigger voltage drop than normal.
In 2034 and 2037, the load increased to 1603 and 1887 MW, respectively, while the Pcrit became 2355 and 2803 MW. The increase in Pcrit was not caused by the increase in the load, but due to the addition of generators enabling the system to become more robust. The increase in Pcrit was smaller than the load growth, such that the margin between the load and Pcrit was smaller, although it still met the standard. However, when there was a contingency in the line of Daya Baru–Sidrap 2, Pcrit decreased to 1944 MW in 2034, while in 2037 the voltage stability standard was violated, such that the curve could not be plotted (Figure 11c).
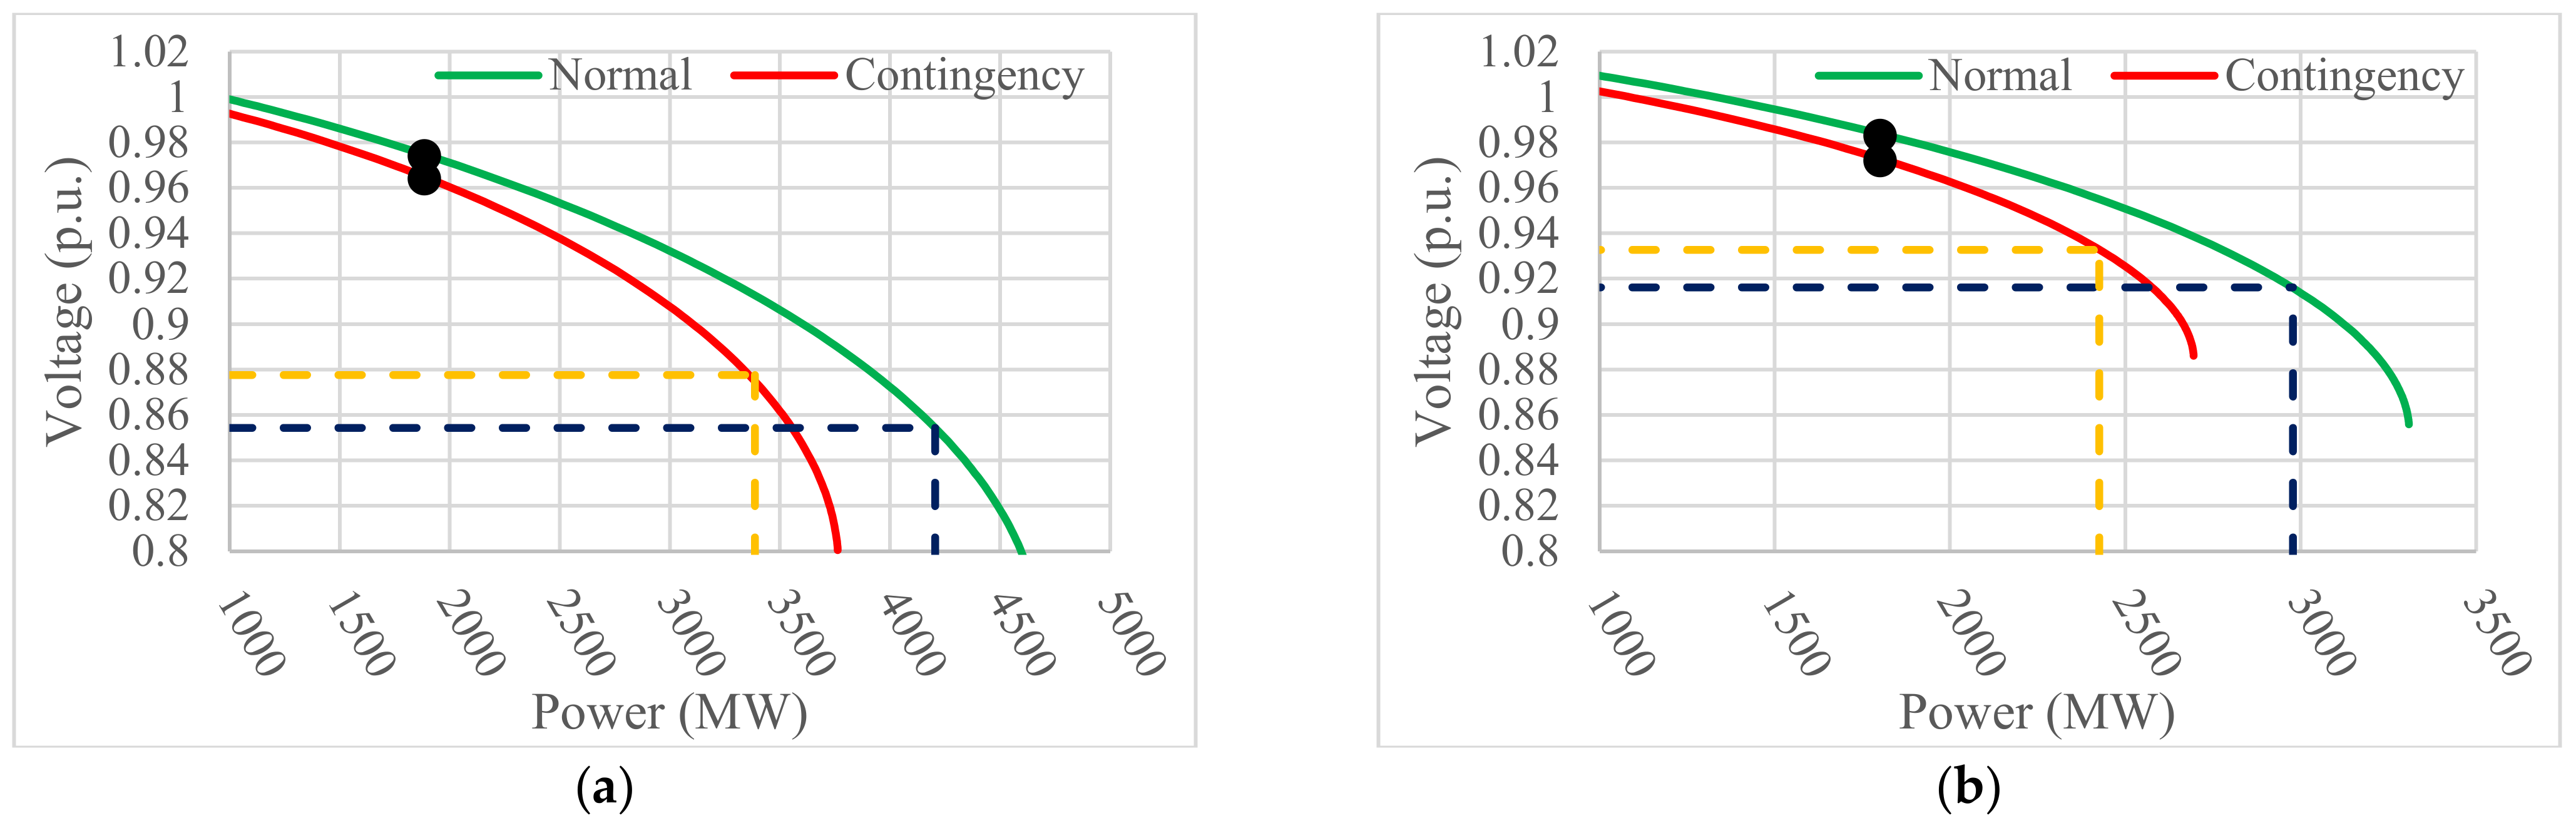
At 275 kV in the high-demand scenario, the largest load was also located in the Daya Baru Station, with the PV curve as shown in Figure 12. In 2031, the load in the Daya Baru Station was 1488 MW greater than that in the base-demand scenario; the Pcrit value was also greater, that is, 2942 MW, and 2400 MW when the contingency was in the line of Daya Baru–Sidrap 2. The Pcrit value was higher because the high-demand scenario has more generators than the base-demand scenario. Then, in 2034, there was an increase in the load to 1801 MW and a Pcrit of 3288 MW; meanwhile, when the contingency occurred, the voltage stability was violated.
For the 500 kV backbone for both scenarios, all of the voltage stabilities remained at safe limits; this is due to the fact that at higher voltage levels, the system is more stable. When the load is the same, but the voltage is higher, the current will be smaller, so the voltage drop is smaller. The smaller the voltage drop, the greater the Pcrit value. For comparison, Figure 13 shows the PV curve at the same time that 275 kV was violated. In the base-demand scenario in 2037, the load at 500 kV was equal to 275 kV, which is 1887 MW, but the Pcrit value was greater at 4671 and 3762 MW for the normal and contingency scenarios, respectively. Likewise, for the high-demand scenario in 2034, the load was the same, which was 1801 MW, but the Pcrit values were greater, which were 3309 and 2695 MW for the normal and contingency scenarios, respectively.

6. Conclusions

Considering the power transfer from the renewable energy source to the load center, the transmission line adequacy, which consists of some criteria, should be considered. In Sulawesi Island, the locations of renewable energy resources are far from the load center. For example, the load center is located in Makassar city or exactly at Daya Baru Station, while the hydro energy resources are located around Bakaru Station in Pinrang District, which is 240 km away, and the wind energy resources are located in Sidrap, which is 175 km away. The selection of the backbone voltage levels was based on the technical criteria that must be fulfilled, including the economic voltage, voltage angle, N-1 contingency, short circuiting, transient stability, voltage stability and small signal stability. Each of these criteria has certain standards, and the evaluation of each criterion was carried out within two scenarios, namely base demand and high demand, in order to consider the load forecast error in the future with two voltage options, 275 and 500 kV. The evaluation results allowed 500 kV to be chosen as the transmission backbone voltage level, as it can meet all of the required standards during the planning period. However, 275 kV does not meet the requirement due to the violation of three criteria, namely the economic voltage, N-1 contingency and voltage stability. For example, in the high-demand scenario, the economic voltages of 275 kV in 2029 and 2034 became 302.3 and 289.84 kV, respectively, which violates the safe requirement to be under the backbone voltage. Thus, in order to achieve the energy mix target, a transmission line upgrade to 500 kV is required. The studies that were carried out can form the basis of the formulation of policies contained in the electricity supply business plan, such that RE utilization can be increased and mixed energy targets can be achieved. Furthermore, the same analysis could also be applied in systems where the location of the renewable energy power plant is far from the load center, such as the China and Finland systems.

Author Contributions

Conceptualization, T., L.M.P., R.I. and S.; methodology, L.M.P., R.I. and S.; software, L.M.P. and R.I.; validation, T., L.M.P., R.I., S., A.P., S.I. and I.S.; formal analysis, T., L.M.P. and S.; investigation, T., L.M.P. and S.; resources, L.M.P., S., A.P., S.I. and I.S.; data curation, T., L.M.P., S.I. and I.S.; writing—original draft preparation, T., L.M.P., R.I. and S.; writing—review and editing, L.M.P. and R.I.; visualization, L.M.P. and R.I.; supervision, T.; project administration, T. and L.M.P. All authors have read and agreed to the published version of the manuscript.

Funding

This research received no external funding.

Institutional Review Board Statement

Not applicable.

Informed Consent Statement

Not applicable.

Data Availability Statement

Not applicable.

Acknowledgments

This work was performed with PT PLN (Persero) System Planning Division in 2018 under grant number 0707.PJ/DAN.02.06/DIV SIS/2017. All of the technical data was provided by our partner from PLN.

Conflicts of Interest

The authors declare no conflict of interest.

References

  1. The World Bank. Total Population. 2019. Available online: https://data.worldbank.org/indicator/SP.POP.TOTL?locations=ID (accessed on 19 November 2020).
  2. The World Bank. Population Growth (Annual%). 2019. Available online: https://data.worldbank.org/indicator/SP.POP.GROW?locations=ID (accessed on 19 November 2020).
  3. Kementerian Kesehatan Republik Indonesia (Ministry of Health Republic of Indonesia). Profil Kesehatan Indonesia 2018 (Indonesia Health Statistic 2018); Kementerian Kesehatan Republik Indonesia (Ministry of Health Republic of Indonesia): Jakarta, Indonesia, 2019; ISBN 6221527716.
  4. The World Bank. Getting Electricity—A Pilot Study by the Doing Business Project. Available online: https://www.doingbusiness.org/content/dam/doingBusiness/media/Special-Reports/Getting-Electricity-Pilot-Indicator-Project.pdf (accessed on 25 December 2020).
  5. PT PLN (Persero) Statistik PLN 2018 (PLN Statistics 2018). Sekr. Perusah. PT PLN 2019, 53, 1689–1699. [CrossRef]
  6. International Monetary Fund. World Economic Outlook; International Monetary Fund, Publication Services: Washington, DC, USA, 2019; ISBN 1557757402. [Google Scholar]
  7. The World Bank. Electric Power Consumption (kWh per Capita)—Indonesia. 2019. Available online: https://data.worldbank.org/indicator/EG.USE.ELEC.KH.PC?locations=ID (accessed on 25 December 2020).
  8. Kementrian Perindustrian Republik Indonesia (Ministry of Industry Republic of Indonesia). Rencana Induk Pembangunan Industri Nasional (National Industry Development Master Plan); Kementrian Perindustrian Republik Indonesia (Ministry of Industry Republic of Indonesia): Jakarta, Indonesia, 2015.
  9. Kementrian Perindustrian Republik Indonesia (Ministry of Industry Republic of Indonesia). Facts and Figures 2017; Kementrian Perindustrian Republik Indonesia (Ministry of Industry Republic of Indonesia): Jakarta, Indonesia, 2017.
  10. Kementerian Energi dan Sumber Daya Mineral Republik Indonesia (Ministry of Energy and Mineral Resources Republic of Indonesia). Rencana Usaha Penyediaan Tenaga Listrik PT. PLN (Persero) 2019–2028 (Electricity Supply Business Plan); Kementerian Energi dan Sumber Daya Mineral Republik Indonesia (Ministry of Energy and Mineral Resources Republic of Indonesia): Jakarta, Indonesia, 2019.
  11. Amado, N.B.; Del, E.; Pelegia, B. Capacity Value from Wind and Solar Sources in Systems with Variable Dispatchable Capacity—An Application in the Brazilian Hydrothermal System. Energies 2021, 14, 3196. [Google Scholar] [CrossRef]
  12. Dunkelberg, H.; Sondermann, M.; Meschede, H.; Hesselbach, J. Assessment of flexibilisation potential by changing energy sources using Monte Carlo simulation. Energies 2019, 12, 711. [Google Scholar] [CrossRef] [Green Version]
  13. Dehdarian, A.; Tucci, C.L. A complex network approach for analyzing early evolution of smart grid innovations in Europe. Appl. Energy 2021, 298, 117143. [Google Scholar] [CrossRef]
  14. Witt, T.; Klumpp, M. Multi-Period Multi-Criteria Decision Making under Uncertainty: A Renewable Energy Transition Case from Germany. Sustainability 2021, 13, 6300. [Google Scholar] [CrossRef]
  15. Ali, E.S.; El-Sehiemy, R.A.; Abou El-Ela, A.A.; Mahmoud, K.; Lehtonen, M.; Darwish, M.M.F. An effective Bi-stage method for renewable energy sources integration into unbalanced distribution systems considering uncertainty. Processes 2021, 9, 471. [Google Scholar] [CrossRef]
  16. UNFCCC. Indonesia: First Nationally Determined Contribution; United Nations Climate Change: Bonn, Germany, 2016; p. 18. [Google Scholar]
  17. Kementerian Energi dan Sumber Daya Mineral Republik Indonesia (Ministry of Energy and Mineral Resources Republic of Indonesia). Rencana Usaha Penyediaan Tenaga Listrik PT. PLN (Persero) 2018–2027 (Electricity Supply Business Plan); Kementerian Energi dan Sumber Daya Mineral Republik Indonesia (Ministry of Energy and Mineral Resources Republic of Indonesia): Jakarta, Indonesia, 2018.
  18. Pusat Kajian LKFT Universitas Gadjah Mada (LKFT Study Center Universitas Gadjah Mada). Penyusunan Kajian Masterplan Kelistrikan Sulawesi (The Sulawesi Electricity Master Plan Study); Pusat Kajian LKFT Universitas Gadjah Mada (LKFT Study Center Universitas Gadjah Mada): Yogyakarta, Indonesia, 2018. [Google Scholar]
  19. Zhang, X.; Conejo, A.J. Candidate line selection for transmission expansion planning considering long- and short-term uncertainty. Int. J. Electr. Power Energy Syst. 2018, 100, 320–330. [Google Scholar] [CrossRef]
  20. Guerra, O.J.; Tejada, D.A.; Reklaitis, G.V. An optimization framework for the integrated planning of generation and transmission expansion in interconnected power systems. Appl. Energy 2016, 170, 1–21. [Google Scholar] [CrossRef]
  21. Gomes, P.V.; Saraiva, J.T. State-of-the-art of transmission expansion planning: A survey from restructuring to renewable and distributed electricity markets. Int. J. Electr. Power Energy Syst. 2019, 111, 411–424. [Google Scholar] [CrossRef]
  22. Liang, Z.; Chen, H.; Chen, S.; Lin, Z.; Kang, C. Probability-driven transmission expansion planning with high-penetration renewable power generation: A case study in northwestern China. Appl. Energy 2019, 255, 113610. [Google Scholar] [CrossRef]
  23. Wu, Z.; Liu, Y.; Gu, W.; Wang, Y.; Chen, C. Contingency-constrained robust transmission expansion planning under uncertainty. Int. J. Electr. Power Energy Syst. 2018, 101, 331–338. [Google Scholar] [CrossRef]
  24. Yi, B.W.; Xu, J.H.; Fan, Y. Inter-regional power grid planning up to 2030 in China considering renewable energy development and regional pollutant control: A multi-region bottom-up optimization model. Appl. Energy 2016, 184, 641–658. [Google Scholar] [CrossRef]
  25. Lumbreras, S.; Ramos, A.; Banez-Chicharro, F. Optimal transmission network expansion planning in real-sized power systems with high renewable penetration. Electr. Power Syst. Res. 2017, 149, 76–88. [Google Scholar] [CrossRef]
  26. Roldán, C.; García-Bertrand, R.; Mínguez, R. Robust transmission expansion planning with uncertain generations and loads using full probabilistic information. Electr. Power Syst. Res. 2020, 189, 106793. [Google Scholar] [CrossRef]
  27. Taherkhani, M.; Hosseini, S.H.; Javadi, M.S.; Catalão, J.P.S. Scenario-based probabilistic multi-stage optimization for transmission expansion planning incorporating wind generation integration. Electr. Power Syst. Res. 2020, 189, 106601. [Google Scholar] [CrossRef]
  28. Das, S.; Verma, A.; Bijwe, P.R. Security constrained AC transmission network expansion planning. Electr. Power Syst. Res. 2019, 172, 277–289. [Google Scholar] [CrossRef] [Green Version]
  29. Abbasi, S.; Abdi, H.; Bruno, S.; La Scala, M. Transmission network expansion planning considering load correlation using unscented transformation. Int. J. Electr. Power Energy Syst. 2018, 103, 12–20. [Google Scholar] [CrossRef]
  30. Mehta, V.K. Text Book of Principal of Power System; S. Chand & Co. Ltd.: New Delhi, India, 2005; pp. 461–462. [Google Scholar]
  31. Greingnger, D.W.; Jhon, J. Power System Analysis; McGraw-Hill, Inc.: New York, NY, USA, 1994. [Google Scholar]
  32. Saadat, H. Power System Analysis, 2nd ed.; McGraw-Hill, Inc.: New York, NY, USA, 1999. [Google Scholar]
  33. Kundur, P. Power System Stability and Control; McGraw-Hill, Inc.: New York, NY, USA, 1994; Volume III, ISBN 9781439883211. [Google Scholar]
  34. Nise, N.S. Control System Engineering, 7th ed.; John Wiley and Sons Inc.: Hoboken, NJ, USA, 2014; ISBN 978-1118170519. [Google Scholar]
  35. PowerFactory DIgSILENT. Technical Reference Documentation-Synchronous Machine; DIgSILENT GmbH: Gomaringen, Germany, 2015; Volume 1, pp. 1–40. [Google Scholar] [CrossRef]
  36. Japan International Cooperation Agency Nippon Koei, Co. Project for the Master Plan Study of Hydropower Development in Indonesia; The Republic of Indonesia Ministry of Energy and Mineral Resources: Jakarta, Indonesia, 2011; Volume II.
Figure 1. Map of the population distribution in indonesia [3].
Sustainability 13 10477 g001
Figure 2. Expected electric energy sales [10].
Sustainability 13 10477 g002
Figure 3. Existing transmission line in the Sulawesi system.
Sustainability 13 10477 g003
Figure 4. Map of the load center and potential hydro resources in Sulawesi.
Sustainability 13 10477 g004
Figure 5. Methodology of the transmission voltage determination.
Sustainability 13 10477 g005
Figure 6. Economic voltage of the transmission line.
Sustainability 13 10477 g006
Figure 7. PV curve/nose curve for the voltage stability evaluation.
Sustainability 13 10477 g007
Figure 8. Illustration of a small signal stability area.
Sustainability 13 10477 g008
Figure 9. Demand forecast for the Sulawesi system [18].
Sustainability 13 10477 g009
Figure 10. Route of the transmission line backbone for the Sulawesi system.
Sustainability 13 10477 g010
Figure 11. PV curve at Daya Baru Station for the 275 kV backbone in the base-demand scenario: (a) 2031, (b) 2034, and (c) 2037.
Sustainability 13 10477 g011
Figure 12. PV curve at Daya Baru Station for the 275 kV backbone in the high-demand scenario: (a) 2031, (b) 2034.
Sustainability 13 10477 g012
Figure 13. PV curve at Daya Baru Station for the 500 kV backbone: (a) 2037, base demand; (b) 2034, high demand.
Sustainability 13 10477 g013
Table 1. Primary energy resource potential.
Energy ResourcesAmount of Potential
Coal2049 MW
Natural Gas795 MW
Geothermal1148 MWe
Wind4105 MW
Hydro5174 MW
Solar27,821 GW
Biomass2086 MW
Table 2. Allowable value of the voltage profile and line loading.
CriteriaAllowable Value
Normal ConditionN-1 Condition
Power Flow Loading80%100%
Voltage Magnitude±5%
Voltage Angle≤30°
Table 3. Allowable short circuit current for each voltage level.
Voltage ClassAllowable Short Circuit Current
70 kV20 kA or less
150 kV30 kA or less
275 kV, 500 kV40 kA or less
Table 4. Minimum critical clearing time requirement for each voltage level.
Voltage LevelMinimum CCT (ms)
150 kV120
275 kV100
500 kV90
Table 5. Total capacity of each generating unit type in MW [18].
YearBase Demand (MW)High Demand (MW)
SteamGeothermalGasCombine CycleHydroWindSteamGeothermalGasCombine CycleHydroWind
2025231613111951501926.1130381611113951501926.1130
2030351613213951501968.1190501613225954501968.1190
203538169923251502928.119068169931256002928.1190
204050168026801503923.119088168032806003923.1190
204566314033503004953.119011,6314037506004953.1190
205010,0004032001505534.119015,0004052009005534.1190
Table 6. Transmission line candidates for the Sulawesi system.
LineLength (km)Year
Daya Baru—Sidrap1752021
Punagaya—Daya Baru702021
Sidrap—Enrekang402022
Enrekang—Plta Bakaru 2252022
PLTA Bakaru 2—PLTA Poko202022
PLTA Poko—PLTA Salu Uro1202022
PLTA Salu Uro—Mamuju Baru552022
PLTA Salu Uro—PLTA Seko752023
PLTA Seko—Wotu752023
Mamuju Baru—Palu Baru255.52023
Wotu—Andowia2602023
Andowia—Kendari67.52023
Palu Baru—Bangkir1952026
Bangkir—Isimu4292029
Isimu—Kawangkoan381.6932029
Table 7. Criteria evaluation for the 275 and 500 kV backbones.
Criteria275 kV500 kV
BaseHighBaseHigh
LoadingSafeSafeSafeSafe
Voltage MagnitudeSafeSafeSafeSafe
Voltage AngleSafeSafeSafeSafe
Economic VoltageSafeNot Safe (violated at 2029)SafeSafe
N-1 ContingencySafeNot Safe (violated at 2034)SafeSafe
Short CircuitSafeSafeSafeSafe
Transient StabilitySafeSafeSafeSafe
Voltage StabilityNot Safe (violated at 2037)Not Safe (violated at 2034)SafeSafe
Small Signal StabilitySafeSafeSafeSafe
Table 8. Economic voltage of Wotu–Tentena 2a in the 275 kV backbone in the high-demand scenario.
YearPower Transferred (MW)Economic Voltage (kV)
202482.03136.09
2026317.93257.08
2029443.37302.30
2031219.14214.87
2034406.77289.84
Table 9. N-1 contingency criteria in 2034 in a high-demand scenario.
No.Backbone VoltageVoltage Magnitude (p.u.)Loading (%)
1275 kVTentena0.939Wotu–Tentena 2_a49.36
Palu Baru0.957Daya Baru–Punagaya 275 kV19.52
Daya Baru0.954Wotu–PLTA Salu Uro 275 kV17.38
2500 kVAll bus voltages still fulfill the standardAll line loading still fulfill the standard
Publisher’s Note: MDPI stays neutral with regard to jurisdictional claims in published maps and institutional affiliations.

