Article

The Impacts of Environmental and Socio-Economic Risks on the Fisheries in the Mediterranean Region

1
Section of Environmental Economics, Centre Scientifique de Monaco, 8 Quai Antoine 1er, 98000 Monaco, Monaco
2
Department of Economics, University of Isfahan, Azadi Square, Isfahan 81746-73441, Iran
3
Institute for the Oceans and Fisheries, The University of British Columbia, Vancouver, BC V6T 1Z4, Canada
4
Department of Economics, Loyola University Chicago, 820 N. Michigan Avenue, Chicago, IL 60611, USA
5
SKILL PARTNERS, 06000 Nice, France
6
Sophia Antipolis Campus, Université Côte d’Azur, CEDEX 2, 06103 Nice, France
*
Author to whom correspondence should be addressed.
Sustainability 2021, 13(19), 10670; https://0-doi-org.brum.beds.ac.uk/10.3390/su131910670
Submission received: 15 July 2021 / Revised: 8 September 2021 / Accepted: 17 September 2021 / Published: 26 September 2021

Abstract

:
The objective of this study is to investigate the impacts of the environmental and socio-economic risks on the fisheries in the Mediterranean region from an economic point of view. A balanced panel of 21 Mediterranean countries for 2001–2018 has been estimated by the GLS method, considering heteroskedasticity and correlation among cross sections. The volume of fish landed and landed values have been considered in two models. The results show that increases in sea bottom and surface temperature, H+ ion concentration and salinity threaten the fisheries in the Mediterranean region for the volume of fish landed and that sea surface temperature and salinity negatively influence landed values. In addition, there is an inverse U-shaped relationship between human population and fisheries. Moreover, the Human Development Index (HDI), an indicator of countries’ adaptive capacity, has a positive impact on fisheries and indicates that countries can safeguard fisheries by improving their adaptive capacity. Finally, our results strongly show the risk of climate change for the fisheries in the Mediterranean region and that fisheries are adversely impacted by climate change as well as worsening socio-economic conditions in the absence of adaptation plans.

1. Introduction

Studying the fisheries in the Mediterranean and the risks they are currently facing is important for different reasons. Situated at the crossroads of Africa, Europe and Asia, the Mediterranean coasts have witnessed the development of exceptional cultural diversity and richness. Numerous civilizations have flourished there, thanks mainly to the important trade and cultural exchange in this region. The basin contributes remarkably to the world economy and trade. Twenty-two countries share the Mediterranean coastline and, together, have a population of about 465.5 million people whose level of economic development varies across its three continents [1]. A high population density is sheltered on its coasts with an additional 200 million tourists each year representing 33% of the total world tourists, making it the world’s leading tourist destination [2]. The Mediterranean basin is also a region undergoing constant change. Human activities are concentrated near the coast and at sea, such as fishing, urbanization and tourism. In addition, the Mediterranean Sea is an important area of industrial development and is one of the most frequented maritime corridors in the world [3]. The Mediterranean Sea is considered one of the hotspots of global biodiversity where the impact of climate change associated with other anthropogenic pressures could be the most destructive [4,5,6,7]. Although it represents only 0.8% of the world’s ocean surface, it is home to between 4% and 18% of the world’s marine species [4].
Climate change is expected to be the most important threat to biodiversity in the Mediterranean over the next 10 years, followed by habitat degradation, exploitation, pollution, eutrophication and invasion of species and loss of biodiversity [4]. Fisheries, which are of social, economic and cultural importance in the Mediterranean, represent a considerable source of food and income and contribute to the traditions and way of life for communities along the Mediterranean. The Mediterranean basin is currently facing several challenges related to climate change such as sea surface water warming, acidification, changes in salinity and circulation, overfishing, eutrophication, deoxygenation and destruction of habitats that are most frequently observed for fisheries [4,8,9,10,11,12]. These challenges are associated with other threats such as increasing droughts, sea level rise and pollution. Most of these threat factors, whether from climate change or from socio-economic factors, are related and interdependent and their simultaneous presence is threatening marine species and ecosystems and in turn threatens the ecosystem services that the Mediterranean Sea provides to society and the human economy.
The objective of the paper is to study the impact of environmental and socio-economic factors on the fisheries in Mediterranean countries. A part of the existing literature on the subject has examined anthropogenic impacts as well as the impact of environmental changes on fisheries by measuring the vulnerability index [13,14,15,16,17]. Besides, some studies have investigated these impacts on the structure of landed fish through the application of ecological indicators [18,19,20,21,22,23,24], and only a few studies, such as [21], have estimated these effects as a causal relationship. Among them, some have been focused on the Mediterranean Sea. For example, Tzanatos et al. [25] have considered temperature as a climatic variable and investigated the correlation between temperature and fisheries landing fluctuations in the region. The results showed a negative relationship for about 70% of species. In addition, Fortibuoni et al. [23] have analyzed the disaggregated landings over the period of 1945–2014 using the landings data enriched by ecological indicators and showed declining trends in most of the years, especially for most vulnerable species (i.e., elasmobranchs and large-sized species). As a contribution to the existing literature, this study considers a wide range of environmental and socio-economic variables and estimates their impacts on both fish landings and landed value through econometric techniques. The results reveal the influences of the factors on fisheries that are deemed of high importance. Since the model has been estimated for both fish landings and the landed value, the results can be used in determining policy priorities in order to protect fisheries and the economic value of the sector. Given the diversity of development levels of countries around the Mediterranean, negative changes in fish production, especially in the less developed regions, will have many consequences. The implications of reduced fish catch in these regions will further increase poverty, food scarcity, unemployment and migration in the Mediterranean region and policy actions may be needed immediately to stop and reverse a bleak future.
The paper is structured as follows: first, we describe the specificities of the fisheries in the Mediterranean countries, which we regroup into three geographical subregions. Then, we consider the risks for the fisheries in the Mediterranean Sea. The methodology is explained in Section 4. Section 5 and Section 6 report the empirical results and discussion, respectively. Finally, the concluding remarks and policy implication of the study are provided in the last section.

2. The Context of Fisheries in the Mediterranean

Twenty-two countries border the Mediterranean Sea, which itself represents only approximately 0.8% of the ocean surface. Countries bordering the Mediterranean Sea can be placed in three groups formed according to Hilmi et al. [26], representing three distinct socio-economic parts of the Mediterranean: Northern, Southern and Eastern Mediterranean countries. The groups are formed as follows:
  • Northern Mediterranean countries (from west to east): Spain, France, Monaco, Italy, Slovenia, Croatia, Bosnia and Herzegovina, Montenegro, Albania, Greece and the island nation of Malta;
  • Southern Mediterranean countries (from west to east): Morocco, Algeria, Tunisia, Libya, Egypt;
  • Eastern Mediterranean countries (from north to south): Turkey, Syria, Lebanon, Israel, Palestinian territories and Cyprus.
Analysis of the trend in yields for total fisheries and aquaculture catches has shown that total Mediterranean fisheries and aquaculture production has increased over the last few decades. However, if we separate the production of wild catches from that of aquaculture, another trend can be observed (see Appendix A Figure A1). Catches of wild stocks have declined since the 1990s, while aquaculture production has increased substantially.
If we compare yields from fisheries catches with those from aquaculture at the regional level, other trends can be observed by region (see Appendix A Figure A2). For Northern Mediterranean countries, catch yields have decreased since the 1960s while aquaculture yields have increased since the 1970s and have stabilized since the 2000s. For Southern countries, the comparison shows that both wild catch production and aquaculture production have increased since 1970. For Eastern Mediterranean countries, fishing catches have decreased in quantity since the 2000s and aquaculture production has steadily increased up to the level of catch production.

2.1. Capture

In 2017, the total fisheries production of the Mediterranean fleets was estimated at 784,000 tonnes of edible marine products. Landings in the Mediterranean continued to increase until 1994, reaching 1,062,000 tonnes, then declined irregularly to 758,340 in 2015, with production apparently stabilizing since then (see Appendix A Figure A3).
The comparative evolution of the Mediterranean catch production between regions is represented in Figure A4 in the Appendix A. Catches in the Northern Mediterranean countries have been decreasing overall since the 1970s, while those in the other regions have been increasing in quantity, particularly in the countries of the Southern Mediterranean, which are now aligned in production with those of the north. An analysis by region in Figure A5 in the Appendix A shows that in the Mediterranean, the Northern Mediterranean countries as a whole have the highest catch fishing production, contributing to 53% of the total landings (411,700 tonnes on average in 2015–2017), while the Southern Mediterranean countries have production representing 39.3% of landings with 311,500 on average for 2015–2017). It is the Eastern Mediterranean countries that contribute the least to the catches with 11% for 85,300 tonnes.
Concerning the main species and groups contributing to the production of fishery catches, three groups of species, namely “herring, sardine, anchovy” (360,900 tonnes), “miscellaneous coastal fish” (122,900 tonnes) and “miscellaneous pelagic fish” (64,300 tonnes), account for about 71% of total declared landings in the Mediterranean. There are five other groups of species contributing to landings and accounting for about 22% of total landings. The remaining species account for about 5%. If we combine “herring, sardines, anchovies” and “miscellaneous pelagic fish” to get an estimate of small pelagic species, we notice that their landing represents more than half of the production.
The classification of species in the Mediterranean shows that sardine (Sardina pilchardus) and European anchovy (Engraulis encrasicolus) are the main species landed (122,400 tonnes and 182,900 tons on average, respectively). In addition to these two dominant species, there is a great diversity of species contributing significantly to catches (more than 1%). Sardines contribute 26% of the Mediterranean catches, followed by European anchovy with 17% and sardinella with 6%. The rest of the contribution amounts to 51% and corresponds to a large number of species.
When we analyze the species contributions by region, we can see that in the group of Northern Mediterranean countries, the main species caught is also sardine (22%), followed by European anchovy (20%) (see Appendix A Figure A6). When we sum up the remaining species that correspond to less than 5% of the catch, this gives us a total of 58% of the landings. In the Southern Mediterranean countries, the main species caught is also sardine (19%), followed by sardinella (13%), the marine fish nei (9%) and jack and horse mackerel (6%), with all other species accounting for 53%. In the Eastern Mediterranean countries, the main species caught is European anchovy (48%), followed by Stripped venus (11%), European sprat (10%) and sardine (7%), with all other species accounting for the remaining 24%. If we compare the diversity of species in the catches, we can see that it is higher in the Northern and Southern Mediterranean countries, while in comparison, it is lower in the Eastern Mediterranean countries, which concentrate almost half of the fish caught on anchovy.

2.2. Aquaculture

In 2017, aquaculture production in the Mediterranean countries together reached 2,571,774 tonnes, with an increase of 55% over the last 10 years. The same year, aquaculture accounted for 40% of the total production of fishery products compared to 30% 10 years earlier. Aquaculture in the Mediterranean countries has increased steadily over the last 20 years, and it can be seen that production has increased particularly in brackish environments (doubled over the last 10 years; see Appendix A Figure A7). The production of fish in seawater and freshwater has also increased since 2007, while the production of mollusks in marine and brackish environments has decreased.
An analysis by region shows that in the Mediterranean, the Southern Mediterranean countries as a whole have the aquaculture production contributing to 57% of the total landings (1,476,474 tonnes in 2017), while the Northern Mediterranean countries have production representing 31% of landings with 793,687 in 2017. It is the Eastern Mediterranean countries that contribute the least to the production, with 12% for 301,612 tonnes in 2017 (see Appendix A Figure A8).
The value of fish landings represents the first sale value of fish caught in FAO Major Fishing Area 37, which is considered the total landed catch multiplied by the estimated price outside the vessel [27]. It represents the price of the products before they are processed and before the added value is obtained. The majority of countries contributing to aquaculture production in terms of value in 2017 were Egypt with 26% (USD 1376 million) followed by Turkey with 20% (USD 1068 million) and the Northern Mediterranean countries, France with 13% (USD 701 million), Greece with 12% (USD 614 million), Spain with 11% (USD 583 million) and Italy with 9% (USD 461 million). By region, the Northern Mediterranean countries together accounted for 49% of the value of aquaculture, thus dominating the value of aquaculture. They are followed by the Southern Mediterranean countries and the Eastern Mediterranean countries, which account for 28% and 23% of the value of aquaculture in 2017, respectively.
The classification of the species fished by the Mediterranean countries including all coasts and inland aquaculture gives us the most produced species (see Appendix A Figure A9). We note that the Nile tilapia species in brackish water (33%) dominates the global production in aquaculture, followed by marine mussels (10%), the Rainbow trout produced in freshwater (7%), the mullet in brackish water (7%) and then the European Seabass (7%) and the Gilthead seabream in a marine environment (6%).

3. The Risks in the Mediterranean

In this section, we consider the risks that threaten the Mediterranean fisheries. These risks can be environmental or due to the socio-economic characteristics of the fisheries section in each country or area.

3.1. The Main Environmental Risks

The main environmental risks are warming, ocean acidification (OA), hypoxia, deoxygenation, pollution and habitat loss. If we consider the response to climate change and acidification of economically relevant Mediterranean species, there are still gaps in information. There is a growing knowledge on the consequences of climate change (CC) and OA on species but there are not enough studies that address the responses of commercial species to climate change and acidification in the Mediterranean Sea [9,13,28,29]. Revenues from fisheries will also be affected by the distribution of species and the spatial structure of populations that are impacted by warming seawater. The phenomenon of meridionalization, where native thermophilic species of southern warmer waters are now moving north, will have both positive and negative impacts on Mediterranean fisheries. The rise in the abundance of thermophilic species could increase the richness in the northern and central regions of the Mediterranean. However, this expansion could threaten the ecosystems by modifying them and there could be a risk of a decrease to extinction for several species of commercial interest [30]. The northward retreat of cold-water species caused by warming water occurs particularly in the areas of the Gulf of Lyons, the northern Adriatic and the Aegean Sea. Commercially valuable fish exploited in the eastern part of Mediterranean such as the sprat (Sprattus sprattus) are at risk of extinction and this is aggravated by other impacts such as overfishing or habitat destruction [31]. The phenomenon of tropicalization may have dramatic consequences, particularly in the Eastern Mediterranean with a decline in several marine populations [32,33]. Other negative impacts would include loss of biodiversity, changes in marine communities, reduction in genetic diversity and affected food webs [6,33,34]. In addition to these changes, global warming is expected to cause a decrease and reduction in fish size [35]. Studies have shown that fish size follows a temperature rule [36]. In a general way, the significant drop in primary production expected in the Mediterranean will affect the sectors most sensitive to changes in rainfall and river runoff and to changes in primary production [37]. Small-scale pelagic fisheries and local communities dependent on rivers (e.g., the Ebro, Nile, Po, Tiber and Danube) are expected to be most affected by the projected changes [
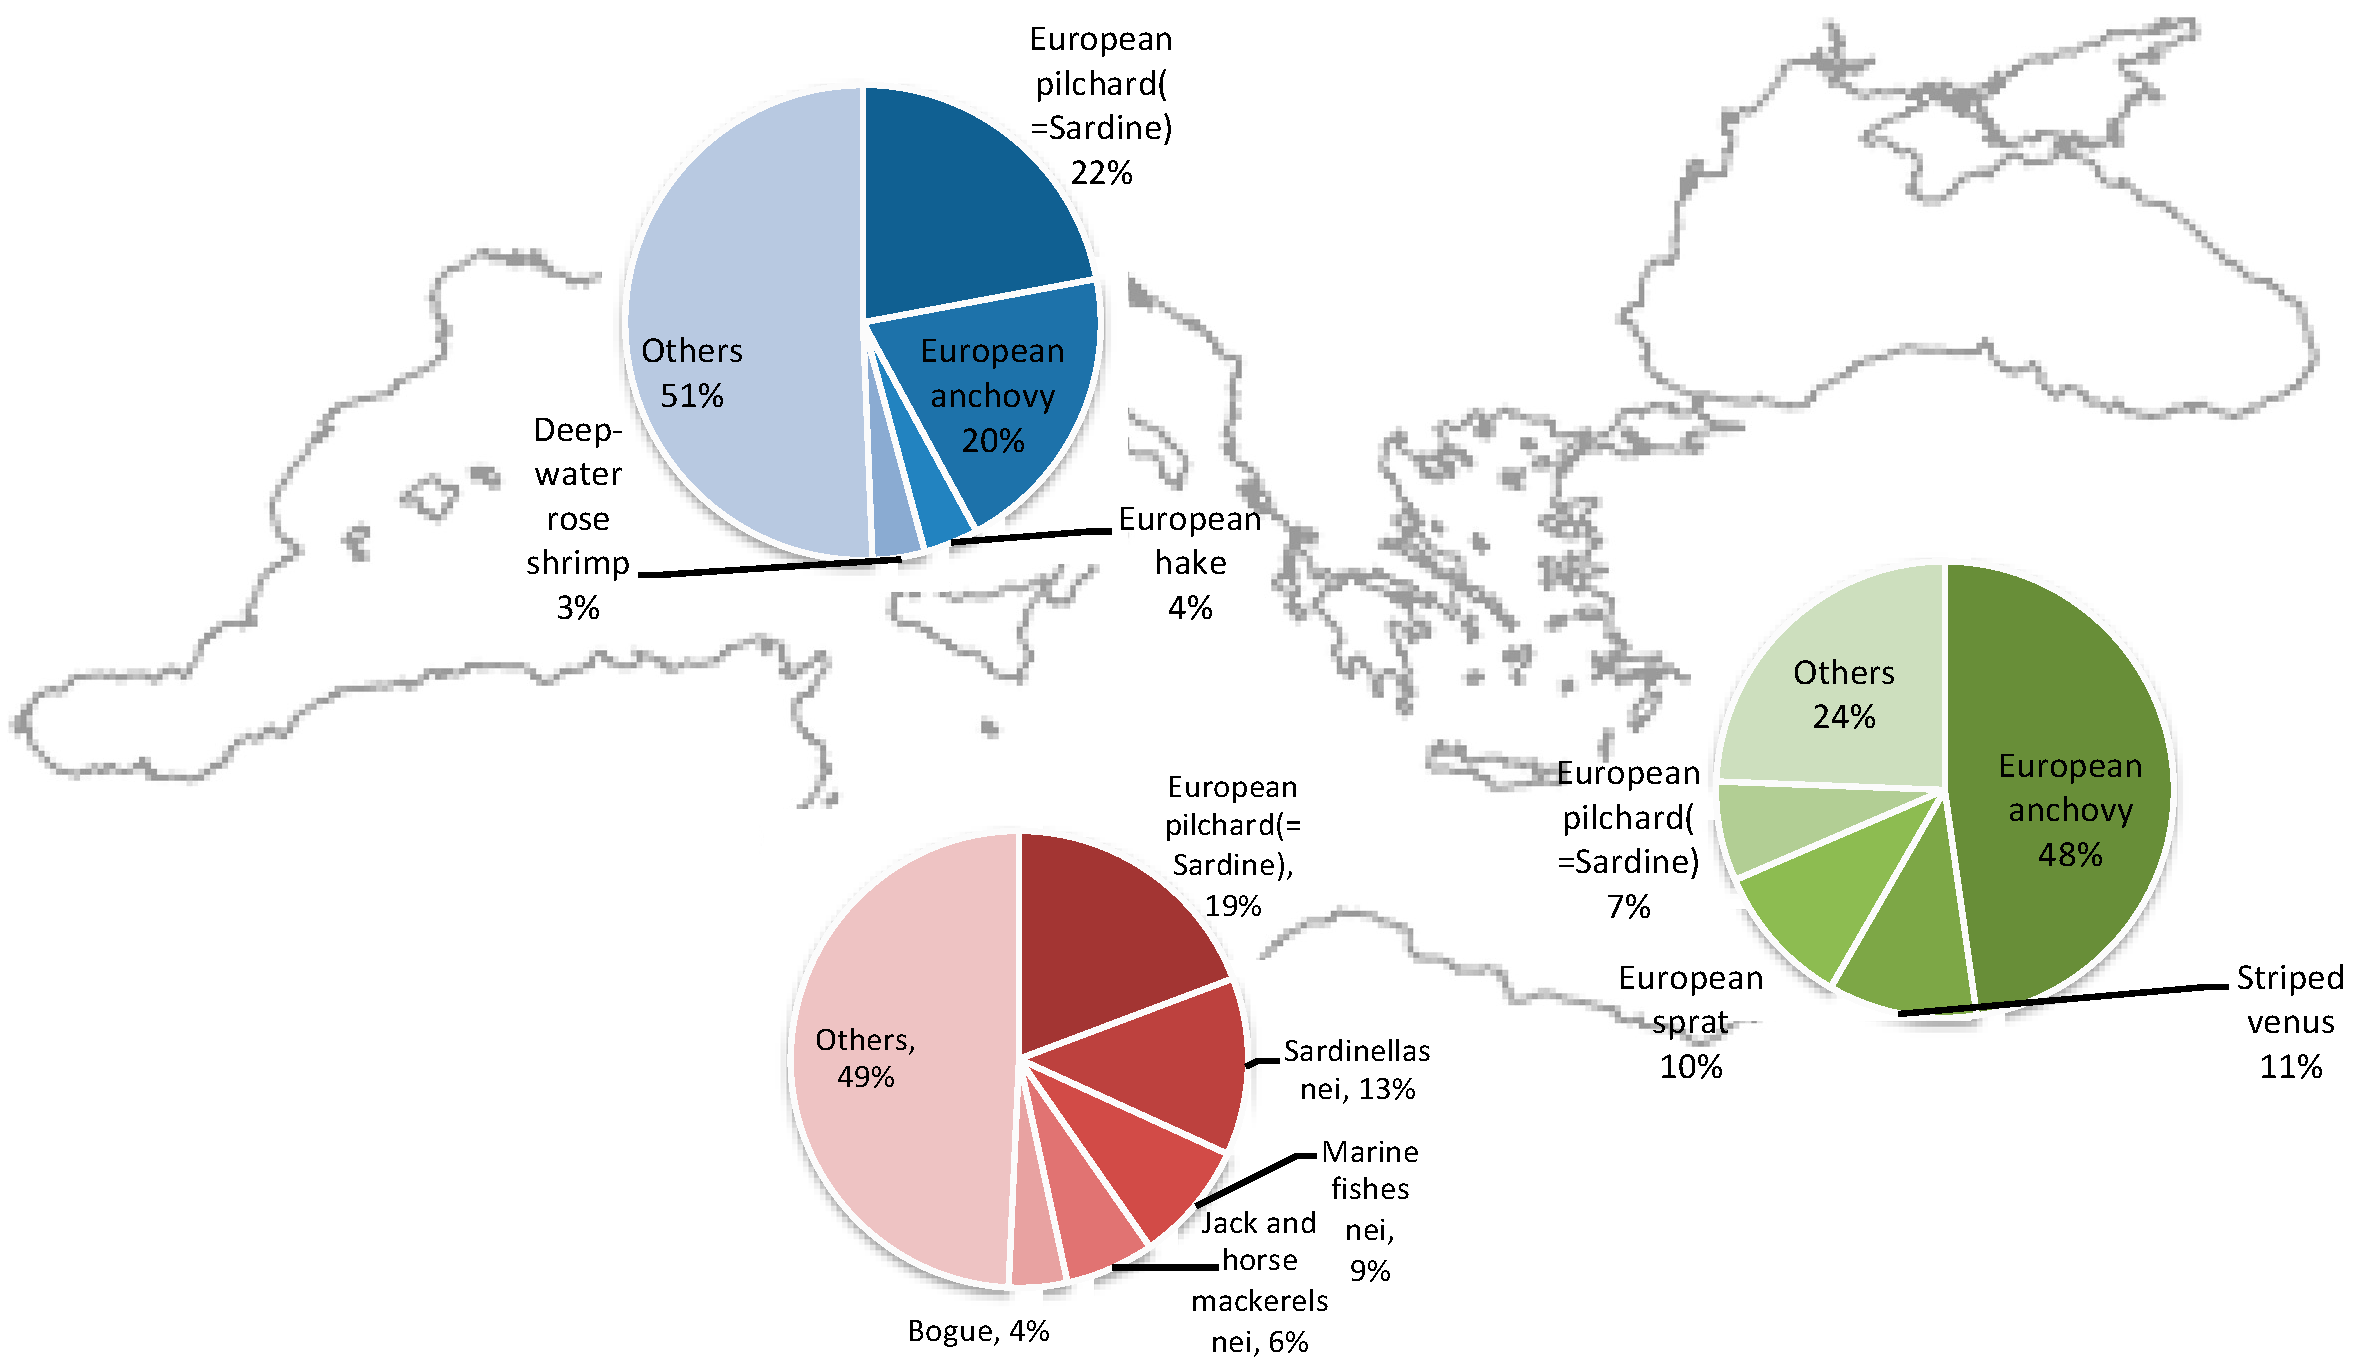
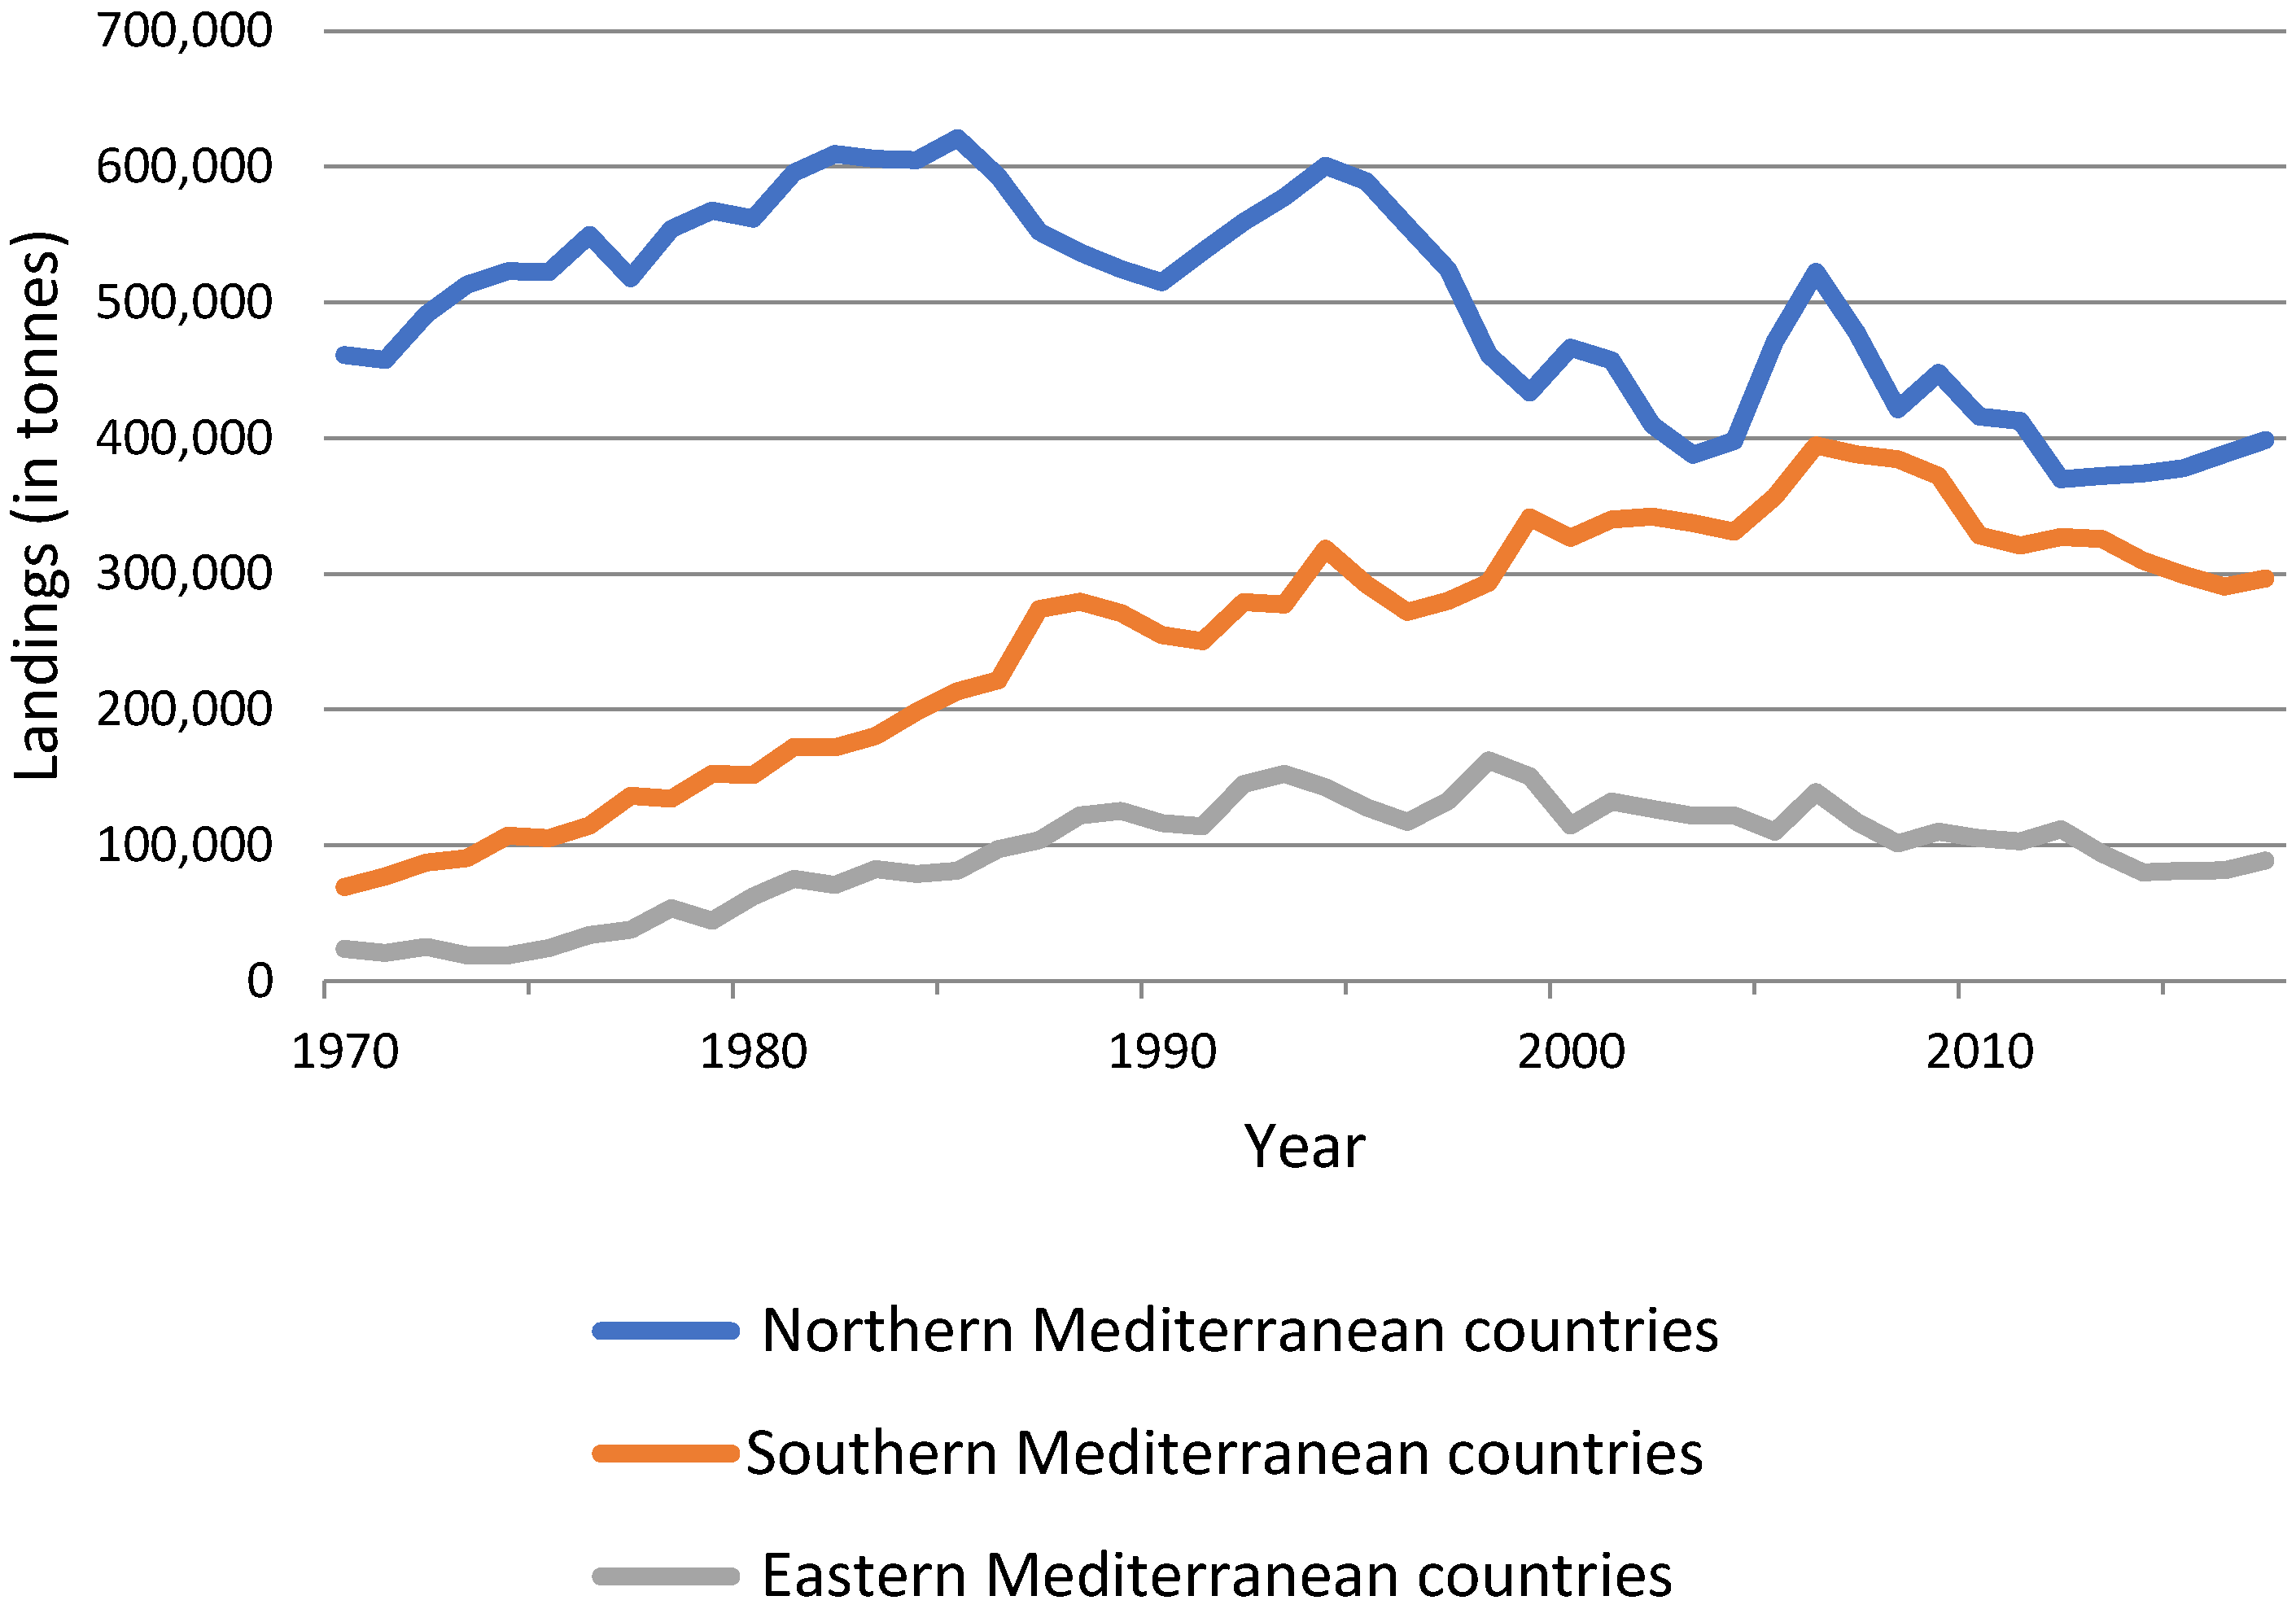
30]. These changes will impact the economies of countries differently depending on their vulnerability and their composition of exploited species. Turkey and Italy being the two largest producers of fisheries in the Mediterranean, it has been observed that they do not exploit the same mix of species. Northern Mediterranean countries such as Italy have a more diversified fishery based on herring, sardines and anchovies and also target mussels, clams, cockles and ark shells, while Eastern countries such as Turkey mainly target the first group.
Countries with less diversified fisheries can then be expected to be more impacted by climate change. Climate change, which impacts pelagic and demersal fish species, increases the risk of certain types of fisheries. Fleets targeting mainly pelagic species such as seiners and longlines are less resilient and will be impacted positively or negatively [30]. Fishing gears that depend on pelagic species (such as purse seiners) such as anchovies and sardines could see their production decrease due to the impact of reduced rainfall and a drop in primary production. This could impact coastal countries such as Turkey, which mainly bases its catch production on anchovies [38]. On the other hand, demersal fishing gears and artisanal fishing fleets could be more resistant to the impacts of climate change on fish distribution [39]. Given the processes of meridionalization and tropicalization and change in primary production that induce changes in species distribution and spatial population structure, impacts on fisheries will depend on adaptation measures, monitoring mechanisms and collaborative research at the regional level designed to address impacts on stocks distributed across national boundaries [30]. Ultimately, the exploitation of the benefits and opportunities of new species will depend on consumers and the adaptation of local markets. Another factor to be taken into account in adapting fleets to climate change is their available technology. In Southern countries such as Turkey, artisanal fishermen have less technology available to increase fishing effort to counter production losses. As shown in the results, artisanal fishers in most cases own their boats and have invested their own capital in them. They, therefore, do not have a great capacity to adapt to go fishing elsewhere or to fish for other species [40]. The artisanal fleets of the Southern Mediterranean would therefore be among the fleets most exposed to climate change.
Regarding acidification, research has shown that it has negative impacts on many species and habitats that benefit fisheries and aquaculture [9,10,26,40,41,42,43]. Acidification particularly threatens species that use carbonate to form a skeleton or shell [41]. Acidification has an impact on commercial species such as mollusks and crustaceans, which are widely present in the Mediterranean with important production sites in France, Italy and Greece [10]. Among the taxa affected by acidification, mollusks and bivalves fare least well [28]. Assuming that the effects of ocean acidification are particularly threatening for mussels and oysters, using seafood harvest data by country, and for the Mediterranean Sea, the vulnerability of some countries can be preliminarily assessed (Appendix A Figure A6). It can be assumed that Italy, Greece, France and Spain will have a strong impact since they produce a lot of mussels. For oyster production, France would once again be the most threatened. The effects of acidification are detrimental to these cultures, causing mass mortality and therefore loss of income as well as adaptation costs to revive production [29]. We can also assume that aquaculture crops would be less exposed than artisanal or recreational fishers who collect from the wild [40]. Like industrial fleets, aquaculture operations have more technological means to counteract the loss of production.
Major economic effects could result from stratification, leading to deoxygenation, epidemics, harmful algal blooms and eutrophication that are present all over the Mediterranean basin and also threaten fisheries and aquaculture operations [44,45,46,47,48]. It is expected that the most affected countries will be those with semi-enclosed areas as well as areas at the outlet of river estuaries, which are most at risk of eutrophication. Eutrophication impacts public health with episodes of shellfish poisoning, and changes in precipitation (causing floods) negatively impact aquaculture facilities and cause harmful algal blooms that cause disease in humans [49]. To address the threats of climate change, acidification and eutrophication, fish farms could adopt integrated multi-trophic aquaculture that integrates fish species from different trophic levels to mimic wild ecosystem interactions and to limit waste [50,51]. There should also be a monitoring of the impacts of other sectors on aquaculture such as agriculture, forestry and tourism, which impact water quality in farms [52]. Finally, we can consider the Allocated Aquaculture Zones (AADs), areas where the impacts of aquaculture on the environment and other users are minimized, as a solution for the development and sustainable management of aquaculture itself [52,53].

3.2. The Main Socio-Economic Risks

In this section, we study the socio-economic factors that have consequences on the fisheries sector in the different Mediterranean countries.
Demography can have an impact on the fisheries sector. The total population of the Mediterranean countries rose from 276 million inhabitants in 1970 to 412 million in 2000 and then to 514 million in 2018 [1]. It is estimated that the population should reach 529 million by 2025 [54]. More than half of the population lives on the southern shore of the Mediterranean. The population is concentrated on the coasts with a higher density in the Western Mediterranean, on the western shore of the Adriatic Sea, on the eastern shore of the Aegean-Levantine region and in the Nile Delta [54].
The history of the Mediterranean has led to a complex socio-political scenario with a diversification of economic and social development, which is reflected in the levels of development. From an economic point of view, we can distinguish the Northern Mediterranean countries from the others with their demographic structure (aging in the North and youth in the South) [55,56]. This socio-economic gap between the European and Afro-Asian shores, on the other hand, is reflected in indicators such as gross domestic product (GDP) and the Human Development Index (Table A1). The GDP per capita of the poorest country is 30 times lower than that of the richest (excluding Monaco) for the Mediterranean countries (see Appendix A Table A1). There are significant inequalities between the different Mediterranean countries. In general, the Northern countries benefit from a better economic, welfare and governance situation [57]. In 2010, Mediterranean countries reached 11.1% of the world’s GDP. In the same year, France, Spain and Italy accounted for 64% of this GDP [10]. Moreover, the total population of the Middle East and North Africa as a whole has increased from 105 million in 1960 to 448 million in 2010 [12]. As their populations grow, they are vulnerable due to uneven distribution of resources, a difficult political context and migration.
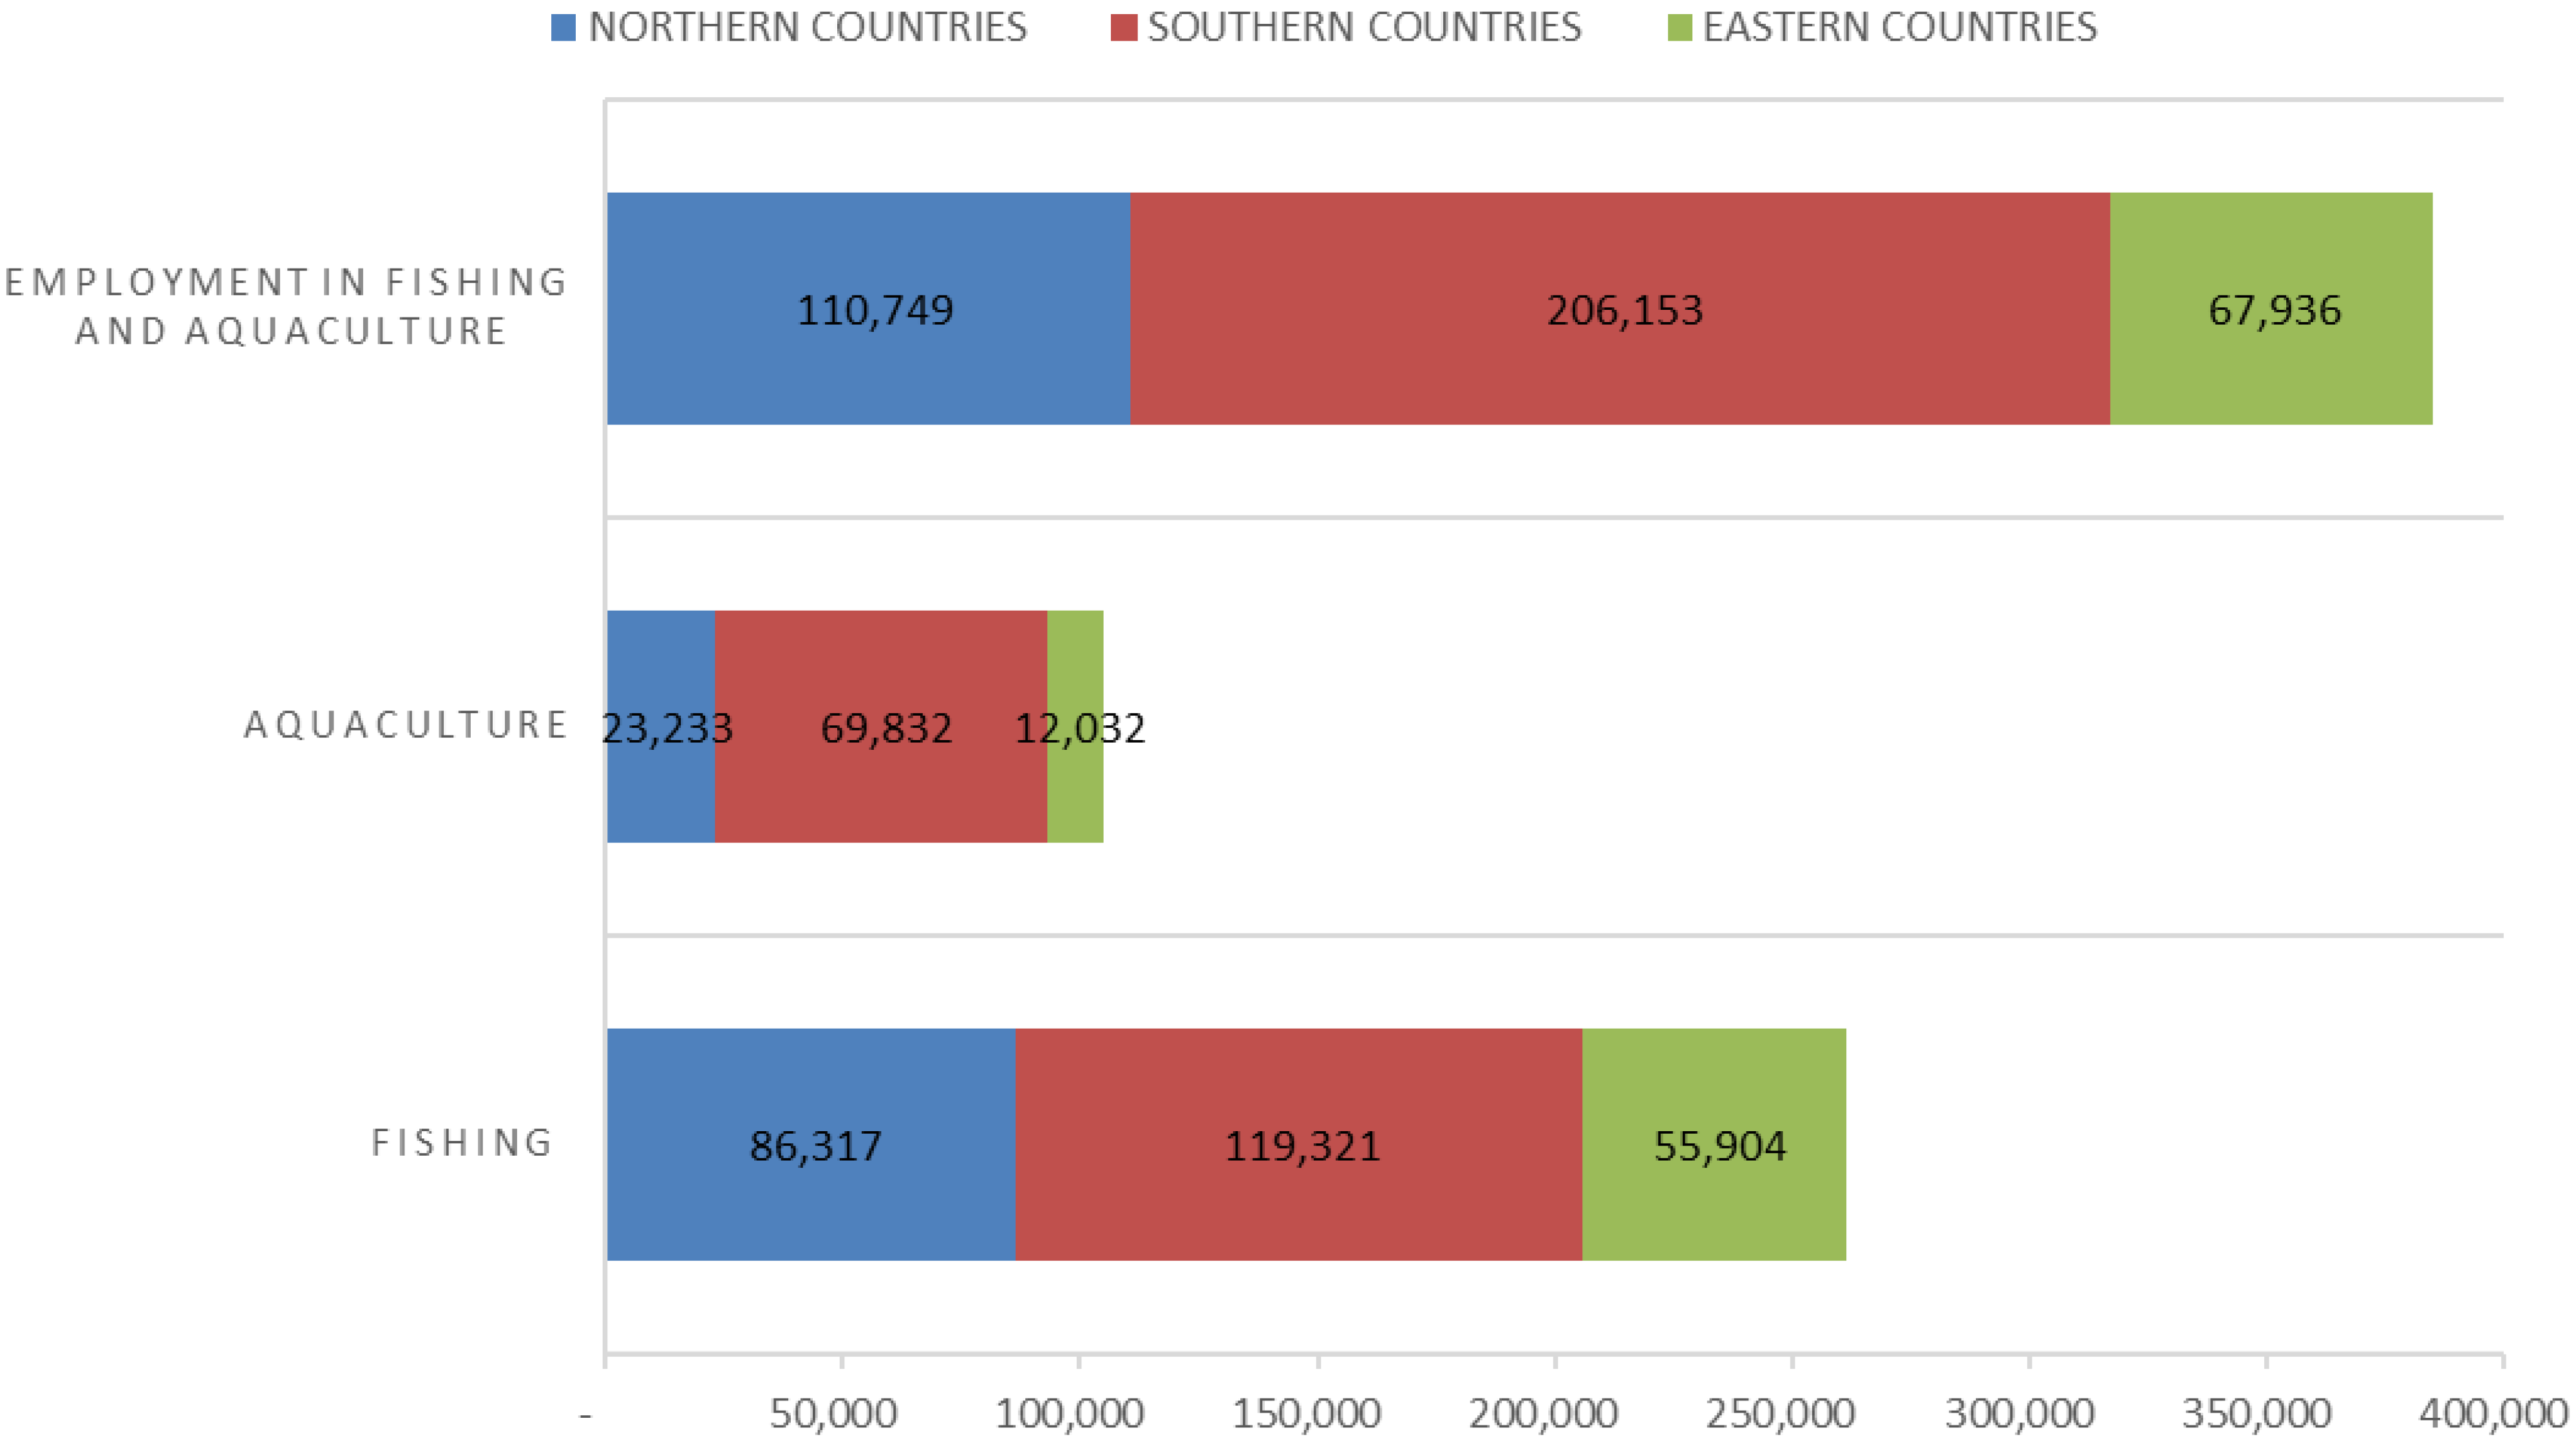
The number of persons employed, directly or indirectly, in the fisheries sector also creates a kind of vulnerability if this sector shrinks due to environmental risks. Direct employment in fishing for the Mediterranean countries was less than 261,000 workers and less than 105,000 thousand workers in aquaculture for a total of 367 thousand jobs generated by this sector (see Appendix A Table A2). Fishing catches provided 71% of employment against 29% for aquaculture. The main countries contributing to employment in the fisheries and aquaculture sectors were Egypt with 22%, Libya with 13%, Tunisia with 12%, Turkey with 11%, Spain with 9% and Greece with 8%. Egypt dominated employment with 86,000 workers for employment in fisheries and aquaculture. Egypt also dominated the aquaculture sector, providing 33% of jobs.
Concerning jobs in the Mediterranean basin, Sacchi [12] reported for the year 2008 a total of 250,000 jobs in the primary sector associated with fishing catches and 123,000 jobs for aquaculture. The number of indirect jobs was 214,000. His results also suggested that Egypt was the country where fishing and aquaculture provide the largest number of jobs and more particularly that the countries of the South dominate the number of jobs in the fishing and aquaculture sector in the Mediterranean.
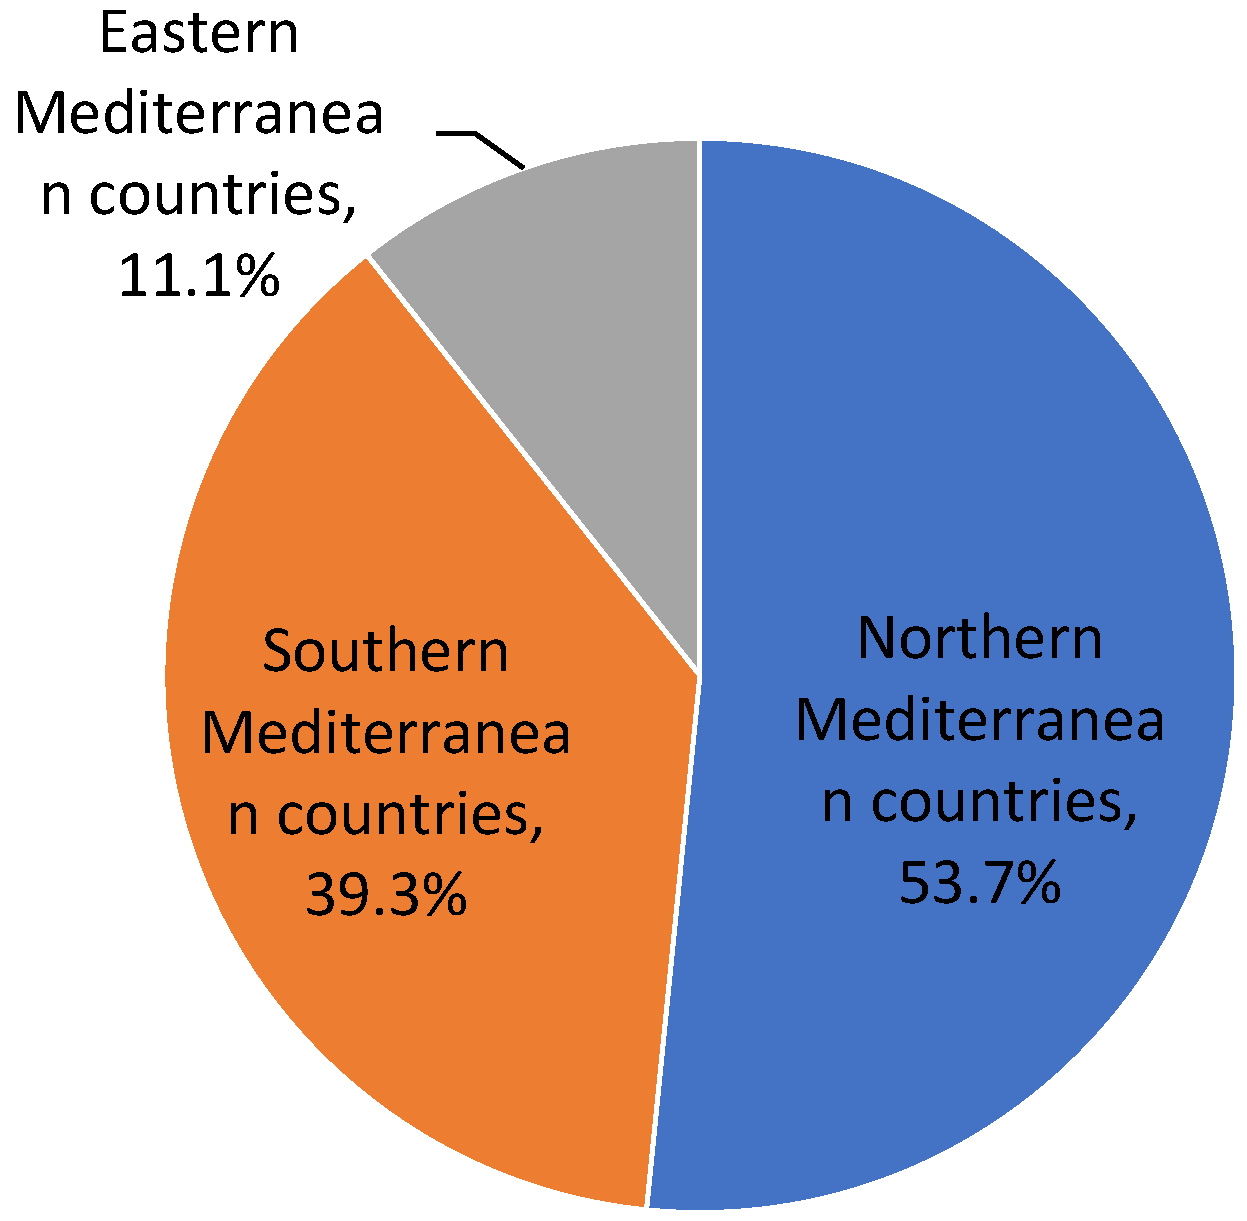
An analysis by region shows that for the Mediterranean countries, the Southern Mediterranean countries as a whole had the highest number of employment in fishing and aquaculture, contributing to 56% of the employment in fishing (119,321 jobs) and to 66% of the employment in aquaculture (69,832 jobs), accounting for 53% of the total employment (206,153 jobs) (See Appendix A Figure A10). The Northern Mediterranean countries contributed to 33% of the employment for the fishing sector (86,317 jobs) and 22% to the aquaculture sector (23,233 jobs), accounting for 29% of the total employment (110,749 jobs). The Eastern Mediterranean countries contributed the least to the employment with 21% of the employment in fishing (559,904 jobs) and 12% for the employment in aquaculture (12,032 jobs), accounting for 18% of the total employment (67,936 jobs).
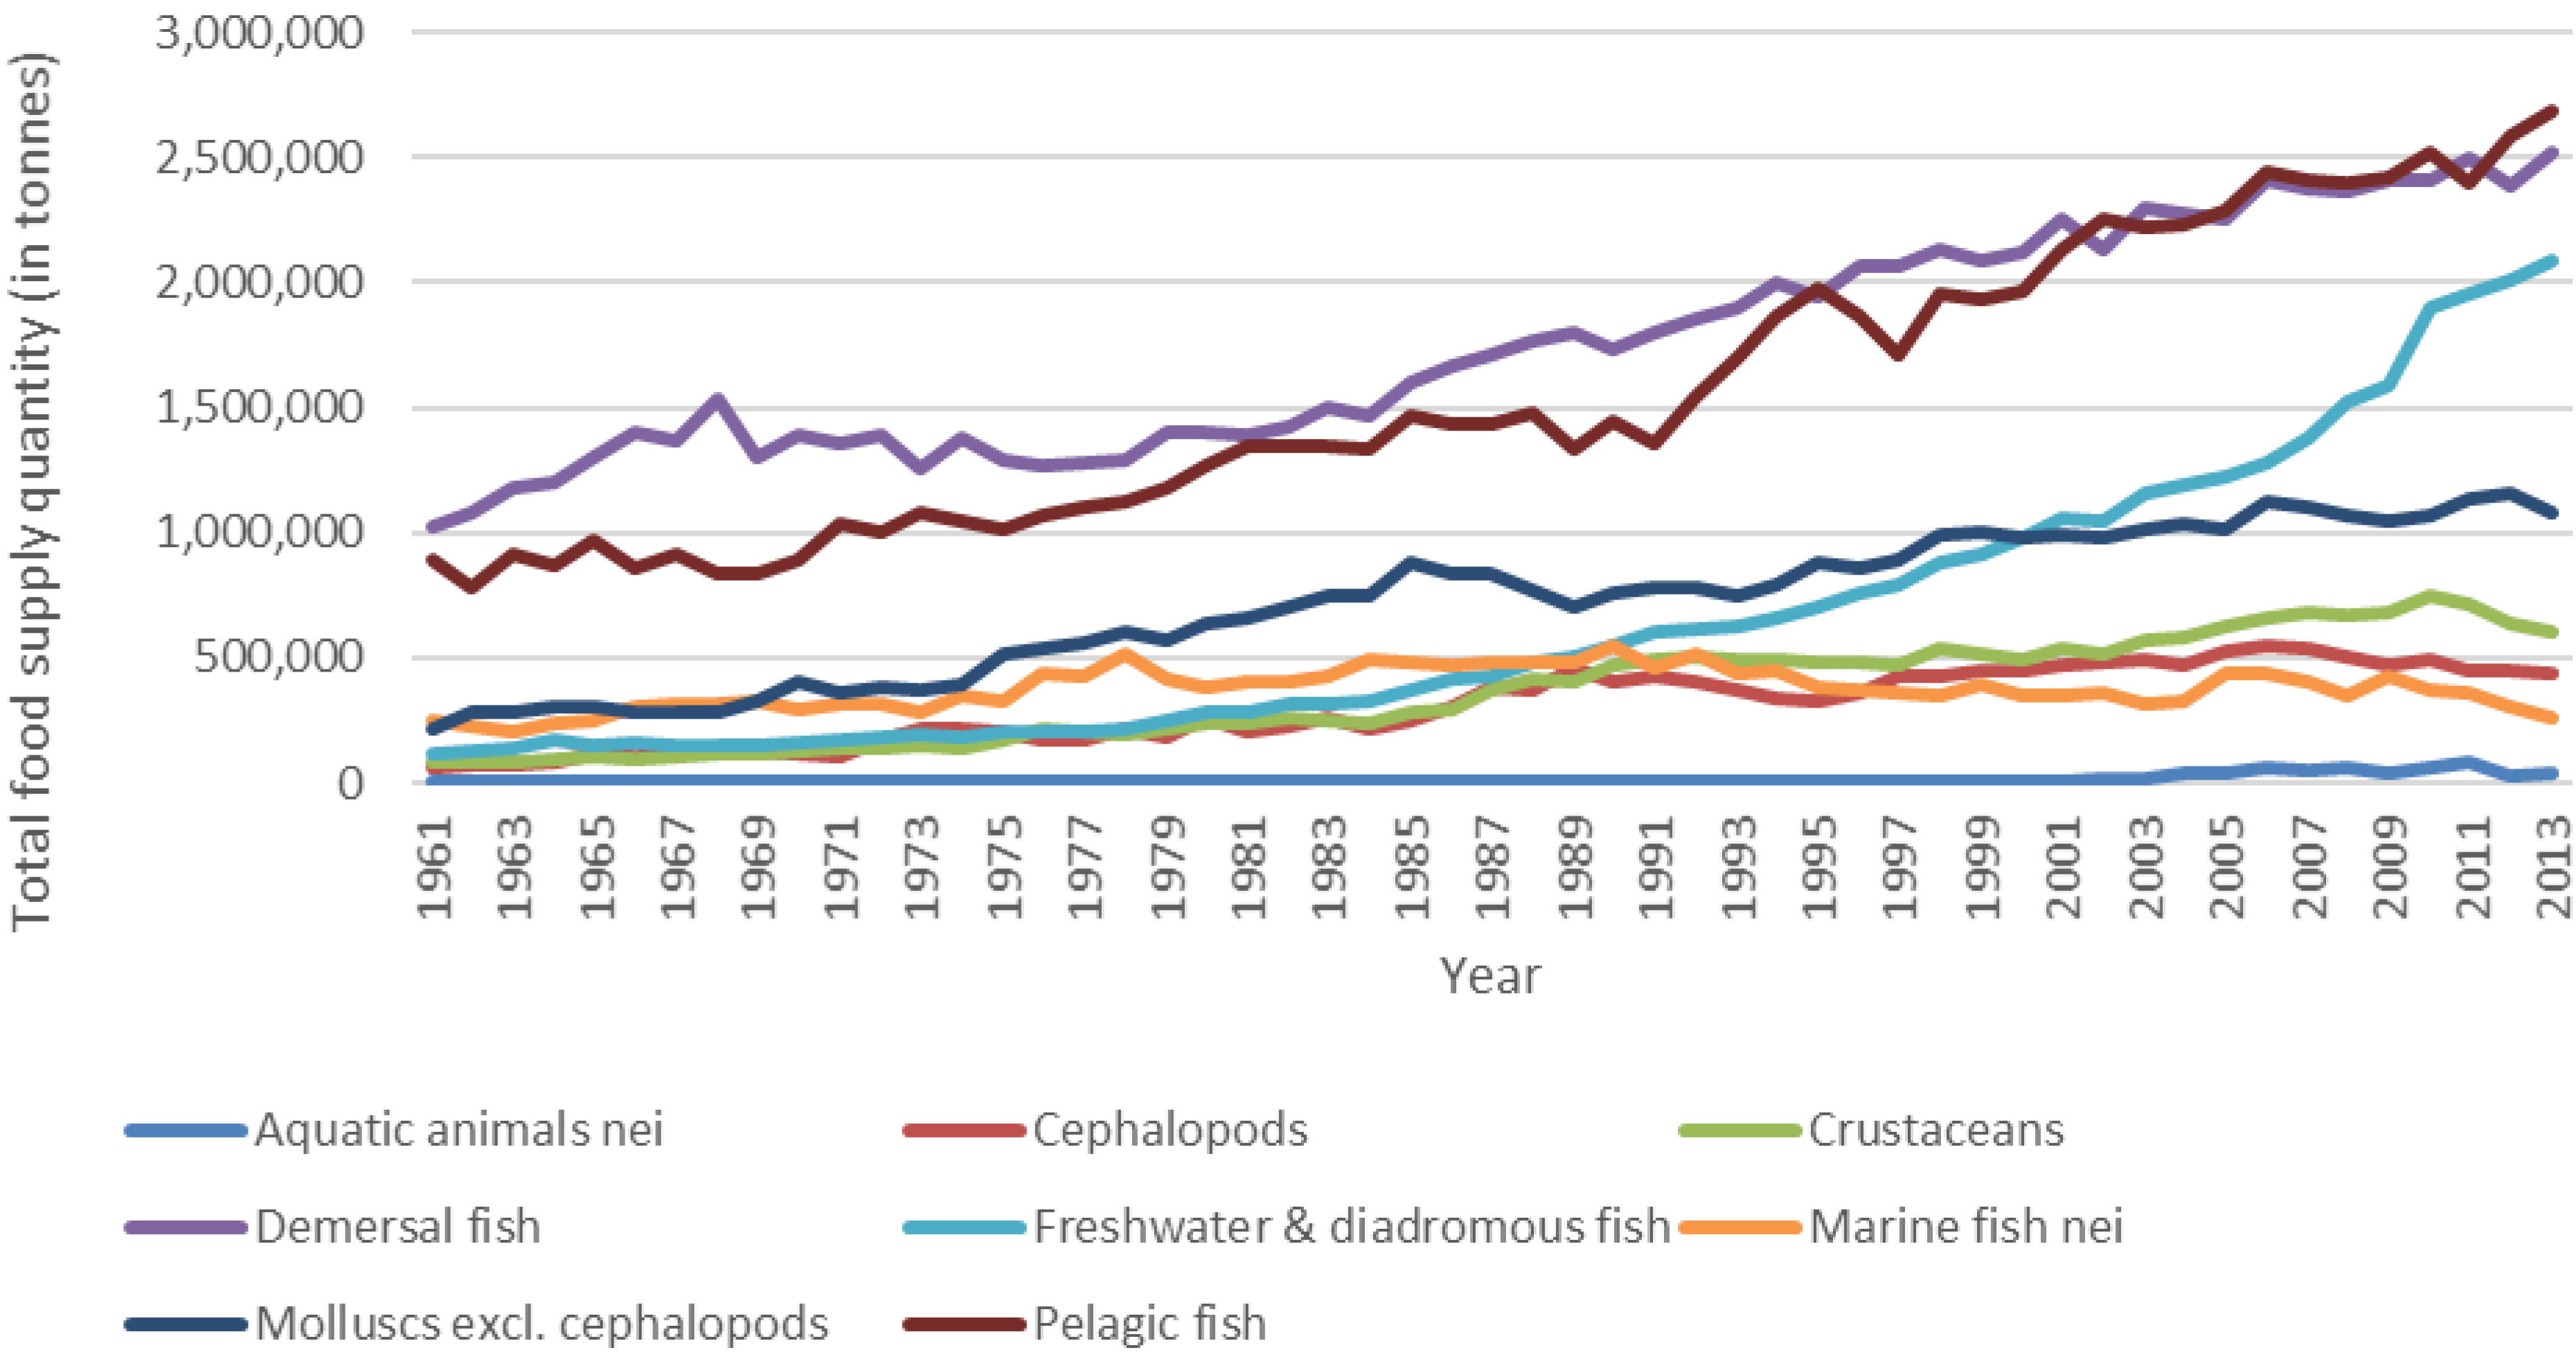
The evolution of the consumption of seafood can also be considered a means to reinforce or decrease the economic importance of fisheries in the different Mediterranean regions. For the Mediterranean countries as a whole, the apparent per capita consumption of all seawater fishery products has been increasing since 1961, rising from 11.3 kg per capita to 20.1 kg per capita in 2013 (see Appendix A Figure A11). After a period of slight decline in the 1980s, the proportion of pelagic species among the marine species consumed has since increased (35% in 2013). The consumption of freshwater and diadromous fish has been steadily increasing since 1961. In 2013, pelagic fish represented 28% of total marine product consumption, followed by demersal fish (26%), freshwater and diadromous fish (21%), mollusks (11%), crustaceans (6%), cephalopods (5%) and the marine fish nei (3%) (see Appendix A Figure A12).
In 2013, the mean estimated consumption of marine products for all Mediterranean countries was 20.1 kg per capita with a production of about 63% of their consumption (see Appendix A Table A3). By group of countries, Northern countries exceeded the world average with 30.7 kg per capita while Southern and Eastern countries were below with 16.7 and 6.8 kg per capita, respectively. Nine countries were above the average: Cyprus (21.9 kg per capita), Egypt (22.1 kg per capita), France (33.5 kg per capita), Israel (23.2 kg per capita), Italy (25.5 kg per capita), Libya (22.6 kg per capita), Malta (32.6 kg per capita) and Spain (42.4 kg per capita). Northern countries covered only 42% of their consumption with their production, and Eastern countries covered only 84%, while Southern countries had a surplus with 104%. Only Croatia, Morocco and Turkey covered their seafood produce consumption by their capture and aquaculture yields. Other countries are therefore highly dependent on imports.
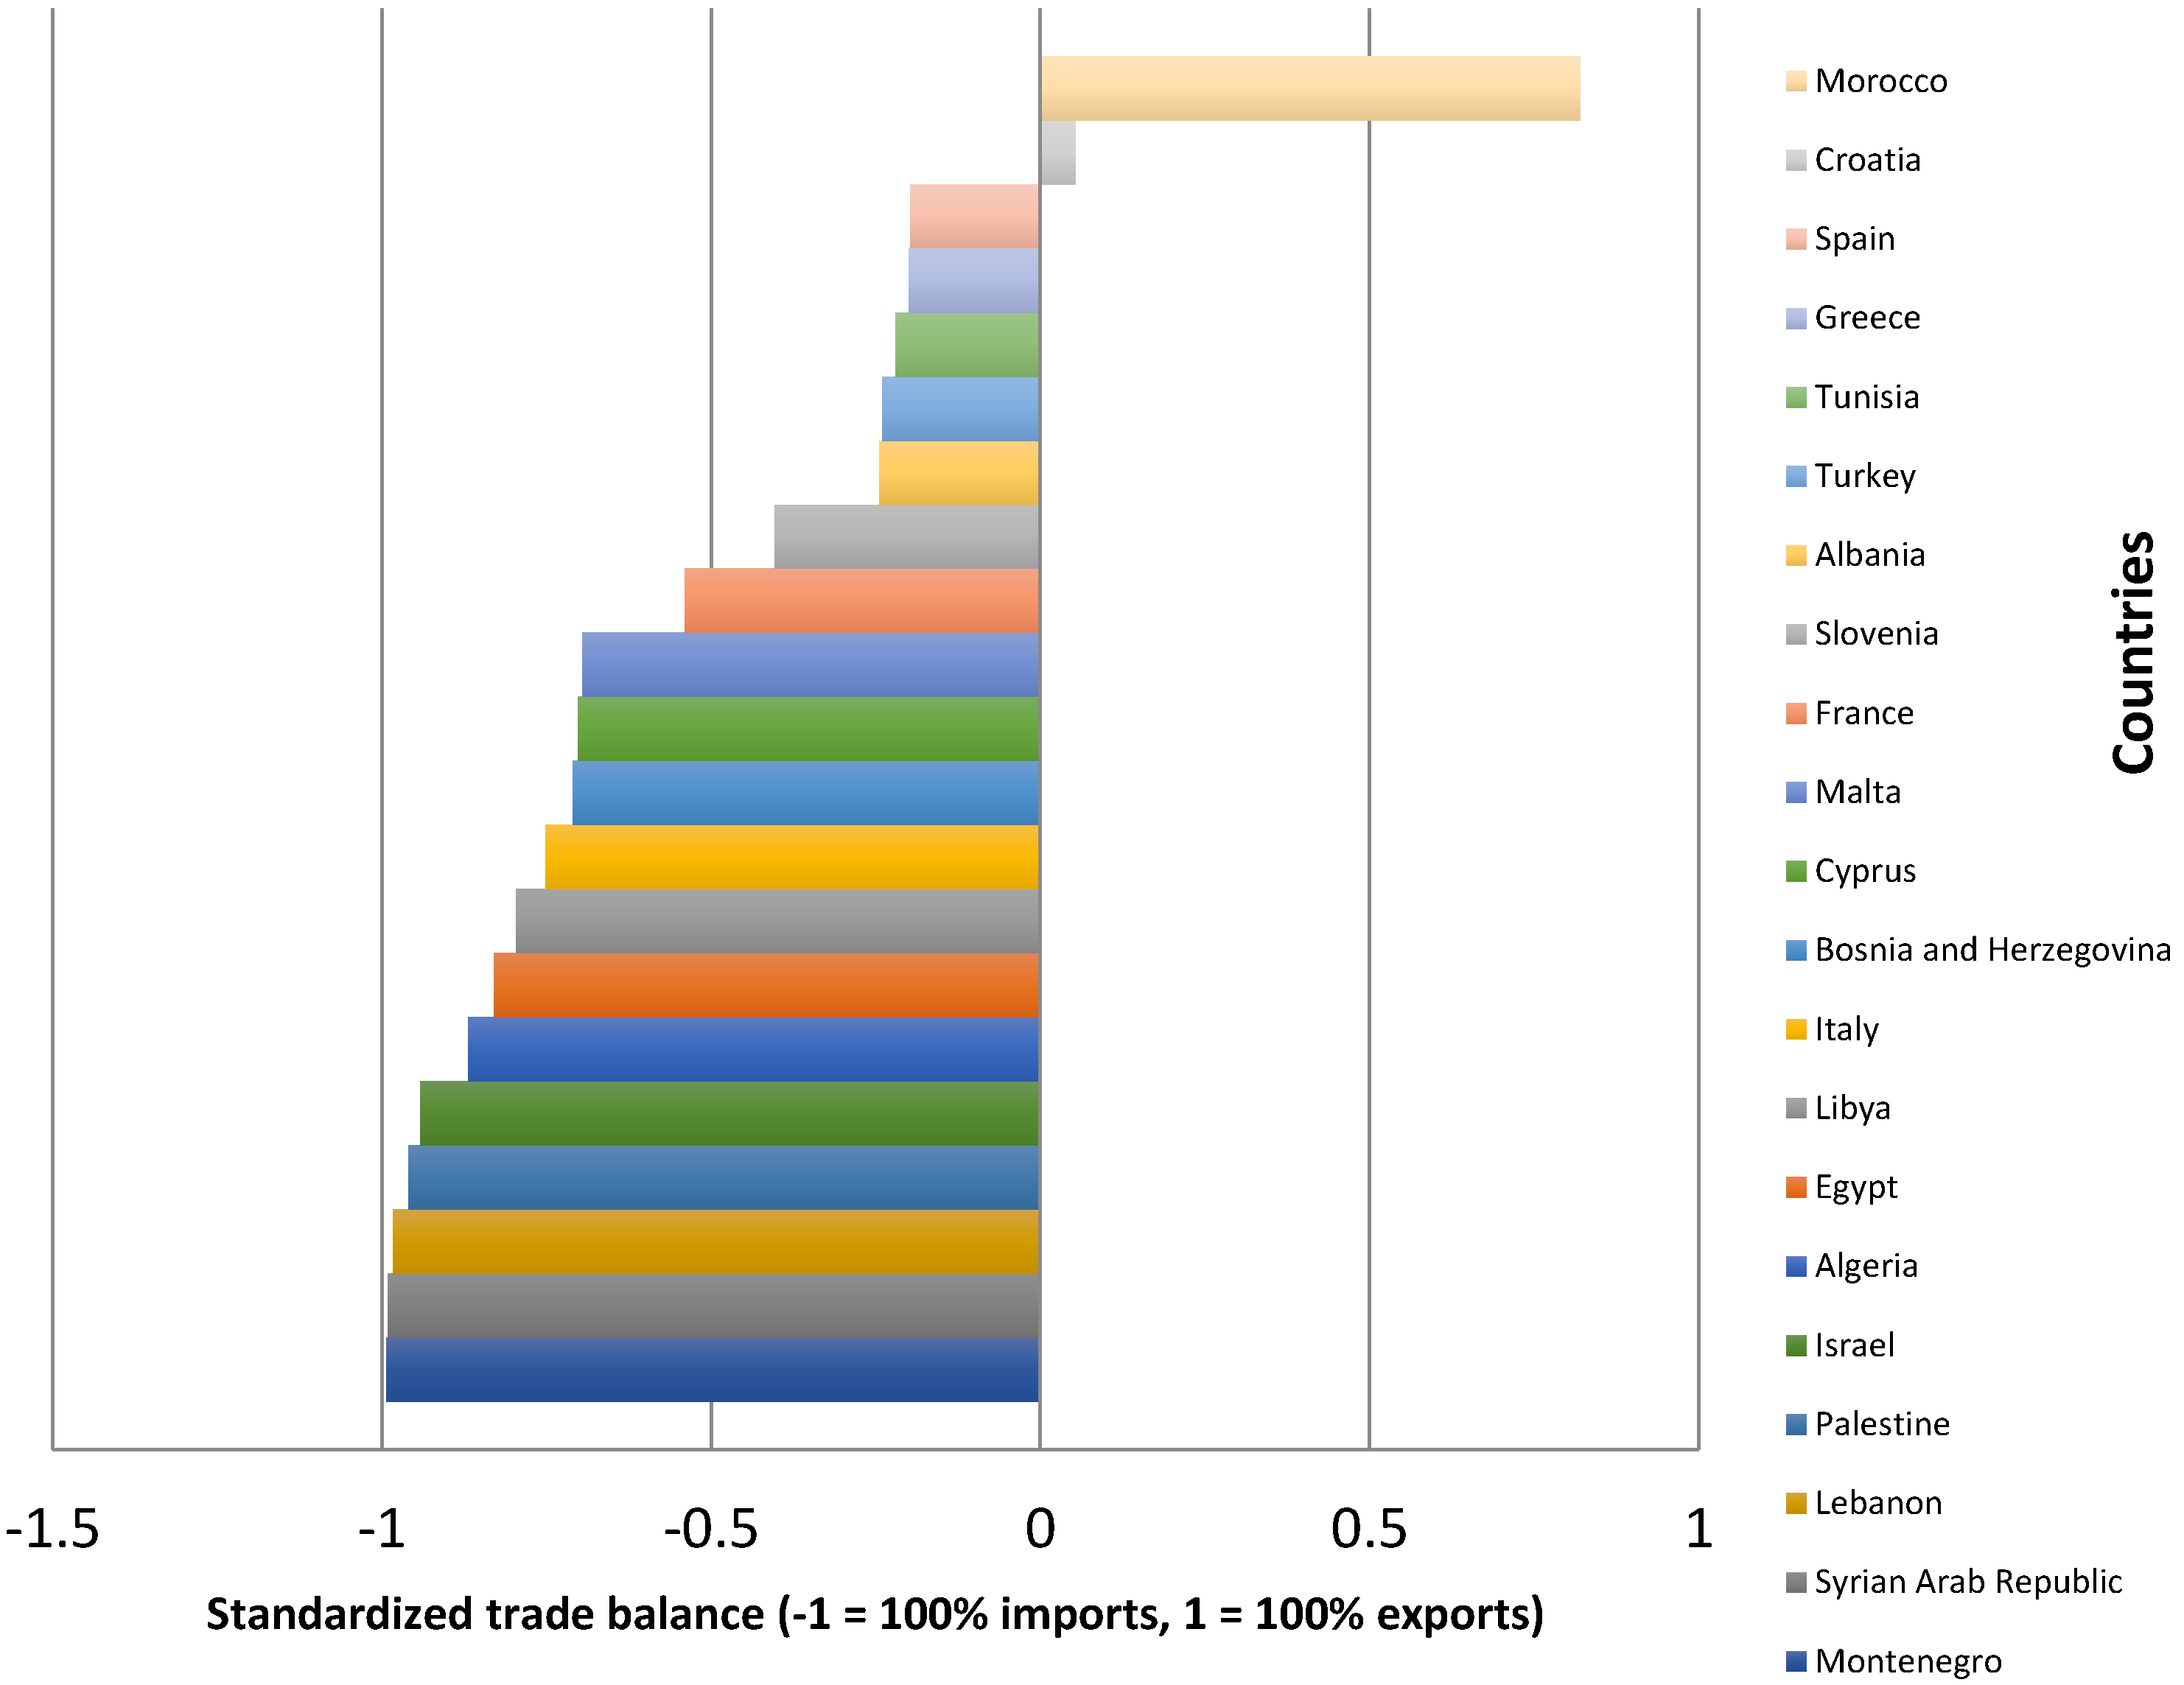
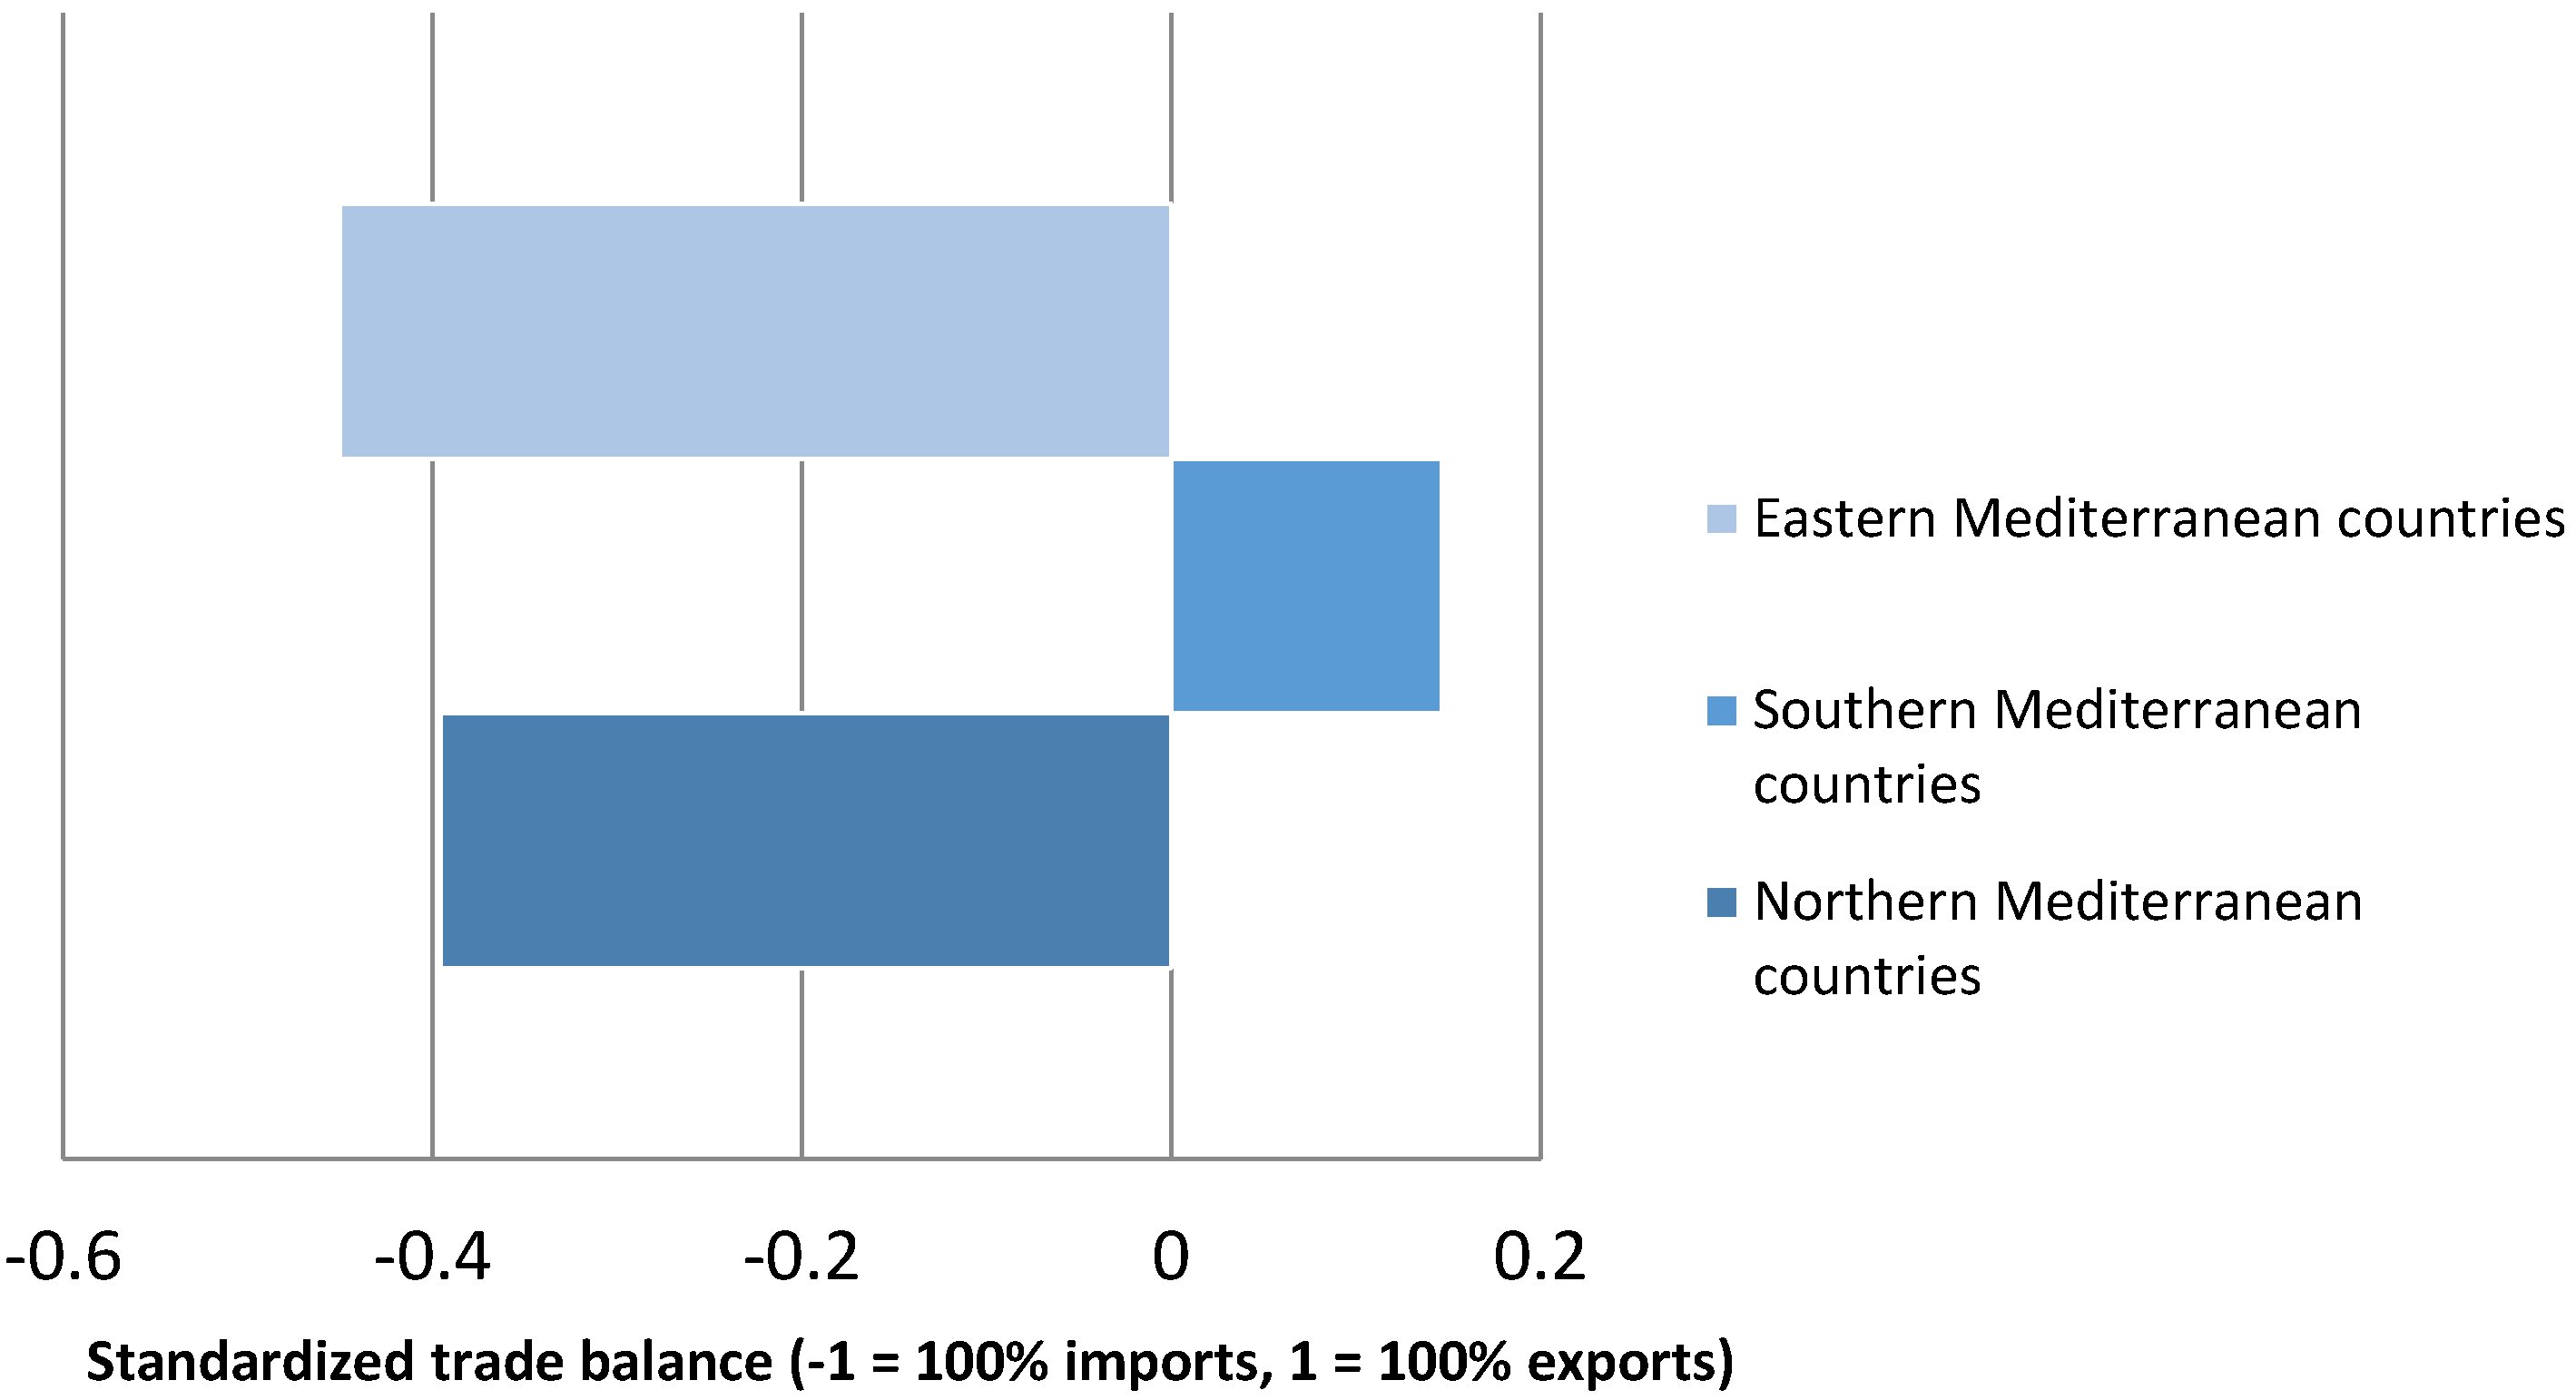
Depending on whether they are importers or exporters (fisheries trade), the impacts of the environmental threats will be different in the different Mediterranean regions. In the Mediterranean, most countries are net importers. Montenegro, the Syrian Arab Republic, Lebanon and Palestine are the most dependent on fishing imports. On the contrary, Morocco and Croatia are net exporters (see Appendix A Figure A13). If we analyze the data from a regional point of view, it can be seen that only the Southern Mediterranean countries are net exporters. The Eastern countries and the Northern Mediterranean countries reflect the importance of trade flows between the Southern and Eastern Mediterranean countries and the Northern countries (such as the EU countries) (see Appendix A Figure A14) [12].
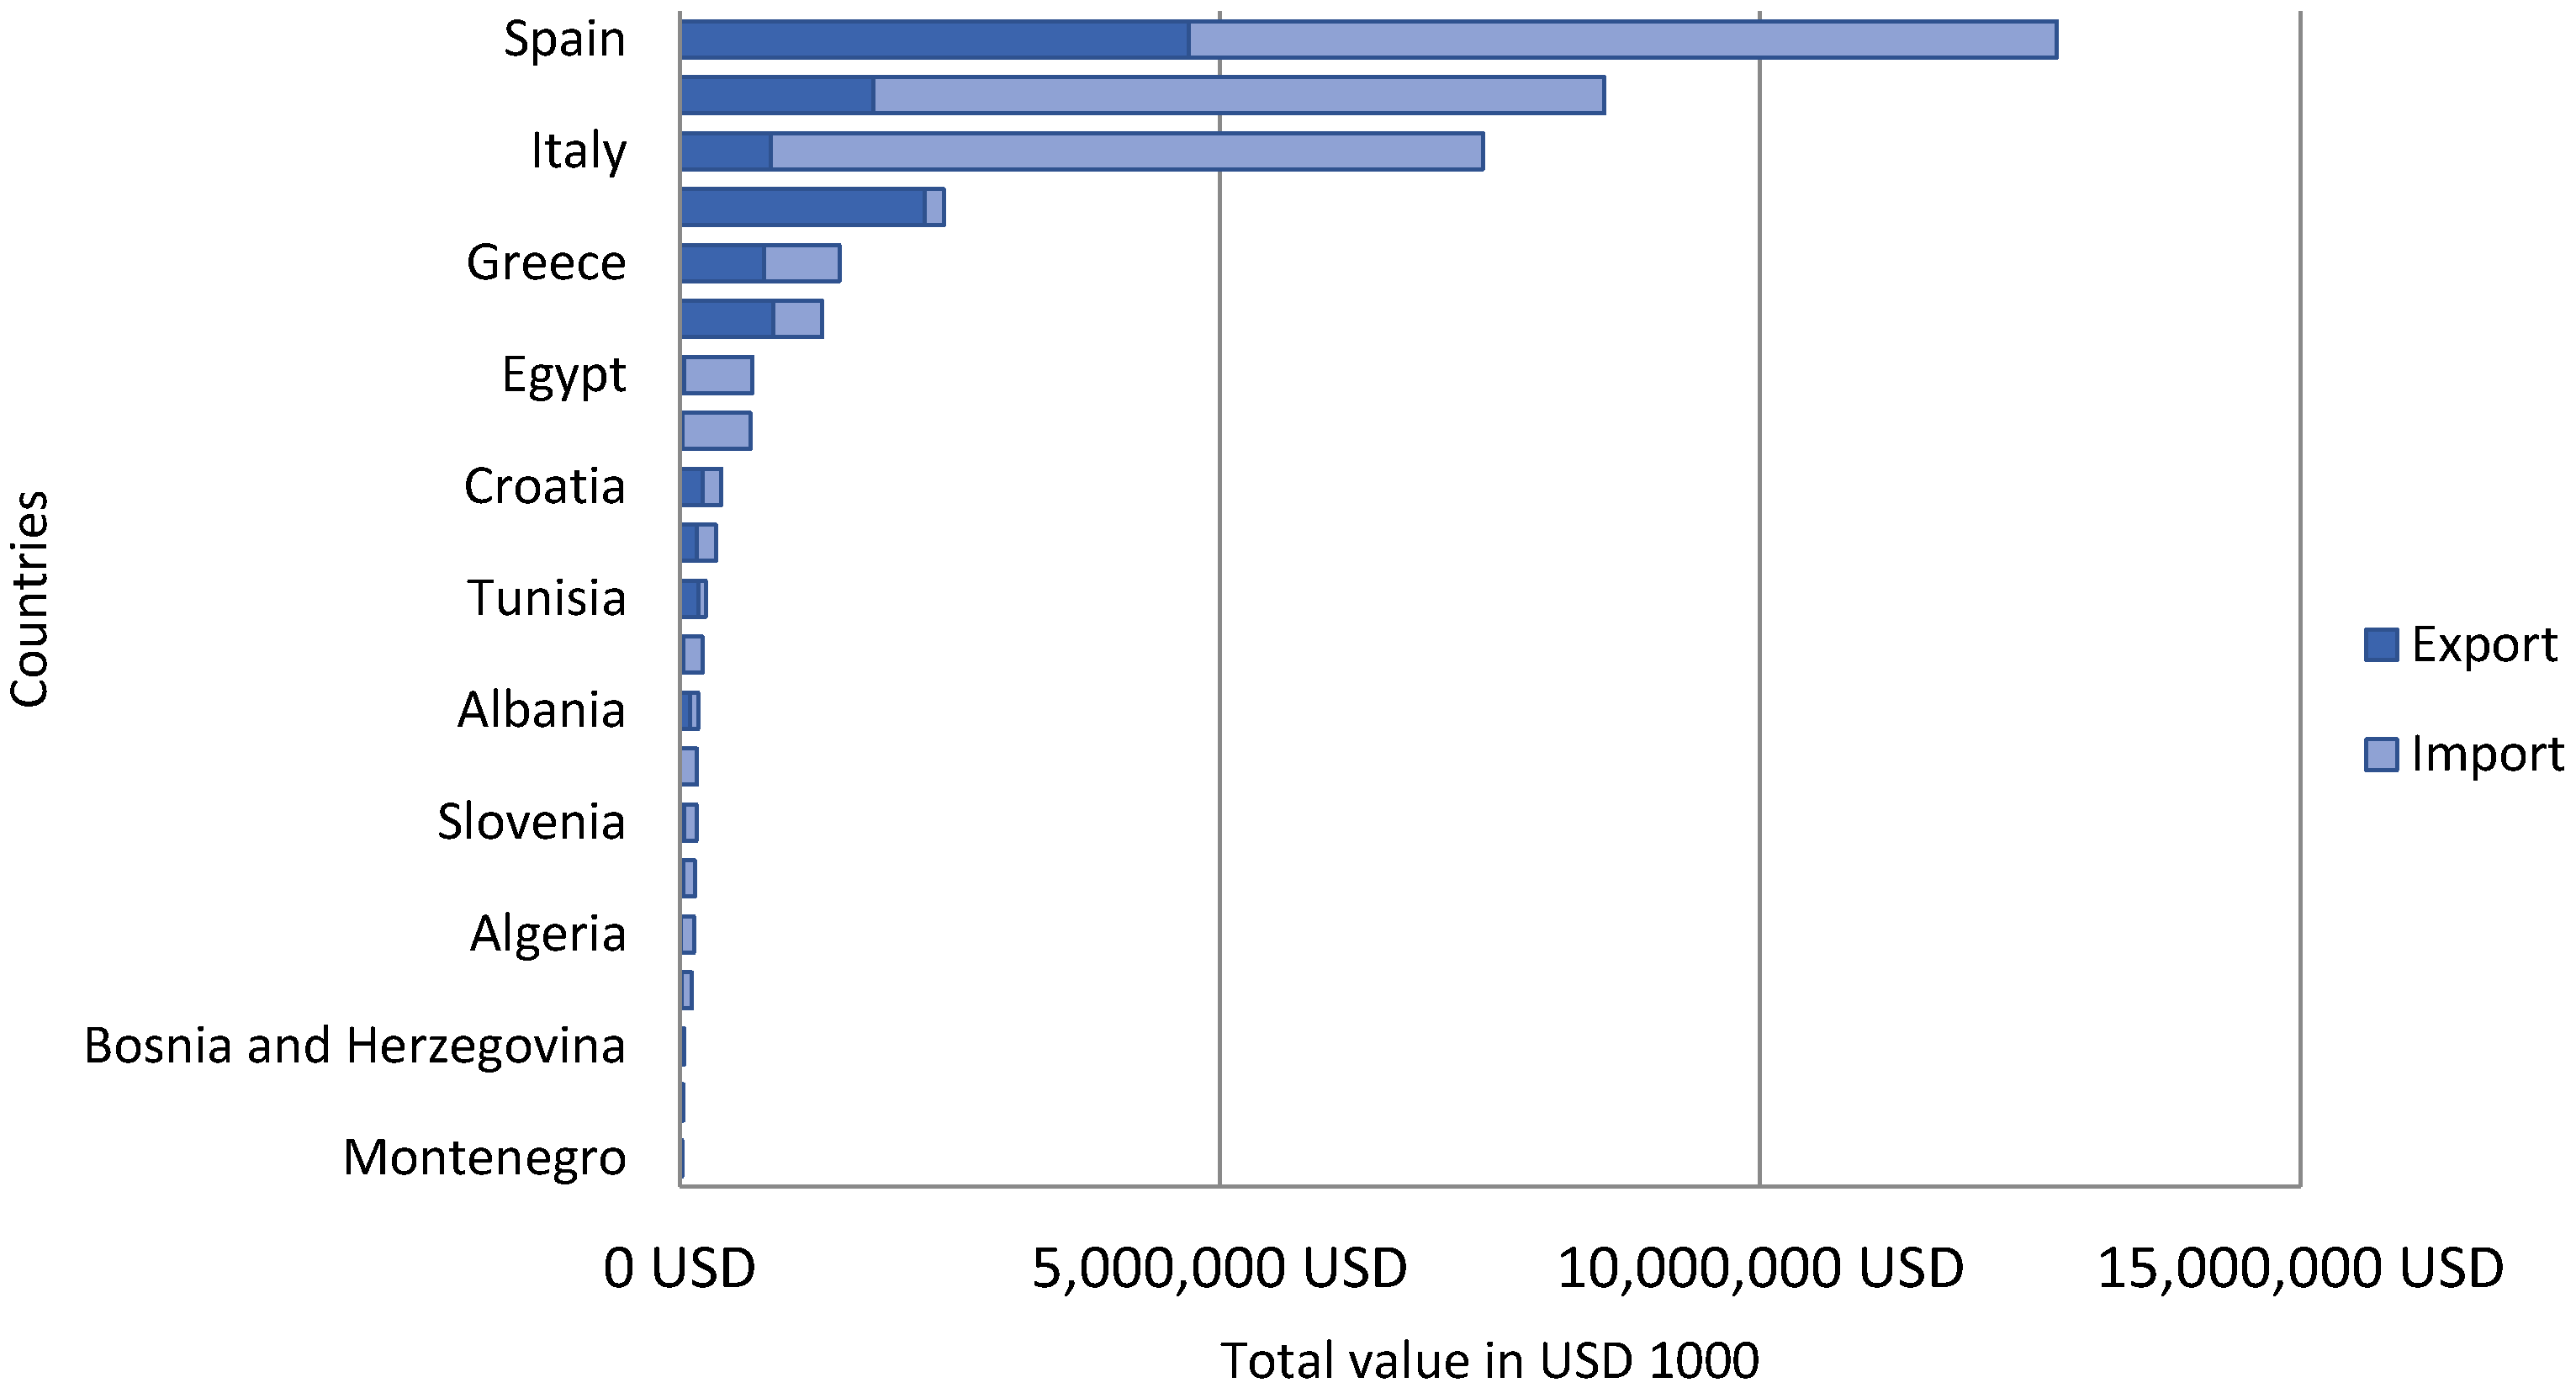
Another indicator studied is the value of the fisheries trade in the Mediterranean region. The total value of the fishery products traded (imports plus exports) is provided in Appendix A Figure A15. The total value of the fishery products marketed by Mediterranean countries is 37.2 billion dollars. All of the countries are net importers in value except for Morocco, Tunisia, Turkey, Albania, Croatia and Greece. If we analyze the data from a regional point of view, it can be seen that only the Southern Mediterranean countries are net exporters of value. The Eastern countries and in particular the Northern Mediterranean countries are net importers, highlighting again the importance of trade flows between the Southern and Eastern Mediterranean countries and the Northern countries (such as the EU countries; see Appendix A Figure A13).
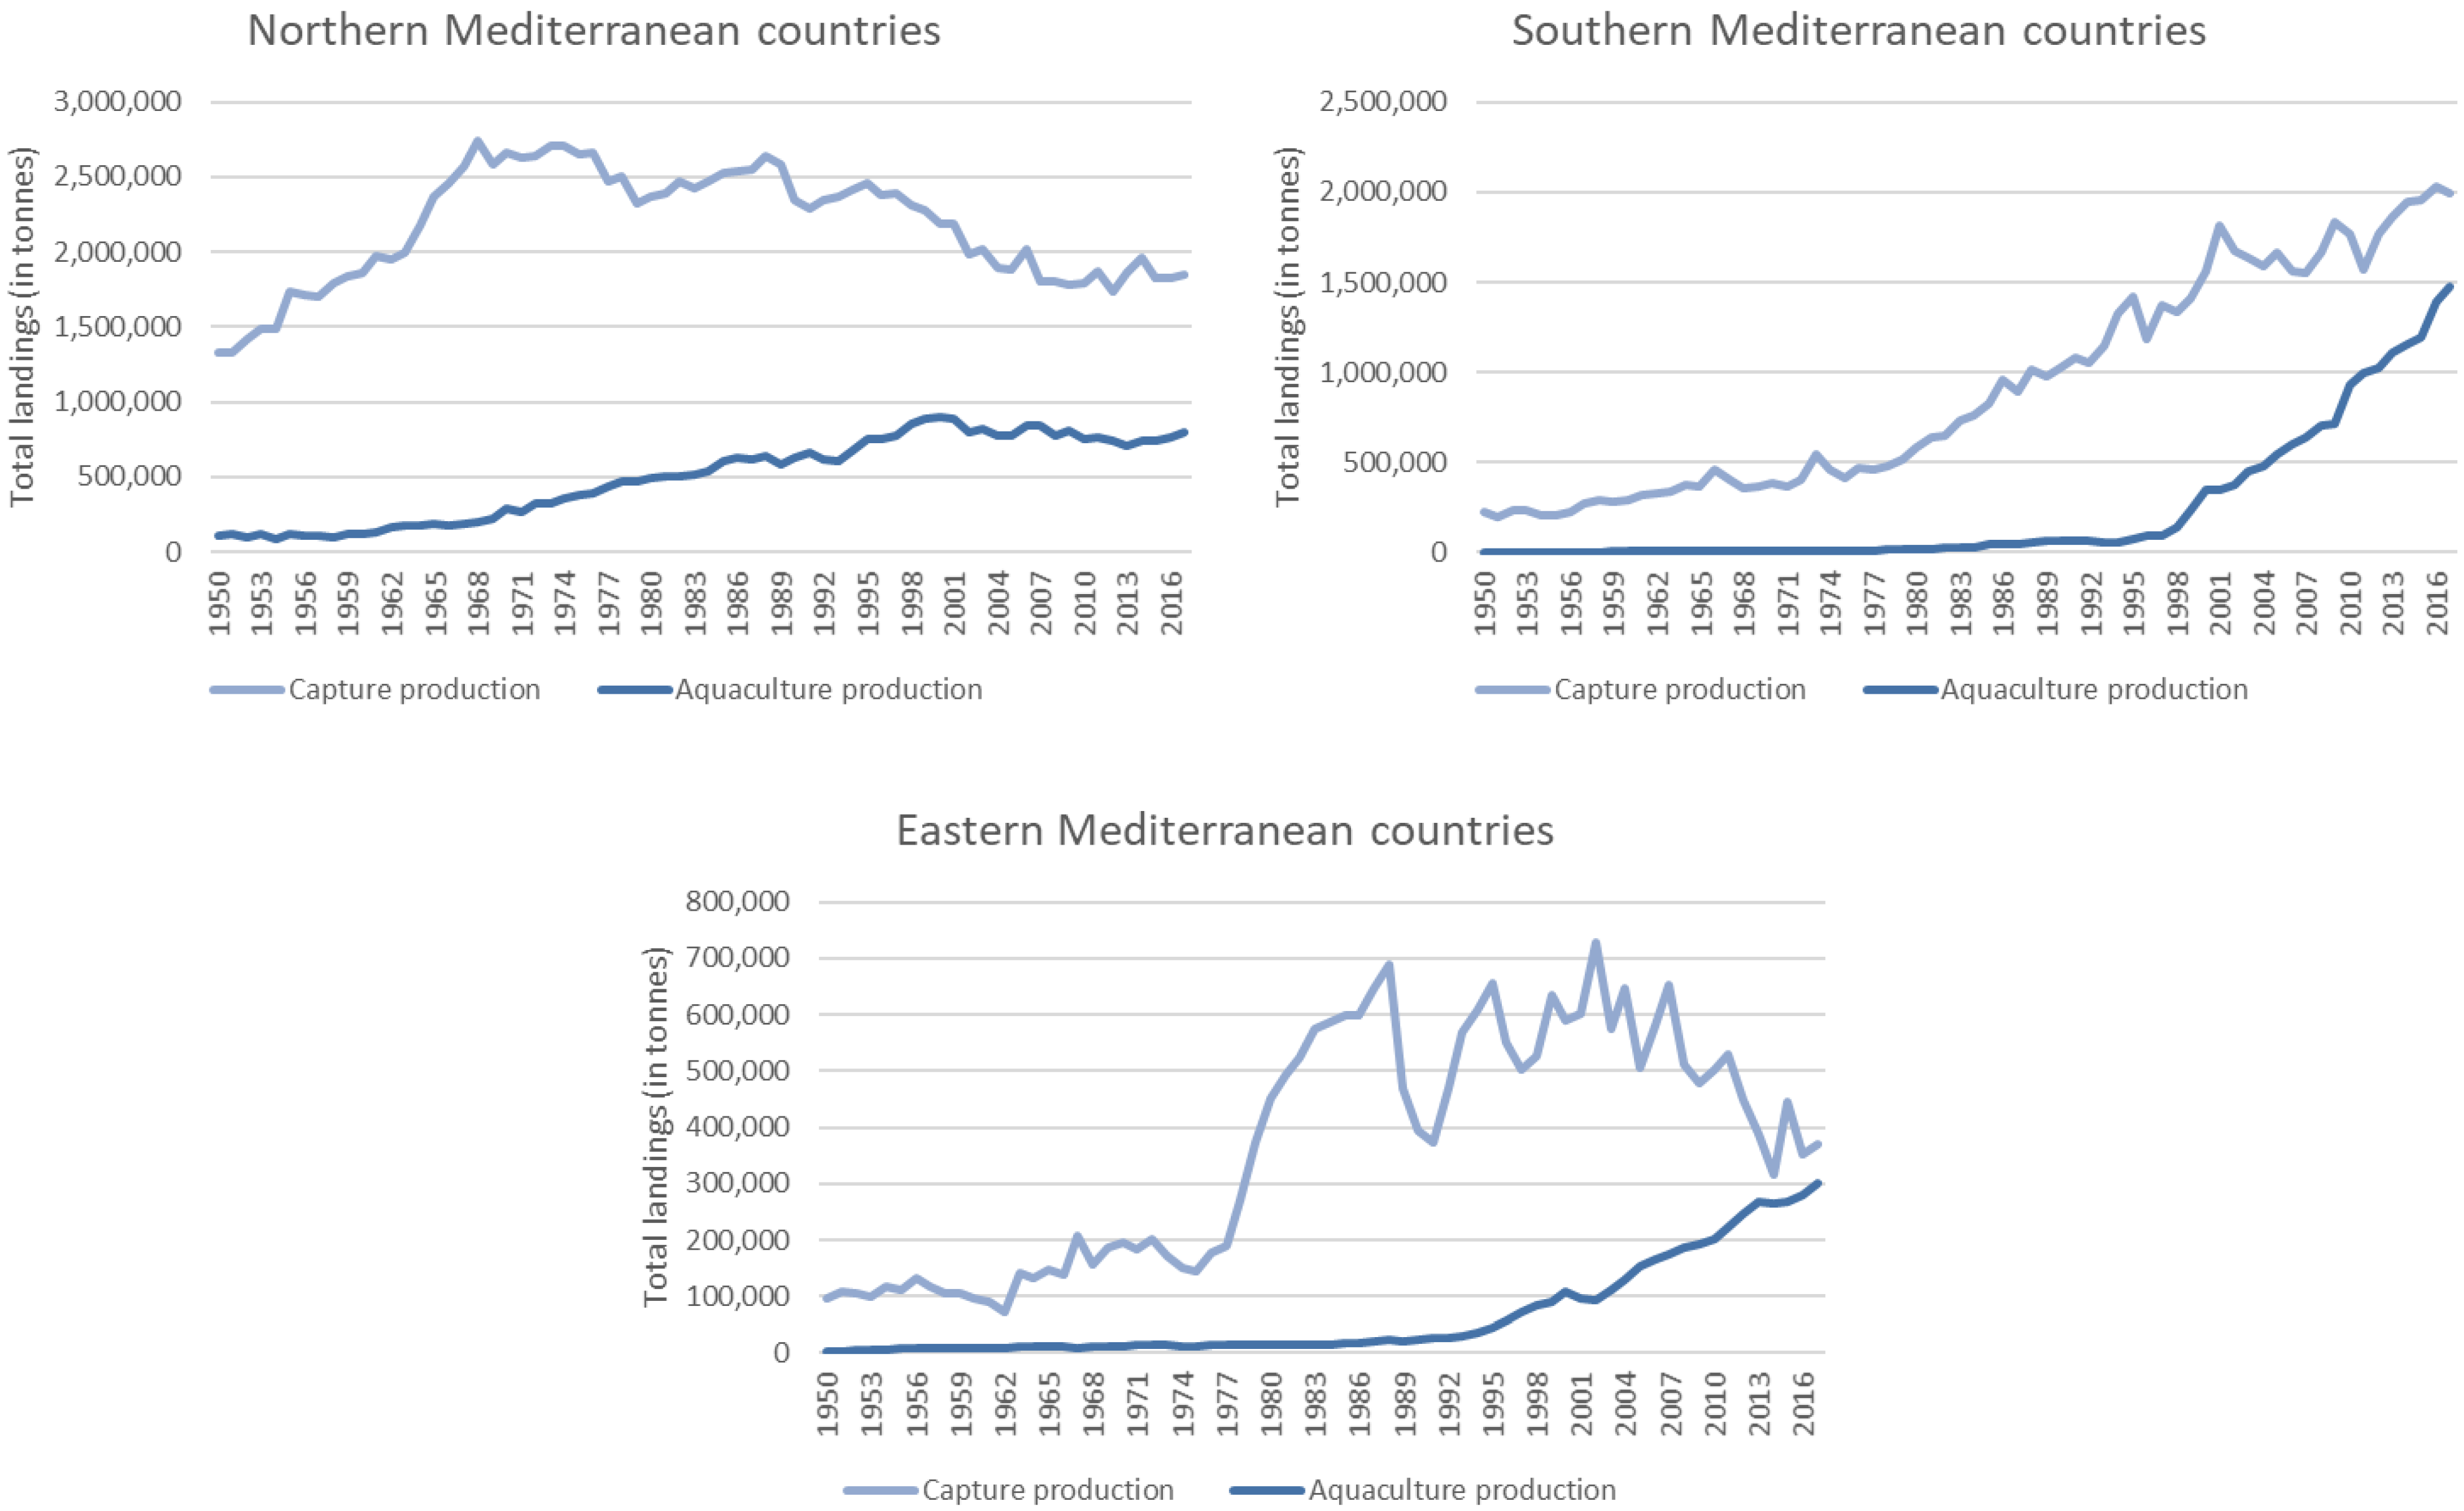
Mediterranean fishing fleets are divided into three types according to the classification of Lleonart et al. (1998) [58]: industrial, semi-industrial and small-scale artisanal fishing. The categories of recreational fishing and subsidence are added here to the capture fisheries in the Mediterranean. Fishing exploitation in the Mediterranean is carried out in depths ranging from 0 to 800 m, with the 400 m level being the most used. Bottom trawls, gillnets, trammel nets, dredges, traps and bottom longlines are part of the fishing gears operating in demersal areas. Small or medium pelagic species such as sardines and anchovies that live in schools are fished by pelagic trawls and purse seines. On the other hand, larger pelagic species, such as tuna, living closer to the surface and being migratory species, are caught mainly by seines, surface longlines and drift nets. The five different types of fleets: artisanal, industrial and semi-industrial fleets, subsidence and recreative are described below according to several classifications [12,58,59]. Sacchi differentiates artisanal fisheries (or small-scale fisheries) and industrial fisheries with the final destination of the products, where the former will produce for the local markets and the latter will export their production.
Pauly and Zeller [59] defined the industrial sector as a large-scale sector of a commercial nature involving large motorized boats and primarily large seiners targeting tuna and swordfish, besides hake, sardine, anchovy, and shrimp [40]. Fleets are expensive to build, maintain and operate. Most of their catches are sold commercially. Both Mediterranean and non-Mediterranean countries fish in the region, and the non-Mediterranean countries include Russia, Japan, Korea, Georgia, Ukraine, Bulgaria, and Romania. The industrial fleets mainly target a limited number of species and operate mainly in deep waters. Sacchi [12] adds that they are fleets that go out for several days at a time, usually over 500 GT, transport the catch and house their crew. The industrial sector prefers to fish for large catches of species such as tuna, sardines, shrimp and anchovies, which are destined for the “international fresh or frozen markets and especially for processing” [12].
Like industrial fleets, semi-industrial fleets target national and international markets. They differ from the industrial sector by their artisanal management of their vessels. They have on board the fishing captain who owns the means of production (vessel and fishing gear). Like the industrial fleets, they use gear that can catch large quantities of fish. In the Mediterranean, there is gear such as “trawlers, sardine seiners and vessels using equipment such as mechanical towed nets, some longlines and trammel nets.” Fleets using these types of gear “generally land their catches daily and operate mainly on the continental shelf and around the continental slope” [12].
Sacchi [12] provides a definition of artisanal fishing that suggests that it differs from other types of fisheries by the destination of production. Artisanal fishing is defined by local markets as a production outlet versus exports for larger fishing operations. Sacchi [12] also adds that artisanal fishing is defined by the length of the vessel. It sets a limit of 12 m for the length of an artisanal fishing vessel. It should be noted that in some countries, such as Turkey, other definitions can be adopted, such as that of the Turkish Statistical Institute, which points out that artisanal fishing operates with one fisherman on a vessel of less than 10 m and with a limit of five crew members [60].
Artisanal or small-scale fisheries in the Mediterranean should be studied as they play an important social and economic role [27]. The FAO report on the state of fisheries in the Mediterranean and the Black Sea [61] showed that artisanal fisheries account for 84% of the total fishing fleet in the Mediterranean and the Black Sea with 70,000 vessels. It generates 26% of total revenue (USD 633 million) and 60% of total employment (150,000 people). Comparing their data with The State of Mediterranean and Black Sea Fisheries 2016 [62] (SoMFi 2016), FAO notes that the number of vessels in small-scale fisheries has decreased by about 4000 vessels (5%), while data on employment and annual earnings show that they have increased by about 15,000 people (9%) and by USD 45.3 million (7%) compared to 2016. They also note that these changes may be due in part to improved data collection.
Subsistence fishery is small-scale fishing for non-commercial and recreational purposes. This fishery is intended for family consumption and includes artisanal boats where the subsistence catch is given to the families of the crews or to the local community [59]. The recreational fishery is defined as a fishery undertaken for non-commercial reasons or subsidence. This fishery is conducted primarily for pleasure. Occasionally, a portion of the catch may be sold [59]. These kinds of fishery can have a local importance for coastal communities, but their role at the national level is small. Nevertheless, if subsistence and recreational fisheries are reduced due to environmental factors, the consequence on poverty and livelihoods can be significant in some areas of the Mediterranean.
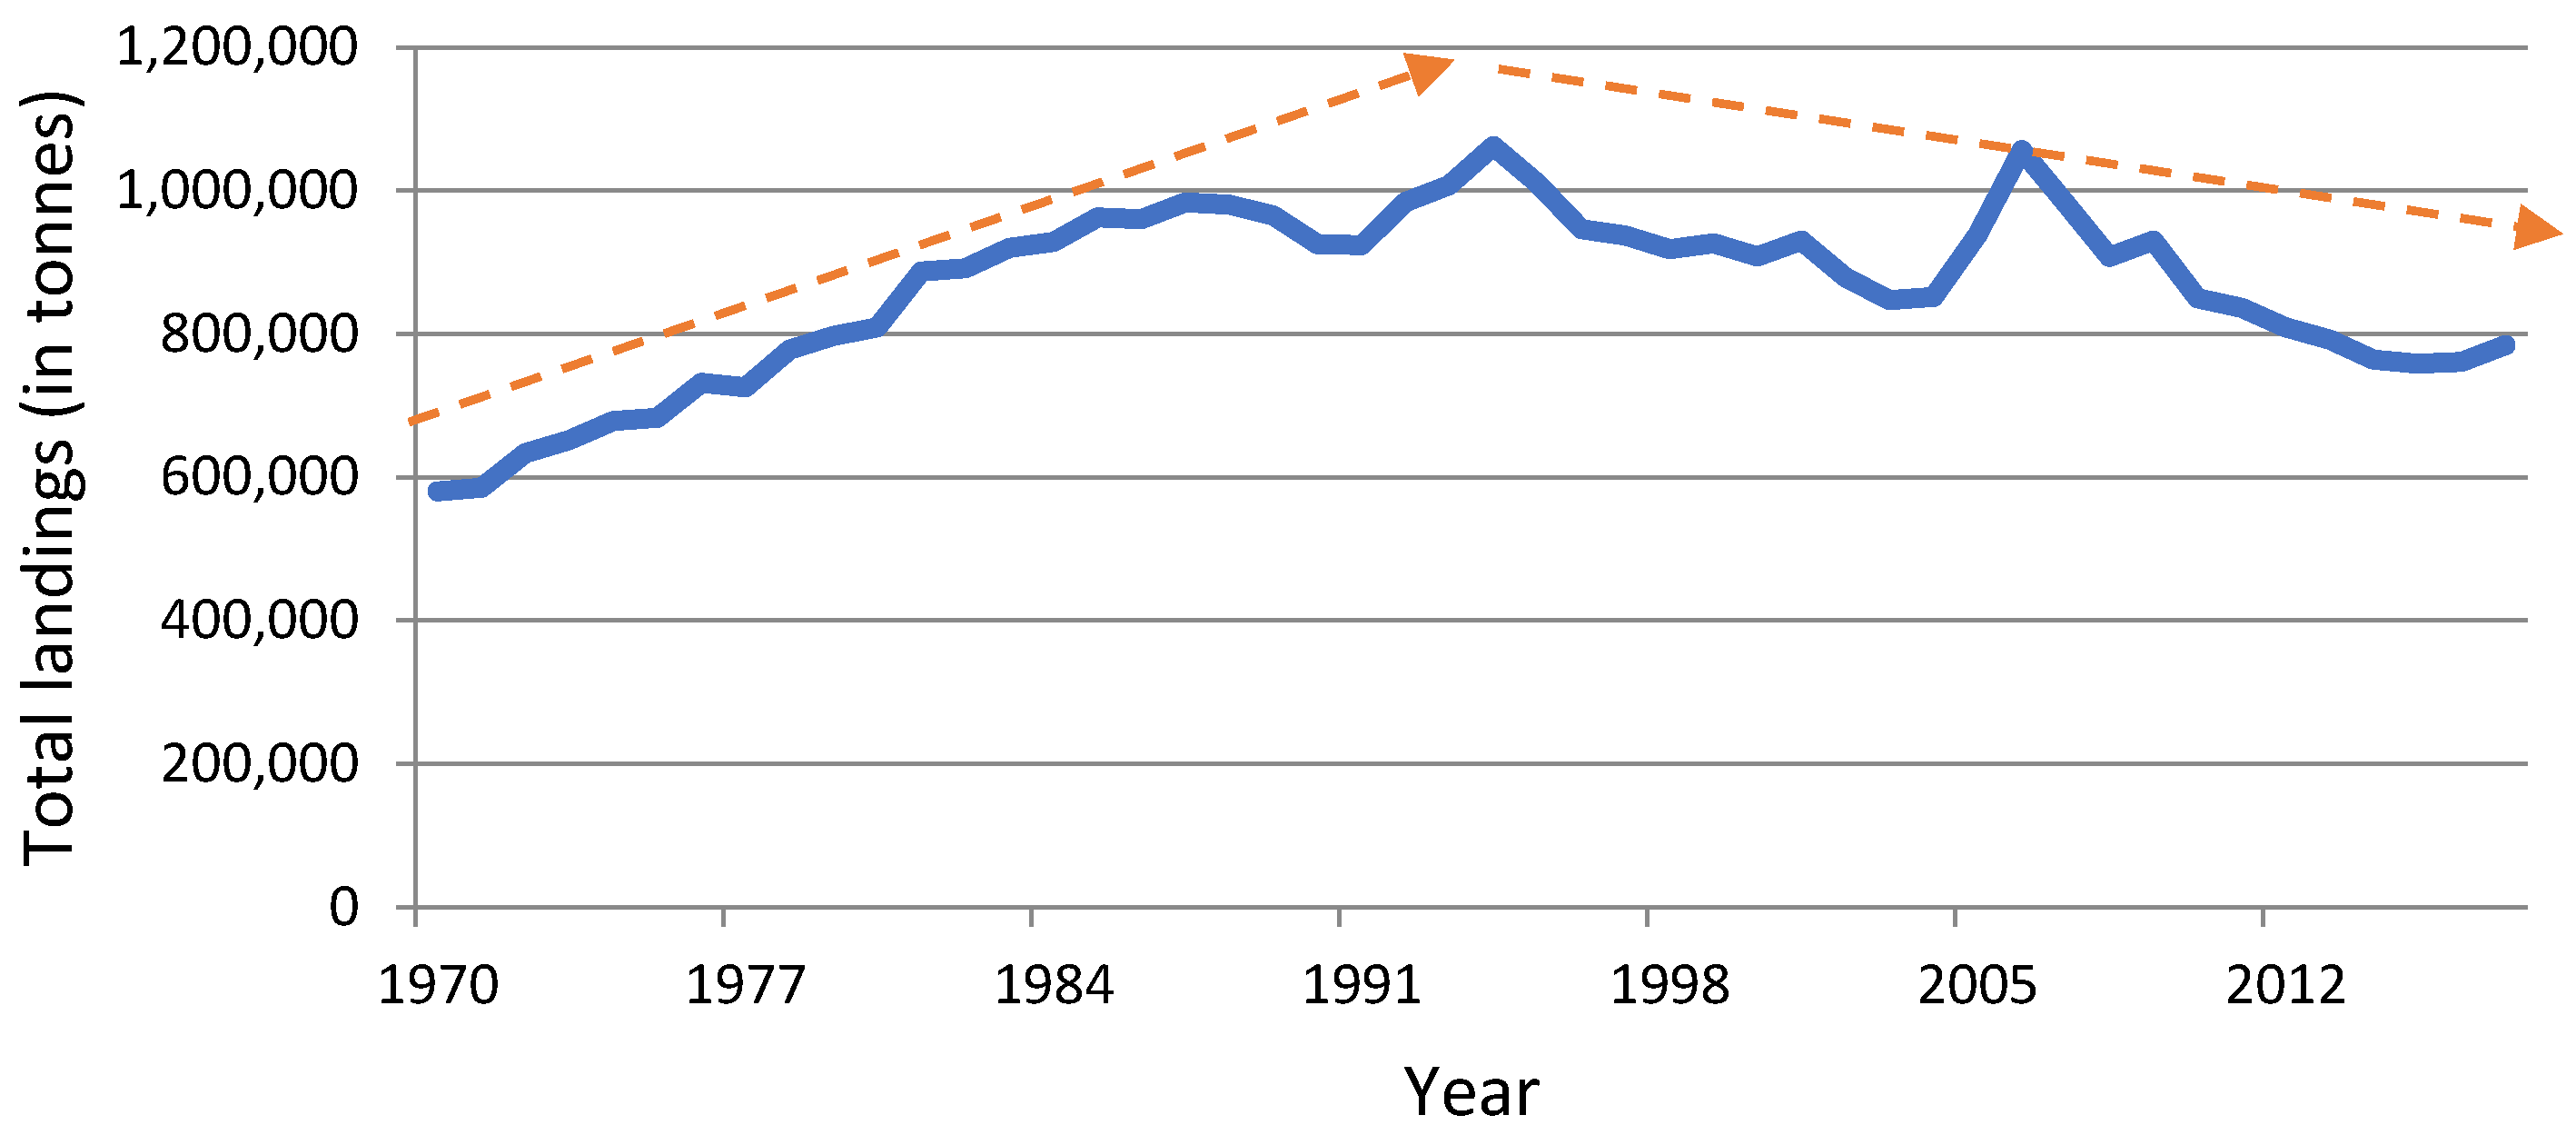
Finally, another human-induced threat to the Mediterranean fisheries is overfishing. Pauly and Zeller [59] distinguish the two types of catches: landings (i.e., catches that are retained on board and landed) and discards (mainly from the industrial fishery). In discards, fish and invertebrates are generally considered dead. To this can be added the net mortality of fishing gear and mortality caused by ghost fishing of abandoned or lost fishing gear. However, no reliable data on these discards are available, so this is a limitation of our analysis.

4. Materials and Methods

4.1. The Objective of the Empirical Study

As mentioned before, the objective of this paper is to study the impacts of the environmental and socio-economic risks on the fisheries in the Mediterranean region. To this end, our research applies econometric modeling. In Section 3, we theoretically discussed some environmental threats as well as socio-economic factors that cause the vulnerability of the fisheries sector in the Mediterranean region. To achieve the goal of the study, we empirically investigate whether such factors have actually influenced fisheries in the region.

4.2. The Model

As stated before, there is a rich literature on environmental changes and anthropogenic impacts on fisheries [13,14,15,16,17,18,19,20,21,22,23,24,25]. However, few studies estimate these impacts. For example, Fu et al. [21] showed that the structure and vulnerability of landed fish are affected significantly by environmental conditions and these effects tended to be negative. This study focuses on the environmental (ecological) and socio-economic factors that influence the fisheries sector. We tested the factors’ influences by considering relevant variables in the model with available data. The advantage of this study is that it includes more variables in the model. For environmental factors, eight variables were considered. Concerning the socio-economic side, HDI is an adequate composite index in which both social (health and education) and economic (GNI per capita) dimensions are included. In addition, the total population, urbanization and changes over time were entered in the model as economic–demographic variables. The population variable was considered in quadratic form based on theoretical grounding. Finally, the ratio of industrial to small-scale fisheries was included as a feature of the fisheries sector. Encompassing these factors, the following econometric model is defined:
F i s h e r i e s = α + β 1 l n S S T i . t + β 2 l n T e m p _ b t m i . t + β 3 l n H T _ s u r f i . t + β 4 l n H T _ b t m i . t + β 5 l n O 2 _ s u r f i . t + β 6 l n O 2 _ b t m i . t + β 7 l n S a l _ s u r f i . t + β 8 l n S a l _ b t m i . t + β 9 l n I S S T i . t + β 10 l n H D I i . t + β 11 l n P o p i . t + β 12 l n P o p 2 i . t + β 11 u p i . t + β 12 u p g i . t + ε i . t
where the first seven regressors are environmental explanatory variables. SST is the sea surface temperature, Temp_btm is the sea bottom temperature, TH_surf is the H+ ion concentration on the surface, HT_btm is the H+ ion concentration at the sea bottom, O2_surf is surface oxygen, O2_btm is bottom oxygen, Sal_surf is surface salinity, and finally, Sal_btm represents bottom salinity. Other explanatory variables are as follows: ISST is industrial to small-scale fisheries, HDI is Human Development Index, Pop is total population, Pop2 is the quadratic form of population, UP is urbanization rate, and UPG is changes in urbanization rate.
For fisheries, two variables were considered; in the first, the dependent variable is FLT (quantity of fish landed in tonnes), and in the second, it is LV (value of fish landed in USD). Using the double log model, all variables were transformed into natural logarithms to reduce the influence of heteroskedasticity. In addition, the interpretation of the estimated coefficients will be the elasticity of the dependent variable relative to explanatory variables. In Equation (1), the subscripts i refer to cross sections. Here, we included 21 Mediterranean countries for which the data are available, while the subscript t stands for the time dimensions in this study, 2001 to 2018. This study utilizes the panel procedure to estimate the proposed equation. According to the discussions in Section 3, it is expected that most estimated coefficients will be negative except for ISST and HDI where HDI proxies the adaptive capacity of countries.

4.3. Data and Variables

The cases of the study are Mediterranean countries, where Albania, Algeria, Bosnia and Herzegovina, Croatia, Cyprus, Egypt, France, Gaza, Greece, Israel, Italy, Lebanon, Libya, Malta, Montenegro, Morocco, Slovenia, Spain, Syria, Tunisia, and Turkey have been included due to data availability for 2001–2018.
The data for both variables have been extracted from the Sea Around Us [63] (http://www.seaaroundus.org/ (accessed on 5 June 2021)). The available data are for exclusive economic zones (EEZs). Thus, for Cyprus, Italy and Spain—countries with more than one EEZ— the data have been separately computed by adding data for relevant EEZs. Data for environmental variables are from [64]. Again, the data are for EEZs. Here, for the aforementioned three countries, we calculated the average of each variable for relevant EEZs to measure the volume of variables for these countries. Industrial and small-scale fisheries data are also extracted from the datasets of the Sea Around Us [63]. Since the available data are by species, we have summed the values of the species to get the total values. It should be noted that only landings have been taken into account and discards have been removed from the calculation. HDI data are from the yearly Human Development Reports (HDRs), which are published by the UNDP [65]. In addition, the population and urbanization data have been extracted from the UN World Population Prospects 2019 [66].
A brief image of the definitions and the descriptive statistics of the variables utilized in the study have been presented in Table A4 in the Appendix A.

4.4. Statistical Tests

Multi-collinearity checks among environmental variables are reported in Table A5 in the Appendix A. As seen in the second column, the VIF (variance inflation factor) for some variables are unacceptably high and show that some variables are possibly redundant. Through one-by-one omission of redundant variables, we deleted lnO2_surf (surface oxygen), lnO2_btm (bottom oxygen) and lnSal_btm (bottom salinity). By these eliminations, the VIFs and tolerance (1/VIF) values look acceptable, as given in the last two columns of Table A5.
To lessen the influence of heterogeneity, we applied algorithmic processing to all variables, where the correlation coefficients and pairwise relationships between variables are shown in Appendix A Table A6. As the results show, the correlation coefficients between the volume of fish landed and the temperature at the bottom of the Mediterranean are significant and negative, while there are inverse statistically significant relationships between the volume of fish landed and the H+ ion concentration as well as the temperature on the surface. In addition, the correlations between the volume of fish landed and socio-economic variables are significant and positive, which indicates the importance of socio-economic factors in fishing. For the landed value of fisheries, all correlation coefficients are all statistically significant except for sea surface temperature and HDI. Here, the negative correlation between landed values and temperature at the sea bottom again indicates the inverse role of this factor in the declining revenues of fisheries. It is clear that further estimation beyond this correlation analysis is required to reliably refute or validate these relationships.
Checking for cross-sectional dependency, since T is smaller than N in our sample, we used the semiparametric cross-sectional dependence test proposed by Frees [67,68] with Frees’ Q distribution since T < 30 [69]. The test results for both models have been presented in Appendix A Table A7. Frees’ statistics in both cases are larger than the critical values. The calculated average absolute correlations are 0.329 and 0.372 for model I and model II respectively, which are significantly high and suggest the presence of cross-sectional dependence. It should certainly come under consideration in the estimation process, since it may mean that the error terms of panels are correlated.
We tested the stationary properties of the variables using the panel unit root test by the methods of Levin et al. [70], Im et al. [71], and Fisher [72]. According to the results in Table A8 in the Appendix A, the unit root tests demonstrate that all the data series are stationary at level, except for lntemp_btm, lnHT_surf, and lnO2_btm. Also, all the data series are stationary after the first differences.
Other tests are related to the specification and estimation of the model and those results are shown in Table A9 in the Appendix A. Here, the first specification test is the F-test for pooled OLS against the fixed effects (FE) model. As the results show, the null hypothesis of pooled data is strongly rejected. According to the Breusch and Pagan LR for random effects (RE), the model specification is RE. At last, we tested for panel-level heteroskedasticity and autocorrelation. The results of the likelihood ratio test for heteroskedasticity, and the Wooldridge test for autocorrelation for both models clearly indicate that there is no autocorrelation problem, while both models are heteroskedastic. Taking all test results into account, the two models are estimated through the GLS method considering heteroskedasticity with cross-sectional correlation, and no autocorrelation.

5. Results

Table 1 shows the estimation results for both models: fish landed and landed values for Mediterranean countries in 2001–2018.
As can be seen in the second column of Table 1, Model I, all estimated coefficients are statistically significant. As expected, the estimated coefficients of the considered environmental variables are all negative in the first model in which the landed volume of fish is the dependent variable. This means that all considered environmental factors threaten fisheries, but with different severity. The highest absolute value of estimated elasticity belongs to sea surface salinity (lnSal_surf) followed by H+ ion concentration on the surface of the Mediterranean Sea, with similar elasticity amounts.
In essence, a 1% increase in surface salinity decreased the volume of fish landed by 5.35%. This affirms the risks of rising marine salinity for fisheries in the Mediterranean region, as discussed earlier. Estimated coefficients for temperature variables demonstrate that a 1% increase in sea surface temperature (lnSST) and temperature at the bottom of the Mediterranean Sea decreased the volume of fish landed by 3.12% and 0.91%, respectively. These outcomes are in line with other studies (e.g., [21,23,25]), and the estimated coefficients confirm the threatening effects of rising sea temperature due to global warming on the fisheries. The estimated coefficients for the two variables related to the H+ ion concentration (lnHT_surf and lnHT_btm) show that an increase in the H+ ion concentration on the surface and at the bottom of the Mediterranean Sea reduces the volume of fish landed by about 5.09% and 0.91%, respectively. These coefficients corroborate the negative influence of ocean acidification on fisheries. Altogether, these results are in line with our a priori expectations and strongly prove the risk of climate change for the fisheries in the Mediterranean region.
The estimated coefficient for lnISST demonstrates the positive but not strong impact of industrial fishing on the volume of fish landed in the region, so that a 1% increase in the ratio of the industrial to small-scale fisheries increased the volume of fish landed just by 0.16%. In addition, HDI influenced volumes positively, with about a 1.89% increase in fish landed due to a 1% rise in HDI. This shows the positive impact of adaptive capacity improvements on fisheries [13,14,15,16,17]. As expected, the relationship between the volume of fish landed and population has an inverse U shape. When the population grows, the volumes of fish landed increase at first, reach a peak and then decline as the population grows further. In other words, there is an optimum point for population and a higher population affects fisheries inversely. Finally, the urbanization rate and the changes in the urbanization rate both have negative effects on fisheries and might be considered as risks for the section. However, the impacts are weak and the estimated elasticity amounts are small. According to the estimation results, a 1% increase in the urbanization rate decreases the volume of fish landed by just 0.003%. Moreover, the elasticity of urbanization fluctuations is about −0.027. The landed value of fisheries in the Mediterranean countries is given in the last column of Table 1. Here, the estimated coefficients of lnSST and lnSal_surf are expectedly negative, indicating the negative impacts of sea surface temperature and salinity on the landed values of fisheries. Accordingly, a 1% increase in the sea surface temperature and salinity decreases landed values by 1.94% and 15.39%, respectively. Correspondingly, the reduction in fish landed values due to marine salinity is considerable. The other three environmental variables unexpectedly show negative effects on landed values in the region. Based on the estimation results, a 1% increase in temperature at the bottom of the Mediterranean Sea, and H+ ion concentration on the surface and at the bottom of the sea, pushes up landed values by approximately 3.52%, 3.67%, and 12.37%, respectively. We note that landed fish values depend on supply and demand and therefore scarcity of the quantity landed will have positive effects on increasing prices.
Similar to the results for the fish landed, industrial fisheries have positively affected landed values in the region (with higher elasticity: 0.36 compared to 0.16). Again, the impact of HDI as an index of adaptive capacity for the countries in the study is positive on landed values. The estimated elasticity indicates a 11.91% rise in landed values by a 1% increase in HDI and this elasticity is about six times more than the elasticity on landed volume. For population, the estimated result is similar to that from the first model and again specifies an inverse U-shaped relationship between landed values and population. Thus, the higher population would increase the vulnerability of fisheries’ revenues. Furthermore, according to the results, urbanization has influenced landed values negatively, while the changes in urbanization rate show a positive relationship with landed values.
Using the elasticity coefficients estimated above, we can forecast the impact of climate change and other changes on fisheries. Table 2 shows the impact of changes in environmental variables due to climate change on fisheries. The predictions for environmental variables are based on two IPCC scenarios: RCP 2.6 (low GHG emission scenario) and RCP 8.5 (high GHG emission scenario). The changes have been calculated for the two time periods: 2020–2050 and 2020–2100.
It is obvious that changes under RCP 8.5 are mostly higher than changes under RCP 2.6. Among environmental variables, the highest changes would occur in H+ ion concentration on the surface, which would be increased by more than 75% by 2100 under the RCP 8.5 scenario. Predictions for sea temperature at the bottom and on the surface show fairly moderate increases under two scenarios. According to predictions, the smallest changes would be for salinity on the surface of the Mediterranean Sea, so that the maximum change would be 0.43% by 2100.
It should be noticed that changes in fisheries’ variables are calculated on the assumption that non-environmental variables are constant. In other words, these changes are actually net changes in fisheries due to climate change only, ceteris paribus. According to the predicted changes for fisheries’ variables that are calculated based on the estimated coefficients, the volume of fish landed in the Mediterranean would decrease by about 78% by 2050 and 84% by 2100 under the RCP 2.6 scenario due to climate change, ceteris paribus. Under the RCP 8.5 scenario, fisheries can be completely destroyed, again assuming that non-environmental factors are constant. Concerning the landed values, the results indicate a plausible increase. However, looking at the predictions for the volume of fish landed, the predictions for landed values under the RCP 8.5 scenario are not readily interpretable. In conclusion, changes in environmental variables due to climate change will extremely threaten the fisheries sector. If the Mediterranean countries do not plan to protect fisheries, climate change will cause untold damage.

6. Discussion

Generally speaking, the estimated results for environmental variables differ between the landed quantity and values from the two estimated models. Concerning the environmental variables, the impacts on the volume of fish landed are expectedly negative, but for landed values, some results were not predictable, and the difference can be explained by the impact of the considered variables on prices. Simultaneously, negative effects of temperature at the bottom of the sea and H+ ion concentration on the surface and at the bottom of the sea on volumes of fish landed, and positive impacts of the same variables on landed values might indicate that they have influenced fish prices positively due to scarcity and daily auction prices and the effects on fish prices have been stronger than effects on volumes of fish landed.
The risks of climate change for different regions and countries vary according to the importance of the value of fisheries to their national economy and trade, the importance of fisheries for employment and food security [73]. Factors, such as the contribution of the fisheries sector and fisheries exports, the number of fishers and seafood consumption, vary from one Mediterranean country to another. Linking these factors together, it has been observed that the sector as a whole for the Mediterranean countries represented only a small part of the primary sector and of GDP (Table A1). However, these results did not take into account the indirect and induced economic impacts and linkages of associated industries and services. For the Southern Mediterranean countries and in general for the least developed countries, fishing and associated sectors contribute more to GDP. In Morocco, the fishing sector contributes 2.3% to the country’s GDP. In fact, the economic impact of fishing goes beyond yields and has a direct, indirect and induced economic effect. The true value of fishing was also estimated based on the many jobs it produces (Table A2). FAO estimates that for every person employed in the primary sector of fisheries or aquaculture, four jobs are created in the secondary sector [27]. The results indicated that there is greater social and economic importance of fishing, especially for coastal communities where it is the main socio-economic activity [1,74]. Regarding international trade, net exporting countries such as Morocco, whose marine fisheries production accounts for a large proportion of total domestic fish production, could be more sensitive to climate change implications for the fisheries sector than other coastal states. When considering seafood consumption (Table A3), countries such as Turkey and Morocco could be less sensitive to climate change since they largely cover their seafood consumption by their fishing yield. Northern countries do not cover half of their consumption with their production, which makes them economically dependent on imports. It has been observed that fish consumption has increased throughout the Mediterranean and particularly strongly in the Southern and Eastern Mediterranean countries. This increase can be attributed to population and income growth [40,75]). This total consumption is expected to increase, and the greatest increase is expected in the Southern and Eastern Mediterranean countries due to population growth [75]. Despite the observed decline in fishing, the demand for consumption and production of seafood products will have to be met. We showed that only the countries of the South were net exporters and that they were able to cover their consumption through their seafood production. The opposite trend was observed for the other countries that turned to imports to cover their demand. This growing demand is attributed to rising incomes and population growth rather than to trade agreements between Mediterranean countries [75]. This can be explained by the fact that the Northern countries and, in general, the more developed countries import more than the others because there are strict requirements in terms of food quality and safety in developed countries. For example, Egypt, which is one of the dominant producers of fishery products, destines the majority of its products to its domestic market. The poorer countries are unable to keep the products fresh and meet these requirements and therefore cannot fully exploit their duty-free access to the EU market [40].

7. Conclusions, Policy Implication and Future Research

Using our GLS model estimated elasticities and then forecasting the quantify of fish landed and value changes with two IPCC RCP 2.6 and RCP 8.5 scenarios for 2020–2050 and 2020–2100 gave us very dire pictures of the future. These future predictions did not involve the worsening of economic variables, which could even shorten the time periods if non-environmental factors deteriorated over time.
Moreover, the effects of climate change in the Mediterranean basin are asymmetric between developing countries, mostly located in the Southern and Eastern Mediterranean countries that suffer the consequences of climate change with greater effects compared to developed ones. The climate justice concept takes into account the socio-economic context in which climate change is occurring, and it is an added challenge when a country is already facing structural issues of high poverty rate, weak infrastructure and social services, critical demographic changes, high unemployment, economic informality and emigration, political instability, corruption and spatial inequality with fast urbanization [76].
In the Northern and Western parts of the Mediterranean, the situation is heterogeneous, but the historical responsibility for greenhouse emissions since the Industrial Revolution is objectively higher than in Southern and Eastern parts. All Mediterranean countries are nevertheless facing cross-cutting common issues, such as biodiversity preservation, sustainable development of tourism, commercial links related to food production and consumption, stock of fishes, blue carbon, energy production, political stability, migrations and security. Their interests are linked, because they share a common resource. To prevent environmental and social imbalances linked to climate change, it will be necessary for the governments of Mediterranean countries to jointly define strategies for adaptation and mitigation. The climate justice concept is, then, relevant to promote policies implemented in a coordinated manner by all the countries involved in the Mediterranean basin to comply with the Paris agreement. It would be difficult to achieve the objectives of national contributions without such coordination [77].
We did not consider either the species migration or the food web effects of interconnected and overlapping food chains, which are topics for future research. In addition, we did not study the impacts of the considered factors on different species. Although this is a fundamentally important subject, it goes beyond the goal of the paper and is recommended for future studies. There are some studies that have paid attention to the subject (see [23,25]). This paper is the first step in a broader project where we will modify the Blasiak vulnerability index [14] by replacing the “projected SST increase” by the expected modifications of the probability of presence of the species. The advantage is that this makes it possible to couple the environmental aspects, including species migration and food web effects, with the economic part of the project. In addition, this makes it possible to take into account not only the expected average temperature variations but also the variations in other environmental parameters (annual temperature variability, salinity, primary production, etc.) as well as the preferences of species toward these settings.

Author Contributions

Study conceptualization, N.H., M.C. and A.S.; methodology, S.F.; data collection, V.W.Y.L., J.G. and S.F.; supervision, N.H. and M.C. All authors have written and revised the text of this paper. All authors have read and agreed to the published version of the manuscript.

Funding

This research received no external funding.

Informed Consent Statement

Not applicable.

Data Availability Statement

Fisheries data, [63,78,79], are available at: http://www.seaaroundus.org/data/#/feru (accessed on 5 June 2021); www.fao.org/fishery/statistics/global-commodities-production/query/en (accessed on 5 June 2021); http://www.fao.org/fishery/statistics/software/fishstatj/en. (accessed on 5 June 2021); Also, Environmental data, [64], are available at: https://gmd.copernicus.org/articles/9/1937/2016/. HDI data, [65] have been retrieved from: http://hdr.undp.org/en/data (accessed on 27 January 2021). Besides, population data, [66] are available at: https://population.un.org/wpp/Download/Standard/Population/ (accessed on 5 June 2021).

Conflicts of Interest

The authors declare no conflict of interest.

Appendix A

Figure A1. Trends in capture fisheries and aquaculture production for the Mediterranean Sea and the Black Sea between 1970 and 2017 [78,79].
Sustainability 13 10670 g0a1
Figure A2. Trends in capture fisheries and aquaculture production for Mediterranean countries, by regions, in the Mediterranean Sea and the Black Sea between 1970 and 2017 [78,79].
Sustainability 13 10670 g0a2
Figure A3. Trends in landings in the Mediterranean, by year, 1970–2017.
Sustainability 13 10670 g0a3
Figure A4. Trends in landings in the Mediterranean by regions and by years, 1970–2017.
Sustainability 13 10670 g0a4
Figure A5. Countries contributing to at least 5% of total captures in the Mediterranean Sea, average landings in 2015–2017.
Sustainability 13 10670 g0a5
Figure A6. Landings by GFCM subregion and by species, average 2015–2017.
Sustainability 13 10670 g0a6
Figure A7. Production in tonnes of the major FAOStat groups, between 2007 and 2017, for Mediterranean countries at the national level [78,79].
Sustainability 13 10670 g0a7
Figure A8. Countries’ contribution to aquaculture in the Mediterranean Sea, in 2017 [78,79].
Sustainability 13 10670 g0a8
Figure A9. Main species produced contributing to the marine, brackish and freshwater aquaculture systems of the Mediterranean countries in 2017 [78,79].
Sustainability 13 10670 g0a9
Figure A10. Contributions of regions to employment in fisheries and aquaculture for Mediterranean countries.
Sustainability 13 10670 g0a10
Figure A11. Trends in apparent consumption for marine products in the Mediterranean, by year, 1961–2013 [78,79].
Sustainability 13 10670 g0a11
Figure A12. Apparent consumption (=total food supply) by group of species, by years, 1961–2013 [78,79].
Sustainability 13 10670 g0a12
Figure A13. Standardized trade balance for quantity in 2017 [78,79].
Sustainability 13 10670 g0a13
Figure A14. Standardized trade balance for the subregion, for quantity in 2017 [78,79].
Sustainability 13 10670 g0a14
Figure A15. Standardized trade balance for the value in 2017 [78,79].
Sustainability 13 10670 g0a15
Table A1. Socio-economic indicator for Mediterranean countries [80].
CountryHuman Development Index in 2018GDP per Capita in 2018 (Current USD)
Albania07915268.8
Bosnia and Herzegovina07696065.7
Croatia083714,909.7
France089141,463.6
Greece087220,324.3
Italy088334,483.2
Malta088530,098.3
MonacoNA185,741.3
Montenegro08168844.2
Slovenia090226,124
Spain089330,370.9
NORTHERN COUNTRIES’ average085436,699
Algeria07594114.7
Egypt07002549.1
Libya07087241.7
Morocco06763237.9
Tunisia07393447.5
SOUTHERN COUNTRIES’ average07164118.2
Cyprus087328,159.3
Israel090641,715
Lebanon07308,269.8
Palestine, Occupied Tr.06903198.9
Syrian Arab Republic05492032.6
Turkey08079370.2
EASTERN COUNTRIES’ average075915,457.6
World073111,312.4
Table A2. Employment in the fishing and aquaculture sector for Mediterranean countries (in thousands).
FishingAquacultureEmployment in Fishing and Aquaculture
Albania (1)22504002650
Bosnia and Herzegovina (2)--1200
Croatia (2)207111173188
France (2)5951911415,064
Greece (2)24,759464029,399
Italy (2)21,077169522,772
Malta (2)811153964
Montenegro (2)-150150
Slovenia (2)751994
Spain (2)29,322594635,268
Algeria (1)4500-4500
Egypt (3)18,00068,00086,000
Libya (4)50,60348051,083
Morocco (5)--17,000
Tunisia (6)46,218135247,570
Cyprus (2)7623411103
Israel (7)1500-1500
Lebanon (8)85008009300
Palestine (9)3300-3300
Syrian Arab Republic (10)10,00039110,391
Turkey (10)31,84210,50042,342
Grand total261,541105,097366,638
1 FCP (2014). 2 Eurostat (2015) for employment in fishing and Eurostat (2014) for employment in aquaculture. 3 FCP 2008 for employment in fishing and NASO (2003–2012) for employment in aquaculture. 4 FCP (2019). 5 FCP (2017). 6 FCP (2017). 7 FCP (2015). 8 FCP (2005). 9 FCP (2008). 10 FCP (2007).
Table A3. Comparison of apparent consumption of marine products and total yields (from fisheries and aquaculture) by Mediterranean country in 2013 [78,79].
CountryTotal Estimated Consumption 2013 (t)Population 2013 (thousands)Per Capita Consumption 2013 (kg per capita)Total Marine Produce Yield 2013 (tonnes)Yield to Consumption Ratio 2013
Albania15,458.3131734.912,673.582%
Bosnia and Herzegovina16,394.638294.33228.520%
Croatia81,795.15429019.187,850.24107%
France2,156,636.976,429133.5740,563.234%
Greece214,709.0511,12819.3178,171.0583%
Italy1,555,982.6860,99025.5318,793.720%
Malta13,980.2342932.6762255%
Monaco138NA1NA
Montenegro7623.9662112.32391.531%
Slovenia21,864.25207210.61625.927%
Spain1,991,842.0146,92742.41,212,433.0461%
NORTHERN COUNTRIES6,076,288.21197,788.0030.72,565,353.6542%
Algeria158,775.4339,2084.0103,249.8865%
Egypt1,814,763.3382,05622.11,454,40280%
Libya140,086.69620222.636,01426%
Morocco596,617.7133,00818.11,260,688.7211%
Tunisia149,735.1110,99713.6120,893.781%
SOUTHERN COUNTRIES2,859,978.27171,471.0016.72,975,248.28104%
Cyprus25,016.3114121.96522.126%
Israel179,789.7773323.224,234.613%
Lebanon54,750.65482211.442808%
Palestine, Occupied Tr.7970.1843261.8221428%
Syrian Arab Republic53,546.1621,8982.4880016%
Turkey455,375.9974,9336.1607,991.6134%
EASTERN COUNTRIES776,448.98114,853.006.8654,042.384%
Totals9,712,715.46484,112.0054.26,194,644.2364%
Table A4. Descriptive statistics of the regression variables.
VariablesDefinitionUnitSourceObs.MeanStd. Dev.MinMaxSkewnessKurtosis
FLTfish landed volumetonnes (10 thousand)[63]3788.02611.1410.00650.1851.7935.485
LVLanded ValueUSD (billions)[63]3782.5114.5500.00022.7102.0926.652
SSTSea surface temperature°C[64]37819.9211.50116.36722.995−0.1062.362
Temp_btmSea bottom temperature°C[64]37813.1851.8905.17315.299−3.52115.314
HT_surfH+ ion concentration on the surfacemol m−3[64]3780.5460.0190.5000.6010.1113.016
HT_bomH+ ion concentration at the bottommol m−3[64]3780.7040.0500.5930.815−0.0592.531
O2_surfSurface oxygenmol m−3[64]3780.2340.0080.2200.2590.6363.284
O2_btmBottom oxygenmol m−3[64]3780.1520.0290.1040.2190.3872.380
Sal_surfSurface salinityPSU[64]37836.7540.95132.95138.023−2.0528.052
Sal_btmBottom salinityPSU[64]37837.8220.66735.23438.364−2.75610.875
ISSTIndustrial to small-scaletonnes[63]3782.6723.7630.00025.6192.83813.070
HDIHuman Development Index [65]3780.7750.0930.5280.916−0.3882.179
PopTotal population(millions)[65]37822.34626.2170.39698.4241.1142.885
UPUrbanization Rate%[66]37867.65314.26442.43594.6120.0492.193
UPGChanges in urbanization rate%[66]3781.3881.375−6.5156.744−0.86610.239
Table A5. Correlation coefficients for regression variables.
lnFLTlnSSTlnTemp_botlnTH_surflnHT_bomlnSal_surflnISSTlnHDIlnPoplnPop2UPUPGlnLV
lnFLT1.000
lnSST0.0901 *1.000
lnTemp_bot−0.145 **0.107 **1.000
lnTH_surf0.337 ***0.271 ***−0.324 ***1.000
lnHT_bom0.274 ***−0.145 **−0.488 ***0.418 ***1.000
lnSal_surf0.235 ***0.643 ***0.198 ***0.050−0.296 ***1.000
lnISST0.500 ***−0.049−0.010−0.200 ***0.029−0.089 *1.000
lnHDI0.0004−0.327 ***0.333 ***0.0380.136 **−0.158 **0.174 ***1.000
lnPop0.674 ***0.051−0.223 ***0.217 ***0.325 ***0.114 **0.069−0.226 ***1.000
lnPop20.681 ***0.041−0.223 ***0.222 ***0.336 ***0.123 **0.093 *−0.209 ***0.996 ***1.000
UP0.209 ***0.386 ***0.162 **0.259 ***−0.0270.357 ***0.123 **0.478 ***−0.123 **−0.114 **1.000
UPG0.125 **0.409 ***−0.084 *0.090 *0.0420.142 **−0.049−0.199 ***0.110 **0.109 **0.235 ***1.000
lnLV0.968 ***0.072−0.255 ***0.352 ***0.298 ***0.212 ***0.535 ***−0.0440.626 ***0.640 ***0.202 ***0.128 **1.000
Note: ***, **, and * denote statistical significance at the 1%, 5%, and 10% significance levels, respectively. Source: Authors computations.
Table A6. VIF test results.
All Variables IncludedOmitting Correlated Variables
VariableVIF1/VIFVariableVIF1/VIF
lnO2_surf172.950.006lnHDI3.400.294
lnSST138.840007lnSST3.370.296
lnSal_btm35.100.029UP2.700.371
lnO2_btm28.090.036lnSal_surf2.170.460
lnTemp_btm16.970.059lnHT_btm2.080.479
lnHT_btm14.840.067lnTemp_btm2.060.486
lnSal_surf7.910.126lnHT_surf1.670.599
lnHDI3.890.257lnPop1.380.727
lnHT_surf3.300.303UPG1.370.732
UP3.210.312lnISST1.120.895
lnPop1.690.591
UPG1.400.715
lnISST1.250.803
Mean VIF33.03 Mean VIF2.13
Source: Authors’ computations.
Table A7. Cross-sectional dependence test results.
Frees’ Test of Cross-Sectional IndependenceCritical Values from Frees’ Q Distribution
Model I1.923alpha = 0.10:0.1438
Model II2.689alpha = 0.05:0.1888
alpha = 0.01:0.2763
Average absolute value of the off-diagonal elements in Model I: 0.329
Average absolute value of the off-diagonal elements in Model II: 0.372
Source: Authors computations.
Table A8. Panel unit root test results.
VariablesLevelFirst Difference
Levin, Liu and ChuIm, Pesaran and ShinADF-FisherLevin, Liu and ChuIm, Pesaran and ShinADF-Fisher
lnFLT−2.423 **−0.42660.831 **−6.631 ***−8.926 ***156.804 ***
lnLV−2.151 **−0.74251.470−11.089 ***−10.004 ***172.596 ***
lnSST−4.760 ***−4.467 ***98.262 ***−10.783 ***−14.458 ***247.054 ***
lnTemp_btm−1.823 **−3.712 ***114.107 ***−6.254 ***−8.313 ***145.733 ***
lnHT_surf1.1676.9123.828−12.626 ***−13.164 ***228.422 ***
lnHT_btm2.636.73514.921−9.378 ***−9.157 ***159.447 ***
lnO2_surf−5.455 ***−4.931 ***114.02 6 ***−11.673 ***−13.089 ***225.162 ***
lnO2_btm1.0821.77435.860−7.236 ***−9.052 ***158.379 ***
lnSal_surf−2.361 ***−2.517 **84.135 ***−11.450 ***−9.994 ***174.836 ***
lnSal_btm−1.586 **−0.42535.648−7.488 ***−7.156 ***126.874 ***
lnISST−1.602 **−1.912 **93.686 ***−10.364 ***−9.938 ***173.557 ***
lnHDI−6.537 ***−2.004 **103.958 ***−5.875 ***−4.354 ***87.186 ***
lnPop−6.231 ***9.075196.501 ***−15.420 ***−18.764 ***254.237 ***
lnPop2−6.278 ***9.438190.868 ***−15.736 ***−19.213 ***252.417 ***
UP−0.13810.248326.098 ***−8.371 ***−6.134 ***72.4789 **
UPG−10.92 ***0.187136.60 ***−6.146 ***−7.375 ***136.107 ***
Note: *** and ** denote statistical significance at 1%, and 5% significance levels, respectively. Source: Authors’ computations.
Table A9. Specification test results.
Model IModel II
F-test218.86109.89
(0.000)(0.000)
Hausman testχ2 = 9.90χ2 = 62.20
(prob. = 0.476)(prob. = 0.000)
Breusch and Pagan LR for RE χ ¯ 2 = 2486.20 χ ¯ 2 = 2486.20
(prob. = 0.000)(prob. = 0.000)
Likelihood ratio test for heteroskedasticityχ2 = 522.00χ2 = 493.09
(prob. = 0.000)(prob. = 0.000)
Wooldridge test for autocorrelationF = 0.170F = 0.313
(prob. = 0.685)(prob. = 0.582)
No. of observations378378
Source: Authors’ computations.

References

  1. World Bank. World Development Indicators. Available online: https://databank.worldbank.org/reports.aspx?source=2&series=SP.POP.TOTL&country=BIH,TUR,ESP,FRA,MCO,ITA,SVN,HRV,MNE,ALB,GRC,MAR,DZA,TUN,LBY,EGY,SYR,LBN,ISR,CYP,PSE# (accessed on 22 May 2020).
  2. Jones, A.L.; Phillips, M. Global Climate Change and Coastal Tourism: Recognizing Problems, Managing Solutions and Future Expectations; CABI: Wallingford, UK, 2017. [Google Scholar]
  3. Broodbank, C. The Origins and Early Development of Mediterranean Maritime Activity. J. Mediterr. Archaeol. 2006, 19. [Google Scholar] [CrossRef]
  4. Coll, M.; Piroddi, C.; Steenbeek, J.; Kaschner, K.; Lasram, F.B.R.; Aguzzi, J.; Ballesteros, E.; Bianchi, C.N.; Corbera, J.; Dailianis, T.; et al. The Biodiversity of the Mediterranean Sea: Estimates, Patterns, and Threats. PLoS ONE 2010, 5, e11842. [Google Scholar] [CrossRef] [Green Version]
  5. Giorgi, F.; Lionello, P. Climate change projections for the Mediterranean region. Glob. Planet. Chang. 2008, 63, 90–104. [Google Scholar] [CrossRef]
  6. Lejeusne, C.; Chevaldonné, P.; Pergent-Martini, C.; Boudouresque, C.F.; Pérez, T. Climate change effects on a miniature ocean: The highly diverse, highly impacted Mediterranean Sea. Trends Ecol. Evol. 2010, 25, 250–260. [Google Scholar] [CrossRef] [PubMed]
  7. Micheli, F.; Halpern, B.S.; Walbridge, S.; Ciriaco, S.; Ferretti, F.; Fraschetti, S.; Lewison, R.; Nykjaer, L.; Rosenberg, A.A. Cumulative Human Impacts on Mediterranean and Black Sea Marine Ecosystems: Assessing Current Pressures and Opportunities. PLoS ONE 2013, 8, e79889. [Google Scholar] [CrossRef] [Green Version]
  8. Adloff, F.; Somot, S.; Sevault, F.; Jorda, G.; Aznar, R.; Déqué, M.; Herrmann, M.; Marcos, M.; Dubois, C.; Padorno, E.; et al. Mediterranean Sea response to climate change in an ensemble of twenty first century scenarios. Clim. Dyn. 2015, 45, 2775–2802. [Google Scholar] [CrossRef]
  9. Bridging the Gap between Ocean Acidification Impacts and Economic Valuation: Regional Impacts of Ocean Acidification on Fisheries and Aquaculture. Available online: https://www.patrinum.ch/record/177560 (accessed on 5 June 2021).
  10. Rodrigues, L.C.; Bergh, J.C.V.D.; Ghermandi, A. Socio-economic impacts of ocean acidification in the Mediterranean Sea. Mar. Policy 2013, 38, 447–456. [Google Scholar] [CrossRef]
  11. Bolle, H.-J. (Ed.) Mediterranean Climate: Variability and Trends; Springer Science & Business Media: Berlin, Germany, 2012. [Google Scholar]
  12. Sacchi, J. Analysis of Economic Activities in the Mediterranean: Fishery and Aquaculture Sectors; Plan Bleu: Valbonne, France, 2011. [Google Scholar]
  13. Allison, E.; Perry, A.L.; Badjeck, M.-C.; Adger, W.N.; Brown, K.; Conway, D.; Halls, A.S.; Pilling, G.M.; Reynolds, J.D.; Andrew, N.; et al. Vulnerability of national economies to the impacts of climate change on fisheries. Fish Fish. 2009, 10, 173–196. [Google Scholar] [CrossRef] [Green Version]
  14. Blasiak, R.; Spijkers, J.; Tokunaga, K.; Pittman, J.; Yagi, N.; Österblom, H. Climate change and marine fisheries: Least developed countries top global index of vulnerability. PLoS ONE 2017, 12, e0179632. [Google Scholar] [CrossRef]
  15. Wabnitz, C.C.C.; Lam, V.W.Y.; Reygondeau, G.; Teh, L.C.L.; Al-Abdulrazzak, D.; Khalfallah, M.; Pauly, D.; Palomares, M.L.D.; Zeller, D.; Cheung, W.W.L. Climate change impacts on marine biodiversity, fisheries and society in the Arabian Gulf. PLoS ONE 2018, 13, e0194537. [Google Scholar] [CrossRef] [Green Version]
  16. Thiault, L.; Mora, C.; Cinner, J.E.; Cheung, W.W.L.; Graham, N.A.J.; Januchowski-Hartley, F.A.; Mouillot, D.; Sumaila, U.R.; Claudet, J. Escaping the perfect storm of simultaneous climate change impacts on agriculture and marine fisheries. Sci. Adv. 2019, 5. [Google Scholar] [CrossRef] [Green Version]
  17. Wilson, T.J.B.; Cooley, S.R.; Tai, T.C.; Cheung, W.W.L.; Tyedmers, P.H. Potential socioeconomic impacts from ocean acidification and climate change effects on Atlantic Canadian fisheries. PLoS ONE 2020, 15, e0226544. [Google Scholar] [CrossRef]
  18. Pauly, D.; Watson, R. Background and interpretation of the ‘Marine Trophic Index’ as a measure of biodiversity. Philos. Trans. R. Soc. B Biol. Sci. 2005, 360, 415–423. [Google Scholar] [CrossRef] [Green Version]
  19. Baeta, F.; Costa, M.J.; Cabral, H. Changes in the trophic level of Portuguese landings and fish market price variation in the last decades. Fish. Res. 2009, 97, 216–222. [Google Scholar] [CrossRef]
  20. Munyandorero, J.; Guenther, C.B. A Six-Decade Portrait of Florida Marine Fisheries via Landings-Based Trophodynamic Indicators. N. Am. J. Fish. Manag. 2010, 30, 259–280. [Google Scholar] [CrossRef]
  21. Fu, C.; Large, S.; Knight, B.; Richardson, A.; Bundy, A.; Reygondeau, G.; Boldt, J.; van der Meeren, G.I.; Torres, M.A.; Sobrino, I.; et al. Relationships among fisheries exploitation, environmental conditions, and ecological indicators across a series of marine ecosystems. J. Mar. Syst. 2015, 148, 101–111. [Google Scholar] [CrossRef] [Green Version]
  22. Coll, M.; Shannon, L.; Kleisner, K.; Juan-Jordá, M.J.; Bundy, A.; Akoglu, A.; Banaru, D.; Boldt, J.; Borges, M.; Cook, A.; et al. Ecological indicators to capture the effects of fishing on biodiversity and conservation status of marine ecosystems. Ecol. Indic. 2016, 60, 947–962. [Google Scholar] [CrossRef] [Green Version]
  23. Fortibuoni, T.; Giovanardi, O.; Pranovi, F.; Raicevich, S.; Solidoro, C.; Libralato, S. Analysis of Long-Term Changes in a Mediterranean Marine Ecosystem Based on Fishery Landings. Front. Mar. Sci. 2017, 4. [Google Scholar] [CrossRef] [Green Version]
  24. Fu, C.; Xu, Y.; Grüss, A.; Bundy, A.; Shannon, L.; Heymans, J.J.; Halouani, G.; Akoglu, E.; Lynam, C.P.; Coll, M.; et al. Responses of ecological indicators to fishing pressure under environmental change: Exploring non-linearity and thresholds. ICES J. Mar. Sci. 2019, 77, 1516–1531. [Google Scholar] [CrossRef] [Green Version]
  25. Tzanatos, E.; Raitsos, D.E.; Triantafyllou, G.; Somarakis, S.; Tsonis, A.A. Indications of a climate effect on Mediterranean fisheries. Clim. Chang. 2013, 122, 41–54. [Google Scholar] [CrossRef]
  26. Hilmi, N.; Lafitte, A.; Allemand, D.; Ferrier-Pages, C.; Reynaud, S.; Tambuté, S.; Venn, A.; Cramer, W.; Guiot, J.; Gazeau, F.; et al. Regional Workshop on Human impacts on Mediterranean marine ecosystems and the economy. In Proceedings of the Musée océanographique de Monaco, Monaco, Monaco, 17–18 October 2017. [Google Scholar]
  27. FAO; The State of World Fisheries and Aquaculture (SOFIA). Food and Agriculture Organization, Rome. 2018. Available online: http://www.fao.org/state-of-fisheries-aquaculture/en/ (accessed on 5 June 2021).
  28. Kroeker, K.J.; Kordas, R.; Crim, R.; Hendriks, I.E.; Ramajo, L.; Singh, G.S.; Duarte, C.M.; Gattuso, J.-P. Impacts of ocean acidification on marine organisms: Quantifying sensitivities and interaction with warming. Glob. Chang. Biol. 2013, 19, 1884–1896. [Google Scholar] [CrossRef] [Green Version]
  29. Rodrigues, L.C.; Bergh, J.C.J.M.V.D.; Massa, F.; Theodorou, J.A.; Ziveri, P.; Gazeau, F. Sensitivity of Mediterranean Bivalve Mollusc Aquaculture to Climate Change, Ocean Acidification, and Other Environmental Pressures: Findings from a Producer Survey. J. Shellfish. Res. 2015, 34, 1161–1176. [Google Scholar] [CrossRef] [Green Version]
  30. Hidalgo, M.; Mihneva, V.; Vasconcellos, M.; Bernal, M. Climate change impacts, vulnerabilities and adaptations: Mediterranean Sea and the Black Sea marine fisheries. In Impacts of Climate Change on Fisheries and Aquaculture; FAO: Rome, Italy, 2018; p. 139. [Google Scholar]
  31. Boero, F.; Féral, J.-P.; Azzurro, E.; Cardin, V.; Riedel, B.; Despalatovic, M.; Munda, I.; Moschella’s, P.; Zaouali, J.; Fonda-Umani, S.; et al. Climate warming and related changes in Mediterranean marine biota. In CIESM Workshop Monographs; CIESM: Monaco, Monaco, 2009; Volume 35, pp. 5–21. [Google Scholar]
  32. Bianchi, C.N. Biodiversity issues for the forthcoming tropical Mediterranean Sea. In Biodiversity in Enclosed Seas and Artificial Marine Habitats; Relini, G., Ryland, J., Eds.; Springer: Dordrecht, The Netherlands, 2007; Volume 193. [Google Scholar] [CrossRef]
  33. Galil, B.S. Loss or gain? Invasive aliens and biodiversity in the Mediterranean Sea. Mar. Pollut. Bull. 2007, 55, 314–322. [Google Scholar] [CrossRef] [PubMed]
  34. Occhipinti-Ambrogi, A. Global change and marine communities: Alien species and climate change. Mar. Pollut. Bull. 2007, 55, 342–352. [Google Scholar] [CrossRef] [PubMed]
  35. Cheung, W.W.L.; Pauly, D. Impacts and effects of ocean warming on marine fishes. In Explaining Ocean Warming: Causes, Scale, Effects and Consequences; Laffoley, D., Baxter, J.M., Eds.; IUCN: Gland, Switzerland, 2016; pp. 239–253. [Google Scholar]
  36. Van Rijn, I.; Buba, Y.; Delong, J.; Kiflawi, M.; Belmaker, J. Large but uneven reduction in fish size across species in relation to changing sea temperatures. Glob. Chang. Biol. 2017, 23, 3667–3674. [Google Scholar] [CrossRef] [PubMed] [Green Version]
  37. Macias, D.M.; Garcia-Gorriz, E.; Stips, A. Productivity changes in the Mediterranean Sea for the twenty-first century in response to changes in the regional atmospheric forcing. Front. Mar. Sci. 2015, 2, 79. [Google Scholar] [CrossRef] [Green Version]
  38. Erdogan, N.; Duzgunes, E.; Ogut, H. Black Sea fisheries and climate change. In CIESM Workshop Monographs; CIESM: Monaco, Monaco, 2009. [Google Scholar]
  39. Hattab, T.; Albouy, C.; Lasram, F.B.R.; Somot, S.; Le Loc’H, F.; Leprieur, F. Towards a better understanding of potential impacts of climate change on marine species distribution: A multiscale modelling approach. Glob. Ecol. Biogeogr. 2014, 23, 1417–1429. [Google Scholar] [CrossRef]
  40. Hilmi, N.; Allemand, D.; Cinar, M.; Cooley, S.; Hall-Spencer, J.M.; Haraldsson, G.; Hattam, C.; Jeffree, R.A.; Orr, J.C.; Rehdanz, K.; et al. Exposure of Mediterranean Countries to Ocean Acidification. Water 2014, 6, 1719–1744. [Google Scholar] [CrossRef] [Green Version]
  41. CIESM, Impacts of Acidification on Biological, Chemical and Physical Systems in the Mediterranean and Black Seas. N° 36 in CIESM Workshop Monographs; Briand, F. (Ed.) CIESM: Monaco, Monaco, 2008; 124p. [Google Scholar]
  42. Cooley, S.R.; Lucey, N.; Kite-Powell, H.; Doney, S.C. Nutrition and income from molluscs today imply vulnerability to ocean acidification tomorrow. Fish Fish. 2011, 13, 182–215. [Google Scholar] [CrossRef] [Green Version]
  43. Lacoue-Labarthe, T.; Nunes, P.A.; Ziveri, P.; Cinar, M.; Gazeau, F.; Hall-Spencer, J.; Hilmi, N.; Moschella, P.; Safa, A.; Sauzade, D.; et al. Impacts of ocean acidification in a warming Mediterranean Sea: An overview. Reg. Stud. Mar. Sci. 2016, 5, 1–11. [Google Scholar] [CrossRef] [Green Version]
  44. Brander, K.; Cochrane, K.; Barange, M.; Soto, D. Climate Change Implications for Fisheries and Aquaculture. In Climate Change Impacts on Fisheries and Aquaculture; John Wiley & Sons: Hoboken, NJ, USA, 2017; pp. 45–62. [Google Scholar] [CrossRef]
  45. Cochrane, K.; De Young, C.; Soto, D.; Bahri, T. (Eds.) Climate Change Implications for Fisheries and Aquaculture: Overview of Current Scientific Knowledge; FAO Fisheries and Aquaculture Technical Paper No. 530; FAO: Rome, Italy, 2009; 212p, Available online: http://www.fao.org/docrep/012/i0994e/i0994e00.htm (accessed on 5 June 2021).
  46. Boero, F. Adriatic ecological history: A link between jellyfish outbreaks, red tides, mass mortalities, overfishing, mucilages, and tha-liacean plankton. In Proceedings of the CIESM Workshop Series. 14, Gelatinous Zooplankton Outbreaks: Theory and Practice, Naples, Italy, 29 August–1 September 2001; pp. 55–57. [Google Scholar]
  47. Dale, B.; Edwards, M.; Reid, P.C. Climate Change and Harmful Algal Blooms. In Ecological Studies; Springer: Berlin/Heidelberg, Germany, 2006; pp. 367–378. [Google Scholar]
  48. Hinder, S.L.; Hays, G.; Edwards, M.; Roberts, E.C.; Walne, A.W.; Gravenor, M.B. Changes in marine dinoflagellate and diatom abundance under climate change. Nat. Clim. Chang. 2012, 2, 271–275. [Google Scholar] [CrossRef]
  49. Rosa, R.; Marques, A.; Nunes, M.L. Impact of climate change in Mediterranean aquaculture. Rev. Aquac. 2012, 4, 163–177. [Google Scholar] [CrossRef]
  50. Chopin, T. Integrated Multi-Trophic Aquaculture. What it is and why you should care. And don’t confuse it with polyculture. North. Aquac. 2006, 12, 4. [Google Scholar]
  51. Kelleher, K.; Failler, P.; Gilles, B.; McGaughey, L.; Laffoley, D.; Parker, L.; Pecl, G.; Turley, C.; Warnau, M. Bridging the Gap Between Ocean Acidification Impacts and Economic Valuation: Regional Impacts of Ocean Acidification on Fisheries and Aquaculture. Re-gional Impacts of Ocean Acidification on Fisheries and Aquaculture: The Southern Ocean and South Pacific Region; IUCN: Gland, Switzerland, 2015; pp. 29–47. [Google Scholar]
  52. Fezzardi, D.; Massa, F.; Àvila-Zaragoza, P.; Rad, F.; Yücel-Gier, G.; Deniz, H.; Hadj Ali Salem, M.; Auadh Hamza, H.; Ben Salem, S. Indicators for sustainable aquaculture in Mediterranean and Black Sea countries: Guide for the use of indicators to monitor sus-tainable development of aquaculture. In General Fisheries Commission for the Mediterranean. Studies and Reviews; FAO: Rome, Italy, 2013; No. 93. [Google Scholar]
  53. Sanchez-Jerez, P.; Karakassis, I.; Massa, F.; Fezzardi, D.; Aguilar-Manjarrez, J.; Soto, D.; Chapela, R.; Avila, P.; Macias, J.C.; Tomassetti, P.; et al. Aquaculture’s struggle for space: The need for coastal spatial planning and the potential benefits of Allocated Zones for Aquaculture (AZAs) to avoid conflict and promote sustainability. Aquac. Environ. Interact. 2016, 8, 41–54. [Google Scholar] [CrossRef] [Green Version]
  54. GRID-Arendal. Population Density and Urban Centers in the Mediterranean Basin. 2013. Available online: https://www.grida.no/resources/5900 (accessed on 5 June 2021).
  55. Doignon, Y. Demographic Ageing in the Mediterranean: The End of the Spatial Dichotomy between the Shores? Spat. Demogr. 2019, 8, 85–117. [Google Scholar] [CrossRef]
  56. European Union. Fisheries Cooperation in the Mediterranean and the Black Sea. Publications Office of the European. Available online: http://op.europa.eu/en/publication-detail/-/publication/323a30ca-df48-4511-acff-282fc6b367f1/language-en (accessed on 14 April 2014).
  57. Cramer, W.; Guiot, J.; Fader, M.; Garrabou, J.; Gattuso, J.-P.; Iglesias, A.; Lange, M.A.; Lionello, P.; Llasat, M.C.; Paz, S.; et al. Climate change and interconnected risks to sustainable development in the Mediterranean. Nat. Clim. Chang. 2018, 8, 972–980. [Google Scholar] [CrossRef] [Green Version]
  58. Lleonart, J.; Lloret, J.; Touzeau, S.; Salat, J.; Recasens, L.; Sardà, F.; Fromentin, J.M.; Levi, D.; Stergiou, K.I.; Tudela, S. Mediterranean fisheries, an overview. In Proceedings of the II SAP Meeting, Barcelona, Spain, 13–17 October 1998. [Google Scholar]
  59. Pauly, D.; Zeller, D. Catch reconstructions reveal that global marine fisheries catches are higher than reported and declining. Nat. Commun. 2016, 7, 10244. [Google Scholar] [CrossRef]
  60. Turkish Statistical Institute. Fisheries Statistics; Turkish Statistical Institute: Ankara, Turkey, 2010; 73p. [Google Scholar]
  61. FAO. The State of Mediterranean and Black Sea Fisheries. General Fisheries Commission for the Mediterranean. Rome. 172p. Licence: CC BY-NC-SA 3.0 IGO. 2018. Available online: http://www.fao.org/publications/card/en/c/CA2702EN (accessed on 5 June 2021).
  62. FAO. The State of Mediterranean and Black Sea Fisheries. General Fisheries Commission for the Mediterranean. Rome, Italy, 2016. Available online: www.fao.org/3/a-i5496e.pdf (accessed on 5 June 2021).
  63. Sea around US. Global Fisheries Economics. 2020. Available online: http://www.seaaroundus.org/data/#/feru (accessed on 5 June 2021).
  64. Eyring, V.; Bony, S.; Meehl, G.A.; Senior, C.A.; Stevens, B.; Stouffer, R.J.; Taylor, K.E. Overview of the Coupled Model Intercomparison Project Phase 6 (CMIP6) experimental design and organization. Geosci. Model Dev. 2016, 9, 1937–1958. [Google Scholar] [CrossRef] [Green Version]
  65. United Nations Development Programme. Human Development Data Center. Available online: http://hdr.undp.org/en/data (accessed on 27 January 2021).
  66. United Nations. Department of Economic and Social Affairs, Population Division. World Population Prospects 2019: Data Booklet (ST/ESA/SER.A/424). Available online: http://www.europeanmigrationlaw.eu/documents/UN-WorldPopulationProspects2019-Databooklet.pdf (accessed on 5 June 2021).
  67. Frees, E.W. Longitudinal and Panel Data: Analysis and Applications in the Social Sciences; Cambridge University Press: Cambridge, UK, 2004. [Google Scholar]
  68. Frees, E.W. Assessing cross-sectional correlation in panel data. J. Econ. 1995, 69, 393–414. [Google Scholar] [CrossRef]
  69. Ditzen, J. Estimating Dynamic Common-Correlated Effects in Stata. Stata J. Promot. Commun. Stat. Stata 2018, 18, 585–617. [Google Scholar] [CrossRef]
  70. Levin, A.; Lin, C.-F.; Chu, C.-S.J. Unit root tests in panel data: Asymptotic and finite-sample properties. J. Econ. 2002, 108, 1–24. [Google Scholar] [CrossRef]
  71. Im, K.S.; Pesaran, M.; Shin, Y. Testing for unit roots in heterogeneous panels. J. Econ. 2003, 115, 53–74. [Google Scholar] [CrossRef]
  72. Choi, I. Unit root tests for panel data. J. Int. Money Financ. 2001, 20, 249–272. [Google Scholar] [CrossRef]
  73. Ding, Q.; Chen, X.; Hilborn, R.; Chen, Y. Vulnerability to impacts of climate change on marine fisheries and food security. Mar. Policy 2017, 83, 55–61. [Google Scholar] [CrossRef]
  74. Dyck, A.J.; Sumaila, U.R. Economic impact of ocean fish populations in the global fishery. J. Bioeconomics 2010, 12, 227–243. [Google Scholar] [CrossRef]
  75. Malvarosa, L.; De Young, C. Fish Trade among Mediterranean Countries: Intraregional Trade and Import–Export with the European Union. Studies and Reviews; General Fisheries Commission for the Mediterranean. No. 86; FAO: Rome, Italy, 2010; 93p. [Google Scholar]
  76. Moneer, A. Rethinking the response to climate change threats in the Mediterranean: Lessons from the coronavirus emergency. In IEMed: Mediterranean Yearbook 2020; European Institute of the Mediterranean: Barcelona, Spain, 2020; pp. 145–152. [Google Scholar]
  77. Buades, J. The “Saharisation” of the Mediterranean: For a Shared Agenda on Climate Justice; Beyond Greening: Berlin, Germany, 2013; p. 52. [Google Scholar]
  78. FAO. FAO Fishery Commodities Global Production and Trade (Online Query). 2020. Available online: www.fao.org/fishery/statistics/global-commodities-production/query/en (accessed on 5 June 2021).
  79. FAO. FAO Fishery Commodities Production and Trade Database. 2020. Available online: http://www.fao.org/fishery/statistics/software/fishstatj/en (accessed on 6 June 2021).
  80. World Bank. WDI [World Development Indicators]. 2020. Available online: https://databank.worldbank.org/source/world-development-indicators# (accessed on 2 December 2020).
Table 1. Estimation results for fisheries in Mediterranean countries in landed fish and value.
Model I: lnFLTModel II: lnLV
lnSST−3.117 ***−1.943 ***
(0.000)(0.000)
lnTemp_btm−0.090 ***3.519 ***
(0.000)(0.000)
lnHT_surf−5.085 ***3.675 ***
(0.000)(0.000)
lnHT_btm−0.910 ***12.371 ***
(0.000)(0.000)
lnSal_surf−5.348 ***−15.393 ***
(0.000)(0.000)
lnISST0.163 ***0.356 ***
(0.000)(0.000)
lnHDI1.892 ***11.908 ***
(0.000)(0.000)
lnPop5.231 ***3.547 ***
(0.000)(0.000)
lnPop2−0.250 ***−0.124
(0.000)(0.000)
UP−0.003 ***−0.045
(0.000)(0.000)
UPG−0.027 ***0.108
(0.000)(0.000)
Cons.9.535 ***62.436
(0.000)(0.000)
Log likelihood1157.247787.308
No. of observations378378
Estimation methodGLS: heteroskedastic with cross-sectional correlationno autocorrelationGLS: heteroskedastic with cross-sectional correlationno autocorrelation
Note: The p-values are given in the parentheses. *** denotes statistical significance at the 1%, and 10% significance levels, respectively. Source: Authors’ computations.
Table 2. Prediction of the impact of climate change on fisheries.
RCP 2.6RCP 8.5
Definition2020–20502020–21002020–20502020–2100
Changes in environmental variables, %
ΔSSTSea surface temperature0.0340.043−0.0370.073
ΔTemp_btmTemperature at the bottom0.0170.0340.0290.084
ΔHT_surfH+ ion concentration on the surface0.1210.1190.2580.755
ΔHT_btmH+ ion concentration at the bottom0.0540.0770.0950.326
ΔSal_surfSalinity on the surface0.00080.00430.00040.0027
Changes in fisheries variables %
ΔFLTFish landed (tonnes)−0.778−0.836−1.287−4.388
ΔLVLanded values1.0941.3622.2926.924
Source: Authors’ computations.
Publisher’s Note: MDPI stays neutral with regard to jurisdictional claims in published maps and institutional affiliations.

