
Urban Heat Island and Its Interaction with Heatwaves: A Review of Studies on Mesoscale


1
Center for Wind, Waves and Water, School of Civil Engineering, The University of Sydney, Sydney 2006, Australia
2
Chair of Building Physics, Department of Mechanical and Process Engineering, ETH Zürich, 8093 Zürich, Switzerland
*
Author to whom correspondence should be addressed.
Sustainability 2021, 13(19), 10923; https://doi.org/10.3390/su131910923
Submission received: 2 August 2021
/
Revised: 21 September 2021
/
Accepted: 22 September 2021
/
Published: 30 September 2021
(This article belongs to the Special Issue Responding to Climate Emergency: Design, Planning and Assessment of the Built Environment)
Abstract
:With rapid urbanization, population growth and anthropogenic activities, an increasing number of major cities across the globe are facing severe urban heat islands (UHI). UHI can cause complex impacts on the urban environment and human health, and it may bring more severe effects under heatwave (HW) conditions. In this paper, a holistic review is conducted to articulate the findings of the synergies between UHI and HW and corresponding mitigation measures proposed by the research community. It is worth pointing out that most studies show that urban areas are more vulnerable than rural areas during HWs, but the opposite is also observed in some studies. Changes in urban energy budget and major drivers are discussed and compared to explain such discrepancies. Recent studies also indicate that increasing albedo, vegetation fraction and irrigation can lower the urban temperature during HWs. Research gaps in this topic necessitate more studies concerning vulnerable cities in developing countries. Moreover, multidisciplinary studies considering factors such as UHI, HW, human comfort, pollution dispersion and the efficacy of mitigation measures should be conducted to provide more accurate and explicit guidance to urban planners and policymakers.
1. Introduction
Due to increasing populations, cities all over the world have been developing both horizontally and vertically to accommodate their increasing needs [1]. Such urbanization has contributed to urban climate change due to the replacement of natural elements (e.g., water, vegetation) with artificial heat-absorbing features (e.g., concrete, asphalt) that have a relatively low albedo, high solar absorption and high heat capacity [1,2,3,4,5,6,7]. These impervious materials can also reduce evapotranspiration, thus reducing latent heat flux and altering the urban thermal environment [4,7,8,9,10,11,12]. In terms of urban morphology development in the vertical direction, the increasing height of buildings can not only trap the outgoing radiation due to in-canyon reflections but also reduce turbulence transfer and overall ventilation in dense urban environments as a result of increased surface roughness [3,4,7]. Moreover, the released anthropogenic heat from human activities, such as traffic and air conditioning systems, also increases heat accumulation in urban areas [4,6,7]. As a result, cities often present a higher ambient temperature than their surrounding suburban and rural areas, especially at night, and this phenomenon is widely known as urban heat island (UHI) [4,13,14].
UHI has enormous direct and indirect impacts on urban regions and dwellers, such as causing a considerable rise in energy consumption for cooling purposes [4,14,15,16] and increasing heat-related mortality and morbidity, especially for vulnerable groups such as senior and low-income citizens [4,9,17,18,19,20]. These impacts are reported to be intensified during heatwave (HW) events, a period of excessively hot days [21,22,23]. Recent research also shows that the UHI effect can increase the frequency and duration of extreme heat events as it can extend the duration of hot conditions and reduce the time window for relief from high heat exposures [7]. As reported in [24], the UHI effect can lead to a 3.7-day increase in the number of annual HW days in the Yangtze River Delta region in China. More frequent, longer and stronger extreme heat events are expected to occur in the future [6,7,25]. A study conducted by Lhotka et al. [26] predicted that the frequency of HWs would be nearly twice as high in the period 2020–2049 compared to the historical period 1970–1999, and they are projected to occur 3–4 times per year on average by the end of the 21st century. On the other hand, HWs may strongly affect the spatial and temporal variability of UHI by altering sensible and latent heat transfer and changing wind conditions [4,27,28]. While many researchers [27,28,29] have reported synergistic interactions between UHI and HW, other researchers [25,30] found no synergistic effect. Nevertheless, the interaction between UHI and HW is complex and remains a subject of debate.
In order to mitigate the negative effects of UHI, especially during HWs, numerous strategies have been proposed, such as using permeable pavements [31,32,33] and reflective materials [34,35], increasing vegetation cover [36,37,38,39,40,41,42] and so on. Susca et al. [43] evaluated the effectiveness of using vegetation for UHI mitigation in New York City and reported a positive impact since vegetation effectively reduced the building cooling/heating load and the consequent building energy consumption. Although many strategies have been proven to be effective in mitigating or suppressing UHI, it remains unclear whether they are still effective during HW events. For example, considering that grass is sensitive to extreme heat events, its impact on UHI during HW events is still an open question.
Santamouris [4] has highlighted the need for a more integrated and holistic analysis of UHI combining climate issues in cities such as HWs and global climate change in future studies. Due to the severe impact and increasing intensity of UHI and HW, it is necessary to look at the existing studies related to both UHI and HW. This review aims to articulate existing understandings of UHI under HW conditions by answering the following key questions:
- How does HW affect UHI?
- What are the main drivers controlling the synergies between UHI and HW?
- What can be done to mitigate UHI under HW conditions?
A comprehensive literature search is conducted to find all peer-reviewed articles related to UHI and HW using three major databases, namely ScienceDirect (access date: 28 April 2021), Scopus (access date: 28 April 2021) and Web of Science (access date: 1 May 2021). The selection process of the literature and the number of articles reviewed are shown in Figure 1. First, different combinations of keywords (urban heat island, heat wave and heatwave) are applied to form advanced query strings for different databases. Then, the review is conducted on the articles that meet the following criteria: published in English; peer-reviewed journals; specifically studying UHII under HW conditions concerning synergistic effect and/or mitigation measures; considering the comparison between HW and non-HW days when studying the synergistic effect; focusing on mesoscale (brown circle in Figure 1). Finally, 64 articles are selected for in-depth review, as is shown in the green circle in Figure 1. Among these articles, 37 of them focus on the synergistic effect; 23 of them focus on mitigation measures; and 4 of them cover both topics.
The remainder of this paper is organized as follows: Section 2 presents the current status of research related to UHI during HWs. Different classifications of UHIs and HWs, interactions between UHI and HW and mitigation solutions are discussed in this section. The research gaps and future research suggestions are discussed in Section 3, and observations from this review are summarized in Section 4.
2. Current Status of Research
The 64 selected studies are further classified and analyzed. Overall, the number of publications studying UHI under HW conditions has increased over the last decade, as shown in Figure 2, which indicates increasing research attention in this topic. Among these studies, most of them are conducted for Chinese and American cities, as shown in Figure 3, and many of the remaining studies focus on European cities.
2.1. Methods for Retrieving UHI
In this section, an overview of the methods adopted in the literature for retrieving UHI is provided. Three major methods have been adopted in this regard, including in-situ measurement, remote sensing and numerical modeling [44]. The reviewed articles are classified by research methods in Figure 4. As is shown in this figure, numerical simulation is the most widely adopted method, followed by in situ measurements and remote sensing, while some studies adopt two or more methods. More details can be found in Supplementary materials Table S1. In the subsections to follow, the applications of each of these methods will be briefly discussed.
2.1.1. In Situ Measurement
The in situ measurement approach/method has certain advantages, such as allowing direct, instantaneous and continuous measurements of air temperature, wind speed, humidity and other variables, but it also has some limitations, such as the inability to provide a high spatial resolution of measured variables due to the limited number of weather stations [44]. Ngarambe et al. [45] emphasized the importance of the appropriate selection of urban and rural stations to avoid inaccurate UHI estimations. They suggested that the selected rural area should be located in a relatively flat terrain surrounded by natural properties, without impervious surfaces such as densely constructed buildings. Such a criterion of urban and rural station selection is also adopted in other studies. Jiang et al. [46] and Chew, Liu, Li and Norford [25] considered an urban station in the central urban area with more than 70% impervious surfaces and less than 20% vegetation cover within 1 km2 of the station. It should be noted that stations in large urban parks have limited representativeness of urban stations [46] since they may underestimate the actual urban heat island intensity (UHII) in cities’ built-up zones [47]. In contrast, rural stations were selected with 65% or higher vegetation or cropland cover and 30% or lower impervious surfaces [25,46]. Other criteria, such as population [48] and satellite night-time brightness index [49], have also been applied in some studies. Generally, the selection of weather stations is important when applying the in situ measurement method, and UHII should rather be estimated by fewer representative sites than more unrepresentative sites [50], especially for studying UHI under HWs, as the performance of different land types may change under extreme temperature conditions.
2.1.2. Remote Sensing
In contrast to the in situ measurement, thermal infrared remote sensing from satellites allows global monitoring of geophysical parameters such as land surface temperature, and thus is widely used for studying surface urban heat island [51,52]. A few studies [29,53] also used ground-based or aircraft-based remote sensors to observe the urban boundary layer (UBL). Among the various satellite images, Moderate Resolution Imaging Spectroradiometer (MODIS) (https://modis.gsfc.nasa.gov, accessed on 6 June 2021) and Landsat (https://landsat.gsfc.nasa.gov, accessed on 6 June 2021) images are commonly used [54,55,56,57,58,59]. These datasets have different spectral, temporal and spatial resolutions, typical ranges of which are shown in Table 1. It should be noted that satellite-based sensors cannot continuously record information over the diurnal cycle due to having an orbital tour around the Earth [44]. In addition, cloud cover may affect dataset quality, and images showing more than 10% cloud cover are usually excluded from analysis [56]. Therefore, although this method can provide continuous spatial data for studying UHI under HWs, it cannot monitor continuous temporal variations in UHI under HWs.
2.1.3. Numerical Modeling
Climate models, such as the Weather Research and Forecasting Model (WRF) [60] and its extended version, WRF-Chem [61], the Consortium for Small-scale Modeling (COSMO) [62], ALARO-0 [63], UrbClim [64], the non-hydrostatic mesoscale atmospheric model (Meso-NH) [65,66], MUKLIMO_3 [67,68] and the Community Earth System Model (CESM) [69], have been developed to simulate, analyze and predict the urban thermal environment and flows. The modeling approach offers a solution to overcome the limitations of in situ measurement and remote sensing as it provides information at high spatial and temporal resolutions and can also test hypothetical scenarios and assess potential future impacts. Promising results have been obtained using the modeling approach in the past few decades [44,70,71]. The details of the various numerical models are summarized in Table 2. These models all comply with the same fundamental mass, momentum and energy conservation laws but differ in hydrostatic assumptions, formulation of equations and available options in parameterization schemes [71]. Among them, WRF, developed by the National Centre for Atmospheric Research, is the most popular one, which can capture temporal–spatial variations in regional climate (temperature, wind, shortwave and longwave radiation, rainfall, surface heat fluxes and other environmental variables) caused by urbanization and has been successfully applied to simulate many UHI and HW events [9,72,73,74,75].
To precisely resolve the surface energy balance in the atmospheric model, land surface models (LSMs) are usually coupled to provide parameterizations for sub-grid-scale atmospheric processes [71]. These models vary in the level of complexity from simplified bulk representations (such as Noah LSM [76], which treats urban areas as homogeneous and flat surfaces with properly modified radiative, thermal and aerodynamic properties [71,75,77]) to single- and multi-layer urban canopy models (UCMs) that take into account in more detail urban morphology characteristics, building material parameters and anthropogenic heat release [71,78]. Single-layer UCM (SLUCM) [79] considers two-dimensional and symmetrical street canyons with an infinite length. It resolves mass and energy exchanges between the lowest level of the atmosphere and the canopy’s roof, wall and road surfaces [6,71,78]. Building Effect Parameterization (BEP) [80], which is a multi-layer UCM (MLUCM), accounts for the three-dimensional nature of urban surfaces. It treats several layers within the urban canopy and simulates the heat, momentum and turbulent kinetic energy exchange across multiple atmospheric levels [37,71,78,81,82]. In WRF simulations, BEP is usually coupled with the Building Energy Model (BEM) [83] to improve the calculation of energy exchange between building interiors and the outdoor atmosphere [78,84]. The BEM, for each floor, considers the conductive/sensible heat transport through walls, roofs and floors; radiation exchange through windows; longwave radiation exchange between indoor surfaces; production of heat due to occupants and equipment; and air conditioning, ventilation and heating [72,85,86]. It has been demonstrated that BEP–BEM provides more accurate predictions of sensible heat flux than BEP [87]. Princeton UCM (PUCM) [88] is also adopted in WRF simulations. Similar to other UCMs, it considers three main facets—roofs, walls and roads. However, PUCM also includes sub-facet-level heterogeneity for urban fluxes as each facet in the PUCM can be divided into multiple sub-facets with different materials [89,90]. For example, a roof surface can be a combination of a green roof and a cool roof. Moreover, PUCM adopts more realistic representations of hydrological processes, such as in-canyon vegetated soils and water storage capacity for impervious materials [91]. The Town Energy Balance Model (TEB) [92] is usually coupled with a Meso-NH atmospheric model. It considers a simplified two-dimensional building layout, including roofs, walls and roads, and models the thermal exchanges between urban surfaces and the atmosphere. In addition, a thermal comfort model and a building thermal model are included in TEB, which allow the simulation of the universal thermal climate index, estimation of human body thermal comfort and calculation of energy consumption for heating and cooling [44]. Some studies [93,94] combine TEB with the Interaction Soil Biosphere Atmosphere (ISBA) [95] to better represent urban green areas and simulate the interactions between build-up and natural cover. In general, choosing appropriate models to accurately study the interactions between UHI and HW is important, and simulation results should be validated against real measurement data wherever possible.
2.2. Classifications of Urban Heat Island
There are mainly four types of UHI, as illustrated in Figure 5: subsurface urban heat island (UHIsub), surface urban heat island (UHIsurf), canopy layer urban heat island (UHIUCL) and boundary layer urban heat island (UHIUBL) [114]. Their definitions, processes, data collection methods and impacts are summarized in Table 3. Oke [114] pointed out that the types of UHI measured or modeled should be identified first because each corresponds to different processes and thus requires different measurement techniques. Figure 5 shows that among the reviewed papers, only two types of UHI have been studied, i.e., UHIsurf and UHIUCL. Most of the papers have considered the UHIUCL, i.e., between the surface and roof level, such as at 2 m height [25,29,48,73,103,115], since a high air temperature at this level is detrimental to human comfort and wellbeing [57]. Ward, Lauf, Kleinschmit and Endlicher [57] mentioned that surface temperature is the only multi-temporal and spatial information that is widely available for large comparative analyses, while air temperature measurements have many constraints, such as cost, location settings and scale. Nevertheless, studying different types of UHI and their interactions with HW deserves more attention.
2.3. Features, Causes and Definitions of Heatwaves
A common feature of all HW events is a persistent high-pressure synoptic system (anticyclone) [116,117]. Other features, such as soil desiccation [48,89], deeper atmospheric boundary layer [89], lower wind speed [45,118,119] and cloudiness [118], are also observed, while some studies report contradictory observations, such as decreased atmospheric boundary layer and abundant soil moisture [29].
Typical HWs occur due to a stubborn jet stream flow, which splits the upper-level atmospheric wind, so that cooler air from the poleward side cannot mix with the hotter air at the equatorial side and warm air starts to build up in the blocked region [116]. Other HWs occur at lower latitudes, such as in Australia [116], where high-pressure systems remain stationary until a low-pressure system shifts them, and they are usually associated with the movement of atmospheric Rossby wave trains [116]. It is reported that anthropogenic activity may cause increased intensity, frequency and duration of HWs, and these three characteristics are predicted to increase remarkably in the future [113,116].
There is no standard and universal definition of HW as different regions have different climatic conditions. Generally, HWs differ in three aspects: temperature metric, intensity (temperature threshold) and duration [120]. In terms of the temperature metric, HWs may be characterized by air temperature, apparent temperature [121] and heat index (HI, see the equation below Table 4). Maximum air temperature is widely used for characterizing HWs in the literature [28,34,53,58,90,99,103,113,118,122,123]. Another temperature indicator is the mean temperature, which is adopted in [30,110]. Combined maximum and minimum air temperatures are also used to characterize HWs [48,112,124]. Other combinations, such as the maximum and mean temperatures, are adopted in certain studies [25]. Compared to the temperature-based indicators, the apparent temperature and HI are reported to be better indicators of HWs because they consider both temperature and humidity, which may provide a better estimation of heat stress on humans, especially in tropical cities [25,120,121,125,126]. High humidity has an adverse effect on the human body’s efficiency in discharging heat through perspiration, which in turn results in an increase in the body’s internal temperature [29].
Pyrgou, Hadjinicolaou and Santamouris [119] compared both air temperature and HI indicators under HW events, which are characterized by increased air temperature, lower wind speed and increased absolute humidity. They concluded that using HI to define HWs may predict the intolerable weather conditions in the Eastern Mediterranean region more accurately since high humidity can exacerbate the outdoor thermal comfort in this region. As a result, HWs characterized by HI occur more frequently and last for a longer period of time. An, Dou, González-Cruz, Bornstein, Miao and Li [29] also highlighted the importance of HI since the variation in the daily maximum building energy demand correlates better with the change in the HI than with temperature.
Both absolute and relative thresholds are adopted to define a HW [29,45,120,128]. The latter considers the percentile (90th, 95th, 98th, etc.) over a given period rather than the absolute values (e.g., 32 °C, 35 °C, 37 °C, etc.) to account for the climatic adaptability factor [128]. To a certain extent, these two types of definitions are correlated. Another criterion defining a HW is temporal persistence, i.e., a specified number of consecutive days when the temperature or HI surpasses a certain threshold [45,48]. There is no consensus on the minimum number of days to be considered as a HW [128]. All the HW definitions considering metric, threshold and duration from the reviewed literature are summarized in Table 4. It is clear that most of the studies use 3 days as a criterion to define the minimum duration.
2.4. Interactions between Urban Heat Island and Heatwaves
2.4.1. Urban Heat Island Intensity
UHI intensity (UHII) is generally defined as the temperature differences between urban and rural areas [29,48], as shown in Equation (1) [54,57,59,122]:
where is the average temperature for all urban stations (in measurements) () or the average of temperatures in grid cells (in simulations) across an urban area, and is the average temperature of reference rural stations () or the average of temperatures in grid cells across a rural area.
Certain numerical studies adopt an urban increment method [25,74,130] and calculate the UHII as the difference between a control case and a non-urban case, as shown in Equation (2).
where the control case is the original case of urban areas, and the non-urban case is a hypothetical case with all urban areas replaced by rural areas. A previous study [131] has demonstrated that both methods provide similar diurnal variation of the UHII. However, the latter method can provide the spatial distribution of UHII.
Heat magnitude (HM), which refers to the added heat load during HWs to the UHII during average summer or non-HW days [57], is adopted to represent the change in UHII during a HW. HM is calculated using Equation (3):
where is the intensity of UHI during HW days and is the intensity of UHI during a reference period (non-HW days or summer background period).
The synergistic interaction between UHI and HW, or, more specifically, whether the joint effect of the two phenomena is greater than the sum of their separate effects [119] or not, is still an open question. A number of studies have explored this question, and their results are discussed below and also summarized in Figure 6 (note that the study in [113] is not included in this figure due to the lack of location information). More details including the location, climate type [132], UHI type, time period, method and HM can be found in Table S1 (in Supplementary Materials).
Most of the studies find that UHII correlates positively with HWs, i.e., UHI is more intense during HW periods than non-HW periods [27,29,47,53,59,74,108,115,117,122,123,129]. This phenomenon is particularly common in major European cities and Chinese metropolitan cities. The HM usually ranges from 0 to 5 K. Among these studies, some [29,59,74,117,122,129] find that the synergistic interaction between UHI and HW is more pronounced in the nighttime, and the UHII can be 2–3 times higher than that over non-HW periods.
In contrast, some studies report that the UHII is not amplified during the HW periods [25,30,128,133]. The diurnal variations of the UHII during the HW period are also similar to those during normal days [25], with the peak UHII recorded at midnight. A few studies [48,56,124,128] even report reduced UHII during HW events. For instance, Kumar and Mishra [56] investigated 89 cities in India and reported that the surface UHII was reduced in the majority of urban areas (63% at daytime and 74% at nighttime) during HWs, the causes of which are discussed in Section 2.4.3.
2.4.2. Energy Balance Models
The origin of a UHI is the change in energy balance due to urbanization [72,114]. As suggested in [114,134], a conceptual control volume, integrating the total urban ecosystem from the top of the roughness sublayer down to a certain depth in the substrate (the vertical heat flux by conduction across the bottom is negligible over the period of consideration), can be defined to study the energy balance. The surface energy balance for such a control volume is illustrated in Figure 7a and described by the following equation [114,134,135,136]:
where is the net all-wave radiative heat flux, is the anthropogenic heat flux released within the volume due to human activities such as traffic, buildings and industry activities, is turbulent sensible heat flux, is latent heat flux, is stored heat flux referring to all energy storage mechanisms within the volume, such as in air, soil, building fabric and trees, and is the net horizontal advective heat flux through the sides of the volume. For rural areas, the counterpart of is the ground heat flux , which represents the sensible heat by conduction to the soil for rural surface energy balance (refer to Figure 7b).
The net all-wave radiative heat flux can be calculated as [114]:
where is incoming shortwave radiation, is outgoing (scattered and reflected) shortwave radiation, is incoming longwave radiation and is outgoing longwave radiation.
As shown in Figure 7c,d, the main difference between daytime and nighttime surface radiation is with the shortwave radiation. The shortwave radiation comes from the sun, and the received amount at a specific area depends on various factors, including the latitude, longitude, time period, the ability of the atmosphere to transmit and absorb shortwave and the ability of air, clouds and surrounding surfaces to scatter and reflect radiation [114]. It is reported that the incoming solar radiation increases during HWs due to less cloudiness [25]. Other studies observe a decrease in in cities with significant photochemical smog or industrial aerosol [135]. The outgoing shortwave radiation is primarily determined by surface reflectance, characterized by the albedo value. The incoming longwave radiation is the radiation emitted within and from the Earth–Atmosphere System [114]. The value of incoming longwave radiation depends on the ability of the atmosphere and surrounding surfaces to emit and reflect [114]. It is generally agreed that will increase in urban areas due to the higher air temperature (UHI) or enhanced atmospheric emissivity resulting from particulate and gaseous pollutants, but it may be offset by the effect of the higher surface temperature on [135].
One of the main differences between urban and rural areas is the anthropogenic heat flux. is the heat that is mainly converted from chemical or electrical energy and released into the atmosphere due to human activities in urban areas [114]. It includes waste heat from transport-related fuel combustion, building heating, cooling and ventilation, industrial manufacturing, human metabolism, etc. [72,136]. All of them can be categorized into three sectors: transport, buildings and human metabolism [29,114]. It is reported that from the building sector accounts for the major proportion of the total [72]. However, is difficult to accurately estimate since it is affected by urban morphology, weather conditions, varying human activities and technology adoption, etc. [72].
The turbulent sensible heat flux and latent heat flux are mostly investigated and considered as primary causes of urban and rural temperature variations [28,128]. The Bowen ratio, , which is defined as , is an important indicator adopted in UHI studies. indicates that more heat is converted into sensible form, which warms the lower atmosphere, and indicates that latent heat flux is the dominant one, which cools the lower atmosphere and brings humidity to the environment [114]. Latent heat flux is usually higher in rural areas than in urban areas because of abundant vegetation [128].
The storage heat flux is usually higher in urban areas than that in rural areas due to the higher heat storage capacity of building/pavement materials compared to vegetation and soil [10,128]. In urban areas, heat is usually stored during daytime and mostly released as sensible heat flux at nighttime since urban areas are mostly covered with impervious surfaces [25]. Therefore, UHII is expected to be enhanced during HWs [34,90,138,139,140,141].
The advective heat flux is the net energy carried through the control volume by the wind-driven transport of sensible and latent heat [114]. Some studies attempt not to consider by assuming a relatively homogeneous urban surface [114,136]. However, the horizontal properties are usually different in urban areas, and the thermal gradient between urban and rural areas can result in secondary circulation [89]. In addition, specific morphologies such as hills/mountains and lakes/sea can significantly influence the (cooling) air flow towards the city, and thus influence urban temperatures. The effects of the ventilation corridors, such as rivers and large boulevard streets, are also remarkable. The study conducted by Ching et al. [142] revealed that the horizontal heat fluxes may dominate vertical fluxes when there is a strong horizontal temperature gradient.
2.4.3. Variation in Energy Budgets and Corresponding Drivers
As mentioned above, the relative warming of the urban environment is related to the energy balance [122]. A number of drivers controlling the energy budget change can be distinguished: atmospheric stability, wind speed, air pressure variation, clouds, evapotranspiration, surface albedo, exhaust gases from traffic, pollution, soil moisture, etc. [48,54,81,103,108,122,143]. The relationships between the energy budget and possible drivers are illustrated in Figure 8.
Theoretical models have been developed to quantify the relationships between different drivers. For instance, a biophysical factorization method, which decomposes the urbanization-induced changes in the surface air temperature (air temperature near ground) into multiple components, was proposed in [73,144]. Chew, Liu, Li and Norford [25] pointed out that both momentum and thermal roughness lengths and the surface resistance are important contributing factors and have developed correlations to quantify their effects accordingly based on Monin–Obukhov similarity theory [145]. Evapotranspiration is considered one of the significant drivers in lowering temperature [119,146], and dew formation is another important driver since the evaporation of night dew during the day may bring about some cooling effects [119,128]. This phenomenon occurs when the surface temperature is less than or equal to the dew point temperature, which correlates with the atmospheric pressure and humidity [119]. Efficient nocturnal radiation cooling occurring in clear sky and light wind conditions is also reported to be an important factor for dew formation [119,147].
The synergistic interactions between UHI and HW are attributed to the urban–rural contrasting responses to different drivers and the consequent changes in the energy budgets [29,73]. The findings of the studies investigating different energy budget changes and relevant drivers are summarized in Table S2. Three distinct scenarios have been reported in the literature, which are described below.
- UHII increases during HWs
Most studies have observed the synergies between UHI and HW. The net all-wave radiation is generally higher under HWs than that under normal conditions due to the increase in incoming shortwave radiation in clear sky or lower water vapor conditions [28,29,46,148]. Incoming longwave radiation was also found to increase by Li, Sun, Liu, Yang, Wang and Gao [28]. Jiang, Lee, Wang and Wang [46] found that the daily total solar radiation during HWs was approximately 1.5-times higher than that in non-HWs in all three cities studied. In [28,115], the differences between urban and rural areas were investigated and it was found that the difference in the net all-wave radiation becomes larger during HWs than that under normal conditions, suggesting that urban areas receive more radiative energy input than rural/suburban areas. In contrast, He, Wang, Feng, Yan, Miao, Zhang and Xia [73] reported that the difference in the surface net radiation between HW and regular episodes is negligibly small. They argued that the downward shortwave radiation during daytime is affected more by urbanization on both HW days and regular days.
Enhanced anthropogenic heat flux during HWs is reported to be one of the key contributors to the synergistic effect at both daytime and nighttime [29,73,74,115]. This is primarily attributed to the increased energy consumption by air conditioning systems in urban areas during HWs [73,115]. This increased energy input will be further released into the atmosphere, thus also altering the global urban temperature.
The increase in urban–rural difference in latent heat flux is suggested to be another important cause leading to the increase in UHII during HWs [74,90]. In urban areas, urbanization leads to a greater amount of input energy being transformed into sensible heat and reduced latent heat due to limited vegetation cover and soil moisture [73,108,115]. This effect becomes more significant during HW events, as observed in [73]. In rural areas, latent heat flux by evapotranspiration increases due to abundant vegetation and available water [28,118]. Oláh [149] also pointed out that vegetation can utilize incoming solar radiation for photosynthesis, and thus reduce the heat transformed by radiation. During HWs, the higher atmospheric temperature could enhance the capacity of air to absorb water vapor and the potential evapotranspiration mechanisms [45,119]. Pyrgou, Hadjinicolaou and Santamouris [119] observed higher dew formation during HWs and reported that the dew deposited on the upper top layer of soil may suppress higher temperatures in rural sites by soil evaporation. Ngarambe, Nganyiyimana, Kim, Santamouris and Yun [45] and Ao, Wang, Zhi, Gu, Yang and Li [115] reported that the urban–rural difference in humidity becomes larger during HWs. Studies conducted by Founda and Santamouris [123] found that the higher water content in rural areas is attributed to sea breeze circulation; they also highlighted the significant effect of background wind field on the synergistic interactions.
Most studies [29,45,54,103,108,115,119,122,129] observe a lower wind speed during HWs than non-HW periods, where the reduced wind speed increases atmospheric stability, prolongs stagnant conditions and weakens horizontal advective cooling. Ngarambe, Nganyiyimana, Kim, Santamouris and Yun [45] found higher UHII during low wind speed conditions than during medium and high wind speed conditions. They also found that the synergies between UHI and HW are more intense in densely built areas, which is attributed to the presence of tall buildings hindering natural wind flow, resulting in reduced heat removal. Prominent wind directions are observed to change during HWs in the studies conducted by Jiang, Lee, Wang and Wang [46] and Ramamurthy and Bou-Zeid [89]. Jiang, Lee, Wang and Wang [46] observed wind originating from neighboring hot cities in the southwest instead of the cool sea breeze from the southeast during HWs, which leads to a significant increase in the daytime UHII. Reduced moderation of UHI by the sea breeze due to the change in wind direction was also reported by Ramamurthy and Bou-Zeid [89].
A significant increase in heat storage in urban areas during HWs was observed by Li, Sun, Liu, Yang, Wang and Gao [28], the additional heat gain of which was released during night, resulting in more significant nocturnal synergistic interactions [45,74,103,123]. Ramamurthy and Bou-Zeid [89] revealed that the variations in heat storage among different cities are related to the size of the cities. They found that New York City, where the UHI is amplified during HWs, has around 3.5 GW heat stored, compared to 20 MW for Philadelphia.
- UHII decreases during HWs
In contrast to the studies described above, some studies find that the intensity of UHI decreases during HWs, and this is mainly caused by reduced latent heat flux in rural areas due to soil moisture depletion, which results in a decrease in evapotranspiration [48,56,128]. Urban areas are mostly covered by impervious surfaces, and thus the evapotranspiration is less likely to have an impact on the urban temperature [48]. Richard, Pohl, Rega, Pergaud, Thevenin, Emery, Dudek, Vairet, Zito and Chateau-Smith [48] studied six HW periods and found that little or no rainfall was recorded during five of them. Such low rainfall leads to a decrease in soil wetness and consequent evapotranspiration. Kumar and Mishra [56] revealed that the soil moisture and vegetation cover decline after harvesting since most of the rural areas are located in agriculture-dominated regions. Khan, Paolini, Santamouris and Caccetta [128] found that the fast depletion of moisture and latent heat flux in rural areas during daytime is caused by the advection of dry and warm wind blowing from the desert, while the urban area is affected by the advection of humid and cool air from sea at the same time. Therefore, the advective heat flux is recognized as a dominant factor in addition to the latent heat flux, especially in coastal cities [128].
- UHII remains unchanged during HWs
Although most studies observe a lower wind speed during HWs, which results in amplified UHII, Chew, Liu, Li and Norford [25] found no significant deviation in the wind speed and diurnal profile compared to pre-HW and post-HW days. Since no change in wind speed is observed, the urban–rural soil moisture deficit is not significantly altered, and the heat storage is not amplified. Consequently, the UHII remains unaltered during a HW episode, as reported by Chew, Liu, Li and Norford [25]. However, a limitation of their numerical modeling is that they assume the same anthropogenic heat on HW days as on normal days, which may affect the validity of their results. Ramamurthy and Bou-Zeid [89] found that UHII remains unchanged in small cities, and they attribute this to the low thermal capacity and small soil moisture gradient across the short urban–rural transect of such cities.
2.5. Mitigation of Urban Heat Island during Heatwaves
To alleviate extreme urban temperatures, various mitigation strategies and their effectiveness for different regions have been studied. The strategies discussed in this section include increasing vegetation coverage (e.g., green roof and park), adopting high albedo surfaces (e.g., modified radiative properties of walls, roofs and roads) and adding water features (e.g., irrigation), etc. [70,96,105,150]. Since the occurrence of HWs may become more frequent, understanding the impact of these mitigation solutions in diverse cities and extreme weather conditions is important. All the reviewed studies in mesoscale related to mitigation solutions of UHI under HW conditions are summarized in Figure 9 and Table S3, and the various strategies are described below.
2.5.1. Increasing Albedo
Albedo refers to the ratio of the reflected solar radiation from a surface to the incoming solar radiation on that surface [77,100]. Lower albedo leads to reduced reflection and increased absorption of solar radiation, and consequently to a higher surface net radiation and temperature. In many cities, the roofs, walls and roads are dark-colored, which increases net radiation and leads to higher temperatures due to their low solar radiation reflectance [106]. The mean albedo of urban surfaces is typically around 0.2, which means that approximately 20% of the incoming solar radiation is reflected [98]. For example, asphalt, which is the main material for streets, has albedo values between 0.12 and 0.24 [100]. To mitigate UHI, deliberately increasing the albedo of urban surfaces, such as having cool/white roofs, high reflective walls and roads, has drawn widespread attention.
Materials with higher albedo usually have a lighter color compared with ordinary materials. They can reflect more of the incoming solar radiation in urban areas and thus reduce the net radiation [84,91,96,105]. Ultimately, the sensible heat flux , which heats up the urban atmosphere, is reduced, and the urban ambient temperature is potentially lower. The study conducted by Ma, Shao and Song [106] revealed that around 183.3 W/m2 net solar radiation and 125.8 W/m2 sensible heat flux can be reduced when the roof albedo is increased from 0.15 to 0.8. Imran, Kala, Ng and Muthukumaran [6] found that cool roofs can reduce net radiation by up to 100, 160 and 180 W/m2 as well as sensible heat flux by up to 100, 170 and 220 W/m2 by changing the albedo values from 0.2 to 0.5, 0.7 and 0.85, respectively. It should be noted that, with reduced surface temperature, the outgoing longwave radiation is also reduced. However, the net radiation still decreases since the increase in the reflected shortwave radiation outpaces the reduction in outgoing longwave radiation [91]. Previous studies have also reported that increasing albedo can reduce building energy consumption for cooling due to the reduced urban ambient temperature and the reduced heat storage in roofs, and can consequently reduce the anthropogenic heat emission (e.g., heat pumped into the exterior by air conditioners) in urban areas [6,91,98,106] if solar shading is handled properly; otherwise, as indicated in [151], increasing albedo may lead to an increase in solar heat gain through windows and consequently an increase in the building cooling load.
Existing studies suggest that increasing albedo is an effective way of reducing the urban heat island during summer extreme heat events [94,107,111], although it may not completely offset the HW effect [100,106]. HWs generally have more cloud-free conditions than non-HW periods, and thus allow more incoming solar radiation. Cities are likely to receive more effective cooling outcomes under such conditions with increased albedo [96,98]. Chen, Zhang, Zhu, Wang and Skorokhod [110] found that the UHII is decreased by 28% on normal days and by 29.9% on HW days during summer when albedo increases from 0.2 to 0.85. Typical values of the albedo ranging from 0.12 to 0.88 are reported to have positive relationships with temperature reduction. Geletič, Lehnert and Jurek [70] reported that the daily average air temperature in both Prague and Brno is reduced by 0.2 K with an albedo increase of 0.25, while the temperature difference can be up to 0.5 K in Prague and 0.4 K in Brno when albedo is increased by 0.5. Imran, Kala, Ng and Muthukumaran [6] found that the maximum roof surface temperature can be reduced by up to 3, 4 and 5 K in urban areas with albedos of 0.5, 0.7 and 0.85, respectively. Zhou and Shepherd [105] noted that albedo has a moderate effect, with around a 2 K reduction in the 2 m air temperature when it is increased from 0.15 to 0.45, while the albedo has no effect on lowering the temperature at the 2 m height in Atlanta when it is increased from 0.15 to 0.3.
Previous studies have reported that high albedo has more distinct effects on reducing surface temperature than reducing air temperature because the surface is directly affected by the distinct reduction in the net solar radiation [106]. The decrease in the surface temperature can be up to 6.2 K, which is much more than the decrease in the air temperature (1.5 K), as reported by Ma, Shao and Song [106]. The same conclusions are also found in [6,91]. Some studies also compared the daytime and nighttime effects of such mitigation strategies and reported that increasing albedo is most effective during daytime as its cooling mechanism occurs via the reflection of sunlight [84,96,98,111]. At nighttime, altering albedo no longer plays an important role in the surface energy balance due to the absence of incoming solar radiation [91]. Nevertheless, it is interesting to observe that nighttime temperature is slightly lower with higher albedo according to [77,85,100,106,107], due to reduced urban heat storage during the day [102].
Air speed is also reported to be reduced by increasing urban albedo during HWs [6,82,100,106,109]. This is mainly because the lower surface temperature caused by increasing albedo leads to a reduced buoyancy effect and in turn weakens turbulence [82]. It is found that the turbulent kinetic energy is reduced with increasing albedo [6]. Meanwhile, it is also observed that the planetary boundary layer depth is reduced by 300 m over urban areas [6]. It is interesting to note that some studies report a small temperature increase in discrete areas, and they speculate that it is likely due to the changes in vertical and horizontal mixing associated with the increase in albedo [106].
2.5.2. Increasing Vegetation Coverage
Vegetation changes the surface energy balance by increasing the latent heat flux via evapotranspiration relative to the sensible heat flux for a given net radiation [6,9,57,91,152,153,154,155]. The changes in surface energy balance lead to a decrease in the surface temperature and the near-surface air temperature [34,102]. Vegetation also reduces the amount of solar radiation transmitted to underlying surfaces by providing shade and thus cools the soil and, as a result, also the air [105,156]. Therefore, increasing vegetation is regarded as an effective mitigation strategy to reduce UHI.
Strategies for increasing vegetation coverage in urban areas include applying green roofs, increasing the number of trees and grassy areas and adding urban parks, etc. In general, it is found that increasing vegetation is effective in reducing the temperature during HW days [6,91,99,104,105]. Imran, Kala, Ng and Muthukumaran [6] reported that the daily sensible heat flux can be reduced by up to 150 W/m2 by increasing the green roof fraction from 0 to 90%, and the roof surface UHI and near-surface UHI can be reduced by 3.8 K and 1.15 K, respectively. Sun, Grimmond and Ni [104] revealed that the temperature reduction has a strong linear relationship with the green roof coverage fraction. A decrease of 0.16 K and 0.22 K in the mean and maximum 2 m air temperature can be achieved by a 10% increase in the green roof coverage fraction. Imran, Kala, Ng and Muthukumaran [101] investigated three different combinations of vegetation types: mixed forest, mixed forest and grasslands and mixed shrublands and grasslands. They found that all these methods have a positive impact on reducing surface and air temperatures. The mixed forest and grasslands method is slightly more effective in mitigating UHI than the other two methods. The cooling effect of increasing vegetation coverage during the night is observed in [82,91,101,104,105]. As revealed by Imran, Kala, Ng and Muthukumaran [101], this phenomenon can be explained by the reduction in heat storage during the daytime since UHI is driven by the release of heat stored during the night.
In contrast, Alavipanah et al. [157] noted that the effectiveness of vegetation is less pronounced during HWs compared to other periods. They explained that it is mainly because vegetation dries out during HWs due to water shortage. The importance of soil moisture in the performance of vegetation is also highlighted in the literature [57,91,158]. Li, Bou-Zeid and Oppenheimer [91] revealed that the cooling effect provided by green roofs may be eliminated when the soil moisture is very close to its wilting point.
2.5.3. Irrigation
As mentioned above, soil moisture plays an important role in evapotranspiration, which is a combination of evaporation and transpiration [9,159,160]. The rate of evapotranspiration is limited by the water availability, and it affects the cooling effect by vegetation [9,161]. This highlights the importance of irrigation.
The effectiveness of irrigation strategies during HWs has been studied by Gao, Santamouris and Feng [9] and Daniel, Lemonsu and Viguié [93]. Both studies show that cooling by irrigation is more effective during HW periods compared with non-HW periods. The daily average latent heat flux is significantly increased and the urban air temperature is reduced with irrigation [9]. Daniel, Lemonsu and Viguié [93] observed that the efficacy of vegetation watering based on the 2 m air temperature slightly increases with increasing duration and intensity of HWs. Apart from the ambient temperature, the study conducted by Gao, Santamouris and Feng [9] revealed that the cooling effect of irrigation is also sensitive to other environmental variables, such as the soil moisture level before irrigation, urban fraction (fraction of impervious surface in an urban area) and sea breeze. It is found that the effectiveness of irrigation is enhanced when soil is drier before irrigation, but it decreases with a higher urban fraction. It is also found that irrigation is less effective in coastal regions affected by the sea breeze.
It should be noted that the increase in humidity by irrigation may have an adverse effect on reducing the thermal stress in hot and humid regions and in turn on outdoor human thermal comfort [162]. Daniel, Lemonsu and Viguié [93] found that the performance of irrigation in mitigating heat stress is slightly reduced under very severe HW conditions.
2.5.4. Combined Strategies
Some studies have investigated the combination of different mitigation strategies. For instance, Masson, Lion, Peter, Pigeon, Buyck and Brun [94] studied the effects of landscape change (forest, local farming and water) coupled with reflective surface coverage and found that the UHI in Paris can be reduced by 2–3 K. Zhou and Shepherd [105] revealed that the cooling effect of combined albedo change and green space is not as significant as individual strategies during HW days. The combination of five different urban hydrological processes, including anthropogenic latent heat, urban oasis effect, urban irrigation, evaporation from paved surfaces and green roofs, was studied by Wang, Liu, Miao, Wu, Zhang and Qiao [97]. They found that the urban hydrological processes can effectively mitigate UHIsurf and UHIUBL, and the effectiveness is more distinct with reduced density of urbanization. However, they also pointed out that the reduced vertical airflow speed due to the mitigation method may inhibit moisture transport to the higher atmosphere and in turn enhance the wetting effect in the lower PBL, which may partly counteract its cooling effect on human comfort.
3. Discussion
3.1. Addressing the Important Questions
The primary goal of this review is to articulate existing understandings of UHI under HW conditions. Although understanding the synergies between UHI and HW is still an open research issue, some general findings can be summarized, which provide insight into the three key questions outlined in the Introduction.
- How does HW affect UHI?
HWs usually result in higher temperatures in both urban and rural areas. The intensity of UHI depends on the background climate and the different responses to HWs between urban and rural sites. Most studies note intensified UHII during HWs, while other studies find no apparent synergies between them or even a reduced UHII in HWs.
- What are the main drivers controlling the synergies between UHI and HW?
The synergies between UHI and HW are influenced by various factors, such as the morphology, population, climate background and many more [29,45]. For the daytime, the main changes in the energy budgets identified in most studies are the differences in latent heat flux and net all-wave radiation between urban and rural areas, and the relevant drivers include vegetation fraction, evapotranspiration, soil moisture (precipitation) and albedo, etc. For the nighttime, the main changes lie in the differences in the heat storage fluxes (to be released at night) between urban and rural areas, and the relevant drivers include city size and albedo, etc. Increased anthropogenic heat flux due to greater usage of air-conditioning systems and changes in wind conditions can also significantly amplify both daytime and nighttime UHII.
- What can be done to mitigate UHI under HW conditions?
Several strategies have been proposed to mitigate UHI under heatwave conditions. First, increasing surface albedo can significantly reduce the net solar radiation on surfaces and thus lower the urban ambient temperature. It should be noted that high albedo values above 0.8 are only applicable for clean coated surfaces and may cause visual discomfort (glare), and thus intermediate albedo values around 0.5 are more practical [106]. Second, increasing vegetation coverage in urban areas may be effective, but city planners should consider irrigation availability. In addition, the increased humidity due to irrigation may reduce human comfort in hot and humid regions. Finally, the combination of different strategies may reduce UHII, but their effectiveness needs to be further investigated.
3.2. Research Gaps and Suggestions for Future Research
- Time duration: Some studies, such as [25,108], only consider a short time period or even a single heatwave event, which may not be sufficiently representative of long-term behavior. However, the evolution of climate change is a long-term and complex process, and HWs are reported to become more intense and last for longer durations in the future [57]. Therefore, future studies exploring the synergies between UHI and HW and mitigation strategies should consider multi-year datasets or even future weather datasets.
- Study area: The synergistic effect between UHI and HW has been quantified mostly for metropolitan cities, but few studies have considered the different responses of urban and non-urban sites to HWs. Future studies should focus more on developing countries and the comparison between urban and rural sites. More detailed classifications such as low-intensity urban areas, high-intensity urban areas, forest, grassland and croplands, may be considered and compared. Moreover, although individual cities in different regions are worth investigating due to their unique geographies and climates [163], further studies may pay more attention to the comparisons among cities of different sizes or with different climates to reveal the general trend.
- Research method: In terms of numerical simulation, more complex UCMs such as MLUCMs may be preferred over the SLUCM for better prediction [25,84,164,165], but the latter is computationally inexpensive. In addition, high-resolution downscaling methods [166] may be considered in further studies. In terms of onsite observations, unified and dense weather stations can be established to improve spatial resolution. The data obtained through onsite measurements can be used to validate the numerical simulations. It is also advisable that a hybrid method incorporating both numerical simulations and onsite observations may be adopted alongside machine learning methods to construct accurate prediction models [167].
- UHI types: Despite a great deal of studies on UHIs during HWs, few studies have considered the differences in the thermal conditions, such as the temperature between urban and rural areas in the entire urban boundary layer. In addition, the relationships between the different UHI types also need to be investigated as studying the connections between air temperature and surface temperature may enable us to better understand the heat transfer in the atmospheric boundary layer and propose effective mitigation methods.
- Efficacy of mitigation strategies: When considering vegetation as a strategy, factors such as the efficiency of water use for different irrigation methods must be considered. Moreover, the choice of optimal vegetation type for different urban morphologies should be studied for cities in different climates. The sensitivity to soil moisture is worth investigating to provide more information about variations in latent heat flux. Mitigation by highly reflective surfaces may be effective in summer but may be undesirable in winter. The efficacy of these strategies for the mitigation of the HW effect and their impact in various seasons and in future climates should be investigated. More studies on the efficiency of combined mitigation strategies involving various physical mechanisms and processes should be conducted. In addition, studies on the efficiency of lightweight building materials may be conducted as they have a smaller heat capacity, which may reduce heat release at night. It is also worth noting that the efficacy of mitigation strategies may need to be assessed with reference to the ‘absolute’ urban thermal climate in addition to UHII due to the large diurnal variation in UHII and other factors influencing thermal sensation, as suggested by Martilli et al. [168].
- Health, economy and environmental considerations: Future work may consider other environmental and socio-economic impacts of the mitigation strategies, such as their impact on air quality, storm water, energy use, health, thermal comfort, visual comfort (albedo change), social aspects as wellbeing, costs and so on.
- Other considerations: A holistic approach considering changes in both climate and urbanization (horizontal and vertical spatial extent, building size, building material) may be adopted in future studies. Ramamurthy and Bou-Zeid [89] pointed out that the soil state and properties in urban areas are different from natural soils, which leads to variability in their thermal and hydrological characteristics. Accordingly, more research effort may be devoted to this topic.
4. Concluding Remark
HWs are expected to occur more and more frequently. Exploring the synergies between UHI and HW is necessary as it helps to identify the key drivers that may intensify urban overheating and thus may be helpful for the development of adequate mitigation strategies. The present review provides a comprehensive overview of studies on the interactions between UHI and HW and the mitigation methods during HW days. It is found that, although a variety of research topics have been covered in the open literature, a number of research gaps, such as overlooking the long-term effect of heatwave events and failure to consider different UHI types and their connections, etc., still exist and deserve more research attention. It should be noted that this review only considers papers published in English and included in the three main databases (i.e., ScienceDirect, Scopus and Web of Science). There may be other studies related to this topic but not included in this review due to the adopted selection criteria. Nevertheless, the majority of the studies on this topic have been covered in this study.
Supplementary Materials
The following are available online at https://0-www-mdpi-com.brum.beds.ac.uk/article/10.3390/su131910923/s1, Table S1: Summary of the reviewed articles related to studying UHI in HW, Table S2: Summary of studies investigating energy budget changes and relevant drivers, Table S3: Summary of the reviewed studies related to mitigation solutions of UHI in HWs.
Author Contributions
Writing—original draft preparation, J.K.; writing—review and editing, C.L., J.C., Y.Z. and J.K.; supervision, C.L., J.C. and Y.Z. All authors have read and agreed to the published version of the manuscript.
Funding
This research received no external funding.
Institutional Review Board Statement
Not applicable.
Informed Consent Statement
Not applicable.
Data Availability Statement
The data are available from the corresponding author upon request.
Acknowledgments
The first and last authors are grateful for the financial support of the School of Civil Engineering, the University of Sydney. The second and third authors are grateful for the financial support of the Swiss National Science Foundation (Grant 200021169323) and ETH Research Grant ETH-08 16-2. The authors also thank Rahul Kumar for providing the detailed data in [56].
Conflicts of Interest
The authors declare no conflict of interest.
References
- Yun, G.Y.; Ngarambe, J.; Duhirwe, P.N.; Ulpiani, G.; Paolini, R.; Haddad, S.; Vasilakopoulou, K.; Santamouris, M. Predicting the magnitude and the characteristics of the urban heat island in coastal cities in the proximity of desert landforms. The case of Sydney. Sci. Total. Environ. 2020, 709, 136068. [Google Scholar] [CrossRef]
- Kim, S.W.; Brown, R.D. Urban heat island (UHI) intensity and magnitude estimations: A systematic literature review. Sci. Total. Environ. 2021, 779, 146389. [Google Scholar] [CrossRef]
- He, B.-J.; Ding, L.; Prasad, D. Relationships among local-scale urban morphology, urban ventilation, urban heat island and outdoor thermal comfort under sea breeze influence. Sustain. Cities Soc. 2020, 60, 102289. [Google Scholar] [CrossRef]
- Santamouris, M. Recent progress on urban overheating and heat island research. Integrated assessment of the energy, environmental, vulnerability and health impact. Synergies with the global climate change. Energy Build. 2020, 207, 109482. [Google Scholar] [CrossRef]
- Steeneveld, G.J.; Koopmans, S.; Heusinkveld, B.G.; Theeuwes, N.E. Refreshing the role of open water surfaces on mitigating the maximum urban heat island effect. Landsc. Urban Plan. 2014, 121, 92–96. [Google Scholar] [CrossRef]
- Imran, H.M.; Kala, J.; Ng, A.W.M.; Muthukumaran, S. Effectiveness of green and cool roofs in mitigating urban heat island effects during a heatwave event in the city of Melbourne in southeast Australia. J. Clean. Prod. 2018, 197, 393–405. [Google Scholar] [CrossRef]
- Li, Y.; Schubert, S.; Kropp, J.P.; Rybski, D. On the influence of density and morphology on the Urban Heat Island intensity. Nat. Commun. 2020, 11, 1–9. [Google Scholar] [CrossRef] [PubMed]
- Jamei, Y.; Rajagopalan, P.; Sun, Q.C. Spatial structure of surface urban heat island and its relationship with vegetation and built-up areas in Melbourne, Australia. Sci. Total. Environ. 2019, 659, 1335–1351. [Google Scholar] [CrossRef] [PubMed]
- Gao, K.; Santamouris, M.; Feng, J. On the cooling potential of irrigation to mitigate urban heat island. Sci. Total. Environ. 2020, 740, 139754. [Google Scholar] [CrossRef]
- Zhao, L.; Lee, X.; Smith, R.B.; Oleson, K. Strong contributions of local background climate to urban heat islands. Nature 2014, 511, 216–219. [Google Scholar] [CrossRef]
- Manoli, G.; Fatichi, S.; Schläpfer, M.; Yu, K.; Crowther, T.W.; Meili, N.; Burlando, P.; Katul, G.G.; Bou-Zeid, E. Magnitude of urban heat islands largely explained by climate and population. Nature 2019, 573, 55–60. [Google Scholar] [CrossRef]
- Li, D.; Liao, W.; Rigden, A.J.; Liu, X.; Wang, D.; Malyshev, S.; Shevliakova, E. Urban heat island: Aerodynamics or imperviousness? Sci. Adv. 2019, 5, eaau4299. [Google Scholar] [CrossRef] [Green Version]
- Zinzi, M.; Agnoli, S.; Burattini, C.; Mattoni, B. On the thermal response of buildings under the synergic effect of heat waves and urban heat island. Sol. Energy 2020, 211, 1270–1282. [Google Scholar] [CrossRef]
- Santamouris, M.; Haddad, S.; Saliari, M.; Vasilakopoulou, K.; Synnefa, A.; Paolini, R.; Ulpiani, G.; Garshasbi, S.; Fiorito, F. On the energy impact of urban heat island in Sydney: Climate and energy potential of mitigation technologies. Energy Build. 2018, 166, 154–164. [Google Scholar] [CrossRef]
- Santamouris, M. On the energy impact of urban heat island and global warming on buildings. Energy Build. 2014, 82, 100–113. [Google Scholar] [CrossRef]
- Santamouris, M.; Papanikolaou, N.; Livada, I.; Koronakis, I.; Georgakis, C.; Argiriou, A.; Assimakopoulos, D. On the impact of urban climate on the energy consumption of buildings. Sol. Energy 2001, 70, 201–216. [Google Scholar] [CrossRef]
- Baccini, M.; Biggeri, A.; Accetta, G.; Kosatsky, T.; Katsouyanni, K.; Analitis, A.; Anderson, H.R.; Bisanti, L.; D’Ippoliti, D.; Danova, J. Heat effects on mortality in 15 European cities. Epidemiology 2008, 19, 711–719. [Google Scholar] [CrossRef]
- Sarkar, C.; Webster, C. Urban environments and human health: Current trends and future directions. Curr. Opin. Environ. Sustain. 2017, 25, 33–44. [Google Scholar] [CrossRef]
- Katavoutas, G.; Founda, D. Response of Urban Heat Stress to Heat Waves in Athens (1960–2017). Atmosphere 2019, 10, 483. [Google Scholar] [CrossRef] [Green Version]
- Vicedo-Cabrera, A.M.; Scovronick, N.; Sera, F.; Royé, D.; Schneider, R.; Tobias, A.; Astrom, C.; Guo, Y.; Honda, Y.; Hondula, D. The burden of heat-related mortality attributable to recent human-induced climate change. Nat. Clim. Chang. 2021, 11, 492–500. [Google Scholar] [CrossRef]
- O’Neill, M.S.; Ebi, K.L. Temperature extremes and health: Impacts of climate variability and change in the United States. J. Occup. Environ. Med. 2009, 51, 13–25. [Google Scholar] [CrossRef]
- Victorian Auditor-General’s Report: Heatwave management: Reducing the Risk to Public Health. Available online: https://www.audit.vic.gov.au/sites/default/files/2017-07/20141014-Heatwave-Management.pdf (accessed on 22 September 2021).
- Whitman, S.; Good, G.; Donoghue, E.R.; Benbow, N.; Shou, W.; Mou, S. Mortality in Chicago attributed to the July 1995 heat wave. Am. J. Public Health 1997, 87, 1515–1518. [Google Scholar] [CrossRef] [Green Version]
- Zhong, S.; Qian, Y.; Zhao, C.; Leung, R.; Wang, H.; Yang, B.; Fan, J.; Yan, H.; Yang, X.-Q.; Liu, D. Urbanization-induced urban heat island and aerosol effects on climate extremes in the Yangtze River Delta region of China. Atmos. Chem. Phys. 2017, 17, 5439–5457. [Google Scholar] [CrossRef] [Green Version]
- Chew, L.W.; Liu, X.; Li, X.-X.; Norford, L.K. Interaction between heat wave and urban heat island: A case study in a tropical coastal city, Singapore. Atmos. Res. 2021, 247, 105134. [Google Scholar] [CrossRef]
- Lhotka, O.; Kyselý, J.; Farda, A. Climate change scenarios of heat waves in Central Europe and their uncertainties. Theor. Appl. Climatol. 2018, 131, 1043–1054. [Google Scholar] [CrossRef]
- Li, D.; Sun, T.; Liu, M.; Wang, L.; Gao, Z. Changes in Wind Speed under Heat Waves Enhance Urban Heat Islands in the Beijing Metropolitan Area. J. Appl. Meteorol. Climatol. 2016, 55, 2369–2375. [Google Scholar] [CrossRef]
- Li, D.; Sun, T.; Liu, M.; Yang, L.; Wang, L.; Gao, Z. Contrasting responses of urban and rural surface energy budgets to heat waves explain synergies between urban heat islands and heat waves. Environ. Res. Lett. 2015, 10, 054009. [Google Scholar] [CrossRef]
- An, N.; Dou, J.; González-Cruz, J.E.; Bornstein, R.D.; Miao, S.; Li, L. An Observational Case Study of Synergies between an Intense Heat Wave and the Urban Heat Island in Beijing. J. Appl. Meteorol. Climatol. 2020, 59, 605–620. [Google Scholar] [CrossRef]
- Oliveira, A.; Lopes, A.; Correia, E.; Niza, S.; Soares, A. Heatwaves and Summer Urban Heat Islands: A Daily Cycle Approach to Unveil the Urban Thermal Signal Changes in Lisbon, Portugal. Atmosphere 2021, 12, 292. [Google Scholar] [CrossRef]
- Ferrari, A.; Kubilay, A.; Derome, D.; Carmeliet, J. The use of permeable and reflective pavements as a potential strategy for urban heat island mitigation. Urban Clim. 2020, 31, 100534. [Google Scholar] [CrossRef]
- Kubilay, A.; Allegrini, J.; Strebel, D.; Zhao, Y.; Derome, D.; Carmeliet, J. Advancement in Urban Climate Modelling at Local Scale: Urban Heat Island Mitigation and Building Cooling Demand. Atmosphere 2020, 11, 1313. [Google Scholar] [CrossRef]
- Kubilay, A.; Ferrari, A.; Derome, D.; Carmeliet, J. Smart wetting of permeable pavements as an evaporative-cooling measure for improving the urban climate during heat waves. J. Build. Phys. 2020, 45, 36–66. [Google Scholar] [CrossRef]
- Sun, T.; Kotthaus, S.; Li, D.; Ward, H.C.; Gao, Z.; Ni, G.-H.; Grimmond, C.S.B. Attribution and mitigation of heat wave-induced urban heat storage change. Environ. Res. Lett. 2017, 12, 114007. [Google Scholar] [CrossRef] [Green Version]
- Rossi, F.; Castellani, B.; Presciutti, A.; Morini, E.; Filipponi, M.; Nicolini, A.; Santamouris, M. Retroreflective façades for urban heat island mitigation: Experimental investigation and energy evaluations. Appl. Energy 2015, 145, 8–20. [Google Scholar] [CrossRef]
- Onishi, A.; Cao, X.; Ito, T.; Shi, F.; Imura, H. Evaluating the potential for urban heat-island mitigation by greening parking lots. Urban For. Urban Green. 2010, 9, 323–332. [Google Scholar] [CrossRef]
- Mussetti, G.; Brunner, D.; Henne, S.; Allegrini, J.; Krayenhoff, E.S.; Schubert, S.; Feigenwinter, C.; Vogt, R.; Wicki, A.; Carmeliet, J. COSMO-BEP-Tree v1. 0: A coupled urban climate model with explicit representation of street trees. Geosci. Model Dev. 2020, 13, 1685–1710. [Google Scholar] [CrossRef] [Green Version]
- Chen, T.; Yang, H.; Chen, G.; Lam, C.K.C.; Hantg, J.; Wang, X.; Liu, Y.; Ling, H. Integrated impacts of tree planting and aspect ratios on thermal environment in street canyons by scaled outdoor experiments. Sci. Total. Environ. 2021, 764, 142920. [Google Scholar] [CrossRef]
- Ng, E.; Chen, L.; Wang, Y.; Yuan, C. A study on the cooling effects of greening in a high-density city: An experience from Hong Kong. Build. Environ. 2012, 47, 256–271. [Google Scholar] [CrossRef]
- Wang, Y.; Akbari, H. Analysis of urban heat island phenomenon and mitigation solutions evaluation for Montreal. Sustain. Cities Soc. 2016, 26, 438–446. [Google Scholar] [CrossRef]
- Wang, Y.; Akbari, H. The effects of street tree planting on Urban Heat Island mitigation in Montreal. Sustain. Cities Soc. 2016, 27, 122–128. [Google Scholar] [CrossRef]
- Solecki, W.D.; Rosenzweig, C.; Parshall, L.; Pope, G.; Clark, M.; Cox, J.; Wiencke, M. Mitigation of the heat island effect in urban New Jersey. Glob. Environ. Chang. Part B Environ. Hazards 2005, 6, 39–49. [Google Scholar] [CrossRef]
- Susca, T.; Gaffin, S.R.; Dell’Osso, G. Positive effects of vegetation: Urban heat island and green roofs. Environ. Pollut. 2011, 159, 2119–2126. [Google Scholar] [CrossRef]
- Bahi, H.; Mastouri, H.; Radoine, H. Review of methods for retrieving urban heat islands. Mater. Today Proc. 2020, 27, 3004–3009. [Google Scholar] [CrossRef]
- Ngarambe, J.; Nganyiyimana, J.; Kim, I.; Santamouris, M.; Yun, G.Y. Synergies between urban heat island and heat waves in Seoul: The role of wind speed and land use characteristics. PLoS ONE 2020, 15, e0243571. [Google Scholar] [CrossRef]
- Jiang, S.; Lee, X.; Wang, J.; Wang, K. Amplified Urban Heat Islands during Heat Wave Periods. J. Geophys. Res. Atmos. 2019, 124, 7797–7812. [Google Scholar] [CrossRef] [Green Version]
- De Ridder, K.; Maiheu, B.; Lauwaet, D.; Daglis, I.; Keramitsoglou, I.; Kourtidis, K.; Manunta, P.; Paganini, M. Urban Heat Island Intensification during Hot Spells—The Case of Paris during the Summer of 2003. Urban Sci. 2017, 1, 3. [Google Scholar] [CrossRef] [Green Version]
- Richard, Y.; Pohl, B.; Rega, M.; Pergaud, J.; Thevenin, T.; Emery, J.; Dudek, J.; Vairet, T.; Zito, S.; Chateau-Smith, C. Is Urban Heat Island intensity higher during hot spells and heat waves (Dijon, France, 2014–2019)? Urban Clim. 2021, 35, 100747. [Google Scholar] [CrossRef]
- Scott, A.A.; Waugh, D.W.; Zaitchik, B.F. Reduced Urban Heat Island intensity under warmer conditions. Environ. Res. Lett. 2018, 13, 064003. [Google Scholar] [CrossRef]
- Stewart, I.D. A systematic review and scientific critique of methodology in modern urban heat island literature. Int. J. Climatol. 2011, 31, 200–217. [Google Scholar] [CrossRef]
- Keramitsoglou, I.; Daglis, I.A.; Amiridis, V.; Chrysoulakis, N.; Ceriola, G.; Manunta, P.; Maiheu, B.; De Ridder, K.; Lauwaet, D.; Paganini, M. Evaluation of satellite-derived products for the characterization of the urban thermal environment. J. Appl. Remote Sens. 2012, 6, 061704. [Google Scholar] [CrossRef]
- Holderness, T.; Barr, S.; Dawson, R.; Hall, J. An evaluation of thermal Earth observation for characterizing urban heatwave event dynamics using the urban heat island intensity metric. Int. J. Remote Sens. 2013, 34, 864–884. [Google Scholar] [CrossRef] [Green Version]
- Ramamurthy, P.; Gonzalez, J.; Ortiz, L.; Arend, M.; Moshary, F. Impact of heatwave on a megacity: An observational analysis of New York City during July 2016. Environ. Res. Lett. 2017, 12, 054011. [Google Scholar] [CrossRef]
- Tomlinson, C.J.; Chapman, L.; Thornes, J.E.; Baker, C.J. Derivation of Birmingham’s summer surface urban heat island from MODIS satellite images. Int. J. Climatol. 2012, 32, 214–224. [Google Scholar] [CrossRef] [Green Version]
- Wu, C.-D.; Lung, S.-C.C.; Jan, J.-F. Development of a 3-D urbanization index using digital terrain models for surface urban heat island effects. ISPRS J. Photogramm. Remote Sens. 2013, 81, 1–11. [Google Scholar] [CrossRef]
- Kumar, R.; Mishra, V. Decline in surface urban heat island intensity in India during heatwaves. Environ. Res. Commun. 2019, 1, 031001. [Google Scholar] [CrossRef] [Green Version]
- Ward, K.; Lauf, S.; Kleinschmit, B.; Endlicher, W. Heat waves and urban heat islands in Europe: A review of relevant drivers. Sci. Total. Environ. 2016, 569, 527–539. [Google Scholar] [CrossRef]
- Herbel, I.; Croitoru, A.-E.; Rus, A.V.; Roşca, C.F.; Harpa, G.V.; Ciupertea, A.-F.; Rus, I. The impact of heat waves on surface urban heat island and local economy in Cluj-Napoca city, Romania. Theor. Appl. Climatol. 2018, 133, 681–695. [Google Scholar] [CrossRef]
- Rasilla, D.; Allende, F.; Martilli, A.; Fernández, F. Heat Waves and Human Well-Being in Madrid (Spain). Atmosphere 2019, 10, 288. [Google Scholar] [CrossRef] [Green Version]
- Skamarock, W.C.; Klemp, J.B.; Dudhia, J.; Gill, D.O.; Liu, Z.; Berner, J.; Wang, W.; Powers, J.G.; Duda, M.G.; Barker, D.M. A Description of the Advanced Research WRF Model Version 4; National Center for Atmospheric Research: Boulder, CO, USA, 2019; p. 145. [Google Scholar]
- Grell, G.A.; Peckham, S.E.; Schmitz, R.; McKeen, S.A.; Frost, G.; Skamarock, W.C.; Eder, B. Fully coupled “online” chemistry within the WRF model. Atmos. Environ. 2005, 39, 6957–6975. [Google Scholar] [CrossRef]
- Schättler, G.; Doms, G.; Schraff, C. A Description of the Nonhydrostatic Regional COSMO-Model Part VII: User’s Guide; Deutscher Wetterdienst: Offenbach, Germany, 2016. [Google Scholar]
- Gerard, L.; Piriou, J.-M.; Brožková, R.; Geleyn, J.-F.; Banciu, D. Cloud and Precipitation Parameterization in a Meso-Gamma-Scale Operational Weather Prediction Model. Mon. Weather Rev. 2009, 137, 3960–3977. [Google Scholar] [CrossRef]
- De Ridder, K.; Lauwaet, D.; Maiheu, B. UrbClim—A fast urban boundary layer climate model. Urban Clim. 2015, 12, 21–48. [Google Scholar] [CrossRef] [Green Version]
- Lafore, J.P.; Stein, J.; Asencio, N.; Bougeault, P.; Ducrocq, V.; Duron, J.; Fischer, C.; Héreil, P.; Mascart, P.; Masson, V. The Meso-NH atmospheric simulation system. Part I: Adiabatic formulation and control simulations. Ann. Geophys. 1997, 16, 90–109. [Google Scholar] [CrossRef]
- Lac, C.; Chaboureau, J.-P.; Masson, V.; Pinty, J.-P.; Tulet, P.; Escobar, J.; Leriche, M.; Barthe, C.; Aouizerats, B.; Augros, C.; et al. Overview of the Meso-NH model version 5.4 and its applications. Geosci. Model Dev. 2018, 11, 1929–1969. [Google Scholar] [CrossRef] [Green Version]
- Sievers, U. Das kleinskalige Strömungsmodell MUKLIMO_3. Teil 1: Theoretische Grundlagen, PC-Basisversion und Validierung; Deutschen Wetterdienstes: Offenbach am Maine, Germany, 2012. [Google Scholar]
- Sievers, U. Das kleinskalige Strömungsmodell MUKLIMO_3. Teil 2: Thermodynamische Erweiterungen; Deutschen Wetterdienstes: Offenbach am Maine, Germany, 2016. [Google Scholar]
- Hurrell, J.W.; Holland, M.M.; Gent, P.R.; Ghan, S.; Kay, J.E.; Kushner, P.J.; Lamarque, J.-F.; Large, W.G.; Lawrence, D.; Lindsay, K. The community earth system model: A framework for collaborative research. Bull. Am. Meteorol. Soc. 2013, 94, 1339–1360. [Google Scholar] [CrossRef]
- Geletič, J.; Lehnert, M.; Jurek, M. Spatiotemporal variability of air temperature during a heat wave in real and modified landcover conditions: Prague and Brno (Czech Republic). Urban Clim. 2020, 31, 100588. [Google Scholar] [CrossRef]
- Kwok, Y.T.; Ng, E.Y.Y. Trends, topics, and lessons learnt from real case studies using mesoscale atmospheric models for urban climate applications in 2000–2019. Urban Clim. 2021, 36, 100785. [Google Scholar] [CrossRef]
- Luo, X.; Vahmani, P.; Hong, T.; Jones, A. City-Scale Building Anthropogenic Heating during Heat Waves. Atmosphere 2020, 11, 1206. [Google Scholar] [CrossRef]
- He, X.; Wang, J.; Feng, J.; Yan, Z.; Miao, S.; Zhang, Y.; Xia, J. Observational and modeling study of interactions between urban heat island and heatwave in Beijing. J. Clean. Prod. 2020, 247, 119169. [Google Scholar] [CrossRef]
- Gao, Z.; Hou, Y.; Chen, W. Enhanced sensitivity of the urban heat island effect to summer temperatures induced by urban expansion. Environ. Res. Lett. 2019, 14, 094005. [Google Scholar] [CrossRef] [Green Version]
- Pokhrel, R.; Ramírez-Beltran, N.D.; González, J.E. On the assessment of alternatives for building cooling load reductions for a tropical coastal city. Energy Build. 2019, 182, 131–143. [Google Scholar] [CrossRef]
- Chen, F.; Dudhia, J. Coupling an advanced land surface–hydrology model with the Penn State–NCAR MM5 modeling system. Part I: Model implementation and sensitivity. Mon. Weather Rev. 2001, 129, 569–585. [Google Scholar] [CrossRef] [Green Version]
- Giannaros, C.; Nenes, A.; Giannaros, T.M.; Kourtidis, K.; Melas, D. A comprehensive approach for the simulation of the Urban Heat Island effect with the WRF/SLUCM modeling system: The case of Athens (Greece). Atmos. Res. 2018, 201, 86–101. [Google Scholar] [CrossRef]
- Cady, T.J.; Rahn, D.A.; Brunsell, N.A.; Lyles, W. Conversion of Abandoned Property to Green Space as a Strategy to Mitigate the Urban Heat Island Investigated with Numerical Simulations. J. Appl. Meteorol. Climatol. 2020, 59, 1827–1843. [Google Scholar] [CrossRef]
- Kusaka, H.; Kondo, H.; Kikegawa, Y.; Kimura, F. A simple single-layer urban canopy model for atmospheric models: Comparison with multi-layer and slab models. Bound.-Layer Meteorol. 2001, 101, 329–358. [Google Scholar] [CrossRef]
- Martilli, A.; Clappier, A.; Rotach, M.W. An urban surface exchange parameterisation for mesoscale models. Bound.-Layer Meteorol. 2002, 104, 261–304. [Google Scholar] [CrossRef]
- Heaviside, C.; Cai, X.M.; Vardoulakis, S. The effects of horizontal advection on the urban heat island in Birmingham and the West Midlands, United Kingdom during a heatwave. Q. J. R. Meteorol. Soc. 2015, 141, 1429–1441. [Google Scholar] [CrossRef] [Green Version]
- Fallmann, J.; Forkel, R.; Emeis, S. Secondary effects of urban heat island mitigation measures on air quality. Atmos. Environ. 2016, 125, 199–211. [Google Scholar] [CrossRef] [Green Version]
- Salamanca, F.; Krpo, A.; Martilli, A.; Clappier, A. A new building energy model coupled with an urban canopy parameterization for urban climate simulations—part I. formulation, verification, and sensitivity analysis of the model. Theor. Appl. Climatol. 2010, 99, 331–344. [Google Scholar] [CrossRef]
- Jandaghian, Z.; Berardi, U. Analysis of the cooling effects of higher albedo surfaces during heat waves coupling the Weather Research and Forecasting model with building energy models. Energy Build. 2020, 207, 109627. [Google Scholar] [CrossRef]
- Morini, E.; Touchaei, A.; Castellani, B.; Rossi, F.; Cotana, F. The Impact of Albedo Increase to Mitigate the Urban Heat Island in Terni (Italy) Using the WRF Model. Sustainability 2016, 8, 999. [Google Scholar] [CrossRef] [Green Version]
- Gutiérrez, E.; González, J.E.; Bornstein, R.; Arend, M.; Martilli, A. A New Modeling Approach to Forecast Building Energy Demands During Extreme Heat Events in Complex Cities. J. Sol. Energy Eng. 2013, 040906. [Google Scholar] [CrossRef]
- Salamanca, F.; Martilli, A. A new Building Energy Model coupled with an Urban Canopy Parameterization for urban climate simulations—part II. Validation with one dimension off-line simulations. Theor. Appl. Climatol. 2010, 99, 345–356. [Google Scholar] [CrossRef]
- Wang, Z.-H.; Bou-Zeid, E.; Smith, J.A. A coupled energy transport and hydrological model for urban canopies evaluated using a wireless sensor network. Q. J. R. Meteorol. Soc. 2013, 139, 1643–1657. [Google Scholar] [CrossRef]
- Ramamurthy, P.; Bou-Zeid, E. Heatwaves and urban heat islands: A comparative analysis of multiple cities. J. Geophys. Res. Atmos. 2017, 122, 168–178. [Google Scholar] [CrossRef]
- Ramamurthy, P.; Li, D.; Bou-Zeid, E. High-resolution simulation of heatwave events in New York City. Theor. Appl. Climatol. 2017, 128, 89–102. [Google Scholar] [CrossRef]
- Li, D.; Bou-Zeid, E.; Oppenheimer, M. The effectiveness of cool and green roofs as urban heat island mitigation strategies. Environ. Res. Lett. 2014, 9, 055002. [Google Scholar] [CrossRef]
- Masson, V. A physically-based scheme for the urban energy budget in atmospheric models. Bound.-Layer Meteorol. 2000, 94, 357–397. [Google Scholar] [CrossRef]
- Daniel, M.; Lemonsu, A.; Viguié, V. Role of watering practices in large-scale urban planning strategies to face the heat-wave risk in future climate. Urban Clim. 2018, 23, 287–308. [Google Scholar] [CrossRef]
- Masson, V.; Lion, Y.; Peter, A.; Pigeon, G.; Buyck, J.; Brun, E. “Grand Paris”: Regional landscape change to adapt city to climate warming. Clim. Chang. 2013, 117, 769–782. [Google Scholar] [CrossRef] [Green Version]
- Noilhan, J.; Mahfouf, J.-F. The ISBA land surface parameterisation scheme. Glob. Planet. Chang. 1996, 13, 145–159. [Google Scholar] [CrossRef]
- Broadbent, A.M.; Krayenhoff, E.S.; Georgescu, M. Efficacy of cool roofs at reducing pedestrian-level air temperature during projected 21st century heatwaves in Atlanta, Detroit, and Phoenix (USA). Environ. Res. Lett. 2020, 15, 084007. [Google Scholar] [CrossRef]
- Wang, X.; Liu, H.; Miao, S.; Wu, Q.; Zhang, N.; Qiao, F. Effectiveness of urban hydrological processes in mitigating urban heat island and human thermal stress during a heat wave event in Nanjing, China. J. Geophys. Res. Atmos. 2020, 125, e2020JD033275. [Google Scholar] [CrossRef]
- Macintyre, H.L.; Heaviside, C. Potential benefits of cool roofs in reducing heat-related mortality during heatwaves in a European city. Environ. Int. 2019, 127, 430–441. [Google Scholar] [CrossRef]
- Tewari, M.; Yang, J.; Kusaka, H.; Salamanca, F.; Watson, C.; Treinish, L. Interaction of urban heat islands and heat waves under current and future climate conditions and their mitigation using green and cool roofs in New York City and Phoenix, Arizona. Environ. Res. Lett. 2019, 14, 034002. [Google Scholar] [CrossRef]
- Falasca, S.; Ciancio, V.; Salata, F.; Golasi, I.; Rosso, F.; Curci, G. High albedo materials to counteract heat waves in cities: An assessment of meteorology, buildings energy needs and pedestrian thermal comfort. Build. Environ. 2019, 163, 106242. [Google Scholar] [CrossRef]
- Imran, H.M.; Kala, J.; Ng, A.W.M.; Muthukumaran, S. Effectiveness of vegetated patches as Green Infrastructure in mitigating Urban Heat Island effects during a heatwave event in the city of Melbourne. Weather Clim. Extrem. 2019, 25, 100217. [Google Scholar] [CrossRef]
- Chen, Y.; Zhang, N. Urban heat island mitigation effectiveness under extreme heat conditions in the Suzhou–Wuxi–Changzhou metropolitan area, China. J. Appl. Meteorol. Climatol. 2018, 57, 235–253. [Google Scholar] [CrossRef]
- Ortiz, L.E.; Gonzalez, J.E.; Wu, W.; Schoonen, M.; Tongue, J.; Bornstein, R. New York City Impacts on a Regional Heat Wave. J. Appl. Meteorol. Climatol. 2018, 57, 837–851. [Google Scholar] [CrossRef]
- Sun, T.; Grimmond, C.S.B.; Ni, G.-H. How do green roofs mitigate urban thermal stress under heat waves? J. Geophys. Res. Atmos. 2016, 121, 5320–5335. [Google Scholar] [CrossRef]
- Zhou, Y.; Shepherd, J.M. Atlanta’s urban heat island under extreme heat conditions and potential mitigation strategies. Nat. Hazards 2010, 52, 639–668. [Google Scholar] [CrossRef]
- Ma, H.; Shao, H.; Song, J. Modeling the relative roles of the foehn wind and urban expansion in the 2002 Beijing heat wave and possible mitigation by high reflective roofs. Meteorol. Atmos. Phys. 2014, 123, 105–114. [Google Scholar] [CrossRef]
- Wang, M.; Yan, X.; Liu, J.; Zhang, X. The contribution of urbanization to recent extreme heat events and a potential mitigation strategy in the Beijing–Tianjin–Hebei metropolitan area. Theor. Appl. Climatol. 2013, 114, 407–416. [Google Scholar] [CrossRef]
- Li, D.; Bou-Zeid, E. Synergistic Interactions between Urban Heat Islands and Heat Waves: The Impact in Cities Is Larger than the Sum of Its Parts. J. Appl. Meteorol. Climatol. 2013, 52, 2051–2064. [Google Scholar] [CrossRef] [Green Version]
- Jandaghian, Z.; Akbari, H. The Effect of Increasing Surface Albedo on Urban Climate and Air Quality: A Detailed Study for Sacramento, Houston, and Chicago. Climate 2018, 6, 19. [Google Scholar] [CrossRef] [Green Version]
- Chen, L.; Zhang, M.; Zhu, J.; Wang, Y.; Skorokhod, A. Modeling Impacts of Urbanization and Urban Heat Island Mitigation on Boundary Layer Meteorology and Air Quality in Beijing Under Different Weather Conditions. J. Geophys. Res. Atmos. 2018, 123, 4323–4344. [Google Scholar] [CrossRef]
- Touchaei, A.G.; Akbari, H.; Tessum, C.W. Effect of increasing urban albedo on meteorology and air quality of Montreal (Canada)—Episodic simulation of heat wave in 2005. Atmos. Environ. 2016, 132, 188–206. [Google Scholar] [CrossRef]
- Hamdi, R.; Duchêne, F.; Berckmans, J.; Delcloo, A.; Vanpoucke, C.; Termonia, P. Evolution of urban heat wave intensity for the Brussels Capital Region in the ARPEGE-Climat A1B scenario. Urban Clim. 2016, 17, 176–195. [Google Scholar] [CrossRef]
- Zhao, L.; Oppenheimer, M.; Zhu, Q.; Baldwin, J.W.; Ebi, K.L.; Bou-Zeid, E.; Guan, K.; Liu, X. Interactions between urban heat islands and heat waves. Environ. Res. Lett. 2018, 13, 034003. [Google Scholar] [CrossRef]
- Oke, T.R. Urban Climates; Cambridge University Press: Cambridge, UK, 2017. [Google Scholar]
- Ao, X.; Wang, L.; Zhi, X.; Gu, W.; Yang, H.; Li, D. Observed Synergies between Urban Heat Islands and Heat Waves and Their Controlling Factors in Shanghai, China. J. Appl. Meteorol. Climatol. 2019, 58, 1955–1972. [Google Scholar] [CrossRef] [Green Version]
- Perkins, S.E. A review on the scientific understanding of heatwaves—Their measurement, driving mechanisms, and changes at the global scale. Atmos. Res. 2015, 164–165, 242–267. [Google Scholar] [CrossRef]
- Unger, J.; Skarbit, N.; Kovács, A.; Gál, T. Comparison of regional and urban outdoor thermal stress conditions in heatwave and normal summer periods: A case study. Urban Clim. 2020, 32, 100619. [Google Scholar] [CrossRef]
- Hong, J.W.; Hong, J.; Kwon, E.E.; Yoon, D.K. Temporal dynamics of urban heat island correlated with the socio-economic development over the past half-century in Seoul, Korea. Environ. Pollut. 2019, 254, 112934. [Google Scholar] [CrossRef] [PubMed]
- Pyrgou, A.; Hadjinicolaou, P.; Santamouris, M. Urban-rural moisture contrast: Regulator of the urban heat island and heatwaves’ synergy over a mediterranean city. Environ. Res. 2020, 182, 109102. [Google Scholar] [CrossRef] [PubMed]
- Xu, Z.; FitzGerald, G.; Guo, Y.; Jalaludin, B.; Tong, S. Impact of heatwave on mortality under different heatwave definitions: A systematic review and meta-analysis. Environ. Int. 2016, 89–90, 193–203. [Google Scholar] [CrossRef]
- Steadman, R.G. A universal scale of apparent temperature. J. Appl. Meteorol. Climatol. 1984, 23, 1674–1687. [Google Scholar] [CrossRef]
- Founda, D.; Pierros, F.; Petrakis, M.; Zerefos, C. Interdecadal variations and trends of the Urban Heat Island in Athens (Greece) and its response to heat waves. Atmos. Res. 2015, 161–162, 1–13. [Google Scholar] [CrossRef]
- Founda, D.; Santamouris, M. Synergies between Urban Heat Island and Heat Waves in Athens (Greece), during an extremely hot summer (2012). Sci. Rep. 2017, 7, 10973. [Google Scholar] [CrossRef] [Green Version]
- Rogers, C.D.W.; Gallant, A.J.E.; Tapper, N.J. Is the urban heat island exacerbated during heatwaves in southern Australian cities? Theor. Appl. Climatol. 2019, 137, 441–457. [Google Scholar] [CrossRef]
- Davis, R.E.; Hondula, D.M.; Patel, A.P. Temperature Observation Time and Type Influence Estimates of Heat-Related Mortality in Seven U.S. Cities. Environ. Health Perspect. 2016, 124, 795–804. [Google Scholar] [CrossRef]
- Russo, S.; Sillmann, J.; Sterl, A. Humid heat waves at different warming levels. Sci. Rep. 2017, 7, 7477. [Google Scholar] [CrossRef]
- Fernando, H.J. Handbook of Environmental Fluid Dynamics, Volume Two: Systems, Pollution, Modeling, and Measurements; CRC press: Boca Raton, FL, USA, 2012. [Google Scholar]
- Khan, H.S.; Paolini, R.; Santamouris, M.; Caccetta, P. Exploring the Synergies between Urban Overheating and Heatwaves (HWs) in Western Sydney. Energies 2020, 13, 470. [Google Scholar] [CrossRef] [Green Version]
- Nicholson, A. Analysis of the diurnal cycle of air temperature between rural Berkshire and the University of Reading: Possible role of the urban heat island. Weather 2020, 75, 235–241. [Google Scholar] [CrossRef]
- Bohnenstengel, S.I.; Evans, S.; Clark, P.A.; Belcher, S.E. Simulations of the London urban heat island. Q. J. R. Meteorol. Soc. 2011, 137, 1625–1640. [Google Scholar] [CrossRef]
- Li, X.-X.; Koh, T.-Y.; Entekhabi, D.; Roth, M.; Panda, J.; Norford, L.K. A multi-resolution ensemble study of a tropical urban environment and its interactions with the background regional atmosphere. J. Geophys. Res. Atmos. 2013, 118, 9804–9818. [Google Scholar] [CrossRef]
- Kottek, M.; Grieser, J.; Beck, C.; Rudolf, B.; Rubel, F. World map of the Köppen-Geiger climate classification updated. Meteorol. Z. 2006, 15, 259–263. [Google Scholar] [CrossRef]
- Kunkel, K.E.; Changnon, S.A.; Reinke, B.C.; Arritt, R.W. The July 1995 heat wave in the Midwest: A climatic perspective and critical weather factors. Bull. Am. Meteorol. Soc. 1996, 77, 1507–1518. [Google Scholar] [CrossRef] [Green Version]
- Oke, T.; Cleugh, H. Urban heat storage derived as energy balance residuals. Bound.-Layer Meteorol. 1987, 39, 233–245. [Google Scholar] [CrossRef]
- Arnfield, A.J. Two decades of urban climate research: A review of turbulence, exchanges of energy and water, and the urban heat island. Int. J. Climatol. J. R. Meteorol. Soc. 2003, 23, 1–26. [Google Scholar] [CrossRef]
- Barlow, J.F. Progress in observing and modelling the urban boundary layer. Urban Clim. 2014, 10, 216–240. [Google Scholar] [CrossRef] [Green Version]
- Oke, T.R. Boundary Layer Climates, 2nd ed.; Routledge: London, UK, 2002; p. 26. [Google Scholar]
- Ward, H.C.; Evans, J.G.; Grimmond, C.S.B. Multi-season eddy covariance observations of energy, water and carbon fluxes over a suburban area in Swindon, UK. Atmos. Chem. Phys. 2013, 13, 4645–4666. [Google Scholar] [CrossRef] [Green Version]
- Wang, L.; Li, D.; Gao, Z.; Sun, T.; Guo, X.; Bou-Zeid, E. Turbulent Transport of Momentum and Scalars Above an Urban Canopy. Bound.-Layer Meteorol. 2014, 150, 485–511. [Google Scholar] [CrossRef]
- Offerle, B.; Grimmond, C.S.B.; Fortuniak, K.; Kłysik, K.; Oke, T.R. Temporal variations in heat fluxes over a central European city centre. Theor. Appl. Climatol. 2006, 84, 103–115. [Google Scholar] [CrossRef]
- Kotthaus, S.; Grimmond, C.S.B. Energy exchange in a dense urban environment—Part I: Temporal variability of long-term observations in central London. Urban Clim. 2014, 10, 261–280. [Google Scholar] [CrossRef] [Green Version]
- Ching, J.; Clarke, J.; Godowitch, J. Modulation of heat flux by different scales of advection in an urban environment. Bound.-Layer Meteorol. 1983, 25, 171–191. [Google Scholar] [CrossRef]
- Schatz, J.; Kucharik, C.J. Urban climate effects on extreme temperatures in Madison, Wisconsin, USA. Environ. Res. Lett. 2015, 10, 094024. [Google Scholar] [CrossRef] [Green Version]
- Zeng, Z.; Piao, S.; Li, L.Z.X.; Zhou, L.; Ciais, P.; Wang, T.; Li, Y.; Lian, X.; Wood, E.F.; Friedlingstein, P.; et al. Climate mitigation from vegetation biophysical feedbacks during the past three decades. Nat. Clim. Chang. 2017, 7, 432–436. [Google Scholar] [CrossRef]
- Monin, A.S.; Obukhov, A.M. Basic laws of turbulent mixing in the surface layer of the atmosphere. Contrib. Geophys. Inst. Acad. Sci. USSR 1954, 151, e187. [Google Scholar]
- Itenfisu, D.; Elliott, R.L.; Allen, R.G.; Walter, I.A. Comparison of reference evapotranspiration calculations as part of the ASCE standardization effort. J. Irrig. Drain. Eng. 2003, 129, 440–448. [Google Scholar] [CrossRef]
- Zangvil, A. Six years of dew observations in the Negev Desert, Israel. J. Arid. Environ. 1996, 32, 361–371. [Google Scholar] [CrossRef]
- Black, E.; Blackburn, M.; Harrison, G.; Hoskins, B.; Methven, J. Factors contributing to the summer 2003 European heatwave. Weather 2004, 59, 217–223. [Google Scholar] [CrossRef]
- Oláh, A. The possibilities of decreasing the urban heat island. Appl. Ecol. Environ. Res. 2012, 10, 173–183. [Google Scholar] [CrossRef]
- Masson, V.; Marchadier, C.; Adolphe, L.; Aguejdad, R.; Avner, P.; Bonhomme, M.; Bretagne, G.; Briottet, X.; Bueno, B.; de Munck, C.; et al. Adapting cities to climate change: A systemic modelling approach. Urban Clim. 2014, 10, 407–429. [Google Scholar] [CrossRef]
- Allegrini, J.; Dorer, V.; Carmeliet, J. Influence of the urban microclimate in street canyons on the energy demand for space cooling and heating of buildings. Energy Build. 2012, 55, 823–832. [Google Scholar] [CrossRef]
- Peng, S.; Piao, S.; Ciais, P.; Friedlingstein, P.; Ottle, C.; Breon, F.M.; Nan, H.; Zhou, L.; Myneni, R.B. Surface urban heat island across 419 global big cities. Environ. Sci. Technol. 2012, 46, 696–703. [Google Scholar] [CrossRef]
- Rahman, M.A.; Hartmann, C.; Moser-Reischl, A.; von Strachwitz, M.F.; Paeth, H.; Pretzsch, H.; Pauleit, S.; Rötzer, T. Tree cooling effects and human thermal comfort under contrasting species and sites. Agric. For. Meteorol. 2020, 287, 107947. [Google Scholar] [CrossRef]
- Rahman, M.A.; Moser, A.; Rötzer, T.; Pauleit, S. Comparing the transpirational and shading effects of two contrasting urban tree species. Urban Ecosyst. 2019, 22, 683–697. [Google Scholar] [CrossRef]
- Santamouris, M.; Ban-Weiss, G.; Osmond, P.; Paolini, R.; Synnefa, A.; Cartalis, C.; Muscio, A.; Zinzi, M.; Morakinyo, T.E.; Ng, E.; et al. Progress in Urban Greenery Mitigation Science—Assessment Methodologies Advanced Technologies and Impact on Cities. J. Civ. Eng. Manag. 2018, 24, 638–671. [Google Scholar] [CrossRef] [Green Version]
- Manickathan, L.; Defraeye, T.; Allegrini, J.; Derome, D.; Carmeliet, J. Parametric study of the influence of environmental factors and tree properties on the transpirative cooling effect of trees. Agric. For. Meteorol. 2018, 248, 259–274. [Google Scholar] [CrossRef] [Green Version]
- Alavipanah, S.; Wegmann, M.; Qureshi, S.; Weng, Q.; Koellner, T. The Role of Vegetation in Mitigating Urban Land Surface Temperatures: A Case Study of Munich, Germany during the Warm Season. Sustainability 2015, 7, 4689–4706. [Google Scholar] [CrossRef] [Green Version]
- Gill, S.E.; Handley, J.F.; Ennos, A.R.; Pauleit, S. Adapting cities for climate change: The role of the green infrastructure. Built Environ. 2007, 33, 115–133. [Google Scholar] [CrossRef] [Green Version]
- Ballinas, M.; Barradas, V.L. The Urban Tree as a Tool to Mitigate the Urban Heat Island in Mexico City: A Simple Phenomenological Model. J. Environ. Qual. 2016, 45, 157–166. [Google Scholar] [CrossRef] [PubMed]
- Rahman, M.A.; Moser, A.; Gold, A.; Rotzer, T.; Pauleit, S. Vertical air temperature gradients under the shade of two contrasting urban tree species during different types of summer days. Sci. Total Environ. 2018, 633, 100–111. [Google Scholar] [CrossRef] [PubMed]
- Gao, K.; Santamouris, M. The use of water irrigation to mitigate ambient overheating in the built environment: Recent progress. Build. Environ. 2019, 164, 106346. [Google Scholar] [CrossRef]
- Broadbent, A.M.; Coutts, A.M.; Tapper, N.J.; Demuzere, M. The cooling effect of irrigation on urban microclimate during heatwave conditions. Urban Clim. 2018, 23, 309–329. [Google Scholar] [CrossRef]
- Im, E.-S.; Pal, J.S.; Eltahir, E.A. Deadly heat waves projected in the densely populated agricultural regions of South Asia. Sci. Adv. 2017, 3, e1603322. [Google Scholar] [CrossRef] [Green Version]
- Mughal, M.O.; Li, X.X.; Yin, T.; Martilli, A.; Brousse, O.; Dissegna, M.A.; Norford, L.K. High-resolution, multilayer modeling of Singapore’s urban climate incorporating local climate zones. J. Geophys. Res. Atmos. 2019, 124, 7764–7785. [Google Scholar] [CrossRef]
- Liu, X.; Li, X.-X.; Harshan, S.; Roth, M.; Velasco, E. Evaluation of an urban canopy model in a tropical city: The role of tree evapotranspiration. Environ. Res. Lett. 2017, 12, 094008. [Google Scholar] [CrossRef]
- Rai, R.K.; Berg, L.K.; Kosović, B.; Mirocha, J.D.; Pekour, M.S.; Shaw, W.J. Comparison of measured and numerically simulated turbulence statistics in a convective boundary layer over complex terrain. Bound.-Layer Meteorol. 2017, 163, 69–89. [Google Scholar] [CrossRef]
- Fan, Y.; Ding, X.; Wu, J.; Ge, J.; Li, Y. High spatial-resolution classification of urban surfaces using a deep learning method. Build. Environ. 2021, 200, 107949. [Google Scholar] [CrossRef]
- Martilli, A.; Krayenhoff, E.S.; Nazarian, N. Is the urban heat island intensity relevant for heat mitigation studies? Urban Clim. 2020, 31, 100541. [Google Scholar] [CrossRef]
Figure 1.
Selection process of the literature and the number of articles reviewed in this study.

Figure 2.
Reviewed studies by year of publication.

Figure 3.
Reviewed studies by study region (Note: some publications consider multiple countries/regions).
Figure 3.
Reviewed studies by study region (Note: some publications consider multiple countries/regions).

Figure 4.
Reviewed studies by methods for retrieving UHI.

Figure 5.
(Left) Illustration of the temperature differences forming the four types of UHI (modified from [114]) and (Right) classification of UHI types considered by the reviewed studies.
Figure 5.
(Left) Illustration of the temperature differences forming the four types of UHI (modified from [114]) and (Right) classification of UHI types considered by the reviewed studies.

Figure 6.
Summary of the reported HM in different regions (red: positive HM, blue: negative HM, and green: HM equals zero).
Figure 6.
Summary of the reported HM in different regions (red: positive HM, blue: negative HM, and green: HM equals zero).

Figure 7.
Schematic of energy balance: (a) surface energy balance in urban area, (b) surface energy balance in rural area, (c) surface radiation budget at daytime and (d) surface radiation budget at nighttime (modified from [114,137]).

Figure 8.
Relationships between the energy budget (in yellow circles) and corresponding drivers (in blue circles).
Figure 8.
Relationships between the energy budget (in yellow circles) and corresponding drivers (in blue circles).

Figure 9.
Summary of studies related to UHI mitigation measures under HW conditions (ET. is abbreviation for evapotranspiration).
Figure 9.
Summary of studies related to UHI mitigation measures under HW conditions (ET. is abbreviation for evapotranspiration).


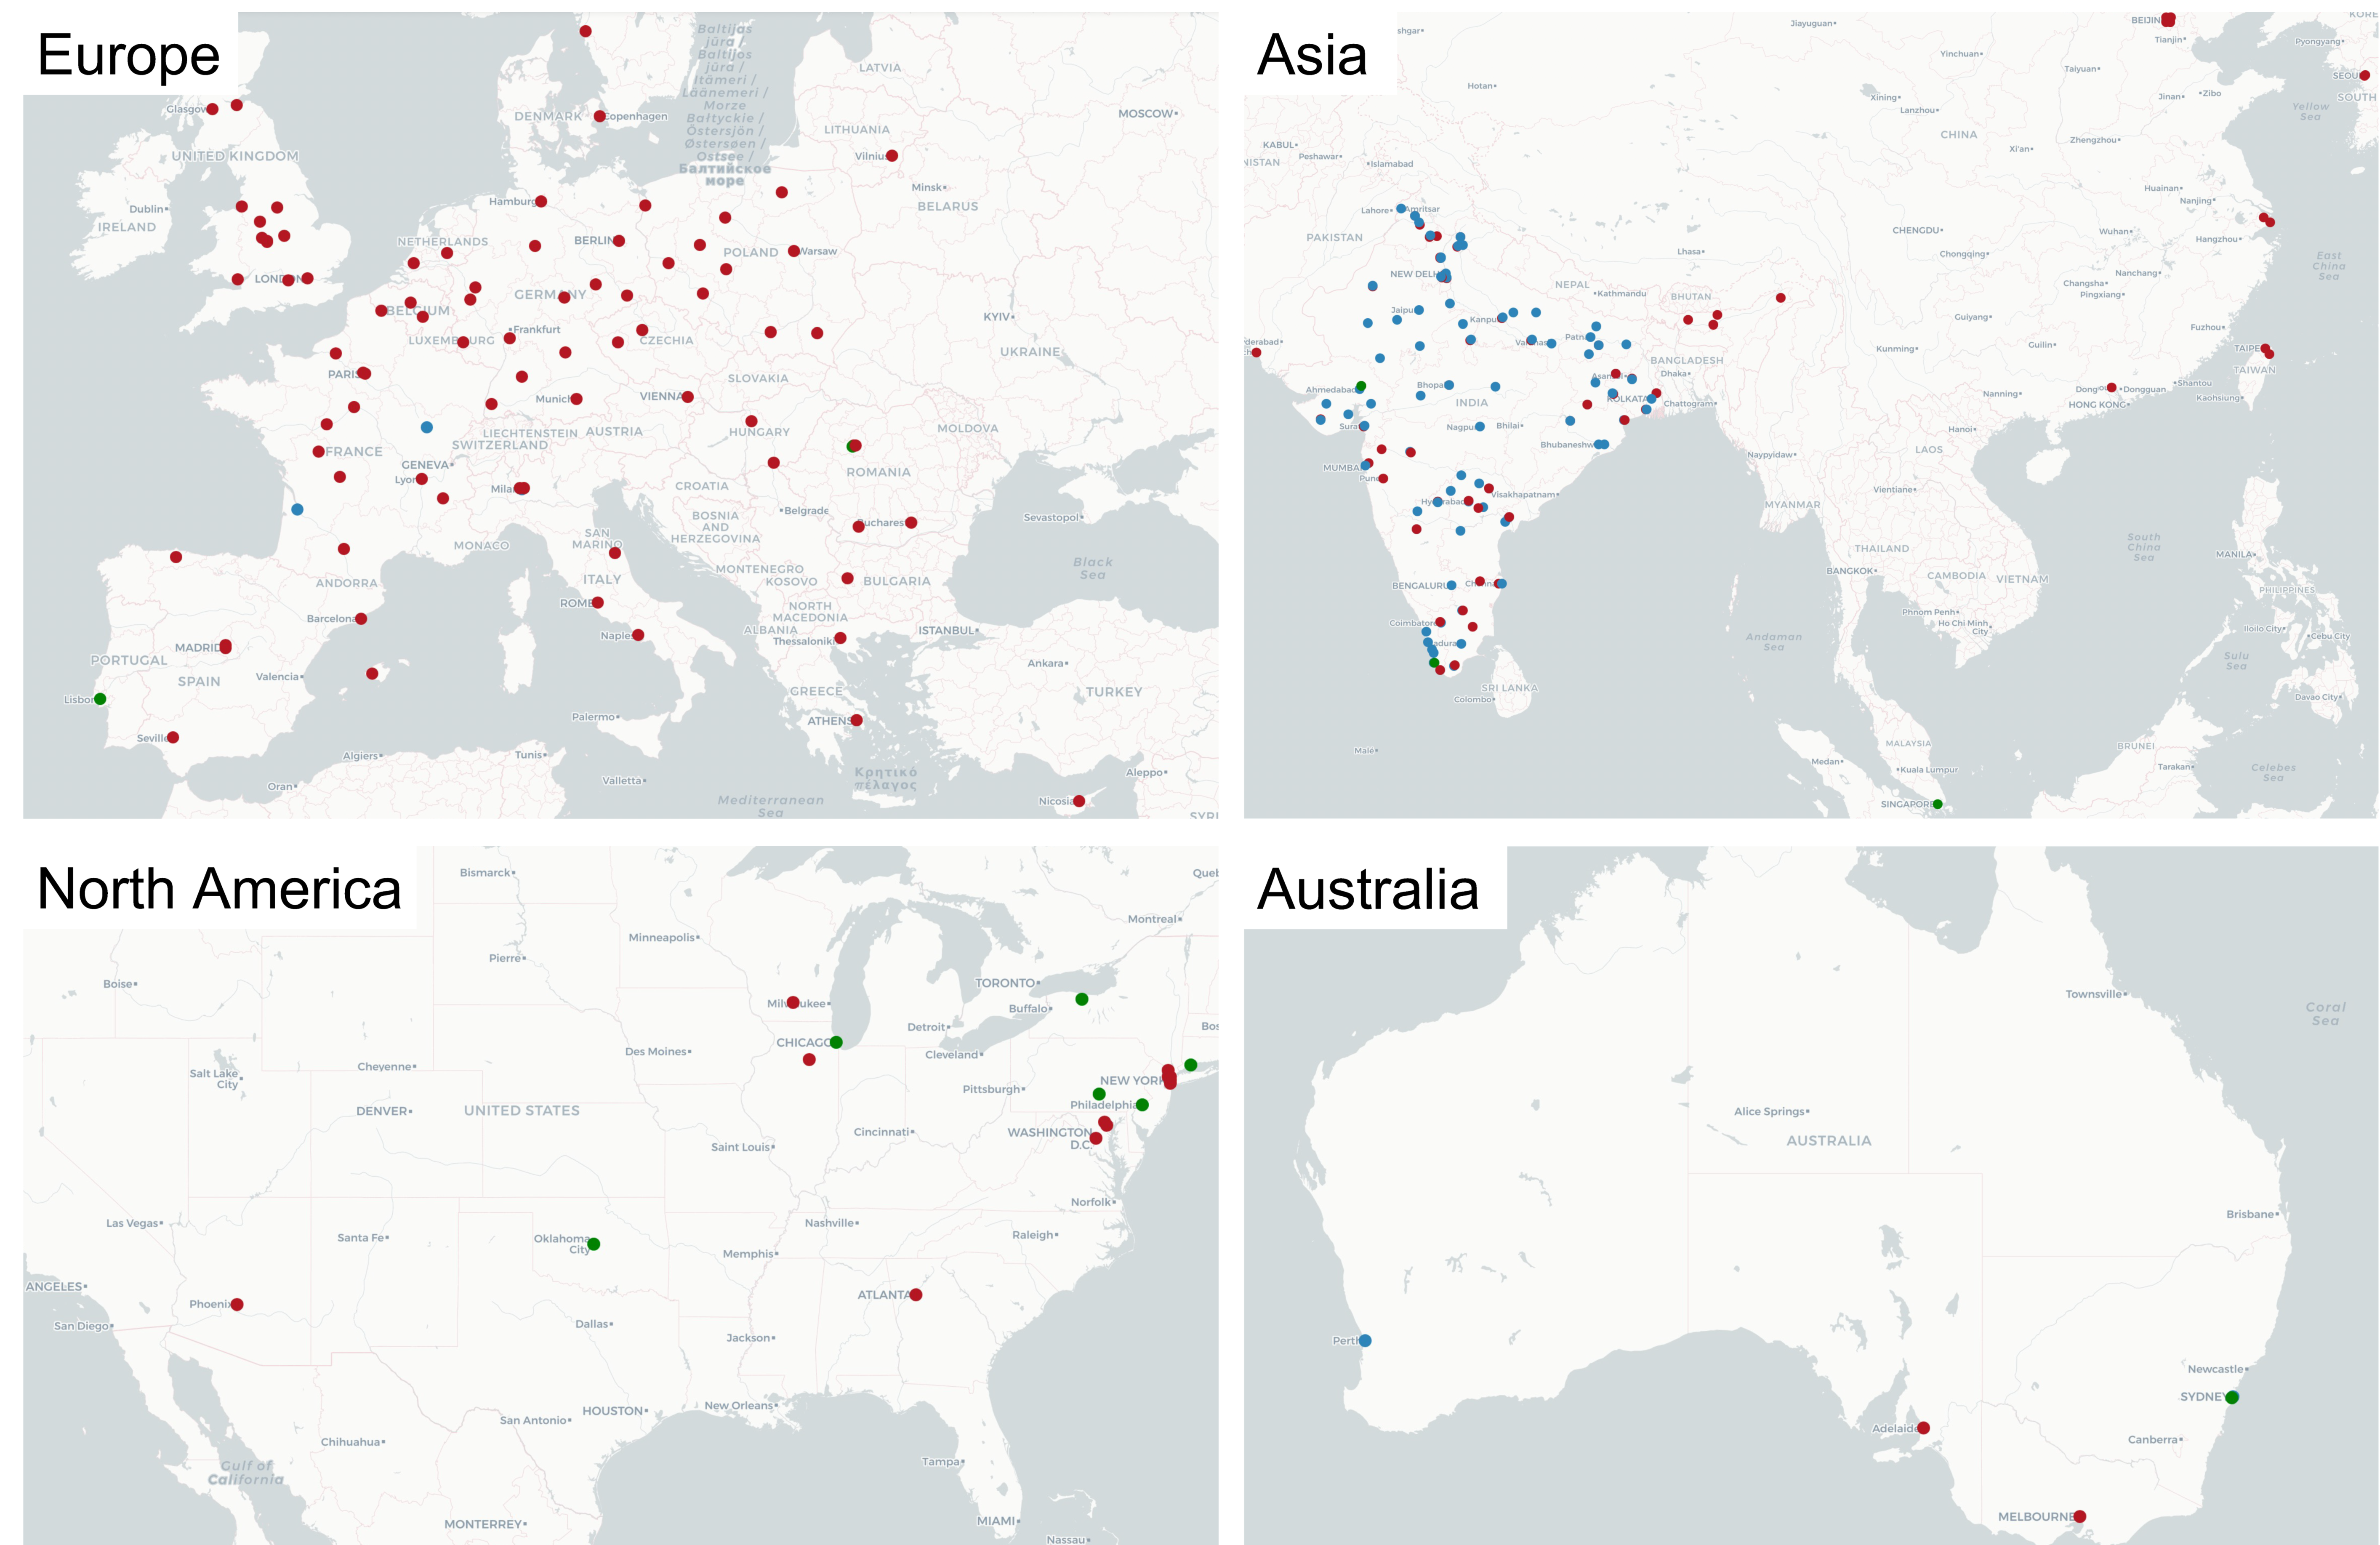
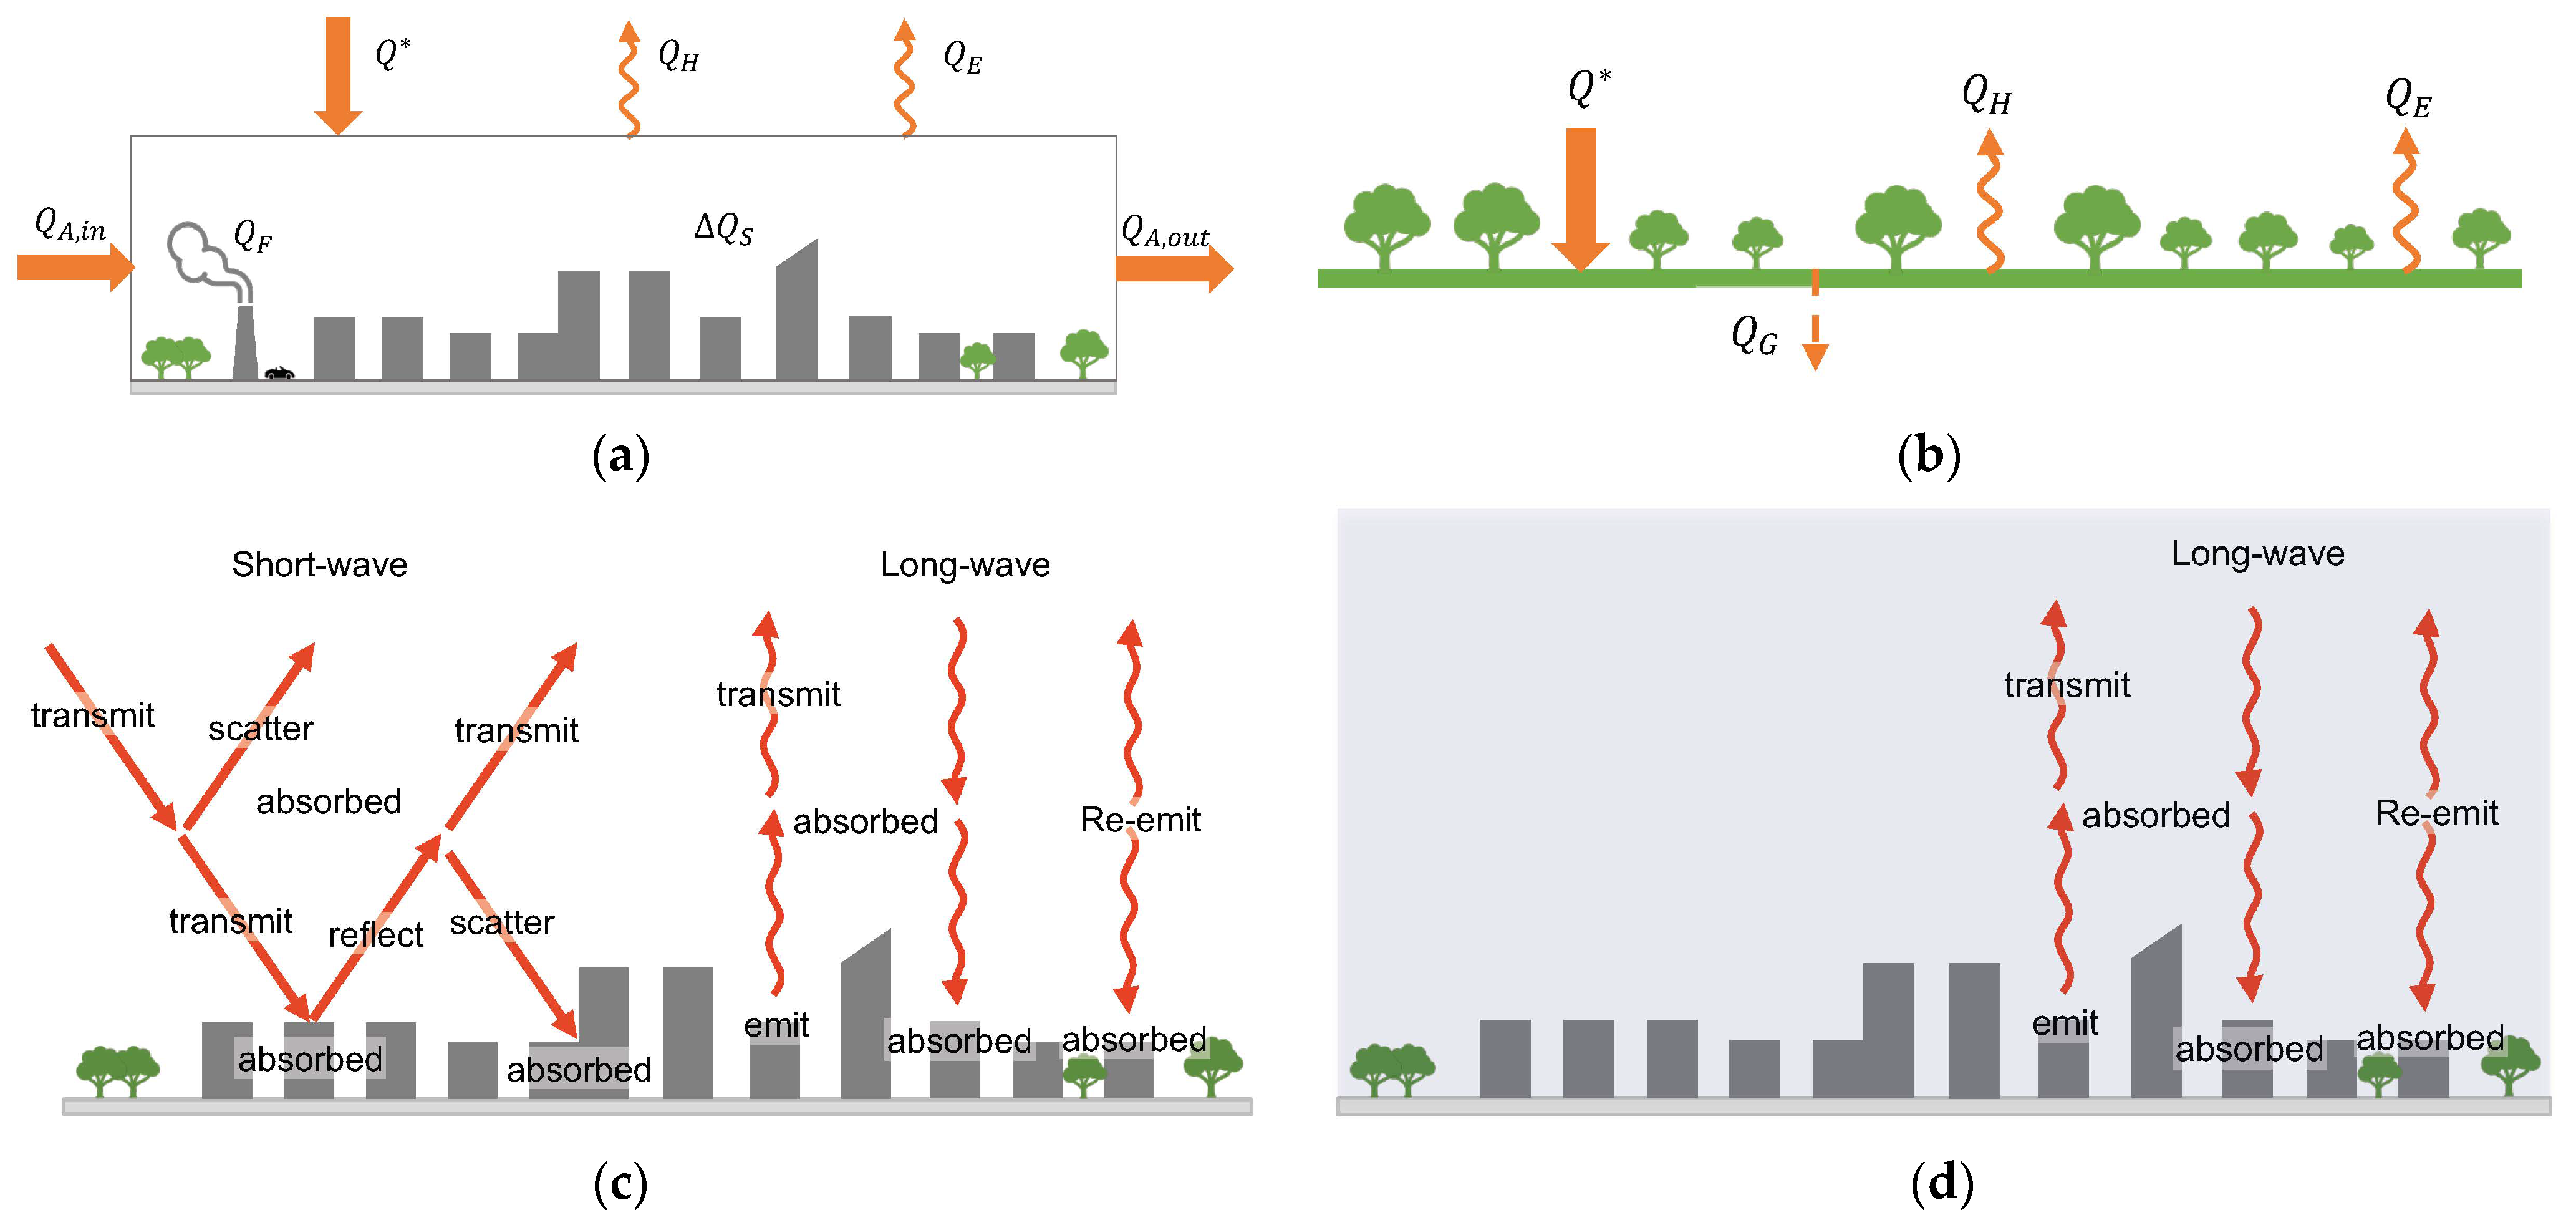
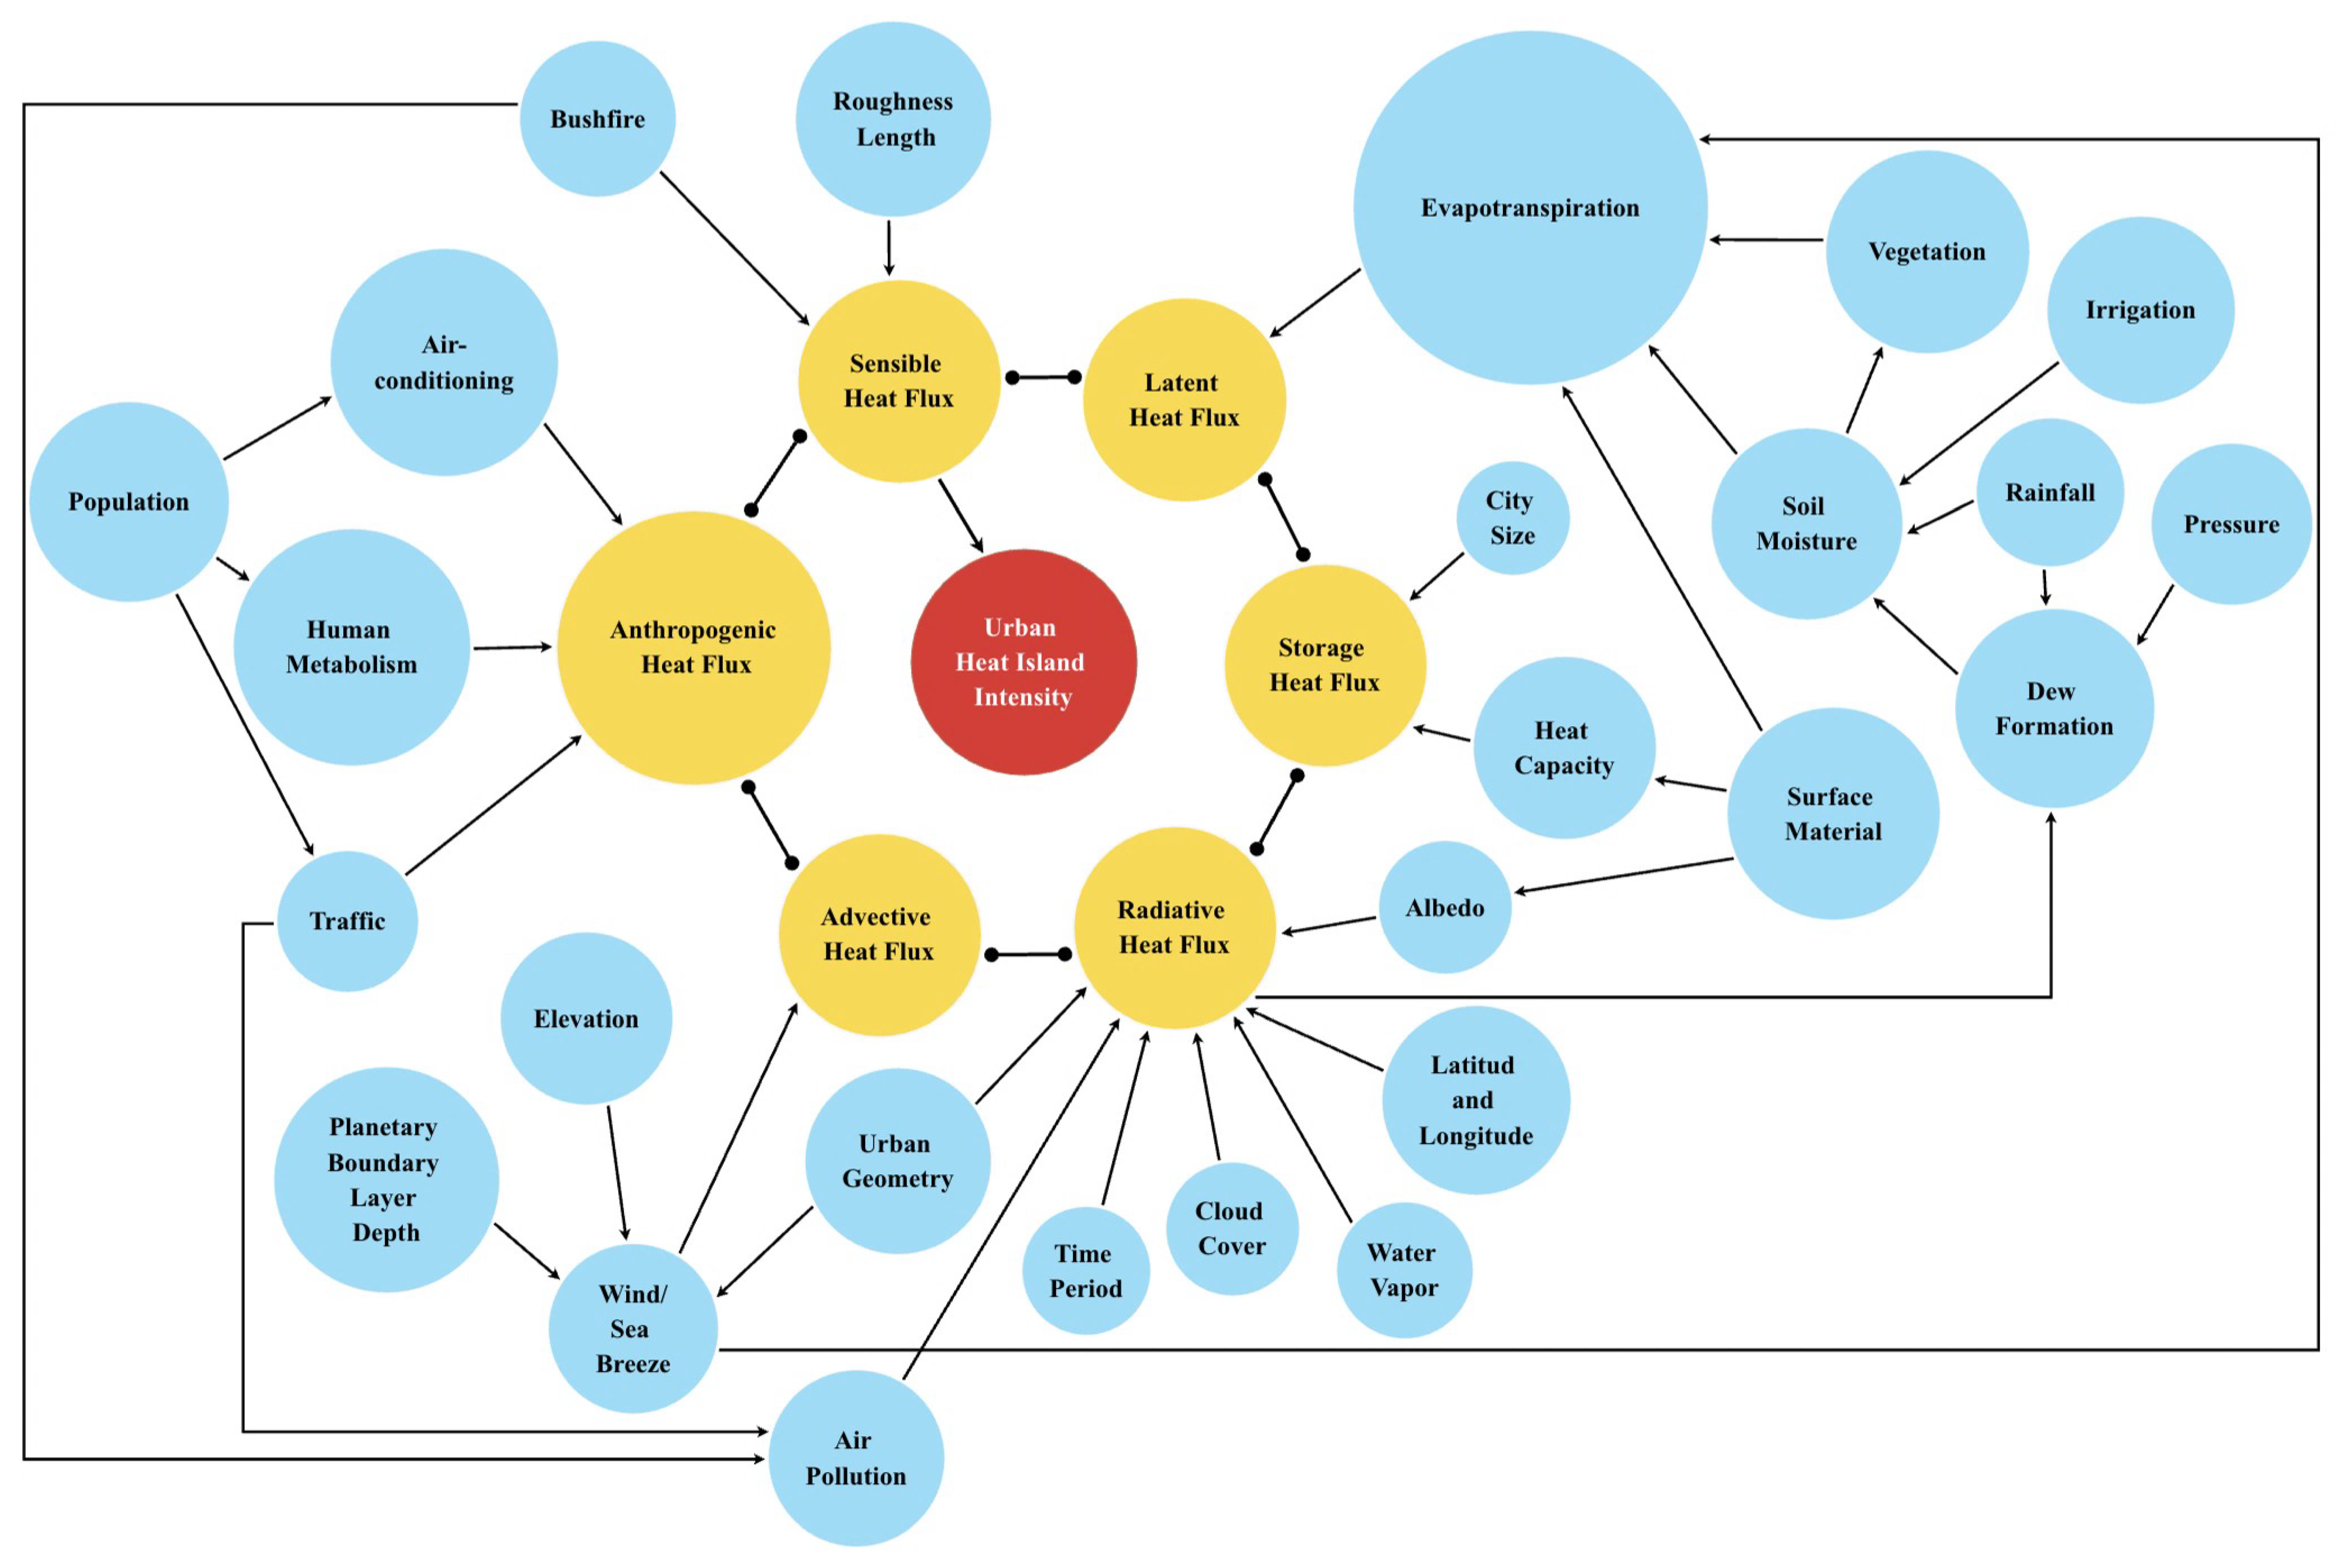
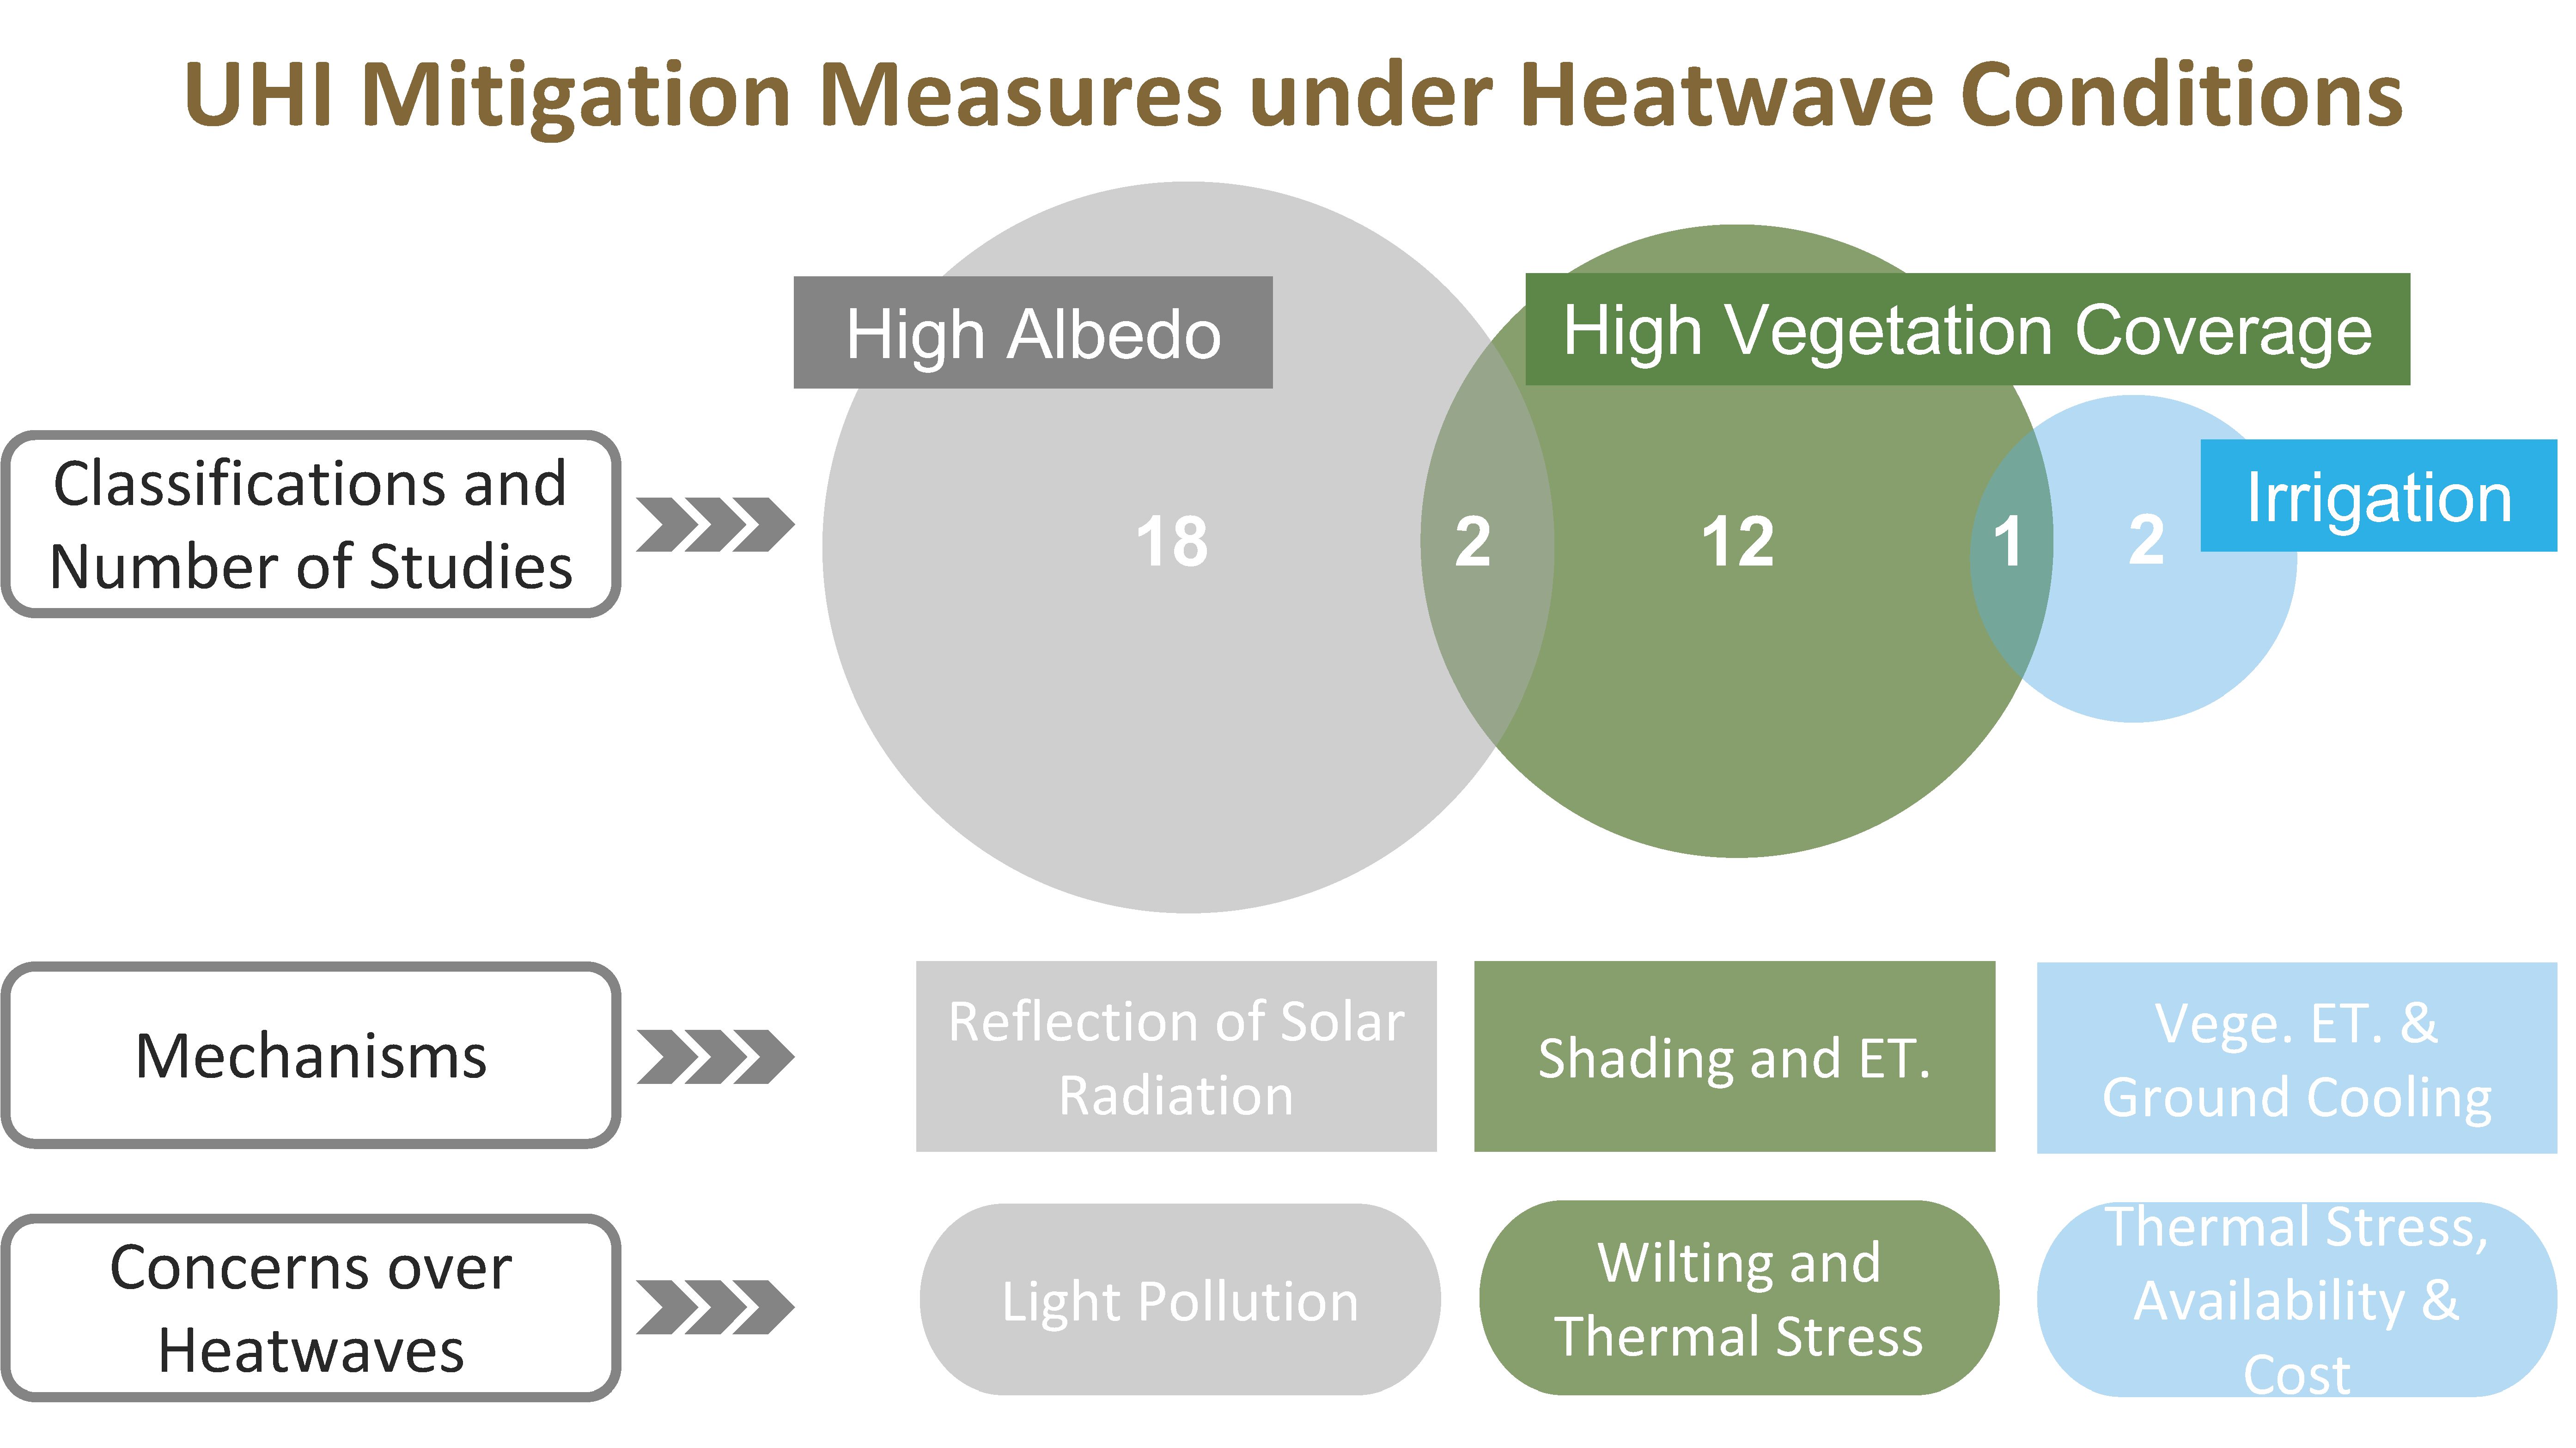
Table 1.
Comparison of MODIS and Landsat specifications.
| Platforms | Record Period (Year) | Spectral Resolution (Bands) | Temporal Resolution (Days) | Spatial Resolution (m) |
|---|---|---|---|---|
| MODIS | 2000+ | 36 | 1–2 | 250, 500, 1000 |
| Landsat | 1972+ | 7, 8, 11 | 16 | 15, 30, 60 1/100 2/120 3 |
1 The spatial resolution of thermal bands of Landsat 7. 2 The spatial resolution of thermal bands of Landsat 8. 3 The spatial resolution of thermal bands of Landsat 4 and 5.
Table 2.
Summary of the various numerical models.
| Ref. | Atmospheric Models | Urban Parameterizations | Resolution (m) | Validation |
|---|---|---|---|---|
| [25] | WRF | SLUCM, Noah LSM | 300 | In situ measure |
| [9] | WRF | SLUCM, Noah LSM | 500 | In situ measure |
| [73] | WRF | BEP, BEM, Noah LSM | 1000 | In situ measure |
| [96] | WRF | BEP, Noah LSM | 1000 | In situ measure |
| [97] | WRF | SLUCM | 1000 | In situ measure |
| [78] | WRF | SLUCM, Noah LSM | 300 | In situ measure |
| [84] | WRF | BEP, BEM, Noah LSM | 333 | In situ measure |
| [98] | WRF | BEP, Noah LSM | 1000 | In situ measure |
| [99] | WRF | SLUCM, Noah LSM | 3000 | In situ measure |
| [100] | WRF | BEP | 1333 | In situ measure |
| [74] | WRF | SLUCM | 1000 | In situ measure, Remote sensing |
| [101] | WRF | SLUCM, Noah LSM | 2000 | In situ measure |
| [102] | WRF | SLUCM, Noah LSM | 2000 | In situ measure |
| [103] | WRF | BEP, BEM, Noah LSM | 1000 | In situ measure |
| [6] | WRF | SLUCM, Noah LSM | 2000 | In situ measure |
| [77] | WRF | SLUCM, Noah LSM | 2000 | In situ measure |
| [90] | WRF | PUCM, Noah LSM | 1000 | In situ measure, Remote sensing |
| [89] | WRF | PUCM, Noah LSM | 3000 | In situ measure, Remote sensing |
| [85] | WRF | MLUCM, BEM, Noah LSM | 260 | In situ measure |
| [104] | WRF | PUCM, Noah LSM | 1000 | In situ measure |
| [105] | WRF | Noah LSM | 2000 | In situ measure |
| [91] | WRF | PUCM, Noah LSM | 1000 | N/A |
| [106] | WRF | SLUCM, Noah LSM | 1000 | In situ measure |
| [107] | WRF | SLUCM, Noah LSM | 4000 | In situ measure |
| [108] | WRF | UCM, Noah LSM | 1000 | In situ measure |
| [109] | WRF-Chem | MLUCM, Noah LSM | 2400 | In situ measure |
| [110] | WRF-Chem | SLUCM, Noah LSM | 3000 | In situ measure |
| [82] | WRF-Chem | BEP, Noah LSM | 3000 | In situ measure |
| [111] | WRF-Chem | MLUCM, BEM, Noah LSM | 1000 | In situ measure |
| [112] | ALARO-0 | TEB | 1000 | In situ measure |
| [47] | UrbClim | N/A | 1000 | In situ measure |
| [93] | Meso-NH | TEB, ISBA | 1000 | In situ measure |
| [94] | Meso-NH | TEB, ISBA | 500 | N/A |
| [70] | MUKLIMO_3 | N/A | 100 | In situ measure |
| [113] | CESM | N/A | 99,000 × 138,750 | Remote sensing |
| Type | Processes | Impacts |
|---|---|---|
| UHIsub | Subsurface energy balance | Carbon exchange between soil and atmosphere |
| UHIsurf | Surface energy balance | Thermal comfort |
| UHIUCL | Surface energy balance, energy balance of UCL volume | Thermal comfort, building energy demand, thermal circulation, air quality |
| UHIUBL | Boundary layer energy balance, energy balance at top of roughness sublayer | Air quality, precipitation, local circulation |
Table 4.
HW definitions adopted in the reviewed literature.
| Metric | Intensity | Duration (Days) | Location | Ref. |
|---|---|---|---|---|
| Tmax | 32 °C | 10 | Taiwan Region | [55] |
| Tmax | 32.2 °C | 3 | USA | [53,89,90,103,113] |
| Tmax | 33 °C | 2 | South Korea | [118] |
| Tmax | 33 °C | 3 | South Korea | [45] |
| Tmax | 35 °C | 3 | China Mainland | [29,46,115] |
| Tmax | 35 °C | 10 | Taiwan Region | [55] |
| Tmax | 36.5 °C | 3 | Spain | [59] |
| Tmax | 37 °C | 3 | Greece | [122,123] |
| Tmax | 90th | 3 | Romania | [58] |
| Tmax | 98th | 3 | Romania | [58] |
| Tmax | 95th | 3 | Romania, Australia | [58,128] |
| Tmax | 95th | 4 | Cyprus | [119] |
| Tmax | 97.5th | 5 | USA | [96] |
| Tmax | 97.5th and 81st | 3 | USA, China Mainland, Poland, UK | [28,34,104,105] |
| Tmax | Tmax + 5 °C 1 | 3 | UK | [129] |
| Tmax | Tmax + 5 °C 1 | 5 | Hungary | [117] |
| Tmean | 25 °C | 3 | Hungary | [117] |
| Tmean | 27 °C | 3 | Hungary | [117] |
| Tmean | 90th | 3 | Portugal | [30] |
| Tmax and Tmin | 32 °C and 16 °C | 2 | France | [48] |
| Tmax and Tmin | 30 °C and 18 °C | 3 | Belgium | [112] |
| Tmax and Tmin | 30 °C and 20 °C | 5 | Hungary | [117] |
| Tmax and Tmin | 90th | 3 | Australia | [124] |
| Tmax and Tmin | 95th | 3 | India | [56] |
| Tmax and Tmean | 35 °C and 29 °C | 3 | Singapore | [25] |
| HImax 2 | 65 °C | 4 | Cyprus | [119] |
1 Tmax + 5 °C means the exceedance of the average daily maximum temperature by 5 °C. 2 HI= −42.379 + 2.04901523T + 10.14333127RH − 0.22475541T × RH − 6.83783 × 10⁻³T2 5.481717 × 10⁻²RH2 + 1.22874 × 10⁻³T2RH + 8.5282 × 10⁻⁴T × RH2−0.199 × 10⁻⁶T2RH2. (RH is relative humidity, T is air temperature in Fahrenheit).
Publisher’s Note: MDPI stays neutral with regard to jurisdictional claims in published maps and institutional affiliations. |
© 2021 by the authors. Licensee MDPI, Basel, Switzerland. This article is an open access article distributed under the terms and conditions of the Creative Commons Attribution (CC BY) license (https://creativecommons.org/licenses/by/4.0/).
Share and Cite
MDPI and ACS Style
Kong, J.; Zhao, Y.; Carmeliet, J.; Lei, C. Urban Heat Island and Its Interaction with Heatwaves: A Review of Studies on Mesoscale. Sustainability 2021, 13, 10923. https://0-doi-org.brum.beds.ac.uk/10.3390/su131910923
AMA Style
Kong J, Zhao Y, Carmeliet J, Lei C. Urban Heat Island and Its Interaction with Heatwaves: A Review of Studies on Mesoscale. Sustainability. 2021; 13(19):10923. https://0-doi-org.brum.beds.ac.uk/10.3390/su131910923
Chicago/Turabian StyleKong, Jing, Yongling Zhao, Jan Carmeliet, and Chengwang Lei. 2021. "Urban Heat Island and Its Interaction with Heatwaves: A Review of Studies on Mesoscale" Sustainability 13, no. 19: 10923. https://0-doi-org.brum.beds.ac.uk/10.3390/su131910923
Note that from the first issue of 2016, this journal uses article numbers instead of page numbers. See further details here.