Article

A Life Cycle Environmental Impact Comparison between Traditional, Hybrid, and Electric Vehicles in the European Context

by
Emiliano Pipitone
*,
Salvatore Caltabellotta
and
Leonardo Occhipinti
Department of Engineering, University of Palermo, 90128 Palermo, Italy
*
Author to whom correspondence should be addressed.
Sustainability 2021, 13(19), 10992; https://0-doi-org.brum.beds.ac.uk/10.3390/su131910992
Submission received: 10 September 2021 / Revised: 23 September 2021 / Accepted: 24 September 2021 / Published: 3 October 2021
(This article belongs to the Special Issue Sustainable Mobility and Transport)

Abstract

:
Global warming (GW) and urban pollution focused a great interest on hybrid electric vehicles (HEVs) and battery electric vehicles (BEVs) as cleaner alternatives to traditional internal combustion engine vehicles (ICEVs). The environmental impact related to the use of both ICEV and HEV mainly depends on the fossil fuel used by the thermal engines, while, in the case of the BEV, depends on the energy sources employed to produce electricity. Moreover, the production phase of each vehicle may also have a relevant environmental impact, due to the manufacturing processes and the materials employed. Starting from these considerations, the authors carried out a fair comparison of the environmental impact generated by three different vehicles characterized by different propulsion technology, i.e., an ICEV, an HEV, and a BEV, following the life cycle analysis methodology, i.e., taking into account five different environmental impact categories generated during all phases of the entire life of the vehicles, from raw material collection and parts production, to vehicle assembly and on-road use, finishing hence with the disposal phase. An extensive scenario analysis was also performed considering different electricity mixes and vehicle lifetime mileages. The results of this study confirmed the importance of the life cycle approach for the correct determination of the real impact related to the use of passenger cars and showed that the GW impact of a BEV during its entire life amounts to roughly 60% of an equivalent ICEV, while acidifying emissions and particulate matter were doubled. The HEV confirmed an excellent alternative to ICEV, showing good compromise between GW impact (85% with respect to the ICEV), terrestrial acidification, and particulate formation (similar to the ICEV). In regard to the mineral source deployment, a serious concern derives from the lithium-ion battery production for BEV. The results of the scenario analysis highlight how the environmental impact of a BEV may be altered by the lifetime mileage of the vehicle, and how the carbon footprint of the electricity used may nullify the ecological advantage of the BEV.

1. Introduction

Worldwide vehicle production growth over the past decades has caused strong emissions increments which have affected both population and industrial sectors globally. EU-28’s CO2 emissions correspond to 10.8% of global CO2 emissions [1]. In 2017, the transport sector contributed to 27.9% of the EU-28 CO2 production, with a passenger cars participation of 43.5%, which hence represents about 12.1% of the total EU-28 CO2 emissions [2]. To reduce air pollution, governments issued increasingly stringent regulations, pushing vehicle manufacturers towards innovative solutions. With a view to eco-sustainable mobility, battery electric vehicles (BEVs) and hybrid electric vehicles (HEVs) are nowadays proposed as clean or light-environmental impact technologies for road transport. In particular, BEVs are often promoted as zero-emitting vehicles since they are propelled by the use of electric energy, in contraposition to internal combustion engine vehicles (ICEVs) and HEVs, which instead make use of fossil fuels. If, on the one hand, it is true that a BEV does not produce tailpipe emissions while moving, on the other hand, it must be considered that the electric energy employed by the BEV may have been produced by the use of fossil fuels, thus contributing to air pollution and CO2 emissions. A fundamental aspect, hence, in the evaluation of the environmental impact related to the use of a BEV is to know the source, or the mix of different sources, employed to produce the electric energy. It is rather obvious that if the electric energy is obtained only by renewable sources (e.g., hydraulic, solar, wind energy), no pollutant emissions are produced during the use of a BEV. Unfortunately, electric energy is not produced exclusively by means of renewable sources, but is still obtained by a mix of different sources which may have a carbon footprint (e.g., coal, natural gas, oil) or may produce different and hazardous waste, such as nuclear energy. Every single country is characterized by a particular mix of energy sources employed to generate electricity, which is usually referred to as the electricity mix (of the country). The pollutant emissions related to the use of a BEV hence depend on the particular mix employed for the electric energy production, and in turn, on the country in which the vehicle is employed. The considerations made up to this point regard only the energy transformation chain which is involved in the BEV propulsion phase. It is, however, widely recognized that a fair and complete evaluation of the pollutant emissions related to vehicle use should also take into consideration the vehicle production phases, since materials employed and manufacturing process may play an important role in determining the real environmental impact related to the use of a vehicle: this aspect is crucial when a comparison between the environmental footprint of different vehicle technology is performed. For this reason, several studies were carried out dealing with the evaluation of the environmental impact of vehicles through a life cycle assessment (LCA) methodology, that considers the entire life of the vehicle, from the production phase to the on-road use of the vehicle, and to the final disposal. In [3], the life cycle greenhouse gas emissions (GHG) of battery electric vehicles and conventional gasoline internal combustion engine vehicles are calculated and compared in different Chinese energy production mix scenarios (2010 and 2014). As a result, the ICEV revealed 34.9 tCO2eq/vehicle with the 2010 electricity mix, and 29.7 tCO2eq/vehicle with the 2014; as instead regards the BEV, 42.5 tCO2eq/vehicle (i.e., +21.7%) were evaluated with the 2010 electricity mix, and 31.4 tCO2eq/vehicle (i.e., +5.72%) with the 2014. In [4] a comparative LCA of European medium-sized passenger vehicles (“VW Passat class”) was carried out, adopting Switzerland as a vehicle usage scenario, and taking into consideration different drive technologies and fuel supply chains, representing both the present and the modern future (2030) state of development. As a result, the CNG-fueled ICEV, the diesel hybrids, and the BEV charged employing the average European electricity mix, proved to generate the lowest life cycle greenhouse gas emissions, in the order of 210 g CO2eq/km, while the highest levels (300 g CO2eq/km) were calculated for the gasoline-fueled ICEV. In [5], the environmental impacts of a vehicle with an internal combustion engine (diesel, petrol, and CNG) is compared to a battery electric vehicle, considering the battery of the electric vehicle produced using the electricity from the Chinese, the European, and a 100% photovoltaic energy mix. In [6], a comparison based on real consumption data of two cars (Nissan Leaf BEV and Mercedes A-170 ICEV) on the New European Driving Cycle (UNECE 2005) is presented. In this study, great attention was paid to vehicle life cycle including both the high-voltage battery and the rest of the car components, based on well-detailed inventories and model parameters. All of these studies highlight how the vehicle production processes, traveled distance, and energy mix may substantially influence the real environmental impact of an electric vehicle during its entire life cycle [7]. According to these considerations, the authors of the present paper followed a life cycle approach to perform a fair comparative evaluation of the real environmental impact connected to the use of three different kinds of vehicle (i.e., ICEV, HEV, and BEV) derived from the 2019 market, considering different driving distances and different energy mixes, thus contributing to delimit the effective pollutant behavior of each kind of vehicle, even changing the conditions of use. With the aim to faithfully represent the current conditions of production, use, and disposal, the analysis was performed employing the most up-to-date data present in the scientific literature (before the pandemic). Unlike other articles in the scientific literature, this work does not analyze only take into account greenhouse gas emissions, but also properly takes into consideration the terrestrial acidification, the particulate matter formation, and the deployment of mineral and fossil resources, thus highlighting, from several points of view, the real advantages, disadvantages, and limitations of modern car propulsion technologies.

2. Method and System Details

Life Cycle Assessment (LCA) is an analytical and systematic methodology that evaluates the environmental footprint of a product or service, along its entire life cycle (“from cradle to gate”) [8]; hence, starting from the phases of extraction of the necessary raw materials, the analysis involves the production and distribution phases, the use and the final disposal. At the end of the calculation, the environmental impact of a product is quantified according to various environmental impact indicators. Worldwide, the LCA methodology is regulated by ISO standards 14040 [9,10] and is structured into the following phases:
  • Goal and scope definition
  • Life cycle inventory (LCI)
  • Life cycle impact assessment (LCIA)
  • Interpretation of results

3. Goal and Scope Definition

As already mentioned, the goal of this study is to compare, from a life cycle perspective, the ecological consequences related to the use of three vehicles characterized by different propulsion technologies, i.e., a gasoline ICEV, a gasoline HEV, and a BEV. Given the difficulty to analyze, in a single paper, all the different kinds of vehicles (from mini cars to SUV, nine different passenger cars categories may be identified, corresponding to the Euro car segments from A to J) the authors decided to focus on the most diffused kind of passenger cars in Europe, i.e., small-medium cars (corresponding to the B-C segments) which account for over half of total EU car sales [11]. Starting from raw materials supplying and processing, considering vehicle production and assembly, and arriving at the use and final disposal phase, the overall environmental impact of each vehicle was assessed employing GREET 2020.NET (Greenhouse gases, Regulated Emissions, and Energy use in Transportation), a widely adopted open-source suite for life cycle analysis developed by Argonne National Laboratory [12,13]; for the environmental impact assessment, the ReCiPe 2016 methodology was followed [14,15], taking into considerations five different environmental impact categories, each one represented by means of a proper characterization factor:
(1)
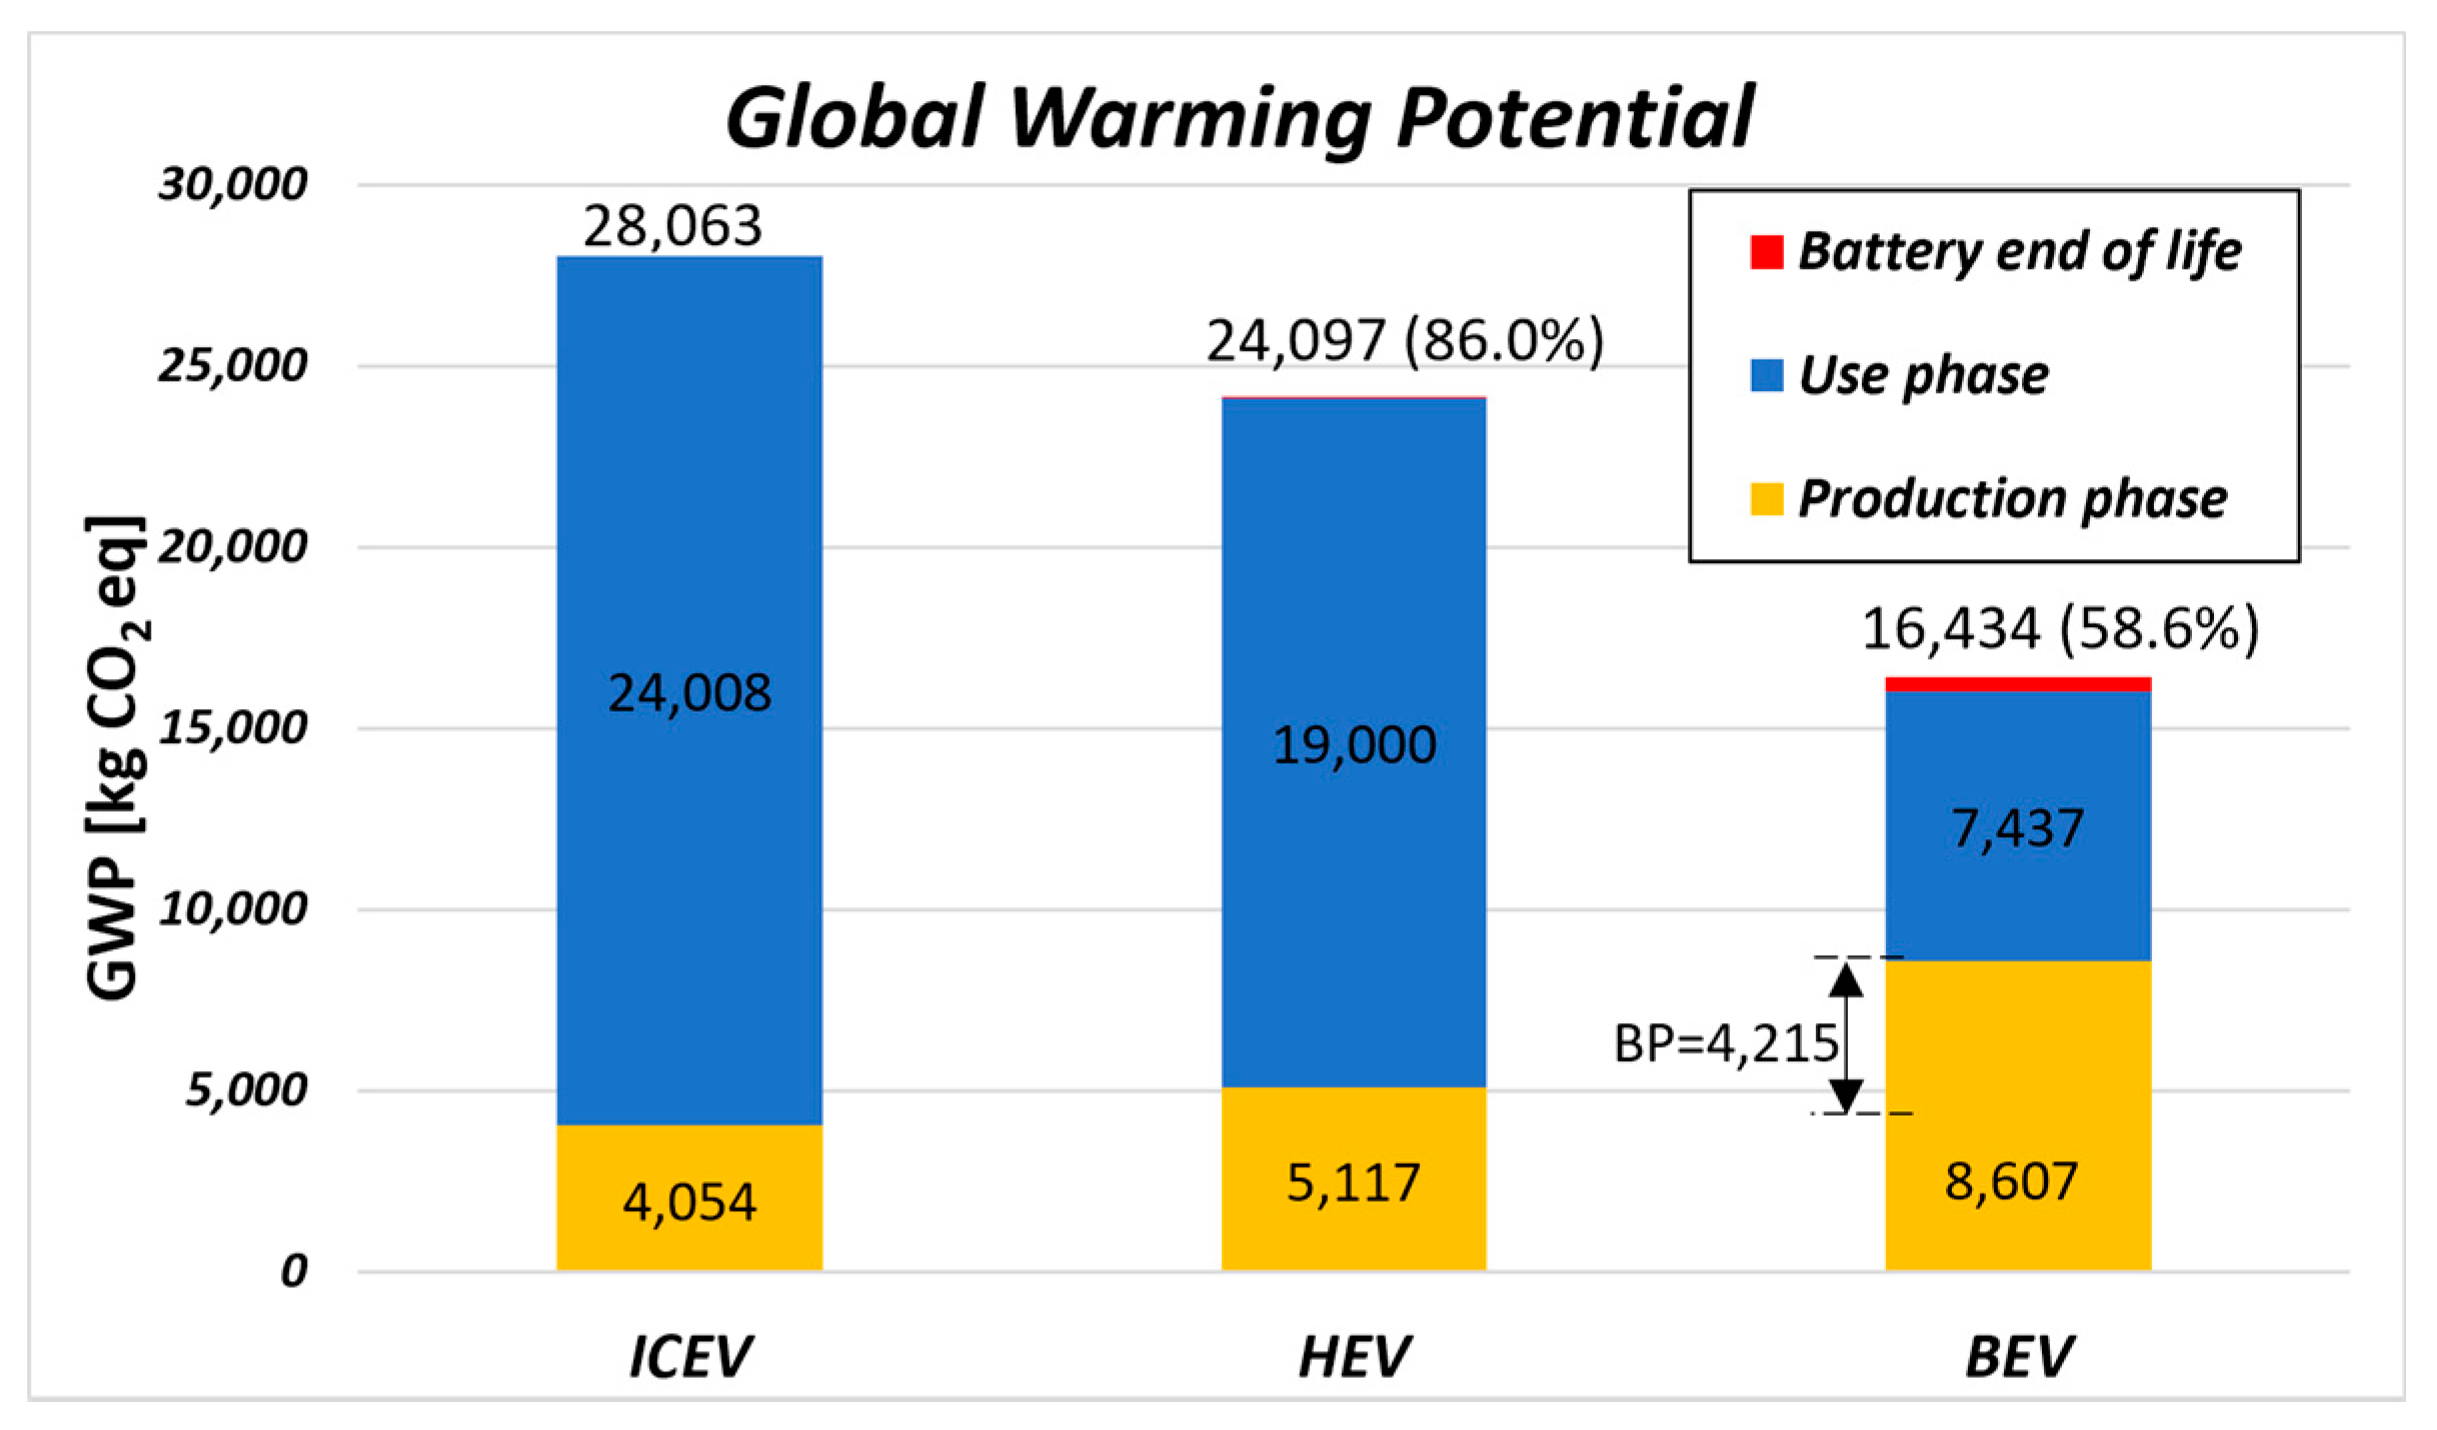
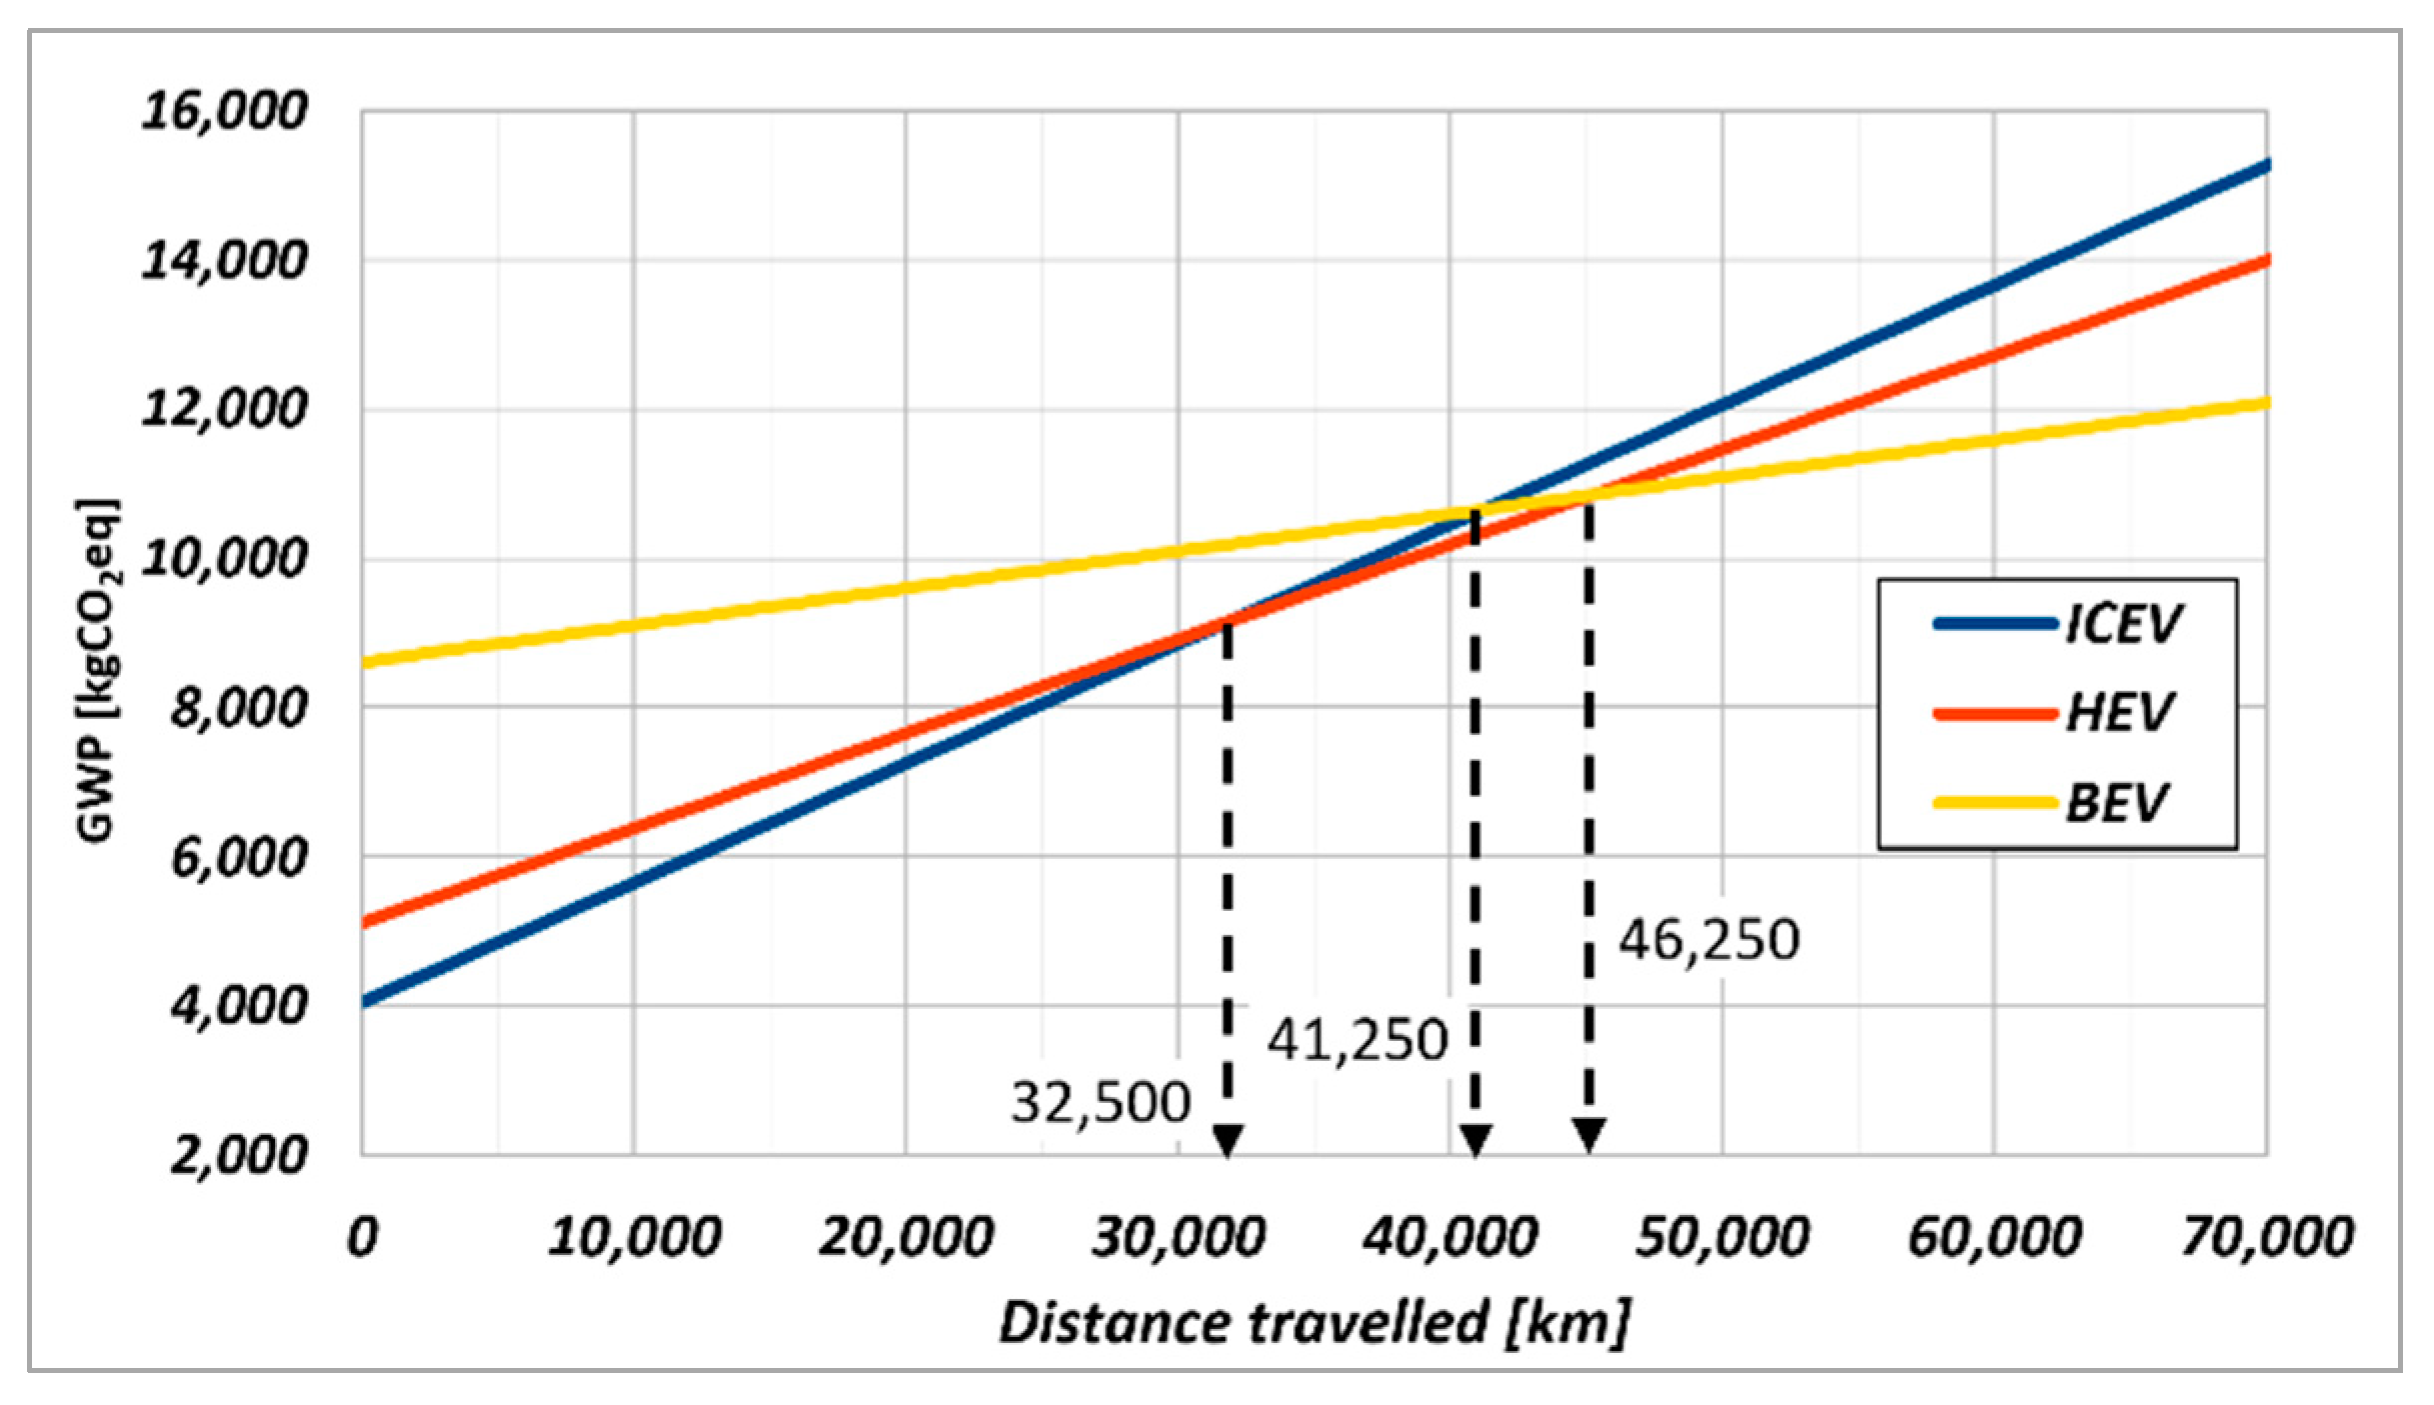
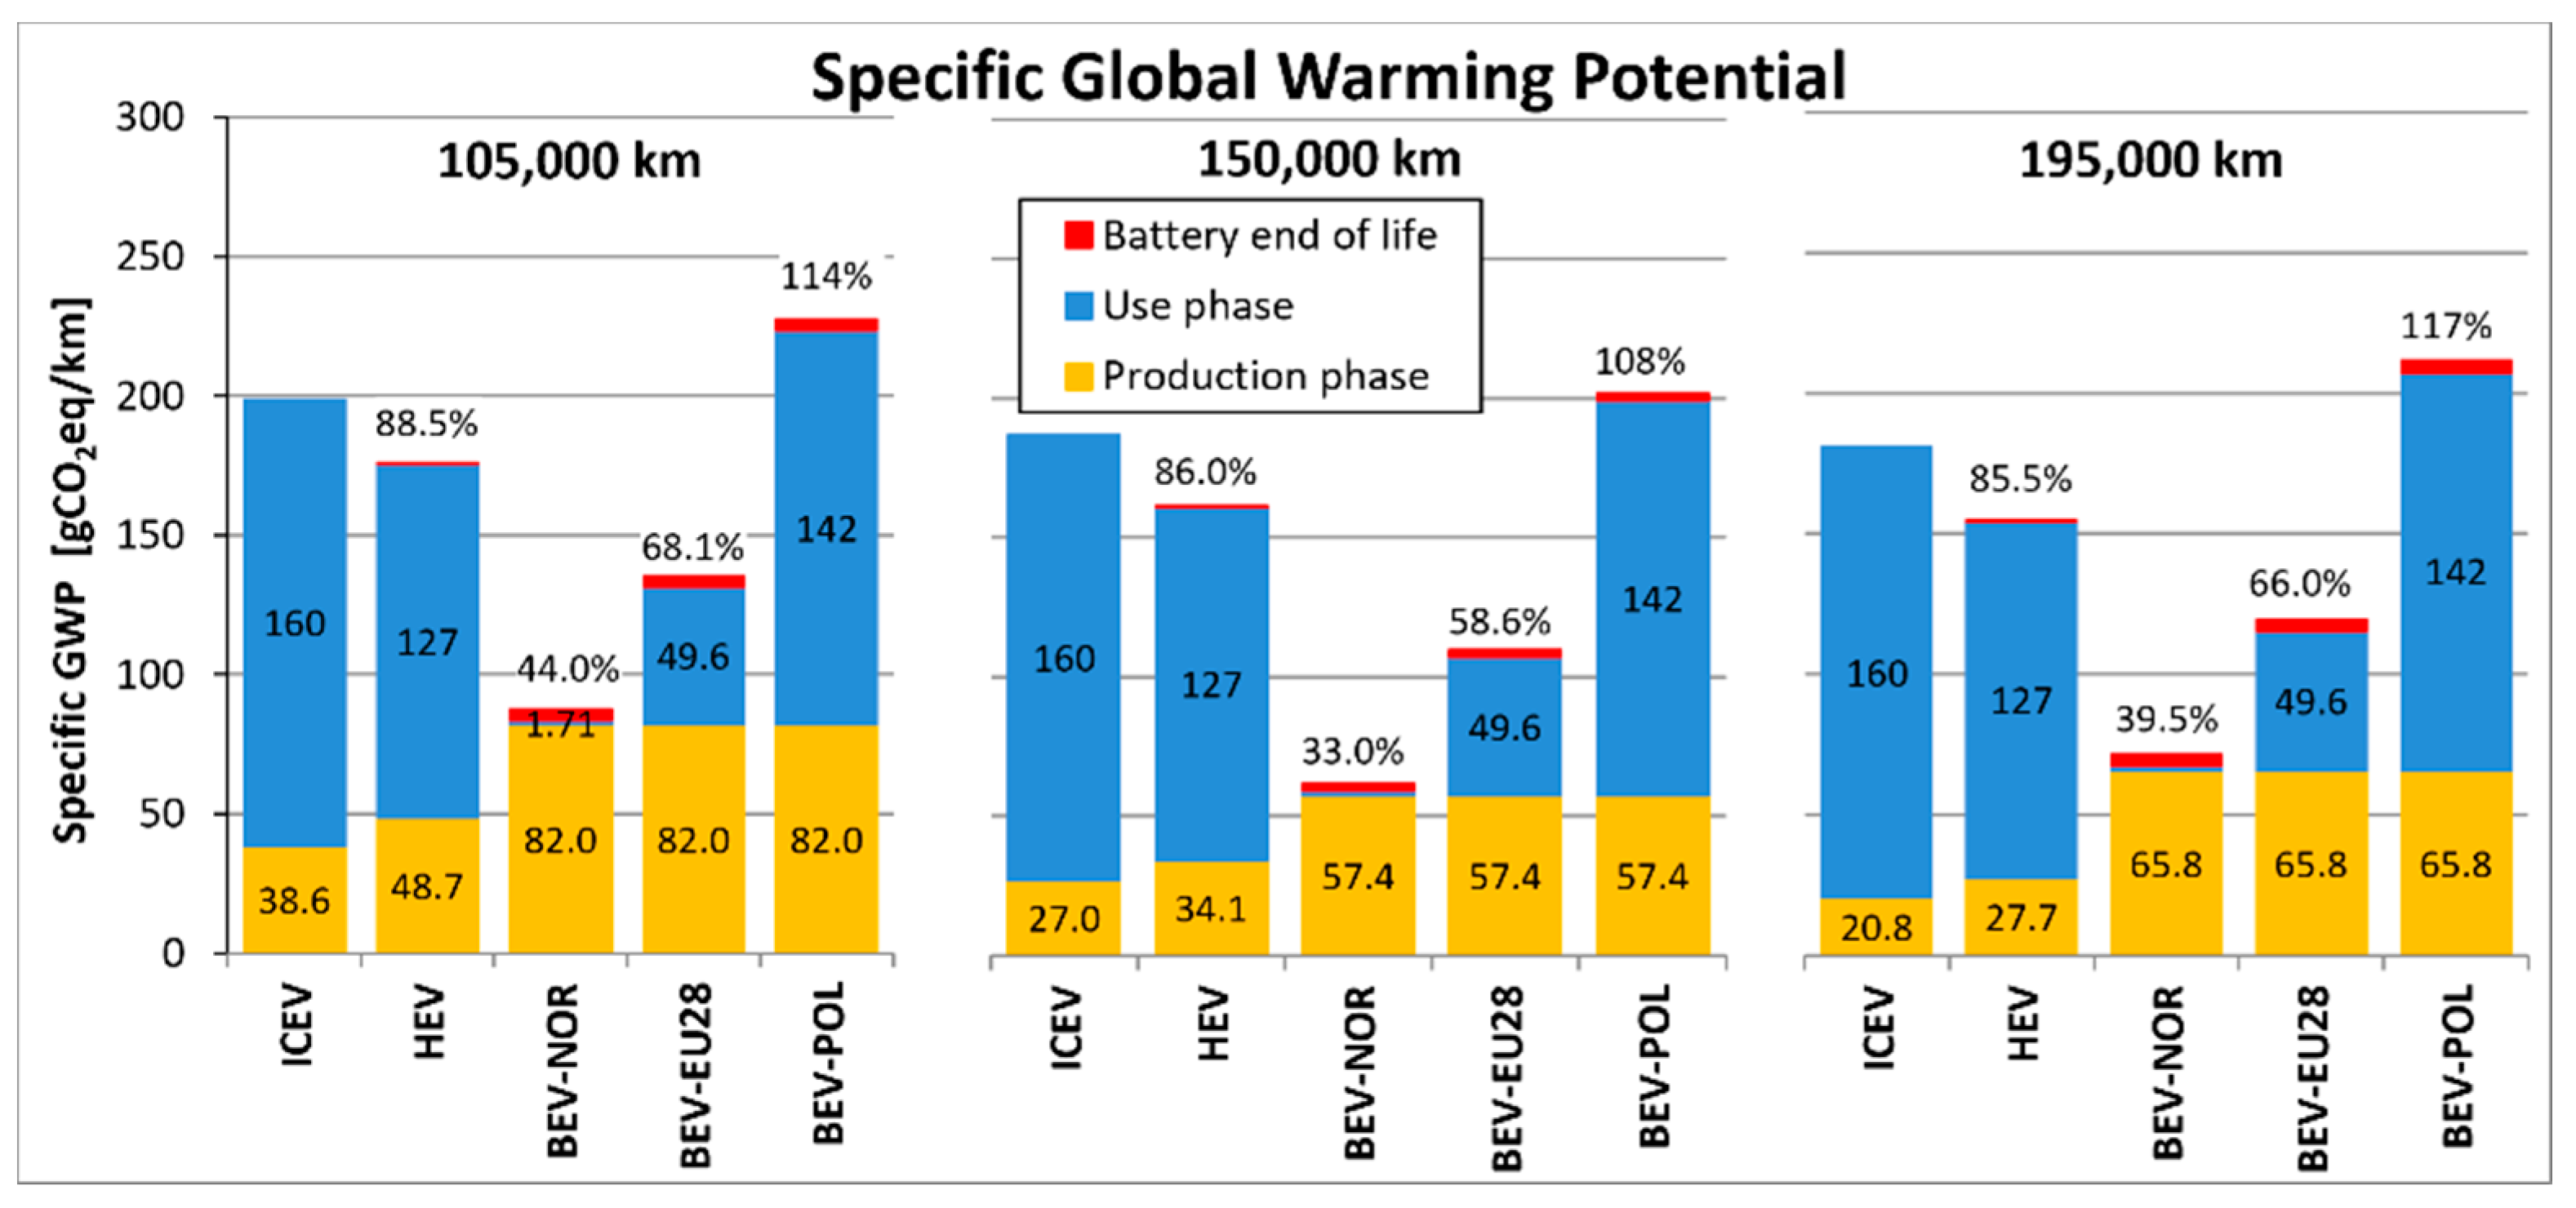
Climate change: mainly due to the increase in greenhouse gases (GHG) in the atmosphere, it is accounted for by the global warming potential (GWP) which expresses the equivalent mass of CO2 emitted to obtain a product or a service.
(2)
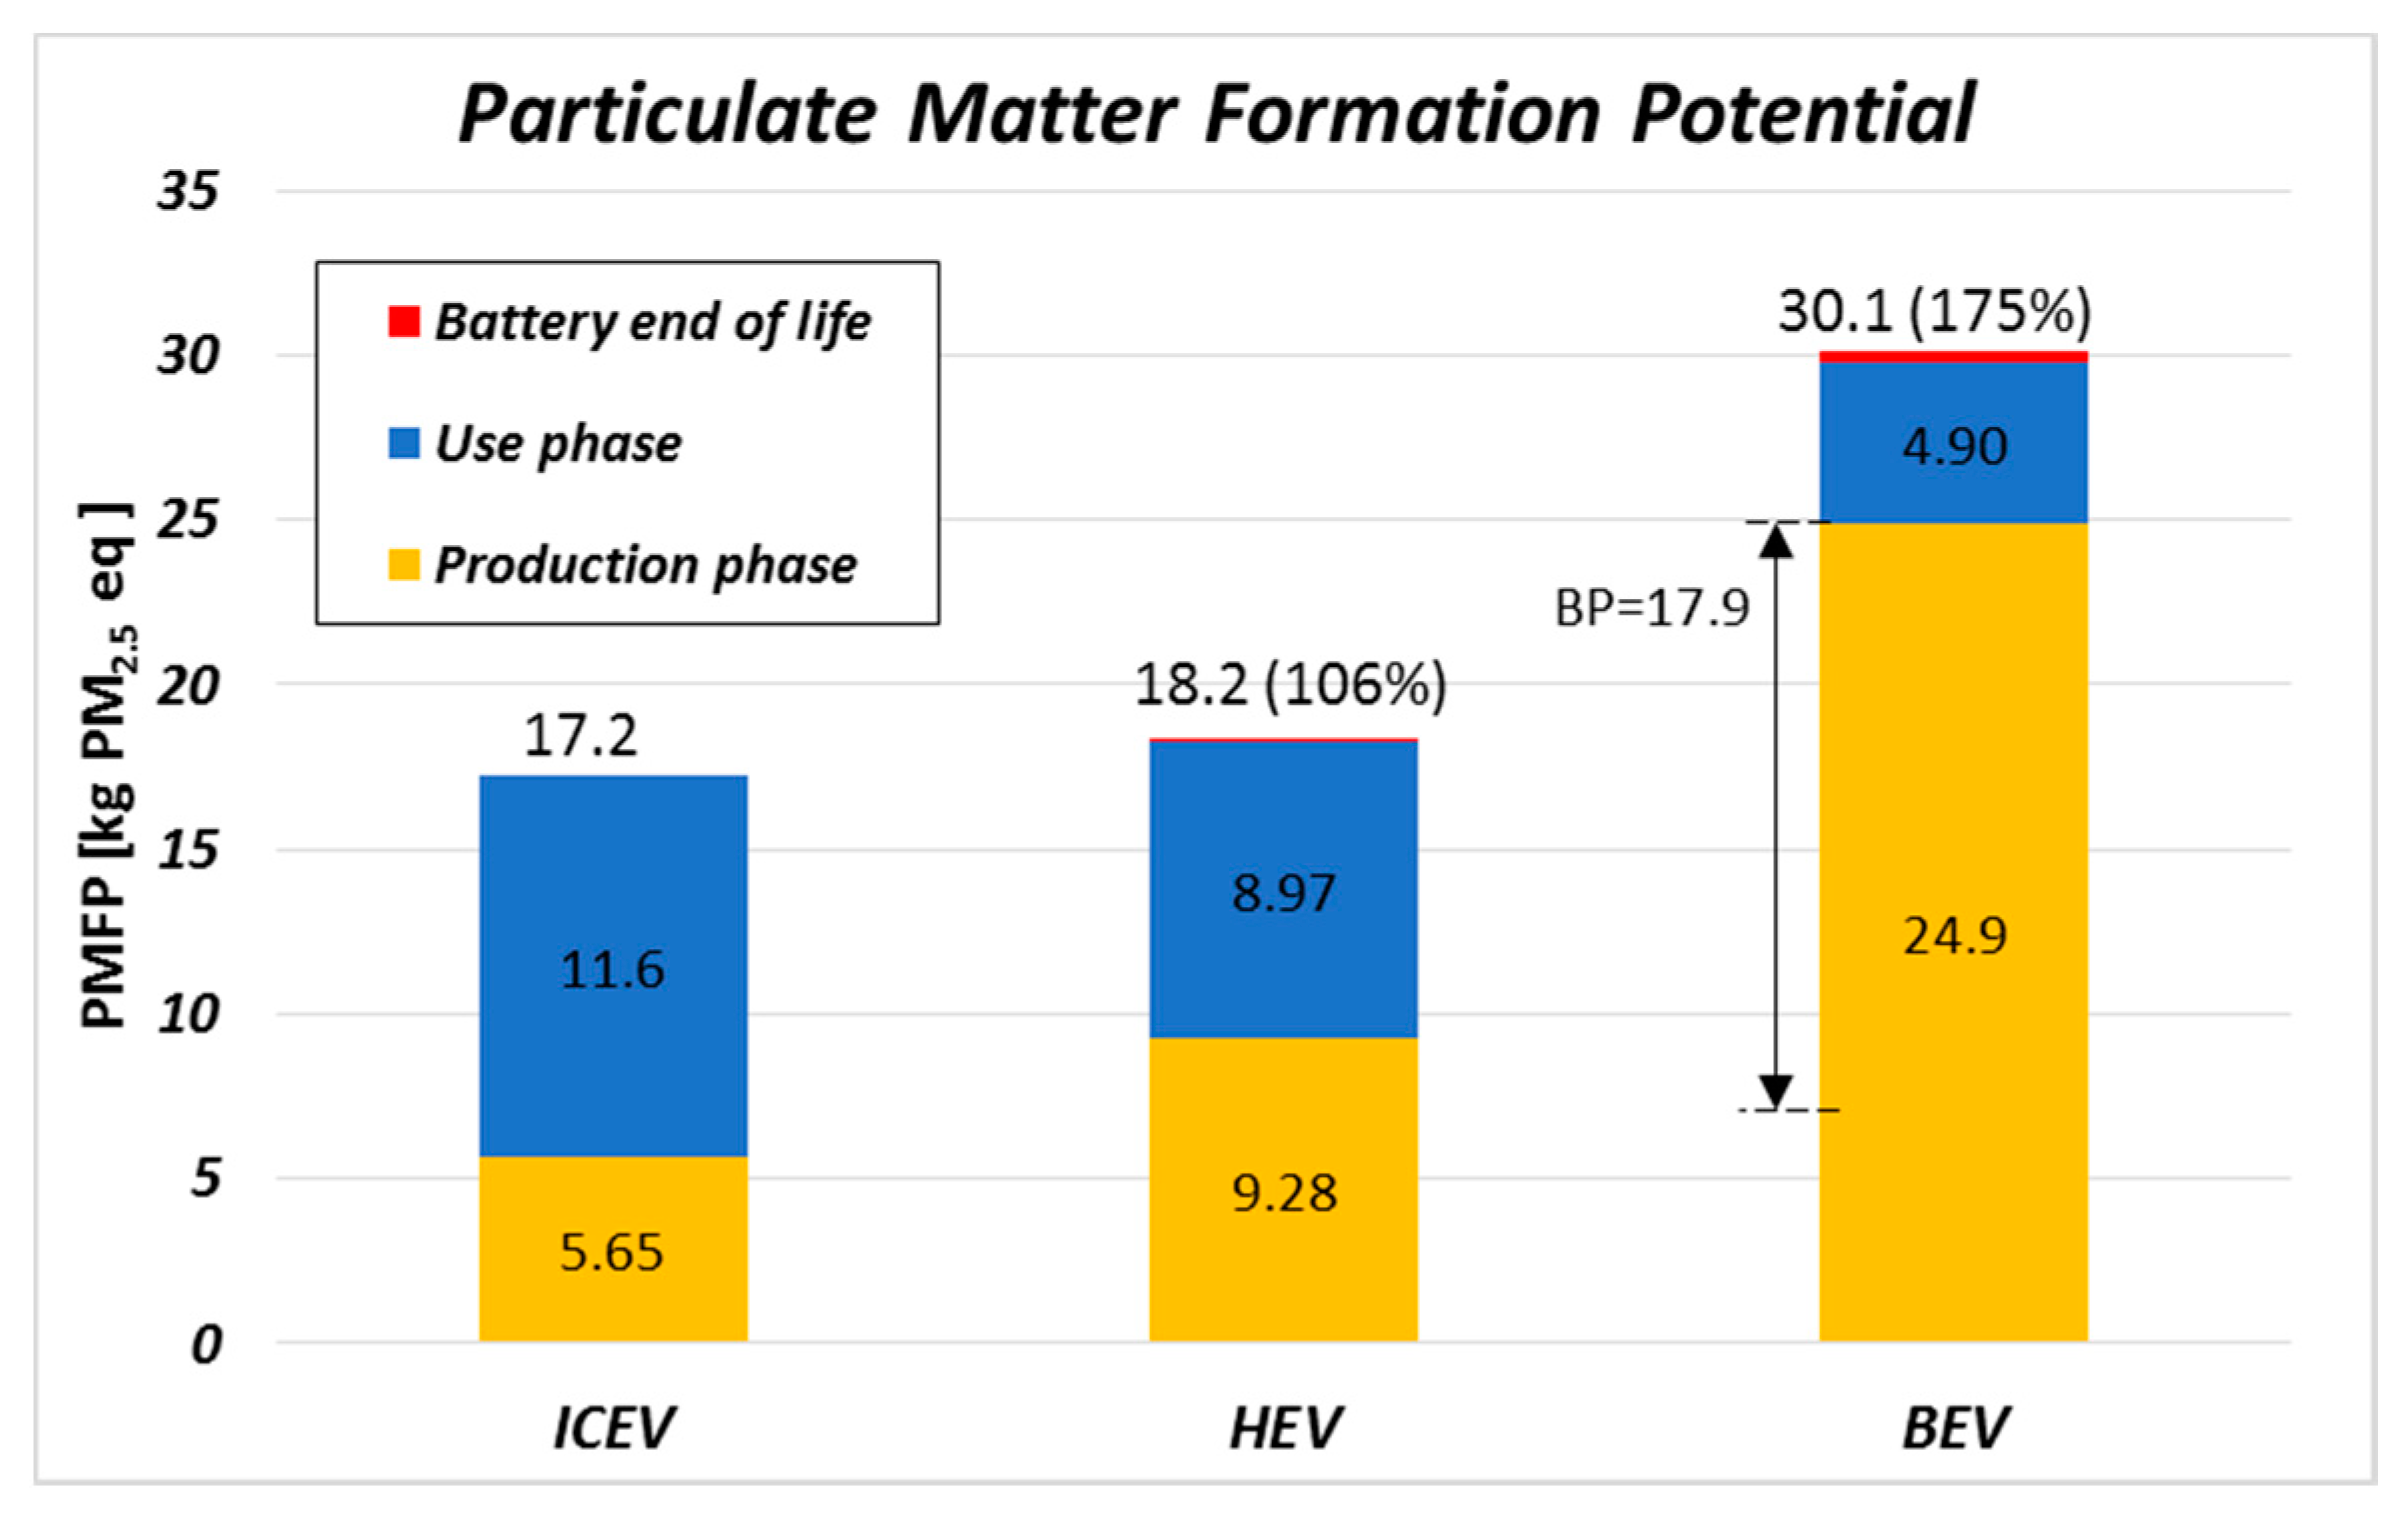
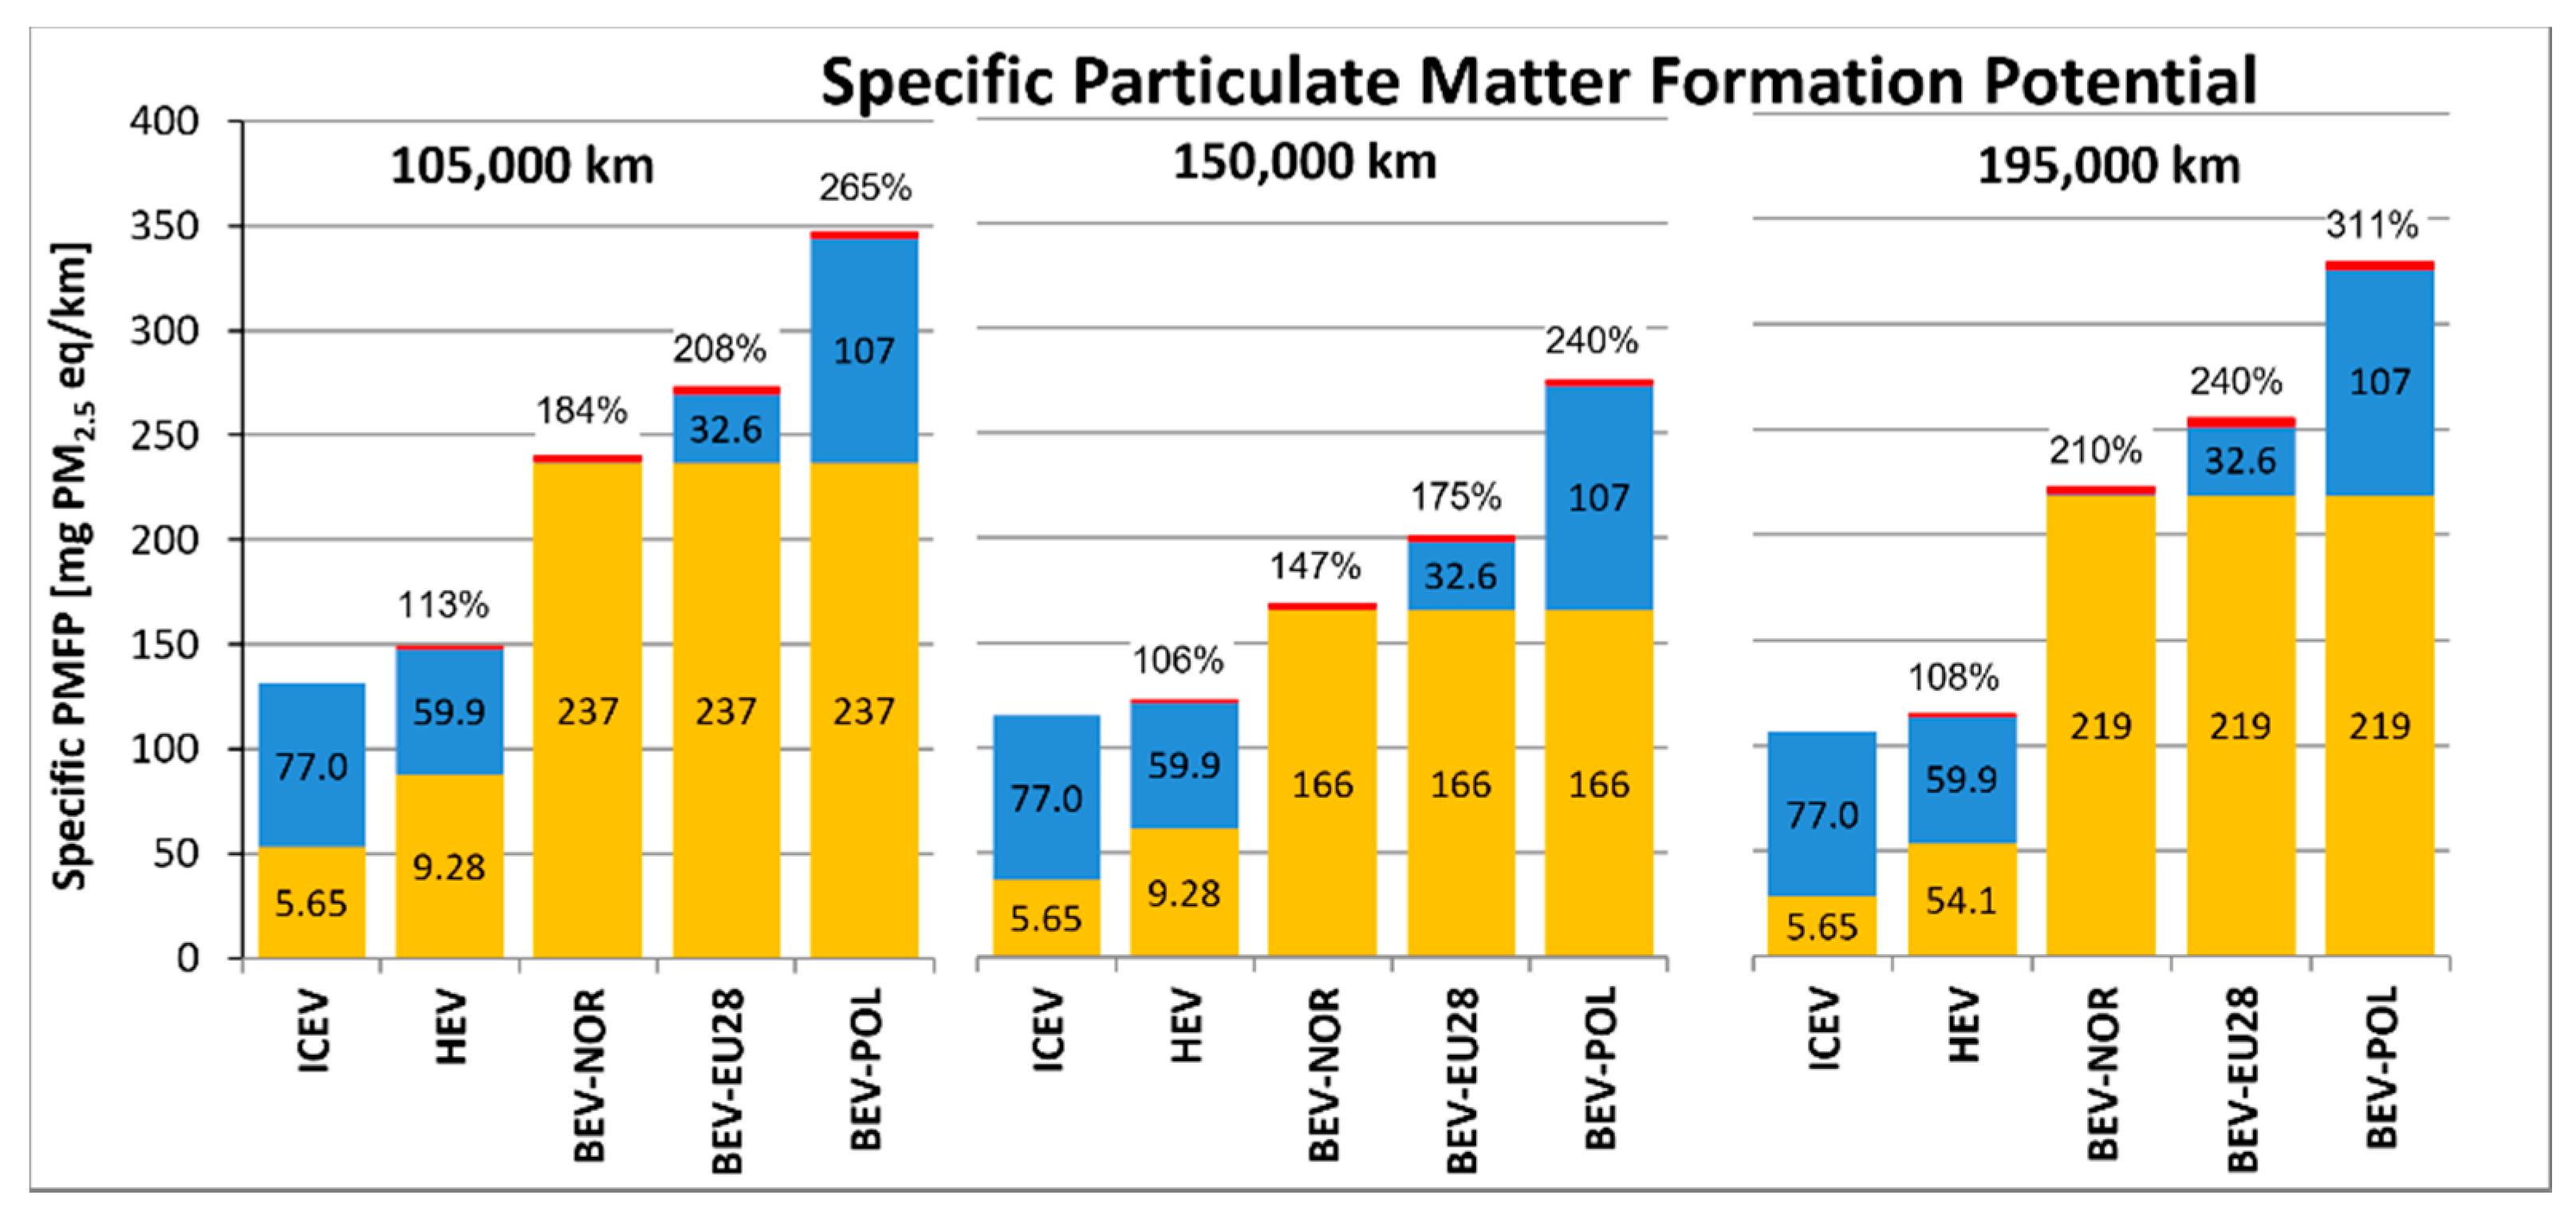
Fine particulate matter formation: focusing on human population intake of PM2.5, the change in ambient concentration of PM2.5 after the emission of primary PM2.5 or precursors (e.g., NH3, NOX, SO2) is evaluated by means of the Particulate Matter Formation Potentials (PMFP), expressed in terms of the equivalent mass of PM2.5 [14,15].
(3)
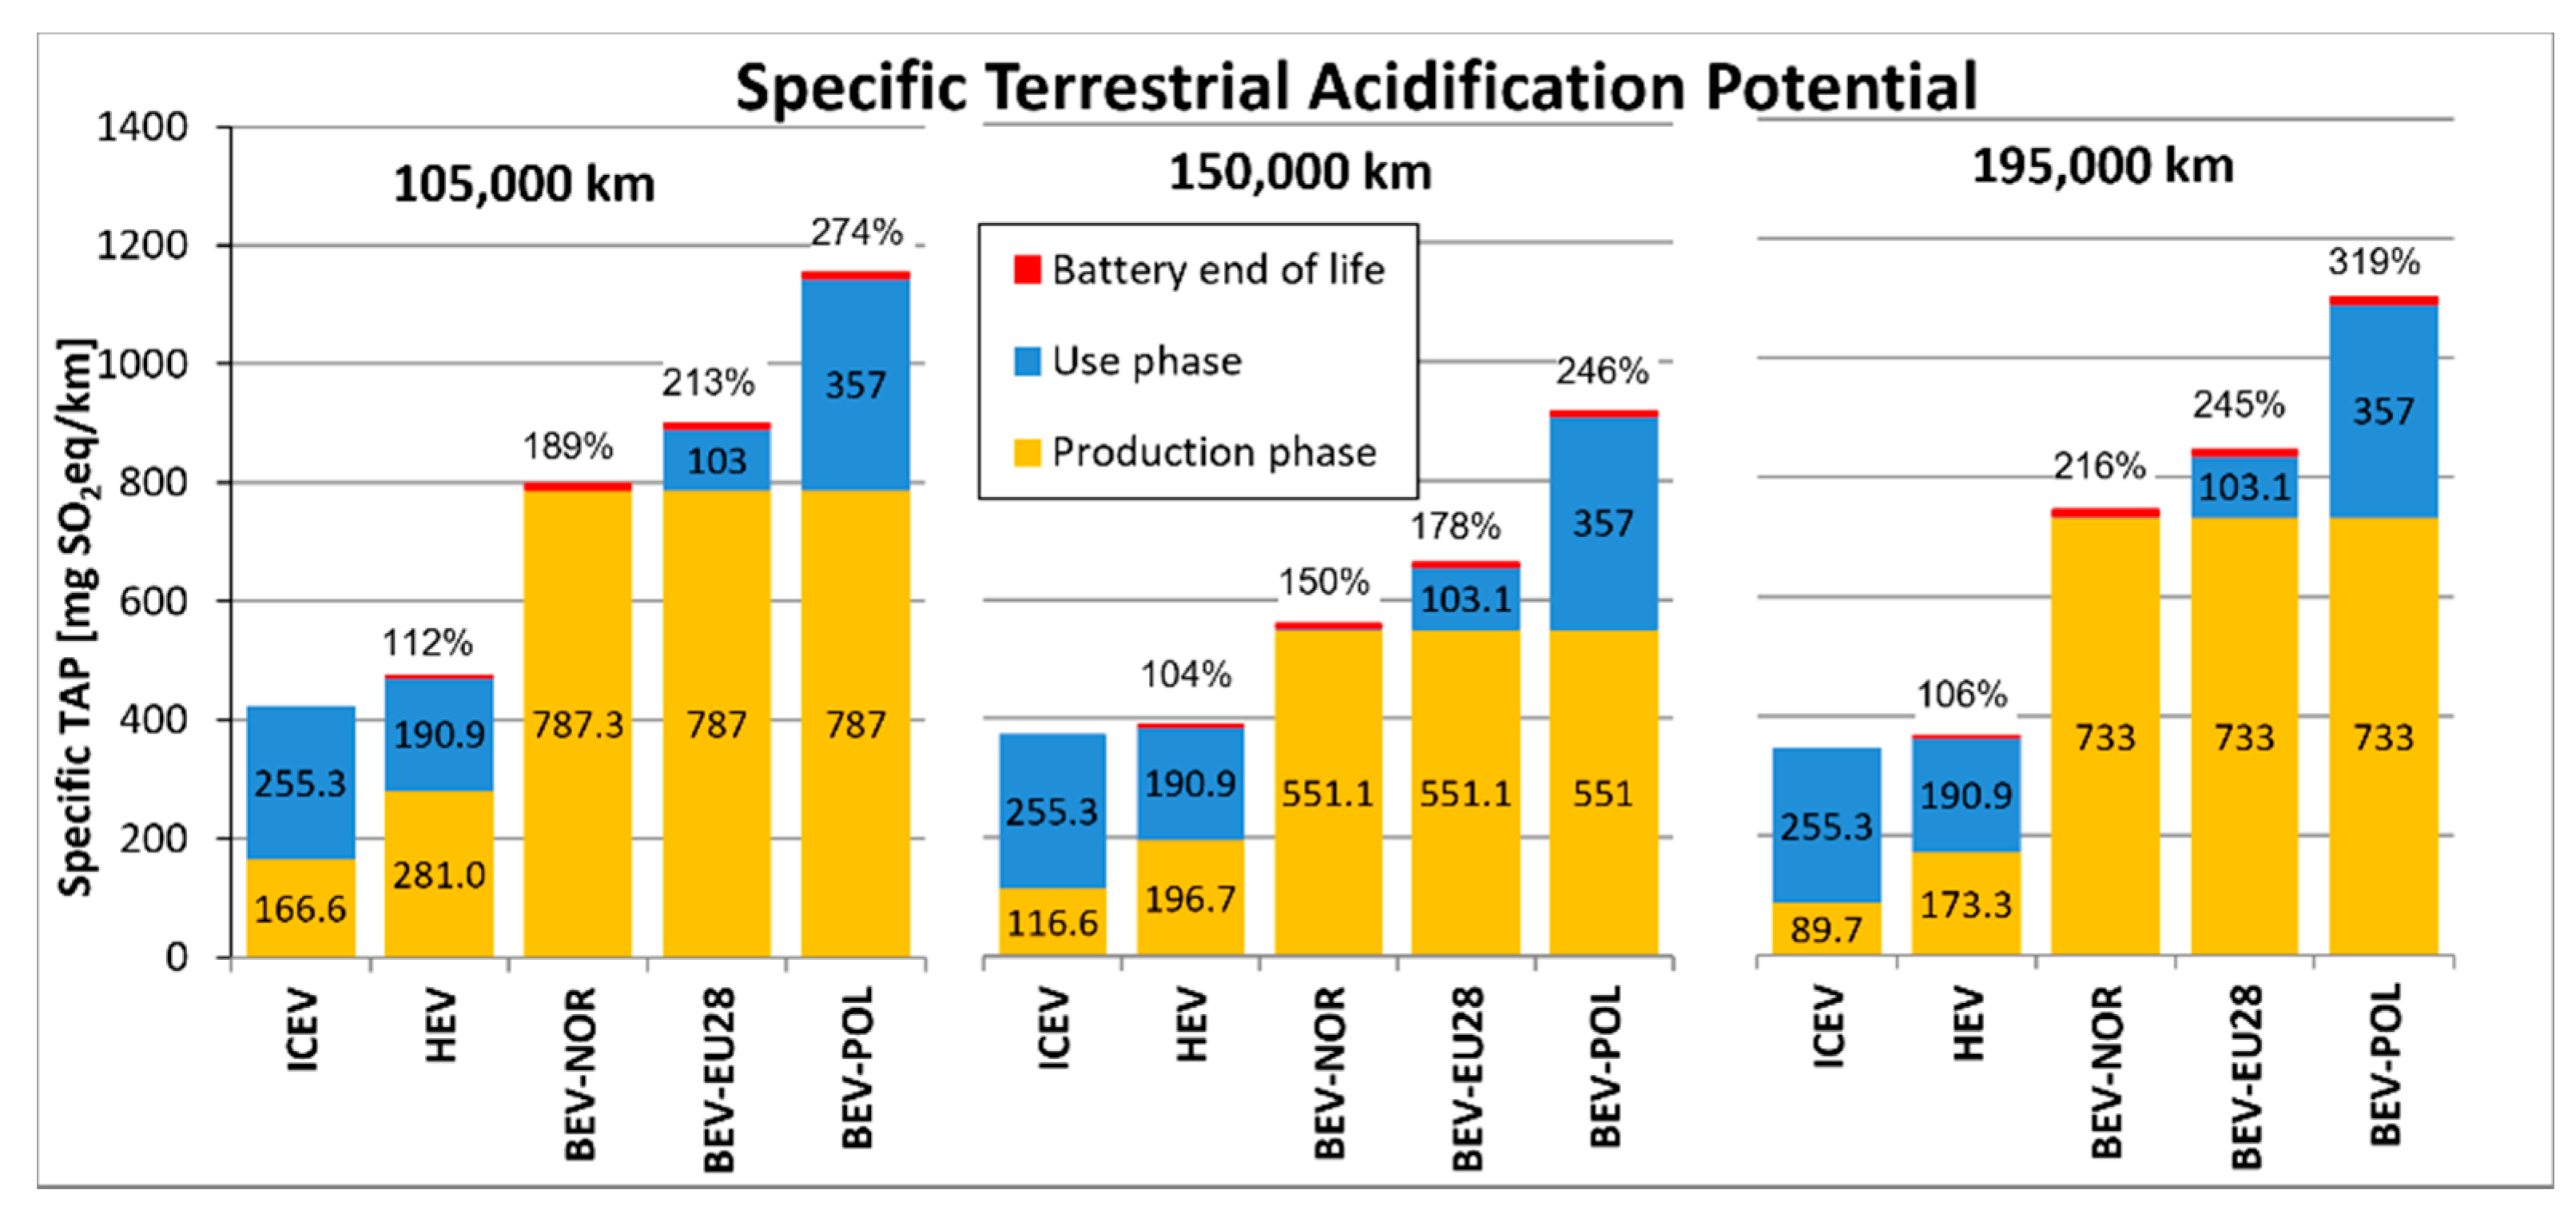
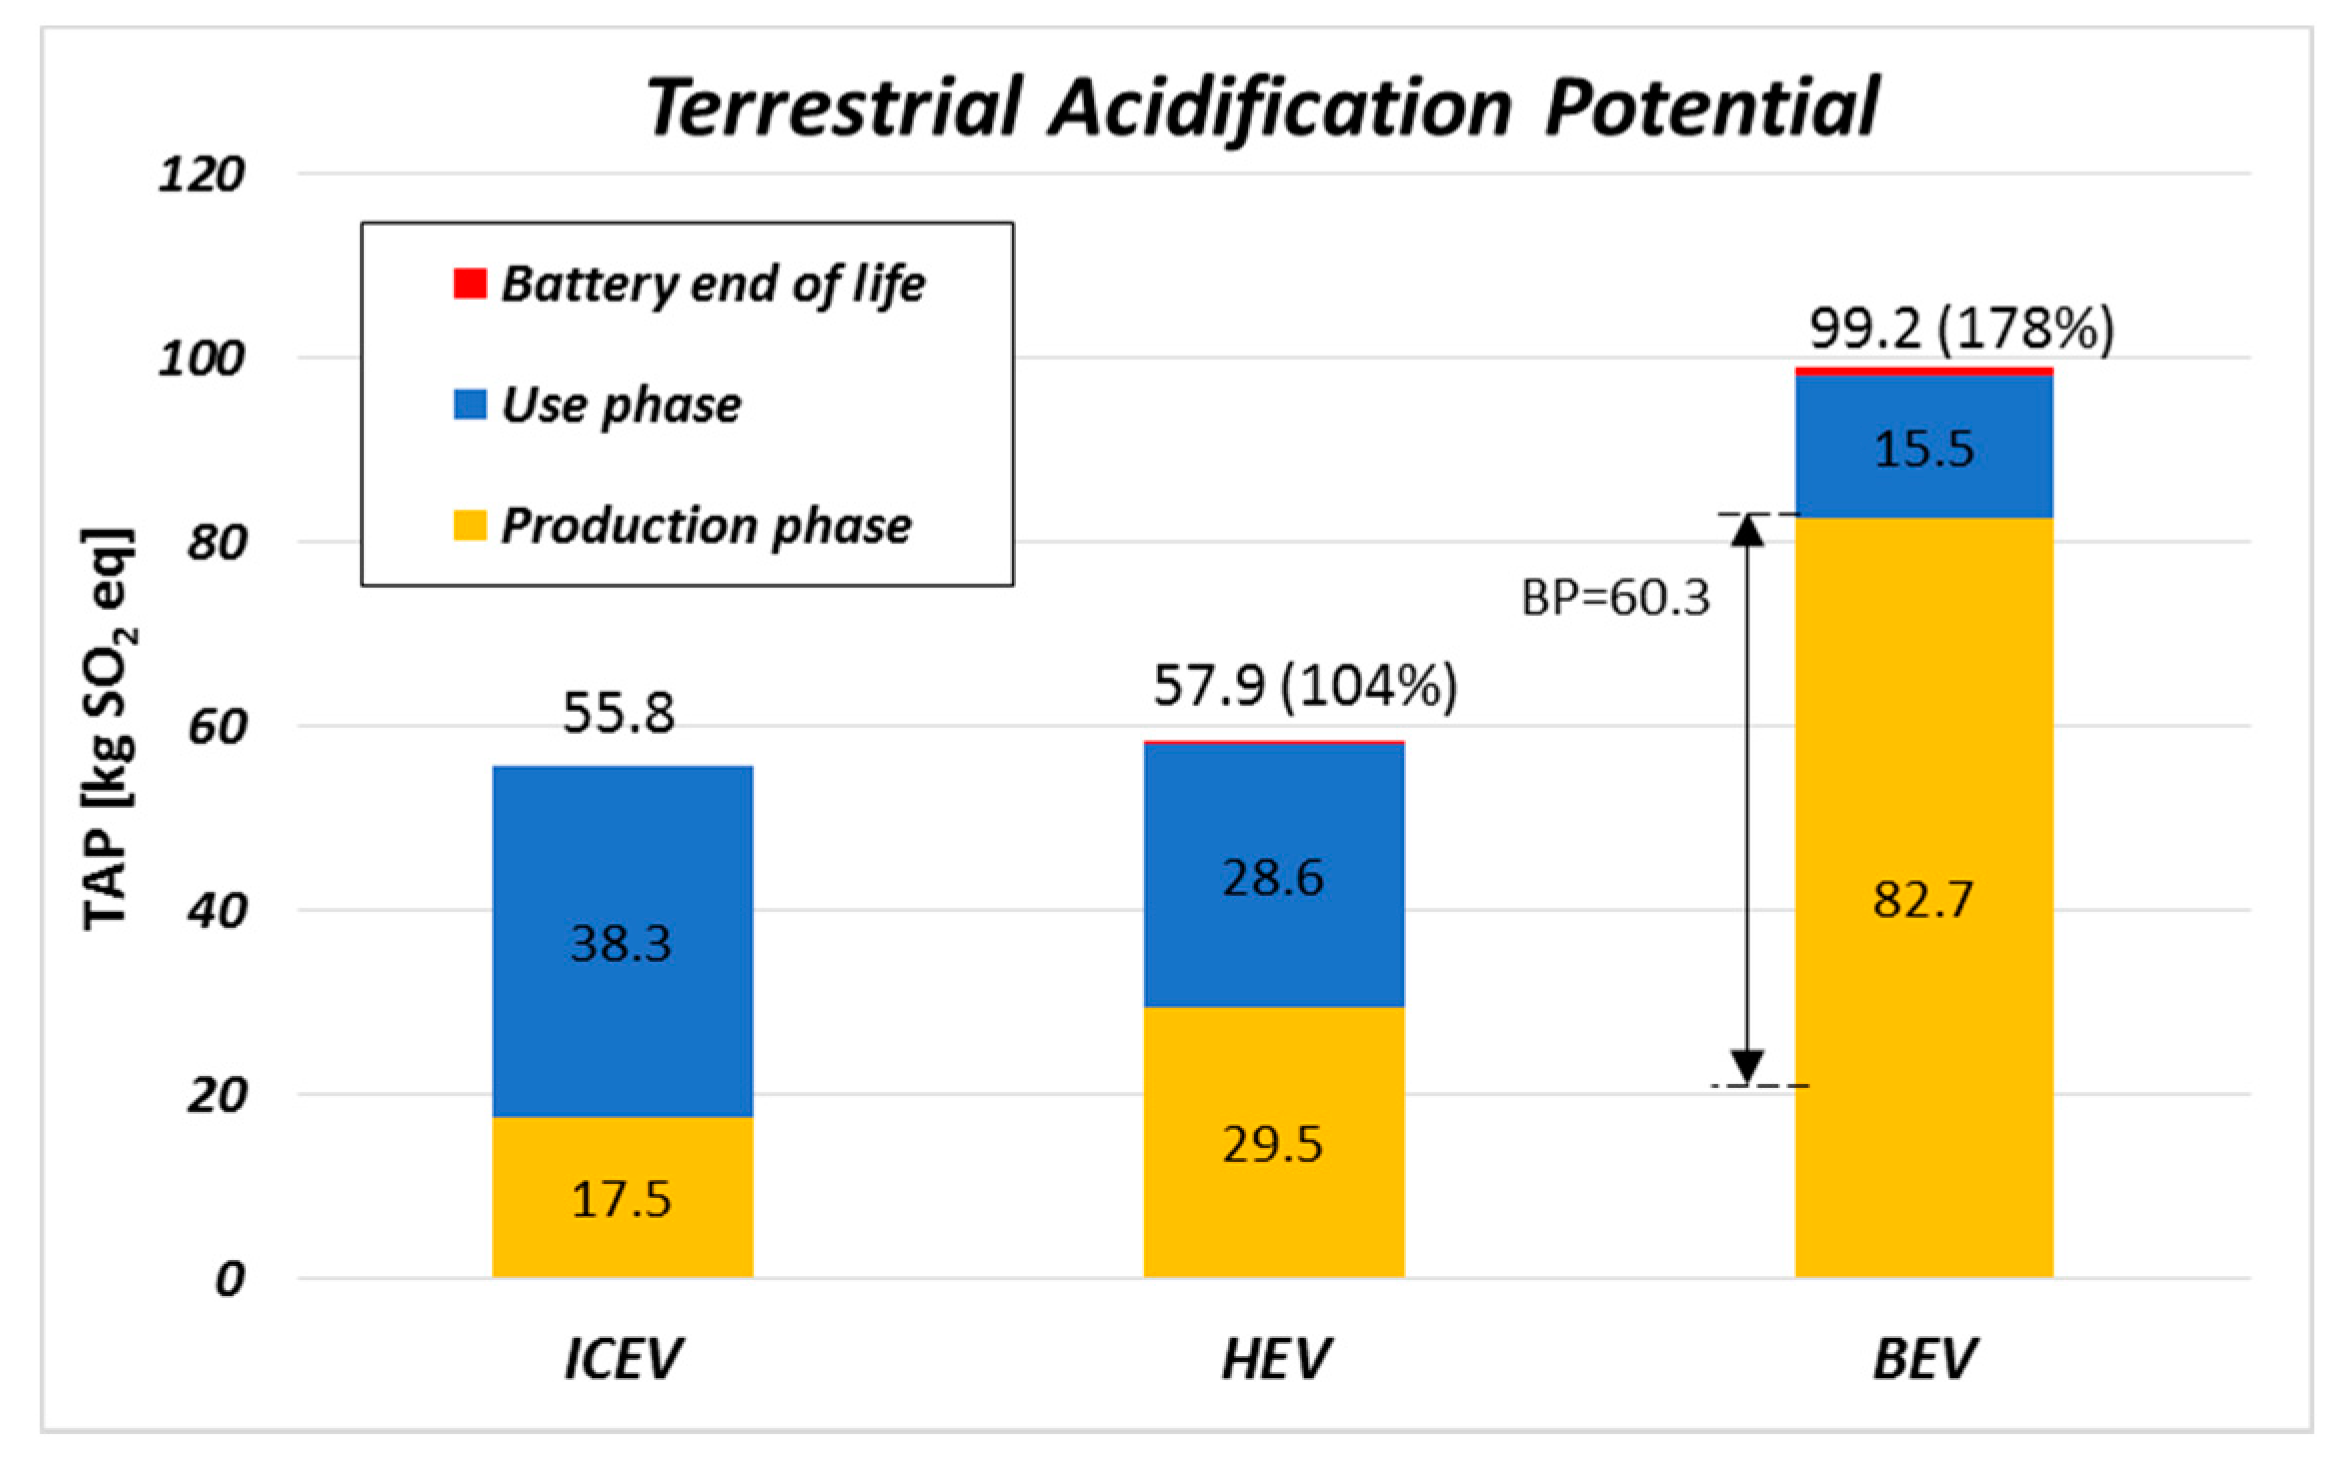
Terrestrial acidification: soil acidity variation due to acid deposition is taken into account by means of the Terrestrial Acidification Potentials (TAP) which expresses the amount of acidifying emissions (e.g., NOX, NH3, and SO2) introduced in the atmosphere in terms of the equivalent mass of SO2 [14,15].
(4)
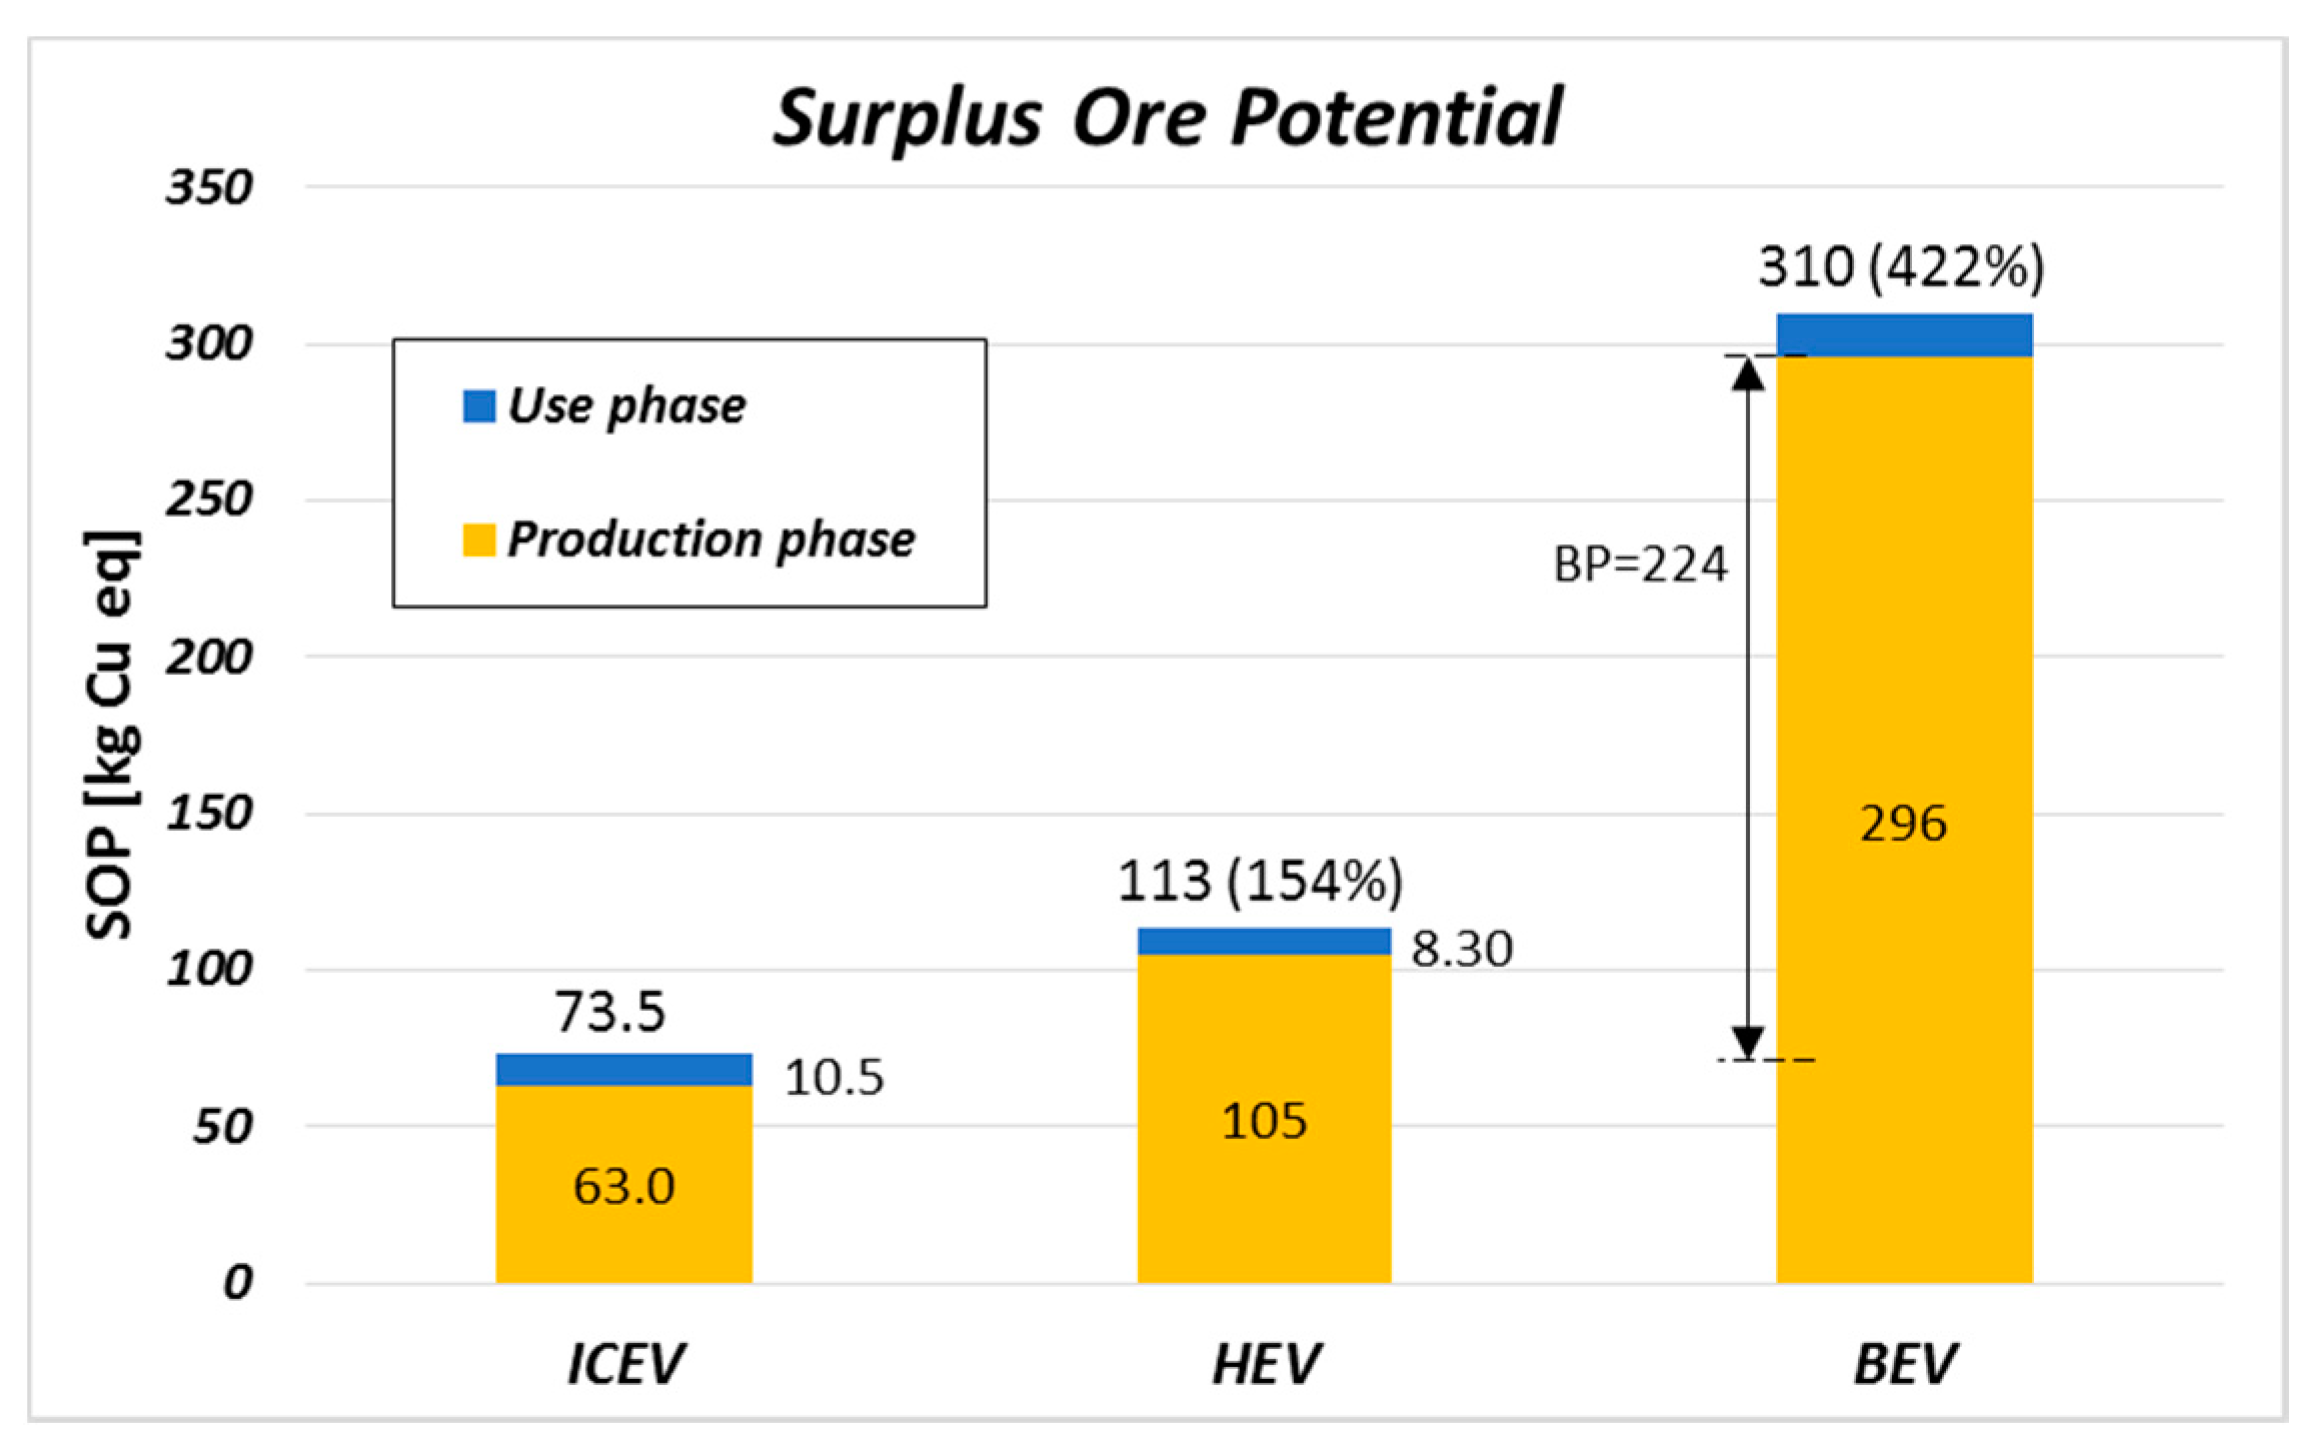
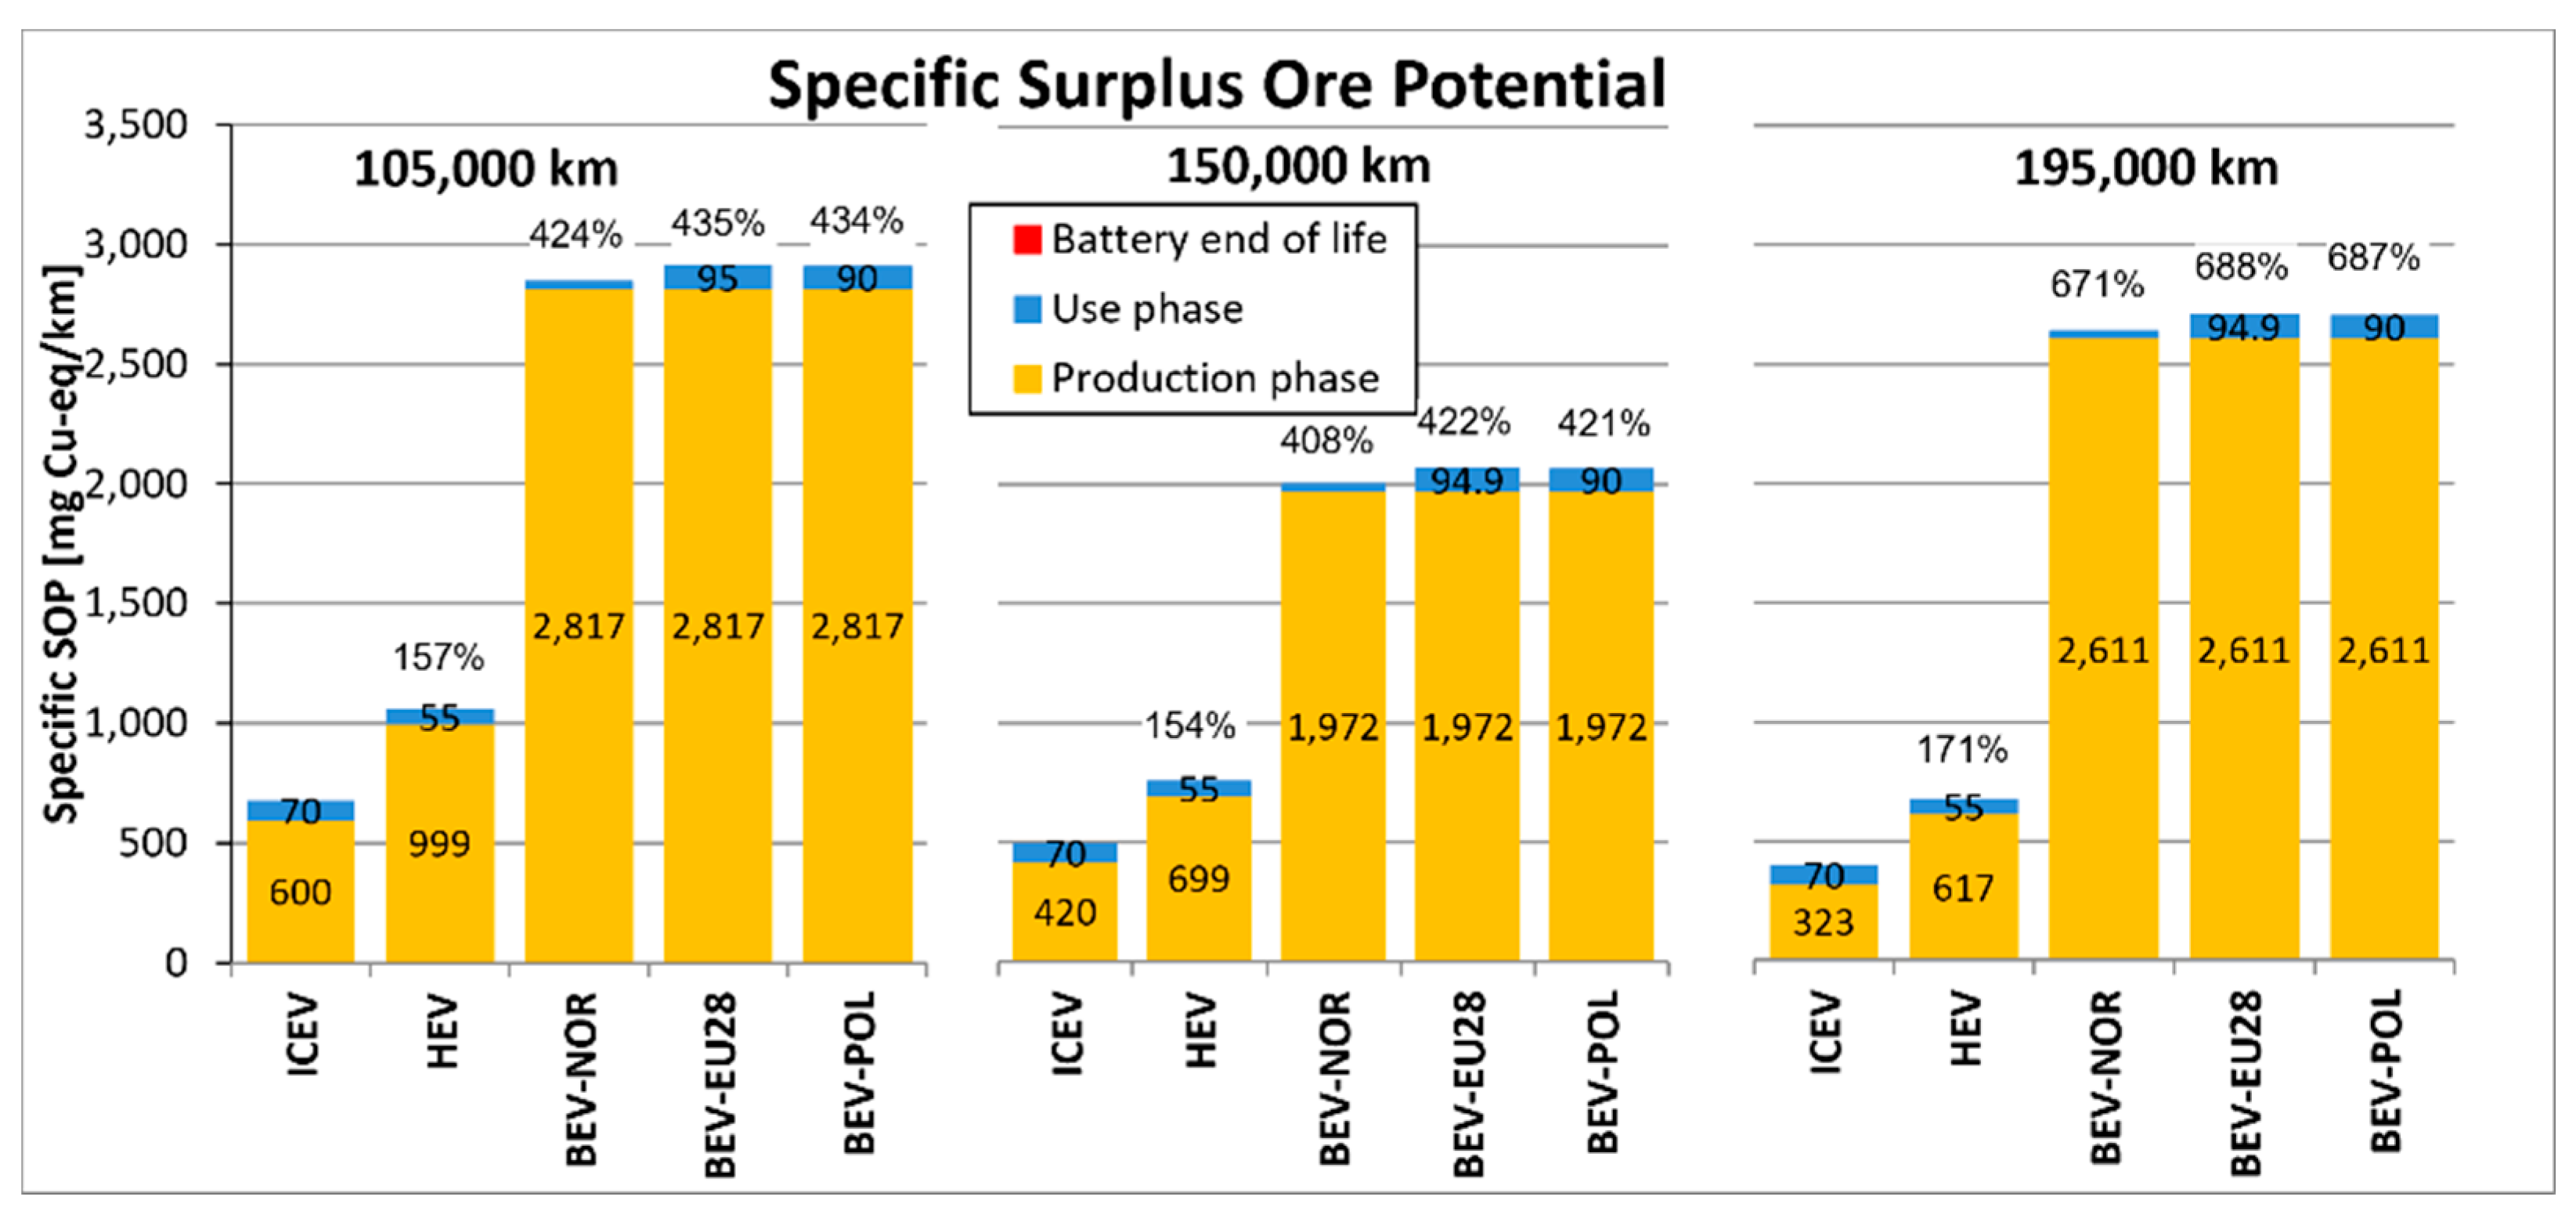
Mineral resource scarcity: although minerals are available in almost infinite amounts in the world, the real availability of a mineral resource primarily depends on the grade, i.e., the concentration of the mineral within an ore. The primary extraction of a mineral resource leads to an overall decrease in the concentration of that resource in ores worldwide. The lower is the grade of a mineral, the larger will be the amount of ore mined to extract the same amount of resource in the future, which obviously will imply larger land use, higher energy consumption, and waste production: this is the environmental impact related to the mineral resource depletion. The Surplus Ore Potential (SOP), expressed as the equivalent mass of copper, indicates the average extra amount of ore produced in the future caused by the extraction of a mineral resource considering all future production of that mineral resource [14,15,16].
(5)
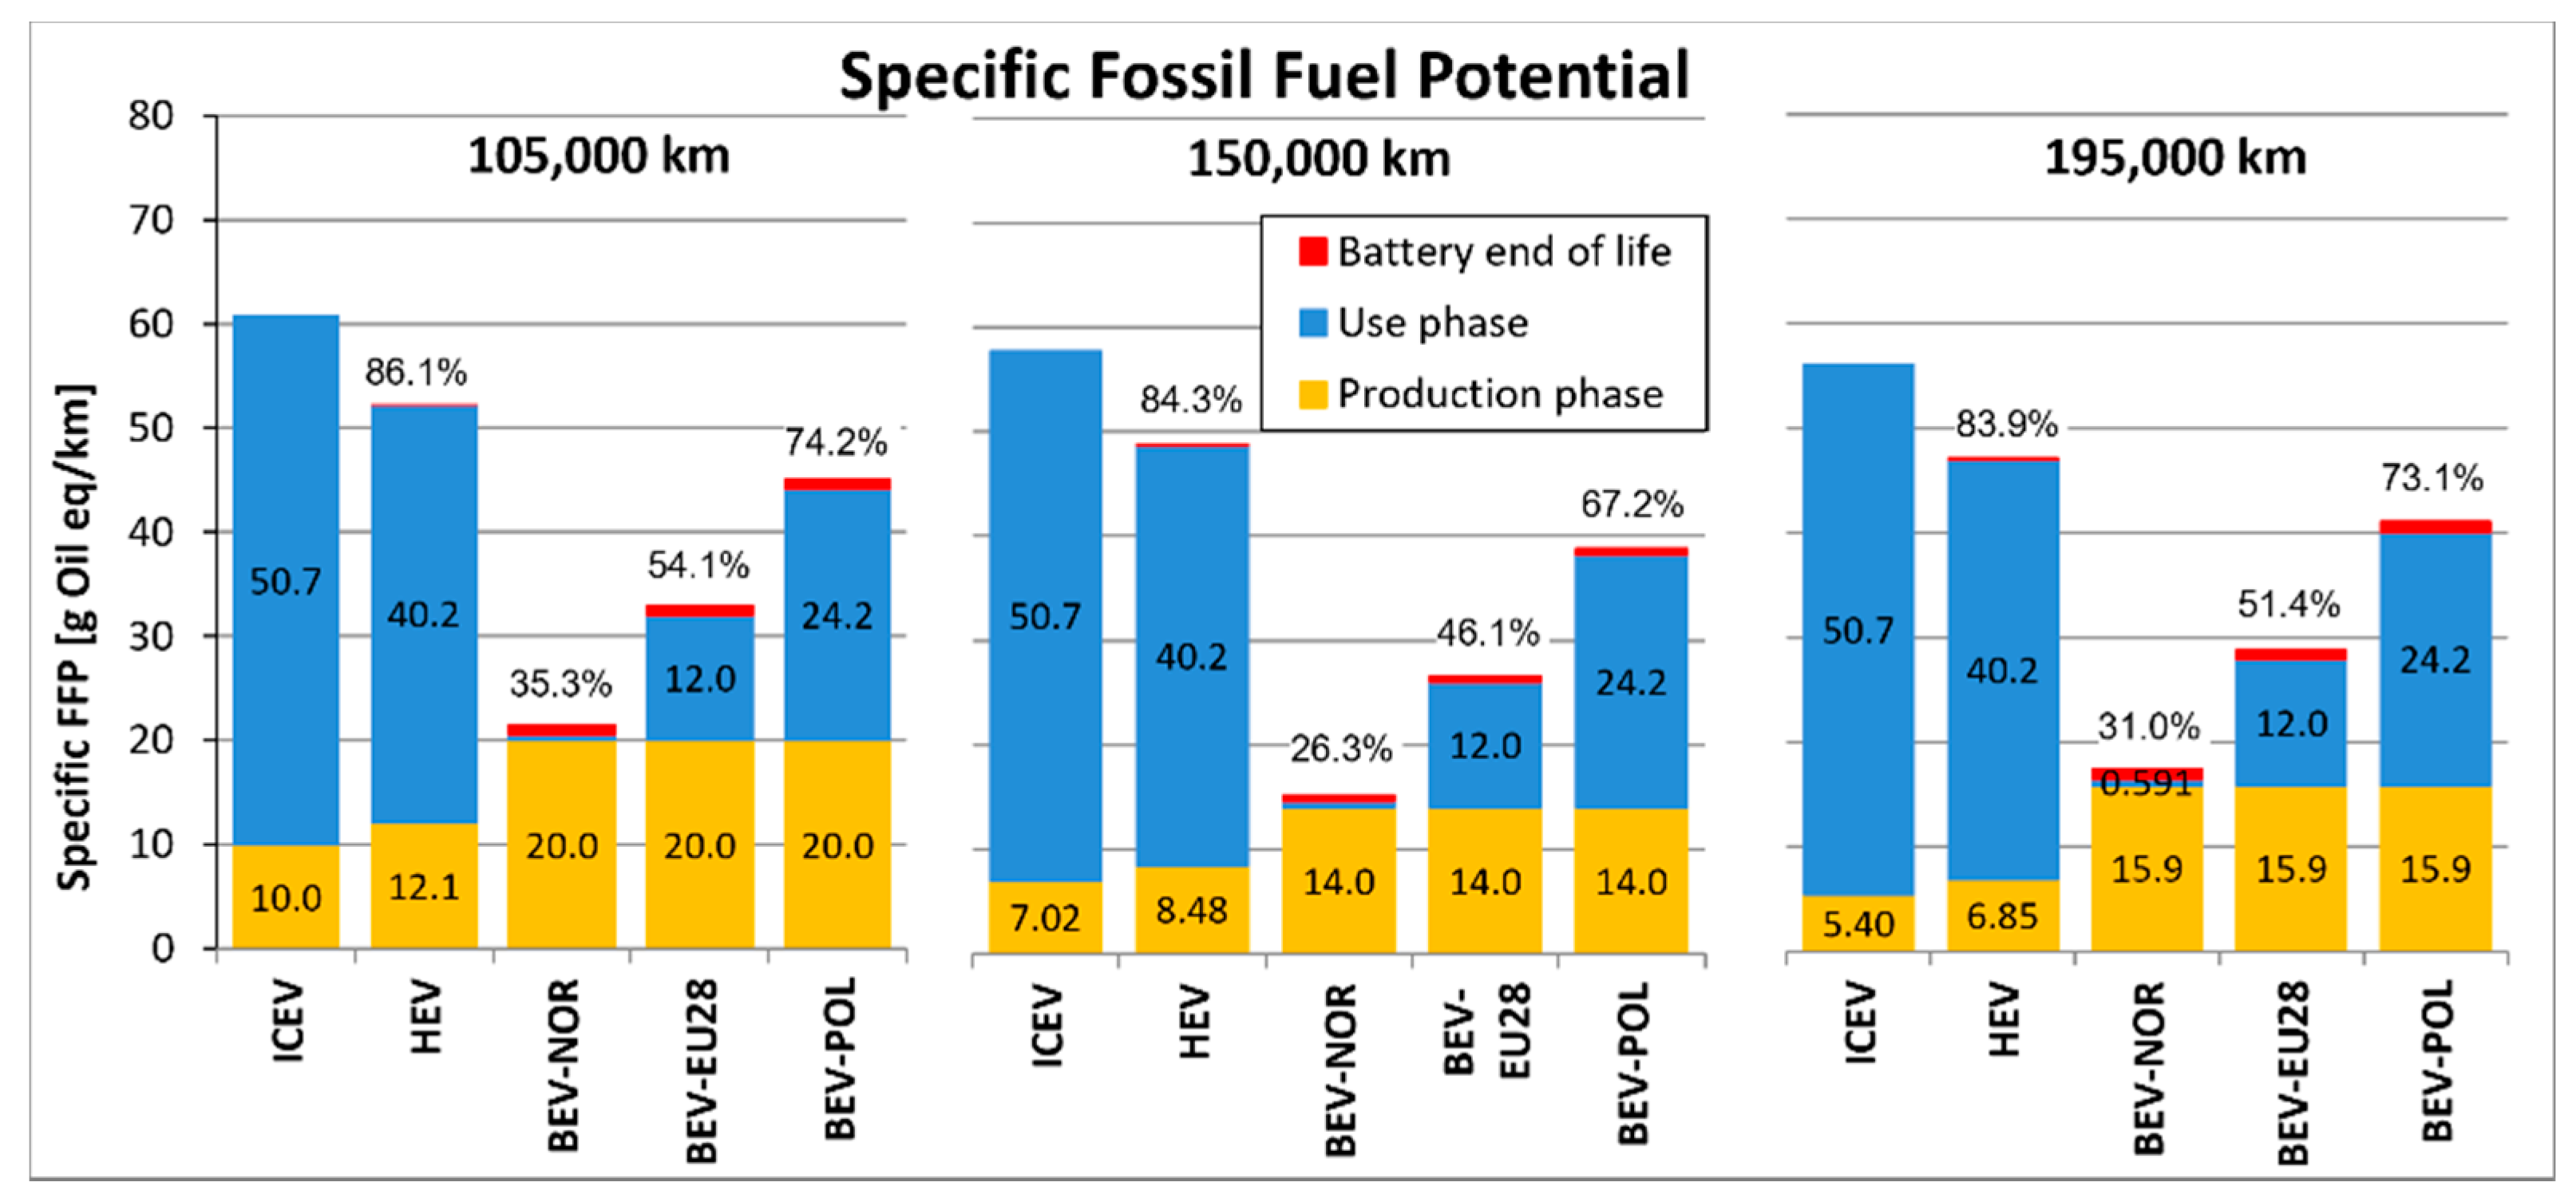
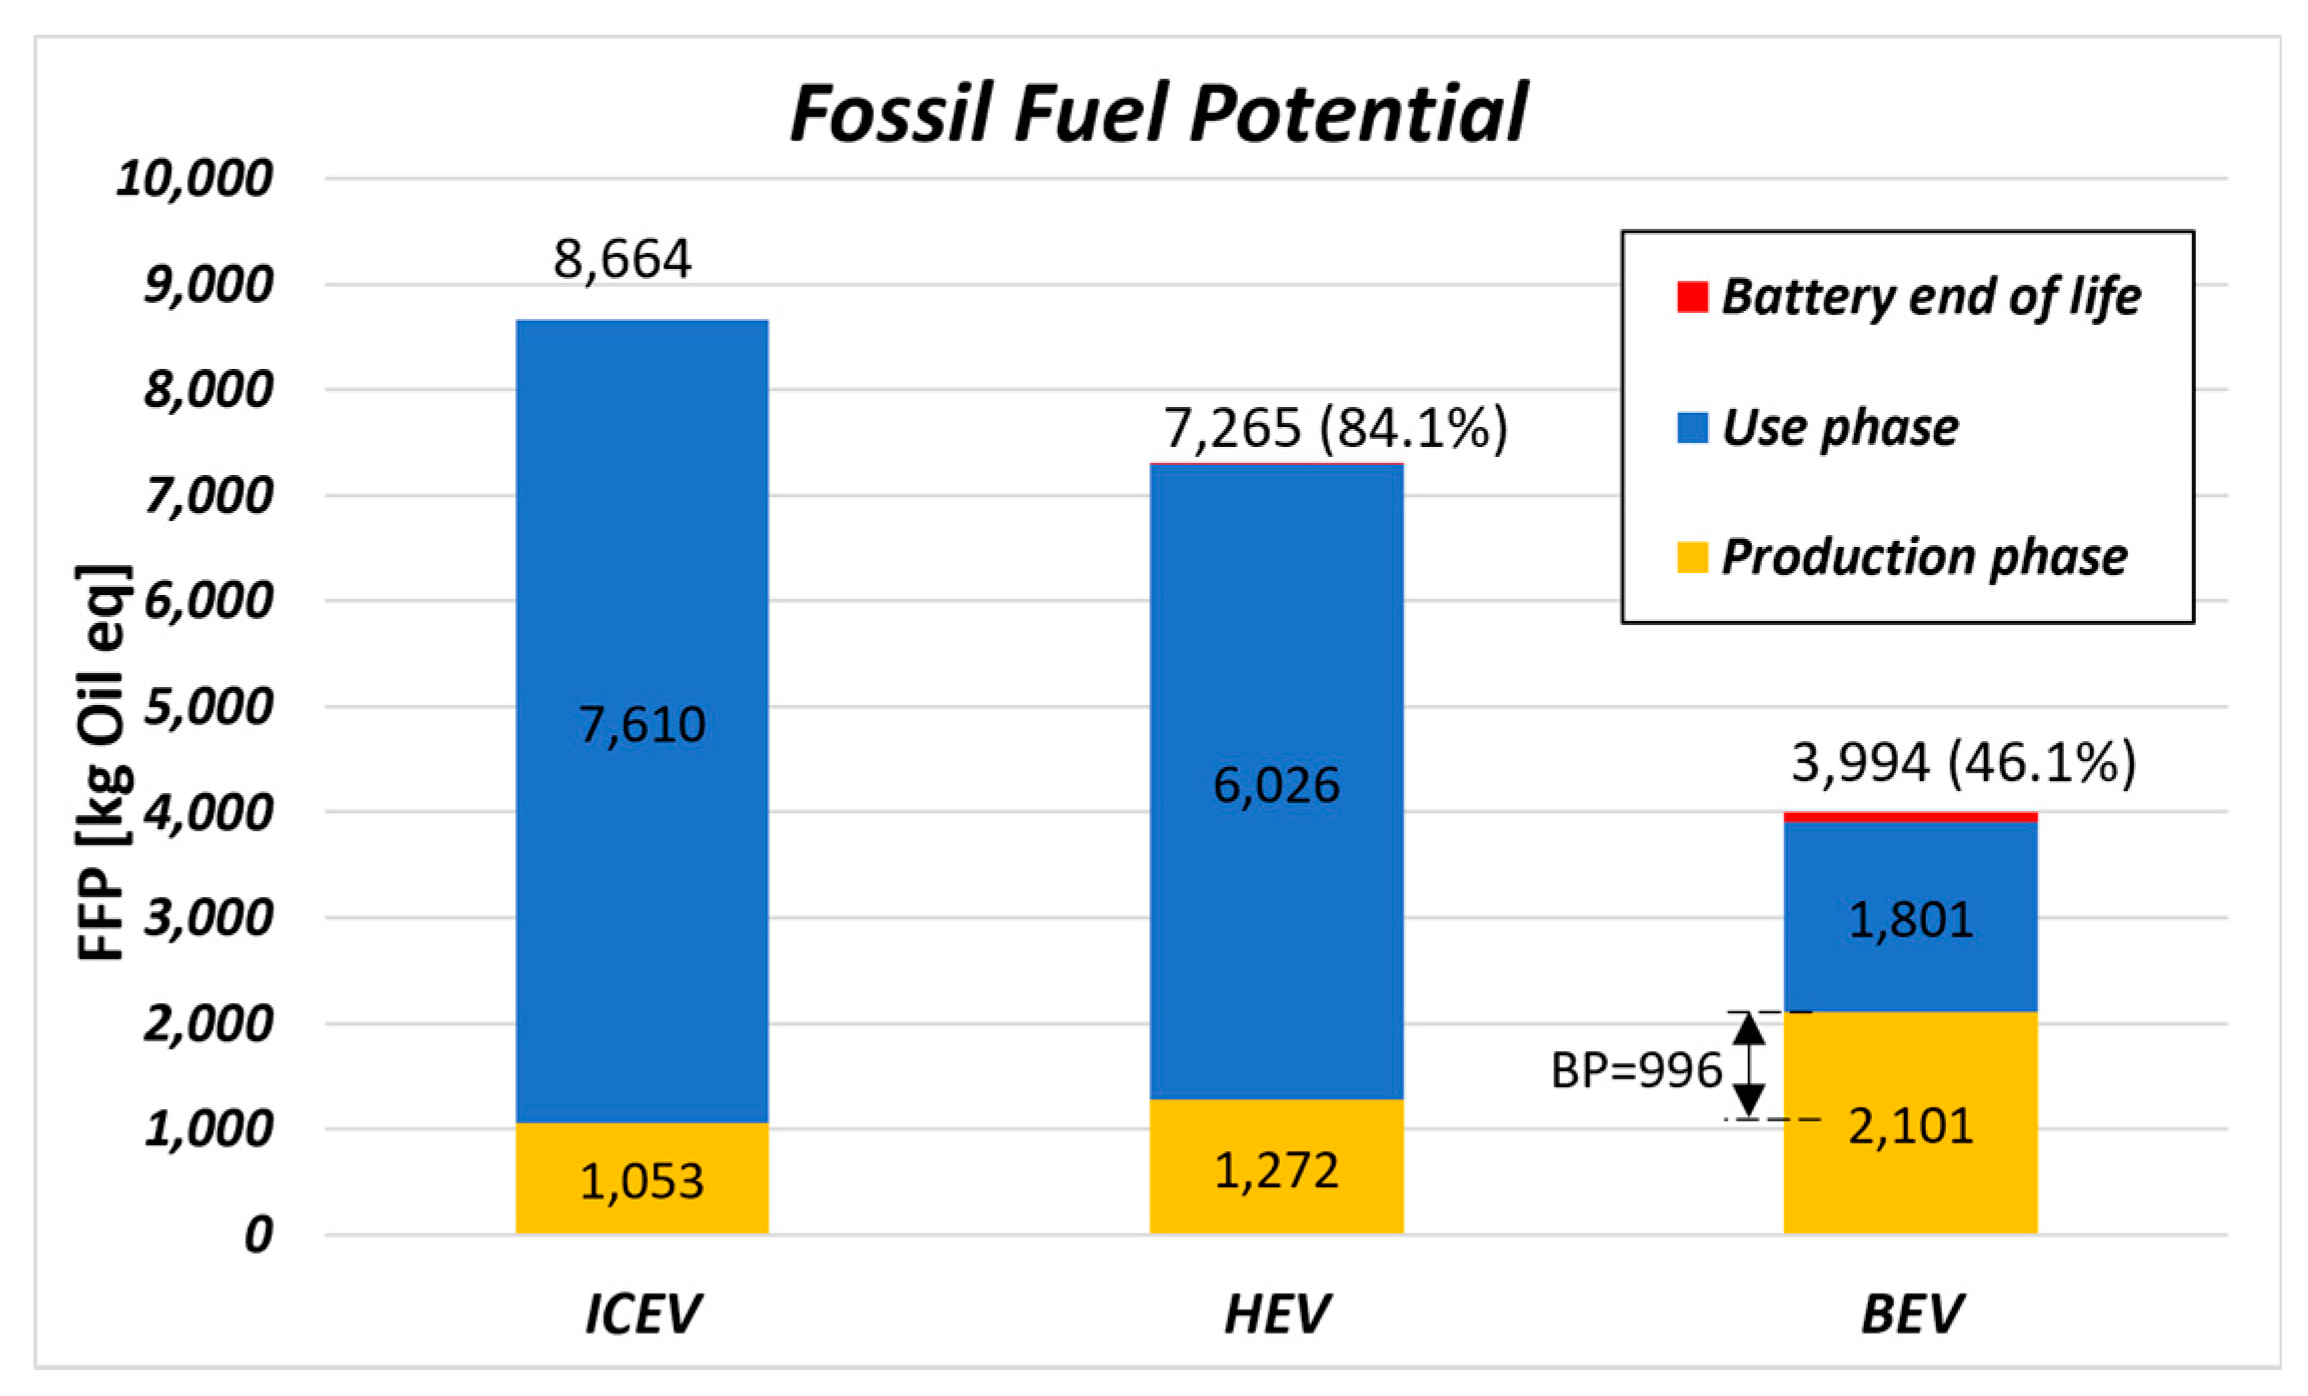
Fossil resource scarcity: with the same significance and approach followed for mineral resources, depletion of fossil energy resources is expressed in terms of the equivalent mass of oil using the Fossil Fuel Potential (FFP), which is calculated as the ratio between the higher heating value of the fossil resource and the higher heating value of crude oil [14,15].
Table 1 resumes the environmental impact categories considered, together with the characterization factors and the unit adopted [15], to quantify the contribution to each category.
With the aim to give the obtained results a greater generality and applicability, the environmental impact comparison was carried out considering three fictitious vehicles (a gasoline ICEV, a gasoline HEV, and a BEV) representative of real market products, whose performance and characteristics, as shown further on, were determined on the basis of real vehicles available on the 2019 market. The functional unit [10] of this study is hence the distance traveled by each vehicle during its entire life. For the life cycle impact evaluation, the following assumptions were also made by the authors:
(6)
The three vehicles compared were assumed to be produced in Germany in 2019: the reason for this assumption is that, as reported by ACEA [17], Germany is the European state with the largest production of passenger cars (4.66 million units in 2019, i.e., 30% of EU production) followed by Spain (2.18 million units in 2019, 14% of EU production).
(7)
The lithium-ion batteries of both the hybrid and the electric vehicles were assumed to be manufactured in China, which is the largest producer in the world: considering, for example, lithium-ion bases batteries for electric vehicles, in 2017 about 70% of the world production (145 out of 206 GWh) came from China [18].
(8)
A reference lifetime distance of 150,000 km traveled in Europe was assumed for each of the three vehicles considered: this was established considering that in the European Union, a passenger car travels an average distance of 12,529 km each year, and has an average useful life of 11.5 years [19]—it results in an average distance traveled by a passenger car during the lifetime of 144,085 km, rounded by the authors to 150,000 km.
According to the assumptions made, hence, the German electricity mix was considered for all the vehicle production phases, excluding the lithium-ion batteries, whose production was instead considered under the Chinese electricity mix. In contrast, in regards to the use phase, each vehicle was supposed to travel all over Europe for the whole lifetime distance. As a result of this assumption, the European gasoline production and distribution chains were assumed for the calculation of the impact related to the fuel employed in combustion engine vehicles, and the average European electricity mix was considered to account for the impact related to the electric energy used by the BEV.
As can be noted, in their evaluation, the authors followed the approach to represent the “most probable situation” making reference to the most diffused case; as a result, the assumptions made delimited the target of this study to the passenger cars belonging to the small-medium category, produced and assembled in Germany, endowed of Li-ion batteries produced in China, and fueled (or recharged) all over Europe.
Moreover, as will be shown further, with the aim to weigh the role of both electricity mix and traveled distance, a scenario analysis was also performed, adding to the comparative analysis two more lifetime mileages and taking into account the two extreme situations currently present in Europe, that is the Norwegian electricity mix, characterized by an almost null carbon footprint, and the Polish electricity mix, still dominated by the recourse to fossil sources. These cases have allowed extending the limits of the analysis, embracing all the European real possible scenarios.

4. Life Cycle Inventory

As already mentioned, the life cycle environmental impact comparison was carried out considering three fictitious vehicles representative of real market products; to this purpose, for each propulsion technology considered (i.e., ICEV, HEV, and BEV), the authors defined the characteristics of a plausible reference vehicle on the basis of the information available on five different vehicles belonging to the B-C segments and available in the 2019 European car market. With regards, for example, to the traditional ICEV, Table 2 reports the technical data provided by the manufacturer of the five commercial vehicles (ICEV1 to ICEV5)—as shown, the last column, reports the technical specification of the representative ICEV used in the comparative environmental impact analysis. The assumptions made and the calculation performed to obtain the data of the reference ICEV are described in detail in Appendix A. Following a similar approach, the reference HEV and BEV were defined on the basis of the technical data available on five commercial products for each kind of propulsion; as a result, Table 3 and Table 4 report the specification of the real vehicles considered and of the reference vehicles adopted for the comparison.
The evaluation performed to determine the main characteristics of the reference HEV and BEV are also reported in Appendix A. The average composition of each electricity mix considered in this study [20] is instead reported in Table 5, according to the assumption made in the Goal and Scope section.

5. Life Cycle Impact Assessment

5.1. Production Stage

As already mentioned in the Goal and Scope section, the environmental impact related to the production phase of each standard vehicle was estimated using the GREET 2020.Net suite. Being this software developed in the United States of America, the processes related to materials production (e.g., steel production) and to mining (e.g., iron extraction) are referred to as the default geographical context of the USA. With the aim to adapt the GREET model evaluation to the assumption made (i.e., the vehicles were supposed to be produced in Germany), the authors replaced the built-in electricity mix of the USA with the electricity mix of Germany (Table 5). It was also assumed an equal demand of thermal energy and materials during the vehicle production phases, which in actual fact corresponds to assume the same industrial technological level between Germany and the USA. It is worth mentioning, however, that the assumption on the geographical localization of the vehicles production phases in Germany did not regard rare materials produced only in few parts of the planet. In these cases, in effect, the source is considered the same for all the production companies all over the world.
According to the GREET model, the mass of each vehicle is divided into three categories [21]:
  • Components
  • Fluids
  • Battery
For the “Vehicle components” category, in turn, the GREET software estimates the percentage mass distributions reported in Table 6 for each kind of vehicle considered; as will be shown, these mass distributions will be necessary to evaluate the environmental impact associated with the production of the components of each vehicle considered. Moreover, the “Vehicle Assembly” function of the GREET model takes into account the assembly, welding, and painting processes necessary for each vehicle. In this phase, the energy necessary for the end-of-life disposal of the vehicle (battery excluded) is also considered and evaluated. The emissions related to the production of each individual component will be hence summed to the emissions caused by the assembly of the vehicle, thus allowing estimating the overall emissions connected to the production of the entire vehicle (battery excluded).

5.1.1. Battery Production

This paragraph refers to the production of the batteries employed in fully electric and hybrid vehicles, while the production of lead-acid batteries usually adopted in ICEV is already accounted for in the vehicle production phase. BEVs and HEVs are mainly equipped with lithium-ion batteries [22] of various types, depending on the different compositions of cathode materials; at present, the most diffused cathode chemistries for lithium-ion batteries are [22,23]:
  • LCO—Lithium Cobalt Oxide (LiCoO2)
  • LMO—Lithium Manganese Oxide (LiMn2O4)
  • NMC—Lithium Nickel Manganese Cobalt Oxide (LiNiMnCoO2)
  • LFP—Lithium Iron Phosphate (LiFePO4)
  • NCA—Lithium Nickel Cobalt Aluminum Oxide (LiNiCoAlO2)
In connection with the reported cathode materials, graphite is the most commonly used anode material [22,24,25]. Lithium-ion polymer batteries (often referred to as LIPO) employ a polymer-based composite material as electrolyte and are produced with all the different cathode chemistries already listed. With the aim to represent the most probable situation, the authors focused on NMC batteries, which currently constitutes the most diffused technology among the electric vehicles registered in the United States, Europe, and Japan [26] due to its high energy density and long cycle life, as is confirmed by the data reported in Table 4; NMC batteries are increasingly used compared to LFP technology, and continued growth is expected in years to come. In the present paper, hence, the GREET model was used to estimate the environmental impact associated with the production of the batteries of each BEV and HEV considered, with reference to the production technologies and to updated data collected by manufacturers of lithium-ion batteries for the automotive sector in China [27,28]; as already explained in the Goal and scope section, the China electricity mix was introduced in the GREET model for the evaluations of the impact related to Li-ion battery production, which is substantially carried out in two separate steps. In the first, the bill of materials (BOM) necessary for the battery realization is compiled based on the battery type and weight, and the environmental impact associated to the amount of each element of the bill is computed; in the second step, instead, all the manufacturing processes necessary for the battery assembly are considered and their environmental impact evaluated on the basis of the battery type and capacity.

5.1.2. Vehicle Production Results

This paragraph describes the procedures and calculations carried out to estimate the environmental impact due to the production of each vehicle. The masses of the three reference vehicles compared in this work are indicated in Table 2, Table 3 and Table 4. The values reported, however, refer to the complete vehicle kerb masses [29], including hence the necessary fluids for vehicle operation (e.g., lubricants, coolant, washer fluid, fuel, etc.) and the batteries. The empty mass of each vehicle (i.e., related to vehicle components only) was hence determined subtracting the masses of fluids and batteries:
m empty = m kerb ( m fluids + m battery )
The masses of the different fluids [21] are reported in Table 7 for each reference vehicle considered; in regards to the batteries, a mass of 16.3 kg was adopted for the ICEV traditional 12V lead-acid model [21], while for the reference HEV and BEV, as already reported in Table 3 and Table 4, the evaluation carried out in Appendix A led to 26.9 and 374 kg, respectively.
Applying the percentage mass distributions reported in Table 6 to each vehicle’s empty mass allowed for determining the mass of each vehicle component, i.e., body, powertrain, transmission, chassis, motor/generator, and controller/inverter. The mass of each vehicle component was then introduced as input to the GREET model, which returned the related polluting emissions and resources used. The influence of each vehicle component on each environmental impact category was hence evaluated applying the ReCiPe characterization factors of Table 1. As a final result, Table 8, Table 9 and Table 10 report the environmental impact related to the production of each component (including fluids and batteries) of the reference ICEV, HEV, and BEV respectively. As can also be observed, the last column reports the energy consumption (expressed in MJ) related to the component—this information has been added with the aim to highlight the energy impact of every single component, which, therefore, affects some of the impact categories considered.

5.2. Use Stage

The environmental impact related to the use phase of the vehicles is, as a general rule, composed of two different contributions. The first is related to the energy source employed by the vehicle, whose production is characterized by a certain environmental impact; the second contribution, instead, accounts for the exhaust emissions produced by the vehicle during on-road operation.

5.2.1. Energy Consumption

Regarding the first contribution, both reference ICEV and HEV use as the energy source the fuel introduced in the internal combustion engine (i.e., gasoline in the cases here considered), while the BEV employs electric energy previously produced by means of different primary energy sources, as for example natural gas, coal, hydro, wind, solar energy, etc. As declared in the Goal and scope section, in this comparative LCA analysis, a lifetime traveling distance of 150,000 km was assumed for each reference vehicle, entirely run in Europe; for this reason, when evaluating the impact related to the fuel consumed by both ICEVs and HEVs, the European fuel production and distribution chain was properly considered through the use of Ecoinvent V3, a widely employed life cycle inventory database [30,31], in place of the GREET model. The reason for this change is that, as already explained, the processes related to materials production comprised in the GREET model refer to the geographical context of the USA. Moreover, even if in accordance with the European Parliament regulation 2009/30/EC, European gasoline can contain up to 10% of ethanol, on average it results in 5% of ethanol present in the gasoline distributed in the European Union [32]. For this reason, the environmental impact related to gasoline production (including manufacturing and transportation) was computed assuming gasoline with 5% of ethanol from biomass, referred to as BE5: Table 11 shows the pollutant emission and the resources use associated with the production of a single kg of BE5. For each of the two reference ICEV and HEV, the total mass of fuel consumed by the vehicle during its entire life mfuel was deduced on the basis of the WLTP fuel consumption F (reported in Table 2 and Table 3), of the total driving distance Dtot (150,000 km), and of the fuel density ρfuel (0.752 kg/L for the BE5 [33]):
m f u e l = F [ L / k m ] D t o t [ k m ] ρ f u e l   [ k g / L ]
to which correspond the energy required for vehicle traction:
E t r a c = m f u e l L H V
being LHV the fuel Lower Heating Value (41.7 MJ/kg for the BE5 [33]). Indicating with x the generic impact category, the characterization factor Ix,source connected to the production of the total mass of fuel employed by the ICEV or by the HEV was obtained as:
I x , s o u r c e = ϕ x m f u e l
being ϕx the specific impact factor referred to the production of 1 kg of gasoline, reported in Table 11. As can be noted, in the last row, the energy required for the production of 1 kg of BE5 is reported: this is the source of production energy and is responsible for the related GWP. In addition, the electric energy used by the BEV was supposed to be entirely produced in Europe, and hence, when computing the environmental impact related to the use of the reference electric vehicle, the mean European electricity mix reported in the third column of Table 5 was assumed.
The total traction energy required by the BEV during its entire life Etrac,BEV was deduced on the basis of WLTP energy consumption F, reported in the last row of Table 4, and of the total driving distance Dtot:
E t r a c , B E V [ k W h ] = F [ k W h / k m ] D t o t [ k m ]
Adopting the same symbol x to denote the generic impact category, hence, the characterization factor Ix,source connected to the production of the total amount of electric energy Etrac,BEV consumed by the BEV was obtained as:
I x , s o u r c e = φ x E t r a c , B E V
where the specific impact factor φx referred to each impact category x and associated to the production of 1 kWh of electric energy is reported in Table 12 and was evaluated by means of the GREET model employing the mean EU-28 electricity mix (already presented in Table 5).
As shown, the last row of Table 12 reports the source production energy, i.e., the energy input required for the production of 1 kWh of electric energy. The resulting environmental impact and resource deployment associated with the energy consumed in the use phase of each reference vehicle, during its entire life, is reported in Table 13.

5.2.2. On-Road Emissions

Being the BEV free from on-road emissions, its road environmental impact was coherently considered null. As instead concerns the other two reference vehicles (ICEV and HEV), the authors evaluated the impact related to the emissions of CO2 produced during the use phase, as well as the impact associated with the other relevant emissions produced (e.g., CO, PM, NOx, etc.). For the evaluation of the carbon dioxide emissions due to the fuel combustion, coherently with the BE5 gasoline assumed (i.e., 95% petrol and 5% bio-ethanol), the authors considered only the carbon participation of petrol, being null the carbon cycle of the bio-ethanol—it resulted in a carbon mass fraction of 82% (instead of the 86.5% usually adopted for petrol) [33], according to which the amount of CO2 emitted by the combustion of each liter of BE5 is:
f C O 2 = ρ F U E L 0.82 1000 44 12 = 2261 [ g C O 2 L F U E L ]
being 12 and 44 the molecular masses of carbon and carbon dioxide, respectively. As a result, the CO2 emission factor (g/km) related to both reference ICEV and HEV was evaluated on the basis of the WLTP fuel consumptions F (already shown in Table 2 and Table 3):
e C O 2 [ g / k m ] = f C O 2 [ g / L ] F [ L / k m ]
and is reported in the 4th row of Table 14. As instead regards the impact related to other relevant exhaust emissions produced by both the ICEV and the HEV, the authors referred to the emission inventory data of the European Environment Agency [34] which contains average values of the emission factor (i.e., grams of pollutant per kilometer of distance traveled) related to different kinds of vehicles (passenger cars, light commercial trucks, heavy-duty vehicles including buses, mopeds, and motorcycles), belonging to different categories (mini, small medium, large, executive, etc.), using different fuels (diesel, petrol, LPG, and CNG), and recorded on several different standard tests (starting from pre-ECE, up to Euro 6 d-temp); for the reference ICEV, the authors considered the emission factor reported for a small petrol passenger car, Euro 6 d-temp, while the reference HEV was considered as a small petrol Hybrid passenger car, Euro 6, thus obtaining the values shown in Table 14.
On the basis of the emission factors and of the total driving distance, the authors could establish the total mass of each pollutant emitted during the life cycle of both the reference ICEV and HEV, which, according to the ReCiPe 2016 methodology described in [14,15], allowed evaluation of the characterization factor for each impact category considered, as reported in Table 15. Summing the contribution of the energy source production to the contribution derived from the exhaust emissions, the total environmental impact and resource deployment related to the use phase of each reference vehicle is reported in Table 16 for the entire vehicle’s life.

5.3. End-of-Life

The disposal and recycling phases of all the components of the ICEV are already taken into consideration in the “vehicle assembly phase” of the GREET model. Moreover, the disposal and recycling of most of the components of both HEV and BEV are included in the GREET “vehicle assembly phase”, remaining out of this evaluation only the batteries, due to the existence of different processes for the disposal of the several different kinds of batteries available. On account of this, the disposal phase of the batteries of both HEV and BEV was expressly carried out by the authors.

Electric Vehicle Battery Disposal

The battery disposal and recycling process was modeled through the environmental impact indicators provided for lithium-ion batteries in the scientific literature [7]. To account for the different battery capacities (i.e., different amounts of materials and hence different environmental impact), a mass-based proportionality was assumed thus adapting the literature available data to the batteries considered in this study. Each battery cell was assumed to be recycled through a pyrometallurgical process, which is commonly used in Europe for vehicle battery recycling [24]. The pyrometallurgical process, however, does not allow the recovery of materials such as graphite, plastic materials, aluminum, lithium, and manganese; in particular, the last three elements are retained in the slag produced during the process [25]. The metal alloy and slag obtained from the pyrometallurgical process, which represent about 55% of the initial battery mass, are hence further refined through the hydrometallurgical process, to recover the metal sulphates, which can be used again to produce the cathode of lithium-ion batteries [35]. The resulting impact indicators related to the disposal of the batteries of both reference HEV and BEV are shown in Table 17.
Finally, summing the three contributions (production phase, use phase, and disposal phase), the life cycle environmental impact, and resource deployment for each reference vehicle considered was obtained—these results will be discussed in the following section.

6. Results of the LCA Analysis and Discussion

This section deals with the results obtained from the life cycle environmental impact assessment carried out for each of the three vehicles considered.

6.1. Global Warming Effect

Being the most significant indicator related to climate changes and to its causes, GWP is one of the most diffused environmental impact indicators among the various life cycle impact assessments. shows the GWP generated by the three reference vehicles during each phase of their life.
As can be observed, the total amount of equivalent CO2 emitted during a vehicle’s life is reported on the top of each bar, while the percentage with respect to the ICEV case is also reported on the top of HEV and BEV bars. The values reported inside the bar refer instead to the single phase (production or use phases, negligible values are not reported). The results of the GWP analysis show that, at the end of its life, traditional vehicles with gasoline-fueled internal combustion engines are responsible for an average specific CO2 equivalent emission of 187 g/km, which is about 40% higher than the “on-road” CO2 emission related to the fuel consumption (i.e., 133.5 g/km in Table 15), due to vehicle production impact. The HEV is characterized by a lower impact (−14.1%) with respect to the ICEV, with an overall average specific CO2eq emission of 160 g/km, which is +52% higher than the on-road emission of 105.7 g/km (Table 15) mainly due to the impact of the production phase. Finally, the BEV revealed a CO2 equivalent emission of 109.6 g/km, which represents about 58.6% of the traditional ICEV, and confirms the relevant role played by the vehicle production phase, as well as by the energy source production processes, in determining the real overall environmental impact of a passenger car [3,4,5]. The graph in Figure 1 also shows that the production of the traditional vehicle is the less impacting among the three production phases, thanks to processes and manufacturing technologies optimized and refined over a long time; BEV and HEV, instead, share the burden of the lithium-ion battery production, which, in the case of the electric vehicle, implies 4215 kg of CO2eq (indicated as BP in Figure 1) causing +112% higher CO2 emissions with respect to the ICEV production phase. The diagram in Figure 1 also shows that the use phase represents the major source of greenhouse gas emissions for both the reference ICEV (85.5% of total CO2eq) and the reference HEV (78.8% of total CO2eq), while for the BEV the production phase involves the major part of the total CO2 emissions (52.3% of total CO2eq), coming from the battery production process the most relevant contribution.
The comparison carried out until now is referred to a lifetime distance traveled of 150,000 km and confirms the BEV to be the less impactful solution among the three alternatives considered with a −41.4% cut with respect to the ICEV and −31.8% with respect to HEV. However, to understand the effect of the vehicle lifetime mileage (or usage time) on overall greenhouse gas emissions, the authors evaluated the GWP impact factor as a function of the distance traveled, as shown in Figure 2. Besides confirming the higher starting impact (i.e., for a null distance traveled) of both HEV and BEV, the diagram in Figure 2 also shows that the reference ICEV reveals to be the less greenhouse gas emitting vehicle up to a mileage of 32,500 km (i.e., roughly the first 2.6 years of vehicle usage, if the already mentioned average European lifetime distance traveled of 12,529 km is considered), and remains cleaner than the BEV up to 41,250 km (i.e., up to 3.3 years of vehicle usage), while the advantage of the HEV on the BEV extends to 46,250 km (i.e., a vehicle usage period of 3.7 years).

6.2. Terrestrial Acidification

Anthropogenic terrestrial acidification is primarily caused by atmospheric deposition of acidity, mainly through acid rain originated by the emissions into the atmosphere of substances such as nitrogen oxides (NOX), ammonia (NH3), and sulphur dioxide (SO2). The evaluation carried out in terms of Terrestrial Acidification Potentials (TAP) for the whole life cycle of the three reference vehicles is shown in Figure 3. The first notable result is that the production phase of the BEV causes a very high level of terrestrial acidification giving an overall final result of 661 mg/km which exceeds +78% of the impact related to the reference ICEV (372 mg/km). This is principally referring to the production of the Lithium-ion battery (60.3 kg of SO2eq, as indicated in Figure 3, i.e., 73% of the total impact generated in the production phase), which causes huge emissions of sulphur and nitrogen oxides (SOX and NOX) for the extraction and refining of nickel, copper, and aluminum, for cell production and synthetic graphite processes [26]. Moreover, a further contribution to the high acidification impact related to the battery production processes is provided by the Chinese electricity mix, which is dominated by coal-fired plants (66% of total electric energy produced, as resumed in Table 5), and hence characterized by high levels of SOX emissions. For the same reason, the overall impact of the HEV (386 mg/km) also results in slightly higher than ICEV (+4%), due to the production of the small Lithium-ion battery. In regards to the ICEV, most of the terrestrial acidification is caused by the exhaust emissions produced during the use phase (68.3% of total), while for the HEV and for the BEV the main impact is related to the production phase, which accounts for the 50.8% and for the 83.3% of the total, respectively.

6.3. Particulate Matter Formation

The results obtained for this environmental impact category are shown in the diagram of Figure 4. Apart from the unit of measurement, a close resemblance between Figure 3 and Figure 4 can also be noted, i.e., almost identical relations exist between the bars of each diagram. This is easily explained since the main substances involved in the formation of secondary PM2.5 (i.e., SO2, NH3, and NOX) are also responsible for the terrestrial acidification—the battery production process, hence, also has a high impact in terms of particulate matter formation, due to both the extraction and refining of the materials used for NMC powders and to the phenomenon caused by the outdoor storage of copper-cobalt minerals in Congo [36]. Considering as reference the impact generated by the reference ICEV, the impact of BEV was substantially stronger (+75%), while HEV remains were slightly higher (+6%). Moreover, the distribution within the results of the different phases was similar to the terrestrial acidification, being 67.4% of the portion of the particulate impact caused by the use phase of the ICEV, while the production phase of both HEV and BEV still represents the most impacting phase with 51.0% and 82.7% of the total emissions produced, respectively.

6.4. Mineral Resource Deployment

Due to the extensive use of rare materials such as lithium, nickel, cobalt, and copper [14,24] required for the production of lithium-ion batteries, the mineral resource deployment (reported in Figure 5) related to the BEV results abundantly higher than the impact caused by the ICEV (about four times), while HEV revealed “only” a + 54% increment. As expected, apart from the reference vehicle considered, almost the entire impact is generated during the production phase. The contribution due to electric vehicle battery production is indicated as BP in the graph of Figure 5 and amounts to 72% of the total surplus ore potential related to the battery electric vehicle.

6.5. Fossil Resource Deployment

Regarding the deployment of fossil fuel sources, the results obtained in this evaluation are reported in Figure 6. Several observations can be made and are worthy of note: firstly, as expected, the highest overall fossil source consumption is generated by the ICEV (i.e., 57.8 g/km), followed by the HEV (48.4 g/km, i.e., 84.1% with respect to the ICEV) and by the BEV, which, even if “fully electric” vehicle, implies a fossil fuel consumption of 26.6 g/km (i.e., 46% with respect to the ICEV); moreover, both ICEV and HEV cause most of their fossil fuel consumption during the use phase of the vehicle (87.8% and 82.7% of the total respectively), being their main energy source for traction a fossil-derived fuel, while, when the BEV is concerned, the most of fossil resource consumption takes place in the production phase (52.6%), mainly due to the high consumption of electricity energy required for battery production, and to the fossil source domination in the Chinese electricity mix. It can also be observed that the fossil resource consumption generated in the use phase by the BEV (1801 kg Oil eq.) constitutes 23.6% of the consumption caused by the ICEV in the same phase (7610 kg Oil eq). This result, however, depends on the particular electricity mix considered for the supply of the BEV, and, as shown further on, may substantially change from one country to another.

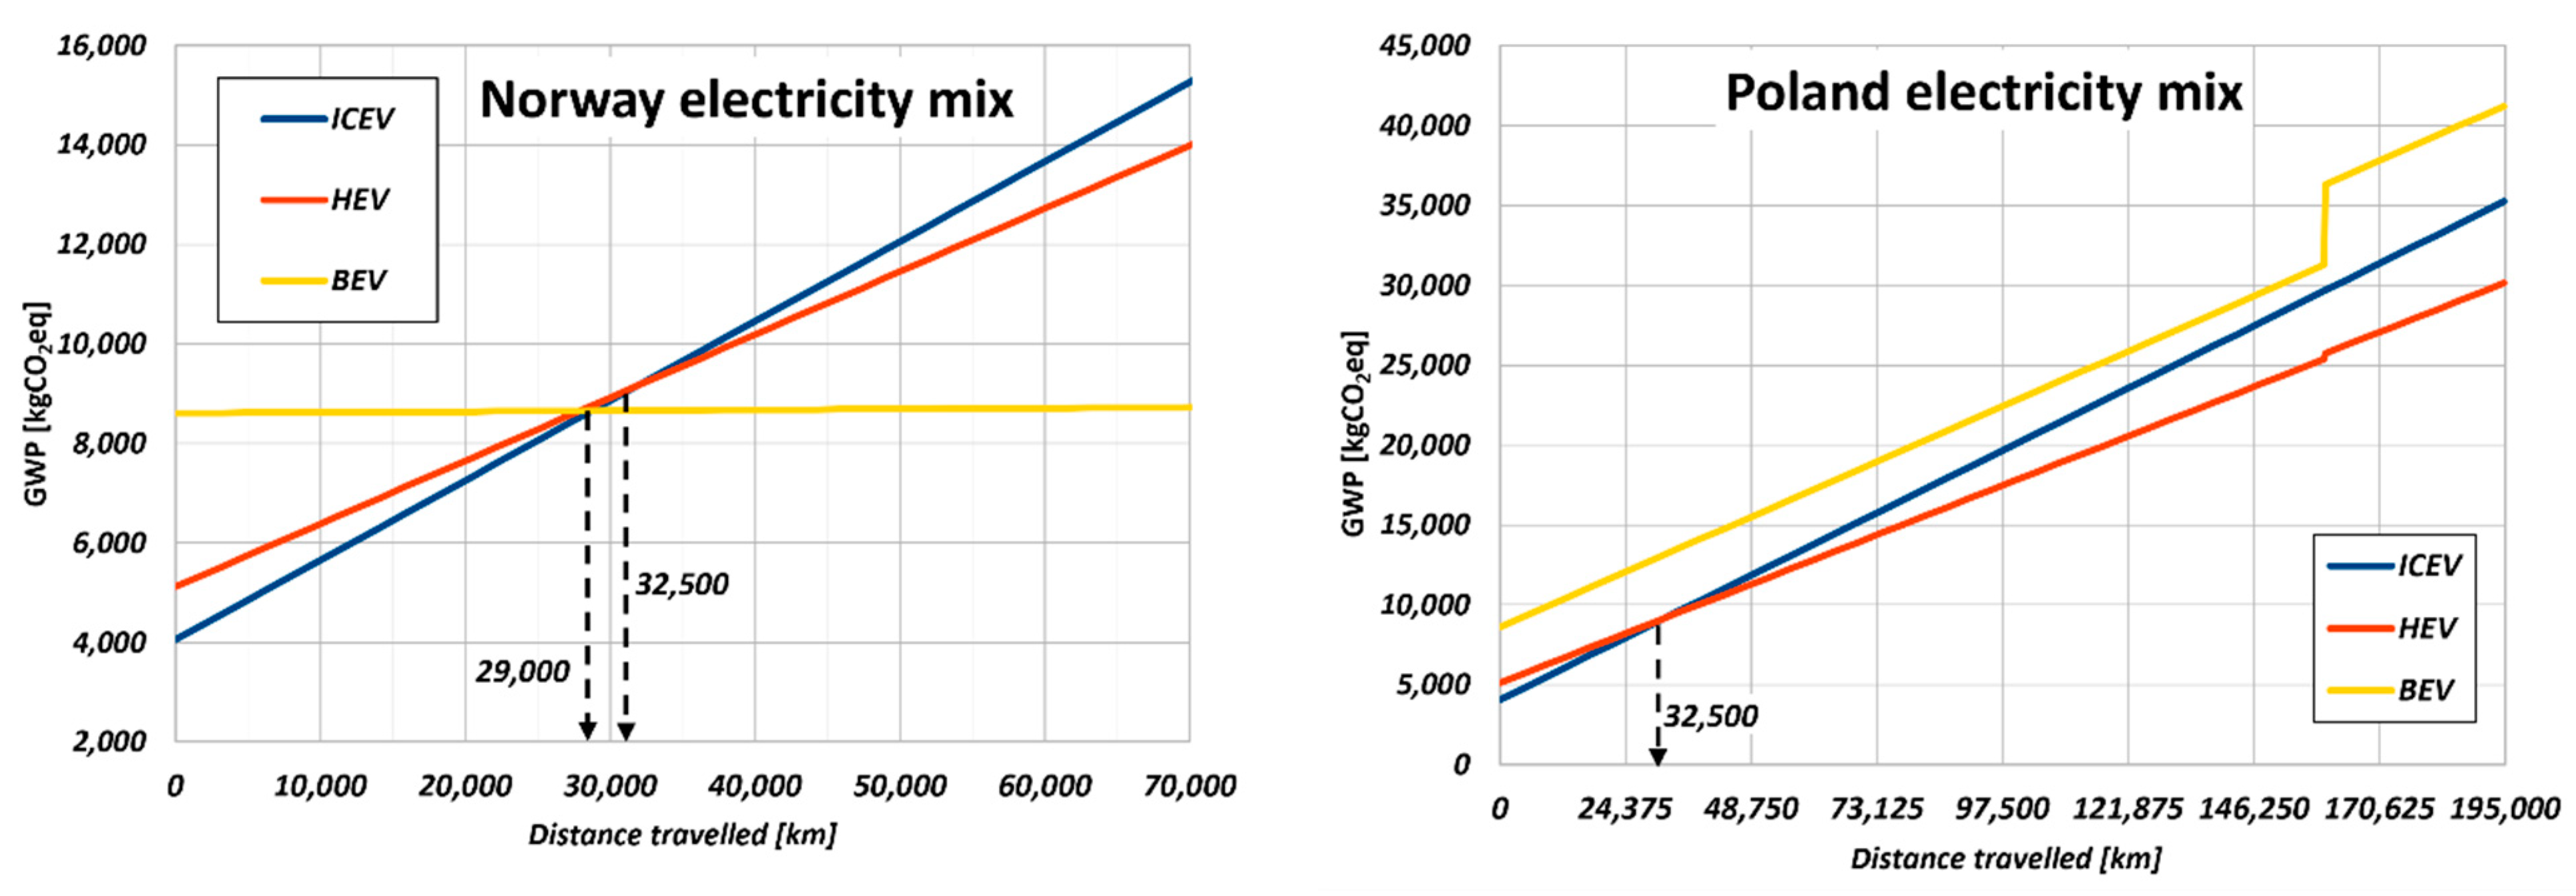
7. Scenario Analysis

The results of the analysis carried out to this point are obviously related to the reference scenario adopted which is characterized by several assumptions. Some of these assumptions may have a general validity (i.e., vehicles produced in Germany may be distributed and used all over Europe, the impact related to petrol production is almost the same in Europe and the USA, most of the lithium-ion batteries used worldwide come from China) while other may easily change and produce considerable variations in the results obtained, such as the lifetime mileage and the country where the vehicles are supposed to be employed. The total distance traveled during a vehicle’s lifetime obviously influences the amount of both energy resource consumed and pollutant emitted, while the country where the vehicle is used has a strict correlation with the electricity mix (i.e., the composition of primary energy resources employed to generate electric energy) and hence with the impact related to the electric energy consumed. With the aim to highlight the importance of these two variables (the most susceptible of variations) on the lifecycle environmental impact of the three reference vehicles considered, a scenario analysis was performed. In regards to the lifetime mileage of each vehicle, two different cases were added to the evaluation, considering a ±30% deviation from the average European lifetime distance traveled, i.e., 105,000 and 195,000 km. Concerning the second variable, two particular countries were considered for the vehicles traveling, characterized by substantially different electricity mixes: Norway, where 97.5% of electric energy is produced by means of renewable sources (mainly hydroelectric, as shown in Table 5), and hence with a near-zero carbon footprint, and, on the other hand, Poland, where 84% of electric energy is produced by fossil sources (above all coal, as shown Table 5). The introduction of these two countries has the meaning to observe how different electricity mixes may influence the environmental impact related to the use of the battery electric vehicles, compared to the gasoline-fueled ICEV and HEV. It is worth repeating that, regarding petrol production, no substantial differences could be traced on the technologies and processes adopted among the different European countries, as, therefore, confirmed by both the database consulted (i.e., GREET and Ecoinvent v.3). For this reason, the impact and resources deployment related to gasoline production in Norway and in Poland was considered equal to the average European assumed in the previous section. In addition, the other production steps were considered unchanged, i.e., the vehicles were assumed to be produced in Germany and the lithium-ion batteries employed in the HEV and in the BEV were supposed to be produced in China. Moreover, since lithium-ion batteries have a limited duration, their replacement was also taken into consideration. Due to a lack of literature references dealing with the longevity of electric vehicle batteries in real conditions of use, all life cycle analyses usually consider the duration of a battery equal to the manufacturer’s warranty [7]. Since the batteries of most of the electric vehicles considered for the characterization of the reference BEV (as reported in Table 4) are guaranteed for 160,000 km, therefore, when exceeding this traveling distance (i.e., only in the scenarios with a lifetime distance traveled of 195,000 km), a battery replacement was introduced in the calculation. Moreover, with the purpose to suppress any difference related to the three lifetime mileages considered and make the results of all scenarios comparable, for each impact category, the authors evaluated the specific factor dividing each characterization factor by the lifetime distance traveled, obtaining hence the impact per km of traveled distance.

8. Results of the Scenario Analysis and Discussion

The results obtained from this scenario analysis, in regards to the specific global warming potential (expressed as gCO2eq/km), are summarized in the graph of Figure 7. Specific global warming potential (gCO2eq/km) related to the three reference vehicles in the scenario analysis. As can be observed, three series of histograms are reported, one for each lifetime mileage considered; each series of histograms, in turn, represents the lifecycle impact evaluated for the ICEV, the HEV, the BEV employed in Norway (BEV-NOR), the BEV employed in Poland (BEV-POL), and the BEV employed using the average European electricity mix (BEV-EU28). As already shown in the previous graphs of this paper, the impacts related to the production and to the use phases are reported inside the colored bar (negligible values are not reported), while the percentage ratio with respect to the ICEV case is reported on the top of both HEV and BEV bars. Starting from the reference ICEV, Figure 7 shows that, the increase in the lifetime distance traveled causes a light specific impact reduction due to the reduction in the specific impact related to the production phase of the vehicle; quite a similar situation occurs for the HEV, which is characterized by a slightly higher impact in the production phase (on account of the lithium-ion battery production) and lower greenhouse gas emissions in the use phase, thanks to the higher vehicle efficiency. It can also be observed that, independent from the lifetime mileage, its global warming impact remains between 85.5% and 88.5% of the impact caused by the ICEV. The specific global warming caused by the BEV, as expected, is instead strongly dependent on the electricity mix adopted by the country where the vehicle is employed, and on the lifetime mileage; more specifically, the specific emissions of CO2eq of the BEV range between 33% and 44% with respect to the ICEV when the vehicle is operated in Norway. In this case, the environmental impact is almost entirely due to the production phase of the vehicle, being negligible the carbon footprint of the Norwegian electricity mix. It is also worth pointing out that in the third scenario (i.e., 195,000 km) the battery replacement required at 160,000 km causes a sharp increment of the specific impact related to the production phase. The advantage of the BEV on the ICEV, in terms of greenhouse gas emissions, however, reduces if the average European electricity mix is considered (with percentage ratio from 58.6% to 68.1%) and reveals null if the electric vehicle is operated in Poland. In this case, the high carbon footprint of the electricity mix causes the greenhouse gas emissions of the BEV to become even higher than the emissions of the ICEV, with a percentage ratio between 108% to 117%, depending on the lifecycle mileage of the vehicle.
Concerning the second impact category, i.e., the specific terrestrial acidification (expressed as mgSO2eq/km), the results obtained from the scenario analysis, reported in Figure 8, confirm the dominant role of the lithium-ion battery production, which causes the HEV and the BEV to have higher environmental impacts than ICEV, apart from the vehicle mileage and the country of utilization; more specifically, the HEV slightly exceeds the ICEV, with percentage ratios between 104% and 112%, while the BEV, whose battery pack has a substantially higher capacity, reveals a percentage ratio in the range of 150−216% in the case of the Norwegian electricity mix, moving up to a range of 246−319% in the case of the Polish electricity mix.
It is worth pointing out that, due to the battery replacement at 160,000 km, the BEV gives the worst results in the longer mileage scenario.
As already observed in the previous section, the scenario analysis confirms that the specific environmental impact due to primary and secondary particulate matter has a trend quite similar to the terrestrial acidification (as shown in Figure 9), being involved the same chemical species. The BEV is confirmed to be the most impacting vehicle, principally due to the battery production processes and resources, with percentage ratios between 147% and 210% (with respect to ICEV) if used in Norway, and between 240% and 311% if the vehicle is instead operated in Poland. The HEV confirms a slightly higher impact with respect to the ICEV, with a percentage ratio between 106% and 114%.
Moving on to the impact on resources, the results obtained by the scenario analysis with regard to the mineral resource deployment are reported in Figure 10 in terms of mg Cu-eq/km. As already highlighted in the previous section, the production of lithium-ion batteries involves a wide use of uncommon metals such as copper, nickel, and cobalt, which, therefore, explains the very high impact of BEV with respect to both ICEV and HEV, apart from the scenario adopted. The percentage ratio ranges from 408% to 422% in the best cases (i.e., for a lifetime distance traveled of 150,000 km) and moves to values higher than 600% for the longer traveled distance due to the battery replacement. The lower capacity of the hybrid electric vehicle battery involves a lower deployment of mineral resources, which results in a lower impact, with a percentage ratio in the range 154−171%.
Finally, the results regarding the deployment of fossil fuel resources are reported in Figure 11 in terms of consumption of oil per km of distance traveled (gOil-eq/km). As evidenced, the highest impacts are caused by the ICEV, followed by the HEV, whose percentage ratio remains around 85%, apart from the scenario considered. The recourse to fossil sources of the BEV instead has a strict correlation to the country that utilizes the vehicle, as shown in the graph; with respect to the ICEV, the impact of the BEV remains around 31% in the fossil-free Norway, rising to an average percentage ratio of 51% when the EU-28 electricity mix is considered, and arriving at an average percentage ratio of 71% if the vehicle is employed in Poland. This scenario analysis, hence, reveals quantitatively (also with the help of percentage ratio referred to the traditional internal combustion engine vehicle) the non-explicit recourse to fossil sources of BEV, and how its real impact strictly depends on the fossil source exploitation in the country that utilizes the vehicle. Finally, the specific impact factors obtained by the scenario analysis are reported, for each scenario considered and for each phase evaluated, in Table 18.
According to the results obtained by this scenario analysis, a consideration can be made: if, at the end of its life, an electric vehicle has caused a global warming impact comparable to a traditional petrol or hybrid vehicle (as in the average European and in the Polish case), from an environmental point of view, this could be considered a failure, given that, with respect to a traditional petrol vehicle, an electric vehicle gives rise to roughly two times the acidifying and particulate emissions, and requires the extraction of five times the amount of minerals. This means that, given the current manufacturing and production processes and technologies, promoting the use of lithium-ion-based electric vehicles in geographical areas where the energy mix used to produce electricity still relies on fossil fuels may be counterproductive. In this case, in effect, the substitution of a large part of the existing traditional vehicles with current technology electric vehicles would lead to a change in the worrying environmental impact category, moving from the global warming problem to the other relevant environmental issues such as acidifying and particulate emissions. Since an overall reduction in all the impact categories is instead desirable, it is necessary to promote research towards the development of more efficient and less polluting battery production processes, reducing significantly the recourse to rare minerals and to fossil energy sources.
The scenario analysis revealed great variations in the impacting behavior of the reference BEV, with considerable deviation also from the results obtained in the first analysis based on the EU-28 average electricity mix. On account of this observation, the authors repeated the breakeven analysis already performed in the previous section (see Figure 2), with the aim to evaluate the traveled distance which makes one vehicle more attractive than another from the perspective of global warming potential. The new breakeven analysis was carried out considering both the Norwegian and the Polish electricity mixes, and the results are shown in the two graphs of Figure 12. As can be seen, if the vehicles are operated in Norway, the BEV exhibits an almost constant GWP with varying the lifetime traveled distance, while both ICEV and HEV are characterized by a lower initial impact (production phase), which hence linearly increases with the traveled distance. The result is that both ICEV and HEV reveal a lower global warming impact up to approximately 29,000 km (which means roughly 2.3 years of vehicle usage), and the ICEV remains less impacting than HEV up to 32,500 km (i.e., 2.6 years of vehicle usage). This means that, even in the best possible electricity mix scenario (the Norwegian case is in effect rare to the point of being unique), the global warming caused during BEV production makes both ICEV and HEV more respective of the environment for at least two years of usage.
The results strongly change if the vehicles are supposed to travel in Poland; in this case, as shown on the right graph of Figure 12, the high carbon footprint of the Polish electricity mix causes the BEV to have such a GWP gradient that even the ICEV remains less polluting up to distance in the order of 180,000 km. Moreover, as can also be noted in Figure 12, the intersection between the global warming curves of the ICEV and the BEV is prevented by the sharp increase caused by the battery replacement on the BEV curve. As a result, in this scenario, the lifecycle global warming impacts of both ICEV and HEV result are always lower than the lifecycle impact caused by the BEV.

9. Conclusions

In this paper, the authors performed a comparative evaluation of the life cycle impact of three different vehicles of different technologies, namely an internal combustion engine vehicle (ICEV), a hybrid electric vehicle (HEV), and a battery electric vehicle (BEV). The study was carried out considering three fictitious vehicles representative of existing products, whose performance and characteristics were determined on the basis of real vehicles available on the 2019 market for the B-C segments. The life cycle impact was evaluated by the use of the GREET model following the ReCiPe 2016 methodology and taking into consideration five different impact categories represented by their characterization factors: Global Warming Potential (GWP), Terrestrial Acidification Potential (TAP), Particulate matter formation potential (PMFP), Surplus ore potential (SOP), and Fossil fuel potential (FFP). The impact evaluation was properly performed taking into account all the phases of the vehicle life, from its production to its use, and to the final disposal. To this purpose, some assumptions were made, justified, and corroborated by proper references, which defined the reference scenario adopted for the comparison—the vehicles were supposed to be produced in Germany and used all-over Europe, while the lithium-ion batteries of both the BEV and the HEV were assumed to be produced in China. The assessment of the environmental impact associated with the production of the fuel for the ICEV and for the HEV was carried out by means of the Ecoinvent v3 database. The procedure adopted by the authors is hence a general and “blind” procedure, which, starting from objective data and through some assumptions (clearly stated in the “Goal and scope definition” section), allows evaluating the lifetime environmental impact of a selected kind of vehicle in a properly defined scenario; the same procedure could be hence repeated considering different vehicles, or different energy scenarios, or making different assumptions, for the evaluation of the lifetime environmental impact caused by vehicles according to LCA methodology. With the aim to extend the limit of the first analysis, the authors also performed a scenario analysis by changing the lifetime traveled distance and the country of utilization of the vehicles.
Several conclusions and observations can be drawn on the basis of the results of this study. First of all, the results obtained clearly pointed out the fundamental role played by the production and the disposal phases of vehicles on the evaluation of the real lifetime impact generated by their use. The production phase of the electric vehicle, and specifically the production of its lithium-ion battery, revealed a very critical phase, with a strong impact in terms of terrestrial acidification, particulate matter formation, and mineral resource deployment. As a result, the environmental impact generated in these categories by the BEV resulted abundantly higher than in the ICEV (from +50% to +500%). The main reasons for this high environmental impact can be found in the high energy required for lithium-ion battery production, in the relevant emissions of primary and secondary particulate which characterize the lithium-ion battery production process, in the large recourse to metals such as cobalt, copper, and nickel, and in the coal-dominated electricity mix of the largest lithium-ion battery producer of the world, i.e., China. In contrast, in regard to the global warming effect and the fossil sources deployment, the BEV is confirmed to be the least impacting vehicle, if the electricity used for vehicle propulsion has been generated by an adequate recourse to renewable sources. For example, in the case of the average European electricity mix (34% from renewable sources, 25% from Nuclear), the GWP impact caused by the BEV in its entire life revealed (for a lifetime distance traveled of 150,000 km) 58.6% of the impact produced by the ICEV; assuming instead to employ the vehicles in Norway (where 97% of electric energy is obtained from renewable sources), the GWP impact generated by the BEV reduced to 33% with respect to the ICEV, while when considering the vehicles used in Poland (where 73% of electric energy is obtained from coal-fired power plants), the BEV reveals to be the most impacting vehicle, regardless of the lifetime distance traveled. The results obtained by the analysis carried out highlight how carefully the real overall impact generated by a vehicle during its entire life must be evaluated, and how this impact may be affected by the fossil source exploitation of the country that utilizes the vehicle.
A further observation must be made on the basis of the very different entities of the impact generated by the BEV in the five impact categories considered—the introduction of electric vehicles on the market should be carefully monitored with life cycle analysis tools, avoiding focus on a single environmental impact category that is currently particularly problematic and known (the global warming) at the risk of causing huge impact increments on less considered but equally harmful categories.
The results of the environmental impact comparison also confirmed the hybrid vehicle as an excellent alternative to ICEV, being capable to achieve a good compromise between all the categories of environmental impact—on all the scenarios considered in this study, the HEV revealed GWP and FFP impacts in the order of 85% with respect to an equivalent ICEV, while maintaining acidifying and particulate emissions well below the high levels of the BEV.
In the study presented in this paper, the effect of the variation of the lifetime distance travelled by the three vehicles on their global warming impact was analyzed. The results show that, apart from the country that utilizes the vehicles, the BEV is always the more impacting vehicle in the lower mileage range, due to the high global warming emissions generated during the production phase of the lithium-ion battery; in the same distance range, the HEV, endowed of a smaller battery, shows slightly higher impact than the ICEV. Being the rate of increase in the GWP impact related to both ICEV and HEV was exclusively dependent on their fuel consumption, it was found that the HEV becomes less impacting than the ICEV after 32,500 km, which, according to the average European annual distance traveled by a passenger car, means after about 3 years of utilization of the vehicles. In the case of the BEV, instead, the rate of increase in the GWP impact with the traveled distance depends also on the particular electricity mix of the country where the vehicle is employed; on account of this, it was found that, according to the average European electricity mix, the BEV reveals less impacting than the ICEV after 41,250 km and less impacting than the HEV after 46,250 km (i.e., roughly after 3.5–4 years of utilization of the vehicles); obviously, the low carbon footprint of the Norwegian electricity mix reduces these distances, which become both equal to 29,000 km. On the contrary, in a country with a high carbon footprint such as Poland, the GWP impact of both ICEV and HEV remains always lower than BEV whichever is the lifetime traveled distance (also due to the lithium-ion battery replacement after 160,000 km, which, in turn, causes a sharp and considerable increment of the environmental impact caused by the BEV).

Author Contributions

E.P. contributed to the conceptualization and supervision of the work, to editing and writing of the paper; S.C. and L.O. contributed to the acquisition and analysis of data, to the interpretation of results, and drafted the paper. All authors have read and agreed to the published version of the manuscript.

Funding

The research was funded by Università degli Studi di Palermo.

Institutional Review Board Statement

Not applicable.

Informed Consent Statement

Not applicable.

Data Availability Statement

All data generated or analyzed during this study are included in this published article or are publicly available.

Conflicts of Interest

The authors declare no conflict of interest.

Abbreviations and Symbols

BBEVElectric vehicle battery capacity
BE5Gasoline with 5% ethanol from biomass
BEVBattery electric vehicle
BHEVHybrid electric vehicle battery capacity
BOMBill of material
CHEVHybrid electric vehicle fuel tank capacity
CICEVInternal combustion engine vehicle fuel tank capacity
CNGCompressed natural gas
DtotElectric vehicle total driving distance on the WLTP cycle
eCO2CO2 emitted per kilometer on the WLTP cycle [g/km]
EoLEnd-of-life
EtracTotal traction energy required by ICEV or HEV during its entire life
Etrac,BEVTotal traction energy required by the BEV during its entire life
F[kWh/km]Electric vehicle energy consumption per kilometer on the WLTP cycle
F[l/km]Fuel consumption per kilometer on the WLTP cycle
fCO2CO2 emitted by the combustion of a liter of BE5 [g/km]
FFPFossil fuel potential [kg Oil-eq]
GHGGreenhouse gases
GWPGlobal warming potential [kg CO2-eq]
HEVHybrid electric vehicle
ICEVInternal combustion engine vehicle
Ix,sourceCharacterization factor connected to the production of the total mass of fuel employed by the ICEV or by the HEV
LCALife cycle assessment
LCILife cycle inventory
LCIALife cycle impact assessment
LCOLithium Cobalt Oxide (LiCoO2)
LFPLithium Iron Phosphate (LiFePO4)
LHVFuel Lower Heating Value
LMOLithium Manganese Oxide (LiMn2O4)
LPGLiquefied petroleum gas
mbatteryMass of vehicle battery
mBEVKerb mass of the battery electric vehicle
memptyEmpty mass of each vehicle (i.e., related to vehicle components only)
mfluidsMass of vehicle fluids
mfuelTotal mass of fuel consumed by the vehicle during its entire life
mHEVKerb mass of the hybrid electric vehicle
mICEVKerb mass of the internal combustion engine vehicle
mkerbKerb mass of the generic vehicle
NCALithium Nickel Cobalt Aluminum Oxide (LiNiCoAlO2)
NMCLithium Nickel Manganese Cobalt Oxide (LiNiMnCoO2)
PMaximum power of the generic vehicle
PBEVBattery electric vehicle maximum power
PHEVHybrid electric vehicle maximum power
PICEVInternal combustion engine vehicle maximum power
PMFPParticulate Matter Formation Potentials [kg PM2.5-eq]
RBEVWLTP driving range of the battery electric vehicle
SOPSurplus ore potential [kg Cu-eq]
TAPTerrestrial acidification potential [kg SO2-eq]
UNECENew European Driving Cycle
VHEVHybrid electric vehicle engine displacement
VICEVInternal combustion engine vehicle engine displacement
WMass of the Li-ion polymer battery
WLTPWorldwide harmonized light vehicles test procedure
ϕxSpecific impact factor referred to each impact category x and associated to the production of 1 kg of gasoline
φxSpecific impact factor referred to each impact category x and associated to the production of 1 kWh of electric energy
βB, kRatio between battery capacity and WLTP driving range
βF, kRatio between WLTP consumption and vehicle mass
βP, kRatio between vehicle maximum power and vehicle mass
βWCapacity-to-mass ratio of the BEV battery
θC,iRatio between fuel tank capacity and vehicle mass
θF,iRatio between vehicle consumption and vehicle mass
θP,iRatio between engine maximum power and vehicle mass
θV,iRatio between engine maximum power and engine displacement
ρfuelFuel density
ψB, jRatio between battery capacity and fuel tank capacity
ψC, jRatio between fuel tank capacity and vehicle mass
ψF, jRatio between vehicle consumption and vehicle mass
ψP, jRatio between maximum vehicle power and vehicle mass
ψV, jRatio between engine displacement and vehicle mass
ψW, jRatio between battery capacity and mass battery

Appendix A

Reference Vehicles Specifications and Characteristics

The main characteristics of the three reference vehicles considered in the environmental impact comparison were determined on the basis of coefficients derived from vehicle fundamental parameters. Starting with the ICEV, the authors evaluated, for each real vehicle considered, the following coefficients:
(1)
θ C , i = C i m i   [ L k g ] = ratio between fuel tank capacity and vehicle mass
(2)
θ P , i = P i m i   [ k W k g ] . = the ratio between engine maximum power and vehicle mass
(3)
θ V , i = P i V i   [ k W L ] = the ratio between engine maximum power and engine displacement
(4)
θ F , i = F i m i   [ k m / L k g ] = the ratio between vehicle consumption and vehicle mass
where the subscript i refers to the generic real internal combustion engine vehicle (i ranges from 1 to 5), m represents the vehicle mass, C the fuel tank capacity of the vehicle, P the engine maximum output power, and F the vehicle fuel consumption on the WLTP cycle (i.e., km/L). The sense of the selected coefficients can be explained by simple considerations: for the first coefficient, the authors considered that the higher is the vehicle mass, the larger will be the necessary fuel tank to allow the vehicle a certain operating range; for the second coefficient, it is easy to consider that the higher is the vehicle mass, the higher will be the necessary power output to produce a certain vehicle acceleration or speed; the third coefficient was deduced considering that engine of similar technological development will exhibit similar specific power; the fourth coefficient is based on the simple consideration that higher vehicle mass will cause higher fuel consumption for the same driving cycle; the last coefficient is based on the proportionality between the amount of CO2 emitted and the amount of fuel burned. It is worth mentioning that, to ascertain the significance of the selected coefficients, their dispersion was evaluated in terms of the range of variation: a range of ±11% was found in the worst case, which means that the selected coefficients have a limited variation from one vehicle to another. Focusing hence on the standard representative ICEV, its mass mICEV was simply determined as the average value of the masses of the five vehicles considered, while the other characteristics were determined employing the above coefficients:
  • Vehicle mass = m I C E V = 1 5 i = 1 5 m i
  • Fuel tank capacity = C I C E V = m I C E V 1 5 i = 1 5 θ C , i
  • Maximum output power = P I C E V = m I C E V 1 5 i = 1 5 θ P , i
  • Consumption = F I C E V = m I C E V 1 5 i = 1 5 θ F , i
  • Engine displacement = V I C E V = P I C E V / 1 5 i = 1 5 θ V , i
A similar approach was followed for the determination of the standard representative HEV. In this case, the coefficients taken into consideration were:
(1)
ψ C , j = C j m j   [ L k g ] = ratio between fuel tank capacity and vehicle mass
(2)
ψ P , j = P j m j   [ k W k g ] = ratio between maximum vehicle power and vehicle mass
(3)
ψ V , j = V j m j   [ L k g ] = ratio between engine displacement and vehicle mass
(4)
ψ B , j = B j C j   [ k W h L ] = ratio between battery capacity and fuel tank capacity
(5)
ψ F , j = F j m j   [ k m / L k g ] = ratio between vehicle consumption and vehicle mass
(6)
ψ W , j = B j W j   [ k W h k g ] = ratio between battery capacity and battery mass
where the subscript j refers to the generic real hybrid electric vehicle (j ranges from 1 to 5), the parameters m, C, P, V, and F have the same meaning adopted for the ICEV, B represents the battery capacity, which, as represented in the fourth coefficient, was considered proportional to the capacity of the fuel tank, and W the battery mass. According to the selected coefficients, the main characteristics of the standard representative HEV were determined as follows:
  • Vehicle mass = m H E V = 1 5 j = 1 5 m j
  • Fuel tank capacity = C H E V = m H E V 1 5 j = 1 5 ψ C , j
  • Maximum output power = P H E V = m H E V 1 5 j = 1 5 ψ P , j
  • Consumption = F H E V = m H E V 1 5 j = 1 5 ψ F , j
  • Engine displacement = V H E V = m H E V 1 5 j = 1 5 ψ V , j
  • Battery capacity = B H E V = C H E V 1 5 j = 1 5 ψ B , j
As regards the battery of the std. HEV, it must be pointed out that an Li-ion polymer model was adopted. Since no information was available on the battery of the vehicle HEV3, the only available capacity-to-mass ratio of the battery of vehicle HEV5 was adopted for the coefficient ψW, hence:
ψ W ψ W , 5 = B 5 W 5 = 1.56 33 = 0.473 [ k W h k g ]
According to this coefficient, the mass of the Li-ion polymer battery of the standard HEV was evaluated as:
W H E V = B H E V / ψ W
Concerning the standard representative BEV, the coefficients taken into consideration were:
(1)
β P , k = P k m k   [ k W k g ] = ratio between vehicle maximum power and vehicle mass =
(2)
β F , k = F k m k   [ k W h k m k g ] = the ratio between WLTP consumption and vehicle mass
(3)
β B , k = B k R k   [ k W h k m ] = the ratio between battery capacity and WLTP driving range
(4)
β W , k = B k W k   [ k W h k g ] = ratio between battery capacity and battery mass
where the subscript k refers to the generic real battery electric vehicle (k ranges from 1 to 5), the parameters m, B, P, F, and W have the same meaning of previous vehicles, while R represents the WLTP driving range of the vehicle, which, as reported by the third coefficient, was assumed to be related to the capacity of the battery. As in the previous cases, the mass of the standard representative BEV was evaluated as the average value among the 5 commercial vehicles:
Vehicle   mass = m B E V = 1 5 k = 1 5 m k
Moreover, considering that the std. BEV should also have an average operating range with respect to the five commercial vehicles, its WLTP driving range was evaluated as average value:
Driving   range   ( WLTP ) = R B E V = 1 5 k = 1 5 R k
According to the selected coefficients, the other main characteristics of the standard representative BEV were determined as follows:
  • Maximum output power = P B E V = m B E V 1 5 k = 1 5 β P , k
  • Battery capacity = B B E V = R B E V 1 5 k = 1 5 β B , k
  • Consumption = F B E V = m B E V 1 5 k = 1 5 β F , k
As reported in Table 4, an Li-ion NMC622 battery was adopted for the std. BEV, hence its mass was deduced on the basis of the only available capacity-to-mass ratio of the vehicle BEV5 battery:
β W β W , 5 = B 5 W 5 = 38.3 340 = 0.112 [ k W h k g ]     Battery   mass = W B E V = B B E V / β W

References

  1. European Commission. Statistical Pocketbook 2019: EU Energy. 2019. Available online: https://op.europa.eu/it/publication-detail/-/publication/e0544b72-db53-11e9-9c4e-01aa75ed71a1 (accessed on 23 September 2021).
  2. European Commission. Statistical Pocketbook 2019: EU Transport. 2019. Available online: https://ec.europa.eu/transport/sites/default/files/pocketbook-2019.pdf (accessed on 23 September 2021).
  3. Wu, Z.; Wang, M.; Zheng, J.; Sun, X.; Zhao, M.; Wang, X. Life cycle greenhouse gas emission reduction potential of battery electric vehicle. J. Clean. Prod. 2018, 190, 462–470. [Google Scholar] [CrossRef]
  4. Bauer, C.; Hofer, J.; Althaus, H.-J.; Del Duce, A.; Simons, A. The environmental performance of current and future passenger vehicles: Life cycle assessment based on a novel scenario analysis framework. Appl. Energy 2015, 157, 871–883. [Google Scholar] [CrossRef]
  5. Helmers, E.; Dietz, J.; Weiss, M. Sensitivity Analysis in the Life-Cycle Assessment of Electric vs. Combustion Engine Cars under Approximate Real-World Conditions. Sustainability 2020, 12, 1241. [Google Scholar] [CrossRef] [Green Version]
  6. Hawkins, T.R.; Singh, B.; Majeau-Bettez, G.; Strømman, A.H. Comparative Environmental Life Cycle Assessment of Conventional and Electric Vehicles. J. Ind. Ecol. 2012, 17, 53–64. [Google Scholar] [CrossRef]
  7. Cusenza, M.A.; Bobba, S.; Ardente, F.; Cellura, M.; Di Persio, F. Energy and environmental assessment of a traction lithium-ion battery pack for plug-in hybrid electric vehicles. J. Clean. Prod. 2019, 215, 634–649. [Google Scholar] [CrossRef] [PubMed]
  8. Hauschild, M.; Goedkoop, M.; Guinee, J.; Heijungs, R.; Huijbregts, M.; Joillet, O.; Margni, M.; De Schryver, A.; Pennington, D.; Pant, R.; et al. Recommendations for Life Cycle Impact Assessment in the European Context, International Reference Life Cycle Data System—ILCD Handbook, EUR 24571 EN.; Publications Office of the European Union: Luxembourg, 2011; JRC61049. [Google Scholar]
  9. ISO 14040. International Standard, Environmental Management—Life Cycle Assessment—Principles and Framework, 2nd ed.; 389 Chiswick High Road: London, UK, 2006; EN ISO 14040. [Google Scholar]
  10. Guinee, J.B. Handbook on life cycle assessment operational guide to the ISO standards. Int. J. Life Cycle Assess. 2002, 7, 311–313. [Google Scholar] [CrossRef]
  11. ACEA. The Automobile Industry Pocket Guide 2019/2020. 2020. Available online: https://www.acea.auto/publication/automobile-industry-pocket-guide-2019-2020 (accessed on 23 September 2021).
  12. GREET Model—The Greenhouse Gases, Regulated Emissions, and Energy Use in Technologies Model. Available online: https://greet.es.anl.gov/index.php (accessed on 23 September 2021).
  13. Elgowainy, M.; Wang, A. Overview of Life Cycle Analysis (LCA) with the GREET Model, Argonne National Laboratory. 2019. Available online: https://greet.es.anl.gov/files/workshop_2019_overview (accessed on 23 September 2021).
  14. Huijbregts, M.A.J.; Steinmann, Z.J.N.; Elshout, P.M.F.; Stam, G.; Verones, F.; Vieira, M.; Zijp, M.; Hollander, A.; van Zelm, R. ReCiPe2016: A Harmonized Life Cycle Impact Assessment Method at Midpoint and Endpoint Level; RIVM Report 2016–2014; Ministry of Health: Bilthoven, The Netherlands, 2016; Available online: www.rivm.nl/en (accessed on 23 September 2021).
  15. Huijbregts, M.A.J.; Steinmann, Z.; Elshout, P.M.F.; Stam, G.; Verones, F.; Vieira, M.; Zijp, M.; Hollander, A.; van Zelm, R. ReCiPe2016: A harmonised life cycle impact assessment method at midpoint and endpoint level. Int. J. Life Cycle Assess. 2016, 22, 138–147. [Google Scholar] [CrossRef]
  16. Vieira, M.D.M.; Ponsioen, T.C.; Goedkoop, M.J.; Huijbregts, M. Surplus Ore Potential as a Scarcity Indicator for Resource Extraction. J. Ind. Ecol. 2016, 21, 381–390. [Google Scholar] [CrossRef]
  17. ACEA. Economic and Market Report—Full Year 2019. 2020. Available online: www.acea.be (accessed on 23 September 2021).
  18. IEA. Commissioned EV and Energy Storage Lithium-Ion Battery Cell Production Capacity by Region, and Associated Annual Investment, 2010–2022. Available online: https://www.iea.org/data-and-statistics/charts/commissioned-ev-and-energy-storage-lithium-ion-battery-cell-production-capacity-by-region-and-associated-annual-investment-2010-2022 (accessed on 23 September 2021).
  19. ACEA. Vehicles in Use Report. 2021. Available online: www.acea.be/statistics/tag/category/vehicles-in-use (accessed on 23 September 2021).
  20. IEA. Data and Statistics. Available online: www.iea.org/data-and-statistics (accessed on 23 September 2021).
  21. Burnham, A. Updated Vehicle Specifications in the GREET Vehicle-Cycle Model; Center for Transportation Research; Argonne National Laboratory: Lemont, IL, USA, 2012. [Google Scholar]
  22. Ellingsen, L.A.-W.; Majeau-Bettez, G.; Singh, B.; Srivastava, A.K.; Valøen, L.O.; Strømman, A.H. Life Cycle Assessment of a Lithium-Ion Battery Vehicle Pack. J. Ind. Ecol. 2013, 18, 113–124. [Google Scholar] [CrossRef] [Green Version]
  23. Blomgren, G.E. The Development and Future of Lithium Ion Batteries. J. Electrochem. Soc. 2016, 164, A5019–A5025. [Google Scholar] [CrossRef] [Green Version]
  24. Mathieux, F.; Ardente, F.; Bobba, S.; Nuss, P.; Blengini, G.; Alves Dias, P.; Blagoeva, D.; Torres De Matos, C.; Wittmer, D.; Pavel, C.; et al. Critical Raw Materials and the Circular Economy—Background Report, JRC Science-for-Policy Report, EUR 28832 EN.; Publications Office of the European Union: Luxembourg, 2017; ISBN 978-92-79-74282-8. [Google Scholar] [CrossRef]
  25. Dunn, J.B.; Gaines, L.; Barnes, M.; Wang, M.; Sullivan, J.S. Material and Energy Flows in the Materials Production, Assembly, and End-of-Life Stages of the Automotive Lithium-Ion Battery Life Cycle. ANL/ESD/12-3; Argonne National Lab: Argonne, IL, USA, 2012. [Google Scholar]
  26. Dai, Q.; Kelly, J.C.; Gaines, L.; Wang, M. Life Cycle Analysis of Lithium-Ion Batteries for Automotive Applications. Batteries 2019, 5, 48. [Google Scholar] [CrossRef] [Green Version]
  27. Dai, J.Q.; Dunn, J.; Kelly, J.; Elgowainy, A. Update of Life Cycle Analysis of Lithium-Ion Batteries in the GREET Model. 2017. Available online: https://greet.es.anl.gov/publication-Li_battery_update_2017 (accessed on 23 September 2021).
  28. Dai, Q.; Kelly, J.C.; Dunn, J.; Benavides, P.T. Update of Bill-of-Materials and Cathode Mate-Rials Production for Lithium-Ion Batteries in the GREET Model. 2018. Available online: https://greet.es.anl.gov/publication-update_bom_cm (accessed on 23 September 2021).
  29. ISO 1176:1990(en), Road Vehicles-Masses-Vocabulary and Codes. Available online: https://www.iso.org/obp/ui/#iso:std:iso:24444:ed-1:v1:en (accessed on 23 September 2021).
  30. Wernet, G.; Bauer, C.; Steubing, B.; Reinhard, J.; Moreno-Ruiz, E.; Weidema, B. The ecoinvent database version 3 (part I): Overview and methodology. Int. J. Life Cycle Assess. 2016, 21, 1218–1230. [Google Scholar] [CrossRef]
  31. Althaus, H.-J.; Bauer, C.; Doka, G.; Dones, R.; Hischier, R.; Hellweg, S.; Humbert, S.; Kollner, T.; Loerinick, Y.; Margni, M.; et al. Implementation of Life Cycle Impact Assessment Methods. Ecoinvent Report No. 3, v2.2; Swiss Centre for Life Cycle Inventories: Dübendorf, Switzerland, 2010. [Google Scholar]
  32. European Environment Agency. Fuel Quality in the EU in 2016; Publications Office of the European Union: Luxembourg, 2018. [Google Scholar] [CrossRef]
  33. Gnansounou, E.; Dauriat, A.; Panichelli, L.; Villegas, J. Energy and greenhouse gas balances of biofuels: Biases induced by LCA modelling choices. J. Sci. Ind. Res. 2008, 67, 885–897. Available online: http://nopr.niscair.res.in/handle/123456789/2418 (accessed on 23 September 2021).
  34. Leonidas, N.; Zissis, S. EMEP/EEA Air Pollutant Emission Inventory Guidebook 2019—Update Oct. 2020. European Environmental Agency. 2020. Available online: http://eea.europa.eu/emep-eea-guidebook (accessed on 23 September 2021).
  35. Recharge. The Advanced Rechargeable Lithium Batteries Association PEFCR—Product Environmental Footprint Category Rules for High Specific Energy Rechargeable Batteries for Mobile Applications Version: H Time of Validity: 31 December 2020. 2018. Available online: https://ec.europa.eu/environment/eussd/smgp/pdf/PEFCR_Batteries.pdf (accessed on 23 September 2021).
  36. Golder Associates. Environmental Impact Assessment—Tenke Fungurume Project-Volume A: ESIA Introduction and Project Description. 2007. Available online: https://www3.opic.gov/environment/eia/tenke/Volume%20A%20ESIA%20Introduction%20and%20Project%20Description.pdf (accessed on 23 September 2021).
Figure 1. Global warming potential related to the entire lifecycle of the three reference vehicles (BP = Battery Production).
Sustainability 13 10992 g001
Figure 2. Global warming potential comparison as a function of the lifetime distance traveled.
Sustainability 13 10992 g002
Figure 3. Terrestrial acidification caused during the entire lifecycle of the three reference vehicles (BP = Battery Production).
Sustainability 13 10992 g003
Figure 4. Particulate matter formation related to the entire lifecycle of the three reference vehicles (BP = Battery Production).
Sustainability 13 10992 g004
Figure 5. Mineral resource depletion related to the entire lifecycle of the three reference vehicles (BP = Battery Production).
Sustainability 13 10992 g005
Figure 6. Fossil fuel depletion related to the entire lifecycle of the three reference vehicles (BP = Battery Production).
Sustainability 13 10992 g006
Figure 7. Specific global warming potential (gCO2eq/km) related to the three reference vehicles in the scenario analysis.
Sustainability 13 10992 g007
Figure 8. Specific terrestrial acidification potential (mgSO2eq/km) related to the three reference vehicles in the scenario analysis.
Sustainability 13 10992 g008
Figure 9. Specific particulate matter formation potential (mgPM2.5eq/km) related to the three reference vehicles in the six different scenarios.
Sustainability 13 10992 g009
Figure 10. Specific surplus ore potential (mgCu-eq/km) related to the three reference vehicles in the six different scenarios.
Sustainability 13 10992 g010
Figure 11. Specific fossil fuel potential (gOil-eq/km) related to the three reference vehicles in the six different scenarios.
Sustainability 13 10992 g011
Figure 12. Global warming impacts comparison as function of the lifetime traveled distance, with reference to the Norwegian (left) and to the Polish (right) electricity mix.
Sustainability 13 10992 g012
Table 1. Impact categories and characterization factors employed for the LCIA.
Impact CategoryCharacterization FactorUnit
Climate changeGlobal Warming Potential (GWP)kg CO2-eq
Terrestrial acidificationTerrestrial Acidification Potential (TAP)kg SO2-eq
Fine particulate matter formationParticulate matter formation potential (PMFP)kg PM2.5-eq
Mineral resource scarcitySurplus ore potential (SOP)kg Cu-eq
Fossil resource scarcityFossil fuel potential (FFP)kg Oil-eq
Table 2. Technical data of the gasoline internal combustion engine vehicles.
Gasoline Internal Combustion Engine Vehicle (ICEV)
Vehicle ref. codeICEV1ICEV2ICEV3ICEV4ICEV5Reference
ICEV
Make and modelVolkswagen Polo 1.0 TSI 115 CVPeugeot 208 PureTech 130 Stop and StartOpel Corsa 1.2 130 CVRenault Clio TCe 130 CVCitroen C3 PureTech 83 Stop and Start Van Live
Tank capacity [L]454444424544
Vehicle mass [kg]119012331233132311651228.8
Displacement [cm3]99911991199133311991176.6
Max power [kW]859696968190.6
Standard emissionEuro 6d tempEuro 6d tempEuro 6d tempEuro 6d tempEuro 6d tempEuro 6d temp
WLTP consumption [km/L]17.217.416.715.917.216.93
Table 3. Technical data of the gasoline hybrid electric vehicles.
Gasoline Hybrid Electric Vehicle (HEV)
Vehicle ref. codeHEV1HEV2HEV3HEV4HEV5Reference
HEV
Make and modelRenault Clio Hybrid E-Tech 140 CVToyota Corolla 1.8 Hybrid Touring SportHyundai Ioniq FL Hybrid 1.6Toyota Prius 1.8 AWDKia Niro 1.6 GDI
Tank capacity [L]394345434543.0
Vehicle mass [kg]139814301436144014901439
Displacement [cm3]161817981580179815801676
Max power [kW]103901049010498.2
Standard emissionEuro 6dEuro 6dEuro 6dEuro 6dEuro 6dEuro 6d
WLTP consumption [km/L]19.623.020.822.720.821.4
Battery capacity [kWh]1.20.751.561.31.561.27
Battery technologyLi-ionLi-ionLi-ion polymerNiMHLi-ion
polymer
NMC
Battery mass [kg]38//////3326.9
Table 4. Technical data of the battery electric vehicles.
Battery Electric Vehicle (BEV)
Vehicle ref. codeBEV1BEV2BEV3BEV4BEV5Reference
BEV
Make and modelPeugeot e-208Renault Zoe R110 2019Volkswagen e-Golf 2019Nissan Leaf S 2019Hyundai Ioniq EV 2019
Vehicle mass [kg]150015001615155815751550
Max power [kW]1008010011010097.9
Battery capacity [kWh]5045.6135.84038.342.1
Battery warranty [km]160,000 (70%)160,000 (66%)160,000160,000200,000160,000
Battery technology//NMC 712NMCNMCNMC 622NMC 622
Battery mass [kg]//305318303340374
WLTP Driving range [km]340300232270311291
WLTP Consumption [kWh/km]0.1640.1780.1760.1710.1380.166
Table 5. Composition of the electricity mixes considered in the LCA [20].
China
(2018)
EU-28
(2019)
Germany
(2019)
Norway
(2019)
Poland
(2019)
Coal66.4%15.4%30.0%0.121%73.72%
Oil0.153%1.64%0.822%0.013%1.09%
Natural gas3.28%21.9%15.3%1.732%9.18%
Nuclear4.09%25.3%12.1%0%0%
Hydro17.1%10.9%4.24%93.4%1.63%
Wind5.07%13.3%20.4%4.1%9.20%
Solar PV2.45%4.07%7.69%0.010%0.44%
Biofuels1.26%5.27%7.22%0.03%4.30%
Waste0.187%1.60%2.03%0.31%0.38%
Geothermal0.002%0.206%0.0317%0%0%
Solar thermal0.004%0.178% 0%0%
Tide0.0002%0.0152% 0%0%
Other sources 0.141%0.168%0.244%0.05%
Table 6. Percentage mass distribution for each kind of passenger car [21].
ComponentICEVHEVBEV
Body44.1%45.3%53.5%
Powertrain25.7%17.0%1.70%
Transmission6.30%7.20%3.30%
Chassis23.9%24.5%28.9%
Traction motor02.10%6.70%
Generator02.10%0
Controller/Inverter01.80%5.90%
Table 7. Fluids masses for each kind of vehicle.
ICEVHEVBEV
Engine lubricant [kg]4.14.10.0
Power steering fluid [kg]0.00.00.0
Brake fluid [kg]0.910.910.91
Transmission fluid [kg]10.90.910.91
Powertrain coolant [kg]10.410.47.2
Windshield wiper fluid [kg]2.72.72.7
Adhesives [kg]13.613.613.6
Table 8. Environmental impact and resource deployment related to the reference ICEV components production.
GWP
[kg CO2 eq]
TAP
[kg SO2 eq]
PMFP
[kg PM2.5 eq]
SOP
[kg Cu eq]
FFP
[kg Oil eq]
Energy
Consumption [MJ]
Body1303.07.12.217.7334.220,890.3
Powertrain659.13.91.324.7191.212,435.9
Transmission163.30.60.25.446.13081.5
Chassis666.13.31.110.1133.59339.3
Assembly1127.51.80.60.0300.420,413.5
Oil13.40.10.00.04.0219.8
Brake fluid3.00.00.00.00.948.8
Transmission fluid35.80.20.10.010.7586.1
Coolant18.00.10.00.04.1205.9
Adhesives48.80.30.10.023.31190.8
Windshield wiper fluid4.90.00.00.00.941.7
Battery11.70.20.15.14.1251.6
Table 9. Environmental impact and resource deployment related to the reference HEV components production.
GWP
[kg CO2 eq]
TAP
[kg SO2 eq]
PMFP
[kg PM2.5 eq]
SOP
[kg Cu eq]
FFP
[kg Oil eq]
Energy Consumption [MJ]
Body1574.78.52.7018.8403.925,246.1
Powertrain523.03.00.9716.6142.59373.7
Transmission317.33.91.2020.161.75155.5
Chassis803.33.91.3210.5161.011,263.5
Traction Motor74.11.40.419.816.31188.9
Generator74.11.40.419.816.31188.9
Controller/Inverter63.40.50.163.920.51263.2
Assembly1320.22.10.700.0351.823,902.1
Oil13.40.10.030.04.0219.8
Brake fluid3.00.00.010.00.948.8
Transmission. Fluid3.00.00.010.00.948.8
Coolant18.00.10.020.04.1205.9
Adhesives48.80.30.070.023.31190.8
Windshield wiper fluid4.90.00.000.00.941.7
Battery BOM214.01.60.506.445.02949.6
Battery assembly20.00.00.010.05.7289.2
Table 10. Environmental impact and resource deployment related to the reference BEV components production.
GWP
[kg CO2 eq]
TAP
[kg SO2 eq]
PMFP
[kg PM2.5 eq]
SOP
[kg Cu eq]
FFP
[kg Oil eq]
Energy
Consumption [MJ]
Body1627.68.82.8022.1417.426,094.7
Powertrain57.90.80.254.417.31035.7
Transmission127.81.60.488.224.82075.8
Chassis832.44.11.3612.7166.811,671.7
Traction Motor213.94.01.1828.647.13431.6
Controller/Inverter182.51.50.4611.159.13637.3
Assembly1421.82.20.750.0378.925,742.7
Brake fluid3.00.00.010.00.948.8
Transmission fluid3.00.00.010.00.948.8
Coolant12.50.10.010.02.8143.3
Adhesives48.80.30.070.023.31190.8
Windshield wiper fluid4.90.00.000.00.941.7
Battery BOM3008.050.314.92180.7683.343,210.8
Battery assembly658.50.90.230.0187.69519.7
Table 11. Specific impact factors related to the production of 1 kg of gasoline with 5% ethanol from biomass (BE5) [30]).
GWP [kg CO2 eq/kg]0.596896
TAP [kg SO2 eq/kg]0.00529478
PMFP [kg PM2.5 eq/kg]0.00169847
SOP [kg Cu eq/kg]0.00157793
FFP [kg Oil eq/kg]1.14230
Energy consumption [MJ/kg]7.0463
Table 12. Specific impact characterization factors related to the production of 1 kWh of electric energy (EU-28 average electricity—Table 5).
GWP [kg CO2 eq/kWh]0.2994
TAP [kg SO2 eq/kWh]0.0006227
PMFP [kg PM2.5 eq/kWh]0.0001971
SOP [kg Cu eq/kWh]0.0000
FFP [kg Oil eq/kWh]0.07252
Energy consumption [MJ/kWh]6.8368
Table 13. Environmental impact and resource deployment related to the energy consumed in the use phase of each reference vehicle (whole vehicle life = 150,000 km).
ICEVHEVBEV
Total fuel consumed [kg]6662.45274.90
Traction energy [kWh]77,17361,10124,841
Source production energy [kWh]13,04010,32547,176
GWP [kg CO2eq/kWh]3976.73148.67436.5
TAP [kg SO2eq/kWh]35.27627.93015.469
PMFP [kg PM2.5eq/kWh]11.3168.95944.8965
SOP [kg Cu eq/kWh]10.5138.32350
FFP [kg Oil eq/kWh]7610.46025.61801.4
Table 14. Emission factors related to the reference vehicles ICEV and HEV (European Environment Agency [34]).
ICEVHEV
Type of carPetrol SmallHybrid Petrol Small
TechnologyEuro 6 d-tempEuro 6
CO2 [g/km]133.5105.7
CO [g/km]0.690.042
NMHC [g/km]0.0480.001
NOX [g/km]0.0560.013
N2O [g/km]0.00130.0002
NH3 [g/km]0.01230.0328
Pb [g/km]1.82 × 10−51.82 × 10−5
CO2 lube [g/km]0.3980.398
Table 15. Environmental impact and resource deployment related to the exhaust emissions of both reference ICEV and HEV produced during the entire life (i.e., 150,000 km).
ICEVHEV
GWP [kg CO2 eq]20,03215,860
TAP [kg SO2 eq]3.0240.7020
PMFP [kg PM2.5 eq]00
SOP [kg Cu eq]0.24000.03000
FFP [kg Oil eq]00
Table 16. Environmental impact and resource deployment related to the use phase of the three reference vehicles on their entire life (i.e., 150,000 km).
ICEVHEVBEV
GWP [kg CO2 eq]24,00819,0097437
TAP [kg SO2 eq]38.30028.63215.47
PMFP [kg PM2.5 eq]11.5568.98944.896
SOP [kg Cu eq]10.5138.32350
FFP [kg Oil eq]7610.46025.61801
Table 17. Impact characterization factors related to the End of Life (EoL) of the lithium-ion batteries of both reference HEV and BEV.
HEVBEV
GWP [kg CO2 eq]28.46396.0
TAP [kg SO2 eq]0.073711.026
PMFP [kg PM2.5 eq]0.020630.2870
SOP [kg Cu eq]00
FFP [kg Oil eq]6.61091.97
Energy consumption [MJ]488.26794
Table 18. Specific impact indicator results of the scenario analysis.
spec. GWP [gCO2eq/km]spec. TAP [mgSO2eq/km]spec. PMFP [mgPM2.5eq/km]spec. SOP [mgCu-eq/km]FFP [gOil-eq/km]
Prod.UseBatt. EoLProd.UseBatt. EoLProd.UseBatt. EoLProd.UseBatt. EoLProd.UseBatt. EoL
EUROPE 105,000 kmICEV38.61600.001672550.0053.877.00.0060070.10.00105350.70.00
HEV48.71270.2712811910.70288.459.90.19699955.50.00127240.20.0629
BEV82.049.63.777871039.7723732.62.73281794.90.00210112.00.876
EUROPE 150,000 kmICEV27.01600.001172550.0037.777.00.0042070.10.00105350.70.00
HEV34.11270.1901971910.49161.959.90.13869955.50.00127240.20.0441
BEV57.449.62.645511036.8416632.61.91197294.90.00210112.00.613
EUROPE 195,000 kmICEV20.81600.0089.72550.0029.077.00.0032370.10.00105350.70.00
HEV27.71270.2921731910.75654.159.90.21261755.50.00133540.20.0678
BEV65.849.64.0673310310.521932.62.94261194.90.00309712.00.943
NORWAY 105,000 kmICEV38.61600.001672550.0053.877.00.0060070.10.00105350.70.00
HEV48.71270.2712811910.70288.459.90.19699955.50.00127240.20.0629
BEV82.01.713.777871.489.772370.3542.73281727.20.0021010.5910.876
NORWAY 150,000 kmICEV27.01600.001172550.0037.777.00.0042070.10.00105350.70.00
HEV34.11270.1901971910.49161.959.90.13869955.50.00127240.20.0441
BEV57.41.712.645511.486.841660.3541.91197227.20.0021010.5910.613
NORWAY 195,000 kmICEV20.81600.0089.72550.0029.077.00.0032370.10.00105350.70.00
HEV27.71270.2921731910.75654.159.90.21261755.50.00133540.20.0678
BEV65.81.714.067331.4810.52190.3542.94261127.20.0030970.5910.943
POLAND 105,000 kmICEV38.61600.001672550.0053.877.00.0060070.10.00105350.70.00
HEV48.71270.2712811910.70288.459.90.19699955.50.00127240.20.0629
BEV82.01423.777873579.772371072.73281789.80.00210124.20.876
POLAND 150,000 kmICEV27.01600.001172550.0037.777.00.0042070.10.00105350.70.00
HEV34.11270.1901971910.49161.959.90.13869955.50.00127240.20.0441
BEV57.41422.645513576.841661071.91197289.80.00210124.20.613
POLAND 195,000 kmICEV20.81600.0089.72550.0029.077.00.0032370.10.00105350.70.00
HEV27.71270.2921731910.75654.159.90.21261755.50.00133540.20.0678
BEV65.81424.0673335710.52191072.94261189.80.00309724.20.943
Publisher’s Note: MDPI stays neutral with regard to jurisdictional claims in published maps and institutional affiliations.

