1. Introduction
Visually impaired people have great difficulties moving around with full autonomy and security, especially in the city. They rely, generally, on sensory compensation such as sound, touch, and smell in order to perceive and understand architectural and urban spaces [
1,
2]. According to existing literature on this topic, this difficulty in wayfinding does not depend on the complexity of the building, but rather on the inaccessibility of environmental landmarks [
3]. Sensory landmarks play an important role in facilitating orientation and improving the perception of space [
4]. These types of landmarks contribute to improving accessibility in the city for visually impaired people [
5]. Other studies have reported that hearing is used by visually impaired people to determine the distance and the size of objects, and also to capture certain environmental elements, acting as a guide to move around in space [
6]. Indeed, the sounds that are generated by the activities of the city and its morphology represent an important supplement to help them move around in built environments [
7].
In contrast, the architecture of the past forty years has produced a visually dominant environment which often excludes other senses [
8]. As a consequence, the city is not legible for everyone, and this negatively affects wayfinding for people who are visually impaired. In line with the UN’s sustainability goal 11, where the aim is to make human settlement inclusive, safe, resilient, and sustainable, there is a need for knowledge on the spatial configuration and orientation of the built environment for visually impaired people with the purpose of ensuring well-functioning and sustainable urban planning and design strategies. For urban designers and planners, knowledge is needed on the relationship between urban space and soundscapes generated by the users of various built environments.
This spatial structure has a significant impact on human social activities [
9]. Throughout the years, the space syntax method has been refined with the purpose of analysing the arrangement of spaces and movement patterns through the spatial configuration of built environments [
10] independent from socio-economic and place-based data [
11]. Applying space syntax in urban studies consists of (1) a concise definition of urban space and the spatial elements analysed [
10,
11], (2) a set of techniques to analyse spatial interrelationships, (3) a set of methods to correlate the results of the spatial analyses with socio-economic data, and (4) a set of general understandings and theories on spatial interrelationships, and urban space and socio-economic human behaviour [
12].
One of the key measures of space syntax is spatial accessibility, which can be evaluated by a two-dimensional axial map [
9,
12,
13]. Throughout the years, the results from axial integration analyses have correlated with pedestrian flow and vehicle transport data throughout the world. As the results have shown, the higher the spatial integration of a street network, the higher the flow of pedestrian and vehicle transport [
14,
15,
16,
17]. Recent research has shown that there is also a correlation between the energy use for transport and the spatial configuration of the street network. The higher integration of primary routes in network at a global scale, the higher the energy use for transport. Conversely, the higher the integration of a local primary internal route inside a neighbourhood with good connection to an integrated primary route at the city scale, the higher the level of pedestrian movement [
18].
As presumed, the various sound levels from vehicles and the presence of people in streets will then help visually impaired people to create a mental map of the urban network in built environments. How then, can a spatial configurative approach through the use of the space syntax method contribute to revealing a sound-based mental map for visually impaired people? With this question in mind, the overall research aim is to reveal the correlation between outdoor noise levels and spatial configuration of the street network in built environments. How does the correlation of local and global space syntax measurements affect sound pressure levels in various types of neighbourhoods?
There exists some space syntax research related to noise and air pollution. Some research has been carried out with the classic space syntax axial analyses methods and registrations of noise and air pollutions in the UK [
19,
20,
21,
22,
23]. As their findings show, streets with a high level of noise pollution are found in highly spatially integrated streets. More recent research on noise pollution and spatial integration was carried out in two densely populated Bulgarian cities. The results from the classic space syntax analyses were correlated with noise mapping simulation models and field-measured noise. Some of the space syntax measures seemed to be highly associated with traffic count and traffic-generated noise. The authors claim that the space syntax method has a high predictive potential above and beyond traffic counts [
24]. The same findings regarding noise pollution and levels of spatial integration were found in a research project in Dhaka city. The researchers found a strong correlation between global axial integration and noise levels from vehicles [
25].
The axial map used in the space syntax method is composed of the longest and fewest visual sightlines in a built environment. Therefore, it seems contradictory to use space syntax in research on issues related to visually impaired people. As research has shown, visual orientation is crucial in panic situations. Evidence on this was found in a research project on space and panic from the 2004 tsunami in Banda Aceh. The higher spatial integration of a neighbourhood’s street network, the easier to escape and the lower mortality rates. Conversely, when a local street network is more of a labyrinth, there is a lower level of spatial integration and a higher mortality rate. The mortality rates in segregated neighbourhoods were ten times higher than in spatially integrated ones [
26].
During the last two decades, segment analyses with angular weighting have been taken into account when performing a space syntax analysis. However, the classic global axial integration analysis is still a powerful spatial analysis tool, to which the degree of spatial ‘intelligibility’ can be measured through the correlation between connectivity and global axial integration [
10,
14,
27]. The degree of intelligibility shows how easy it is to orient oneself through a city simply by being inside a local neighbourhood. As research has shown, the more complicated the street network of a neighbourhood is, the more difficult it is for wayfinding [
28]. The global integration factor is an indicator of spatial accessibility [
29], whereas intelligibility is an indicator of the legibility of urban spaces [
14]. Regarding recent space syntax measurements, systematic intelligibility analyses have not been conducted. Therefore, the classical axial analyses are applied in this research and include the measuring of spatial ‘intelligibility’ and the level of ‘to-movement’ potentials in four different neighbourhoods of Biskra.
Regarding the segment analyses, the angular choice analysis is able to measure the level of ‘through movement’ potentials [
30]. Here the main routes that run through and between various neighbourhoods are highlighted. The space syntax software DepthmapX is able to break up the axial map into segments. The segment length and the degree of angular deviation between each segment can then be taken into account in the angular choice analyses. As research has shown, the largest flow of human movement tends to take place along highly integrated main routes that are well connected to local streets in the vicinity [
10,
11,
12,
13,
14,
15,
16,
17,
18,
31,
32,
33]. Therefore, we tested out how the level of noise correlates with the correlation coefficient between the low and high radius of the normalised angular choice analyses (NACH) as well as the normalised angular integration (NAIN) in this research.
The axial map can be used to specify the locations of the sensory landmark based on the global integration and connectivity values, which can increase the accessibility of visually impaired people [
34]. However, space syntax methods do not provide specific information on the ‘soundscape’. This research explores a possible relationship between sound level and the two-dimensional spatial configuration, by making a comparison between the sound pressure level of the street and the various integration and choice values provided by the space syntax method of four different neighbourhoods in Biskra. The aim of the current study is to gain spatial information that might be useful for improving the accessibility of visually impaired people in built environments.
2. Materials and Methods
Space syntax has been applied worldwide and combines analyses of both spatial integration and pedestrian flow rates. Therefore, a substantial database exists for making general statements and theories regarding urban space and human movement [
12]. The theory of natural movement [
15,
16], states that the higher the spatial integration of a street network, the higher the flow of human movement. As presumed, the higher presence of people in streets, whether they travel by vehicle transport or by foot, the higher the noise level. The hypothesis of this study is that there must be a positive correlation between the level of noise and degree of spatial integration in urban spaces. In order to verify this hypothesis, a historic background of the studied cases is first presented to determine the spatial configuration of the different types of neighbourhoods in Biskra using space syntax. To understand the urban sound characterisation, sound pressure measurements were recorded from four selected neighbourhoods and were compared to World Health Organization (WHO) recommendations. Finally, the results from the space syntax analyses and the urban sound characterisations are compared with one another.
2.1. Background of the Studied Case
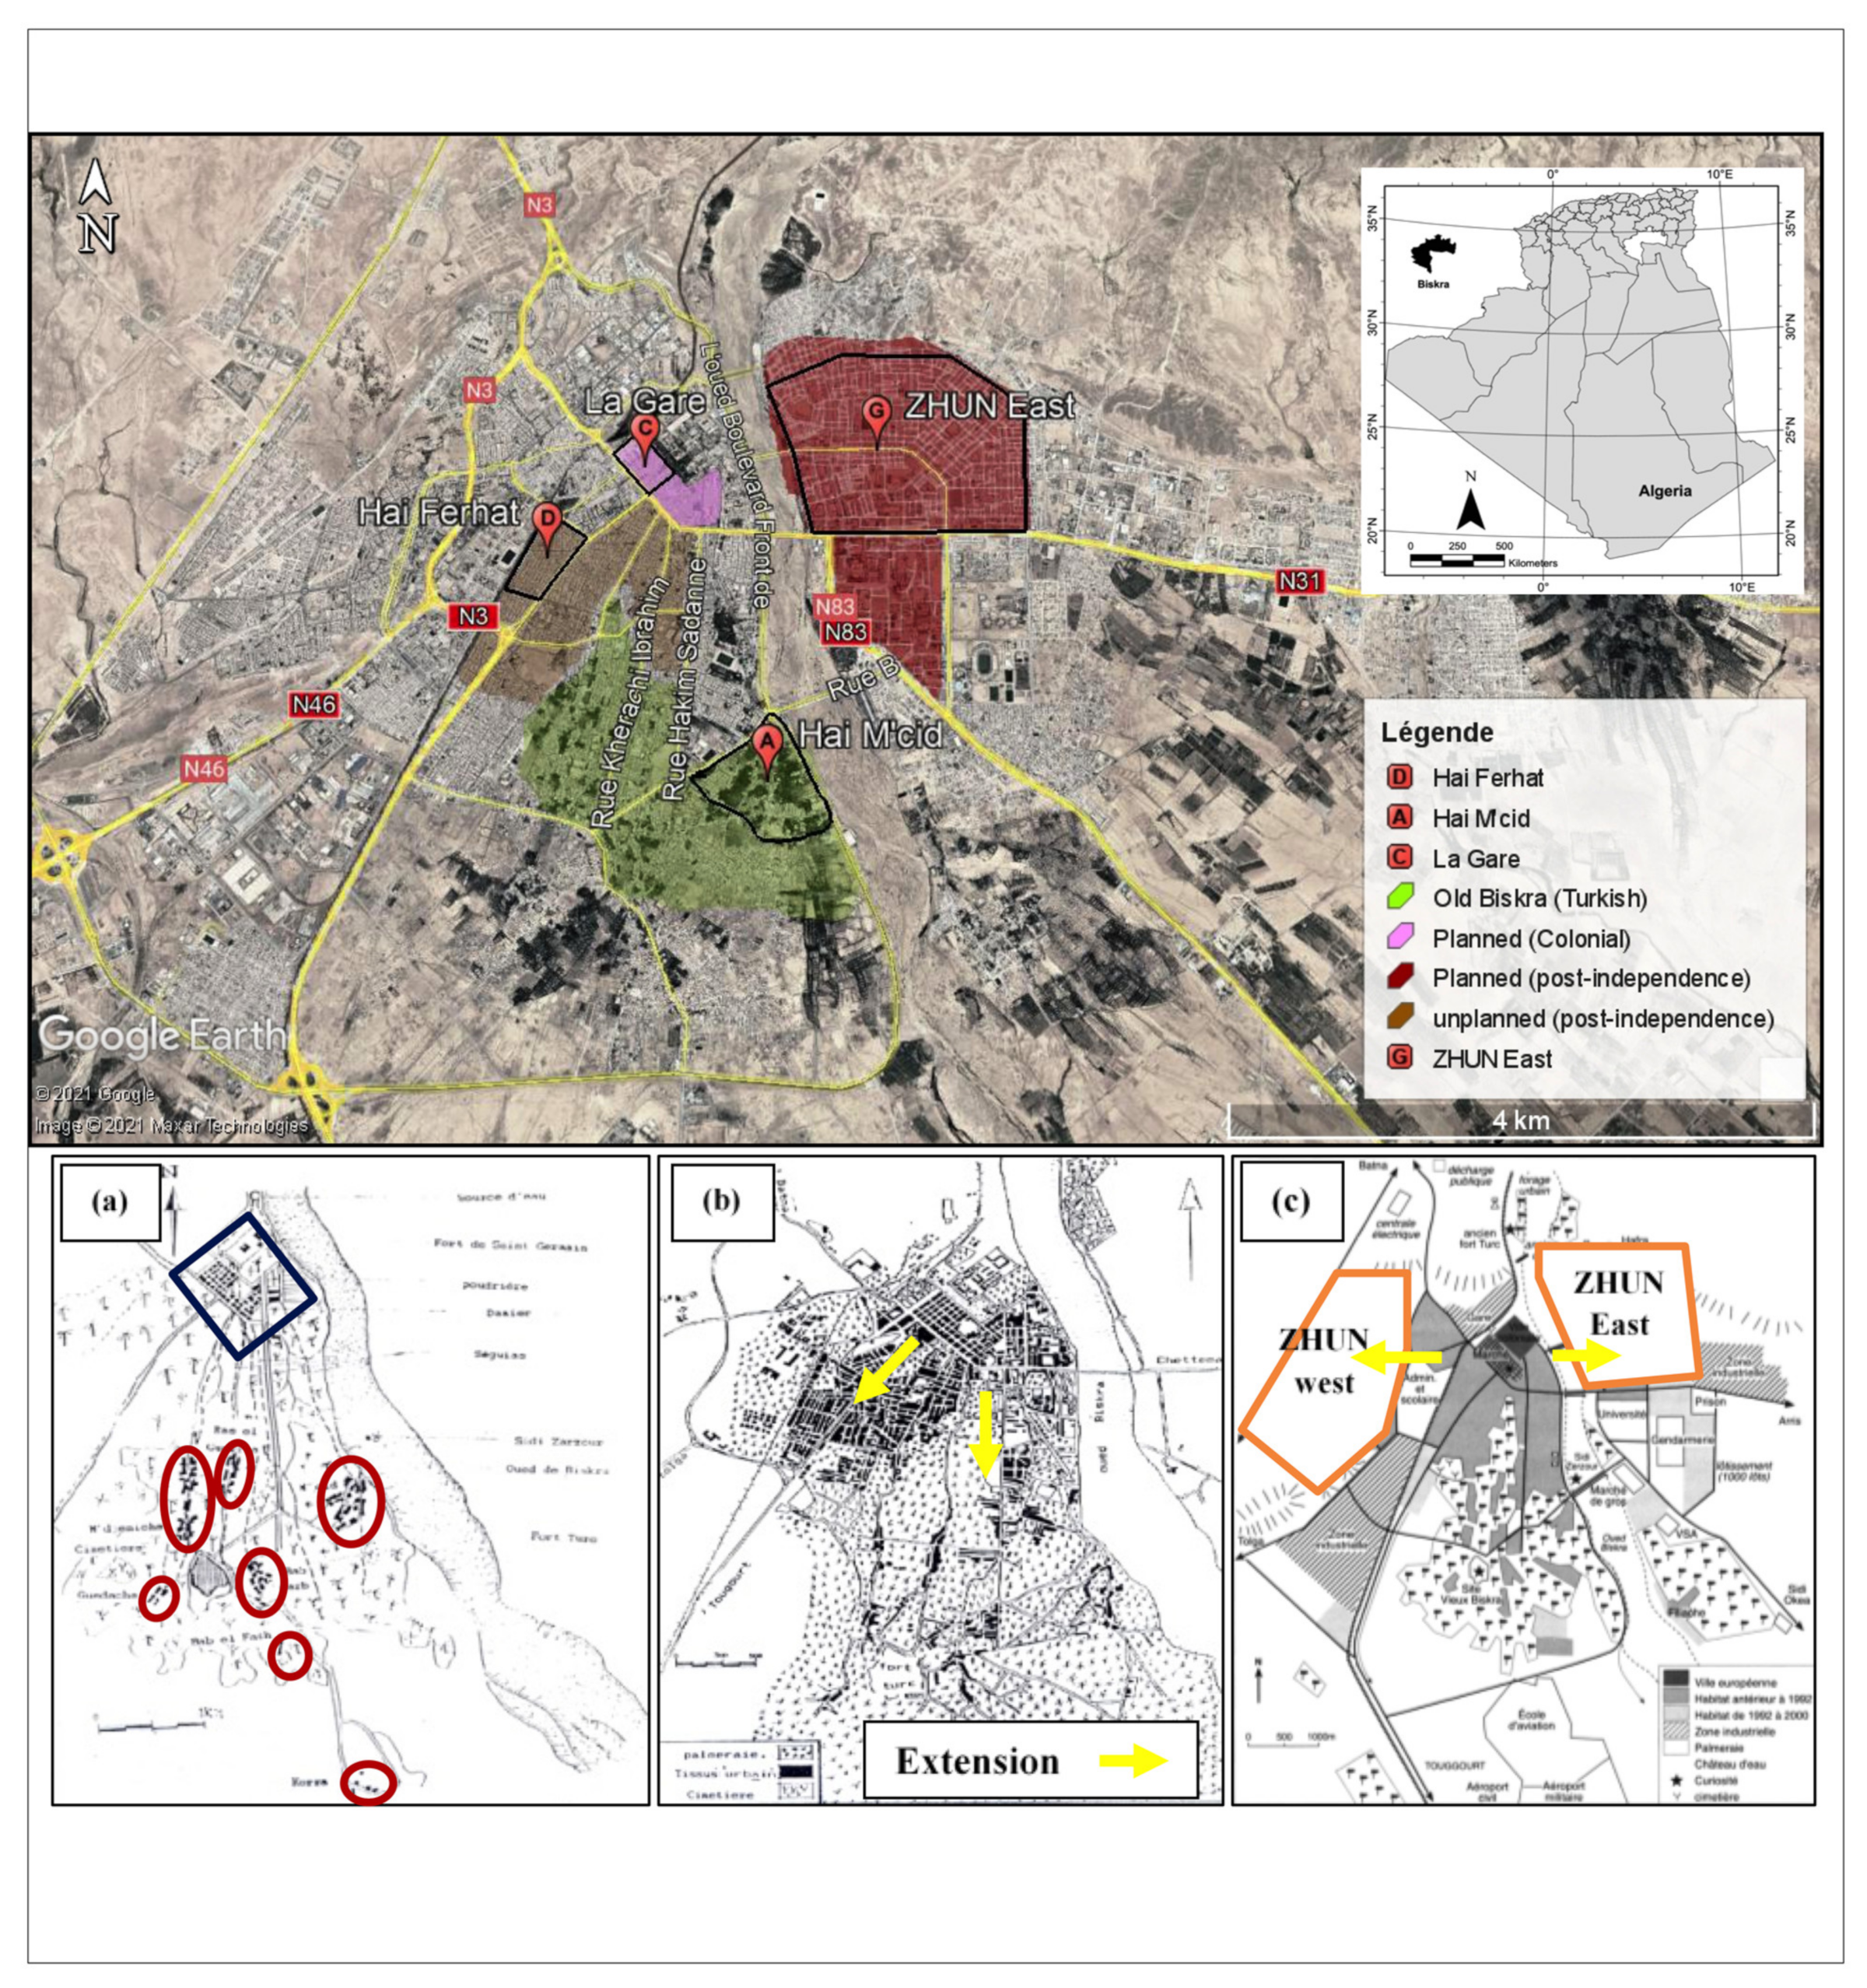
The study is carried out in four neighbourhoods in Biskra. Biskra is located at the edge of the Sahara Desert in Algeria. There are a few small villages located outside the city. Therefore, Biskra is an interesting case for this study, due to its remote location from other towns and cities.
The city is composed of four main types of urban neighbourhoods formed during three historical eras. These neighbourhoods have a spatial layout that have similarities with many other cities in the Middle East, Europe, and Asia. However, what makes Biskra an interesting case for studying the relationship between spatial configuration and noise is that the texture of the building surfaces are more or less the same in all neighbourhoods. Often textures of facades affect the acoustics from sound sources. In addition, Biskra has stable weather conditions, with dry sunny days most of the time.
Many civilizations throughout history have contributed to the form of the oldest neighbourhood of Biskra such as the Roman and Arab civilizations. However, the current shape and form of this neighbourhood, called ‘Old Biskra’, is influenced by the Turkish era (1541–1844). Old Biskra is composed of seven villages known as M’cid, BâbDarb, Bâb El Fath, Guedacha, Ras El Guerria, Medjniche, and El Korra. These villages are shown inside the red circles in
Figure 1a. The villages are scattered in the palm grove in the South of the city. Each village is composed of compact housing groups, which are developed along streets that follow the ‘Seguias’ (the irrigation canals of the palm groves), and on some impasse streets [
35,
36,
37].
The second type of neighbourhood is the result of the French colonial era (1844–1962). The so-called ‘colonial city’ is located to the North of the palm grove. It is characterised by a plot checkerboard layout, which is in contrast to Old Biskra, as shown in the blue square in
Figure 1a.
In the post-independence era, two new types of neighbourhoods were developed [
35,
36,
37]. The first modern type of urbanisation was formed after independence (1962–1974). These new neighbourhoods were unplanned and constructed in an anarchic way without any urban plan with an urban extension towards the Southwest. The new developed neighbourhoods accelerated the urbanisation process and allowed for an articulation between the ‘old Biskra’ and the ‘colonial city’. These areas are marked in the yellow arrows in
Figure 1b.
After 1974, another type of neighbourhood was constructed in a planned way, where the first urban planning tools were applied in Biskra. Those tools were not only used to correct the anarchic pattern of urban growth, but also to meet housing needs through the use of a planning law. For example, the land and construction laws (subdivision permit, building permit etc.) led to the delimitation of different urban zones, such as the east and west urban housing zones (ZHUN), the industrial zone (ZI), the activity zone (ZAC), and the equipment zone (ZE), according to the master plan (PDAU) [
36]. These areas are shown inside the yellow polygons in
Figure 1c.
2.2. Calculating Degree of Spatial Integration with the Space Syntax Method
This phase consists of analysing the spatial configuration of four different types of neighbourhoods, using an axial map to extract the global integration and connectivity values. The axial map of Biskra was elaborated using DepthmapX software and a background map provided by the PDAU study of Biskra carried out in 2010 by URBA, a design office based in Biskra. The results of the spatial global integration values are shown in
Section 3.
One of the key measures of space syntax is spatial accessibility based on the total number of direction changes for every street to all others [
10,
13], this is called “integration”. The basis of the space syntax method is the axial map, and the basic premise is to calculate the topological depth from one axis to all others. Here the total number of direction changes from one axis to all others is calculated. The integration (
I) of an axial line (
i) is a function of its depth related to all other axial lines. The calculation behind the integration of an axial line is [
38] (p. 64):
where
n is the number of axial lines and
dij is the shortest distance (least number of direction changes) between two axial lines
i and
j. The greater the number of direction changes (
dij) between street axes, the lower the integration value becomes. The global integration factor is an indicator of spatial accessibility [
29]. The higher the spatial integration, the higher the spatial inter-accessibility.
Connectivity is to record the number of direct connections each axis has to its direct neighbours. Often shopping streets and long main streets tend to have many direct connections to side streets. The intelligibility is quantified by the degree of correlation between the connectivity and the global integration values [
14,
27]. When the correlation coefficient (R
2) is high, the neighbourhood is thus easily orientable. Conversely, a low correlation coefficient implies poorly orientable neighbourhoods.
Angular choice (C) of a street segment (
i) is calculated as follows:
where
gjk (
i) is the number of shortest paths between segment
j and
k containing
i, and
gjk is the number of all shortest path between
j and
k ([
38] p. 64). The values of the normalised angular choice (NACH) are calculated as follows:
Segment integration is calculated as follows:
where
n is the number of segments,
dθ is the angle between any two segments on the shortest route on segment
x, and
l is the length of the segments. The formula calculates how easy it is to get to a street and how likely one is to pass through a street ([
29], p. 66). The use of the metric radius and the segment length contribute to the solution of the edge effect problem from the classic axial analyses with a radius
n. The values of the normalised segment integration (
NAIN) are calculated as follows:
Due to the size of Biskra and its remote location, a radius like n has been used in this inquiry.
2.3. The Measurement of the Sound Pressure Level
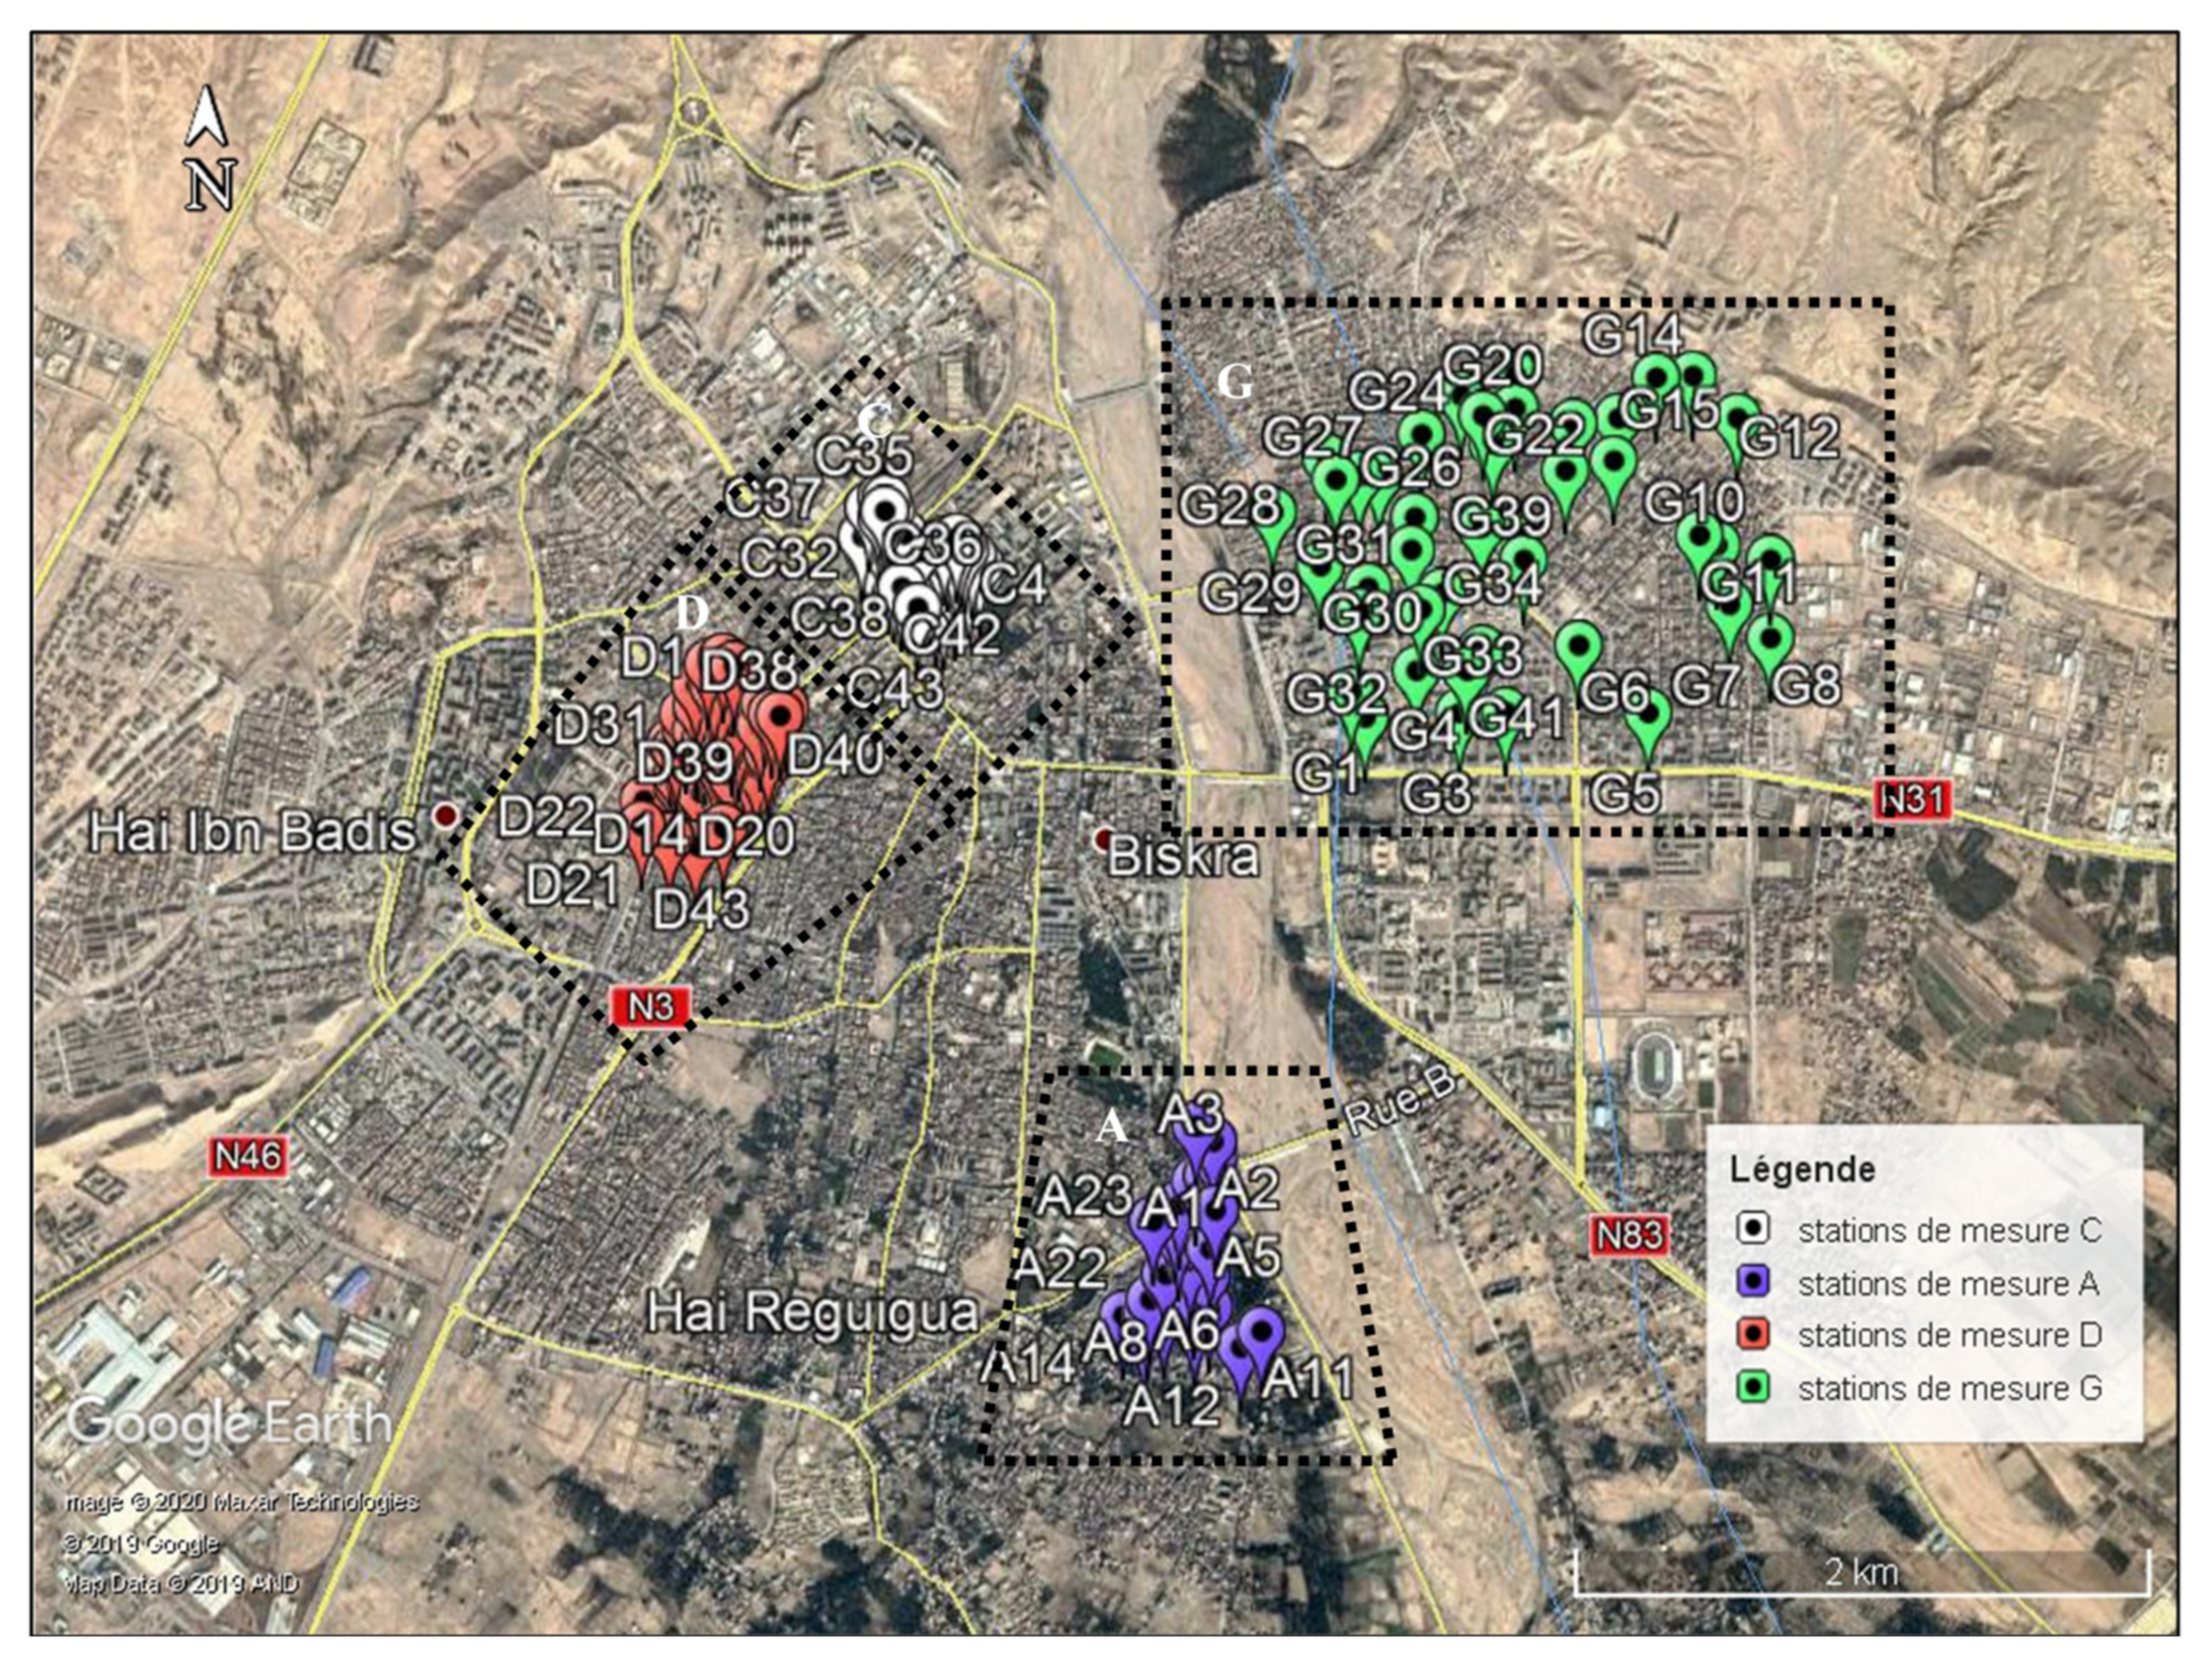
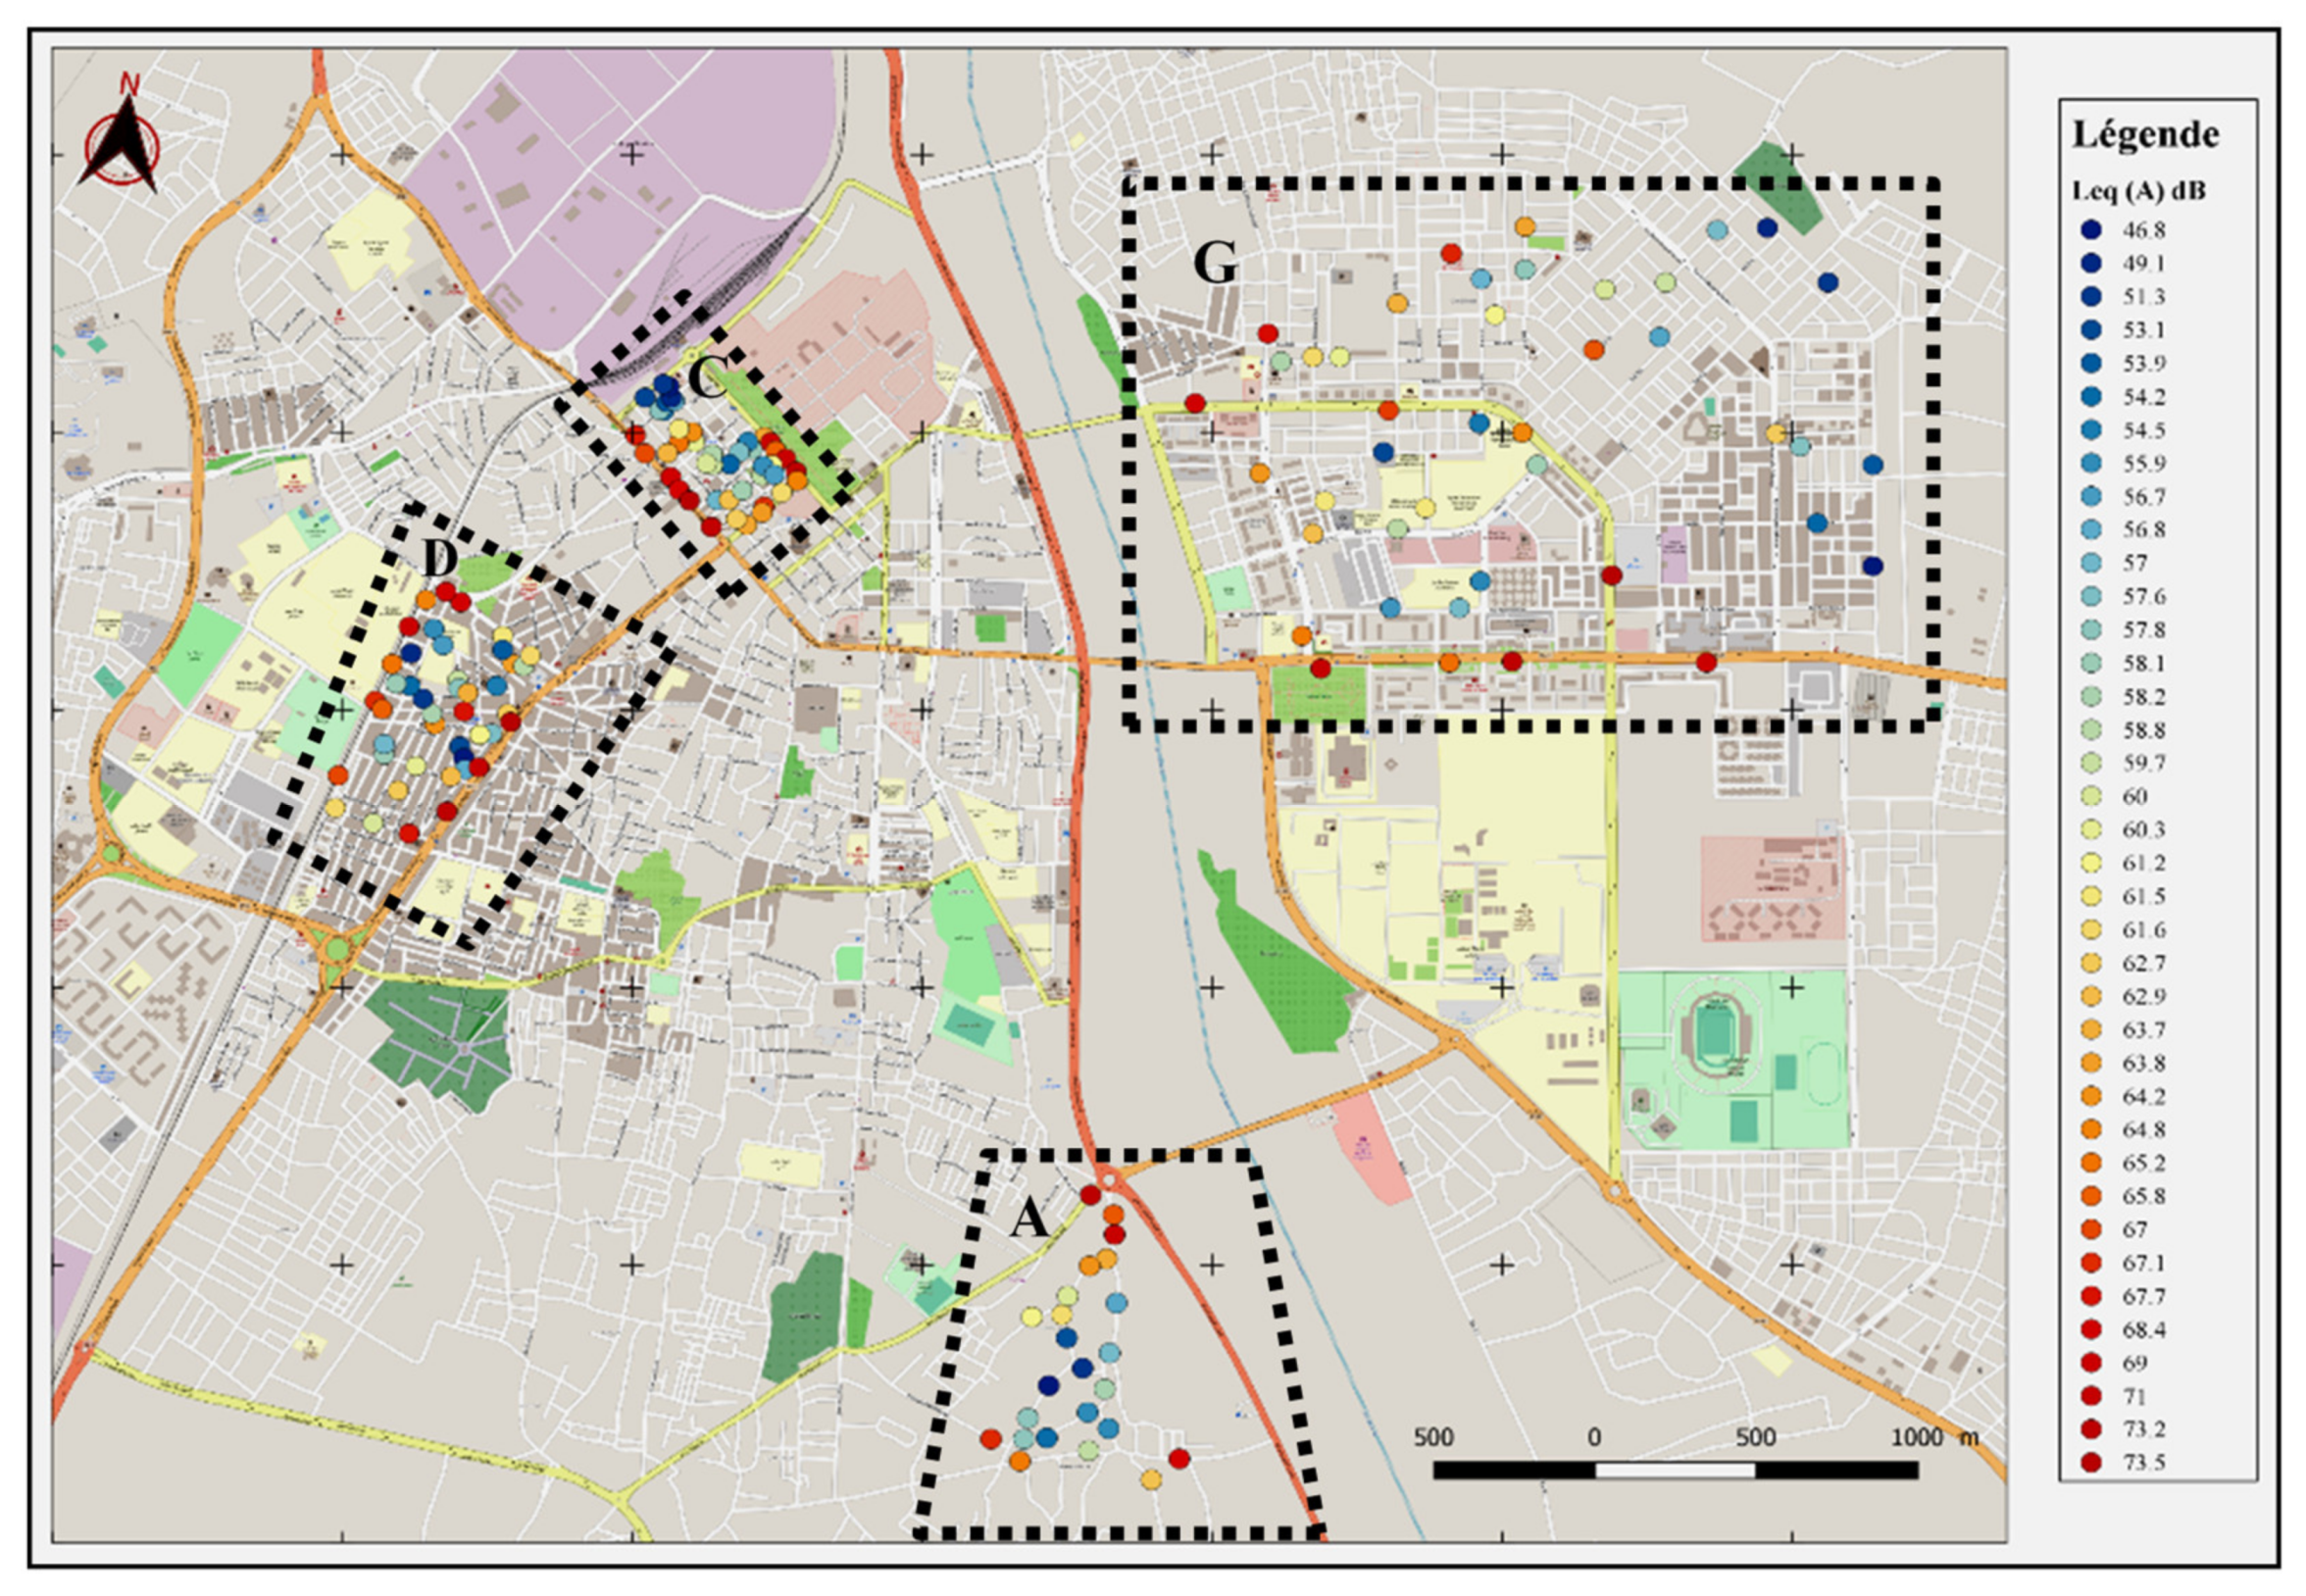
One hundred and fifty-four (154) points were selected to represent the four different types of neighbourhoods which cover the entire city of Biskra.
Figure 2 shows the positioning of the measurement stations. Each neighbourhood has their own specific building characteristics. However, the façade textures, building heights and building materials are similar for all neighbourhoods.
The measurement of sound pressure level (dB) was taken from several streets in all four different neighbourhoods of Biskra. A sound pressure level meter “LandtekSL5868P” was used with a time (Fast) and frequency (A) weighting [
39,
40,
41]. The value recorded represents the LAeq
1 min which is an equivalent continuous sound pressure level A-weighted of one minute. The protocol consists of a series of outdoor measurements taken manually. The sound pressure level meter was placed at a minimum distance of 2 m from all reflective obstacles, and at a height of 1.5 m from the ground [
42].
In line with a previous study [
40], the sound pressure level measured in the city of Biskra during the weekend is slightly lower compared to weekday, where the difference between the sound pressure level measured during the weekdays and at the weekend does not exceed 4 dB in 91.48% of the measured points [
40]. That is why all measurements were taken during the weekends and holidays, from 9 am to 12 pm as shown in
Table 1. Then, the measurements were plotted on a representative map of sound pressure level using the open source QGIS 2.18 software. In order to analyse the urban sound level, the measurements were compared to the WHO recommendations, which state that a serious annoyance in outdoor living area at day time starts at 55 dB [
43].
3. Results
As it turns out, correlations between sound pressure levels and degrees of spatial integration are not as simple as they seem in line with the space syntax theory of the natural movement. In line with earlier space syntax research, the correlation coefficient between global integration and connectivity matters for a neighbourhood’s degree of orientability [
14,
17,
21]. As our findings show for Biskra, the higher the correlation coefficient between street connectivity and global integration, the stronger the correlation between sound pressure levels and the various space syntax variables.
The following two types of space syntax analyses were carried out: an axial map derived from the all-lines analyses, and a hand drawn axial map converted into a segment map.
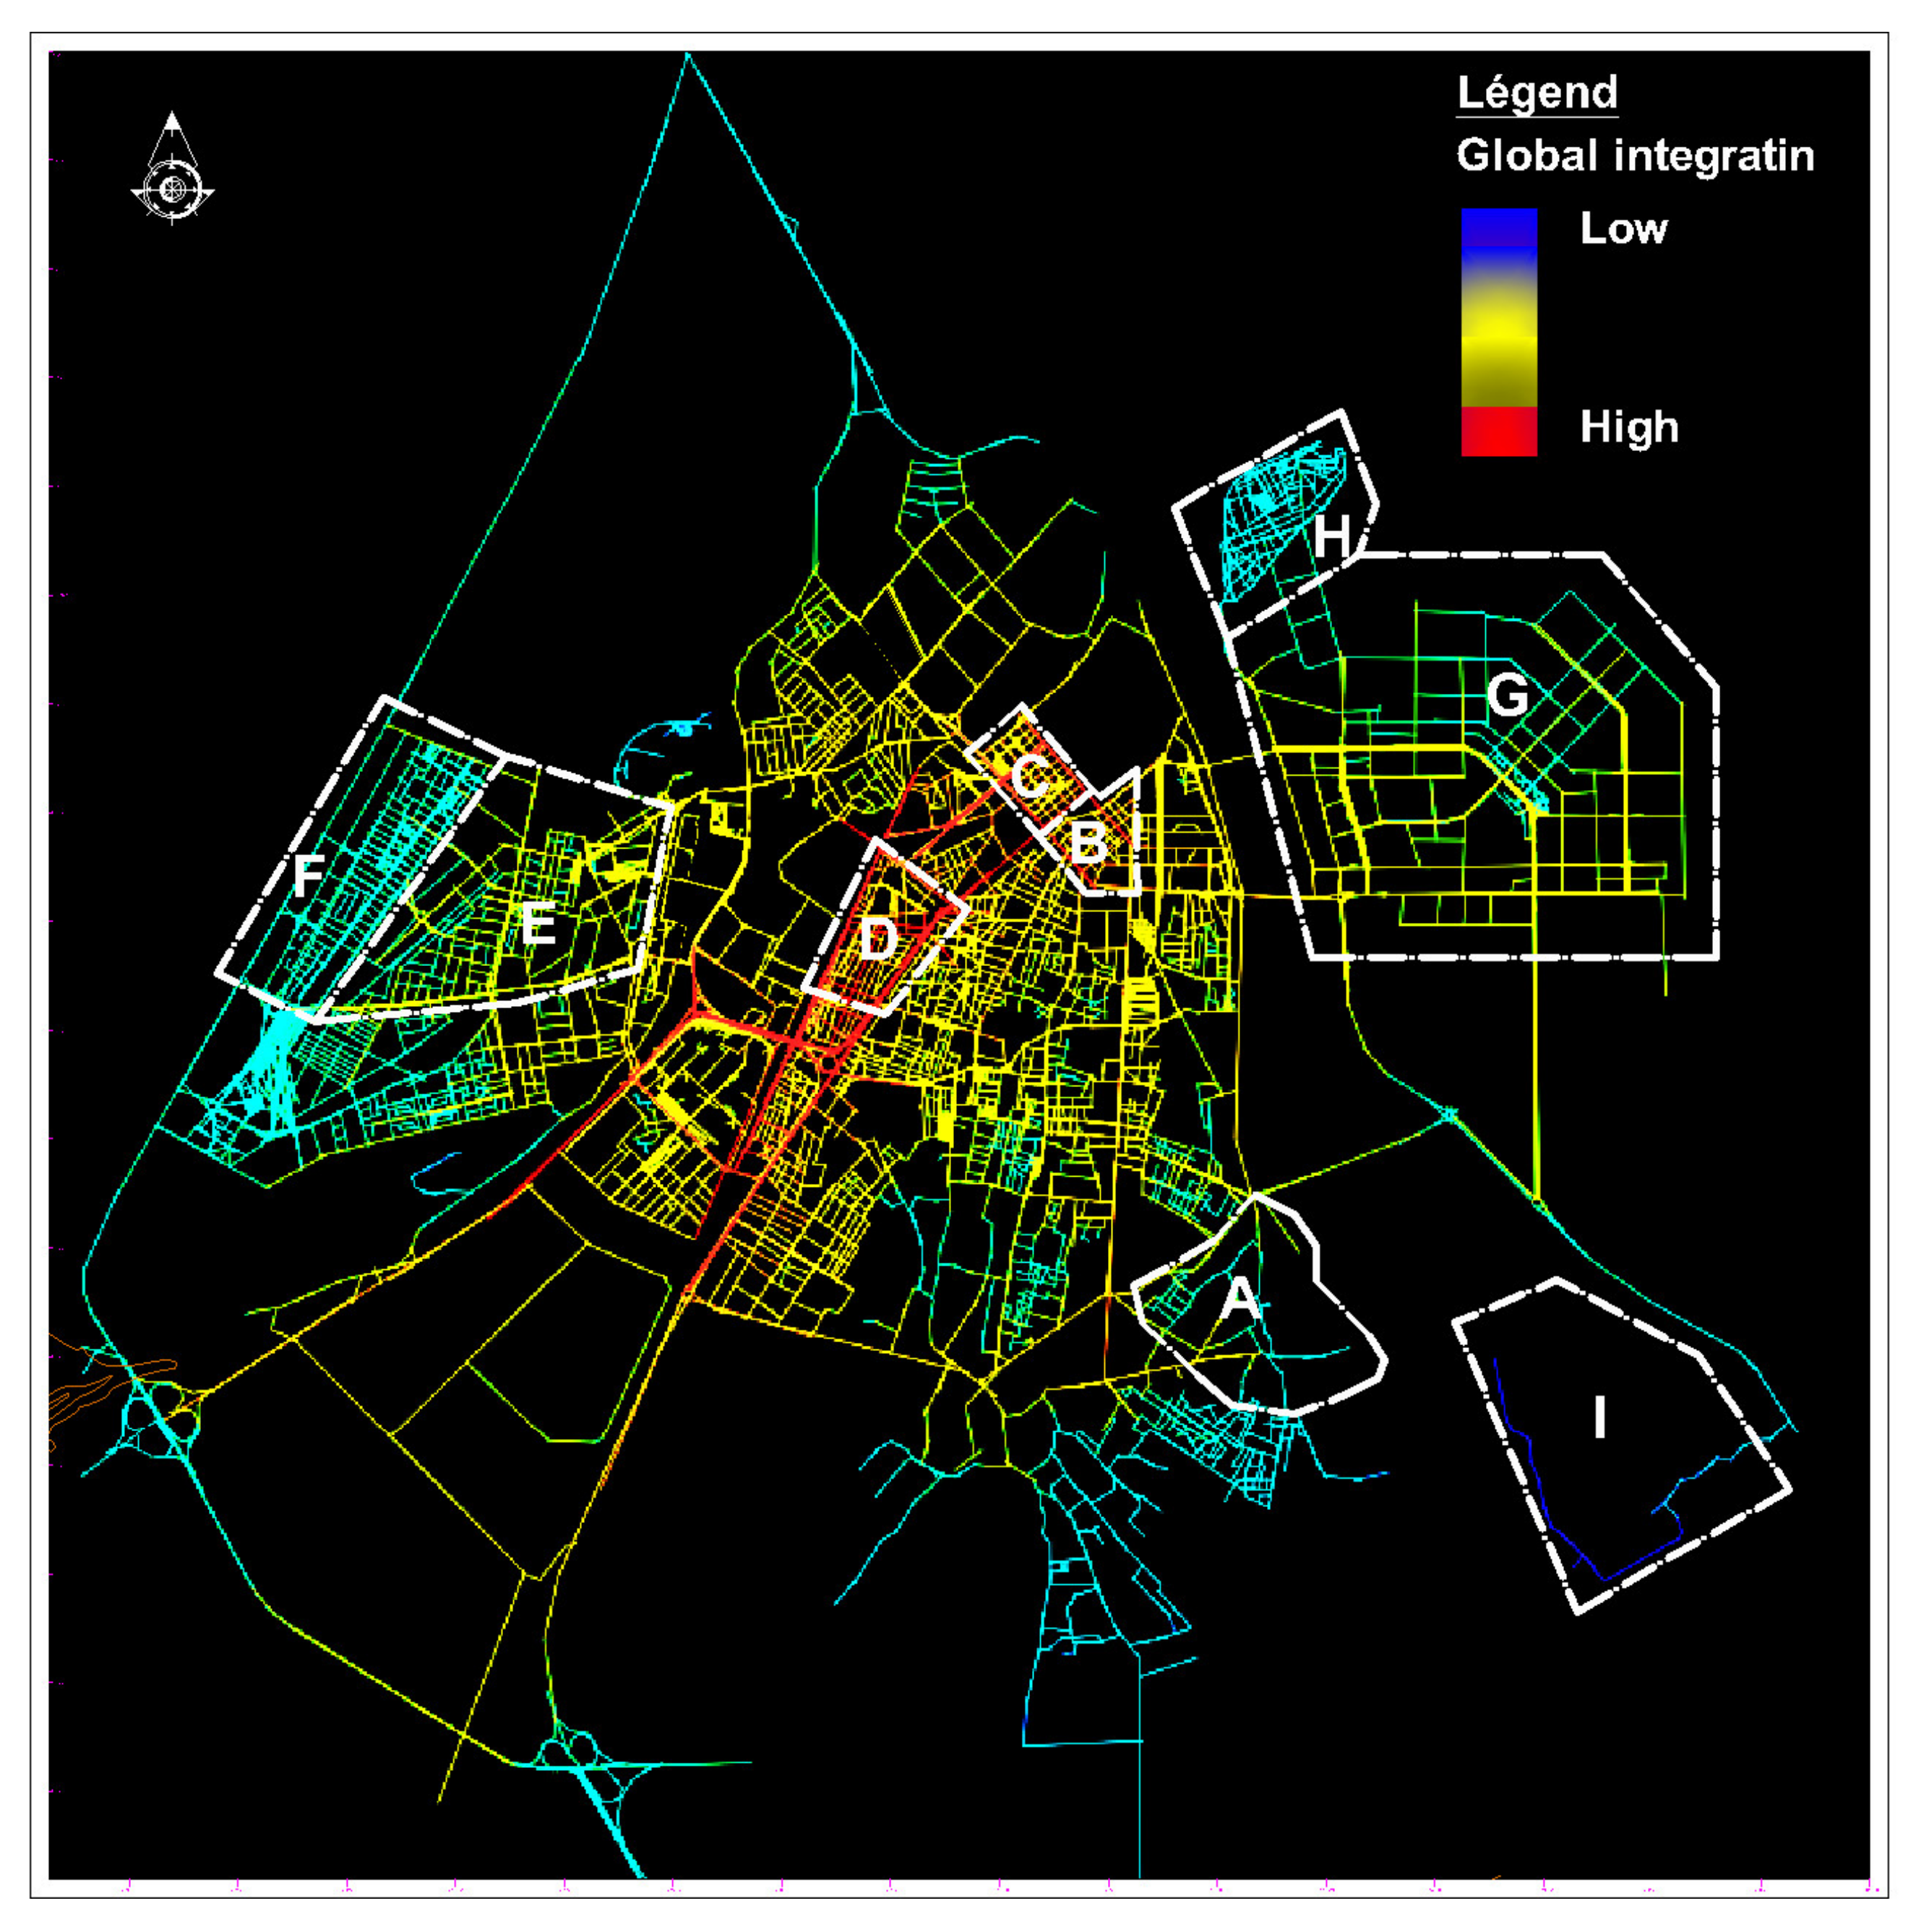
The axial map obtained from the all-lines analyses consists of a map made with the fewest lines from the all-lines map. The axial map of
Figure 3 represents the global integration analysis of Biskra. The values from the axial analyses are presented in a colour gradient, where the dark blue indicates the lowest integration values and the red indicate the highest. The city centre has the highest global integration values.
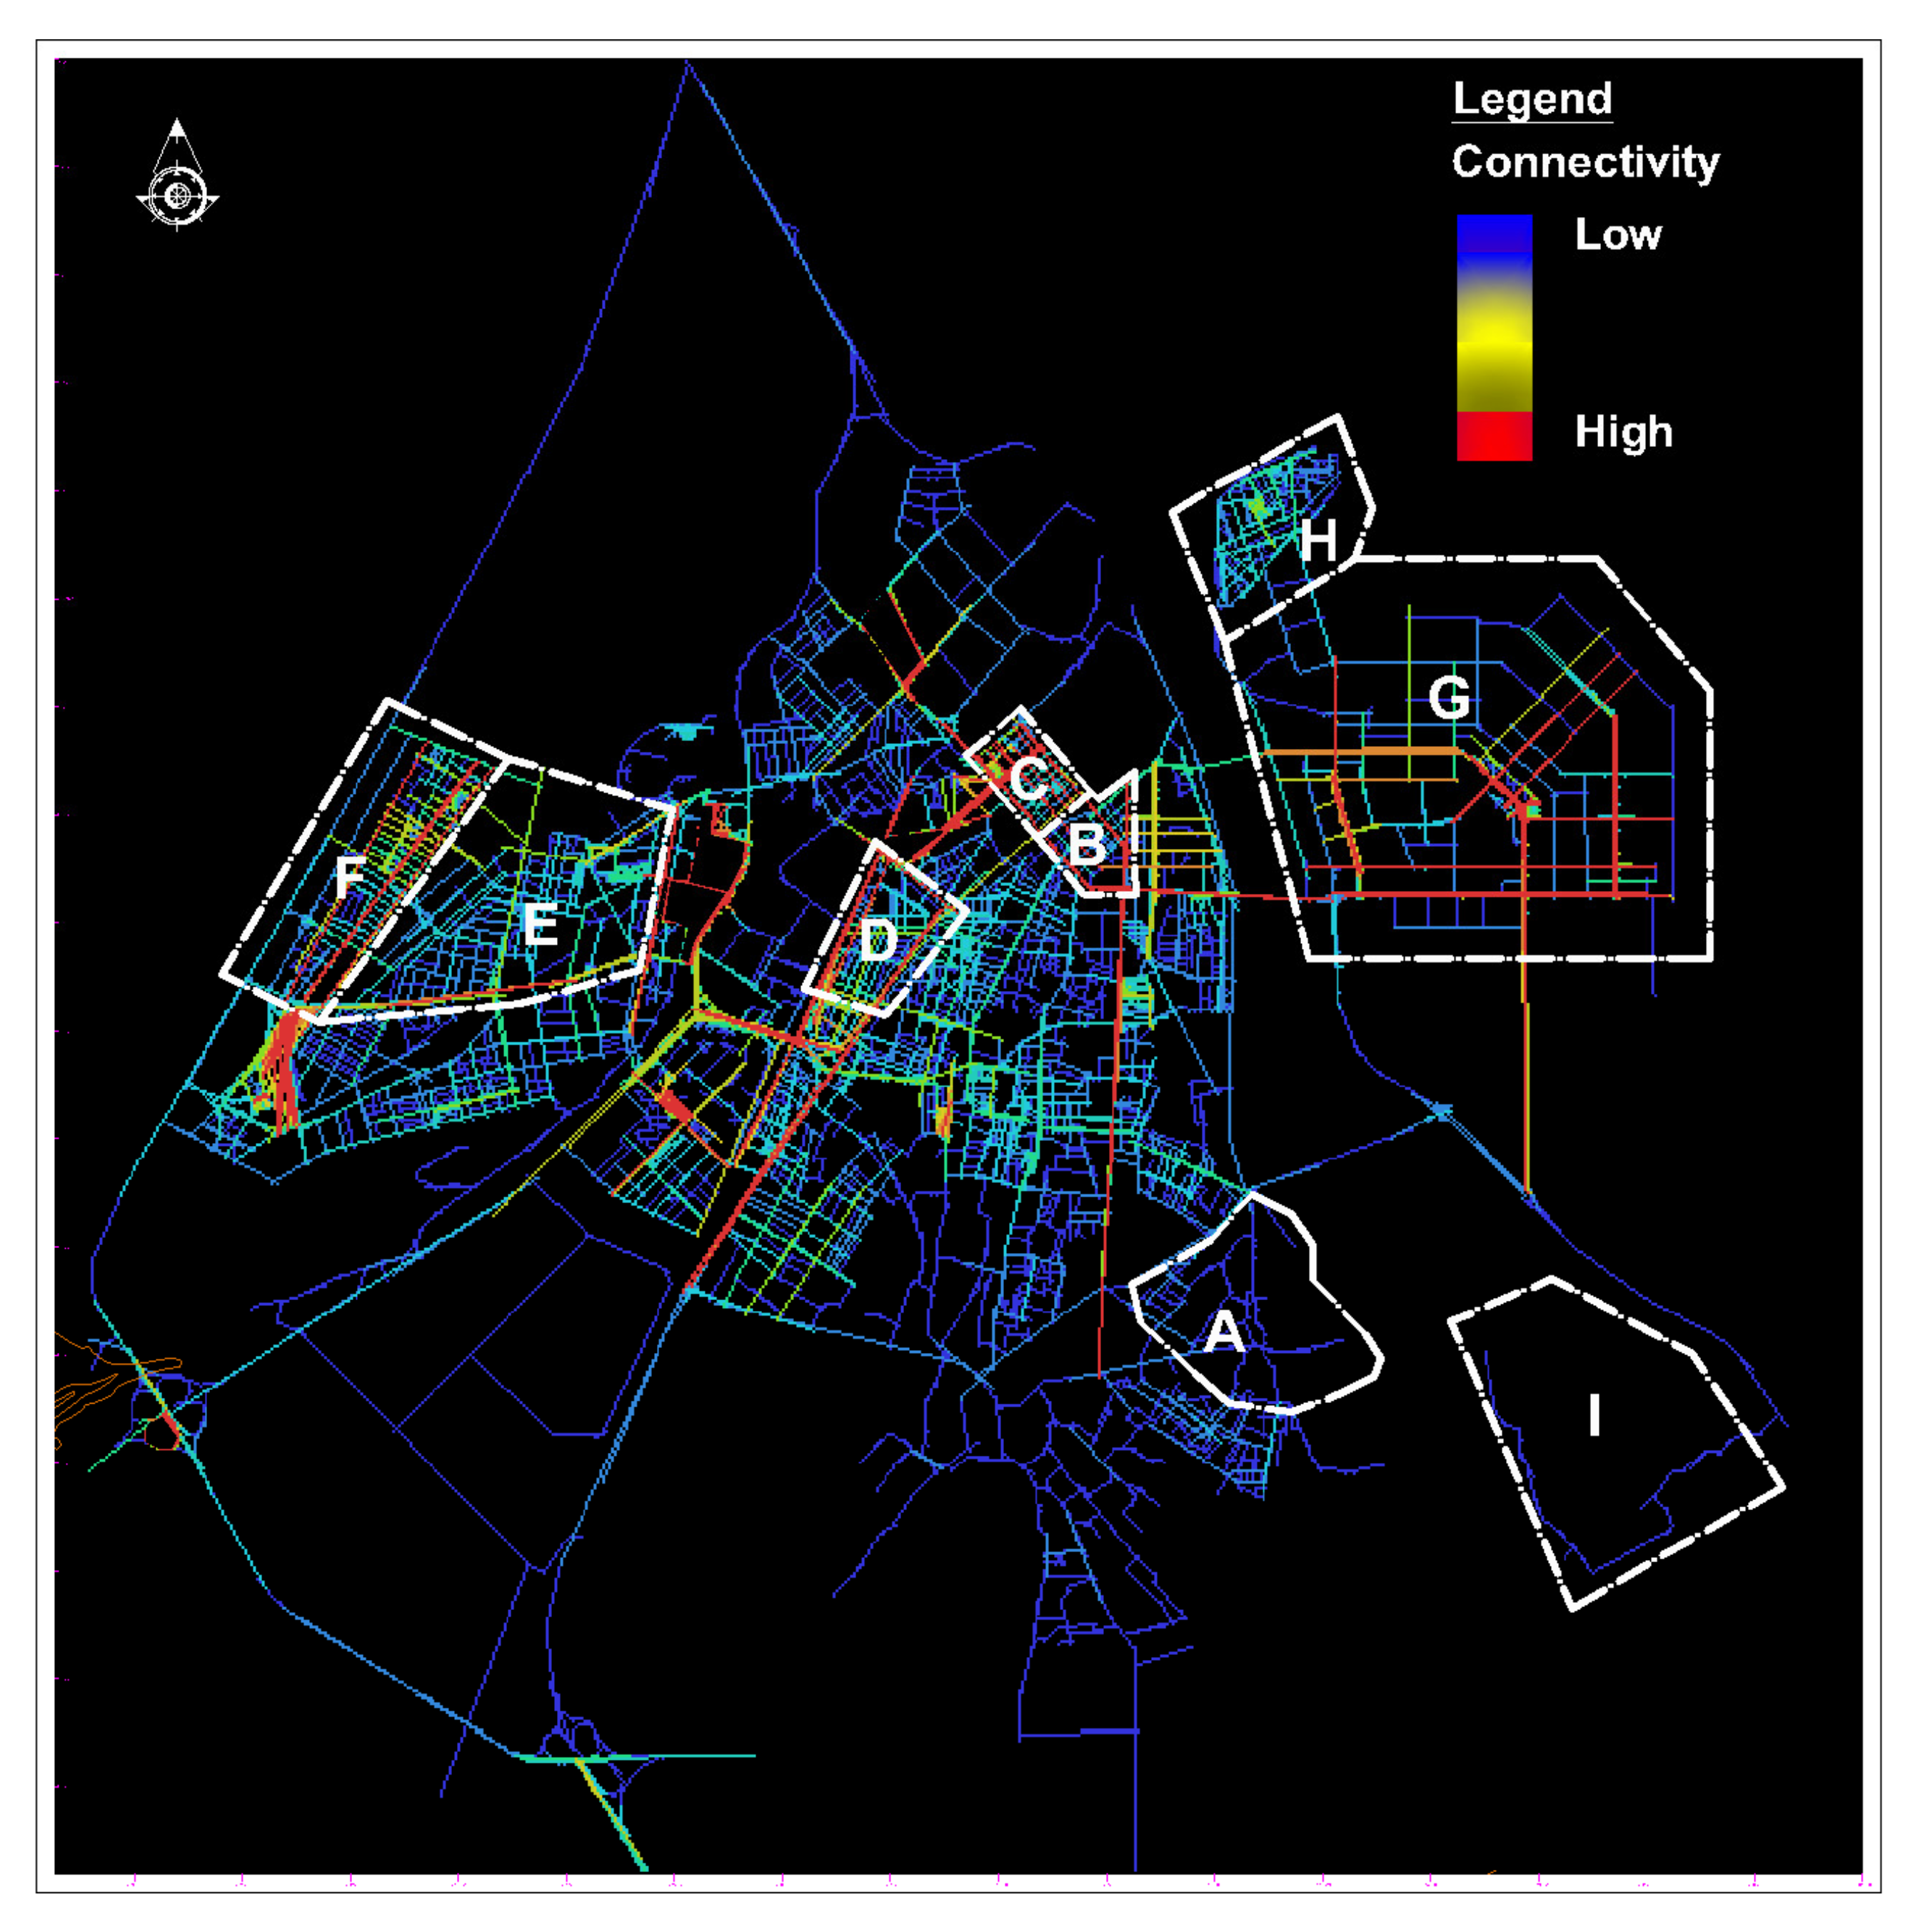
Figure 4 shows the connectivity map of the city. The connectivity analyses reveal the number of direct connections each street has to its side streets. The red coloured axes in
Figure 4 show the streets with the highest number of connections in Biskra.
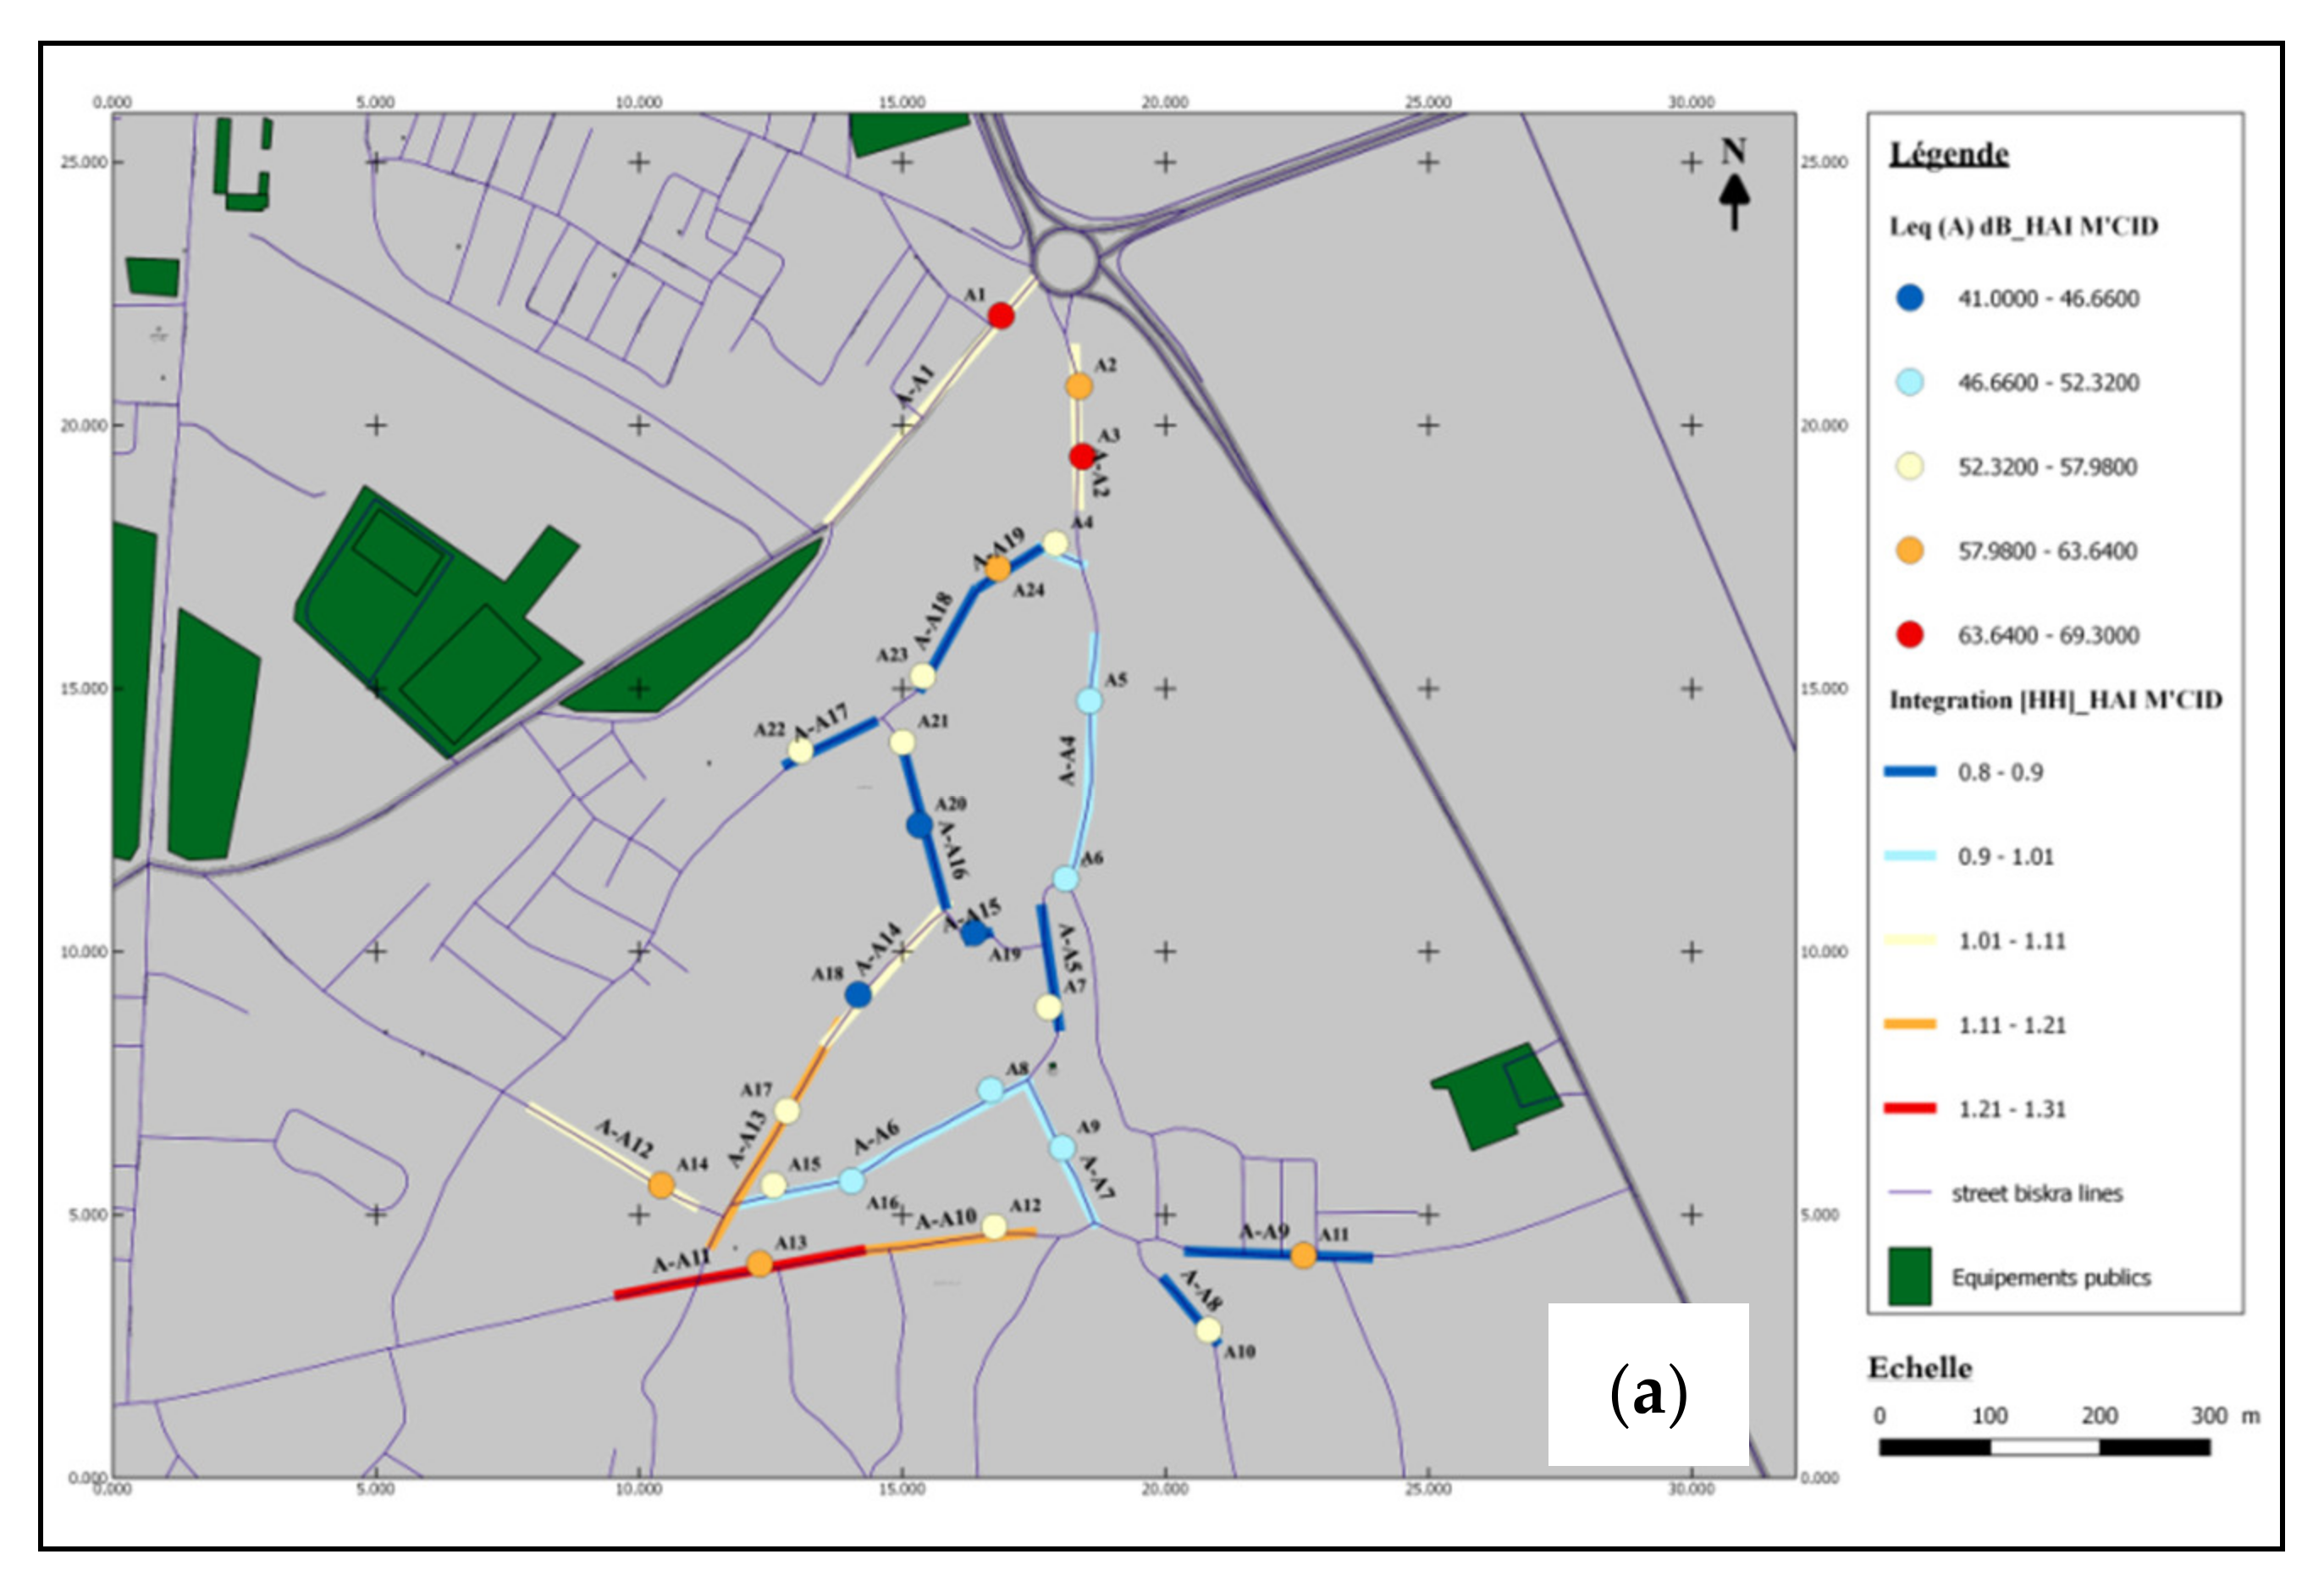
Table 2 shows that the old neighbourhoods of Feliche (I) and M’cid (A) contain axial lines with the lowest global integration values of 0.257 and 0.528, respectively, corresponding with the lowest average global integration values of Biskra (0.401 and 0.909). The unplanned neighbourhood of Ferhat (D) contains the axis with the highest value of global integration (1.692). The highest average value of global integration (1.454) is recorded in the colonial neighbourhood La Gare (C). The planned post-independence neighbourhood ZHUN West (E) and ZHUN East (G) have an average global integration value close to that of the city (1.040 to 1.022). Based on these results, four types of neighbourhoods were selected according to the area and the global integration values as shown in
Table 3.
Based on the results of global integration, the selected neighbourhoods can be defined and classified according to their accessibility. By comparing the selected neighbourhoods with one another, the lowest accessible neighbourhood corresponds to that of Old Biskra, represented by the M’cid (A) neighbourhood. The colonial La Gare (C) and the unplanned post-independence Ferhat (D) neighbourhoods are the most accessible. The planned neighbourhood ZHUN East (G) from the post-independence time period has an average accessibility (
Table 3).
According to the results (
Table 3), the degree of spatial intelligibility can be evaluated by the correlation between the global integration and the connectivity analyses. When the ratio of the correlation (R²) is high, the spatial configuration has higher levels of intelligibility. The graph in
Figure 5 shows the correlation line of the selected neighbourhoods.
The neighbourhoods La Gare (C), Ferhat (D), Hai M’cid (A), and ZHUN East (G) are classified from the highest to the lowest according to R
2 values. As a consequence, La Gare (C) is the most intelligible neighbourhood, implying a high level of orientability (
Table 3).
3.1. Sound Pressure Level Measurements
Figure 5 and
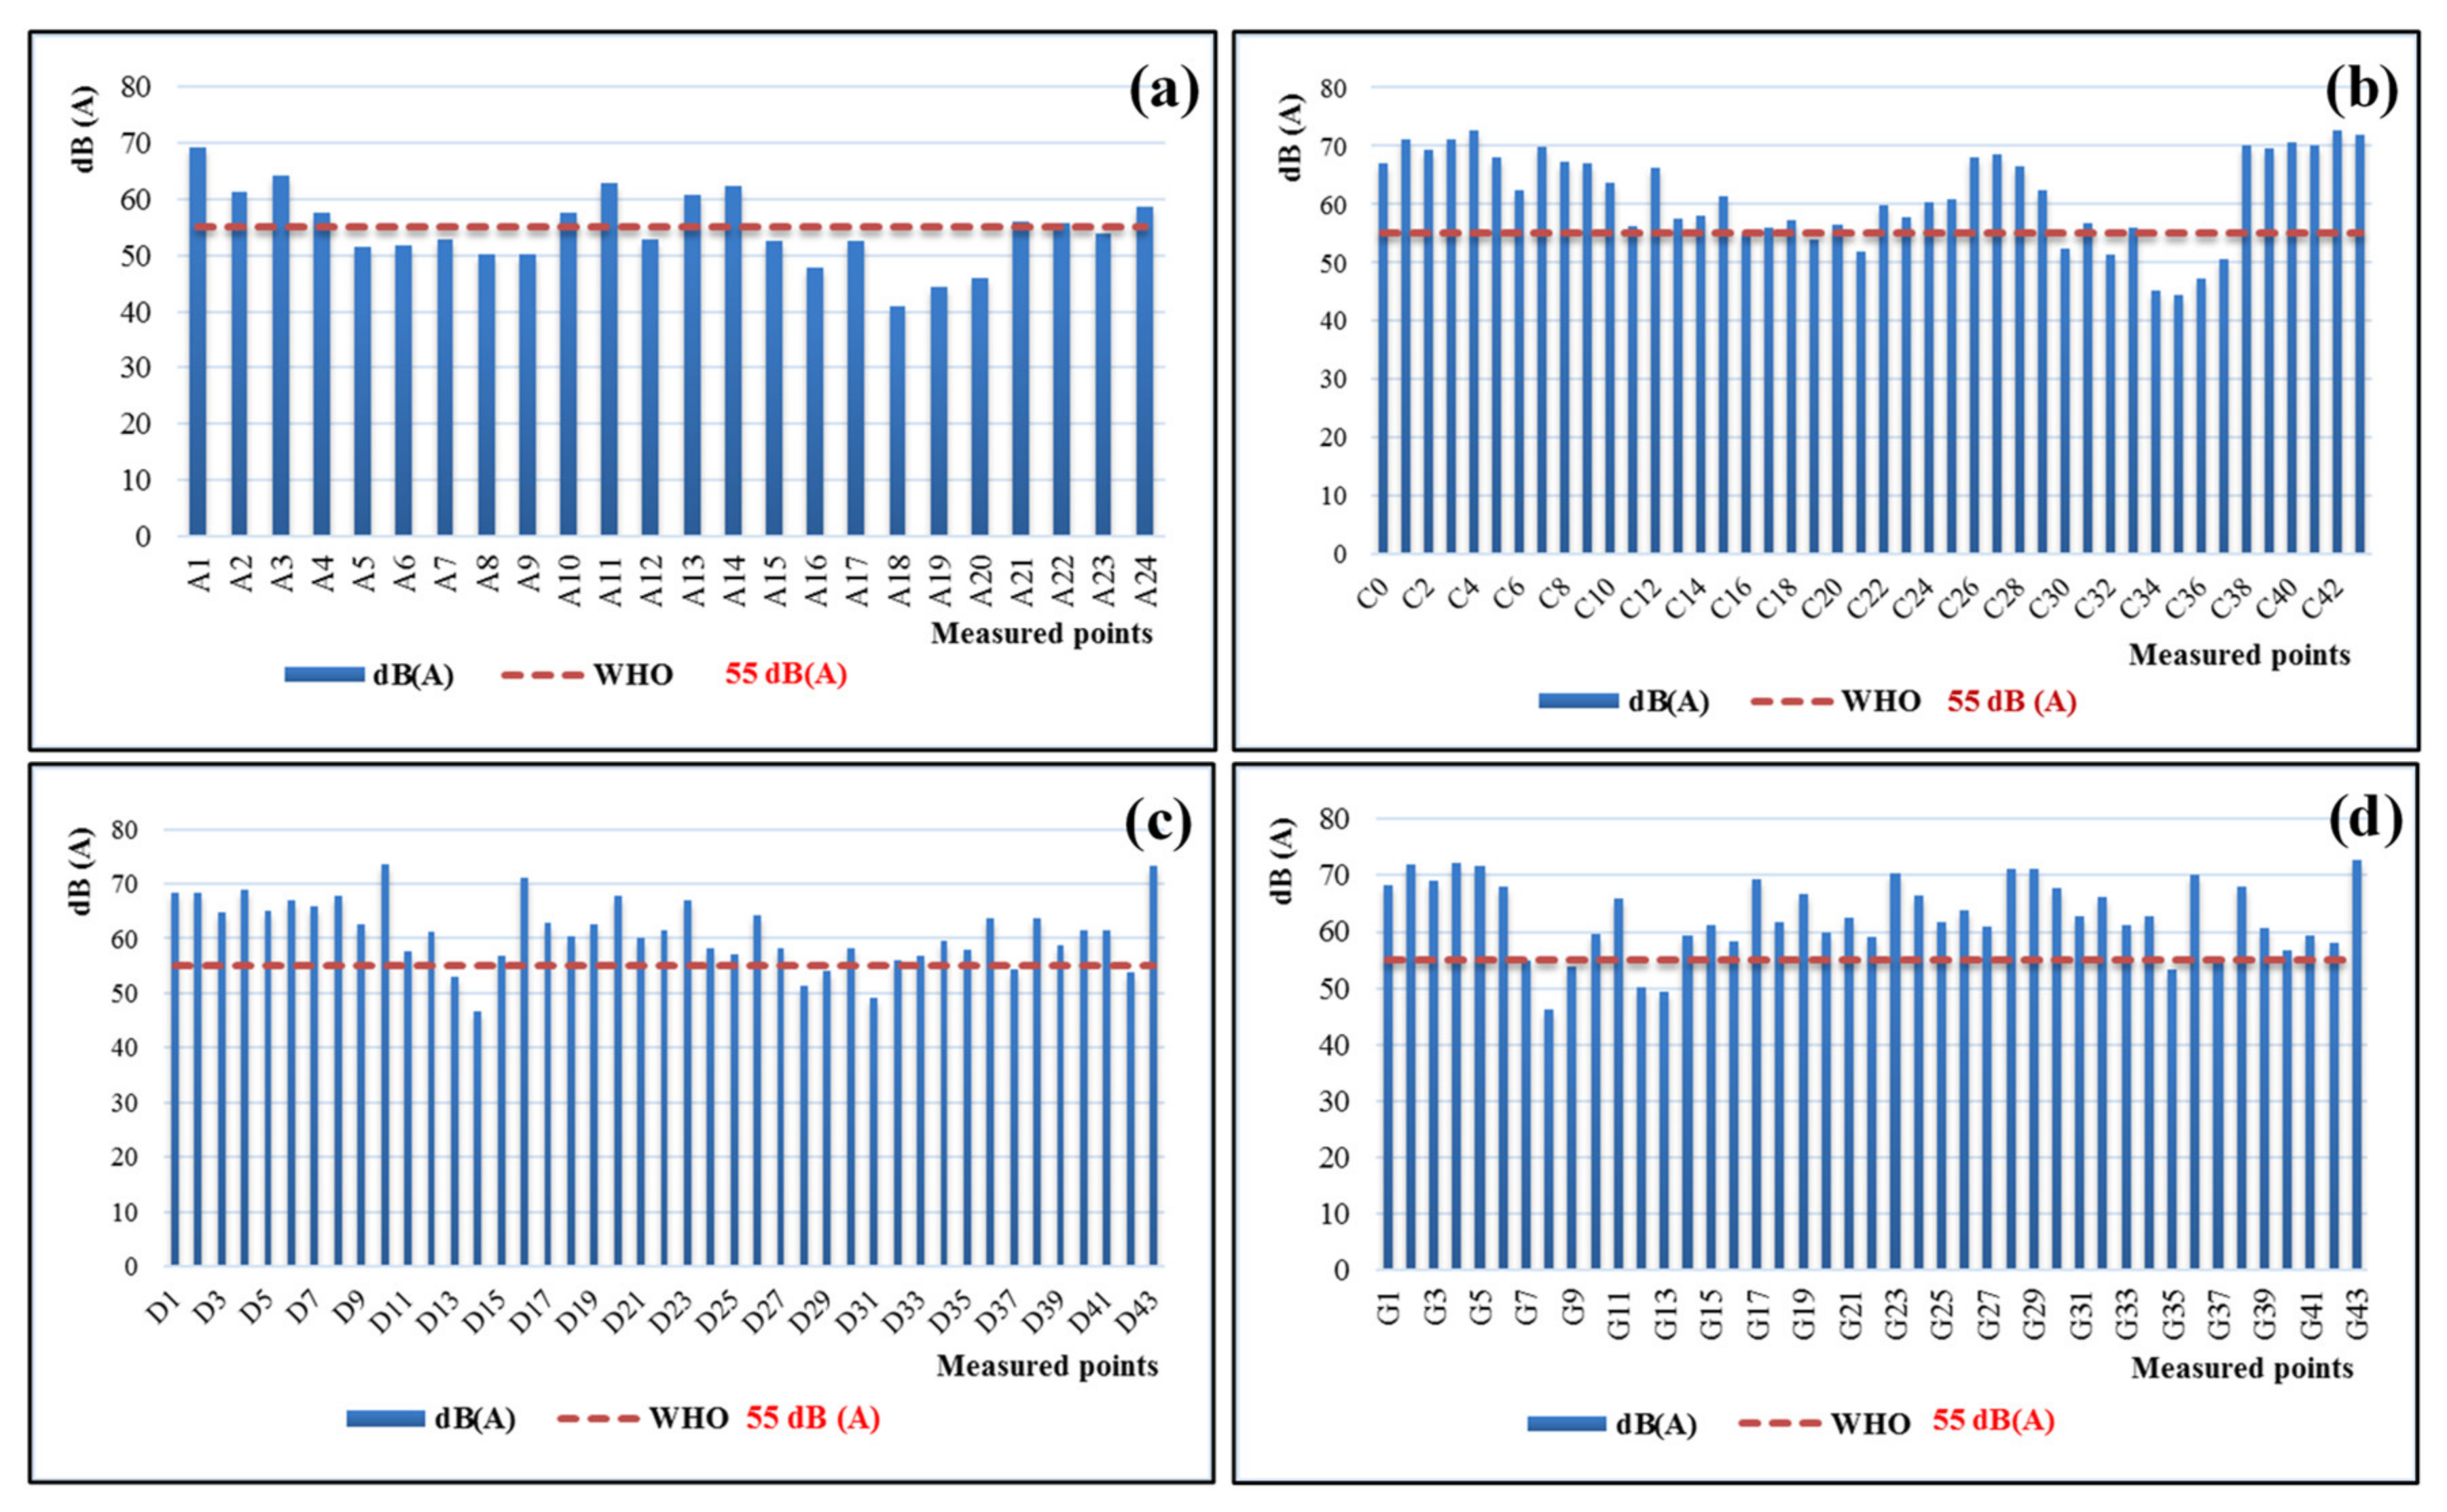
Table 4 summarise the overall results of the noise measurements. The sound pressure level of Biskra during the weekend varies between 41.0 dB (Hai M’cid (A) at station N° A18) and 73.5 dB (Hai Ferhat (D) at station N° D10). The average sound level of Biskra is estimated to be 60.1 dB. Hai M’cid (A) has the lowest average sound pressure level (54.7 dB), and ZHUN East (D) has the highest average sound pressure level (62.8 dB).
Figure 6 shows that the majority of the measured points in the selected neighbourhoods, Hai M’cid (A) (58%), La Gare (C) (86%), Hai Ferhat (D) (86%), and ZHUN East (G) (88%) exceed the limit recommended by WHO (55 dB). As a consequence, the neighbourhoods Hai M’cid (A), La Gare (C), Ferhat (D), and ZHUN East (G) are classified from the calmest to the noisiest. The red dotted line marks the accepted noise limitation from the WHO. As can be seen from the table, the noise level from several of the recorded points exceeds the WHO noise level norm.
3.2. The Relationship between Sound Pressure Level and the Classic Space Syntax Analyses
The next step is to correlate the results from the noise recordings with the various spatial integration values. First, the results from the classic axial analyses are presented and later the results from the normalised angular choice (NACH) and normalised angular segment integration (NAIN) are presented.
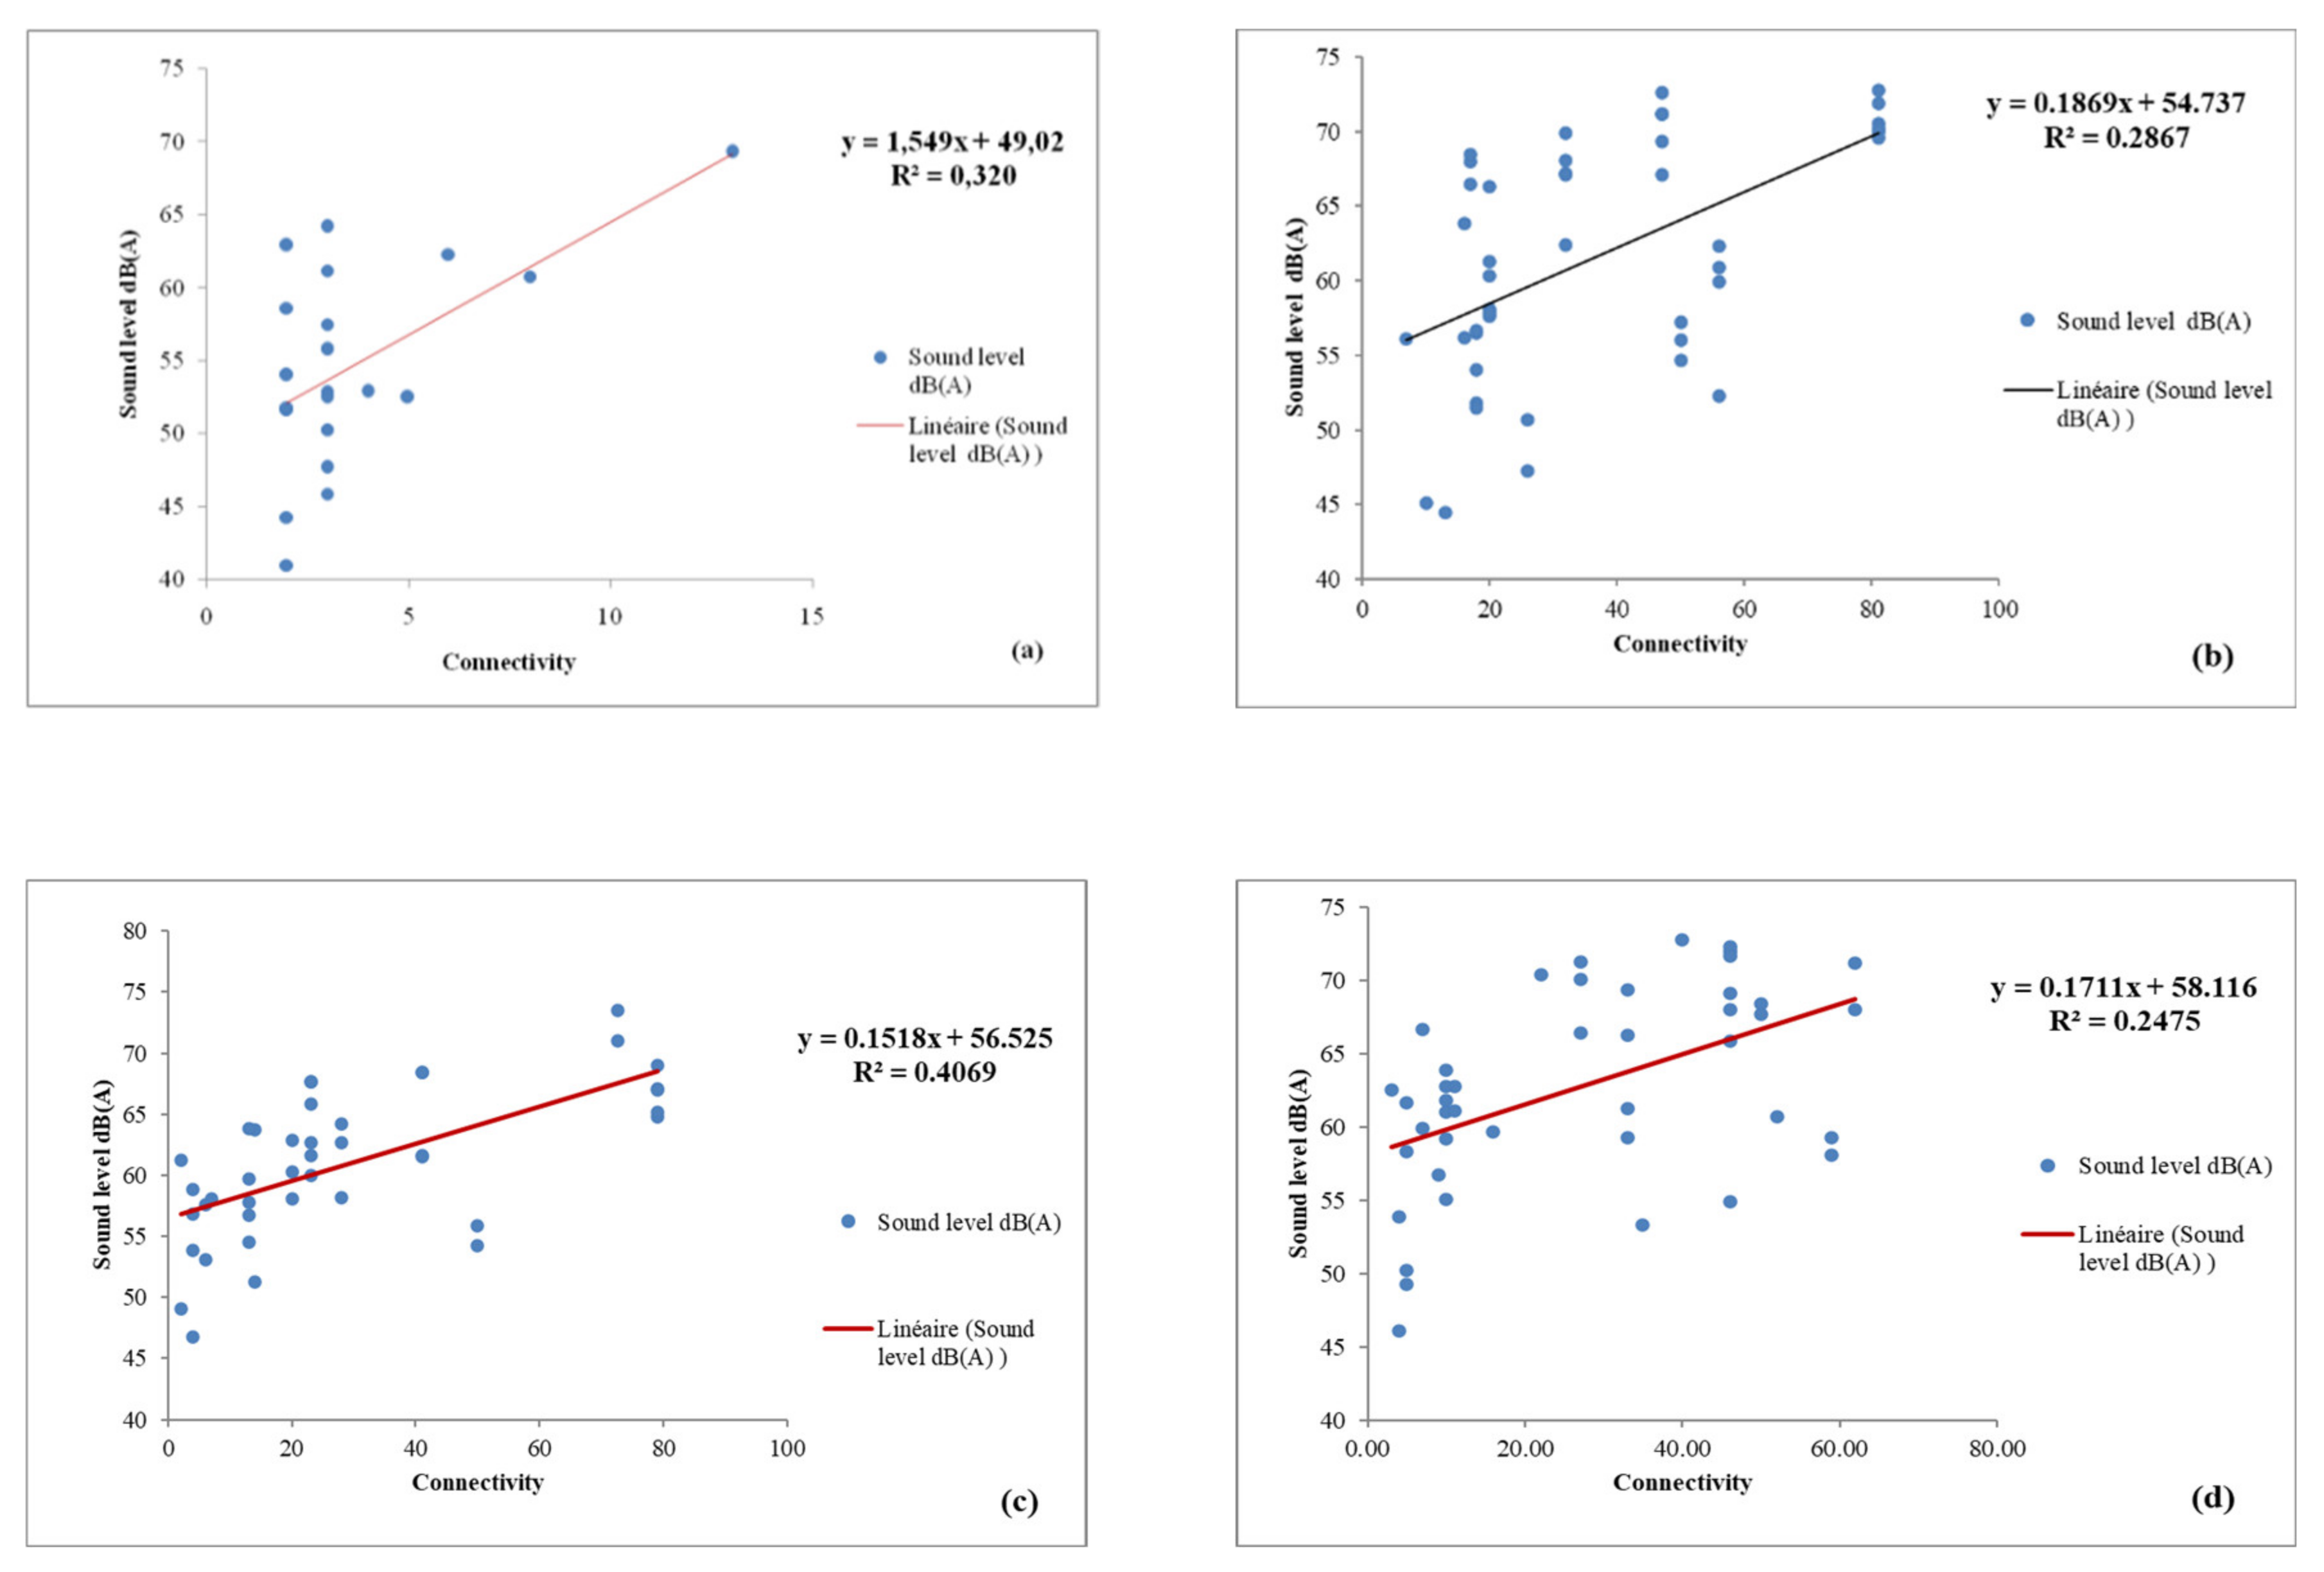
Comparison of the sound pressure level and global integration factor of representative streets from each selected neighbourhood shows that axial lines with a low global integration value correspond to streets with low sound pressure levels in the neighbourhoods of La Gare (C) and Hai Ferhat (D). Likewise, axial lines with high global integration values correspond to streets with high sound pressure level.
Figure 7a visualises levels of spatial integration with sound pressure levels in the neighbourhood La Gare (C), whereas the graph in
Figure 7b represents the correlation line.
The streets of the neighbourhood La Gare (C) reveal a strong, positive, and significant correlation relationship [r = 0.83,
n =42,
p = 6 e−12] between levels of spatial integration and sound pressure levels. The lower the axial global integration is, the quieter the street. This is visualised in
Figure 7a. The red lines represent the spatially highest integrated streets, and the red dots are the points with the highest recorded sound pressure. Conversely, the blue lines are the spatially lowest integrated streets and the blue dots are the points with the lowest recorded sound pressure.
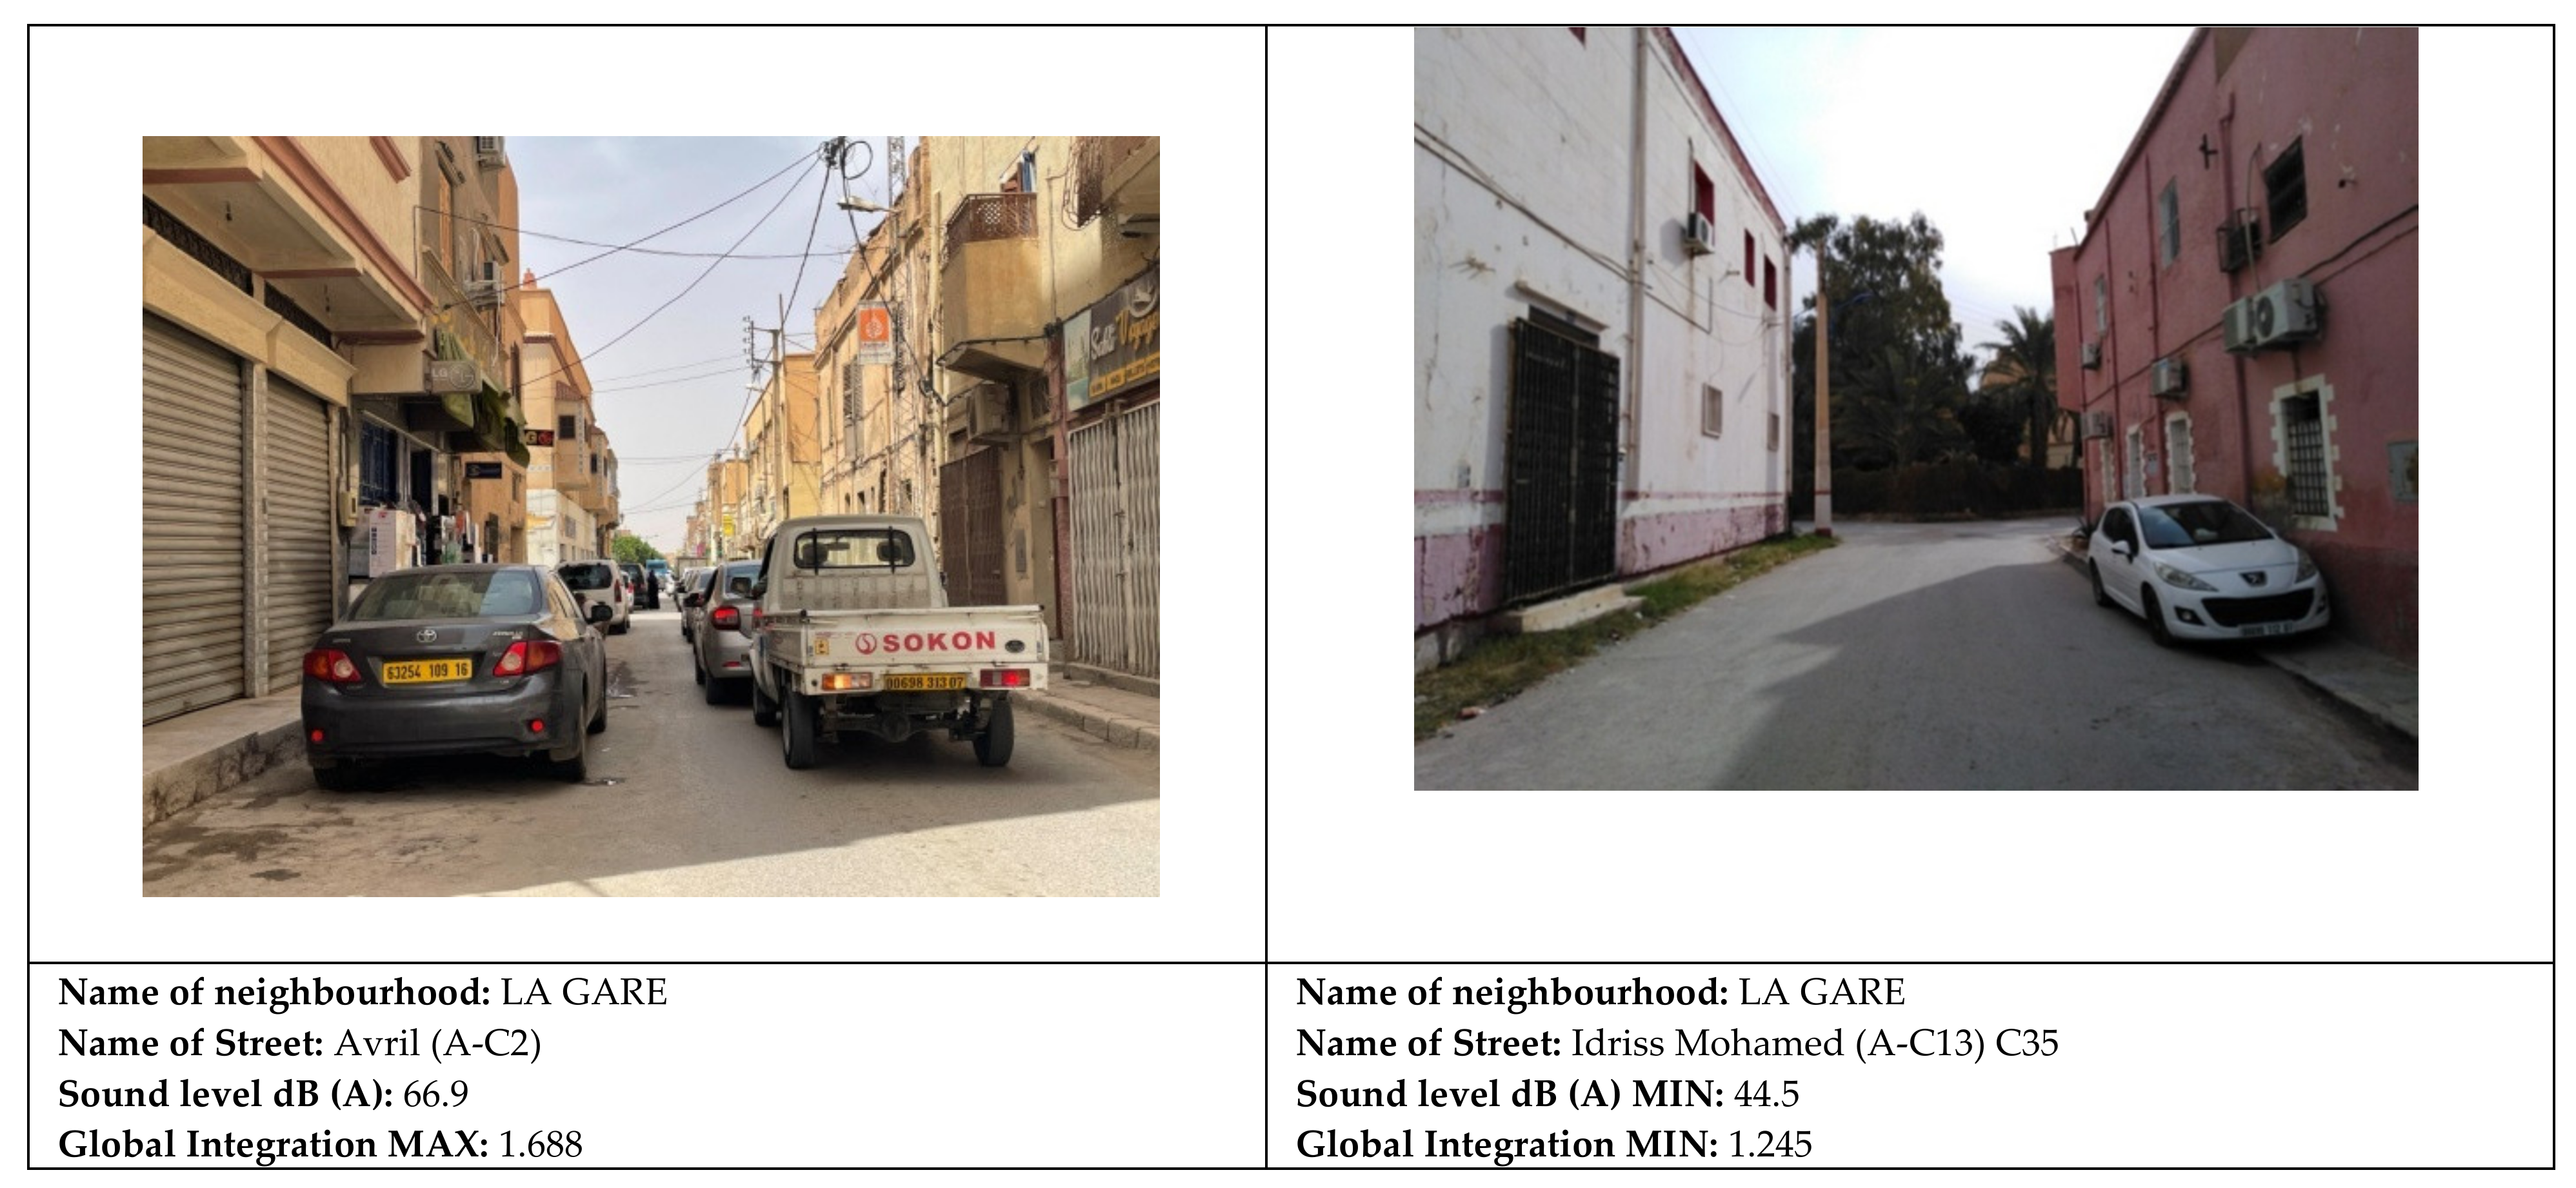
Figure 8 shows an image from the noisiest and highest spatially integrated street (left) and the quietest and lowest spatially integrated street of La Gare.
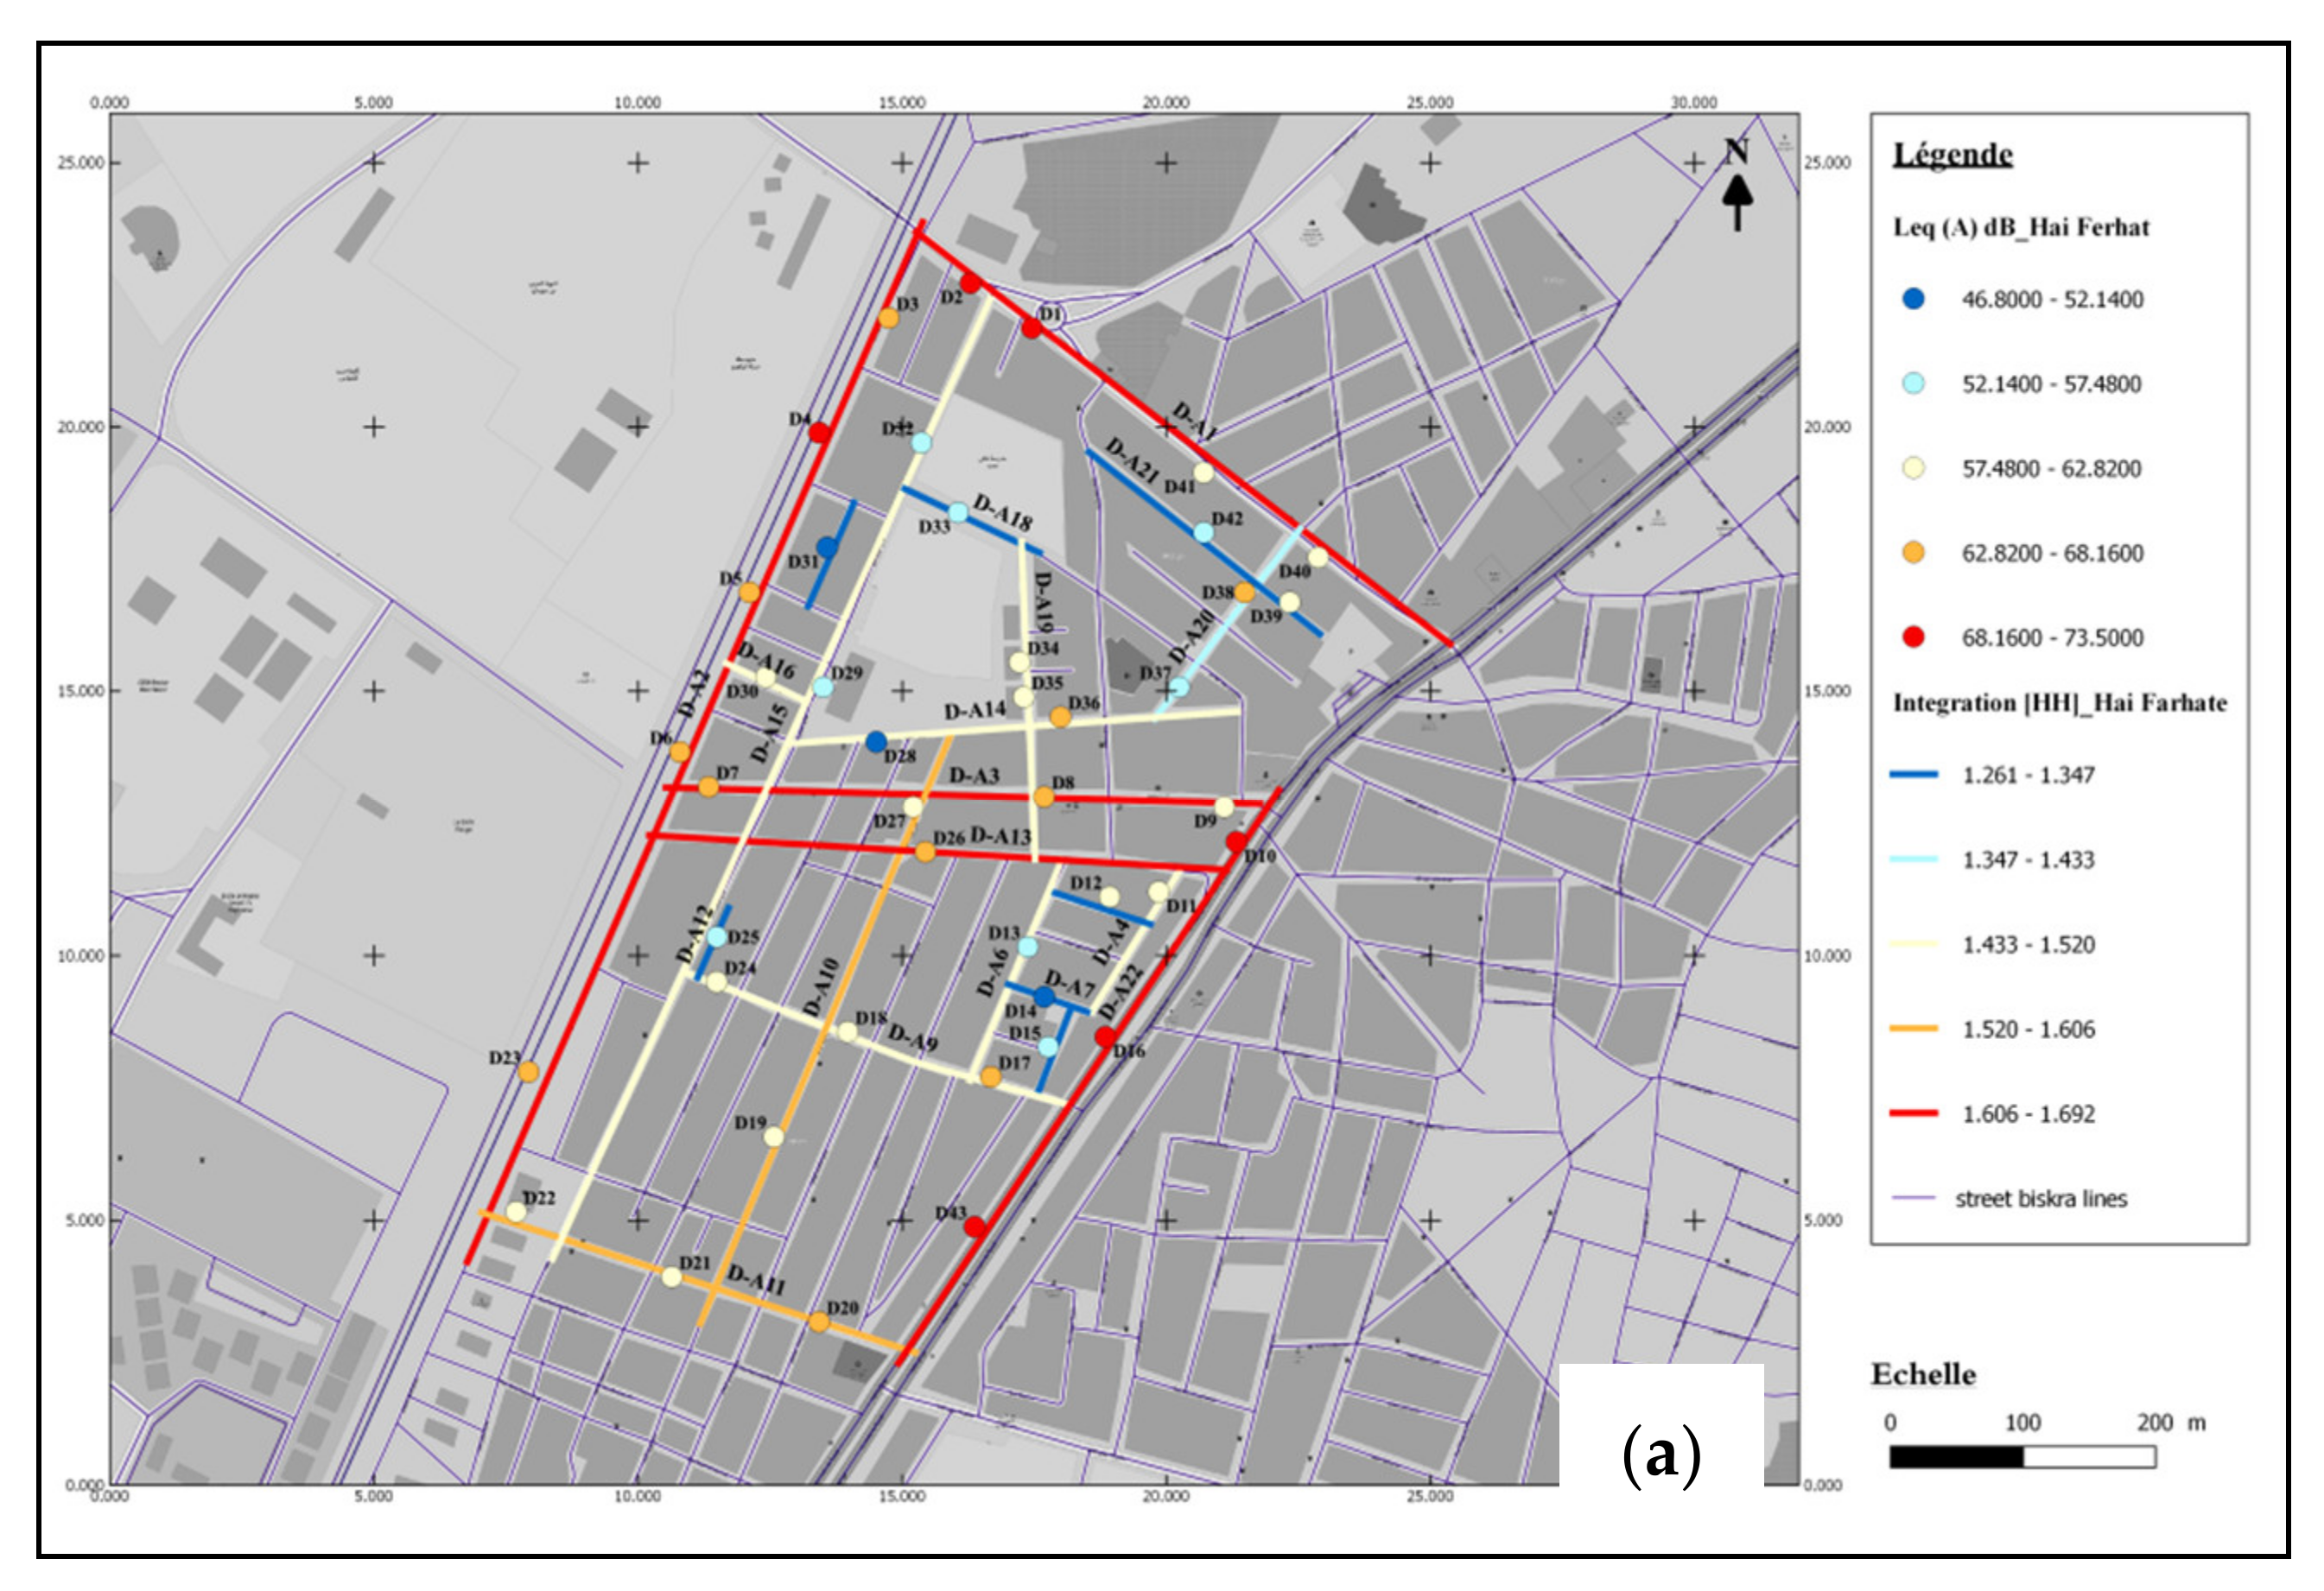
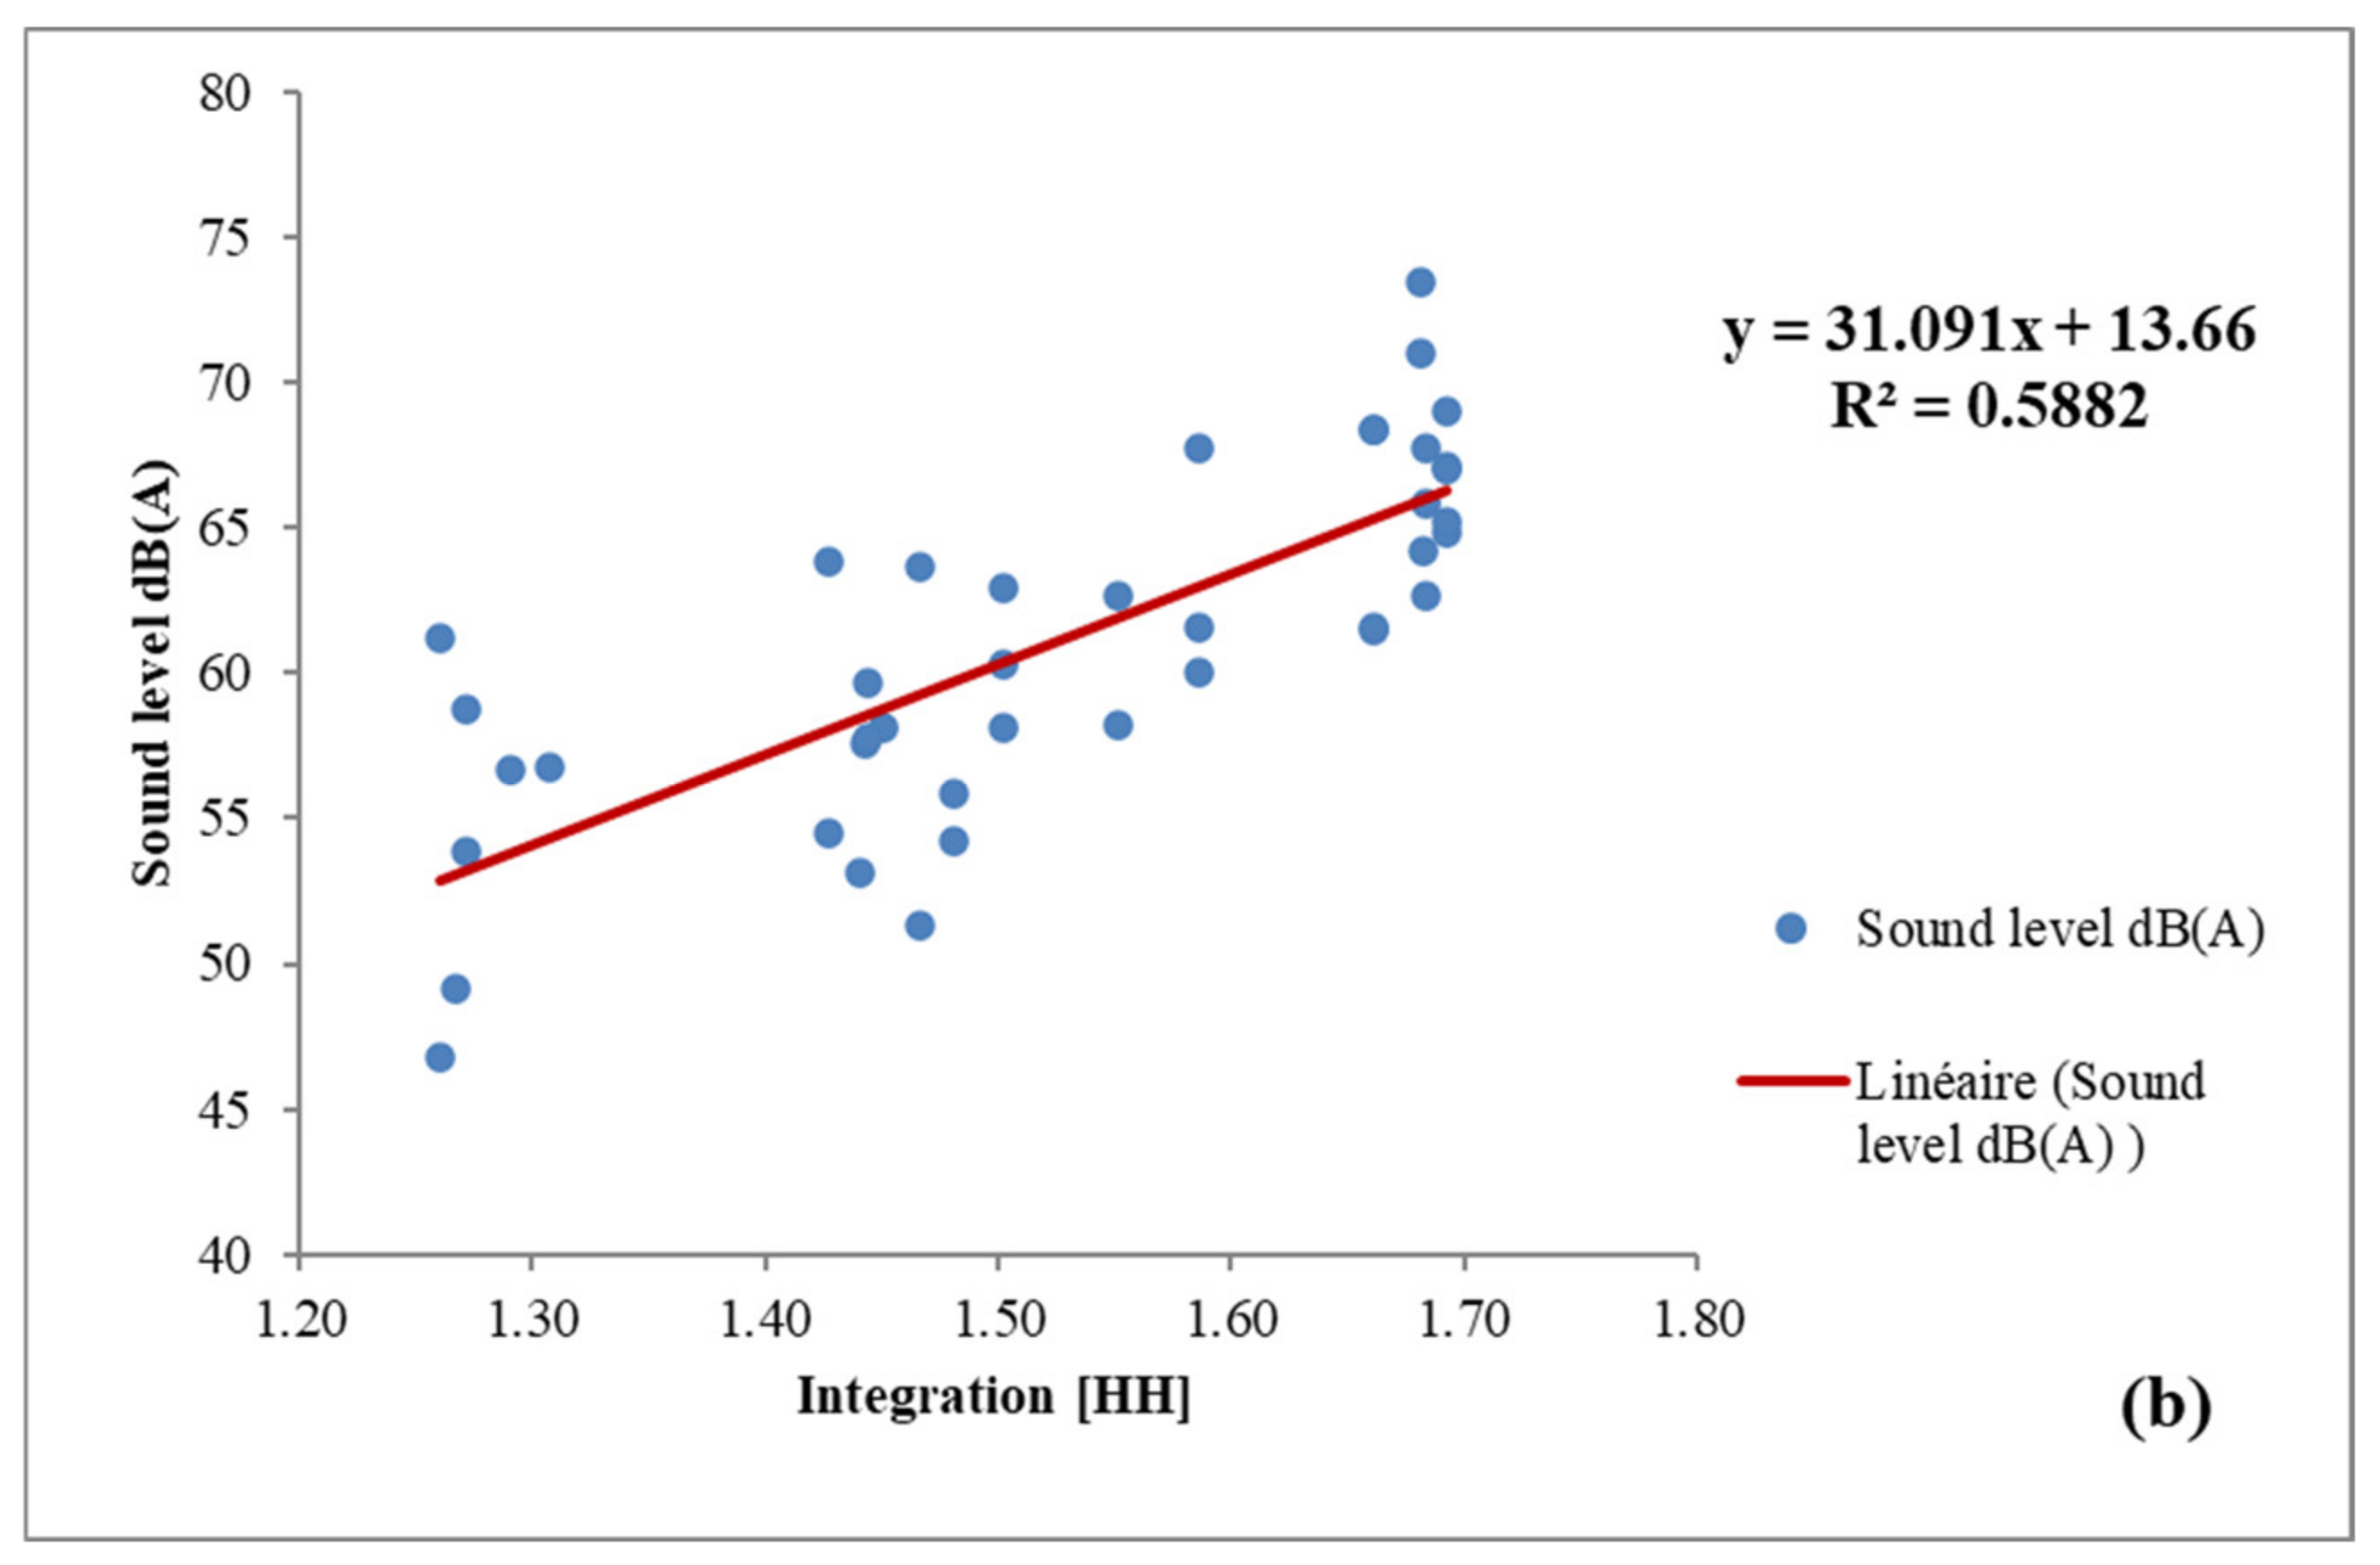
Figure 9 shows that the streets of the neighbourhood Hai Ferhat (D) demonstrate a strong correlation between global integration and sound pressure level values, except for certain axial lines that have some inconsistencies. This correlation is visualised in
Figure 9a. Here the level of spatial integration correlates with sound pressure levels in most streets with a R
2 = 0.5882.
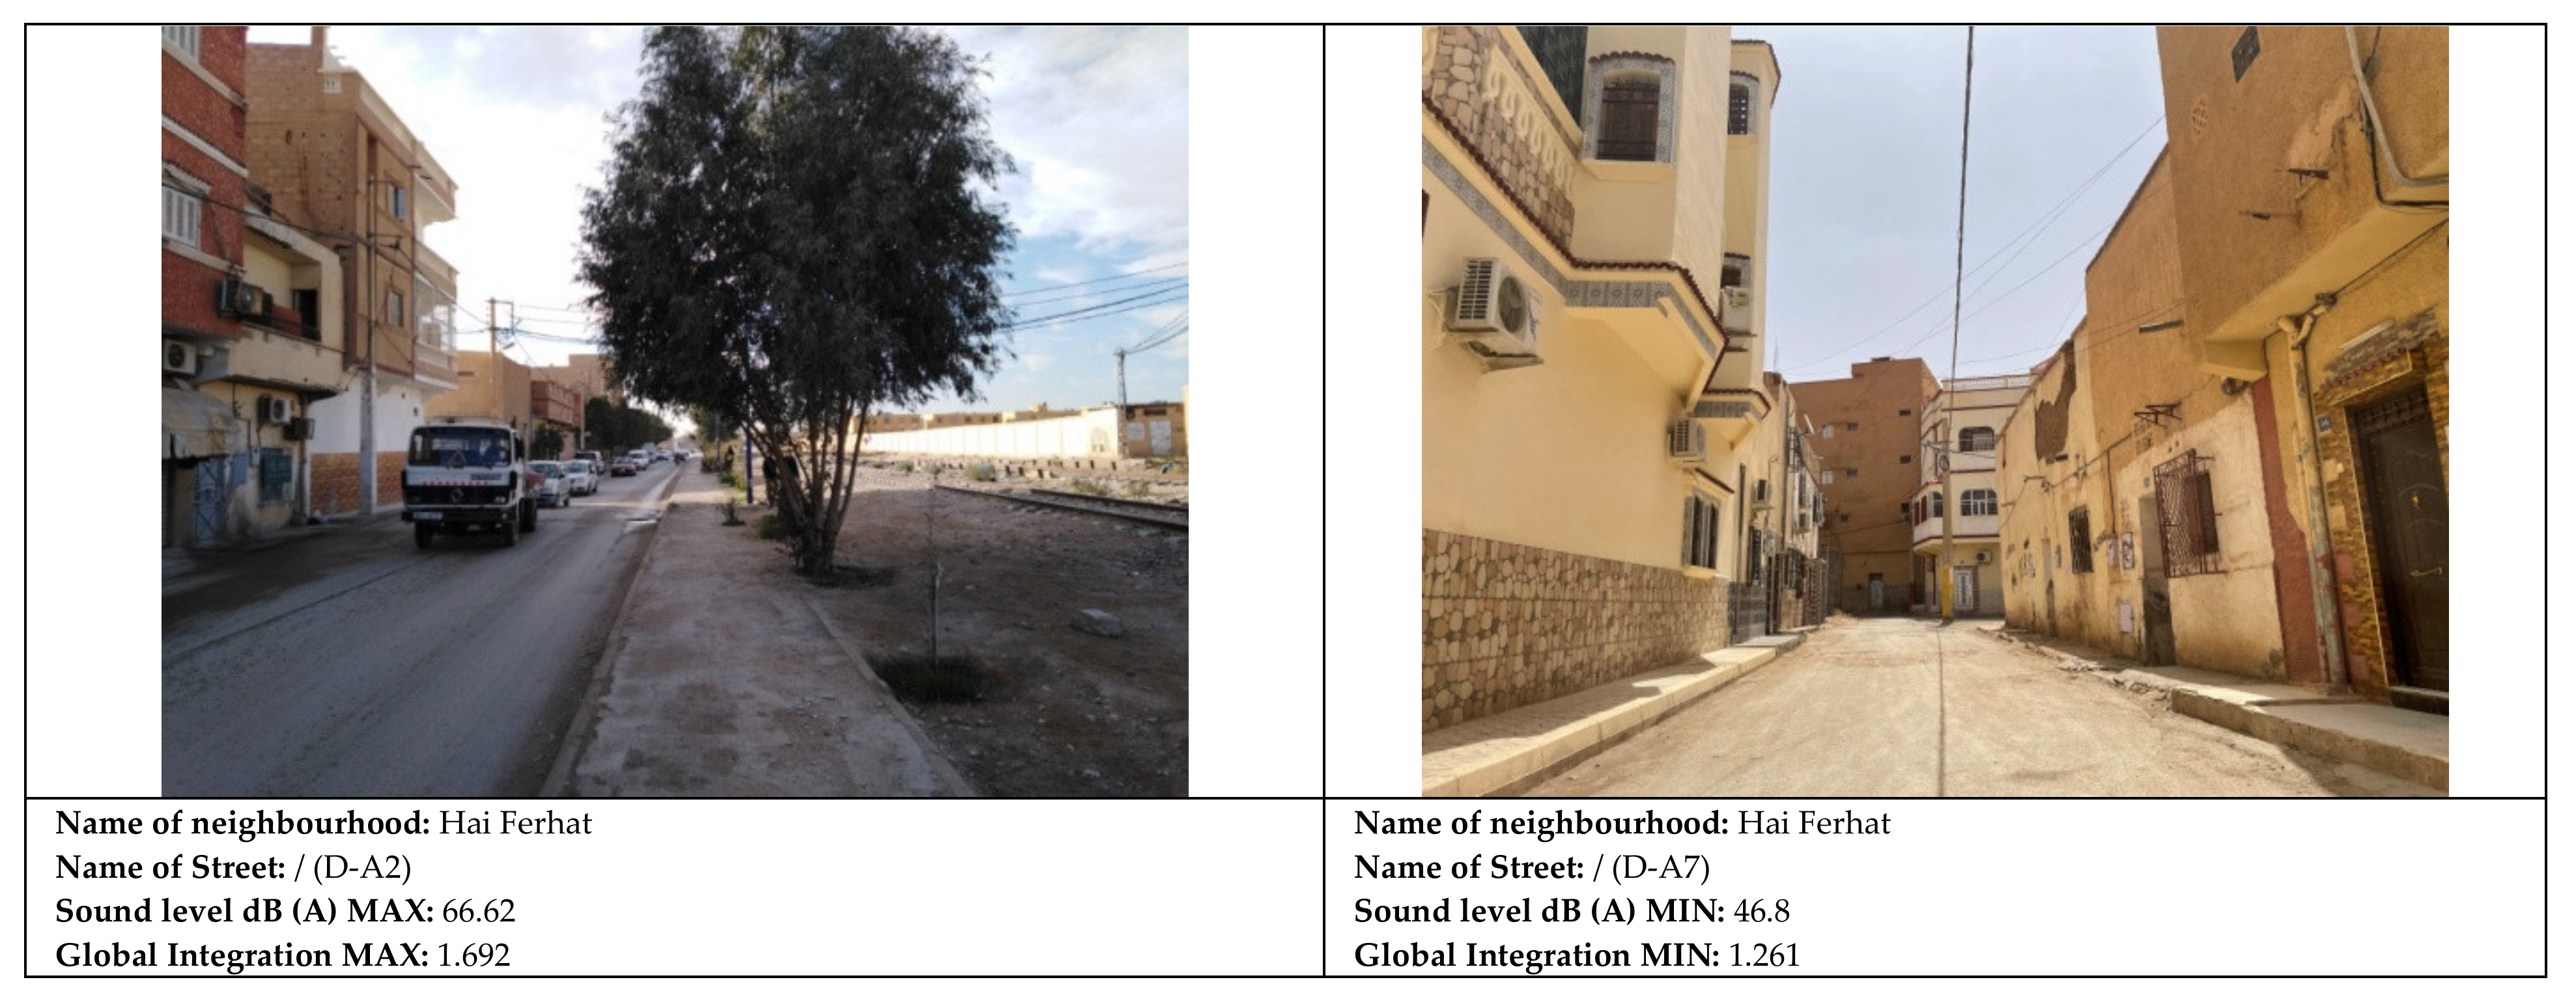
Figure 10 shows images from the noisiest and highest integrated street (left) and the quietest and lowest integrated street of Hai Ferat.
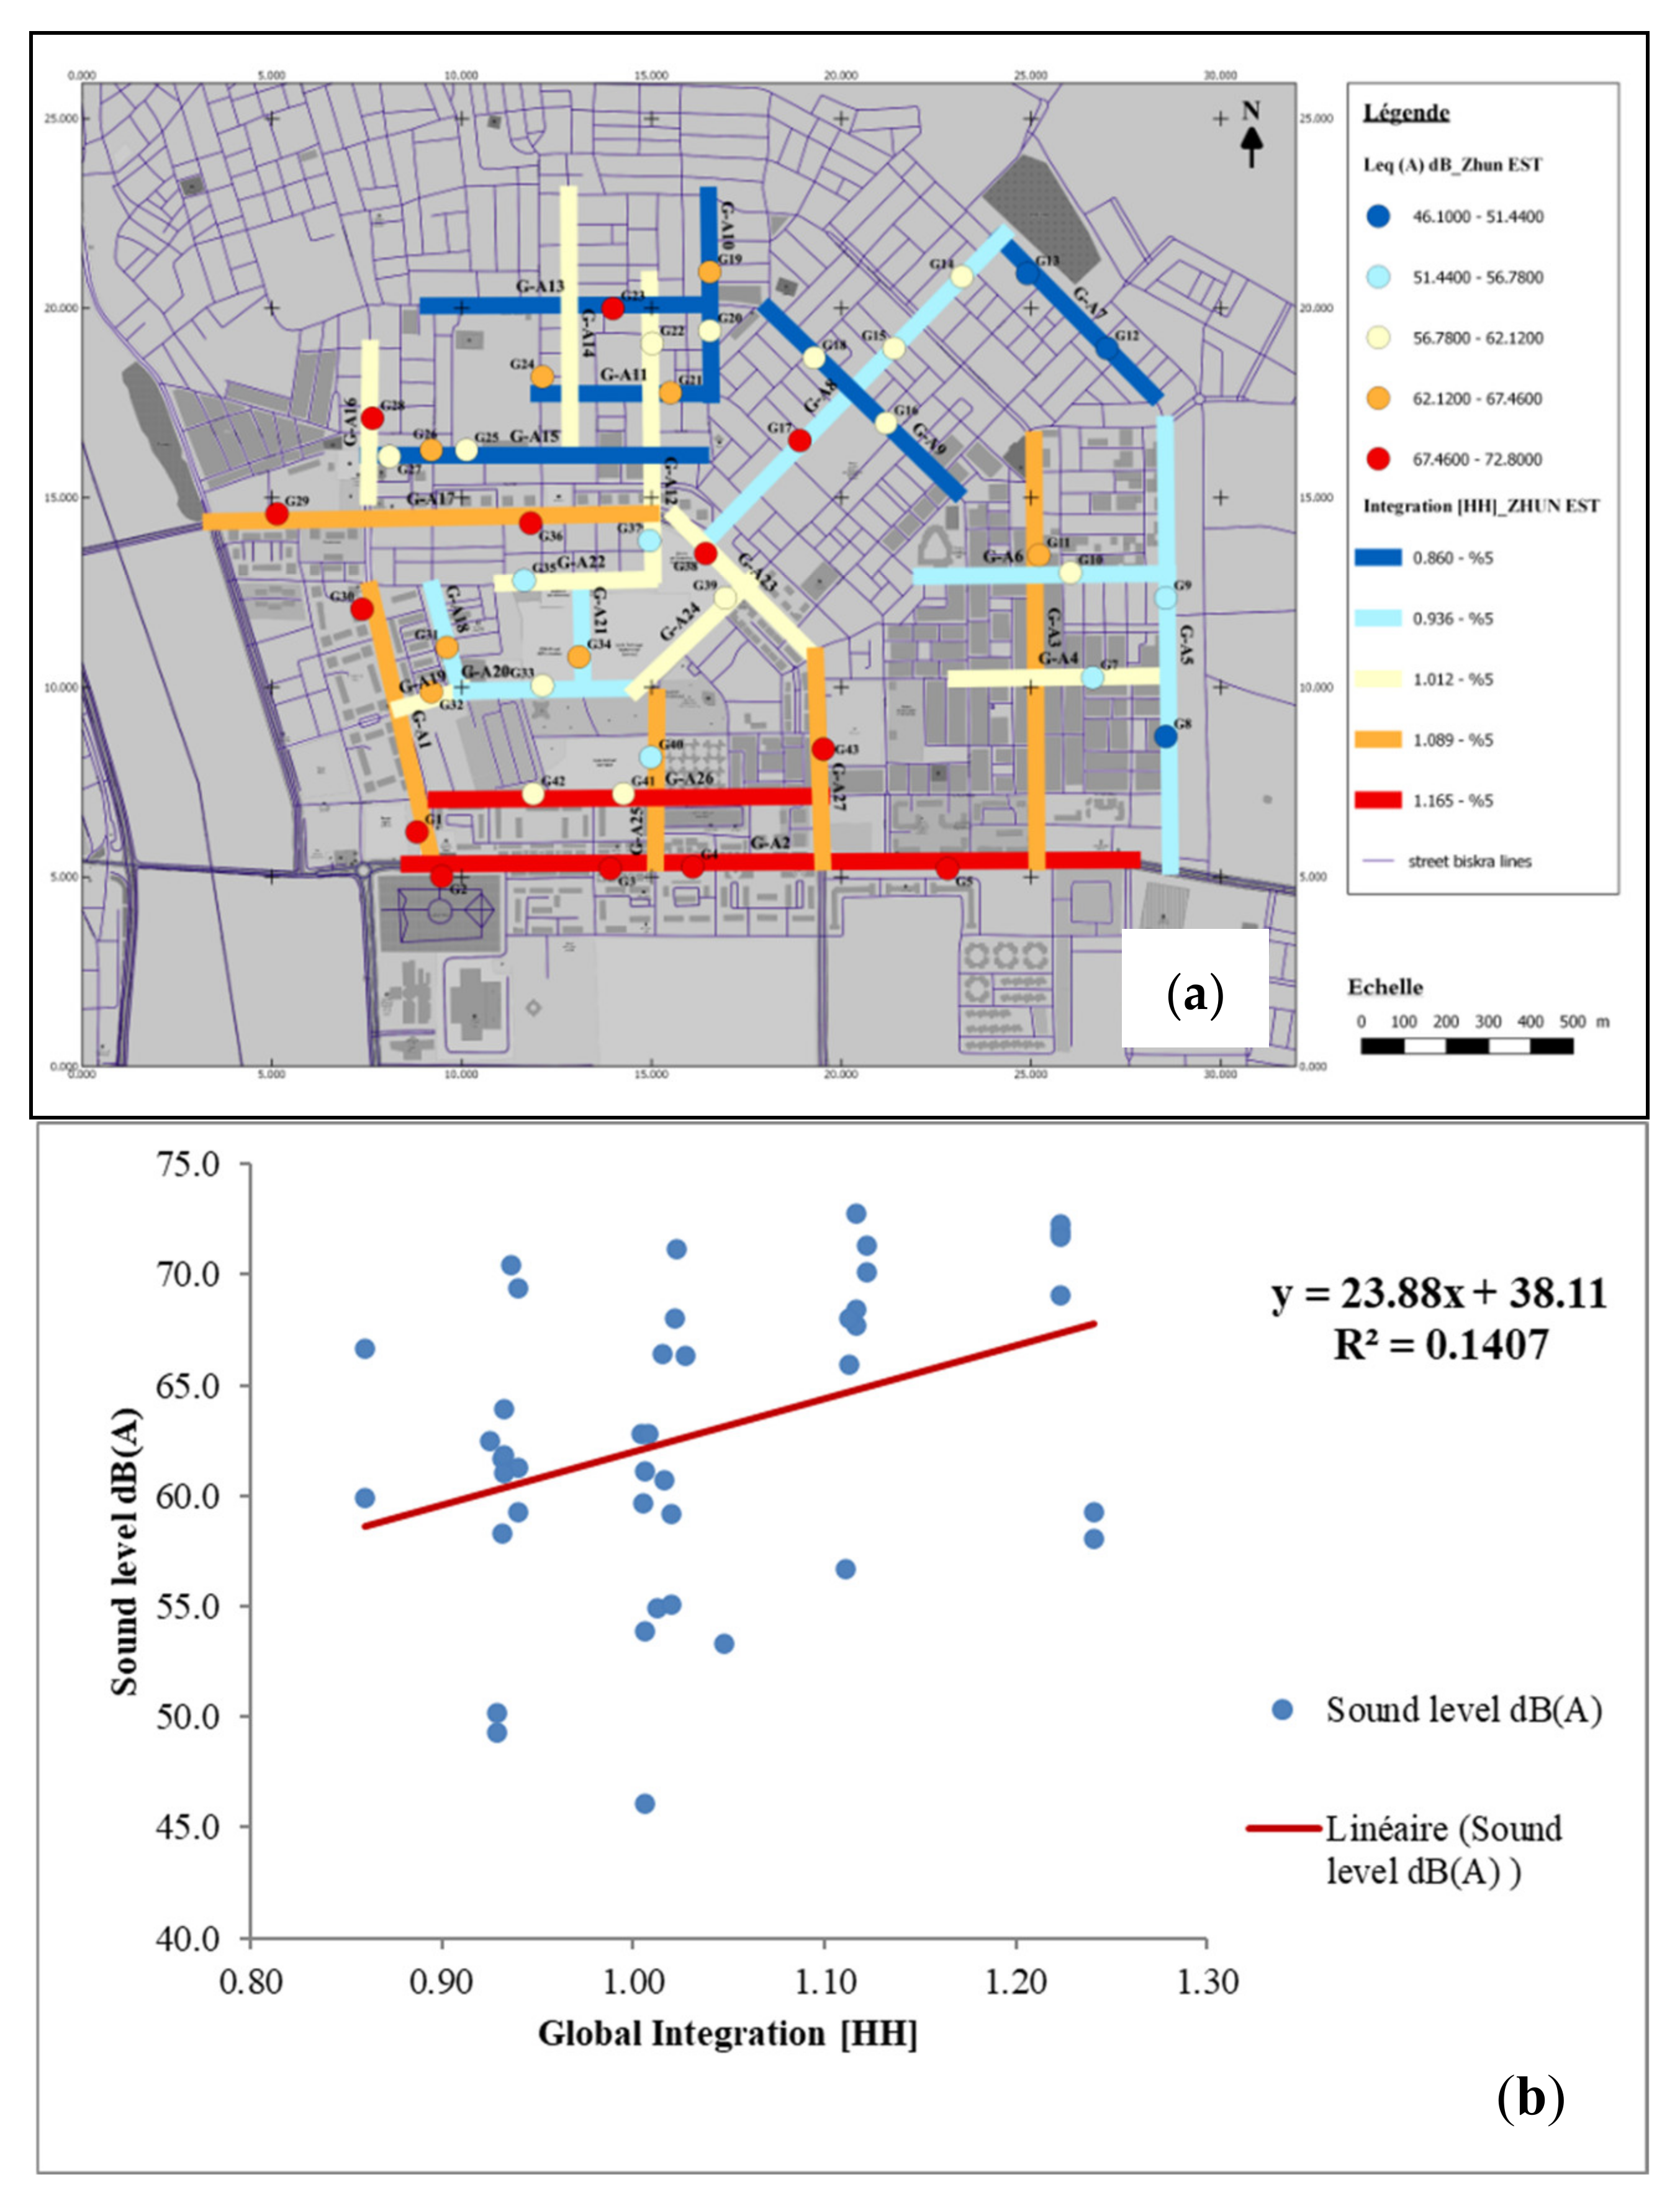
For the neighbourhoods A and G, some inconsistencies are found between sound pressure level and spatial integration. As
Figure 11 shows, the streets of the neighbourhood of ZHUN East (G) reveal the absence of any significant correlation relationship (r = 0.38,
n = 41,
p = 0.0132), R
2 = 0.1407.
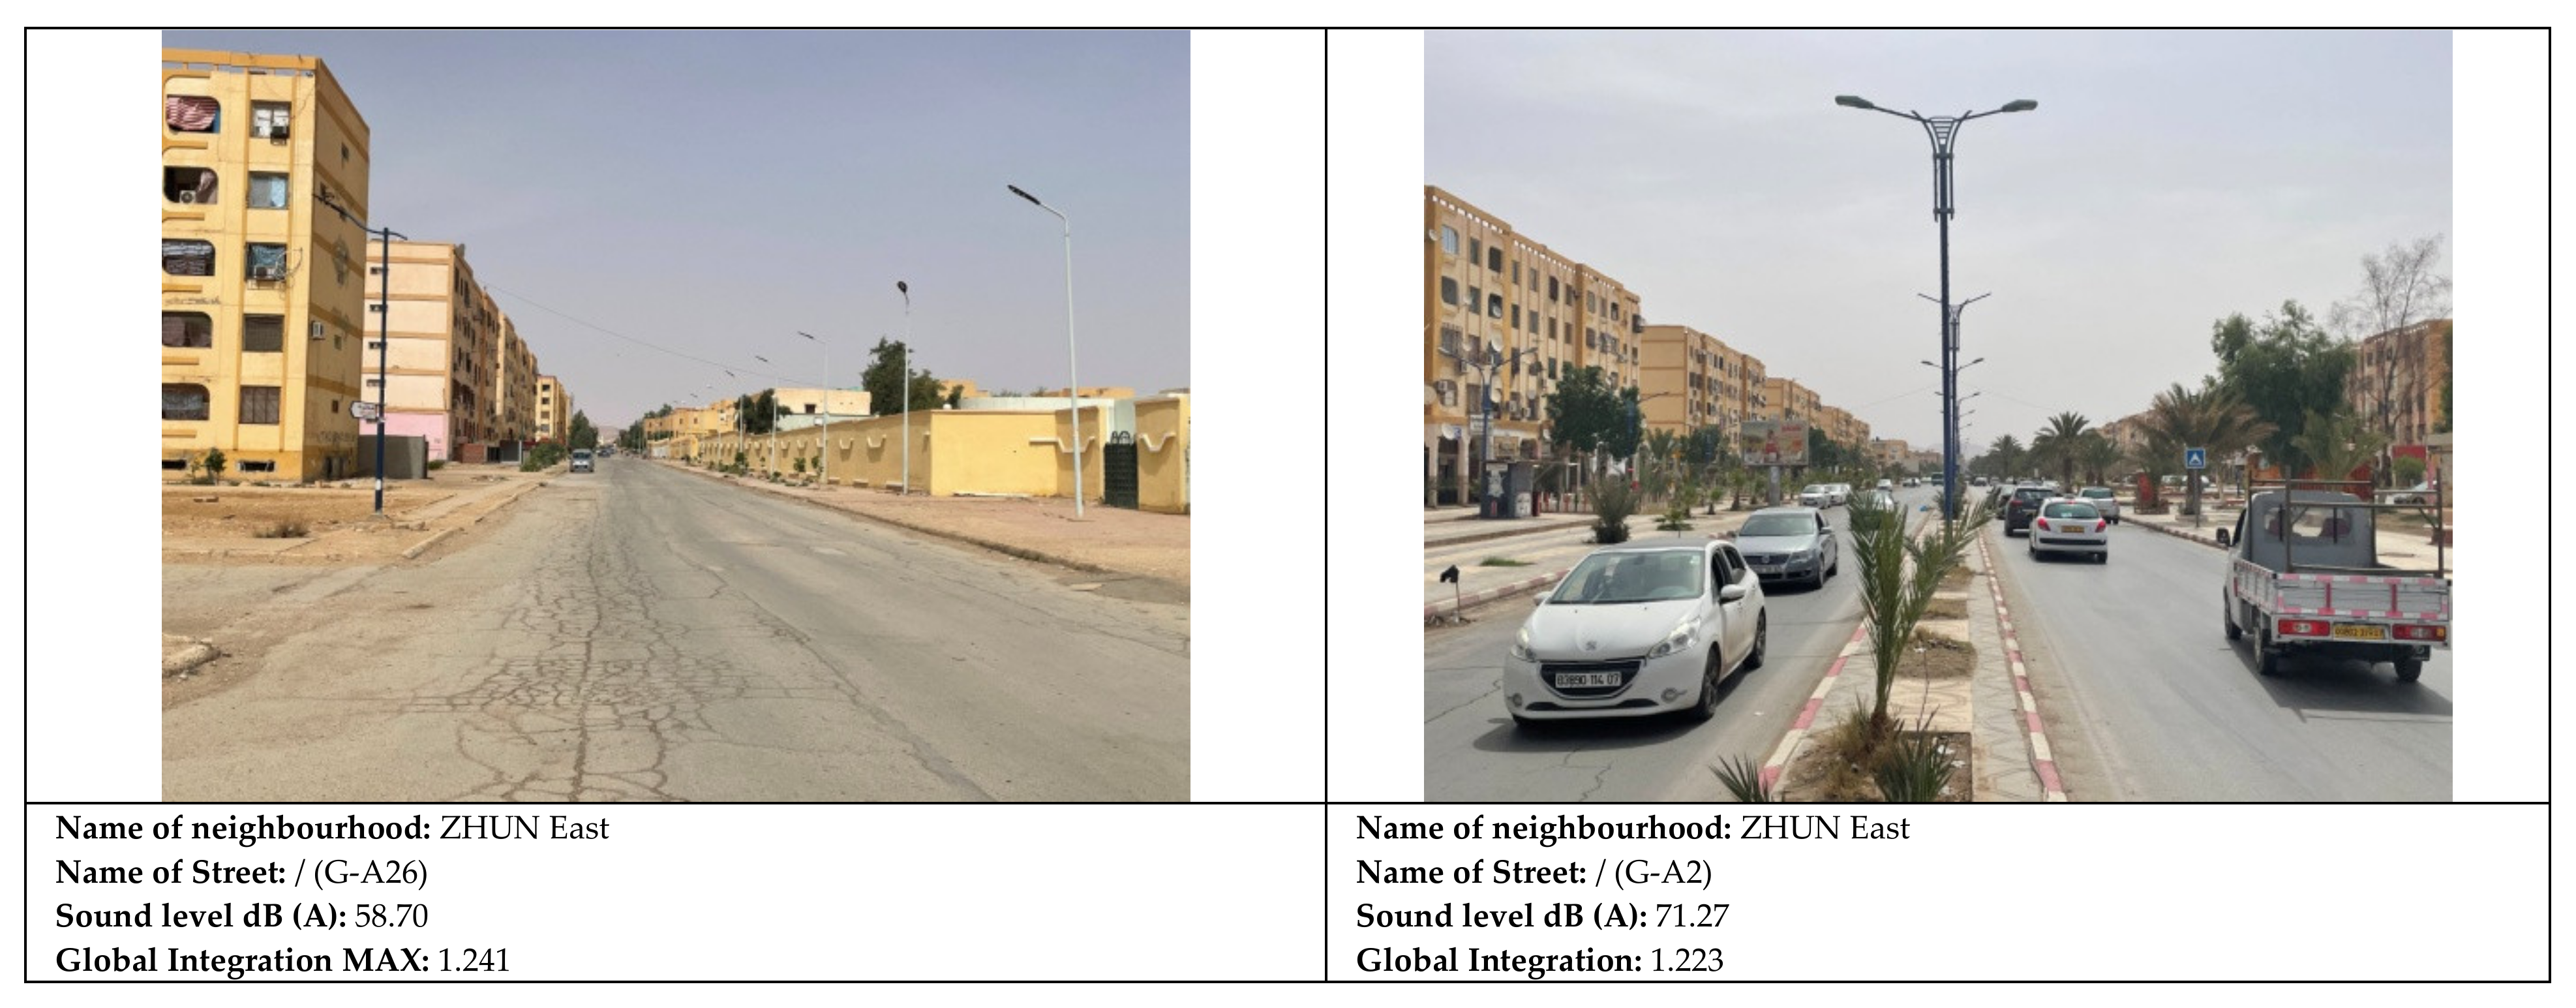
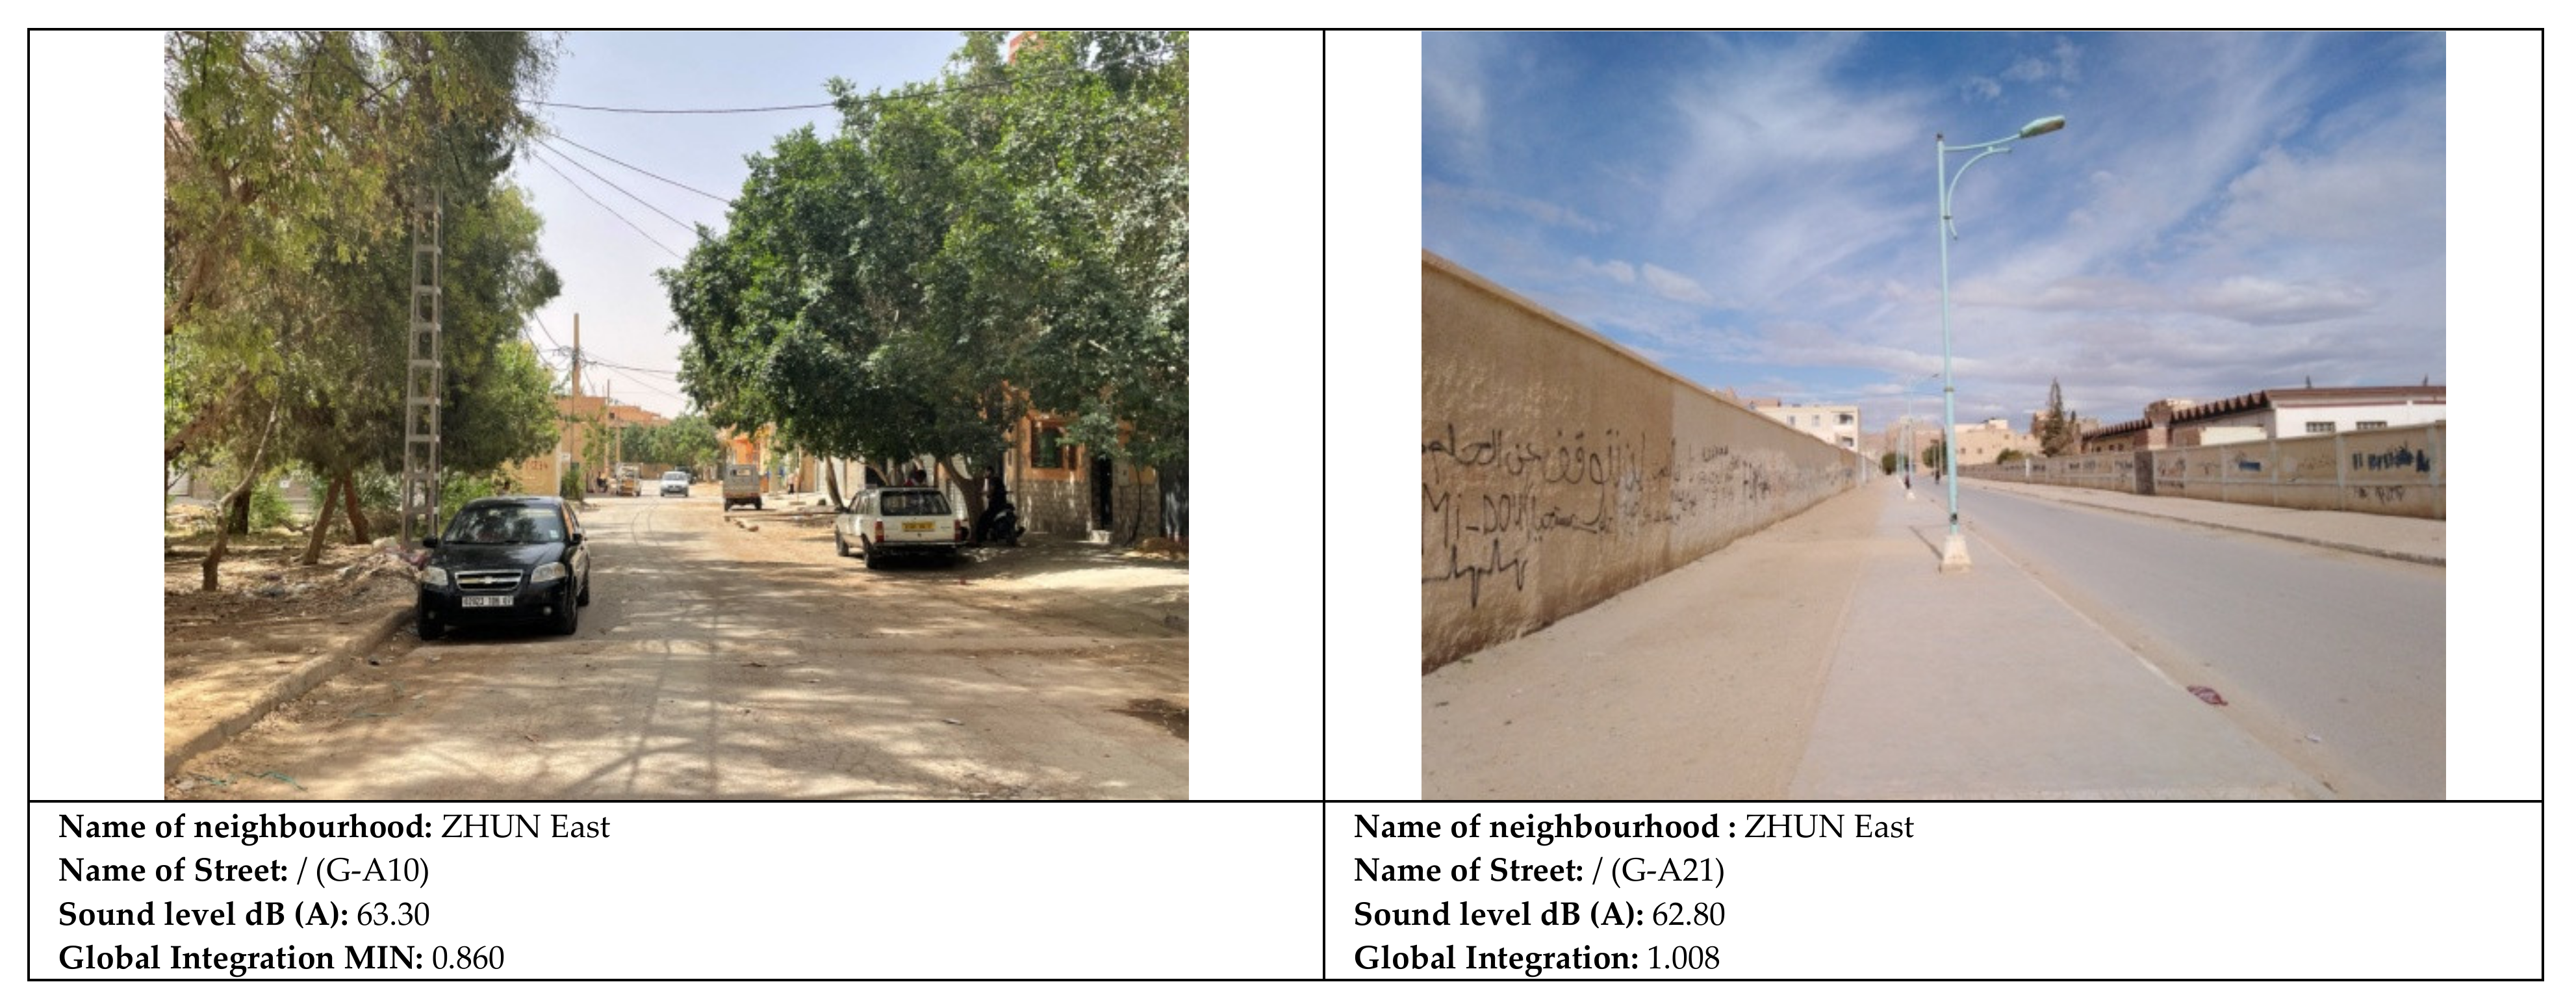
Figure 12 shows some images from four streets in SHUN East. There are little correlations between sound pressure levels and the levels of global integration in the streets.
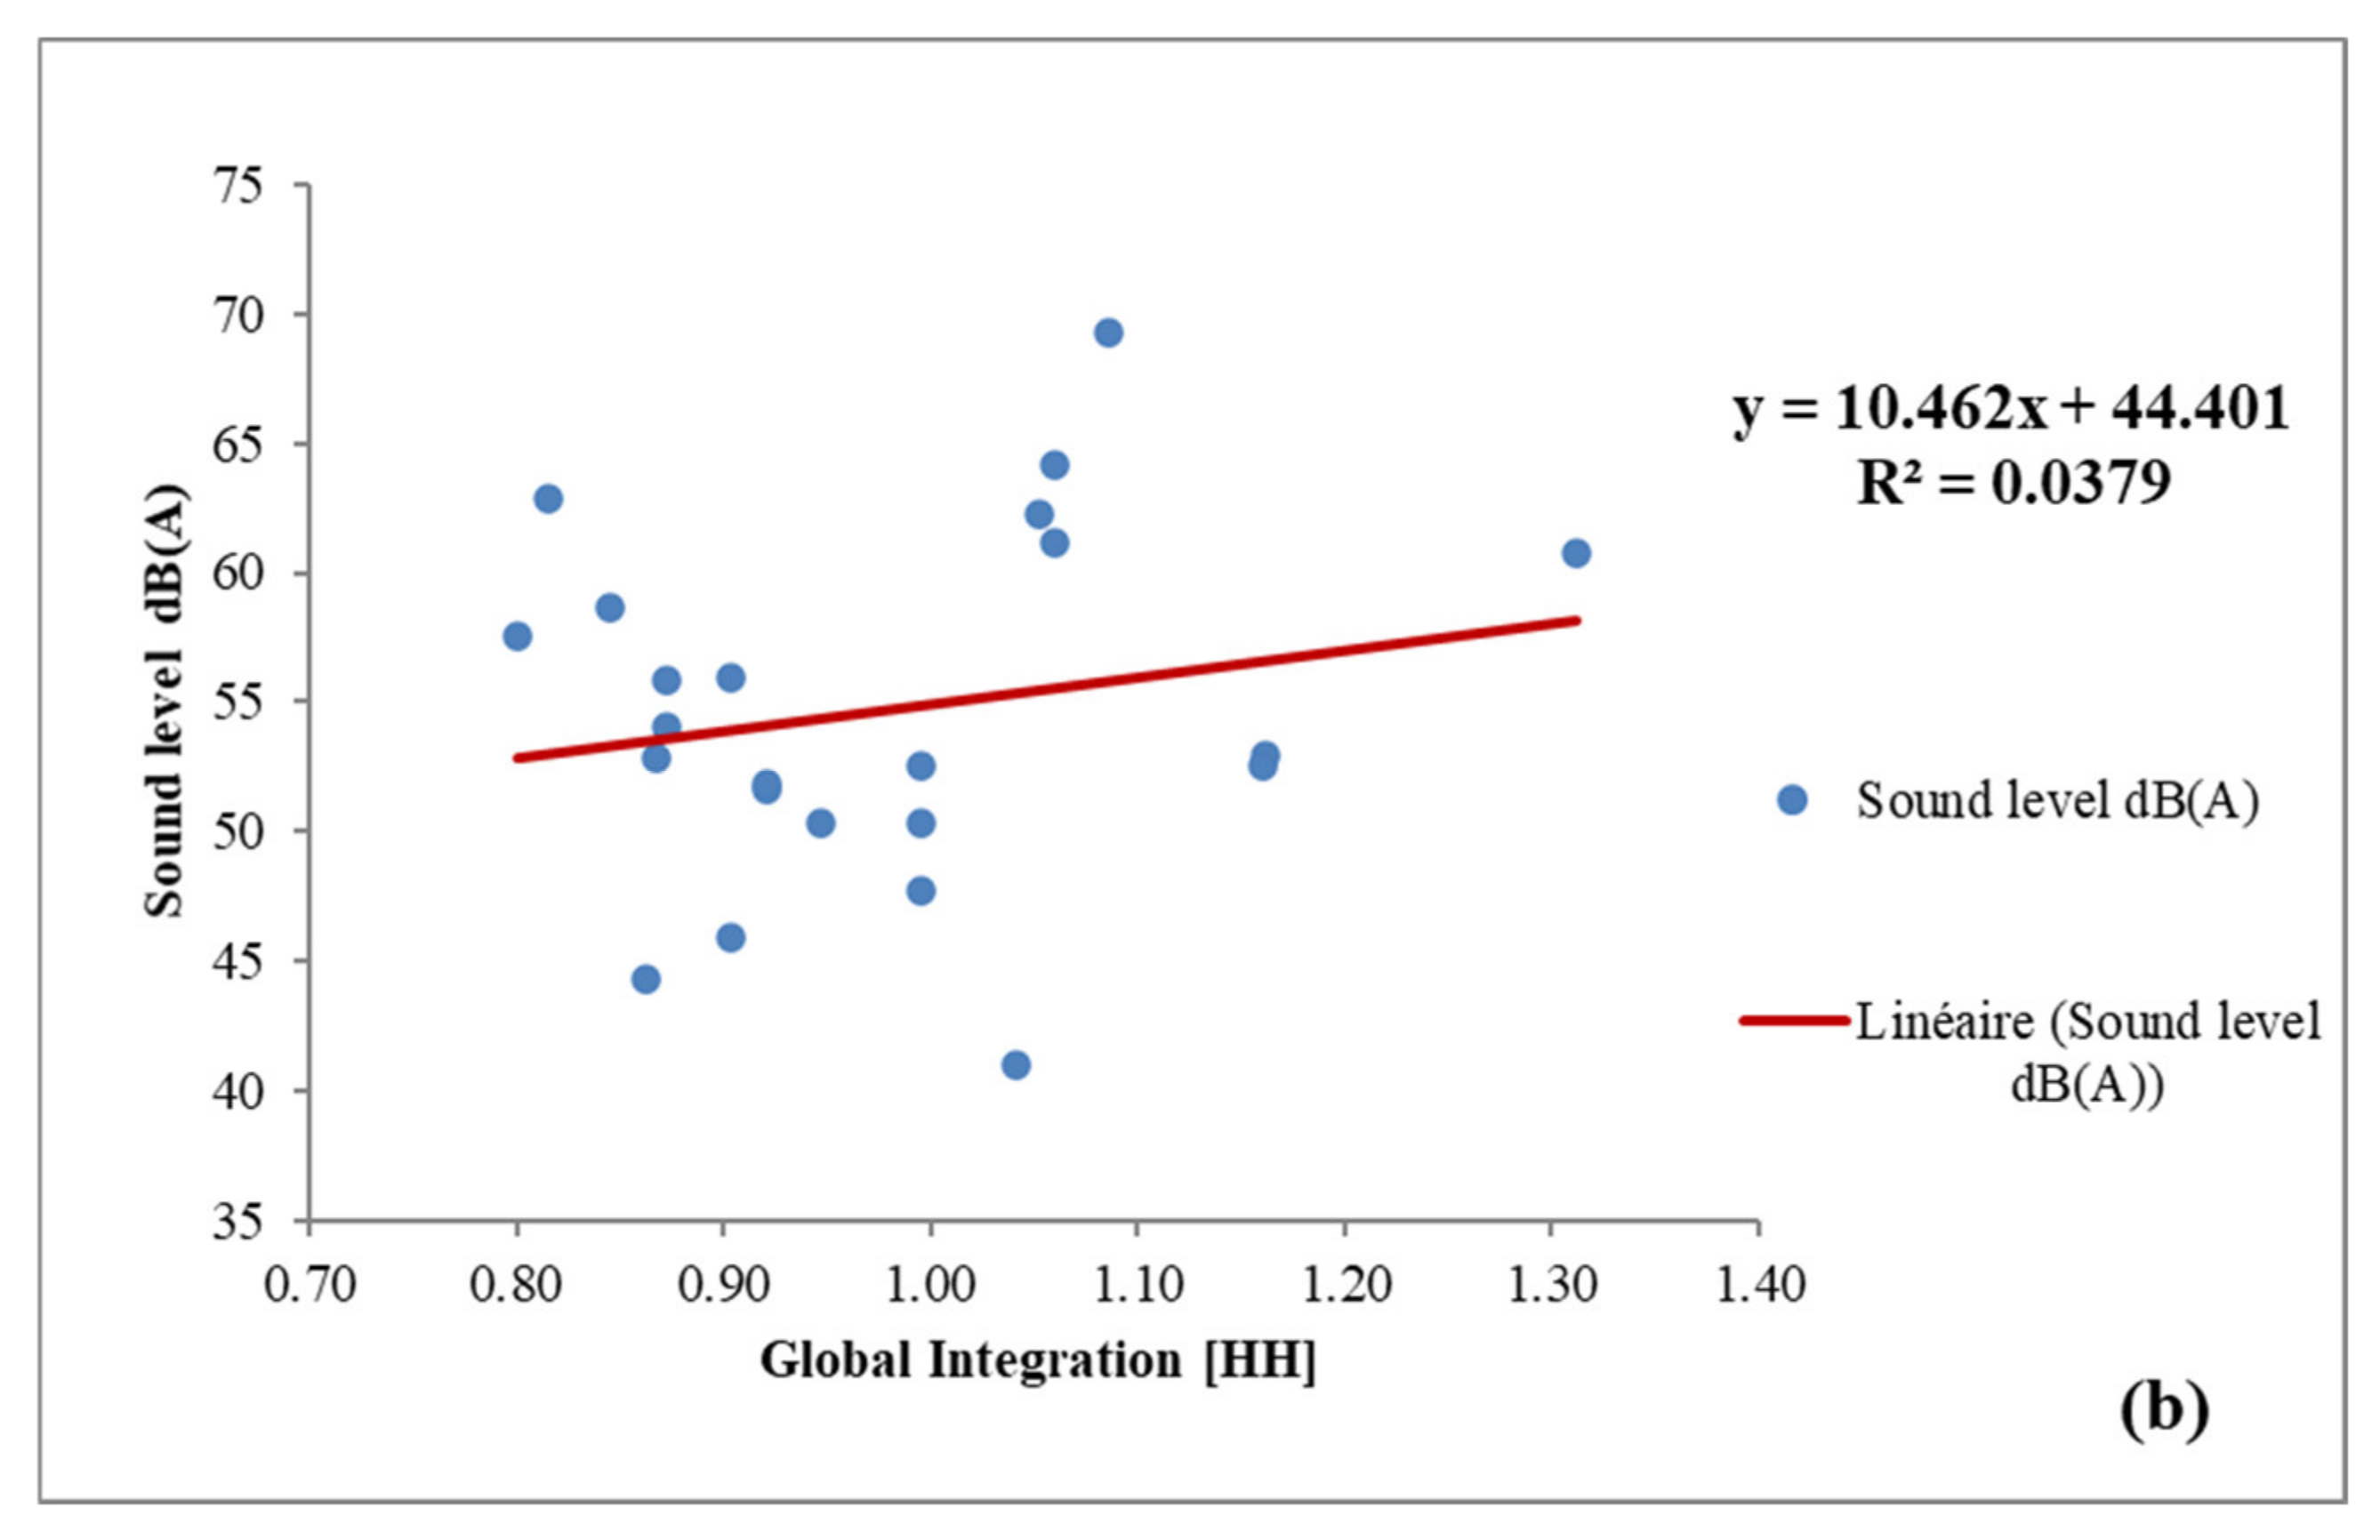
Figure 13 shows that the streets of the neighbourhood of Hai M’cid (A) have some inconsistencies between global integration and sound pressure level axial line values such as in the A-A9 axis. This could be due to the heterogeneity in the construction materials used for this rapidly changed neighbourhood. The streets of the neighbourhoods of Hai M’cid (A), reveal the absence of any significant correlation relationship (r = 0.19,
n =21,
p = 0.37) with an R
2 = 0.0379.
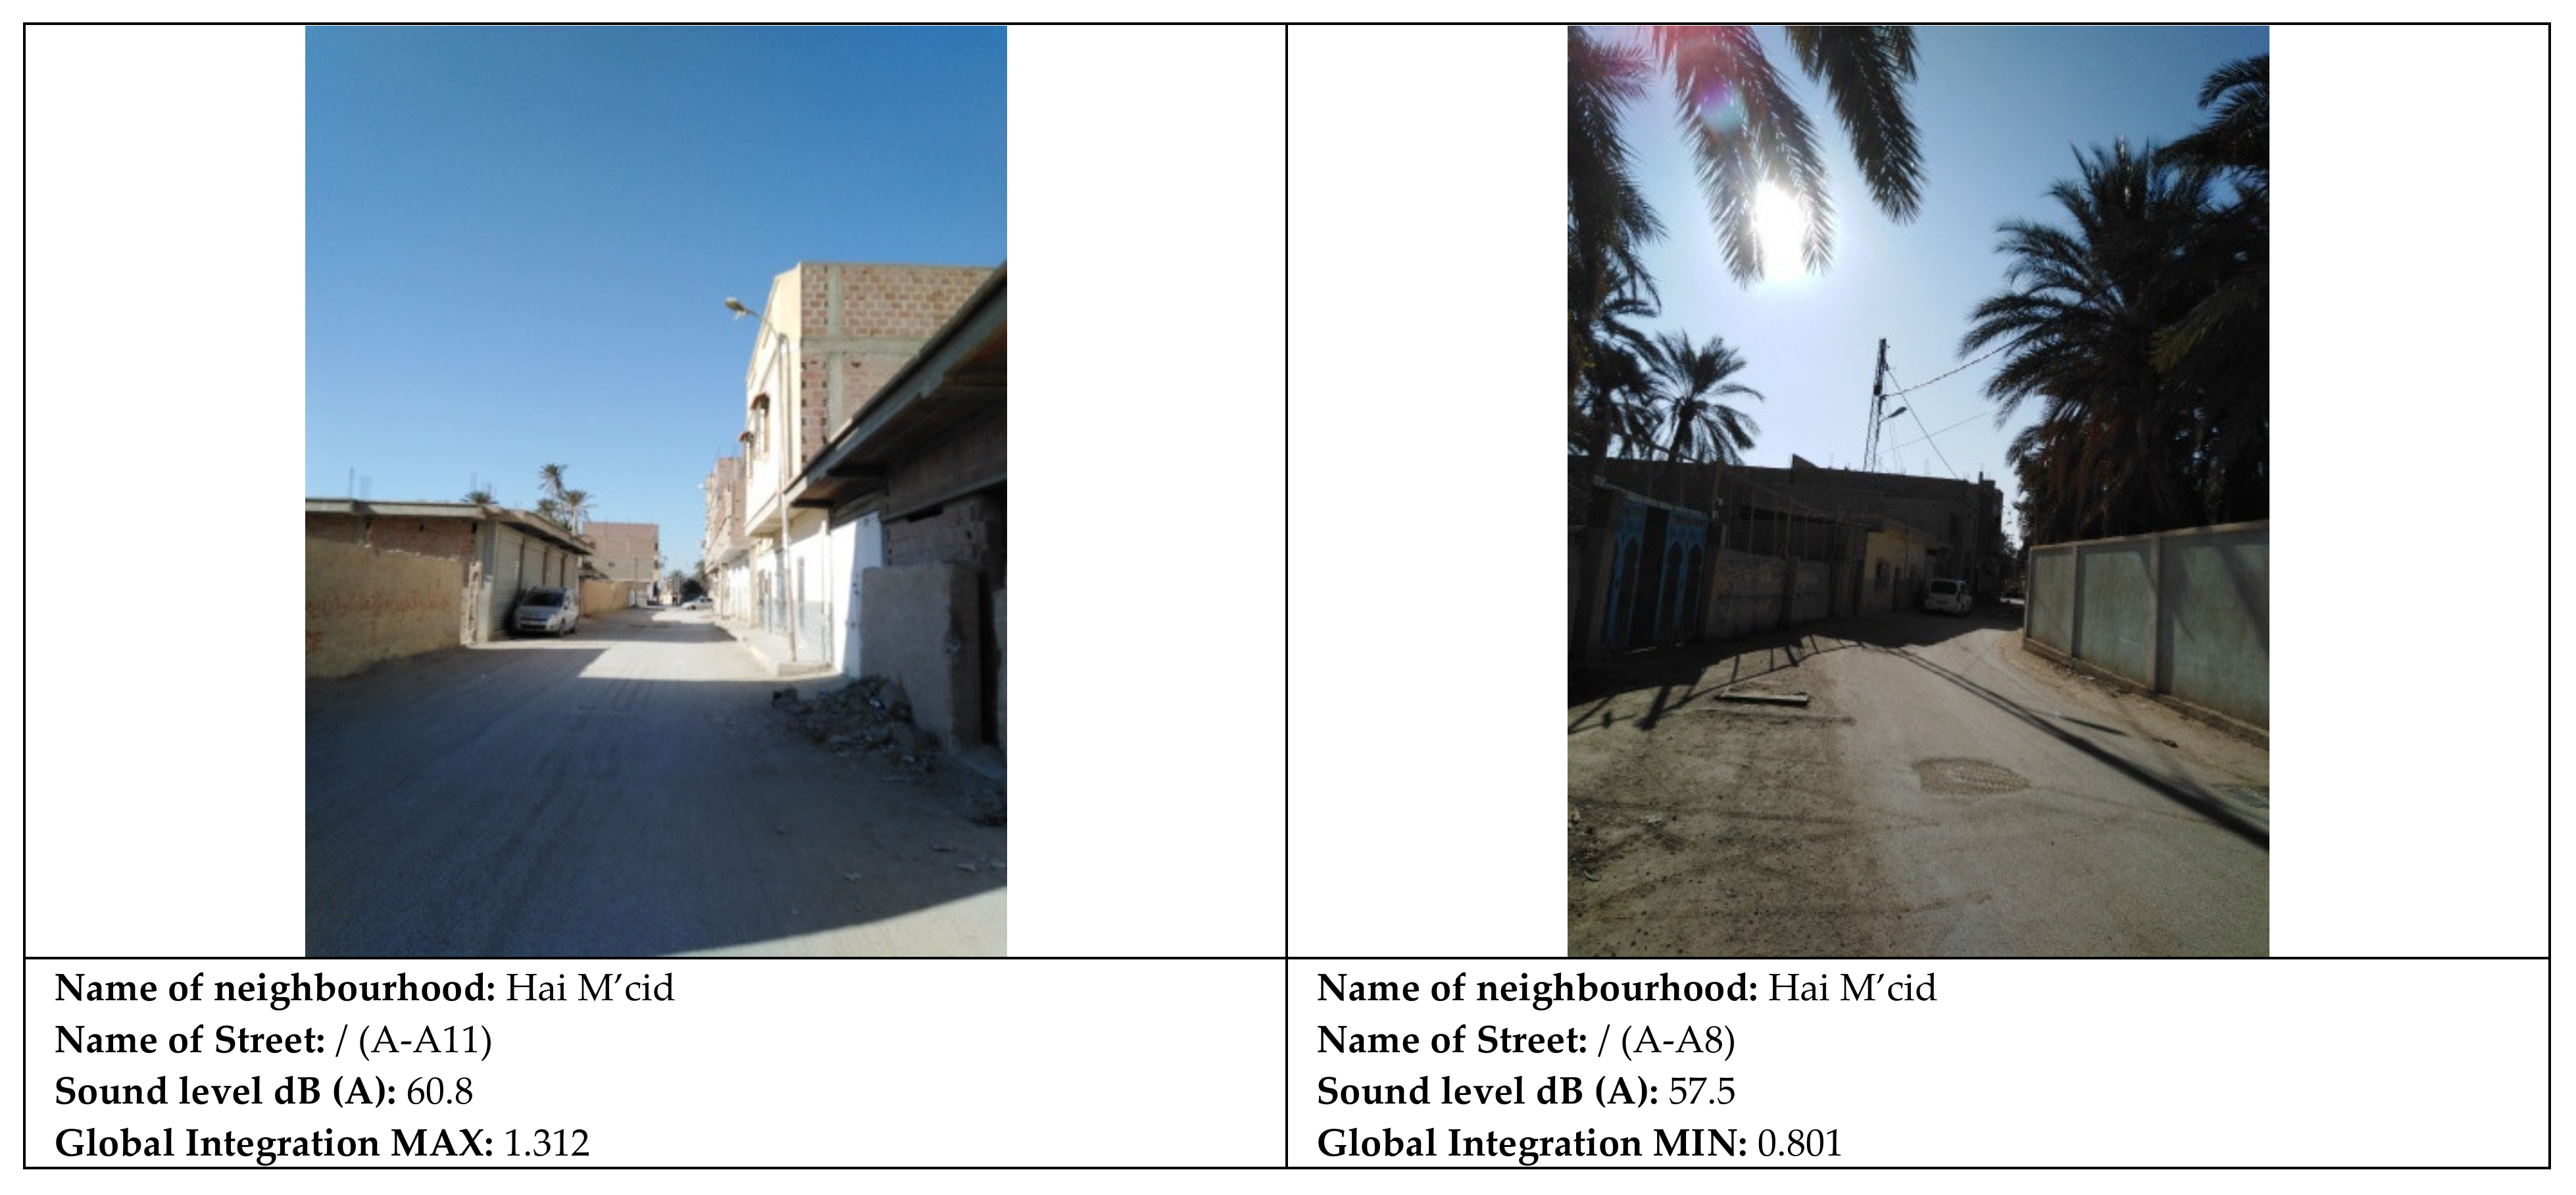
Figure 14 shows images of the noisiest and highest integrated and quietest and lowest integrated street of Hai M’cid.
The graph in
Figure 15 shows the correlation line between sound pressure level and connectivity of the selected neighbourhoods. As the spatial connectivity analyses show, there are strong and significant correlations of all four neighbourhoods with sound pressure levels. As implicated, the more connections a street has, the more potentials for social interaction and changing speed of vehicles, which again means higher sound pressures. Moreover, a high number of junctions imply the presence of traffic lights, which again means the presence of vehicles which need to speed down and to accelerate. All these aspects affect sound pressure levels.
The following results are found regarding sound pressure and connectivity: correlation coefficient ranges from R2 = 0.24 to R2 = 0.40 for the four selected neighbourhoods. Therefore, streets with many direct connections to their vicinity influence the sound pressure levels in built environments.
3.3. The Correlation between Noise and the Recent Space Syntax Analyses (NACH and NAIN)
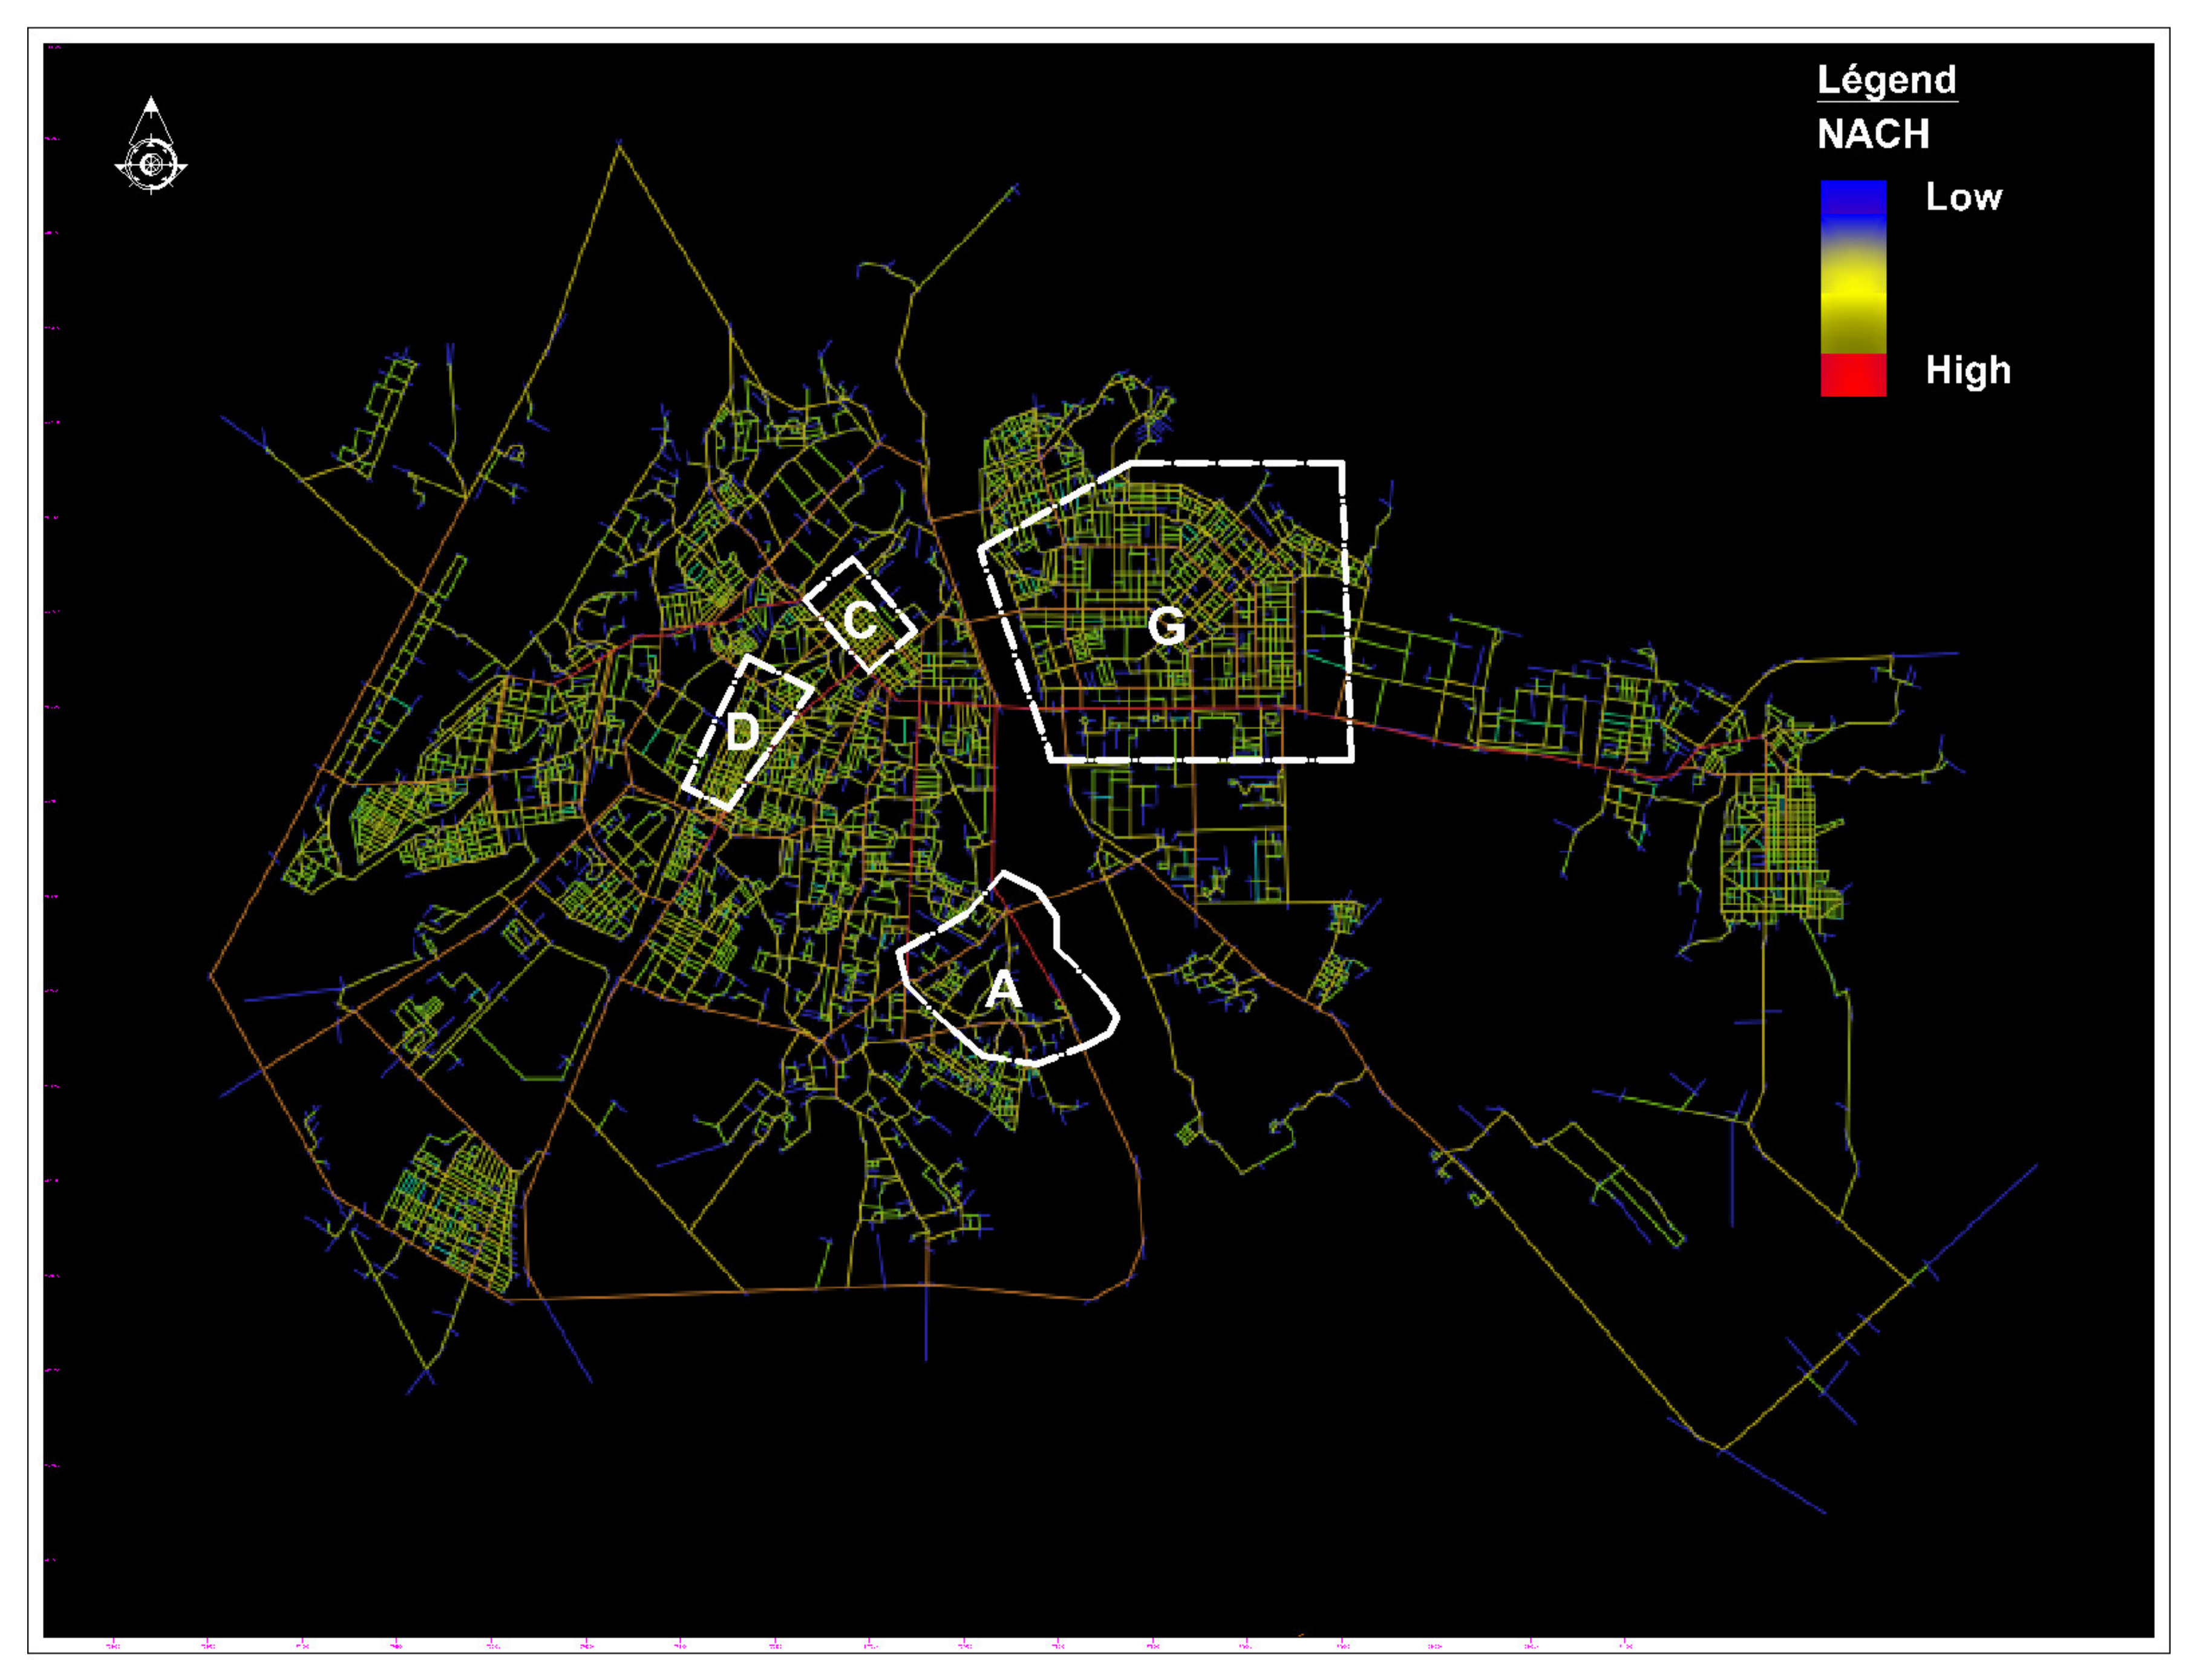
In the previous section, the results from the classic spatial analyses are based on an axial map. In this subsection, we present the results from the recent space syntax variables from 2012, such as the normalised angular choice (NACH) and normalised angular integration (NAIN) values. The difference from the classic space syntax analyses is that the axial map is broken up into segments at every junction and that the angular weighting between every segment is taken into account in the calculations.
Figure 16 shows the results from the normalised angular choice analyses (NACH). Here all main routes running through and between Biskra’s neighbourhoods are highlighted in red and orange. As presumed, these main routes must then have the highest levels of through movement, which imply high sound pressure levels. The next step is to correlate the results from the NACH analyses with the registration of noise levels of the four selected neighbourhoods.
The comparison of the sound pressure level and the normalised angular choice analyses (NACH) of representative streets shows that segments with low NACH values correspond to streets with low sound pressure levels in the neighbourhoods of La Gare (C) and Hai Ferhat (D). Likewise, segments with high NACH values correspond to streets with high sound pressure levels.
The graph in
Figure 17 shows the regression line between the sound pressure level and the NACH of the selected neighbourhoods. The streets of the neighbourhood Hai M’cid (A) have some inconsistencies between the NACH and the sound pressure level segment values with an R
2 = 0.0363. Conversely, the streets of the neighbourhood of La Gare (C) reveals a strong, positive, and significant correlation relationship with a R
2 = 0.6052. The streets of the neighbourhood Hai Ferhat (D) have a correlation between the NACH and the sound pressure level values except for certain segments, with R
2 = 0.2924. The neighbourhood ZHUN East has a low correlation between the NACH and the sound pressure level values with a R
2 = 0.0581. These results show again that the neighbourhoods with a low degree of spatial intelligibility have low correlations between sound pressure levels and NACH values.
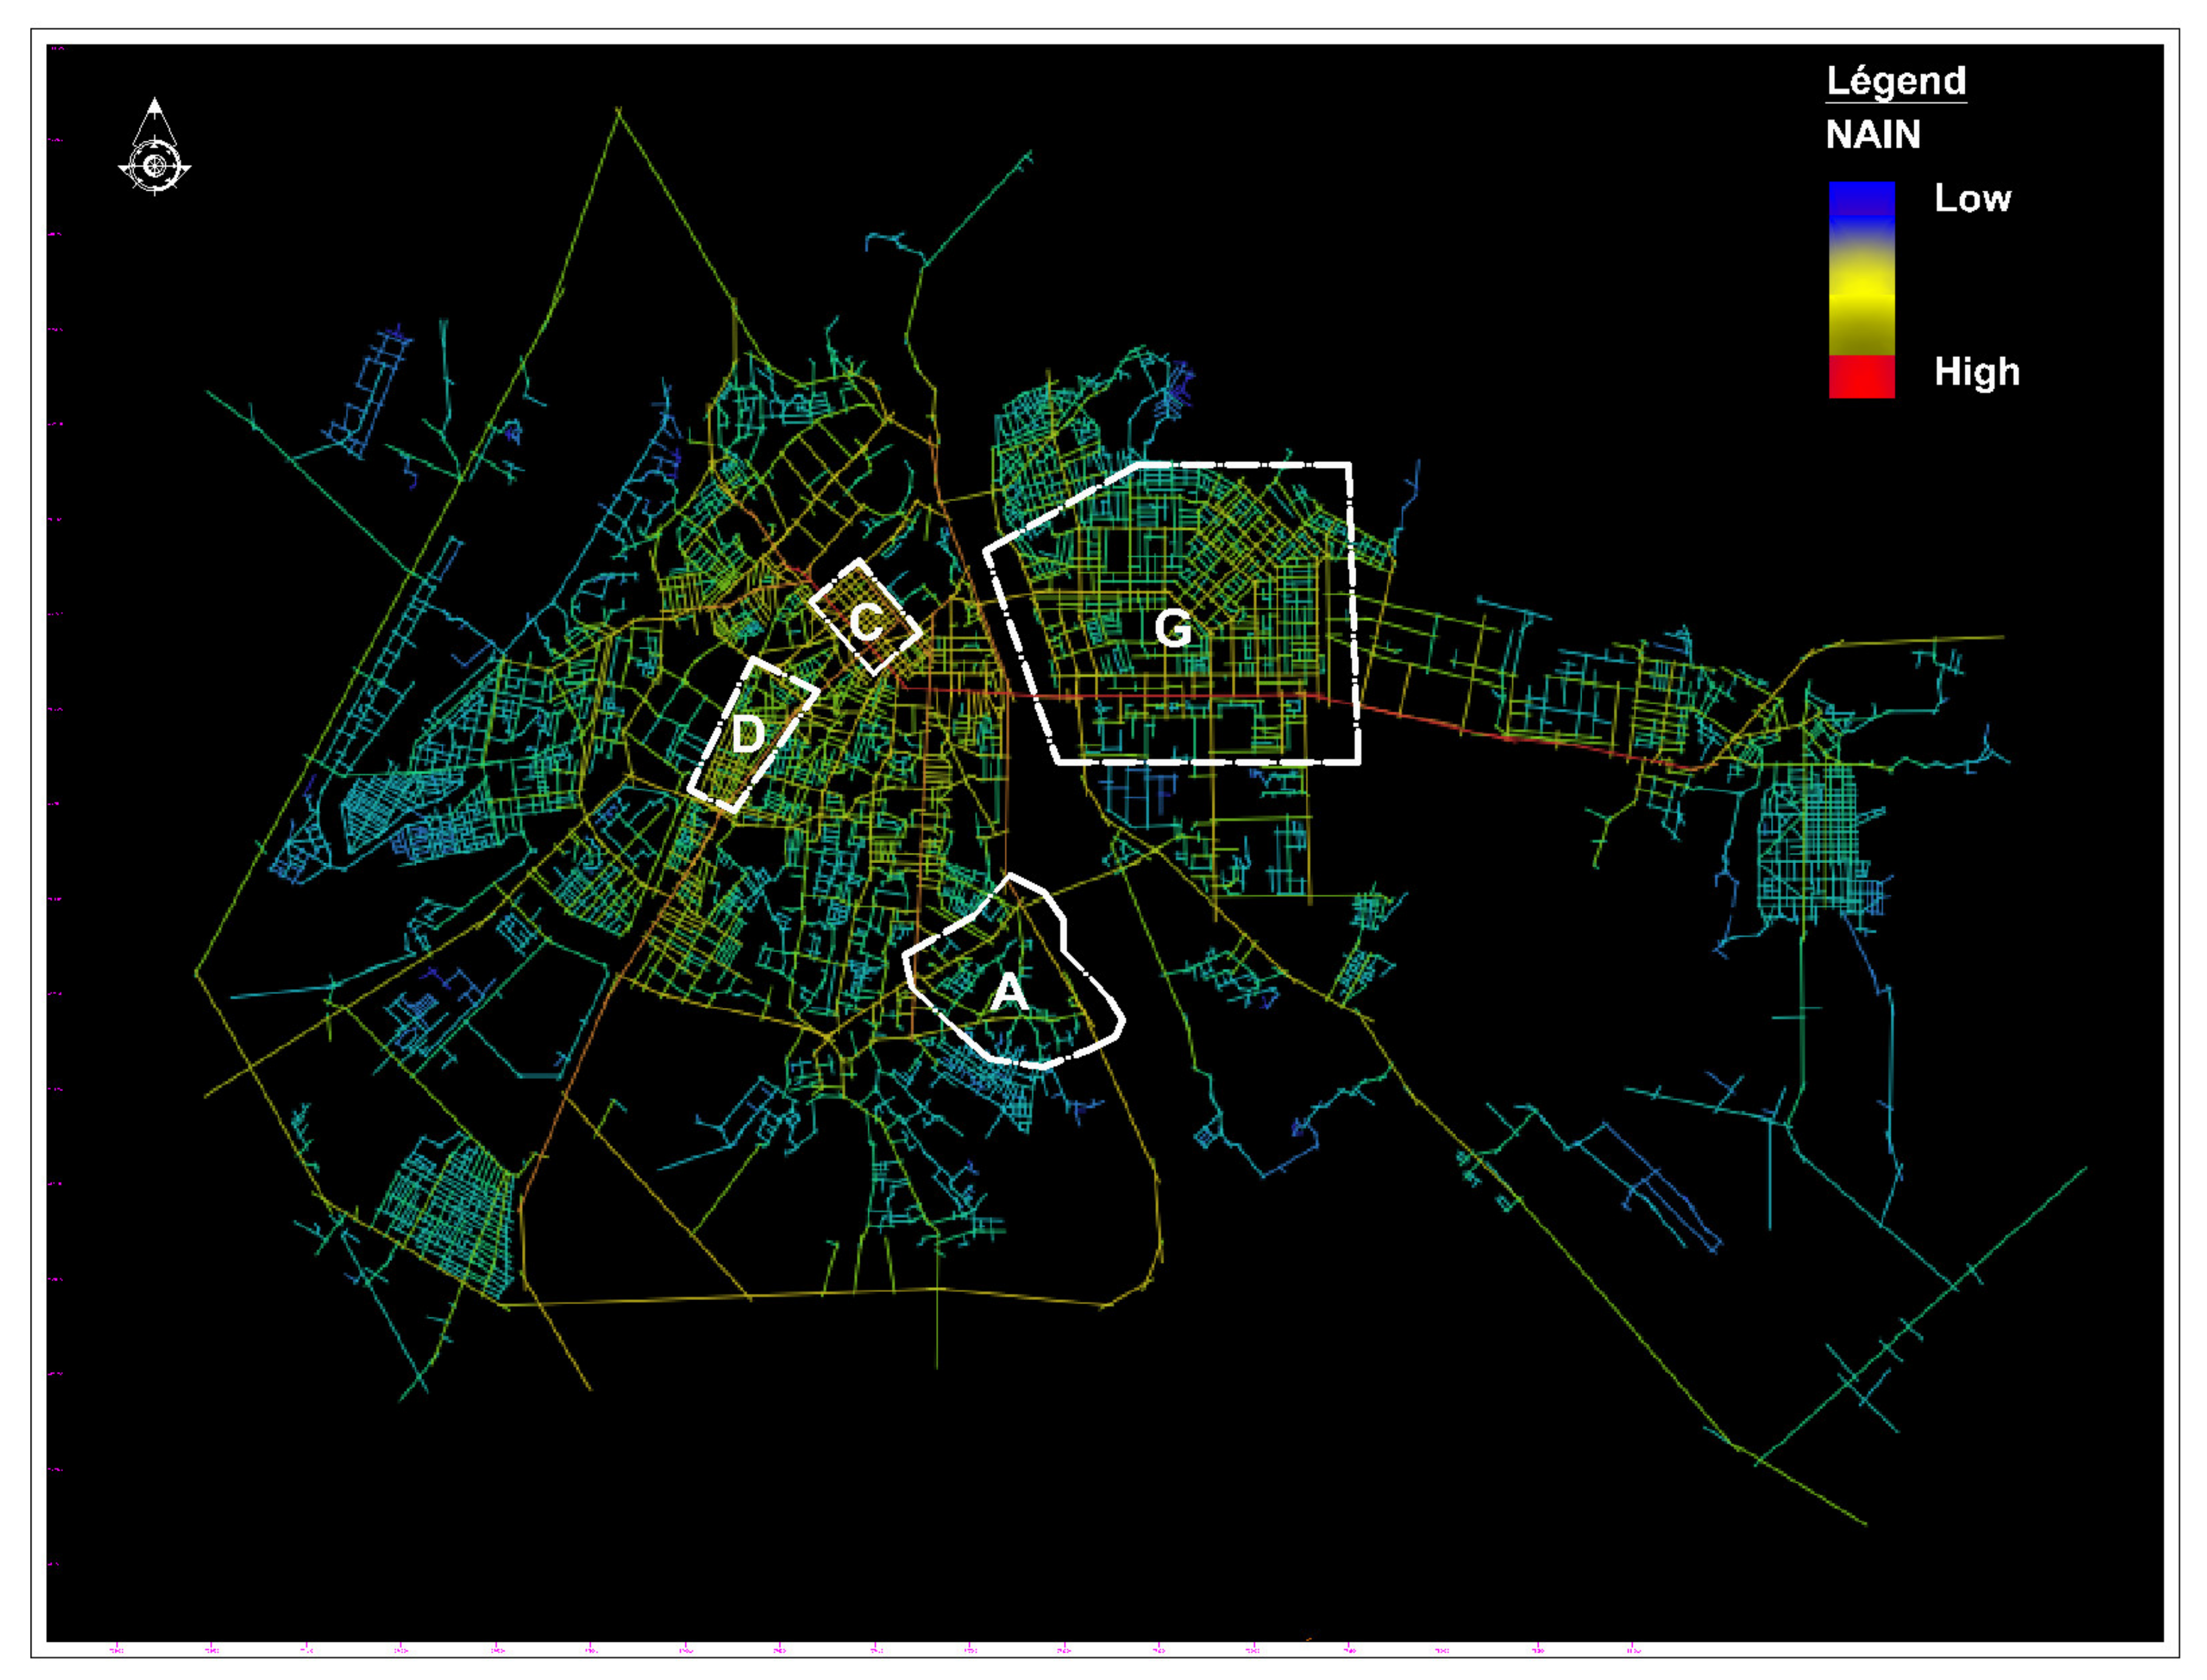
A test of the correlations between normalised segment integration (NAIN) and noise were also carried out. A NAIN analysis shows the ‘to-movement’ potentials for a street segment level.
Figure 18 shows a NAIN analysis of Biskra. As can be seen in the figure, the La Gare area, the main city centre and the main routes leading to these areas has the highest NAIN values. In line with other space syntax research, shops and commercial functions tend to locate themselves along streets with the highest NAIN values [
30].
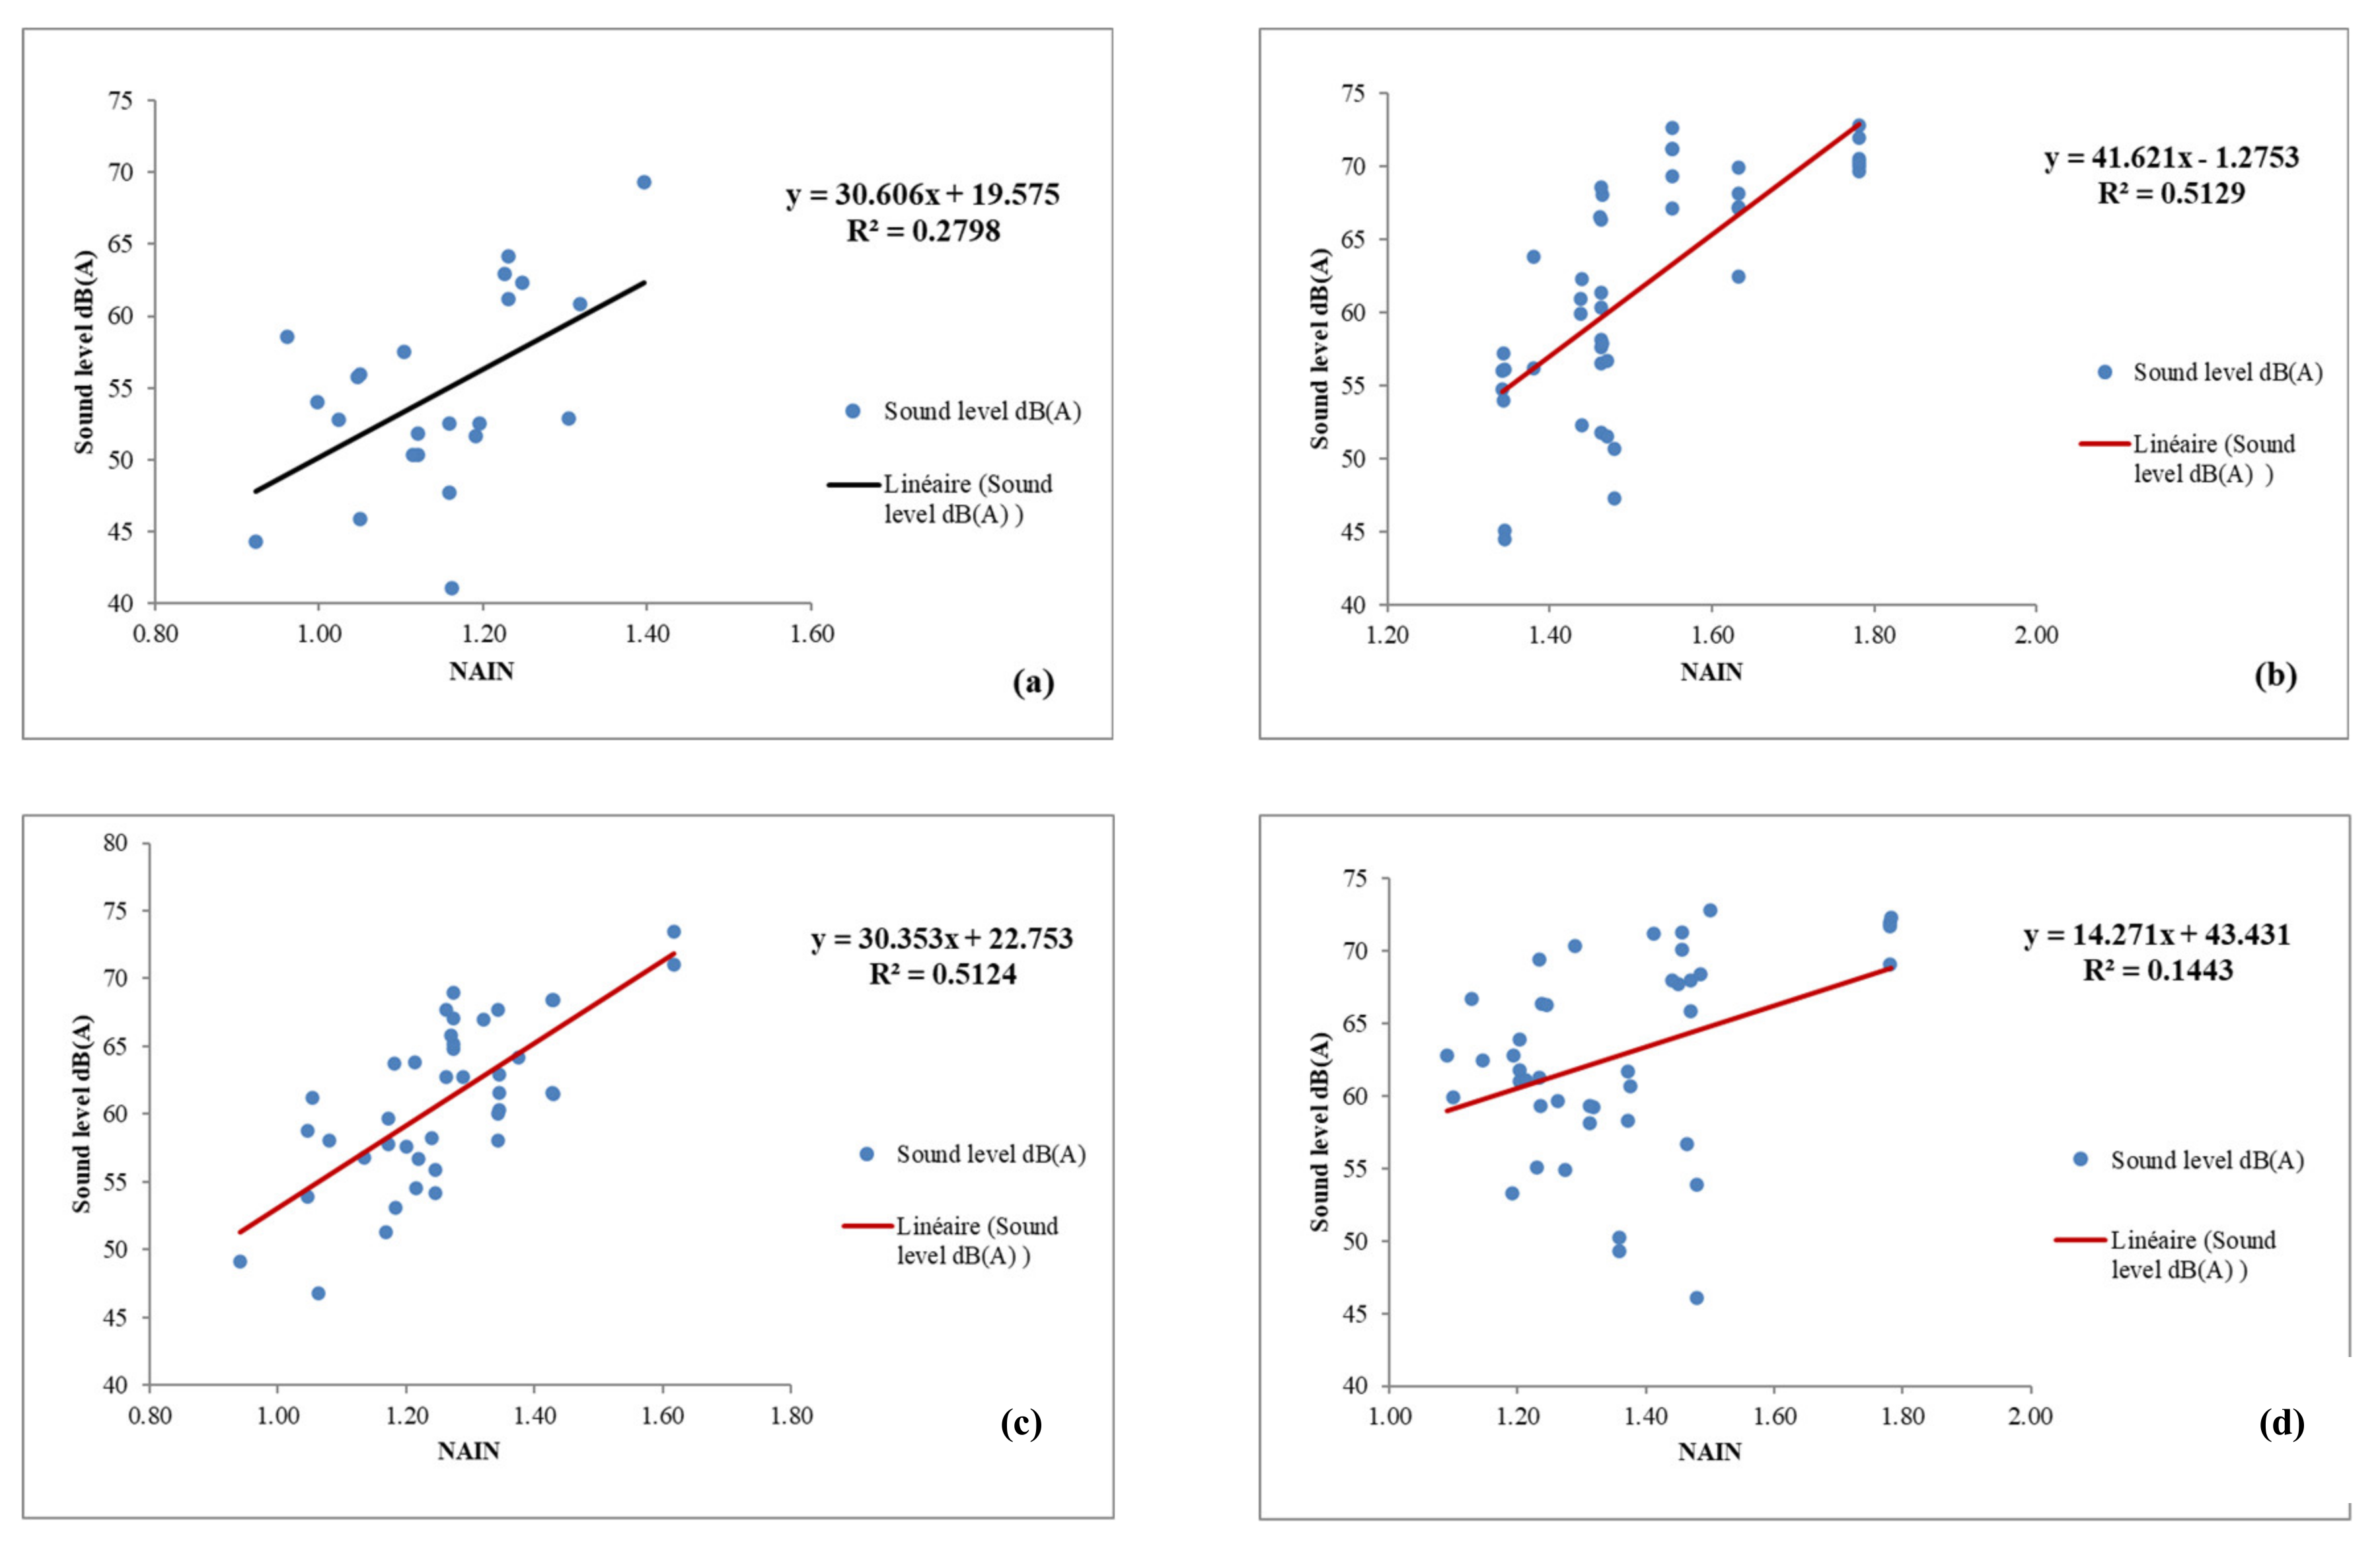
The graph in
Figure 19 shows the correlation line between the sound pressure level and the NAIN of the selected neighbourhoods.
When correlating the results from the NAIN analyses with the sound pressure levels, the correlation coefficient is higher than in the NACH analyses.
Figure 19 shows that the correlation coefficient of Hai M’cid (A) is R
2 = 0.2798. The streets of the neighbourhoods of Hai M’cid (A) and Hai Ferhat (D) reveal a positive, and significant correlation relationship with R
2 = 0.5129 and a R
2 = 0.5124. The streets of the ZHUN East (G) reveal a weak correlation relationship with a R
2 = 0.1443.
Table 5 shows that the NAIN has the strongest correlation with the noise data (sound pressure level Leq (1min), dB (A)). Streets with the highest to-movement potentials seem to generate the highest noise levels. These are the areas where most people travel to and interact. This again affects the sound pressure levels. However, the underlying spatial parameter is spatial intelligibility. Seemingly, when the correlation between connectivity and integration is low, few correlations are found between the other space syntax parameters. Streets with high NACH values have high through movement potentials. When the streets have high levels of connectivity to the vicinity, it affects the sound pressure levels through the stopping and acceleration of vehicles.
The correlation coefficients between NAIN with high and low radius as well as NACH with high and low radius are correlated with sound pressure levels. The variables from the intelligibility analyses are also added.
Table 6 shows the results. The higher the values, the better the degree of spatial legibility, which again correlates with the degree of sound pressures levels. As it turns out, the through-planned area ZHUN East scores poorly in all analyses, which implies a low degree of an understandable spatial logic for orientation, also for visually impaired people.
4. Discussion and Conclusions
What is the correlation between spatial configuration and sound pressure levels? Seemingly, the correlation between street connectivity and global integration matters for wayfinding for all kinds of people. This correlation measures a neighbourhood’s degree of spatial intelligibility or legibility. A neighbourhood with a low degree of spatial intelligibility affects the degree of orientability for visually impaired people as well. As earlier research has shown [
9,
12,
14,
28], modern planned neighbourhoods tend to inhabit these features and tend to demonstrate a low correlation between traffic flow and pedestrian flow data. In addition, we added the correlation coefficient between recent space syntax calculations. As the findings show, the correlation coefficient between the level of ‘to-movement’ and ‘through-movement’ potentials on a local, as well as on a city, scale matters for the degree of sound pressure levels. From the comparison of the urban spatial characteristics of the selected neighbourhoods and the sound pressure level measurements in Biskra, the following conclusions can be drawn from the four selected neighbourhoods:
La Gare (C) is the noisiest neighbourhood, corresponding to the fact that it has the most accessible and intelligible spatial configuration. The highest ‘to-movement’ as well as ‘through-movement’ spatial potentials are found in this neighbourhood, which give the streets and roads high sound pressure levels. This area can be perceived as being close to a city centre for a visually impaired person.
M’cid (A) is the calmest neighbourhood, corresponding to the fact that it has the lowest accessibility and intelligible spatial configuration. Here, the lowest ’to-movement as well as ‘through-movement’ spatial potentials are found. This area can be easily perceived as a local dwelling area for a visually impaired person.
The neighbourhood with the highest average spatial integration values has the best accessibility and intelligibility. This implies a high level of human movement, which is characterised by its high sound pressure levels. This means that the sound pressure levels and global integration values have a strong correlation. Often, the main routes of these types of neighbourhoods have high volumes of vehicle transport on the main route network, which causes high levels of sound pressure. The neighbourhood Hai Ferat (D) is an example of this.
The modern planned neighbourhood ZHUN East (G) has low degree of intelligibility, which affect the low correlations between sound pressures data and various space syntax variables. A feature of these kinds of neighbourhoods is that the vehicle and pedestrian routes lacks a natural social logic on the spatial arrangements. As earlier space syntax research has shown, visitors tend to get lost and the locals know the routes to drive inside these types of neighbourhoods [
9,
12,
26,
31]. Therefore, these neighbourhoods can be a challenge to orient through for visually impaired people too. From a bird’s eye perspective, modern through-planned neighbourhoods tend to look well organised and to have a clear order. However, the spatial structure tends to be hard to understand when moving inside them [
9,
11].
As a consequence, from the first stages of conception and planning in two-dimensional level of urban spaces, urban sound characteristics can be predicted with the help of the space syntax method. Seemingly, what matters is the correlation coefficient between various local spatial parameters with city wide spatial parameters. Our findings show so far that the following spatial parameters reduce the level of orientability for visually impaired people:
- -
Low correlation between the ‘through-movement’ potentials with a high and low metrical radius
- -
Low correlation between the ‘to-movement potentials’ with a high and low metrical radius
- -
Low correlations between global axial integration and street connectivity
Even though only one city was studied, the next step is to test to what extent these findings account for other types of built environments, such as gated communities, built environments located in areas with a different, but stable weather conditions than the dry dessert climate, and to investigate the recent regenerated central urban areas that have banned vehicles. So far, the following can be stated: traditional urban areas have a strong correlation between the degree of spatial orientability and sound pressure levels, whereas it is weak in modern planned urban areas. The findings regarding spatial orientability and intelligibility are in line with several other space syntax analyses of other cities across the world [
9,
12,
13,
14,
15,
16,
17,
18]. This is shown in the Biskra case but also some of the others, but there are few studies on noise pollution and these spatial variables correlate with sound pressure levels [
19,
20,
21,
22,
23,
24,
25].
The pre-determination of urban sound characteristics can help in designing urban spaces with high accessibility and orientability for visually impaired people. When the degree of intelligibility is high in a neighbourhood, high spatial integration of the street network implies a high level of noise, and conversely, low spatial integration implies low level of noise from traffic. Streets with high through-movement potentials tend to have high noise levels and can therefore be easily identified as main routes for visually impaired people. Streets with high to-movement potentials indicate the locations of urban centres and can be identified as shopping areas for visually impaired people. These findings indicate that a mental route network with mental destinations for shopping areas based on sound levels can be created for visually impaired people. The next step is to interview visually impaired people to test to what extent this presumption is true.
These findings are, to some extent, in line with the theory of natural movement, which means that space syntax can be applied to plan legible neighbourhoods for visually impaired people. The theory of natural movement has a high level of predictability [
11]. Throughout the years, space syntax has been applied in the regeneration of poorly functioning neighbourhoods. Examples on this are the regeneration of Trafalgar and Woolwich Squares in London [
28]. These new regeneration plans have improved the accessibility and orientability of these squares for pedestrians in the city in line with the spatial configurative changes of the movement network.
The findings from Biskra are also in line with the research results from noise pollution and levels of spatial integration from London [
19] and Dhaka [
25]. Even though space syntax only takes spatial relationships into account in the spatial calculations, the analyses results seem to be a good predictor on soundscapes. The street width and speed limit are not taken into account in this inquiry. However, as earlier research on noise pollution and spatial integration has shown, street width and speed limits have little influence on the outcomes of the results. What is of interest is that shops, shopping malls, cafés, bars, and other people attracting enterprises tend to locate themselves in the streets with the highest to-movement potentials. All these spatial aspects also affect the sound levels in central areas.
What then are the challenges in applying space syntax in the planning and regeneration of neighbourhoods for visually impaired people? Clearly, space syntax has the potential for this. However, more research is needed. The conclusions are so far based on four different neighbourhoods in only one city. The next step is to involve visually impaired people in the research project and to test out these findings on neighbourhoods in other countries. In addition, future research should also focus on making differentiations for the various types of sound. The noise from streets dominated by vehicle transport sounds different than streets dominated by pedestrians. As earlier space syntax research has shown, high local axial, angular choice and segment integration with a low metric radius enhance high levels of pedestrian movement on streets. Conversely, high global axial, angular choice, and segment integration with a high metric radius enhance high levels of vehicle transport flow on streets and roads [
10]. Neighbourhoods with low levels of spatial intelligibility have challenges for orientation and wayfinding for visitors and visually impaired people [
14]. At least this is a first step to identify the spatial parameters of a refined ‘soundscape mental map’ for visually impaired people with variations of noise from people and vehicles. More research is therefore needed before focused planning strategies can be implemented with the purpose of achieving the sustainable development goal 11 to achieve inclusive, safe, and resilient neighbourhoods for visually impaired people.


