1. Introduction
In the process of implementing a green innovation development strategy and economic transformation and upgrading, small- and medium-sized technology-based enterprises (technology-based SMEs) play an irreplaceable role. The development of technology-based SMEs has become an important force in social and economic development. To develop for a long time, enterprises should actively carry out scientific research and innovation activities, improve their transformation ratio of scientific research achievements, and strive to become innovative model enterprises [
1]. As an evaluation index of green technology innovation activities, green technology innovation efficiency is of great significance in guiding enterprises on how to allocate resources and the government on how to formulate subsidy plans.
As the source of the motive force for regional green growth, green technology innovation has been increasingly encouraged and supported by national policies in recent years, and the input of various innovative resources has increased significantly [
2]. At the same time, academics have carried out a lot of research on the utilization efficiency of regional innovation resources behind the rapid expansion of R&D scale. In [
3], the authors analyzed whether undertaking R&D activities allows SMEs to attenuate the negative impact of recessions on productivity. The results show both that R&D activities render positive productivity returns, and that performing R&D helps to alleviate the negative effects of downturns on productivity. In [
4], the authors discussed the relationship between a company’s investment in innovation and its success in introducing a new product or process innovations. The results show that, beyond the acknowledged effect of R&D in increasing the probability of success of a product innovation, a larger-than-expected role is played by technology acquisition in the innovation process. The authors in [
5] assessed the relationship between green innovation and SMEs development in market turbulence conditions with respect to the role of green entrepreneurship. They showed that there was a significant relationship between green innovation and SMEs development with respect to the mediating role of green entrepreneurship, including in market turbulence conditions. The authors in [
6] examined the impact of different types of innovation on the business performance of SMEs using a multi-dimensional analytical approach. The authors in [
7] summarized and synthesized the evidence on SMEs innovation, exporting, and growth, paying particular attention to internal and external enablers, and to the interplay between innovation and exporting in SMEs’ growth. The authors in [
8] analyzed the determinant factors of eco-innovation, considering business units with different levels of technological intensity. The empirical evidence obtained indicates a positive and significant effect of lean management principles on eco-innovation.
From the research field and perspective, the existing literature mainly focuses on the evaluation of green technology efficiency and its influencing factors in industry, particularly in the energy and manufacturing industries. Studies based on provincial panel data are more common, and a small number of studies have observed the industrial heterogeneity of green technological innovation. Few studies are based on the micro-enterprise or urban dimension, closely linked to the difficulty of obtaining resource, environmental, and patent data in the relevant areas. For example, [
9] divided green technology innovation into green product innovation and green process innovation, using China’s provincial panel data to measure green technology innovation from the perspective of energy conservation and emission reduction, and studied the impact of environmental regulation and government R&D funds on green technology innovation. The authors in [
10] investigated the relationship between green technology innovation and energy intensity in 29 provinces in mainland China from 1999 to 2010. According to the change of energy intensity in the data, these provinces are divided into four groups: the traditional group, gradient group, contemporary group, and low carbon group. The empirical results show that there is a negative and long-term cointegration relationship between energy intensity and green technological innovation. The study also found that there is single causality between green technology innovation and energy intensity in the traditional and low-carbon groups, and green technology innovation directly affects energy intensity through a feedback system for the gradient and contemporary groups. The authors in [
11] took energy-intensive listed companies operating in China from 2011 to 2017 as the research object, and empirically studied the relationship between risk-taking level and green technological progress by dividing the process of green technological progress into green technological progress intention and green technological progress performance. The results showed that higher levels of risk-taking have a negative impact on green technology innovation performance and green-based technological progress, while the most important factor is the intensity of industrial competition. The study found that various external factors, such as environmental regulations, government R&D subsidies, and regions, have a significant impact on a company’s global technological innovation intention. After analyzing the innovation and R&D processes of Indian manufacturing enterprises, [
12] found that the introduction of foreign technology and the increase of R&D investment have a positive impact on the technological innovation efficiency of enterprises. In addition, these factors determine the performance of green technology innovation and the level of risk-taking and R&D investment. These studies provide rich materials and research direction for this paper.
From the perspective of efficiency evaluation methods, the existing research used efficiency measurement methods such as ecological footprint [
13,
14,
15], layout coefficients [
16,
17], the stochastic frontier model [
18,
19,
20,
21], and data envelopment analysis (DEA) [
22,
23,
24,
25,
26,
27] based on different considerations, where the DEA method is the most widely used. The authors in [
28] evaluated and studied the technical efficiency of 35 large membrane bioreactors (MBR). According to the investment and operation data, the marginal cost and environmental benefits were evaluated. According to the non-radial distance function method under the DEA framework, it was found that the efficiency was also affected by external factors, such as regional economic level and population density. The authors in [
29] used the two-stage data envelopment analysis model to empirically analyze the technological innovation efficiency of 1039 Korean manufacturing enterprises at each stage. They found that the technological innovation efficiency gap between the two stages is large, and the enterprise scale and industry nature have an important impact on the overall efficiency. The authors in [
30] constructed three models of non-radial directional distance function-data envelopment analysis to evaluate the efficiency of green industrial innovation activities at the present stage, objectively measured the importance of China’s heavy pollution industry and the development efficiency of green environmental protection technology innovation and discussed the influencing mechanism of external factors. The empirical results of heavy polluting industries in China show that the green innovation efficiency of heavy polluting industries in China is generally low, and the whole industry is in the transition stage of “effective innovation rather than green”. The uncertainty of environmental regulation policies’ effect, excessive dependence on external technology, and uneconomical industrial scale are key factors to consider to improve the efficiency of green innovation in China’s heavy polluting industries, which have a significant negative impact on green innovation efficiency.
To sum up, the evaluation research on green technological innovation efficiency in academia mainly focuses on the level of industry and provincial or listed enterprises and lacks research on the green technological innovation efficiency of technology-based SMEs in specific provinces. DEA is mainly used to measure efficiency, but the traditional DEA analysis method has some defects, such as ignoring the “non-ideal output” and ignoring the output indicators of “sacrificing output to improve social benefits” in reality. Therefore, the accuracy of evaluating the efficiency of green technological innovation is not high, and it is necessary to construct a new model for measurement. Therefore, this paper takes Hebei Province as the research area and takes the green technological innovation efficiency of technology-based SMEs as the research object and constructs a new system that can accurately evaluate the green technological innovation efficiency of technology-based SMEs. The rest of the article is arranged as follows.
Section 2 designs the evaluation index system of the green technology innovation efficiency of science and technology small- and medium-sized enterprises in Hebei Province from two dimensions of input and output, in which the undesirable output index is introduced at the output level.
Section 3 constructs the undesirable SBM and Malmquist index models.
Section 4 evaluates the internal distribution and development trend of the green technological innovation efficiency of technology-based SMEs in Hebei Province from the time dimension and space dimension based on the static efficiency value and dynamic efficiency value.
Section 5 summarizes the research results.
4. Analysis and Discussion
4.1. Data Source and Processing
The samples selected in this paper are all technology-based SMEs in all regions of Hebei Province by the end of 2020 (in accordance with the 13th Five-Year Plan for Economic and Social Development of the People’s Republic of China), and the data source is the comprehensive service platform for technology-based SMEs in Hebei Province.
Data processing mainly includes the following categories:
- (1)
Numerical missing processing
It was found, through consulting the statistical yearbooks, that there is a lack of statistical data in some years in some regions. In order to complete the empirical results more scientifically and reasonably, the interpolation method was used in this paper to deal with the missing values of the data, which calculates the average value of the numbers through the data of the previous two years to represent the missing values.
- (2)
Excluding the impact of price factors
The data obtained in this paper from the platform are all based on the price of the year. Therefore, there was a need to eliminate price factors between year data to ensure comparability. In view of the above reasons, the price factors of research and development expenditure and sales income from the new products of technology-based SMEs were eliminated in this paper. Therefore, this study adopted the permanent inventory method to deal with the internal expenditure of R&D funds and the sales income of new products and converted it into the data of the statistical year based on 2011. The depreciation rate was set as 15% to eliminate the price factors between the data [
32,
33,
34].
4.2. Overall Analysis and Discussion on the Green Technology Innovation Efficiency of Technology-Based SMEs
Based on the SBM model with undesirable outputs and the green technology innovation efficiency evaluation index system of technology-based SMEs, stata16 software was used to calculate the green technology innovation efficiency of technology-based SMEs in 11 prefecture-levels of Hebei Province from 2011 to 2020 and compared it with the green technology innovation efficiency without undesirable outputs, as shown in
Table 2 and
Table 3. In the tables, RN refers to the innovation efficiency of green technology not containing undesirable outputs, and RI refers to the innovation efficiency of green technology containing undesirable outputs.
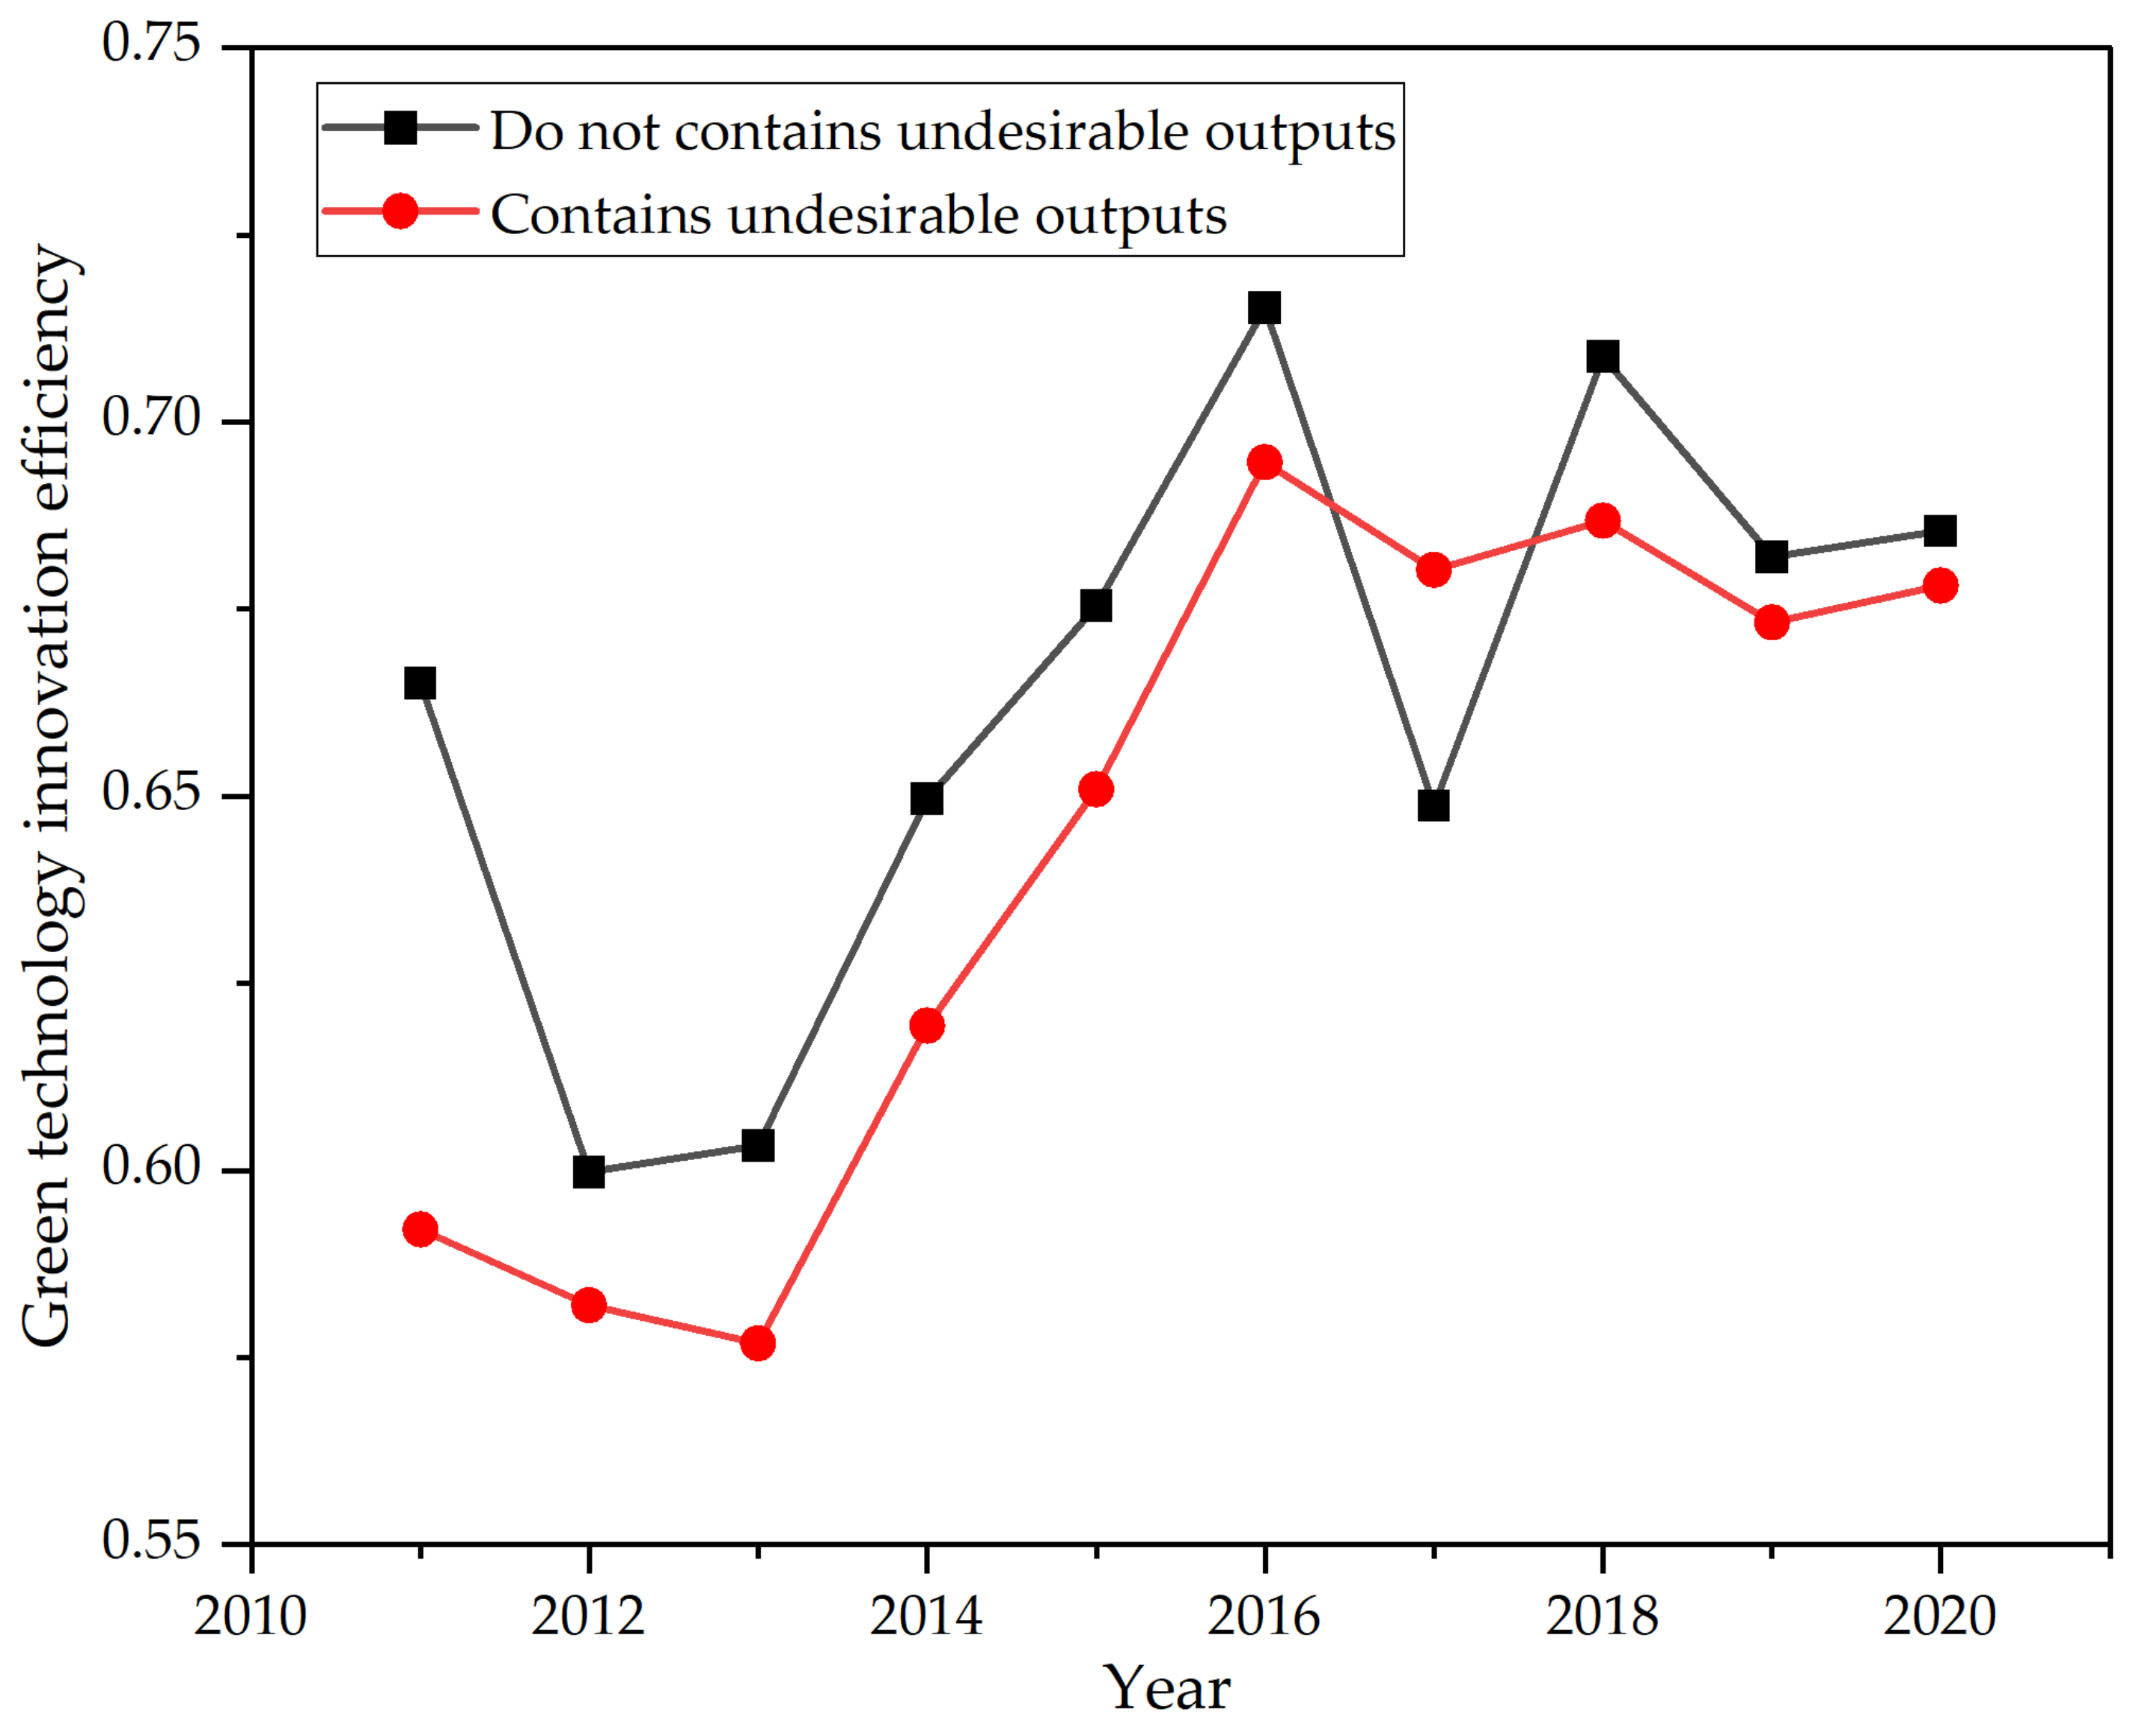
In order to more clearly observe the change trend of the green technological innovation efficiency of technology-based SMEs in Hebei Province in the past 10 years, a trend diagram of the average green technological innovation efficiency of technology-based SMEs in Hebei Province in the past 10 years was drawn, as shown in
Figure 1.
Figure 1 shows that the green technology innovation efficiency of technology-based SMEs in Hebei Province was generally on the rise from 2011 to 2020. Specifically, the efficiency of green technology innovation for technology-based SMEs in Hebei Province declined from 2011 to 2013, and gradually increased from 2014 to 2016, and remained stable in the following years. Without considering the undesired output, the average value is 0.6633 from 0.6651 in 2011 to 0.6854 in 2020; taking into account the conditions of undesired output, from 0.5921 in 2011 to 0.6781 in 2020, the average value is 0.6434. It is clear that the efficiency of green technology innovation that does not include undesired outputs is higher than that including undesired outputs, indicating that the efficiency of green technology innovation has decreased after considering environmental factors. Overall, efficiency levels in both cases showed an upward trend. In recent years, in order to enhance the green innovation power of technology-based SMEs and accelerate the construction of innovative projects, the Hebei provincial government has issued a series of policies and regulations to introduce technology-based SMEs to the path of green innovation. Through the carbon emission rights and trading system, the Hebei provincial government has incorporated carbon emissions and air quality into the work evaluation system, strengthened supervision, and significantly improved the local natural environment. At the same time, Hebei province has lowered taxes and rent to reduce production costs and encourage enterprises to carry out green innovation activities. In addition, with the improvement of China’s higher education, the national civilized quality levels increased significantly along with the public’s awareness of ecological and green consumption; therefore, in consideration of their reputations, enterprises have to pay more attention to environmental protection. All of these factors can help small and mid-sized enterprises in Hebei province improve their overall green technological innovation efficiency. In order to more clearly observe and compare the green technology innovation efficiency of technology-based SMEs in different prefecture-levels of Hebei Province, an average comparison chart of green technology innovation efficiency with and without unintended output were drawn, respectively, as shown in
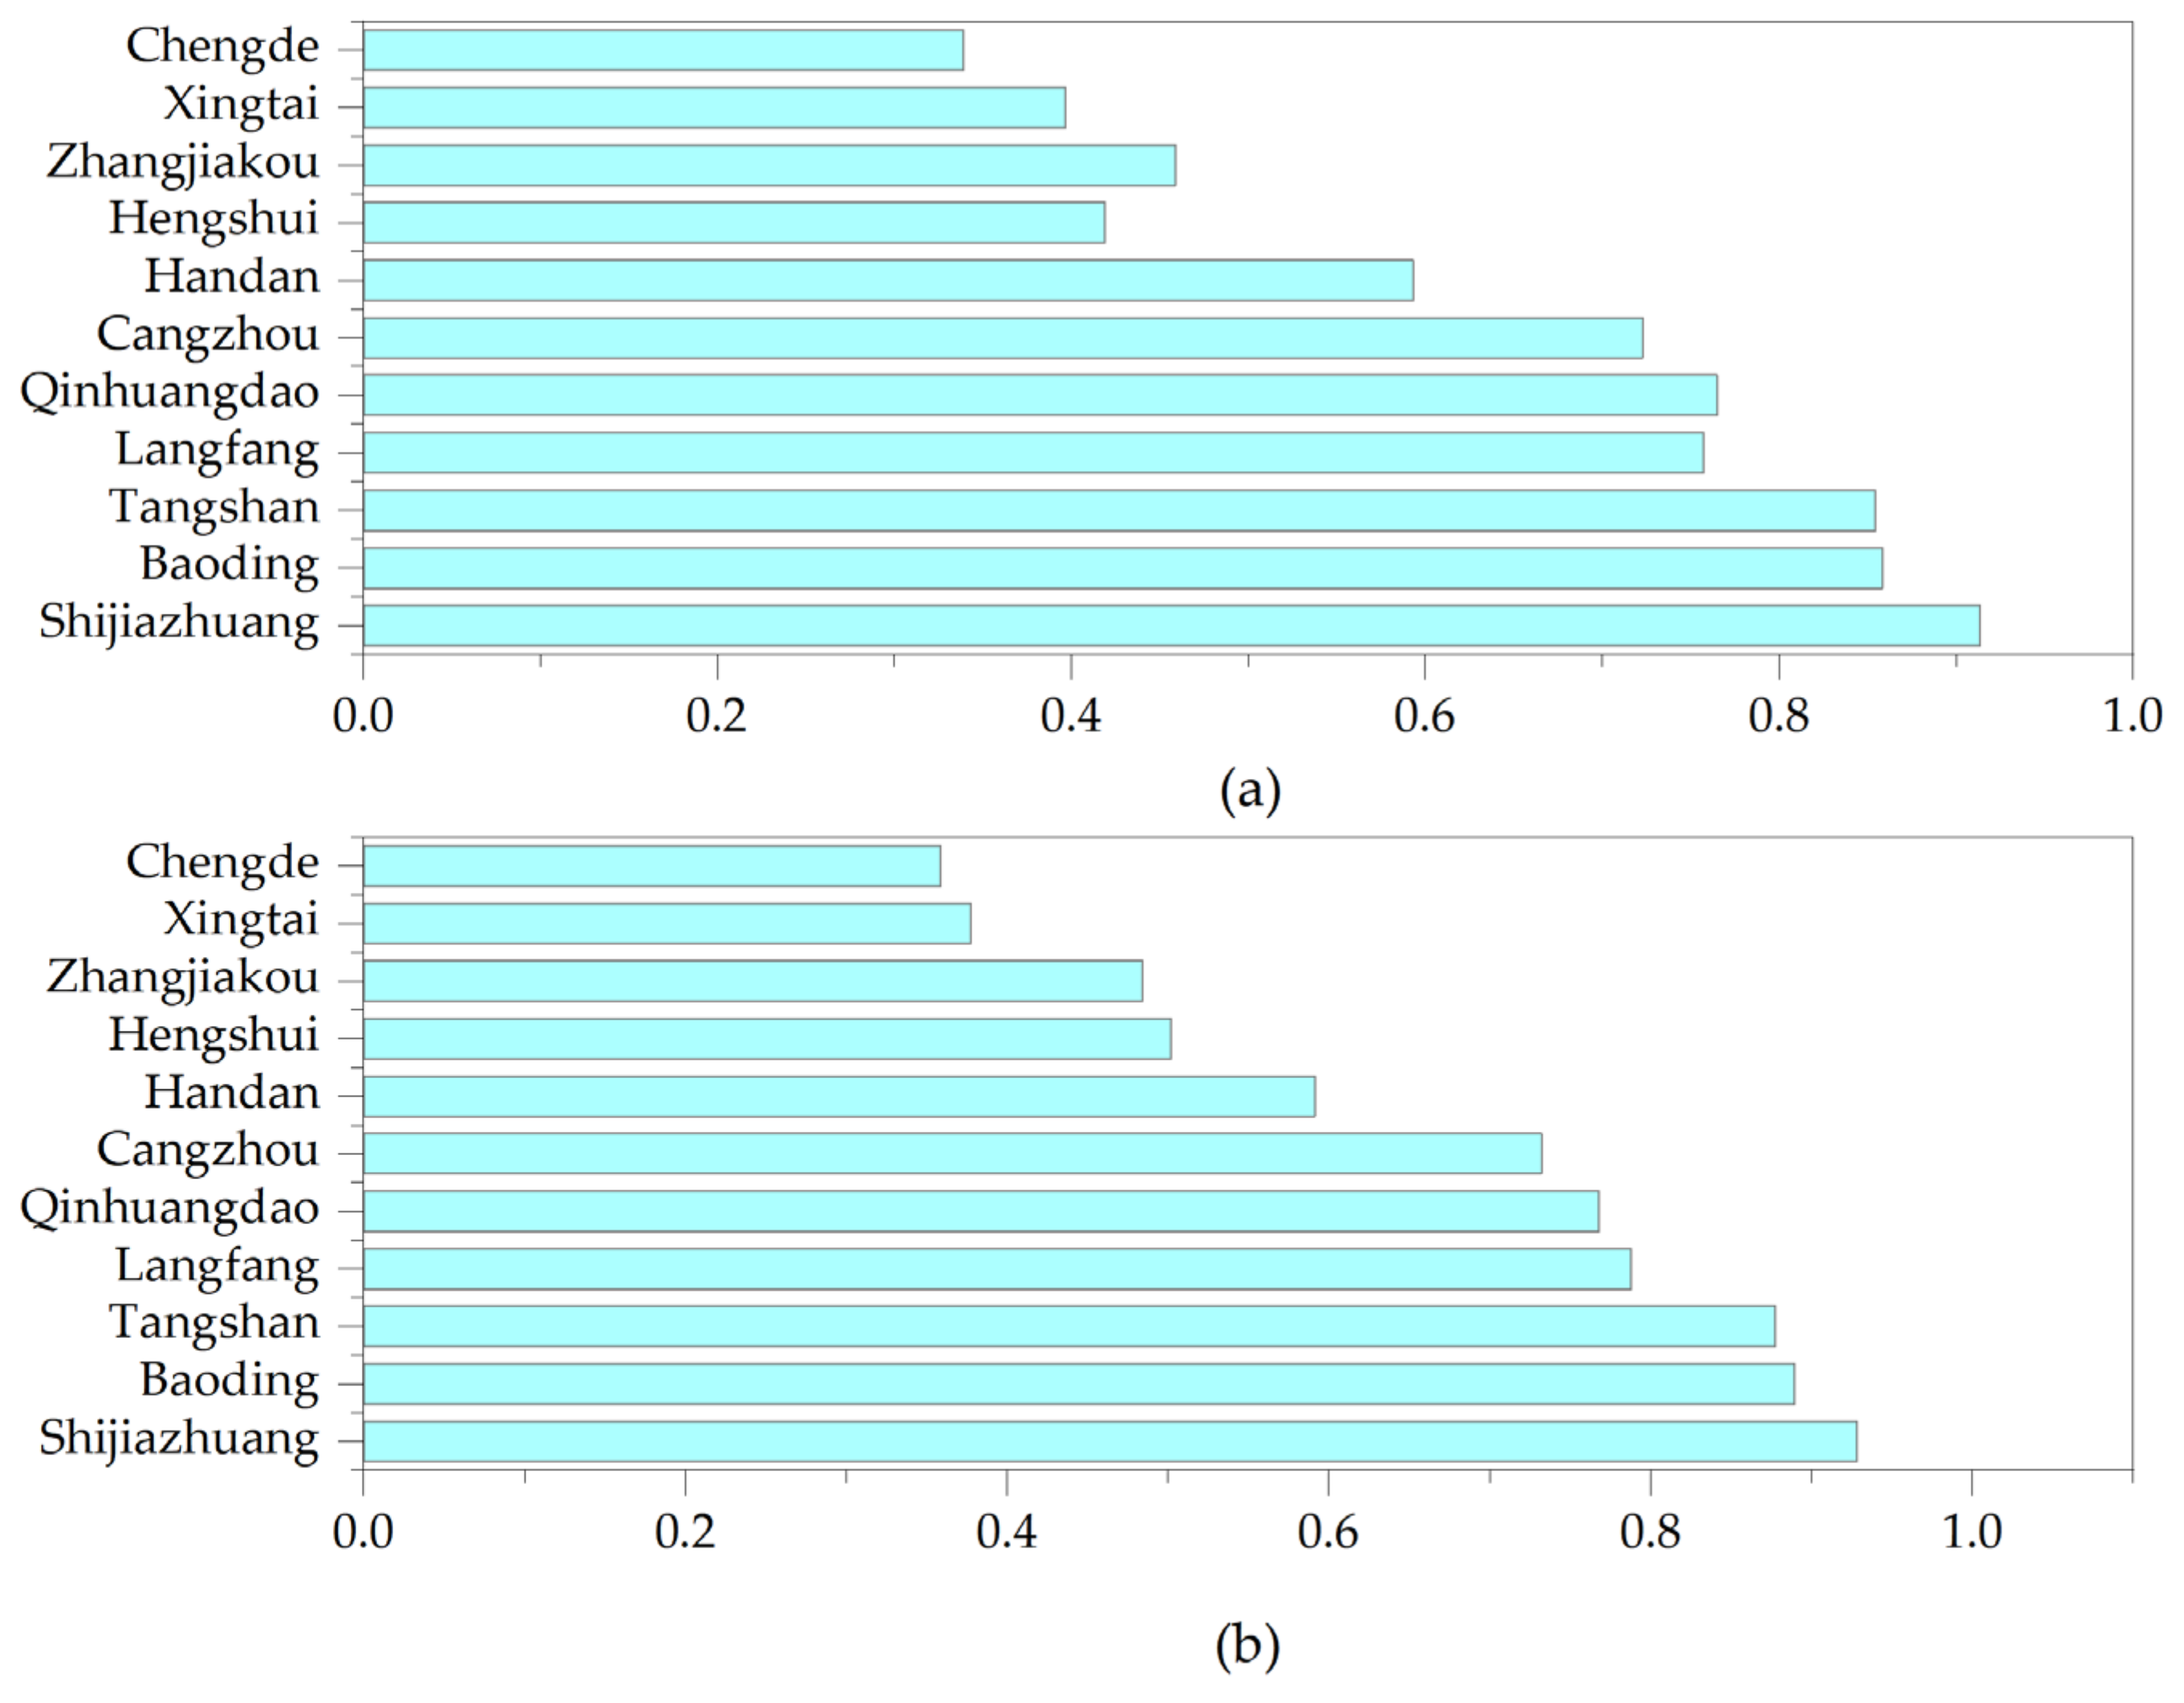
Figure 2.
The prefecture-levels with the top six average values of green technological innovation efficiency that include undesirable outputs are Shijiazhuang, Baoding, Tangshan, Qinhuangdao, Langfang, and Cangzhou., while the prefecture-levels with the top six average values of green technological innovation efficiency that do not include undesirable outputs are Shijiazhuang, Baoding, Tangshan, Langfang, Qinhuangdao, and Cangzhou. It is not difficult to see that the green technology innovation efficiency is generally higher in the economically developed prefecture-levels in Hebei Province. These areas are rich in resources, high in labor force and densely distributed areas of key universities in Hebei Province, and have gathered a large number of high-level talents. In addition, the policy dividend was seized in its early years, and the opening-up was earlier and greater, leading the development level of other regions in Hebei Province. In both cases, Handan, Hengshui, Zhangjiakou, Xingtai, and Chengde rank as the last five prefecture-levels in terms of the mean efficiency of green technology innovation. Except for Zhangjiakou and Chengde, these cities have more serious industrial pollution, and most of them are dominated by heavy industry. In the future, there is still much room for improvement in green innovation in these regions. Efforts should be made to introduce technology and capital, attract and train talent, and improve the innovation environment to build a sound green innovation system, so as to achieve green and sustainable economic development. When considering undesired outputs, the regions where the efficiency of green technology innovation has risen are Qinhuangdao and Zhangjiakou. Obviously, the external green innovation environment of Qinhuangdao and Zhangjiakou is better than that of other prefecture-levels, and the undesired outputs are lower environmental pollution; when considering undesired outputs, the regions with lower rankings of green innovation efficiency are Langfang and Hengshui, indicating that their environmental factors have different degrees of restriction on the improvement of the green technology innovation efficiency of local technology-based SMEs. In the future, technological innovation and green development should be closely combined to promote the green development of local technology-based SMEs.
4.3. Analysis and Discussion on the Difference in Green Technology Innovation Efficiency of Small- and Medium-Sized Technological Enterprises
According to the above calculation results, the 11 prefecture-levels in Hebei Province are divided into three echelons of high efficiency, medium efficiency, and low efficiency according to the size of the green technology innovation efficiency value considering undesired outputs.
- (1)
Analysis of the green technology innovation efficiency level of technology-based SMEs in the first tier.
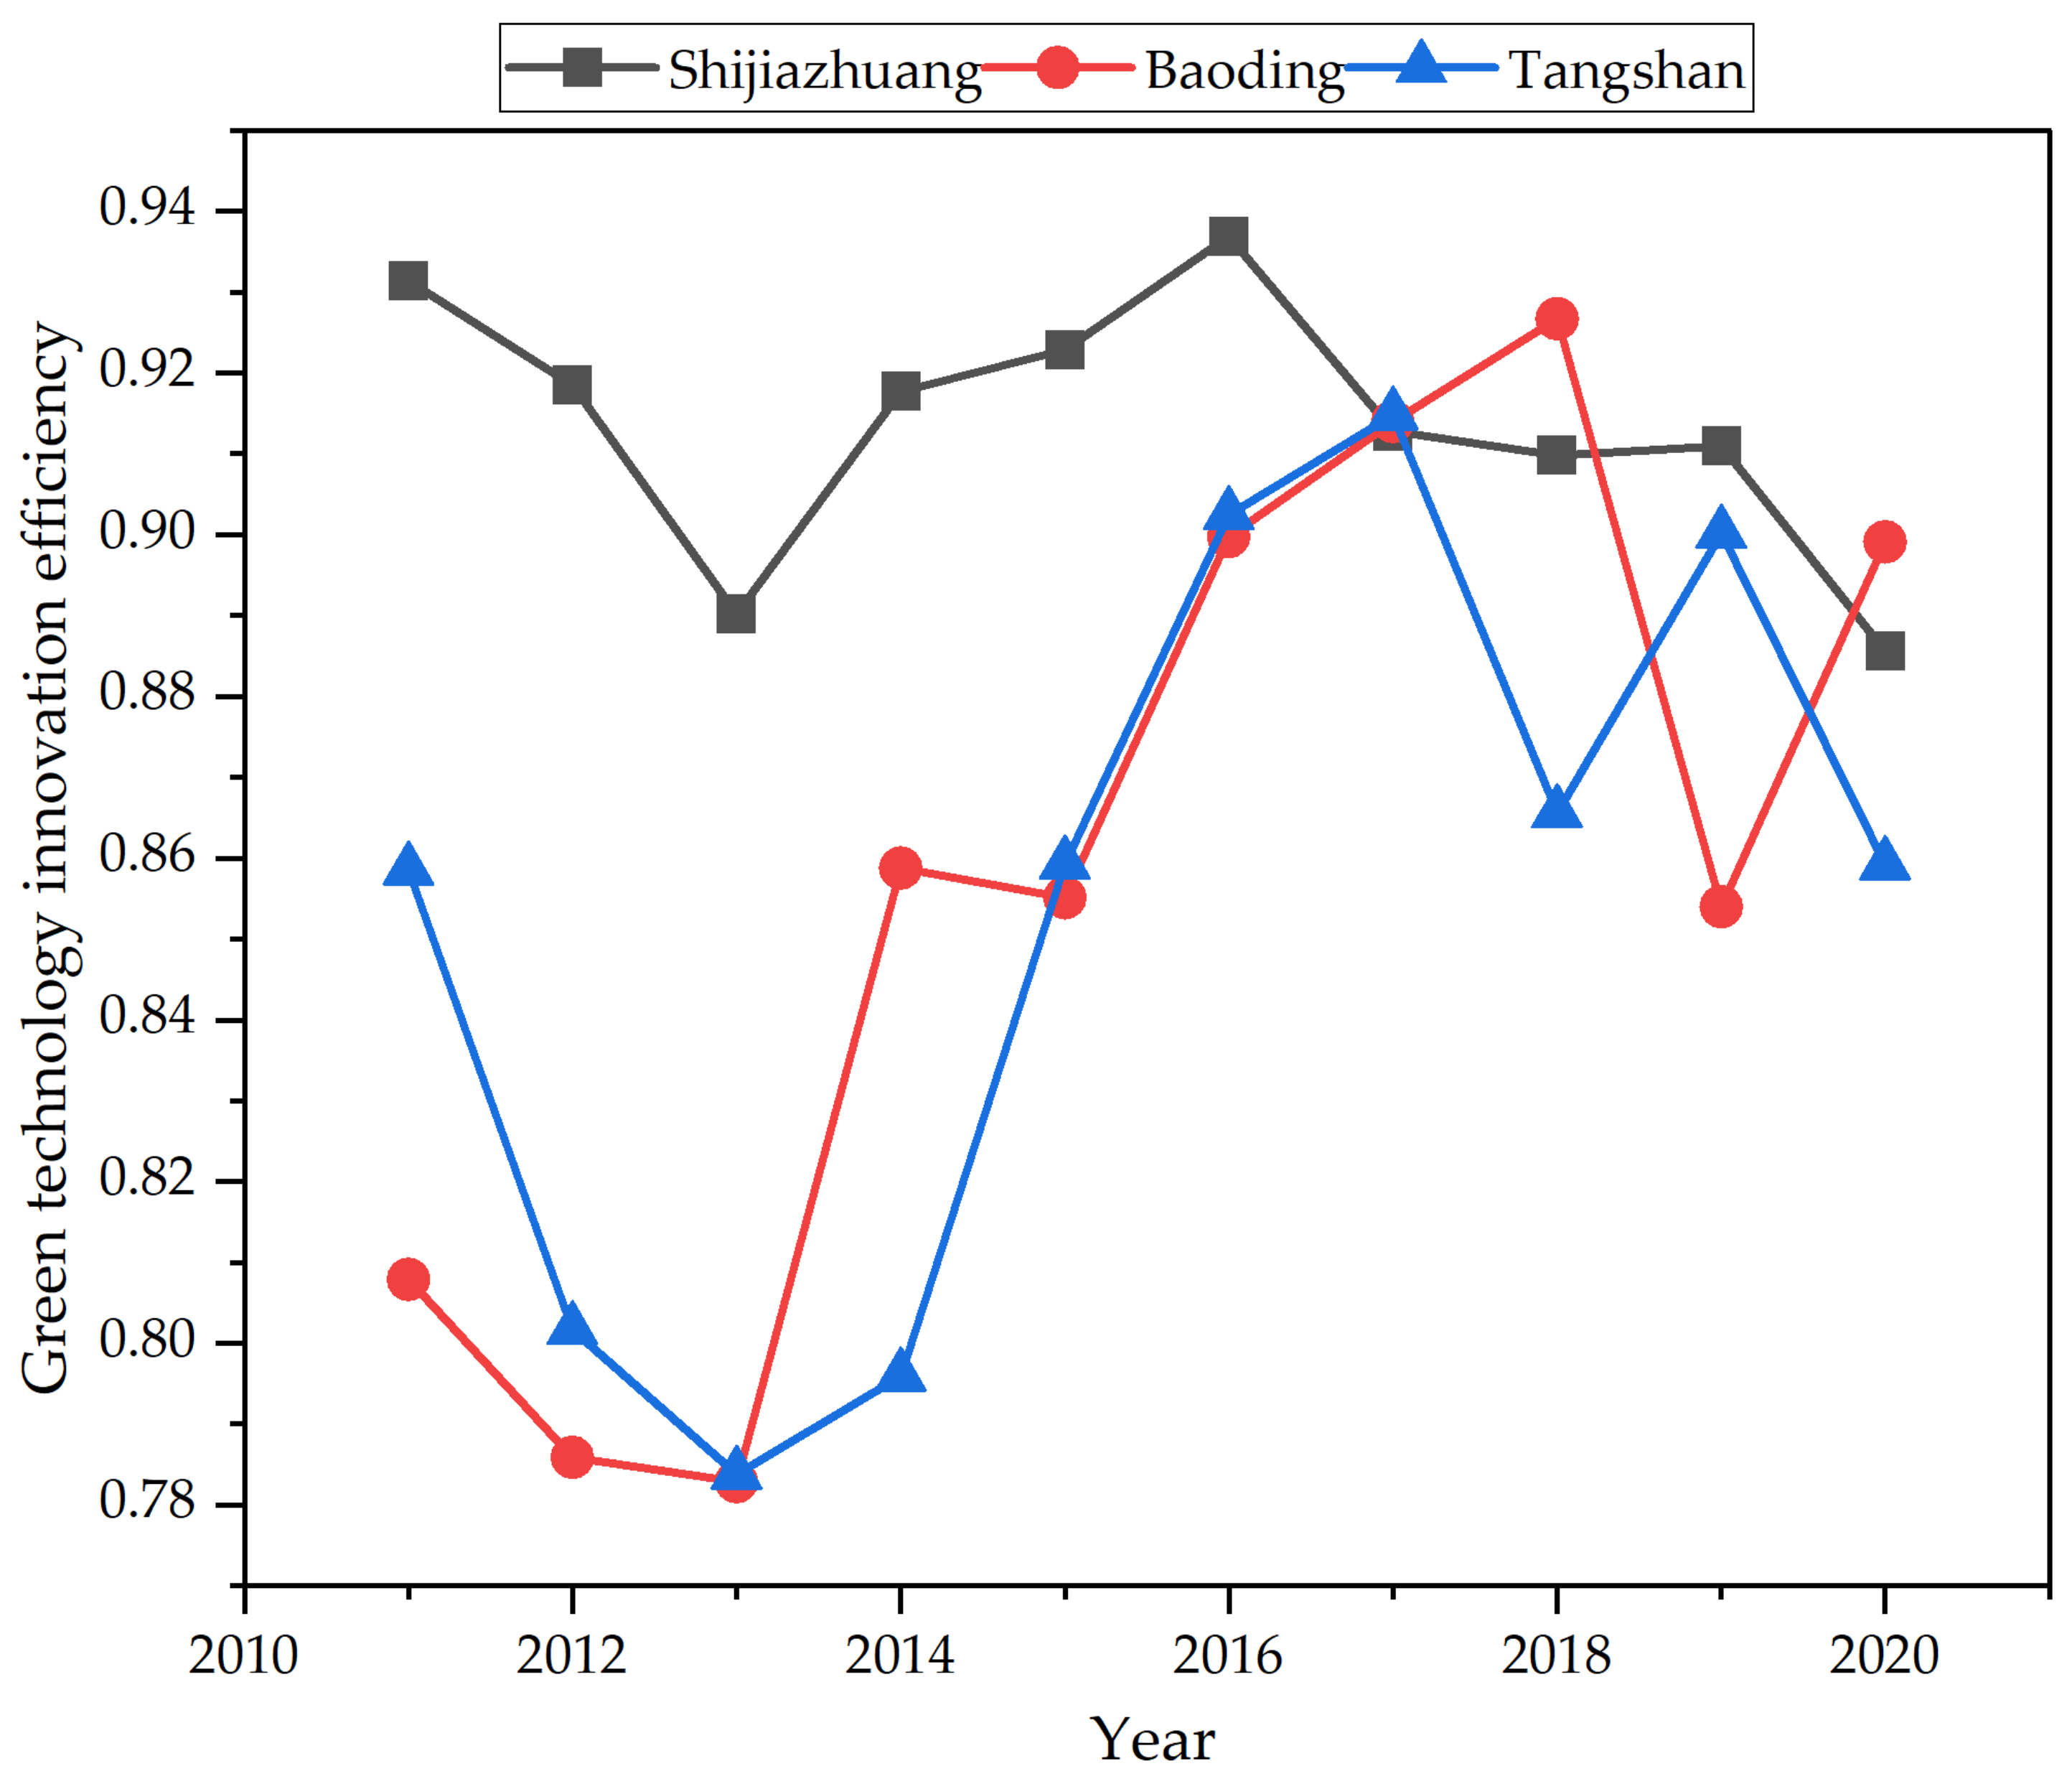
The first tier includes Shijiazhuang, Baoding, and Tangshan. The change of green technology innovation efficiency of technology-based SMEs in these three regions is shown in
Figure 3.
The above three regions have the highest green technology innovation efficiencies, with Shijiazhuang having the highest average. The main reasons are as follows. First, Shijiazhuang has an extremely rich industrial heritage and resources, whose quantity, quality, and coverage are rare in the province. According to the “Shijiazhuang City Land Use Master Plan” and “Shijiazhuang New Smart City Master Plan”, Shijiazhuang city focuses on the construction of the metropolitan space development pattern, guarantees the land demand for the development of central urban areas and clusters, and focuses on supporting the construction land demand for key projects such as high-tech industries. It has identified 46 key projects for smart city construction to improve the level of a new generation of intelligent infrastructure and promote industrial integration and innovation and the development of the digital economy. Secondly, the upgrading of Shijiazhuang’s industrial structure has been steadily advancing, the number of technological enterprises has been increasing, and the construction of a green production system has been accelerated. In 2020, 35 green production systems were added, the coke production was reduced by 500,000 tons, and 12 national and provincial technological innovation demonstration enterprises were registered. It can be seen that the effects of Shijiazhuang’s industrial transformation and upgrading have boosted the improvement of the urban environmental quality and promoted the green transformation of its industry while also improving the quality of development. Thirdly, the comprehensive improvement of Shijiazhuang’s industrial zone has achieved outstanding results. Although the early industrial layout of Shijiazhuang was not reasonable, the production technology was relatively low, and some areas had more serious pollution. Since the reform and opening-up, Shijiazhuang has listed environmental remediation of these heavily polluted areas as a key project of the city, and carried out environmental remediation in a planned way, resulting in a significant decrease in pollutant emissions per unit output value. Fourth, Shijiazhuang continues to improve its services to small- and medium-sized technological enterprises. Shijiazhuang has continued to carry out special actions for small- and medium-sized enterprises to relieve their associated dangers and difficulties and has strengthened the cultivation of “specialized and special new” small- and medium-sized enterprises. One hundred and seven enterprises have been rated as provincial “specialized, special and new” small- and medium-sized enterprises, ranking first in the province, and 11 enterprises were awarded by the Ministry of Industry and Information Technology Specialize with the special new title of “little giant”. The city has actively created entrepreneurial innovation bases for small and micro enterprises and has newly identified 2 provincial-level demonstration bases, 14-level bases, and 8-level demonstration bases. All of these efforts have created a good environment for the improvement of the green technology innovation efficiency of small- and medium-sized technological enterprises. Industrial cities pay more attention to green and sustainable development. Baoding and Tangshan have made historic breakthroughs in regional environmental protection and economic development in the process of promoting the development of the science and technology industries. Therefore, the green technology innovation efficiency of small- and medium-sized technological enterprises in the mentioned three regions is far ahead of other regions.
- (2)
Analysis of the Green Technology Innovation Efficiency of Technology-based SMEs in the Second Tier.
The second tier includes Langfang, Qinhuangdao, and Cangzhou. The change of the green technology innovation efficiency of SMEs in these three regions is shown in
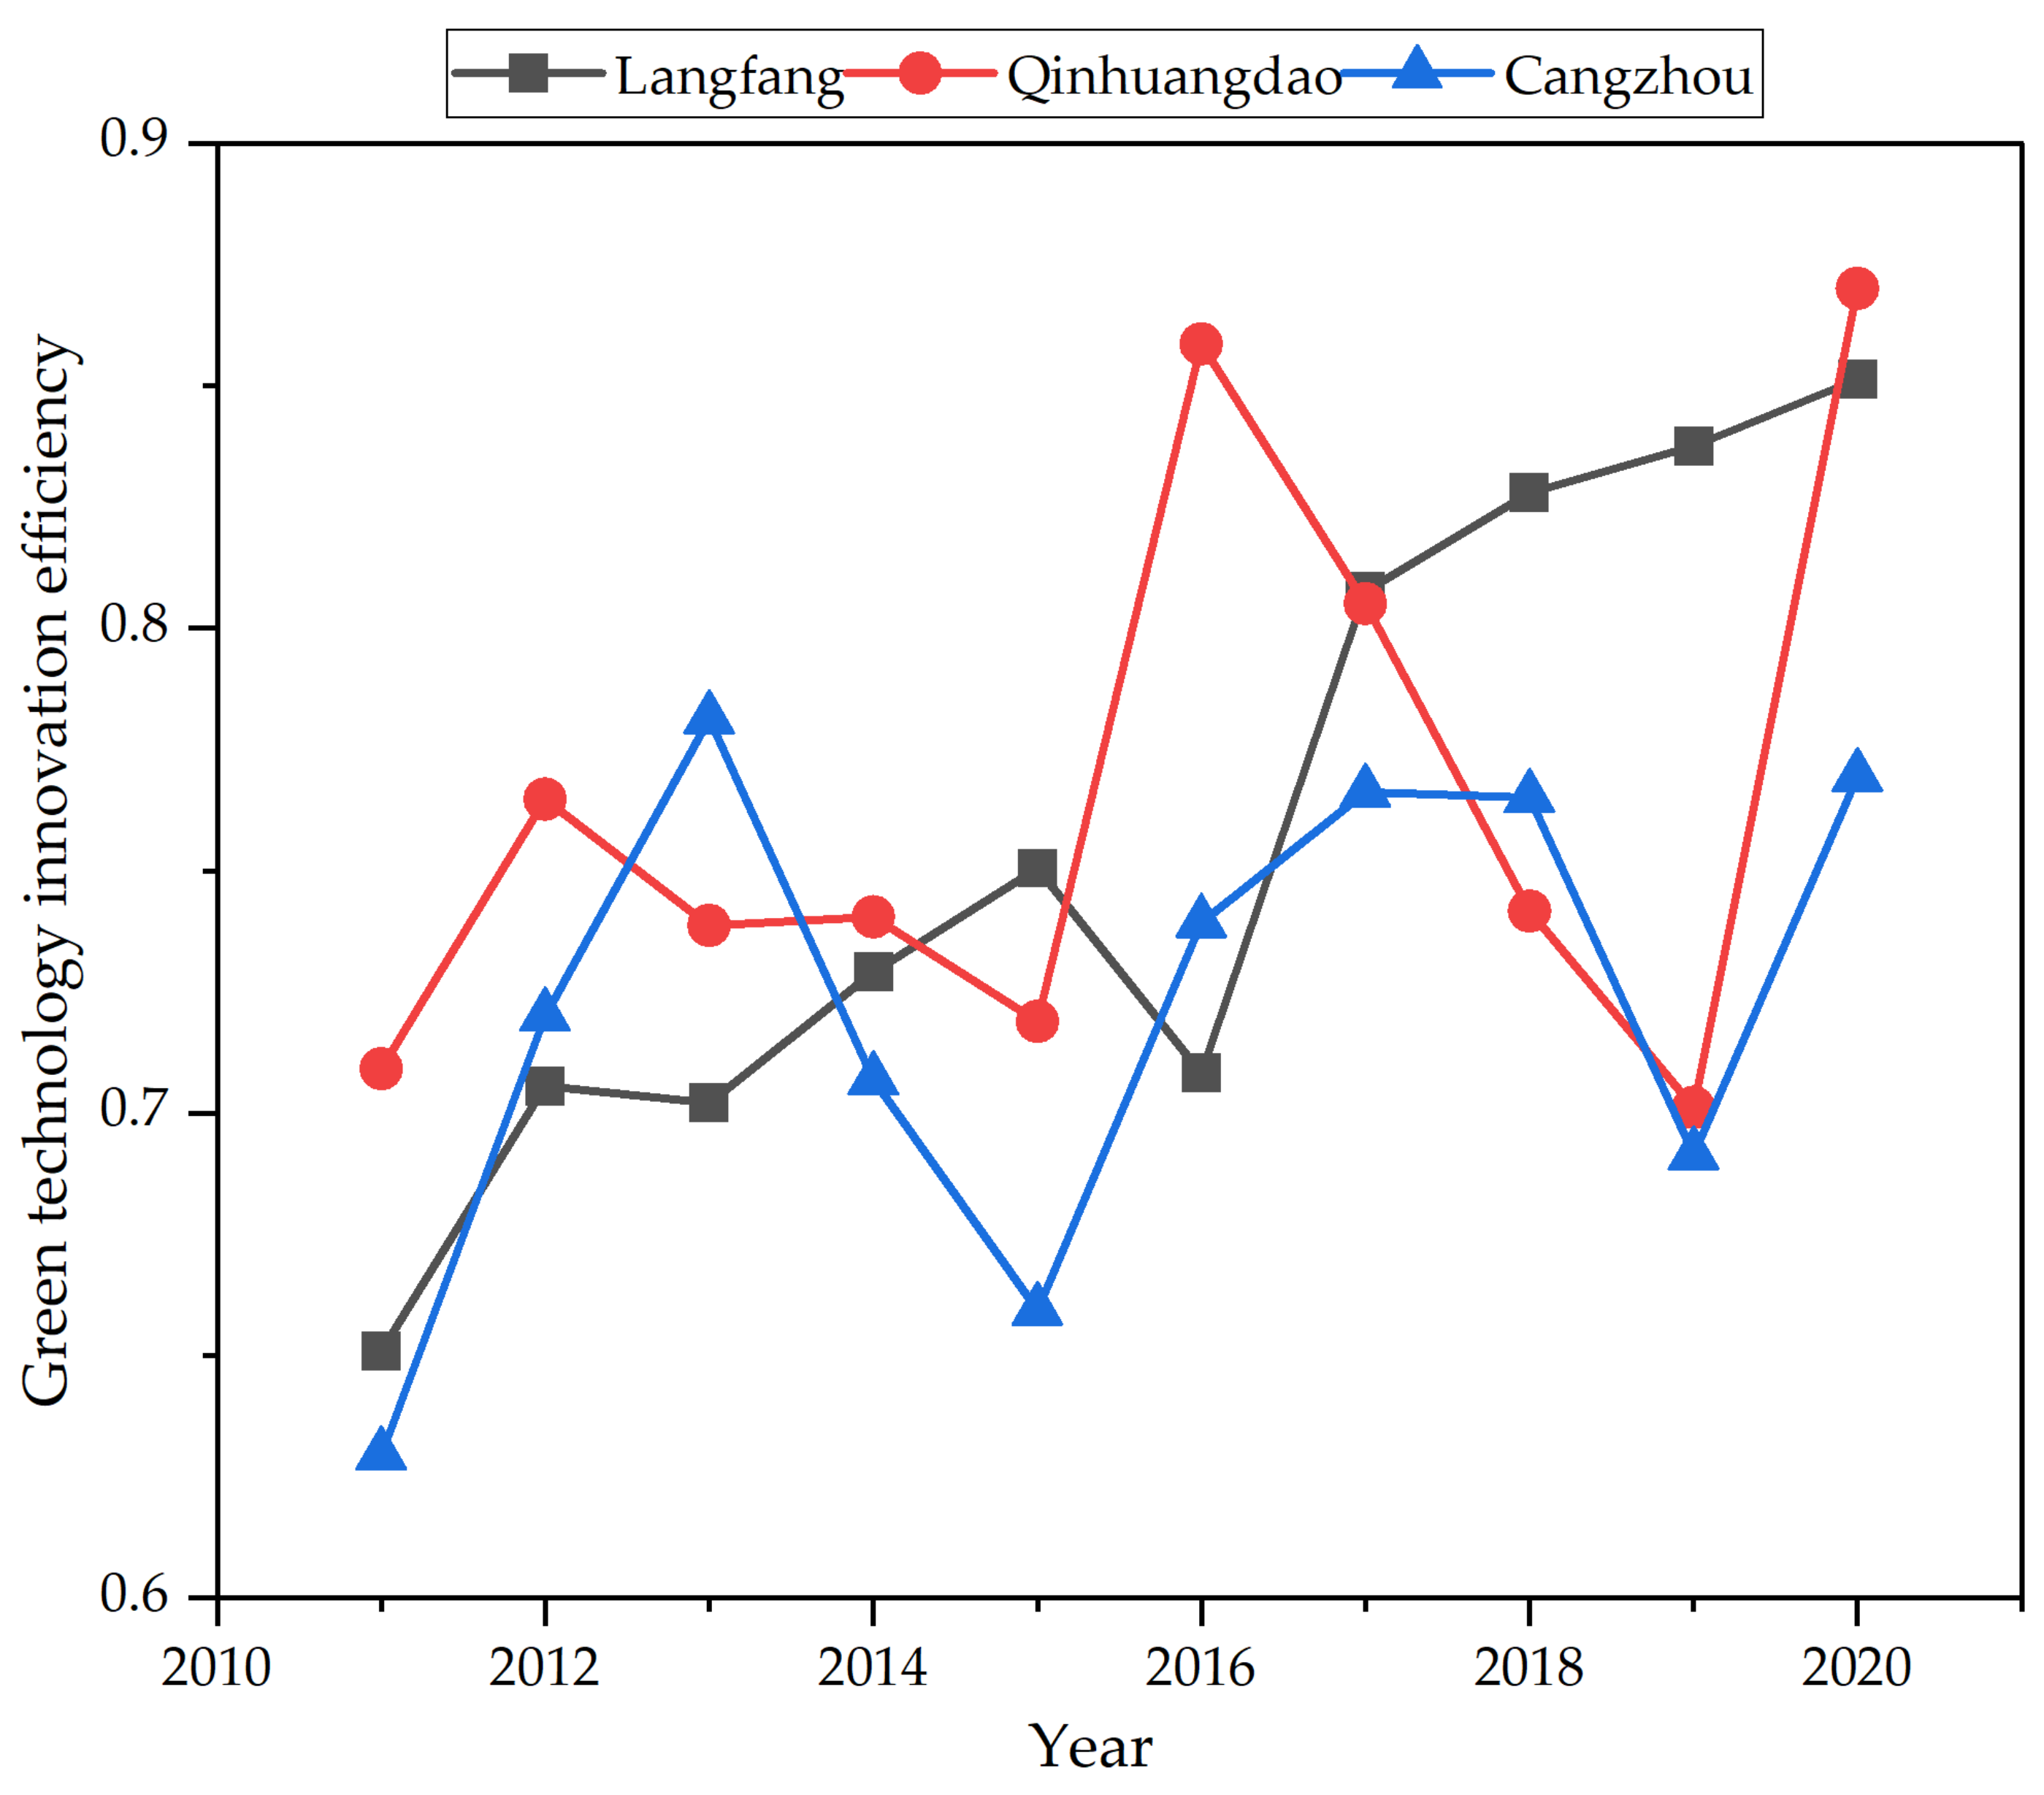
Figure 4.
It can be seen from
Figure 4 that since 2014, the green technological innovation efficiency of technology-based SMEs in Langfang has begun to increase year by year. In 2020, the green technological innovation efficiency value reached 0.8514, and the average green technological innovation efficiency within a 10-year period was 0.7571, indicating that the development trend of the green innovation level of technology-based SMEs in Langfang is good. The Ministry of Science and Technology of China’s latest released data from the “Technology-based SMEs Evaluation System” indicate that 747 enterprises in Langfang registered online, 364 participated in the evaluation, and 311 passed the evaluation. The pass rate was as high as 85%. Hebei Province ranked second in the total number of national-level small- and medium-sized enterprises entering the database. At the same time, Langfang has had a net increase of 574 provincial technology-based SMEs, incrementally ranking second in the province, which has a total of 7244 technology-based SMEs. In recent years, the green innovation ability of technology-based SMEs in Langfang has been prominent. Thanks to the continuous improvement of the regional innovation system with enterprises as the main body, market as the guidance, and the combination of production, learning, and research, local governments continue to encourage enterprises to increase R&D investment and promote the quality improvement of high-tech enterprises. Therefore, a number of “high-tech” and “unicorn” innovation enterprises have been cultivated. Qinhuangdao coastal areas are economically developed, but the layout of heavy polluting enterprises is concentrated, which is the most prominent contradiction between social and economic development and ecological environment security. The slow progress of green technology is an important limiting factor for the improvement of the green development level of technology-based SMEs in Qinhuangdao. Cangzhou is an important petrochemical industrial base in China. Although the industrial economy is relatively developed, it is accompanied by environmental pollution problems, and the correlation between industrial pollution and economic growth is relatively high.
- (3)
Analysis of the Green Technology Innovation Efficiency of Technology-based SMEs in the Third Tier.
The third tier includes Handan, Hengshui, Zhangjiakou, Xingtai, and Chengde. The change of the green technology innovation efficiency of SMEs in these five regions is shown in
Figure 5.
As can be seen from
Figure 5, compared with other regions in Hebei Province, the green technological innovation efficiency values of small- and medium-sized technological enterprises in Handan, Hengshui, Zhangjiakou, Xingtai, and Chengde are relatively low. In 2020, the green technological innovation efficiency values of small- and medium-sized technological enterprises in these five regions were 0.6058, 0.4718, 0.5417, 0.3115, and 0.3934, respectively, and the average green technological innovation efficiency of small- and medium-sized technological enterprises in these five regions was less than 0.6000 over 10 years. The average value of Chengde is only 0.3390, which is the region with the lowest green technology innovation efficiency of technology-based SMEs among the regions studied. This region has relatively concentrated poverty and multi-ethnic agglomeration around Beijing and Tianjin and bears the important responsibility of “blocking sand sources, water conservation and ensuring ecological security” for the Beijing–Tianjin–Hebei urban agglomeration. Its unbalanced and insufficient development and unsustainable problems need to be solved by scientific and technological innovation. The efficiency value of the green technology innovation of technology-based SMEs in Handan has gradually become close to that of several regions in the second tier after 2013. Due to the prosperous development of steel and coal in Handan, the industrial structure is biased. After the economy entered the new normal, Handan continued to rely on scientific and technological innovation to lead, support economic and social development, constantly optimize the environment for innovation and development, and promote the rapid growth of innovation subjects. At present, there are more than 10,000 small- and medium-sized sci-tech enterprises and 500 high-tech enterprises in the city, 8 times and 6 times higher than those enterprises in 2013. The small economy, low industrial level, and lagging development history of Hengshui forced the local government to dock the high-end scientific and technological talent resources in advance and create an excellent innovation and entrepreneurship environment. By 2020, the total number of technology-based SMEs in Hengshui reached 5636, about twice the total number of technology-based SMEs in Zhangjiakou. Zhangjiakou has a high proportion of agriculture, and its industry and service industry are relatively weak, which is typical of an agricultural region. In recent years, the city has seized opportunities such as the preparation for the Winter Olympics and the coordinated development of Beijing, Tianjin, and Hebei. The foundation of the new energy industry has been continuously consolidated, and the momentum of the digital economy industry is good. As of 2020, there are 80 national technology-based SMEs in Zhangjiakou, and the number of technology-based SMEs is close to 3000. However, subject to the weak industrial foundation, the green technological innovation level of technology-based SMEs has been in the third tier over the past decade. Xingtai and Hengshui are similar. There are historical problems such as a small economic aggregate, low industrial level, and lagging development. The weak economic and industrial foundations seriously restrict the development of the green technology innovation of local high-tech SMEs.
4.4. Analysis and Discussion on the M Index of the Green Technology Innovation Efficiency of Technology-Based SMEs
In order to further analyze the change of green technology innovation efficiency of technology-based SMEs in 11 regions of Hebei Province from 2011 to 2020, the Malmquist index model was applied for empirical analysis, and the empirical results are shown in
Table 4. The application of the Malmquist index to measure the efficiency of the green technology innovation efficiency of technology-based SMEs has the following three advantages: first, the price factors of input variables and output variables need not be considered; second, technical efficiency changes, technical level changes, and other sub-indicators are comprehensive; third, the dynamic change of the green technology innovation efficiency of technology-based SMEs in Hebei province and its main reasons and influencing factors can be comprehensively analyzed, and the results are objective.
From
Table 4, it can be seen that the M index of the green technology innovation efficiency of SMEs in Hebei Province from 2011 to 2020 was greater than 1, except for 2012–2013 and 2019–2020, and the average M index is 1.1476. That is, the innovation efficiency of the green technology of science and technology small- and medium-sized enterprises in Hebei Province kept increasing by 14.76 % per year from 2011 to 2020. During the investigation period, the green technological innovation efficiency of SMEs in 11 regions of Hebei Province showed an upward trend. The main reason is that, during the 10 years from 2011 to 2020, Hebei Province formulated a series of relevant policies to enhance the level of the green technological innovation of small- and medium-sized technological enterprises in Hebei Province. In addition, technology-based SMEs are still in the growth period, and the efficiency of resource input and transformation is relatively high. At the end of 2012, China put forward the concept of “innovation-driven development strategy” and “beautiful China”. At the Eighteenth National Congress of the Communist Party of China, it was clearly put forward that “scientific and technological innovation is the strategic support to improve social productivity and comprehensive national strength and must be placed in the core position of the overall national development”. In 2014, China proposed the major strategy of Beijing–Tianjin–Hebei coordinated development. In 2017, China decided to establish the Xiongan New District in Hebei Province, which played an important role in promoting the level of social development of cities in Hebei Province and led to the overall development of technology-based SMEs. The implementation of these national strategies is of great significance for the green technological innovation efficiency of small- and medium-sized technological enterprises in Hebei Province to maintain an increasing trend year by year. The M index of the technological innovation efficiency from 2012 to 2013 is 0.8914, which is mainly affected by factors such as insufficient technical level change values, so the M index of the technological innovation efficiency is less than 1. The M index of the green technological innovation efficiency from 2019 to 2020 is 0.7837. It is mainly related to the outbreak of the new coronavirus in 2020. The increasing pressure on the survival and development of small- and medium-sized technological enterprises in Hebei Province caused by the pandemic has affected the improvement of their green technological innovation efficiency. Therefore, on the whole, the technological innovation M index of the green technology of small- and medium-sized enterprises in Hebei Province is less than 1. In order to further analyze the change of the green technology innovation efficiency M value and its decomposition of small- and medium-sized technological enterprises in Hebei Province from 2011 to 2020,
Figure 6 presents a trend chart.
It can be seen from
Figure 6 that the M index of the green technological innovation efficiency of small- and medium-sized technological enterprises in Hebei Province changed greatly from 2011 to 2020. The M value of green technology innovation efficiency of small- and medium-sized technological enterprises in Hebei Province from 2012 to 2013 is less than 1, and the low change of technology level is the main reason for the low M index. After the government’s macro-control, the M value of the technological innovation efficiency began to rise in 2014, reaching a maximum of 1.4579 in 2016. Then, for the steady development stage, during this period, China gradually put forward the Beijing–Tianjin–Hebei coordinated development strategy, the establishment of the Xiong’an New Area, and other decisions. These policies play an important role in promoting the development of green technology for high-tech SMEs in Hebei Province. Therefore, the M index of the green technology innovation efficiency of science and technology SMEs in Hebei Province maintained a high and stable development at this stage. The change of technical level is the main factor to ensure that the M index of the technological innovation efficiency is greater than 1, and it maintains a high and stable development trend in other years, except during the pandemic period. It can be seen from the change of the trend distribution that the innovation efficiency M index of the green technology of technology-based SMEs in Hebei Province follows the same trend as the change of technological level. This shows that the improvement of technological level has a significant role in promoting the growth of the M index of the green technology innovation efficiency of small- and medium-sized technological enterprises in Hebei Province.
From the time dimension analysis, the change trend of the green technology of small- and medium-sized technological enterprises in Hebei Province over the years can be understood. In order to grasp the change of the spatial green technological innovation efficiency of small- and medium-sized technological enterprises in Hebei Province from 2011 to 2020, this paper further analyzed the change of the green technological innovation efficiency of small- and medium-sized technological enterprises in Hebei Province, as shown in
Table 5.
It can be seen from
Table 5 that, except for Hengshui, Zhangjiakou, Xingtai, and Chengde, the M indexes of other regions are all greater than 1, indicating that the green technological innovation efficiency of small- and medium-sized technological enterprises in Hebei Province has maintained an upward trend in most regions. The low M value of technological innovation efficiency in Zhangjiakou is mainly caused by the low change value of technological efficiency. The low M value efficiency of Hengshui, Xingtai, and Chengde is due to the stagnation of technological level changes, which leads to the overall M value of the technological innovation efficiency of large industrial enterprises in the region being less than 1. For Shijiazhuang, Baoding, Tangshan, and Qinhuangdao, the M values are all above 1.1476, higher than the average level of Hebei Province. Through the decomposition of the M index in the region, it can be seen that the high technical level change is the main reason for the M index in the foremost provinces. Based on the above discussion, the innovation efficiency M index of green technology of small- and medium-sized technological enterprises in Hebei Province from 2011 to 2020 is greatly affected by the decomposition term of technological level change, and technological level change is the main reason for the change of the M index. In addition, through the comparative analysis of adjacent areas, there are some adjacent areas (such as Shijiazhuang, Xingtai, etc.) whose M index difference is large. It shows that the development speed of science and technology SMEs in Hebei Province is not balanced between different regions. There is also a phenomenon of weak collaborative innovation capability, which fails to fully use the advantages of resource linkage and complementary collaboration. There is weak cooperation and communication between some regions, which inhibits further improvement of the green technological innovation efficiency of small- and medium-sized technological enterprises in such regions.
5. Discussions and Conclusions
This paper studied the green technological innovation efficiency of technology-based SMEs in various regions of Hebei Province through the undesirable SBM and the Malmquist index model. Firstly, considering the undesirable output indicators, the evaluation index system was constructed from the input and output levels. Then, the undesirable SBM model was used to measure and compare the green technological innovation efficiency of technology-based SMEs in various regions of Hebei Province with and without undesirable outputs. Finally, the Malmquist index model was used to dynamically analyze the green technological innovation efficiency of small- and medium-sized science and technology enterprises in various regions of Hebei Province, and the following conclusions were obtained:
- (1)
The overall level of the green technological innovation efficiency of technology-based SMEs in Hebei Province, measured by the undesirable SBM model, is low. Through the analysis of the calculation results, it can be seen that between 2011 and 2020, the average green technological innovation efficiency of technology-based SMEs with undesirable outputs is 0.6461. The average green technology innovation efficiency of technology-based SMEs without undesirable outputs is 0.6633. The green technology innovation efficiency in 4 of the 11 regions of Hebei Province is lower than 0.5, and there are large differences between each region. Only Shijiazhuang has a green technology innovation efficiency value, with undesirable outputs, above 0.9. This shows that the green technological innovation level of technology-based SMEs in Hebei Province is not ideal. At the same time, it also reflects that the regions in Hebei Province have a large space to promote the development of technology-based SMEs by improving the efficiency of green technology innovation.
- (2)
There are significant regional differences in the green technological innovation efficiencies of technology-based SMEs in Hebei Province. Through the calculation of the green technology innovation efficiency of each city in Hebei Province, the results show that the green technology innovation efficiency of 11 technology-based SMEs in Hebei Province can be divided into three different development areas from high to low. The first type of area is the cities with the highest efficiency of green technology innovation of small- and medium-sized enterprises, including Shijiazhuang, Baoding, and Tangshan, and the average is 0.8754. The green technological innovation efficiency of technology-based SMEs in the second category is relatively high and includes Langfang, Qinhuangdao, and Cangzhou, with an average value of 0.7483. The green technology innovation efficiency of technology-based SMEs in the third areas is low, which includes Handan, Hengshui, Zhangjiakou, Xingtai, and Chengde, with an average of 0.4413. At the same time, compared with the green technological innovation efficiency value with considering the undesirable outputs, the value of that without the undesirable outputs is generally low. Two conclusions can be drawn from the above results. One is that most areas in Hebei Province ignore the protection of the local environment while developing industry. For example, in Handan and other regions, the rapid development of heavy industry has achieved economic growth, but in order to achieve high quality and sustainable development, it must pay attention to the role of industrial ecological competitiveness. The second is that the high efficiency provinces are mostly located in economically developed areas. For example, Shijiazhuang, Baoding, and Tangshan are subject to more policy dividends, and were the first to implement China’s innovation-driven development strategy and key areas. They have unique advantages in policy, capital, technology, and talents, and also pay attention to environmental problems. Therefore, the green technological innovation efficiency in these regions is high.
- (3)
The green technological innovation efficiency of technology-based SMEs in Hebei Province has an upward trend. According to the analysis of the Malmquist index model, the M index of green technology innovation efficiency of enterprises in Hebei Province from 2011 to 2020 was greater than 1, except for 2012–2013 and 2019–2020. The average M index is 1.1476, indicating that from the overall level of the past decade, the green technological innovation efficiency of technology-based SMEs in Hebei Province has shown an upward trend year by year. In addition, the average M index of most prefecture-levels in Hebei Province in the past decade was greater than 1, indicating that the green technological innovation efficiency of small- and medium-sized technological enterprises in most prefecture-levels in Hebei Province is constantly optimizing and improving. Most regions with an M index less than 1 are located in economically backward areas, and their green technical efficiency also belongs to the third echelon. Due to the limited research time, there are still the following deficiencies in this paper.
SMEs in Hebei Province are calculated on the basis of green technology innovation efficiency from the upgrading of industrial structures, raising the labor production capacity, increasing the environmental protection investment ratio of science and technology, and enhancing the level of regional economic development in Hebei Province to promote science and technology policy suggestions for the development of the green technology innovation efficiency of SMEs. Suggestions include the following:
- (1)
For regions with low green technology innovation efficiency, accelerate the upgrading of industrial structures and improve the level of regional economic development. The proposal mainly includes giving full play to resources and environmental advantages to promote the green development of the secondary industry by increasing investment in high and new technologies and promoting the upgrading of industrial structures. We should attach importance to the key role of capital, technology, and labor to improve the level of regional economic development.
- (2)
For regions with medium green technology innovation efficiency, priority should be given to improving the green technology content of the labor force in production, which is key to improving the green technology innovation efficiency of technology-based SMEs. Therefore, we should focus on improving the scientific and technological literacy of the labor force, promoting education construction, and cultivating and attracting high-level talents so as to promote the development of the green innovation level of regional technology-based SMEs.
- (3)
Strengthen scientific and technological innovation and promotion in areas with medium-high green technology innovation efficiency. The improvement of the green technology innovation efficiency of technology-based SMEs in Hebei Province mainly depends on the improvement of the green technology level. Therefore, we need to encourage SMEs in Hebei Province, through a variety of positive measures, to increase green technology innovation investment and foster the development of the green high technology industry in a timely manner to promote advanced green production and management of science and technology knowledge and experience, so as to promote the green innovation development of SMEs in Hebei Province.
This paper only evaluates the efficiency level and overall trend of the green technological innovation of technology-based SMEs in Hebei Province from the perspective of final efficiency, and there is no stage-by-stage plan for how this problem can be further improved in the future.


