Article

Synergistic Air Pollutants and GHG Reduction Effect of Commercial Vehicle Electrification in Guangdong’s Public Service Sector

1
School of Mechanical and Automotive Engineering, South China University of Technology, Guangzhou 510641, China
2
Guangdong Provincial Academy of Environmental Science, Guangzhou 510045, China
*
Author to whom correspondence should be addressed.
Sustainability 2021, 13(19), 11098; https://0-doi-org.brum.beds.ac.uk/10.3390/su131911098
Submission received: 29 August 2021 / Revised: 27 September 2021 / Accepted: 4 October 2021 / Published: 8 October 2021
(This article belongs to the Special Issue Environmental and Economic Analysis of Low-Carbon Energy Technologies)

Abstract

:
This paper aims to analyze the associated environment and climate benefits of electrification by comparing the air pollutant and CO2 emissions from the fuel cycle of battery electric commercial vehicles (BECVs) and internal combustion engine commercial vehicles (ICECVs) through a case study in Guangzhou Province. Five types of vehicles (i.e., electric buses, coaches, light-duty trucks, dump trucks, and waste haulers) used in the public service sector were selected for analysis, taking into account six development scenarios based on the prevalent ownership trends of electric vehicles and the energy system optimization process. The results reveal that an increase in commercial vehicle electrification in the public service sector will cause reductions of 19.3 × 10³ tons, 0.5 × 10³ tons, 9.5 × 10³ tons, and 8.5 × 10⁶ tons for NOx, PM2.5, VOCs, and CO2, respectively, from the base 2030 case (CS_II, the electrification rates of buses, coaches, light-duty trucks, dump trucks, and waste haulers will reach 100%, 26.5%, 15.4%, 24.0%, and 33.1%, and their power needs will be met by 24% coal, 18.4% gas, and 13.2% renewable power), but with a slight increase in SO2 emissions. With the further penetration of BECVs into the market, the emission reduction benefits for NOx, PM2.5, VOCs, and CO2 could be even more remarkable. Moreover, the benefit obtained from the optimization of the share of renewable energy is more noticeable for CO2 reduction than for air pollutant reduction. Prioritizing the electrification of light-duty trucks after completing bus electrification could be a potential solution for achieving ozone pollution control and lowering carbon emissions in Guangdong. In addition, these results can provide scientific support for the formulation or adjustment of advanced pollution mitigation and peaking carbon policies in Guangdong, as well as other regions of China.

1. Introduction

Owing to their high fuel consumption and high pollution emissions, commercial vehicles (CVs), including all trucks and passenger vehicles more than nine seats, are one of the major contributors to ambient air pollution and global warming. According to the China Mobile Source Environmental Management Annual Report (2020) [1], diesel trucks accounted for 78% of the NOx emissions and 89.9% of the PM2.5 emissions of the automobile sector in 2019. Considering their high energy efficiency and low emissions, battery electric commercial vehicles (BECVs) have been identified as a possible solution for the energy crisis, for improving air quality, and for tackling global warming in China.
In recent years, the Chinese government has implemented incentive policies for the development of new energy vehicle technologies in order to create a clean and sustainable transportation system. The use of BECVs in public sectors, such as the commuting, municipal, and logistics sectors, has been under rapid development [2,3]. Having achieved an over 90% electrification rate for buses, Guangdong, one of the most urbanized regions in China, is a pioneer in the area of electric vehicle development. Moreover, light-duty electric goods-delivery vehicles, medium- and heavy-duty electric coaches, as well as electric waste haulers have also been widely adopted in Guangdong, especially in the Pearl River Delta Region.
Their lack of air pollutants and CO2 emissions during the use phase make battery electric vehicles (BEVs) one of the most straightforward and effective means for the reduction in ambient air pollutants and CO2 in the transportation sector [4,5]. While several studies have highlighted the synergistic effects of the emission mitigation of air pollutants and greenhouse gas (GHG) from the promotion of BEVs in China using a life cycle impact assessment approach [4,5,6,7], some researchers have indicated that there might be an increase in the emissions of air pollutants when considering the whole life cycle [8,9,10], or even an increase in CO2 emissions [11]. Hence, it is meaningful to conduct a study on the fuel cycle in order to analyze the emission characteristics of BECVs, since most emissions from BECVs are produced from the power production stage in the fuel cycle indirectly [12,13,14]. In addition, many domestic studies only focus on electric buses or electric taxis [15,16]; some include electric passenger cars [4,17], but very few pay attention to the environmental or climate impacts of BECVs on the public services sector [18]. It is therefore essential to study the environment and climate benefits BECVs have in terms of the fuel cycle on the public services sector.
Therefore, the purpose of this study is to analyze the associated environment and climate benefits brought about by the substitution of internal combustion engine commercial vehicles (ICECVs) with BECVs in the public services sector (i.e., electric buses, coaches, light-duty trucks, dump trucks, and waste haulers) in 2025 and 2030. The China VI Emission Standard is adopted for diesel commercial vehicles here to further investigate the benefits of electrification and to evaluate the scale of emissions of CO2 and other relevant air pollutants (i.e., SO2, NOx, PM2.5, VOCs). In addition, the research boundary is the air pollutants and CO2 emissions during the fuel cycle for both BECVs and ICECVs (i.e., energy production, storage, and transportation, as well as any other process required by power marketing and diesel marketing, while excluding the air pollutants and CO2 emissions caused during the extraction and transportation of raw materials). The results of this study provide scientific support to clarify the environmental and climate benefits brought about by the promotion of BECVs, as well as providing development strategies relating to BECVs for policy makers.

2. Methods and Data

2.1. Overview of the Study Area

Guangdong Province is located in the southernmost part of mainland China (20°09′∼25°31′ N, 109°45′∼117°20′ E), with Fujian to the east, Jiangxi and Hunan to the north, Guangxi to the west, and the South China Sea to the south. Guangdong is the largest province in terms of population and economy in China. It achieved a GDP of 107,671.1 million yuan in 2019 and its number of motor vehicles has been rapidly increasing with the development of the province’s economy and society. From 2010 to 2019, the number of motor vehicles in Guangdong increased from 8.0 million to 23.3 million, with an average annual growth rate exceeded 12.5%. At the end of 2019, the number of motor vehicles in Guangdong Province reached 23.3 million, of which 2.4 million were trucks. On the one hand, motor vehicle pollution has become a serious source of air pollution in Guangdong. On the other hand, its shortage of energy and mineral resources and enormous demand for fossil fuels cause Guangdong to rely heavily on coal and natural gas imports, causing concerns regarding local energy safety for policy makers in this region.

2.2. Scenario Analysis

Two key factors are analyzed in this study: the prevalent ownership trends of electric vehicles and the energy system optimization process in Guangdong.

2.2.1. Factor 1: Share of BECVs Ownership

The penetration of BECVs into the market in Guangdong by 2025 and 2030 will directly affect the environment and climate benefits brought about by commercial vehicle electrification. Hence, different shares under different policy promotion efforts are studied, including one where an increase in the ownership of BECVs is brought about under the scenario of substantial known policy promotion, as established the basic scenario of BECVs ownership (OECVBS). Following the usual policy orientation in Guangdong, the OECVBS assumes that all updated or newly registered buses and coaches will be electric vehicles and that in OECVBS2025 the market shares of newly registered electric light-duty trucks, dump trucks, and waste haulers will exceed 1/3, 1/2, and 1/2, respectively, during the 14th Five-Year Plan period (2021–2025). By OECVBS2030, it is calculated that the share of newly registered BECVs ownership, as mentioned above, will be no less than 100%, 100%, 50%, 100%, and 100% during the 15th Five-Year Plan period (2026–2030), respectively. In the other scenario, we model an aggressive increment in BECVs ownership due to the urgent needs of the peaking carbon emissions (OECVPS). In OECVPS, a further BECVs promotion policy will be published on the basis of OECVBS, with the assumption that not only will the share of newly registered BECVs ownership reach the level of OECVBS, but also that old ICECVs will be substituted by BECVs. It is assumed that in OECVPS2025 no less than 100%, 6%, 6%, 10%, and 20% diesel buses, coaches, light-duty trucks, dump trucks, and waste haulers will be replaced by electric models between 2021 and 2025, respectively. Additionally, in OECVPS2030 the replacement rates of the other four types mentioned will increase to 10.5%, 9%, 20%, and 40% between 2026 and 2030, respectively. In addition, it is expected that bus electrification will be 100% completed no later than 2025.

2.2.2. Factor 2: Optimization of Installed Power Capacity

The installed power capacity in 2025 and 2030 were estimated by integrating the Guangdong Province Action Plan for Cultivating New Energy Strategic Emerging Industrial Clusters (2021–2025), the Guangdong Province Onshore Wind Power Development Plan (2016–2030), the Guangdong Province Offshore Wind Power Development Plan (2017–2030), and other policy documents that relate to the installed capacity of renewable energy power generation, as well as the results of previous studies [19]. On the basis of the predicted installed power capacity, different degrees of installed clean power capacity for 2025 and 2030 are presented. The usual power structure circumstance in 2025 (PSBS2025) will consist of 30.1% coal, 16.7% gas, and 8.1% renewable power. Additionally, it will consist of 24% coal, 18.4% gas, and 13.2% renewable power supply by 2030 (PSBS2030), respectively. A more proactive case (PSOS2030) is considered as well, which assumes that the installed capacity of renewable energy power generation will be increased by 20% and the installed capacity of power transmission from west to east will be increased by 10% compared with PSBS2030, while the share of thermal power remains the same as that in 2025. In PSOS2030, the rates of use of coal power, gas power, and renewable energy power generation will be adjusted to 23.6%, 13.1%, and 16.0%, respectively.

2.2.3. Scenario Descriptions

Based on the different assumptions of ownership of BECVs and installed power structure in the target year, this research integrates the two influencing factors and forms a total of six development scenarios for analysis, as listed in Table 1.

2.3. Energy Consumption of Vehicles in the Use Stage

In order to further analyze the energy consumption of commercial vehicles in the use stage, two equations are proposed as follows:

2.3.1. Unit Energy Consumption of BEVs and Internal Combustion Engine Vehicles (ICEVs) in the Use Stage

F i = P i × E C i × V K T i
Here, Fi is the electricity or fossil fuel consumption of vehicle i each year, in kWh/a or g/a; Pi is the number of vehicles i. ECi is the unit distance electric energy or fuel consumption for vehicle i, as shown in Table S1 (Supplementary Materials), which is calculated based on the commercial vehicle energy consumption certification and electric vehicle battery capacity and range in the real world. VKTi is the average annual mileage of vehicle i, in km/a, and its value is displayed in Table 2 [20].

2.3.2. Ownership of Commercial Vehicles

Several characteristic factors are used in the multiple linear regression model to predict the trends of ownership of commercial vehicles, including urban population, urbanization rate, gross domestic product, regional industrial output value, and fixed asset investment. The formula is as follows:
P = β 0 + β 1 x 1 + β 2 x 2 + β 3 x 3 + β 4 x 4 + β 5 x 5
where Pi is the number of vehicles I used that year, x denotes the factor influencing the commercial vehicle ownership, and βi is the regression coefficient.
Data from Statistical Yearbook of Guangdong Province were used for this analysis. The R-squared and adjusted R-squared values of the multiple regression models used for predicting the ownership of commercial vehicles were 0.908 ∼ 0.989 and 0.893 ∼ 0.987. The models were also to be found significant at a 99% confidence level (significance values, named p-values, <0.01). p-values associated with F-statistic and t-statistic indicate that the predictor variables have a significant relationship with the ownership of commercial vehicles. Additionally, it is noted that the predicted ownership of commercial vehicles in the target year is calibrated based on the analysis of historical performances by the trend extrapolation method. The stocks of BECVs in the target year are determined based on the current newly registered BECVs stocks and the proportions of newly registered BECVs out of the total.

2.4. Air Pollutants and CO2 Emission of Vehicles in Fuel Cycle

2.4.1. Emission from Energy Production and Storage, Transportation, and Marketing Stage

The annual emissions of air pollutants and CO2 from power production and fossil fuel production are calculated by the following equations:
E e i = L i × E F e i
E o i = F i × E F o i
where Eei is the annual emissions of air pollutants and CO2 for the approach i to power production, g/a; Li is the annual power generation of the power production approach i, kWh/a; EFei is the unit emission factor of air pollutants and CO2 for approach i, obtained from the actual emissions and fossil fuel consumption levels of coal-fired power plants after ultra-low emission transformation and gas-fired power plants after denitrification transformation and treatment in Guangdong, g/kWh (as shown in Figure S1). Eoi is the annual emissions of air pollutants and CO2 throughout the whole process of diesel production, storage, transportation, and marketing, g/a; Fi is the fossil fuel consumption of vehicle i each year, referring specifically to the annual usage of diesel here, g/a; EFoi is the air pollutants and CO2 emission factors for the use of diesel in production, storage, transportation, and marketing, which was selected according to the actual emission levels of major refineries in Guangdong Province, with reference to the Technical Manual for the Preparation of Urban Air Pollutant Emission Inventories, as well as the results of Wang T. et al. [21], g air pollutants/g diesel or g CO2/g diesel (as shown in Figure S2).
In addition, the comprehensive conversion rate of electric energy from the power plant to the electric vehicle is taken as 90%, due to the impacts of the loss rate of the grid transmission line and the charging efficiency of the on-board charger.

2.4.2. Emissions from ICECVs during the Use Stage

The annual emissions of NOx, PM2.5, and VOCs from ICECVs during the use stage are calculated as follows:
E v i = P i × E F v i × V K T i
E F v i = E F v i V × δ i × ρ i
where Evi denotes the annual emissions of NOx, PM2.5, or VOCs during the use of vehicle i, g/a; Pi is the number of vehicles i. EFvi is the unit emission factor of air pollutants per unit distance of the vehicle i, g/km (as shown in Table S2), and is calculated based on the revision of the China V Standard vehicles, Liu X. et al. and Liu Y. et al. [22,23]. VKTi is the average annual mileage of vehicle i, km/a. E F v i V is an emission factor of the China V Standard vehicle, g/km. δ i is the ratio of the China VI emission standard value to the China V emission standard value. ρ i is the correction factor.
The annual emissions of SO2 and CO2 from ICECVs during the use stage are calculated using the following equations [20]:
E S O 2 _ v i = 2.0 × F i × α i
E C O 2 _ v i = F i × γ i
E S O 2 _ v i is the annual SO2 emissions during the use of vehicle i, g/a. Fi is the annual fuel consumption of vehicle i, g/a. α i is fixed as a parameter representing the average sulfur content of the fuel; the value of10 ppm was used in this study. E C O 2 _ v i is the annual CO2 emissions caused during the use of vehicle i, g/a. Fi is the annual fuel consumption of vehicle i, g/a. γ i is fixed as a parameter representing the CO2 emissions emitted per unit fuel used; the value of 3.17g CO2/g diesel was used in this study.

3. Results

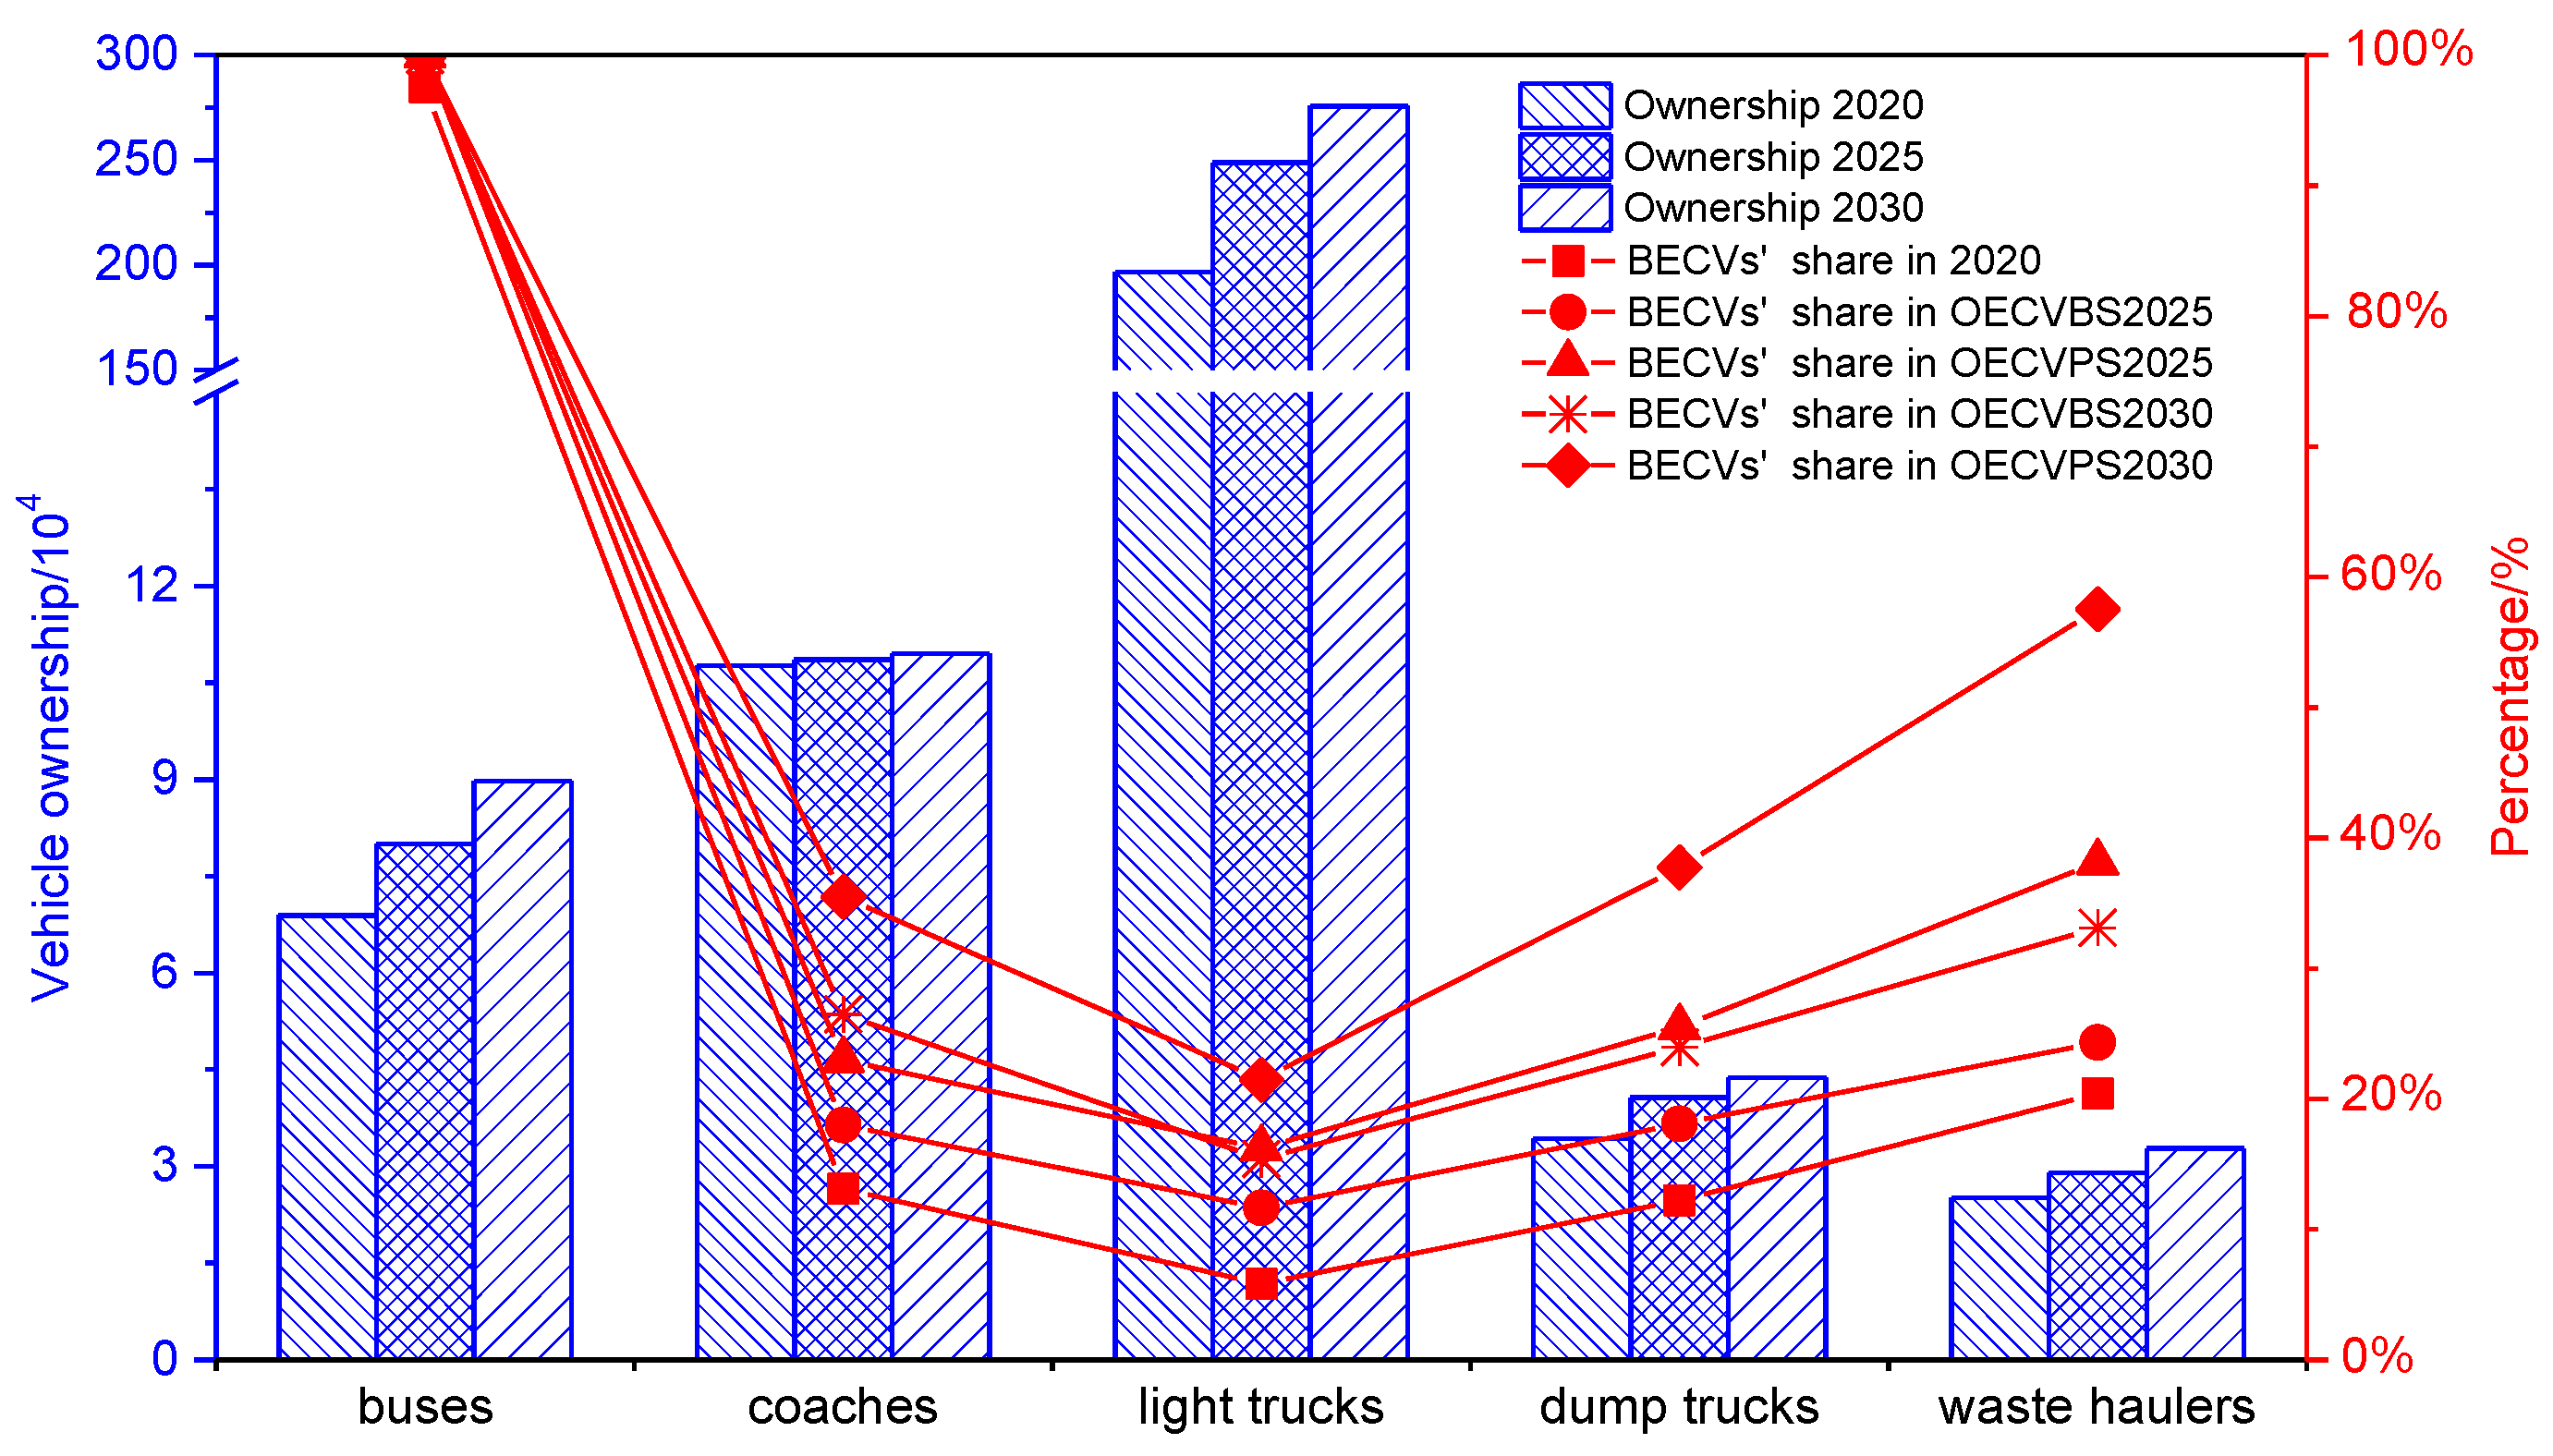
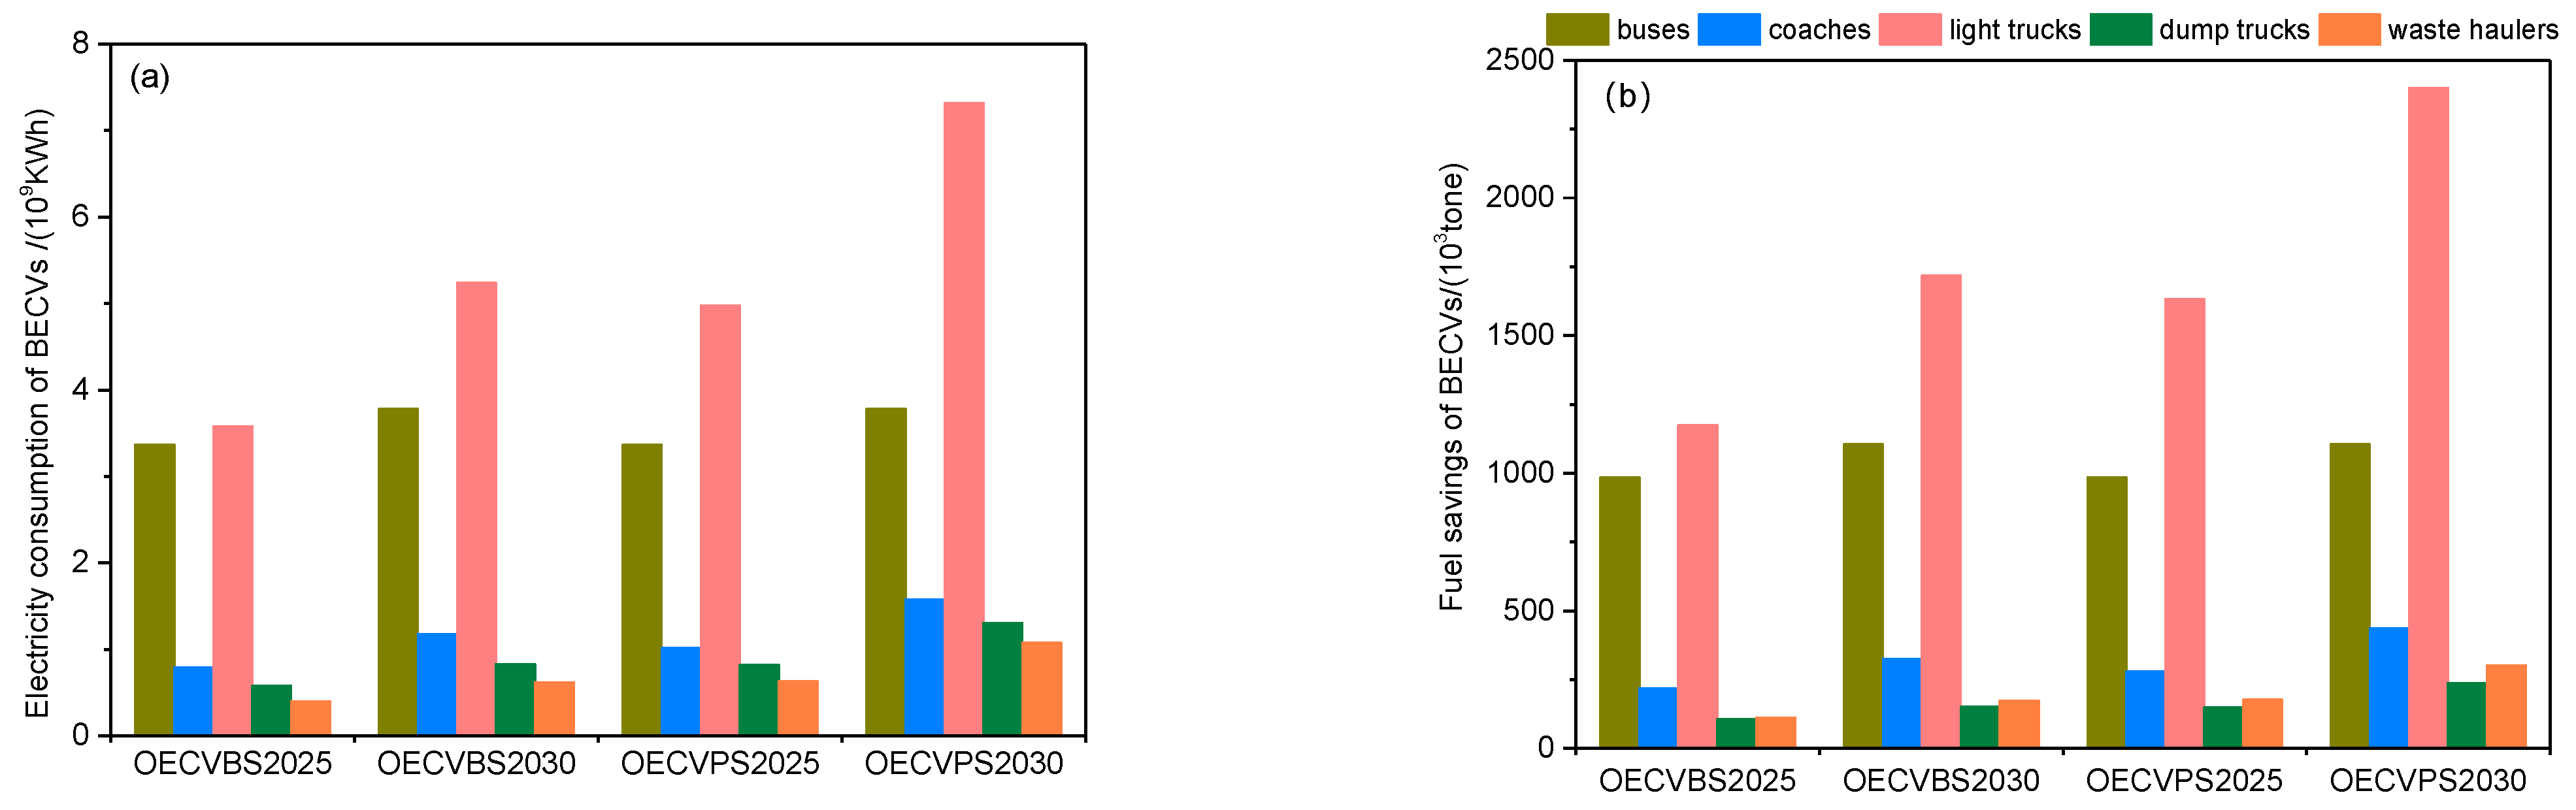
3.1. Ownership and Energy Consumption of CVs

Based on the provincial and national socio-economic development forecast and predictions of the market share of electric vehicles, the ownership scale of commercial vehicles in Guangdong in 2025 and 2030 were calculated and are displayed in Figure 1. This figure shows that electrification rates under OECVBS2025 are expected to reach 100%, 18.0%, 11.7%, 18.1%, and 24.3% for buses, coaches, light-duty trucks, dump trucks. and waste haulers, respectively. By 2030, it is anticipated that buses will be fully electrified, while the electrification rates of coaches, light-duty trucks, dump trucks, and waste haulers will achieve values of 26.5%, 15.4%, 24.0%, and 33.1% under OECVBS2030, respectively. The electrification ratios of buses, coaches, light-duty trucks, dump trucks, and waste haulers are expected to reach 100%, 23%, 16.2%, 25.5%, and 38.1% in OECVPS2025, while these are 100%, 35.5%, 21.5%, 37.7%, and 57.5% in OECVPS2030, respectively. Furthermore, the electrification rates in the peaking CO2 emission scenario of the remaining four vehicles apart from buses are all higher than those in the base scenario, along with an increase in the ownership of BECVs by 31.2% and 34.1% in the public service sector of OECVPS2025 and OECVPS2030, respectively.
Figure 2 demonstrates that the energy consumption changes before and after the electrification of commercial vehicles in Guangdong in 2025 and 2030 under OECVBS and OECVPS. The electrification of commercial vehicles in Guangdong would sharply increase the demand for electricity to 8.7 × 10⁹ kWh/a and greatly reduce the fossil fuel consumption by 2.6 × 10⁶ tons diesel/a in OECVBS2025; meanwhile, 3.5 × 10⁶ tons/a diesel consumption reduction together with 11.7 × 10⁹ kWh/a additional electricity demand in OECVBS2030. Furthermore, under the peaking CO2 emissions condition, extra electric power would be required to fulfill the demand for electrification, representing a value of 10.8 × 10⁹ kWh/a in OECVPS2025 and a value of 15.1 × 10⁹ kWh/a in OECVPS2030, respectively. Meanwhile, a great amount of diesel could be saved annually, with values of 3.2 × 10⁶ tons/a and 4.5 × 10⁶ tons/a for OECVPS2025 and OECVPS2030, respectively. As a result, the electrification of buses and light-duty trucks under these two scenarios requires the largest power consumption and makes the greatest contribution to saving fuel compared to the electrification of other commercial vehicles.

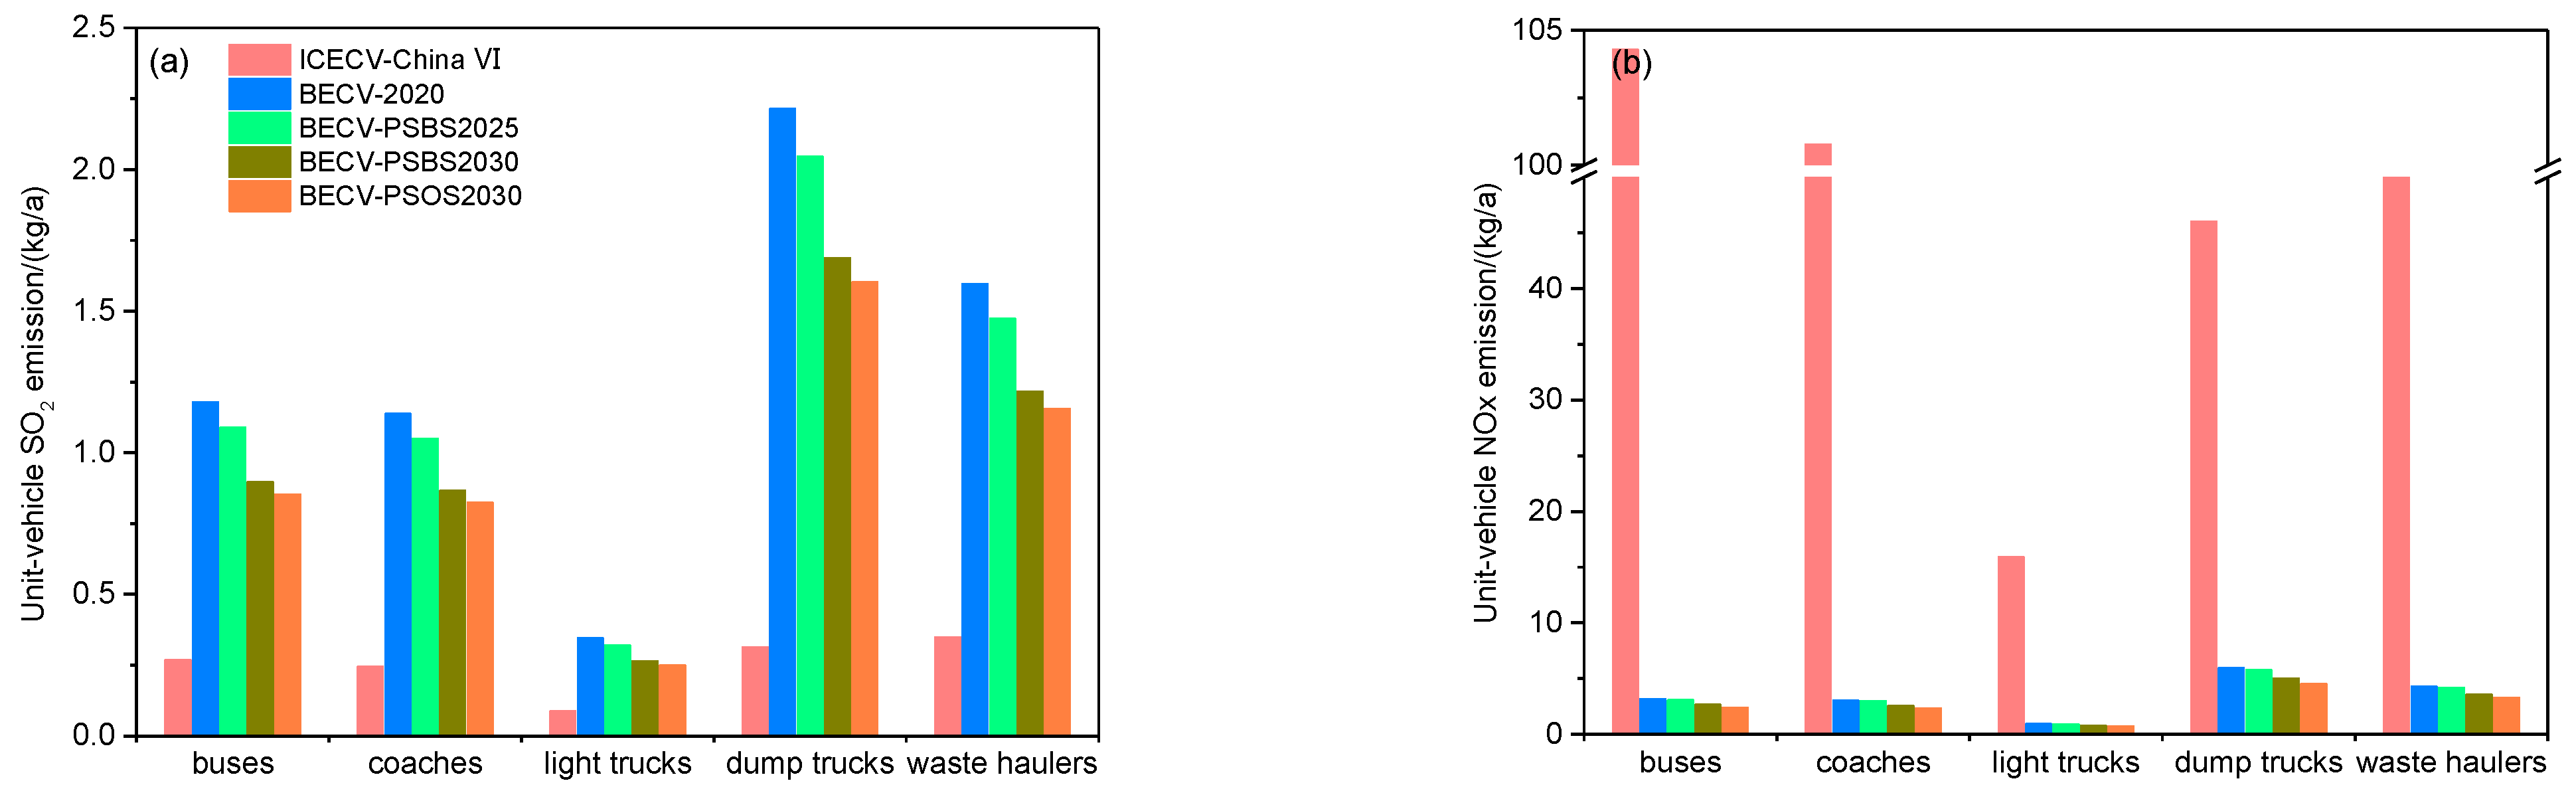
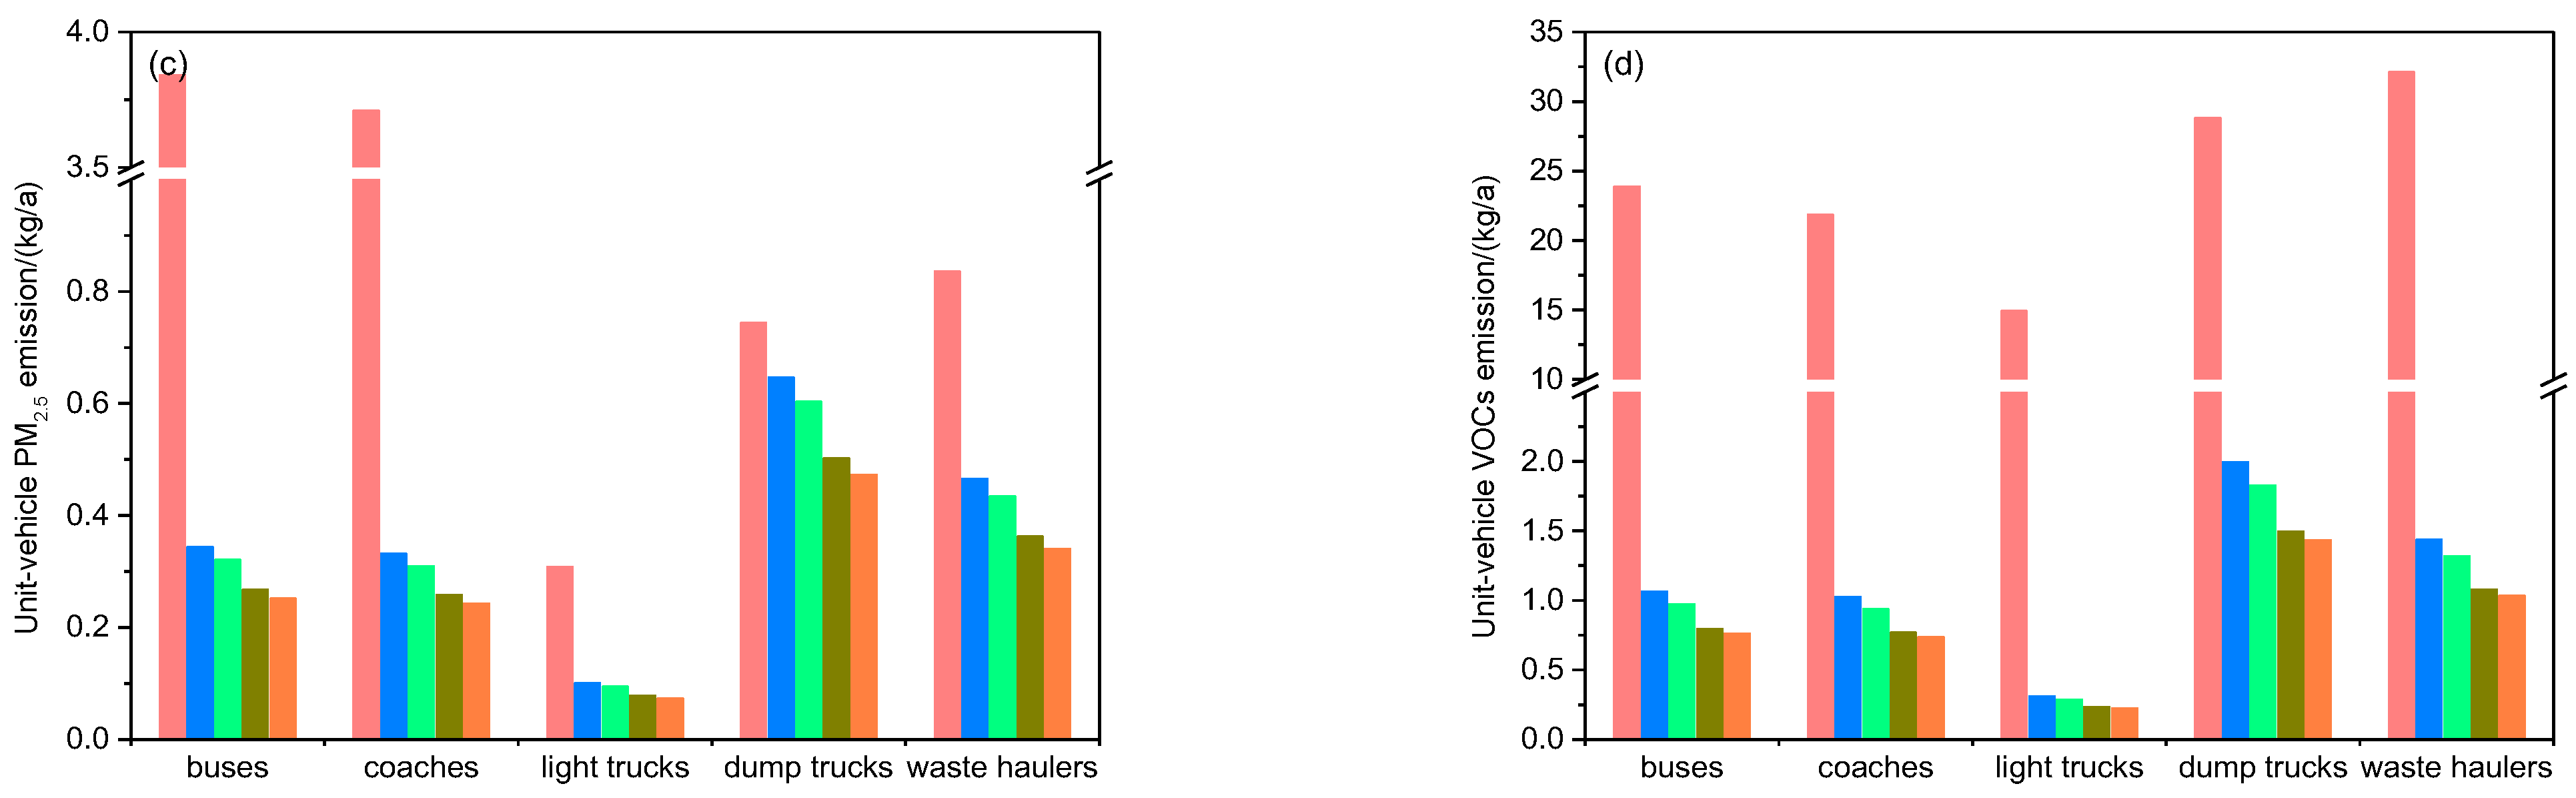
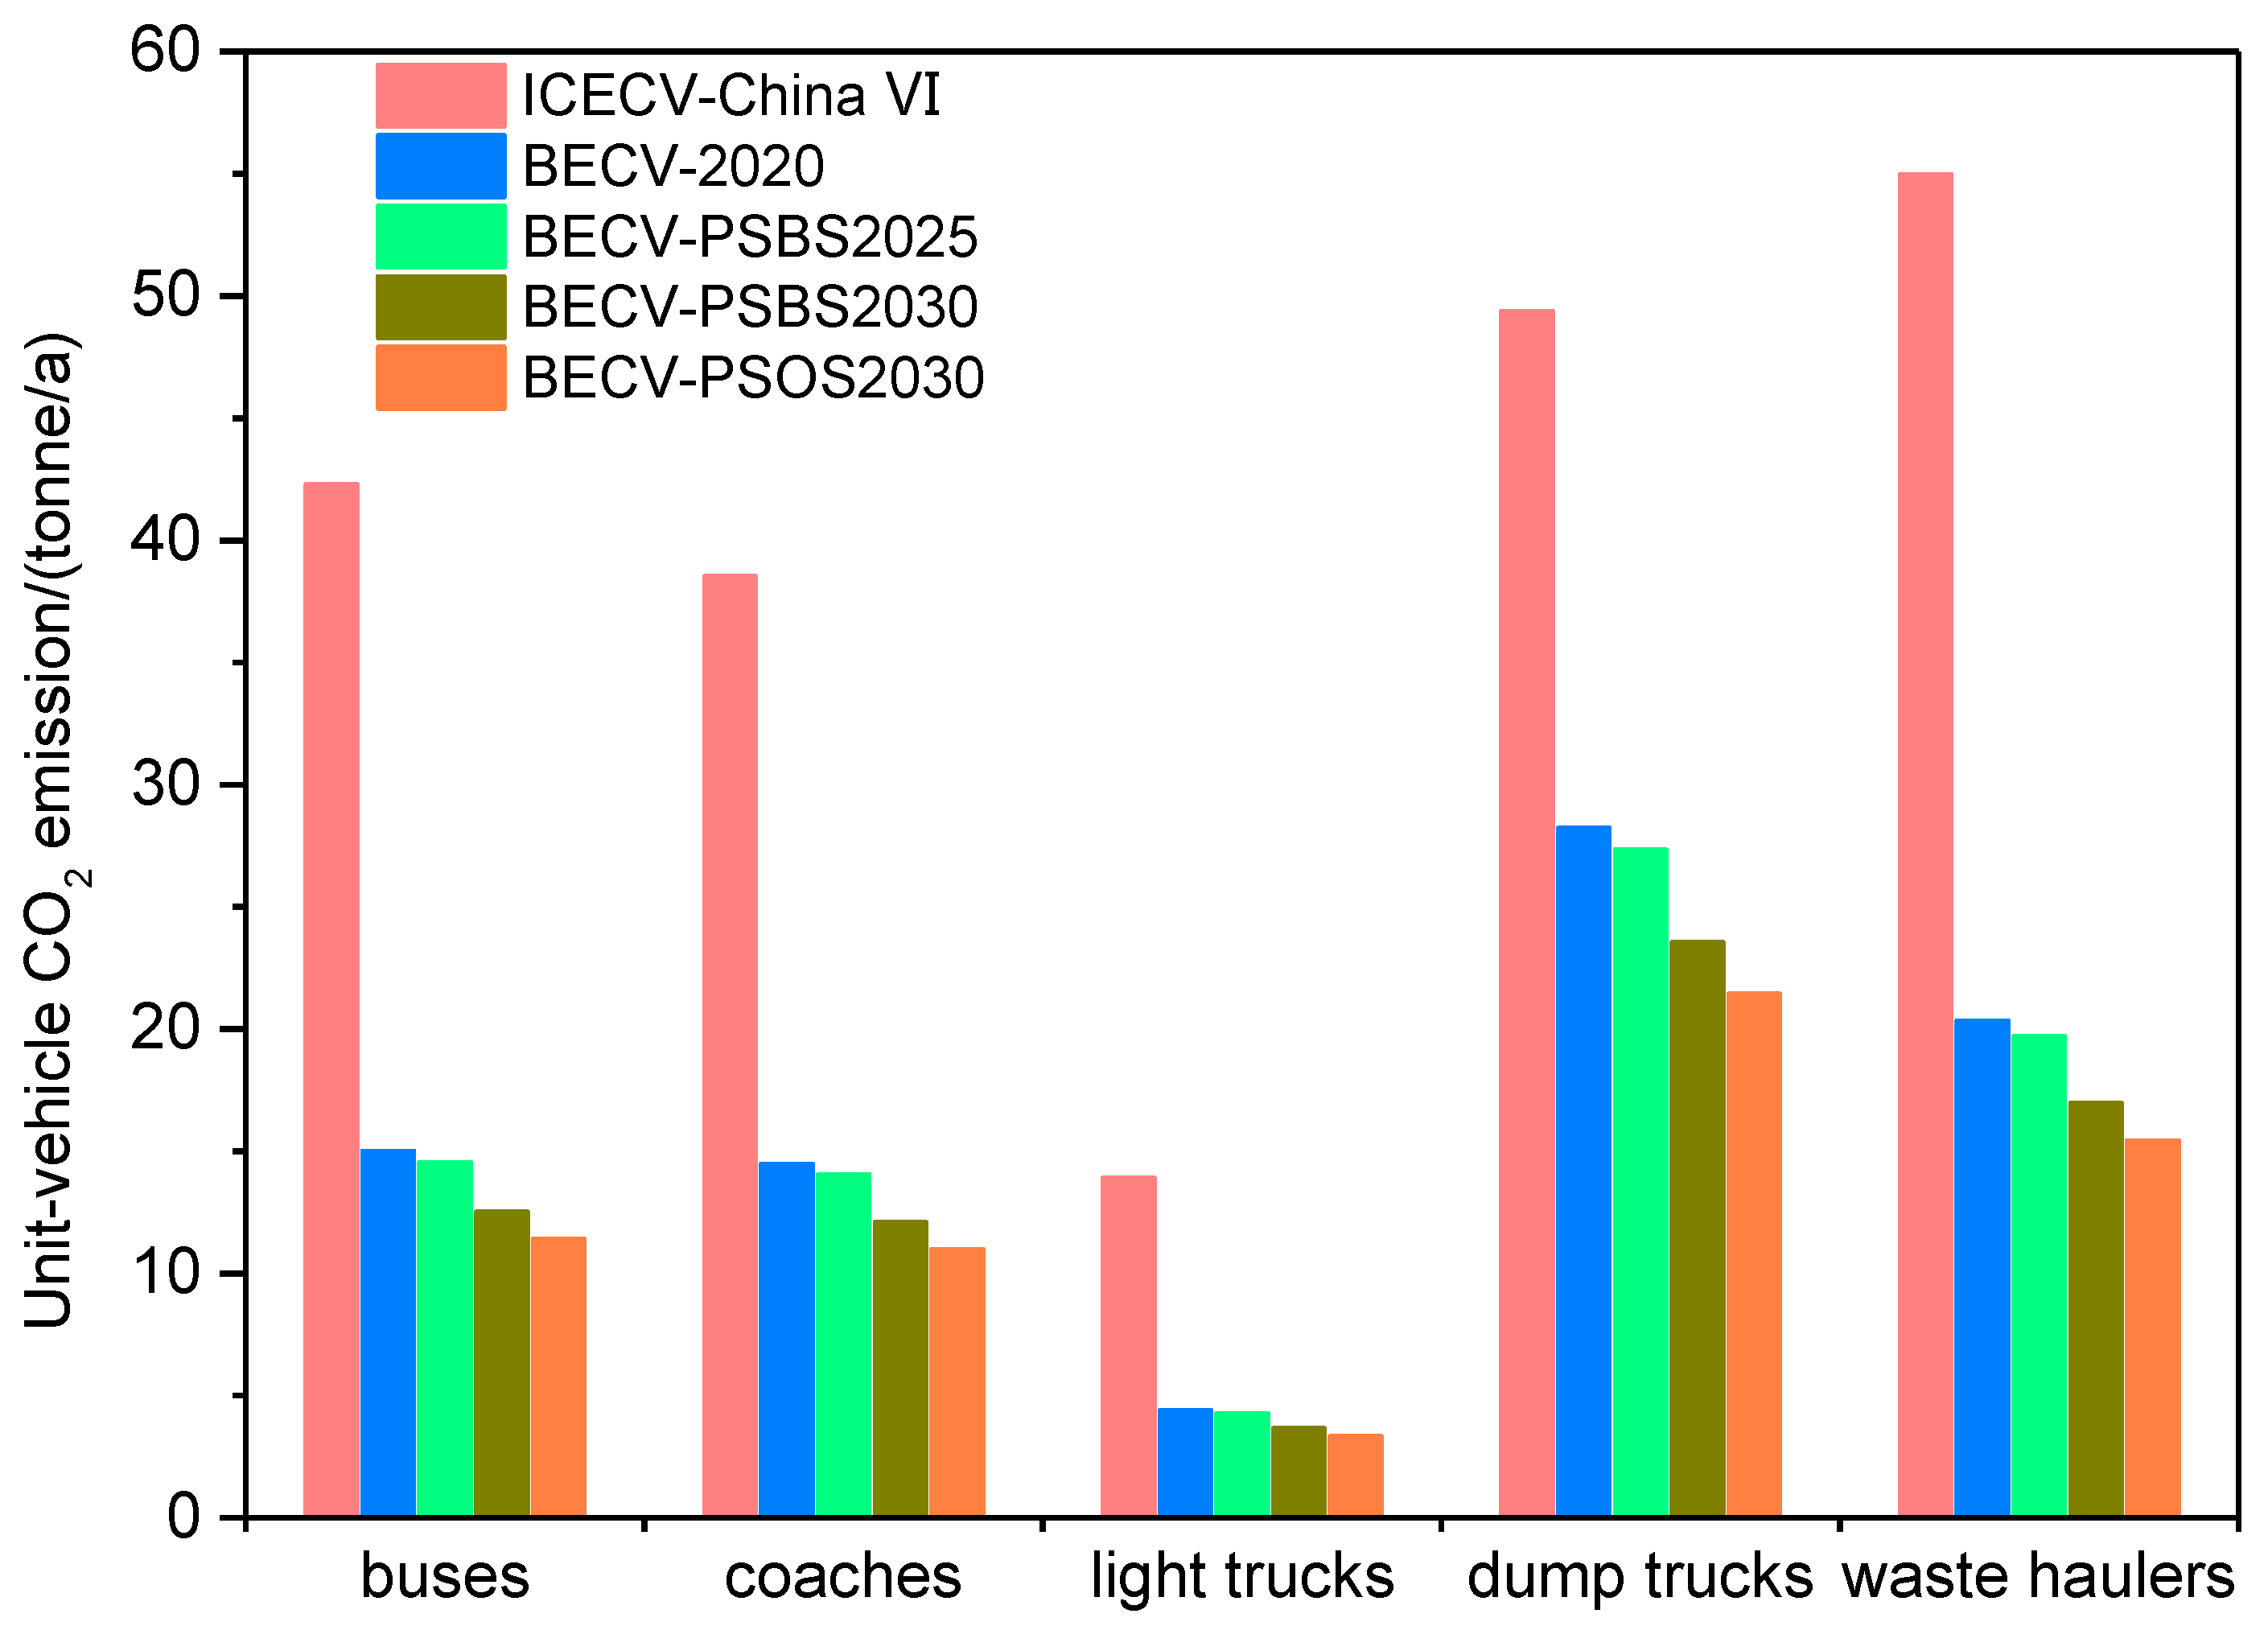
3.2. Unit Emission Level for Air Pollutants and CO2

According to the China VI, the unit-vehicle emission levels of air pollutants from ICECVs and BECVs in Guangdong are displayed in Figure 3. Compared with conventional ICECVs, BECVs’ unit-vehicle emissions of NOx, PM2.5, or VOCs drop dramatically. In detail, the reduction in VOCs for all vehicles effected by electrification seemed to be the most remarkable, with a depletion of more than 93% found. The reduction in NOx is also impressive, with a more than 90% NOx reduction found after the electrification of all commercial vehicles under different scenarios, except for dump trucks. It was found that there are great variations between different vehicles for the unit emission reduction in PM2.5. The emission reductions in PM2.5 for buses and coaches can reach the best amelioration effects, with more than 90% reductions achieved, but lower mitigation impacts appeared for dump trucks (≤36.4%). However, it is worth noting that electrification has some negative impacts on the environment. An increase in SO2 emission is inevitable after electrification, with a critical increase of 4.4 times brought about by dump truck electrification in PSOS2030 compared to ICECVs. An increase in SO2 is attributed to the fact that using coals for power generation might contain a higher sulfur content than the deep-desulfurized diesel circulating in Guangdong. In general, commercial vehicle electrification in Guangdong can lead to appreciable air pollutant emission mitigation effects, which is attributed to the fact that Guangdong has much a cleaner power structure due to the benefits of the West to East Power Transmission.
The unit-vehicle emission levels of CO2 from ICECVs and BECVs in Guangdong are shown in Figure 4. From the picture, it can be seen that the CO2 emissions display obviously declining features. The highest reduction rate will be 75% from light-duty truck electrification, while the lowest reduction rate from dump truck electrification will be larger than 50%. The CO2 emission reduction in electrification here performs more effectively than studies on other regions [12,24,25], which is explained by the fact that the share of coal-fired power in Guangdong is much lower than the average coal-fired power proportion in China.

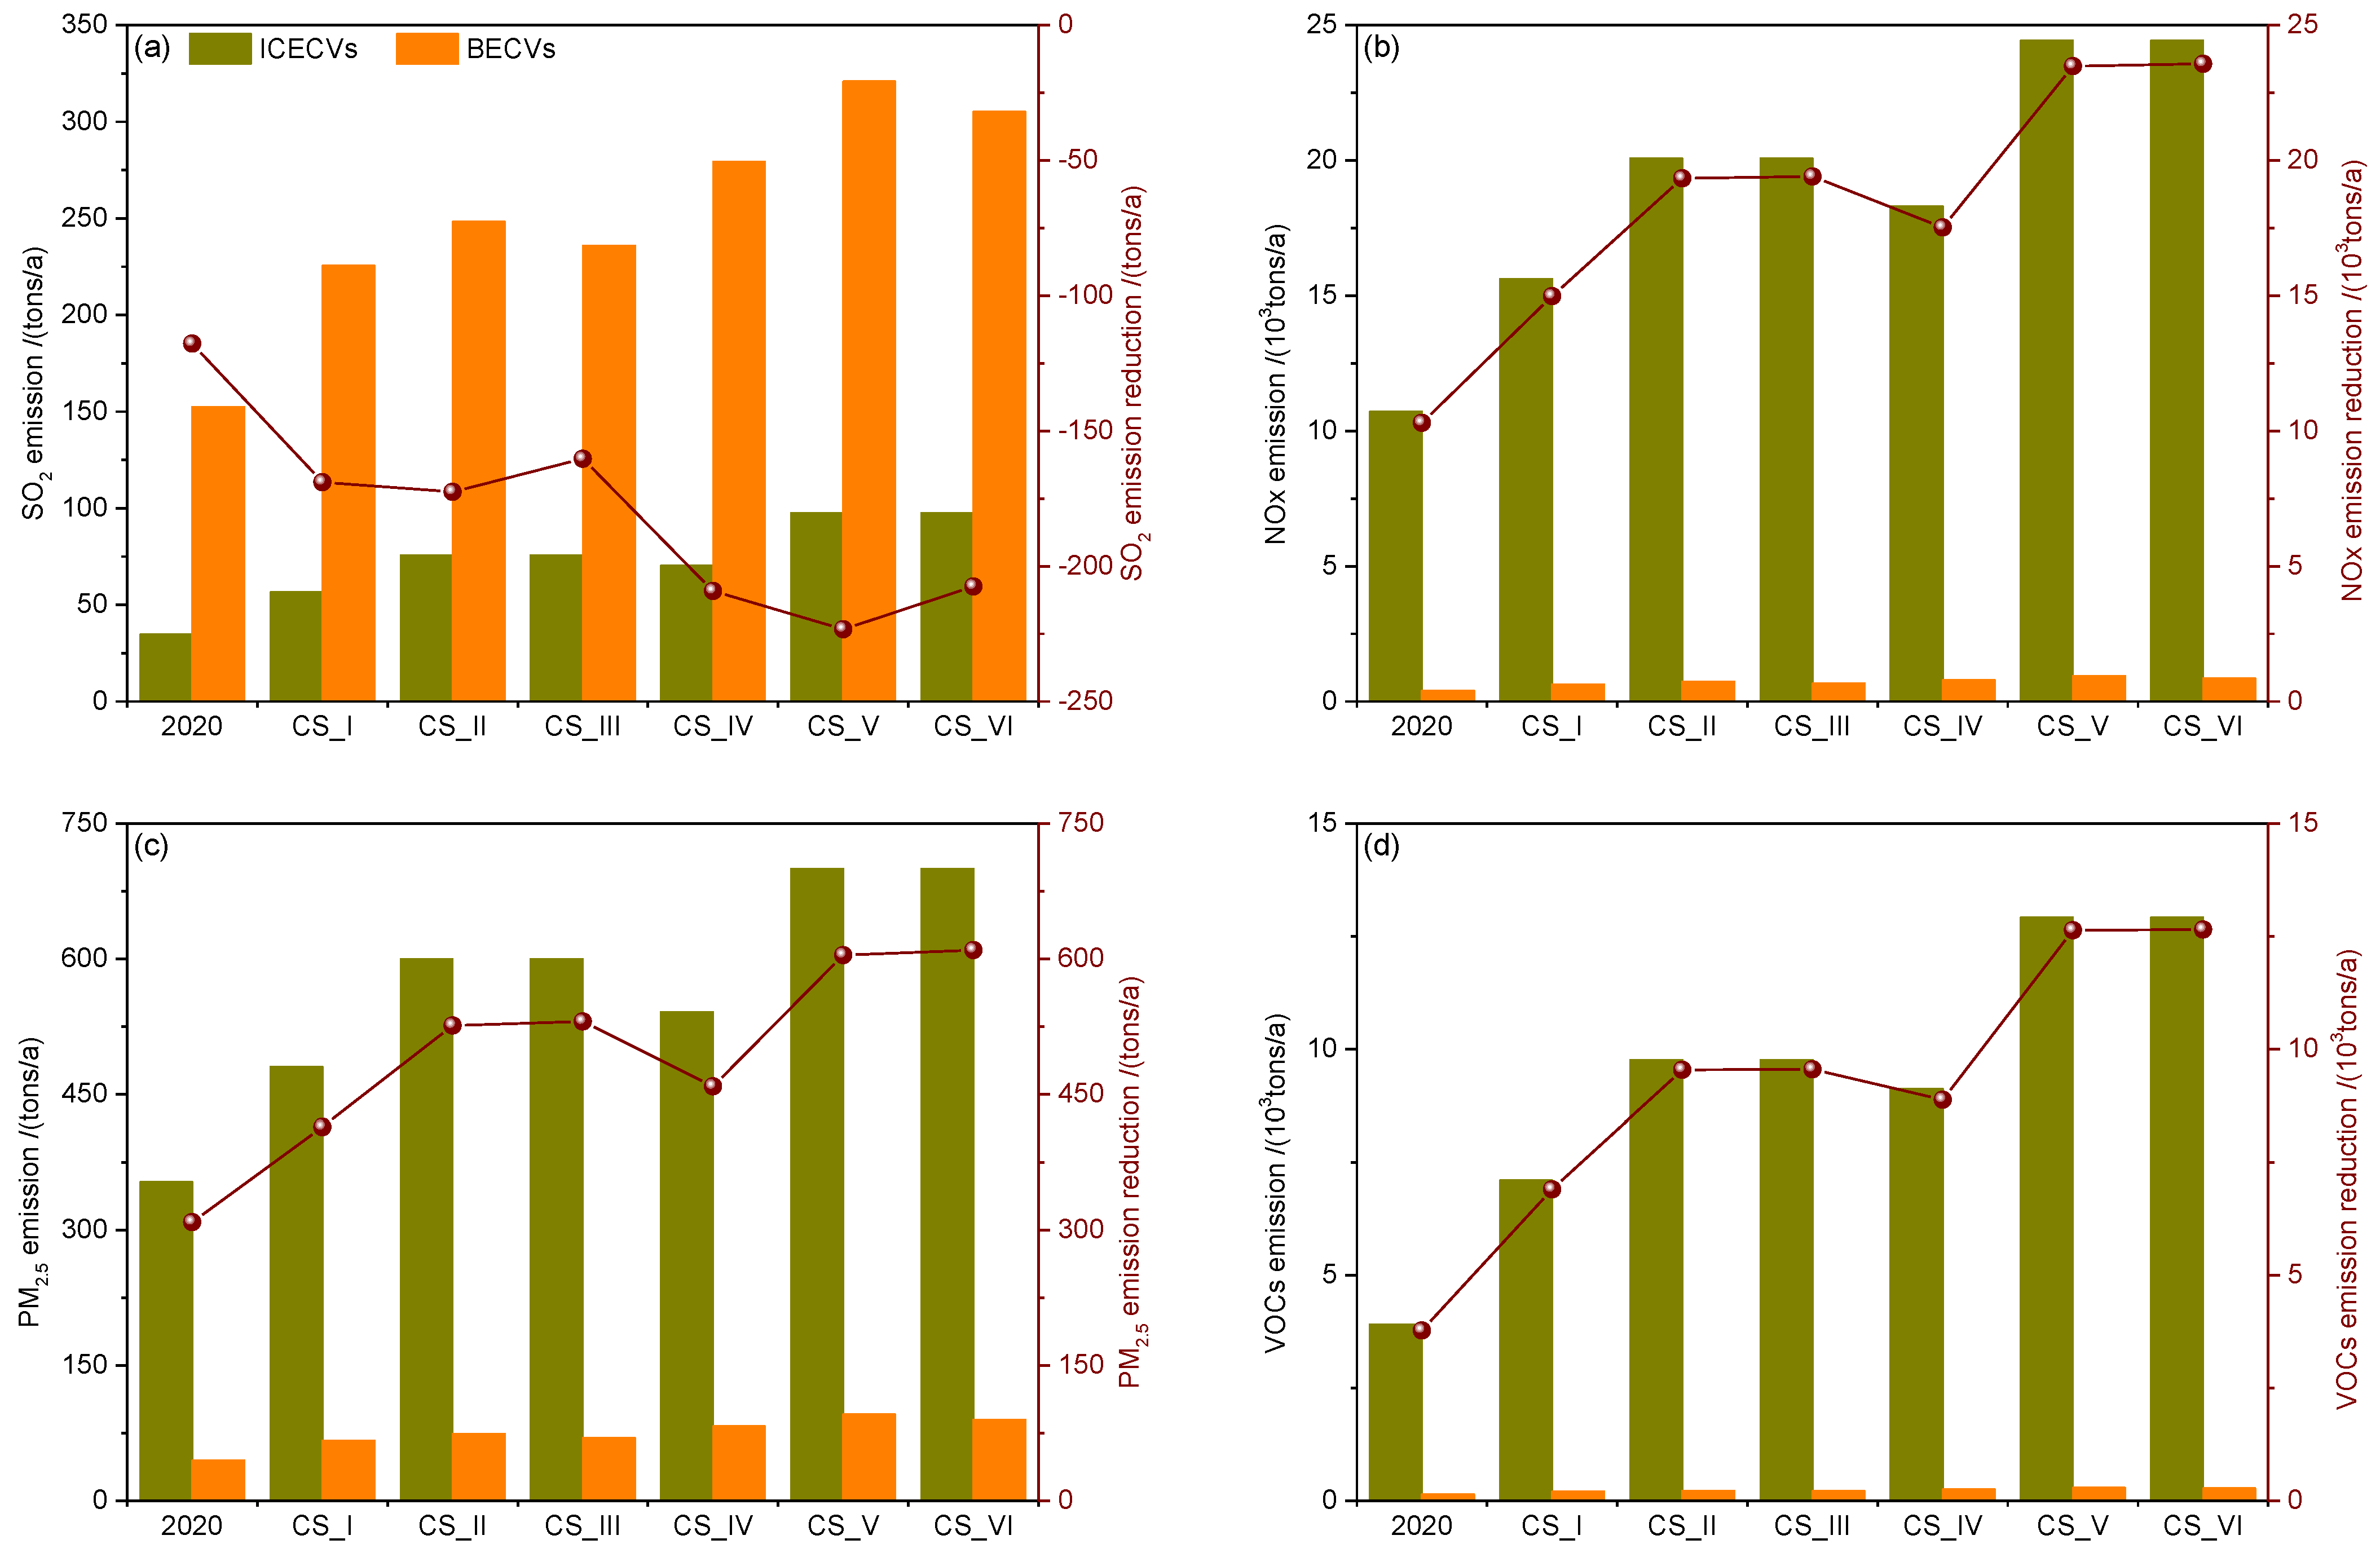
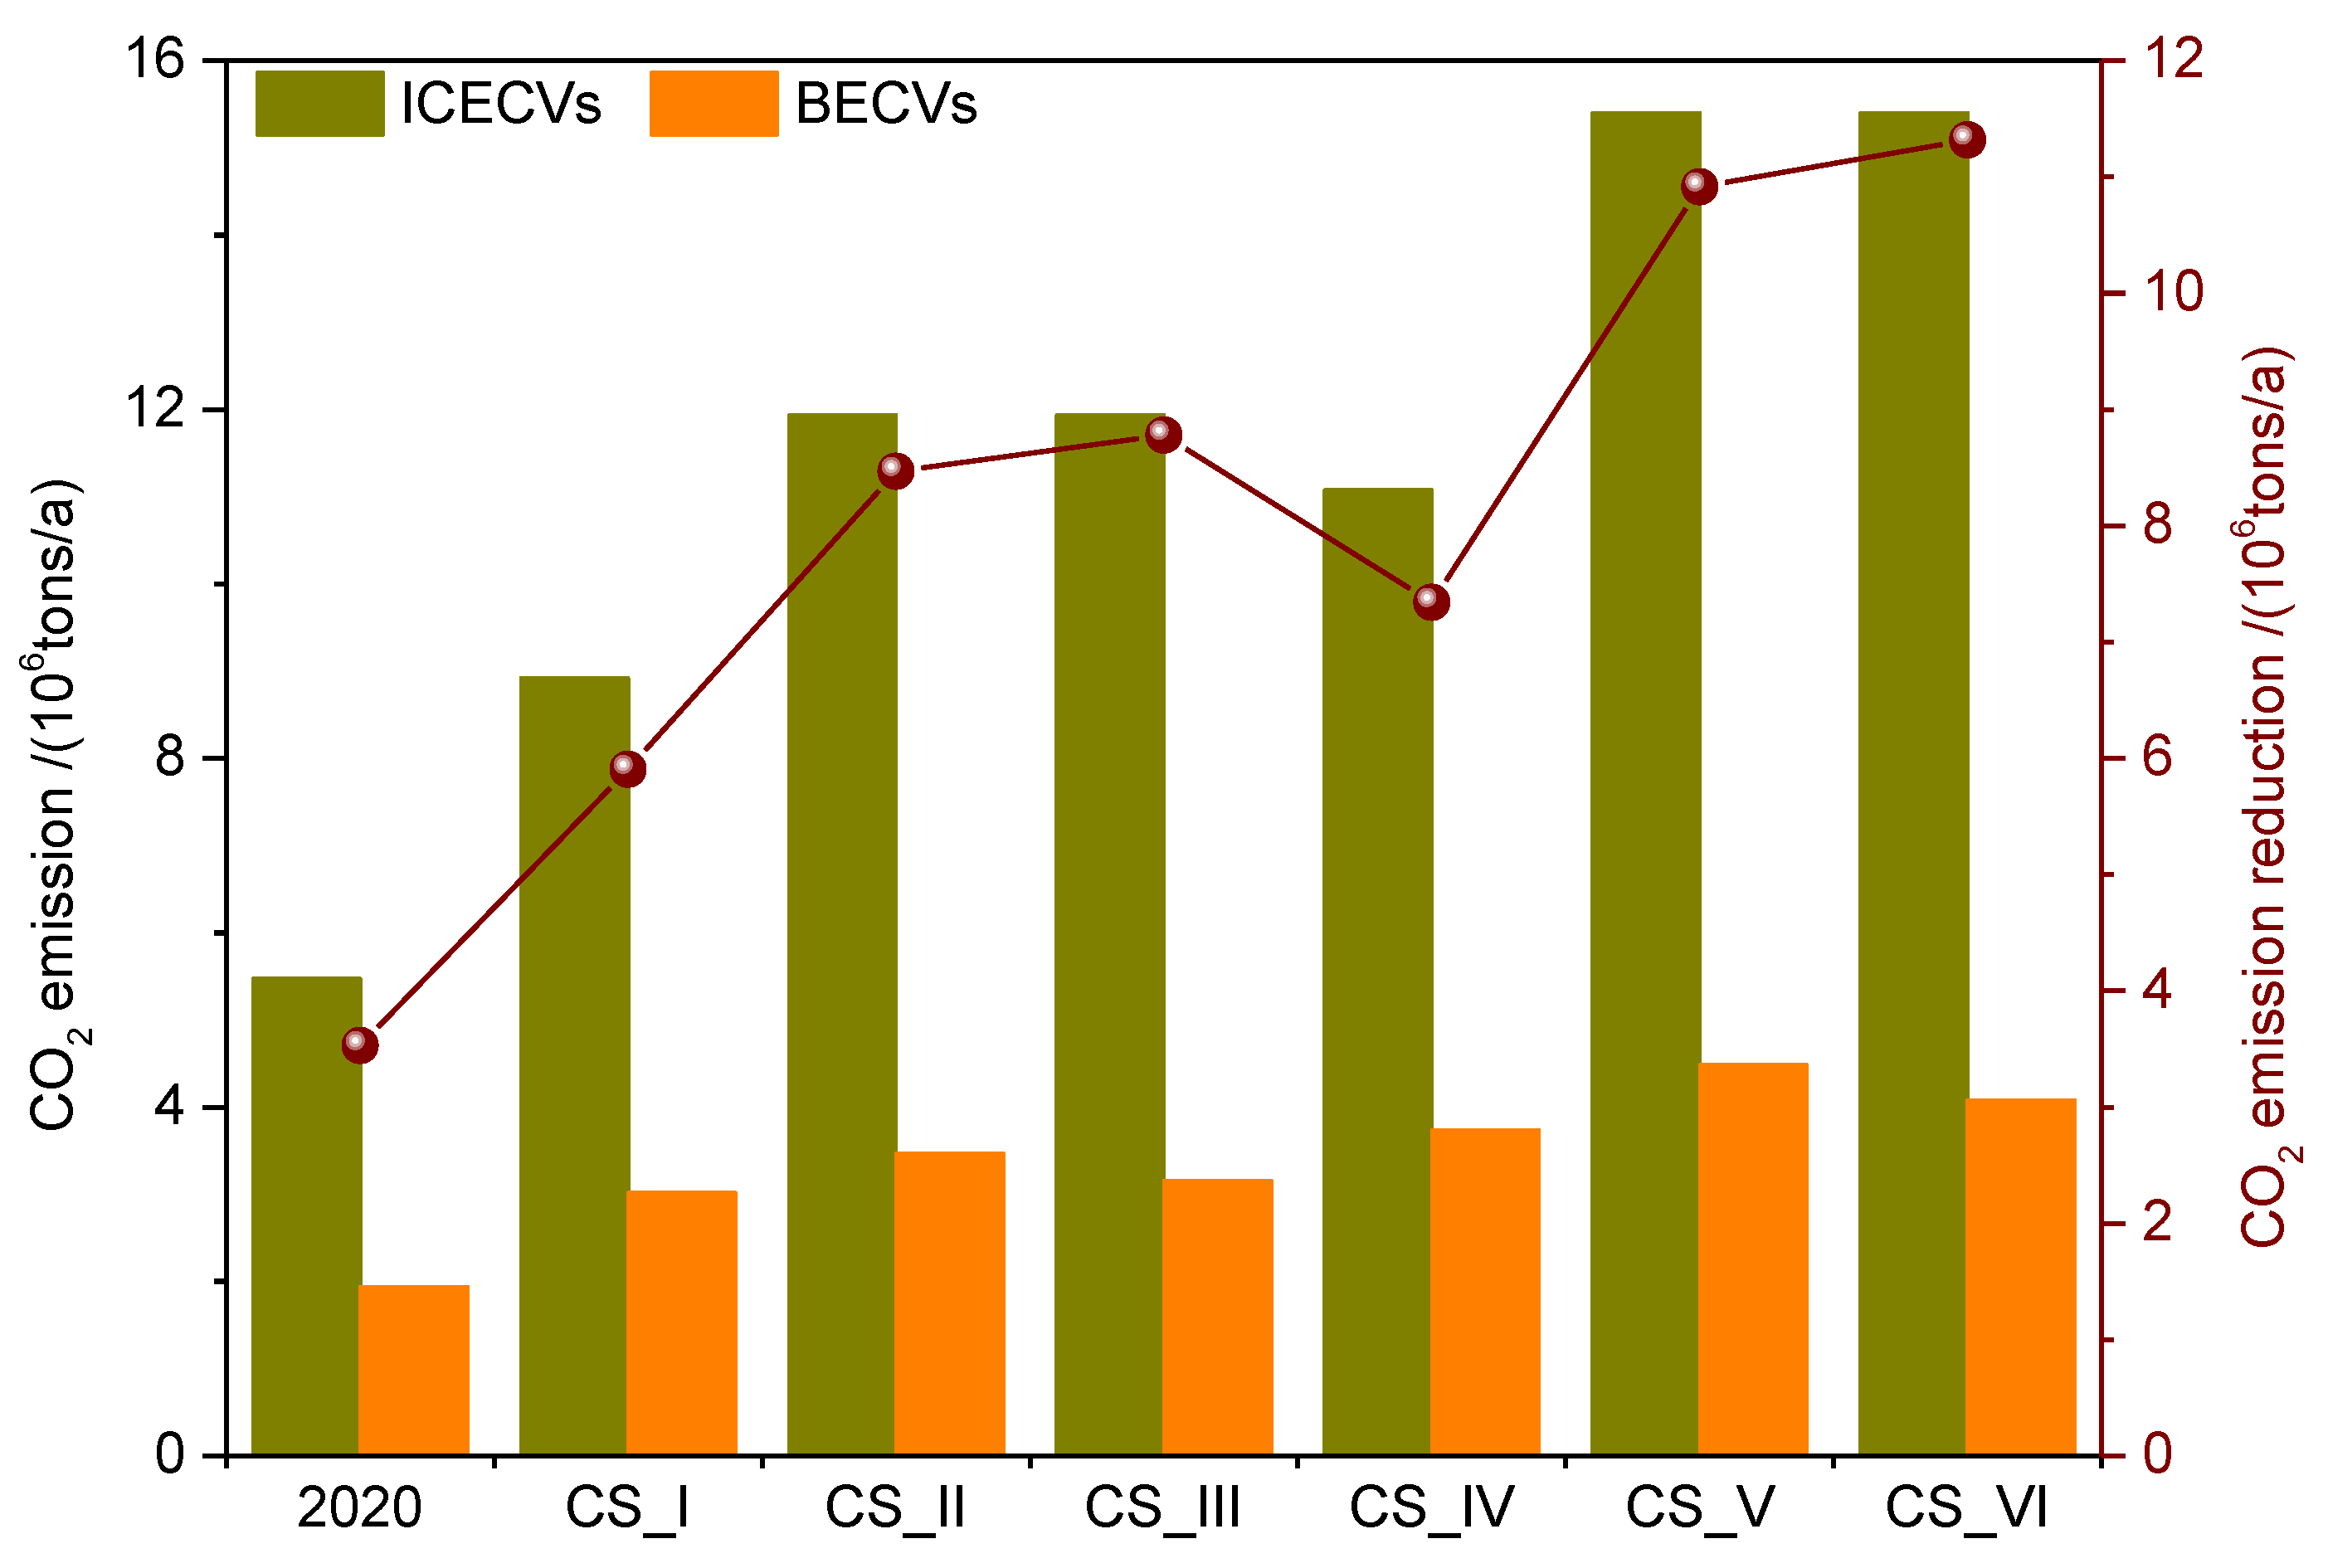
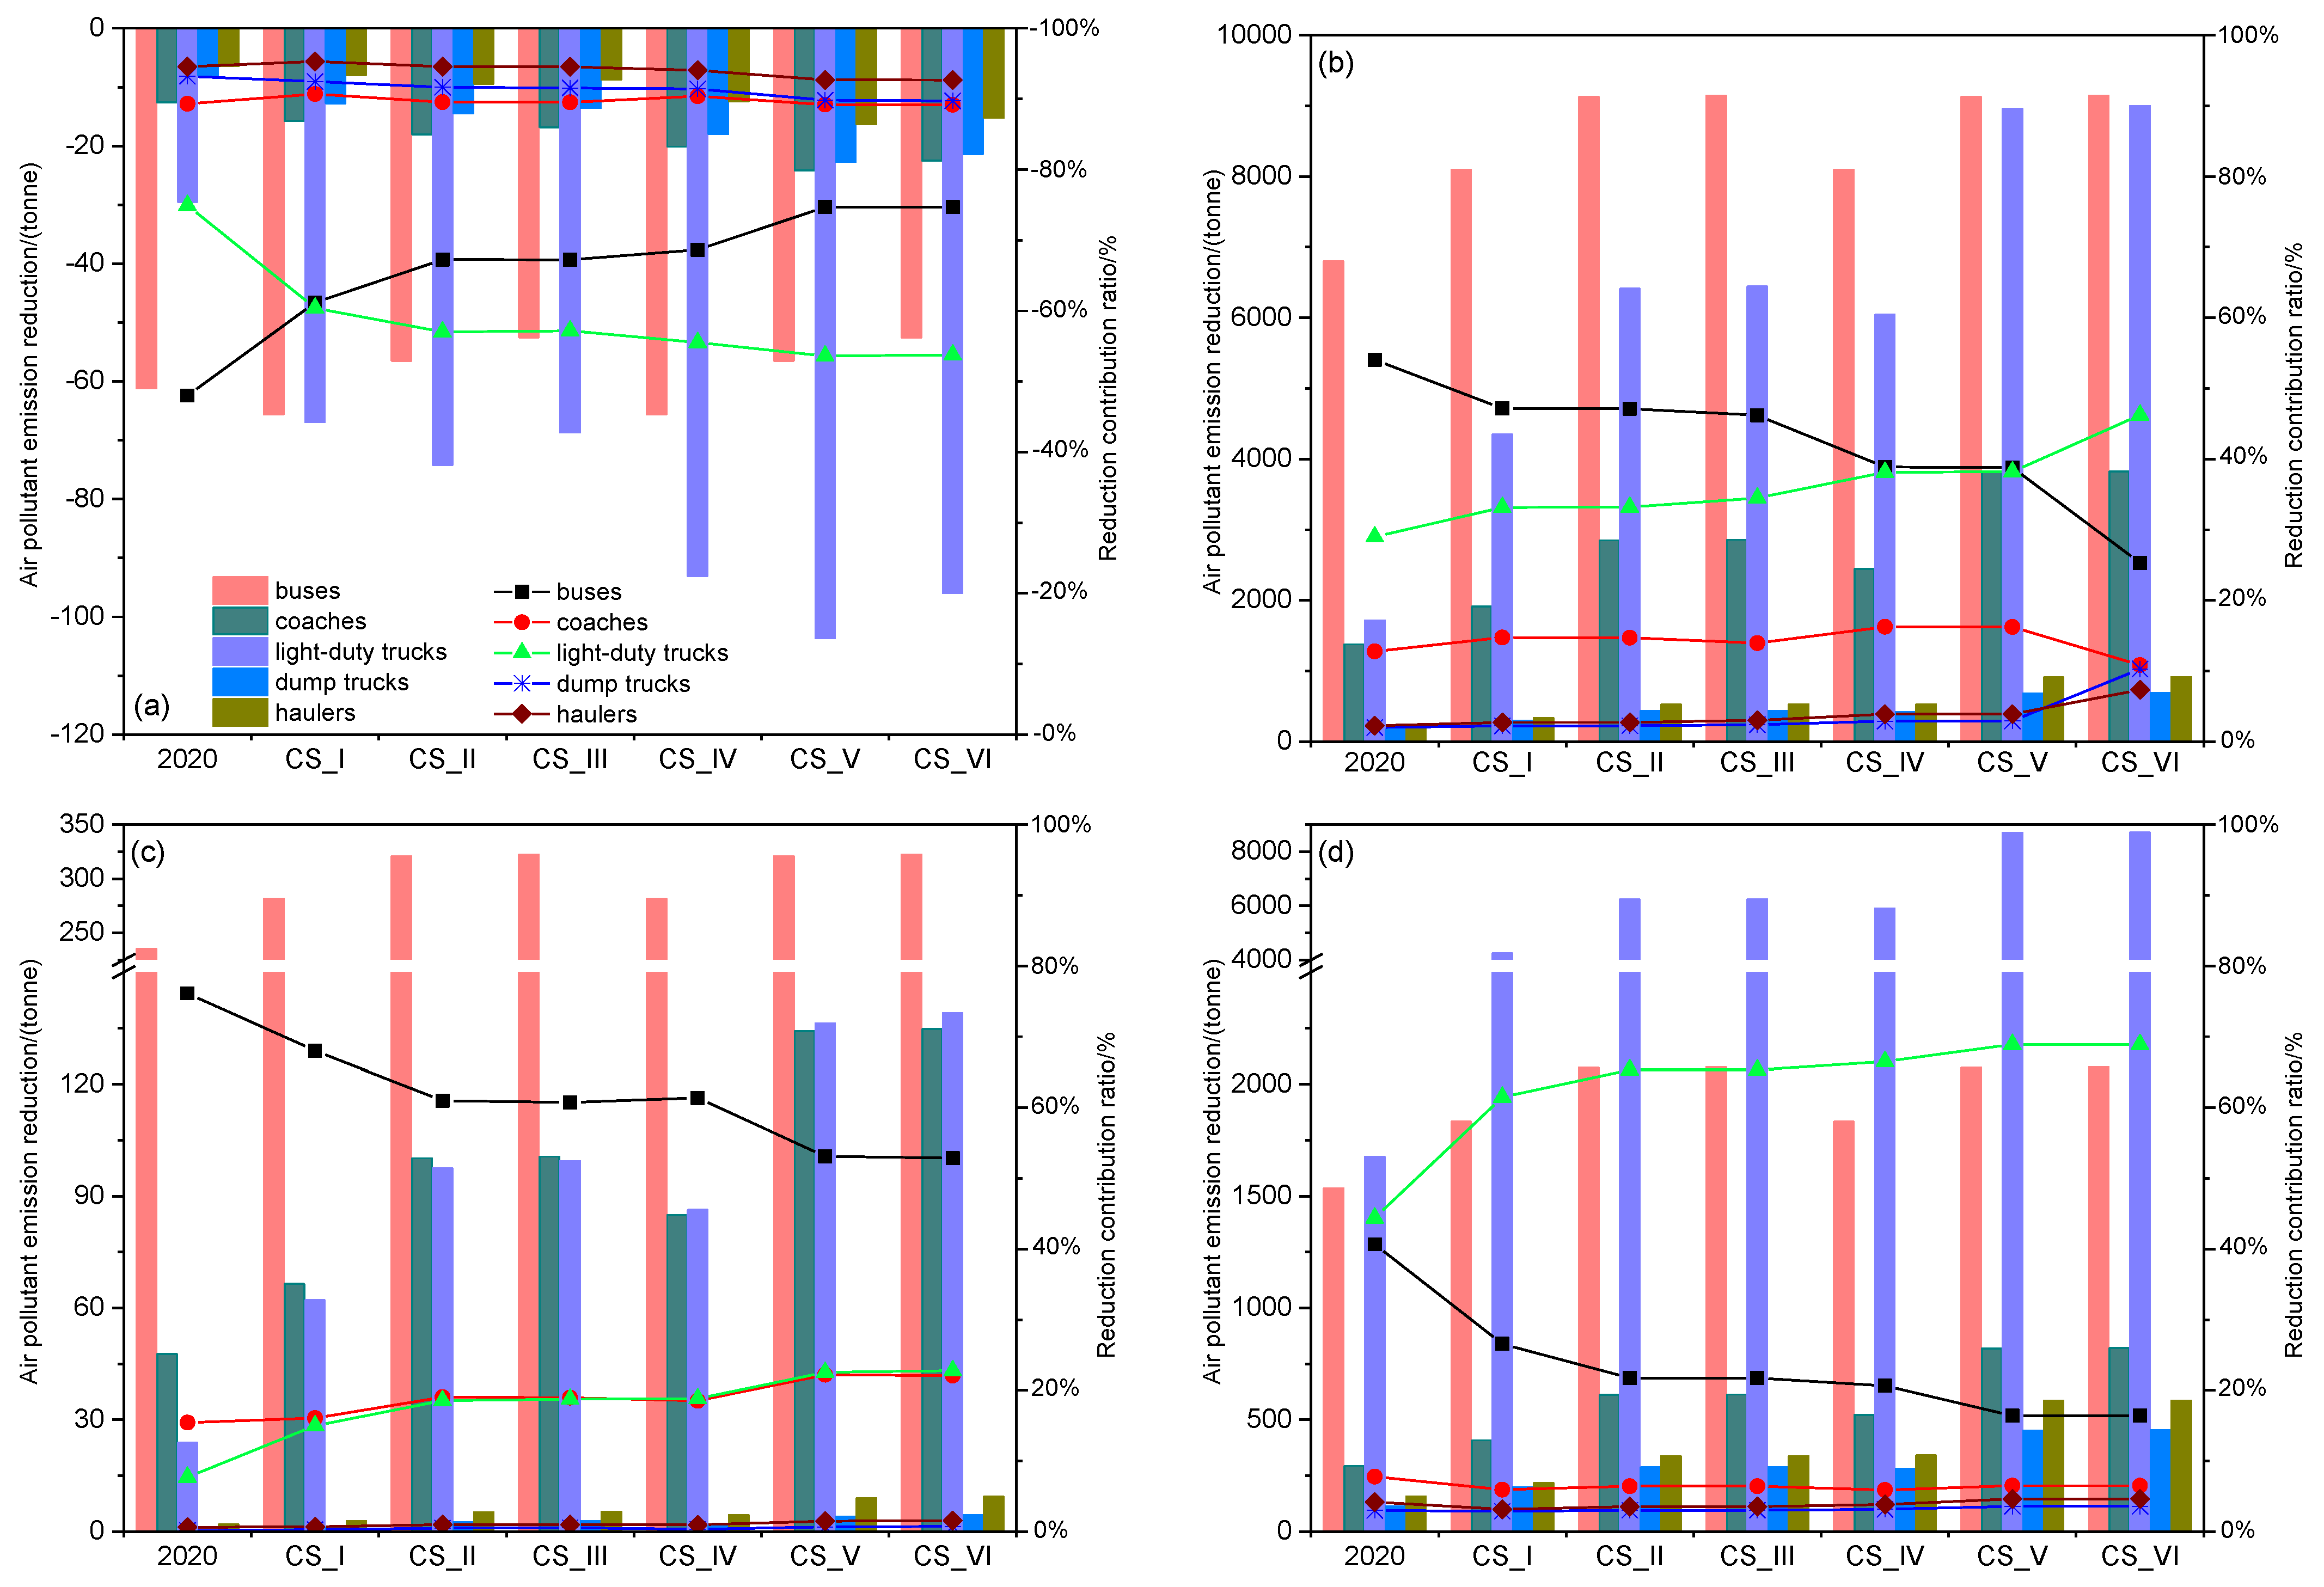
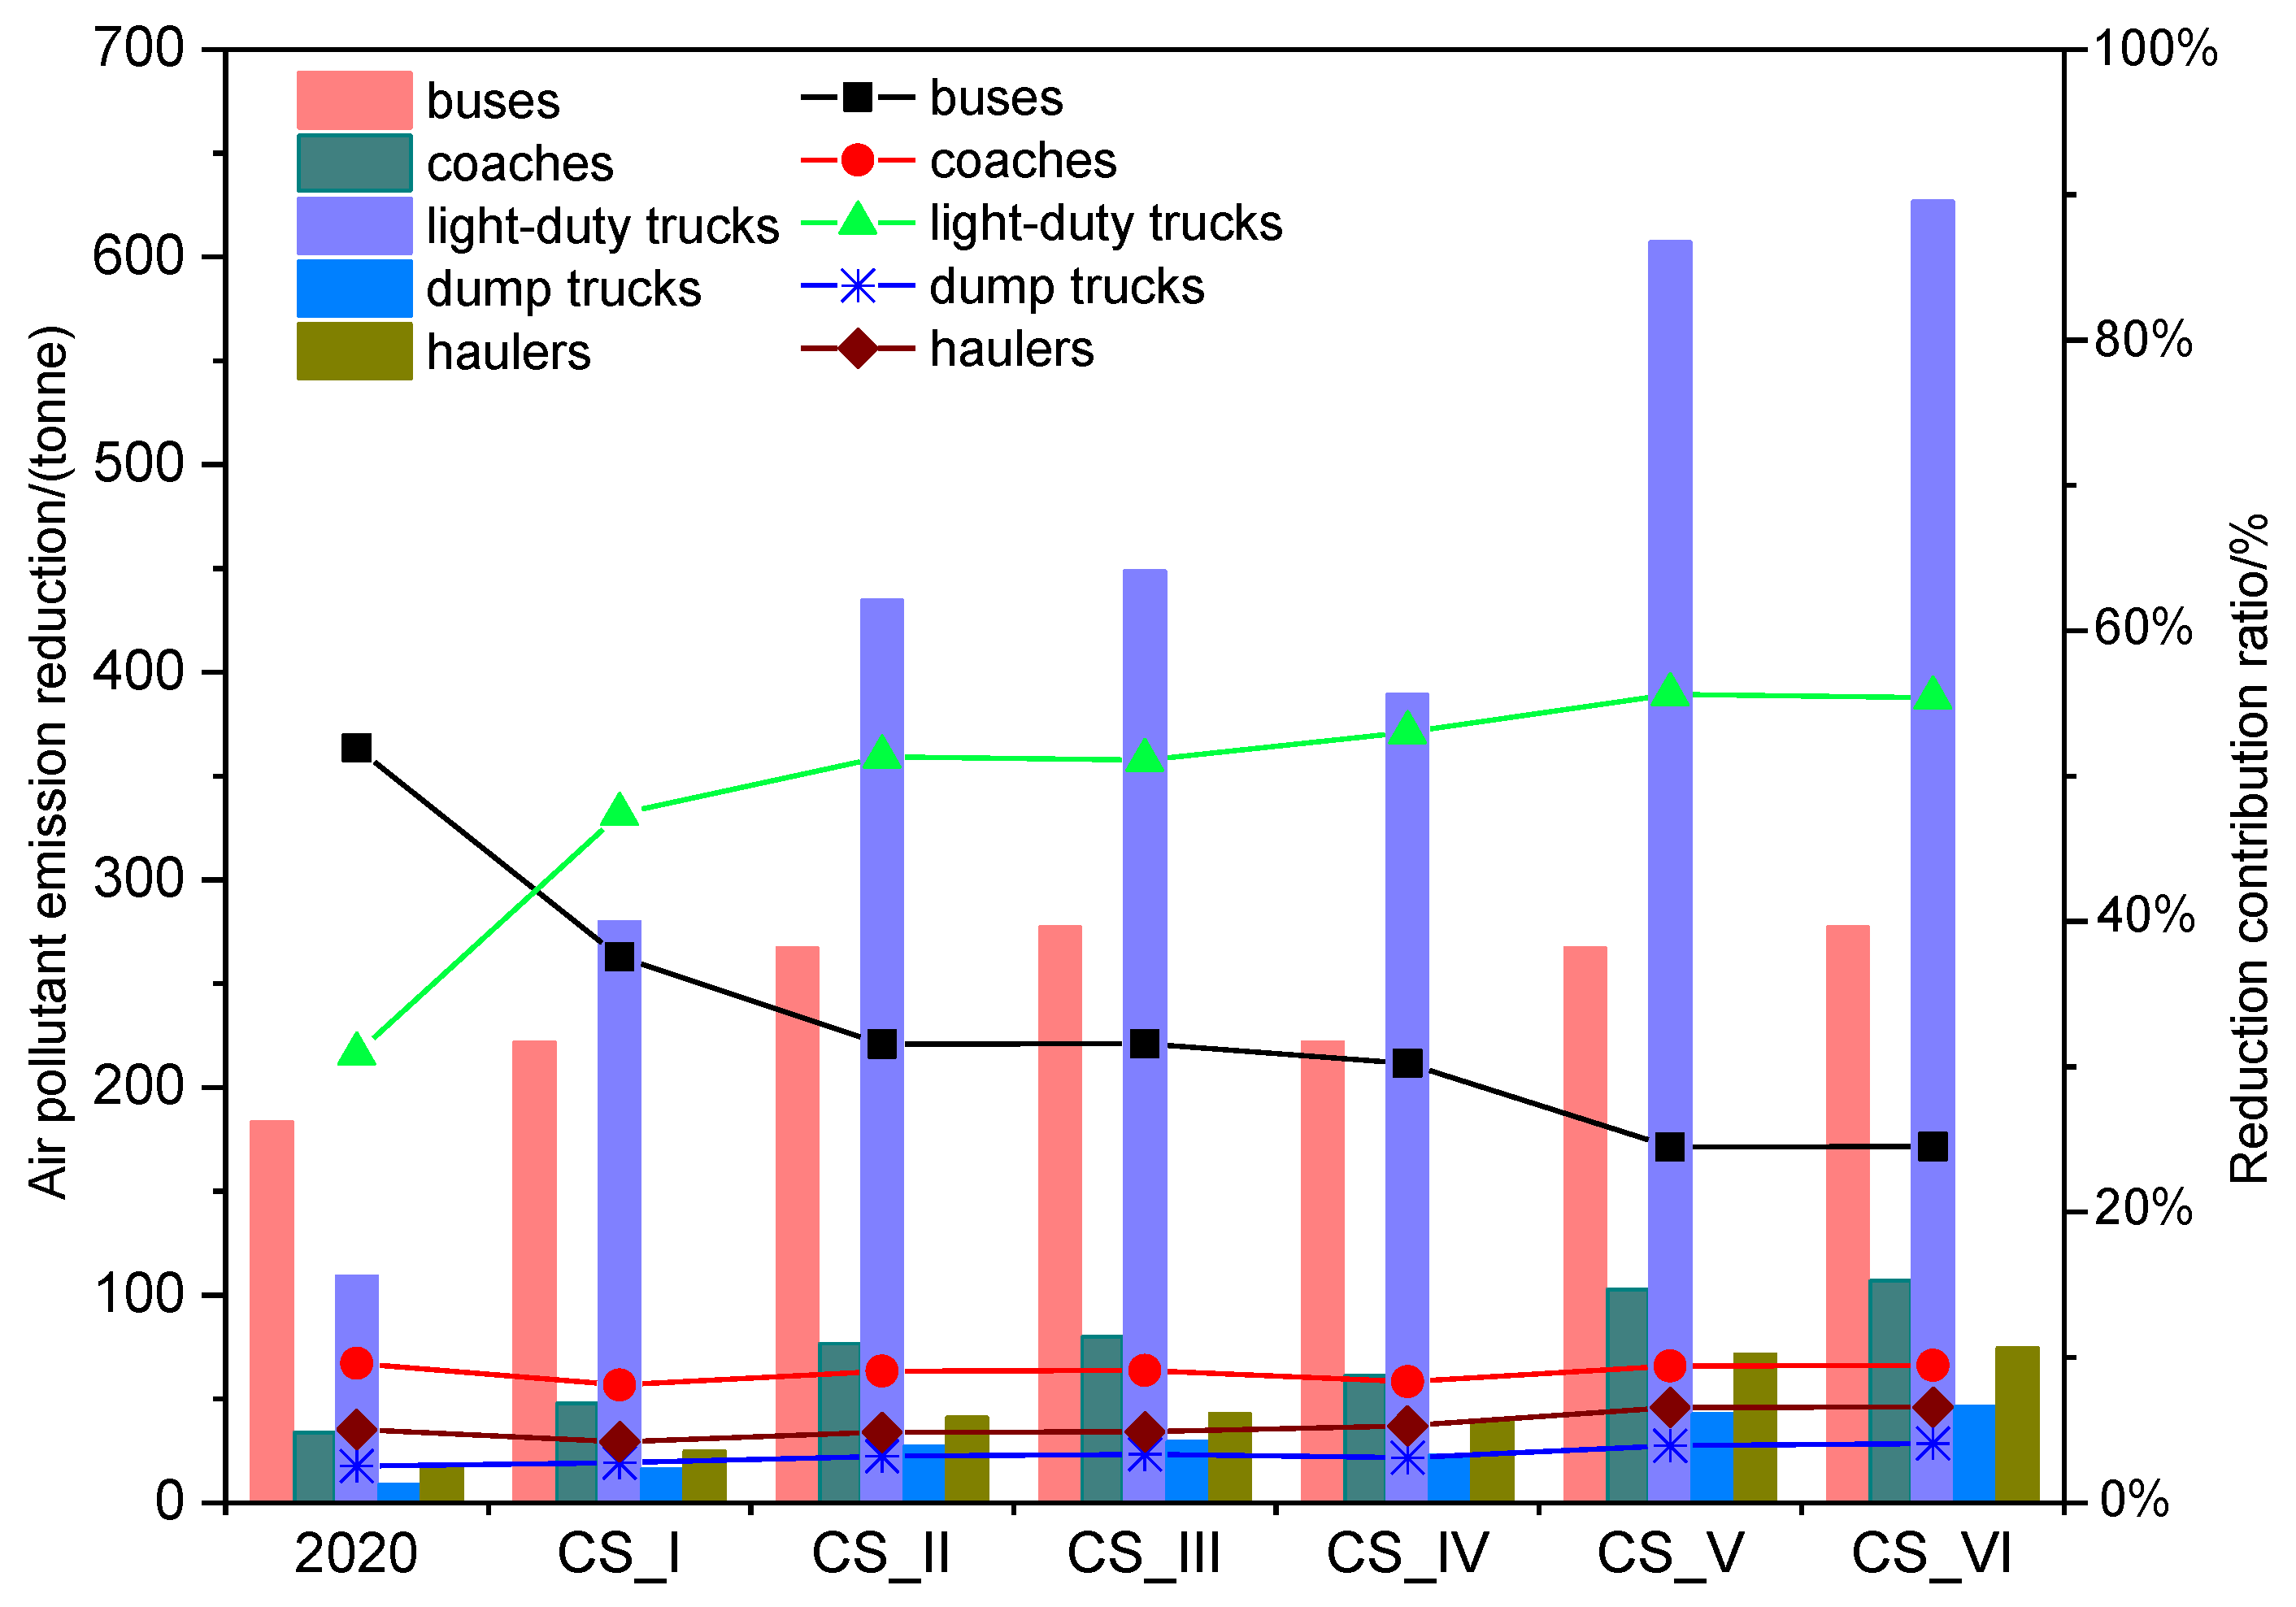
3.3. Emission Amelioration Benefit of Commercial Vehicle Electrification in Fuel Cycle

Figure 5 illustrates the comparison of emissions of air pollutants before and after the implementation of electrification in Guangdong in 2025 and 2030. Throughout the fuel cycle, the implementation of BECVs can significantly reduce NOx, PM2.5, and VOCs, but may slightly increase the SO2 emissions. In CS_II, the implementation of commercial vehicle electrification is expected to annually reduce air pollutant emissions, with values of 19.3 × 10³ tons/a, 0.5 × 10³ tons/a, and 9.5 × 10³ tons/a for NOx, PM2.5, and VOCs, respectively. Similarly, in CS_III, the air pollutant emission reductions for NOx, PM2.5, and VOCs present great reductions benefits after the implementation of commercial vehicle electrification; these are 19.4 × 10³ tons/a, 0.5 × 10³ tons/a, and 9.6 × 10³ tons/a, respectively. Compared with CS_II and CS_III, the emission reduction benefits of NOx, PM2.5, and VOCs for CS_V increased by 21.4%, 14.8%, and 32.4%, while the emission reductions effects for CS_VI increased by 21.5%, 14.9%, and 32.4%, which generally match the growth level of ownership, respectively.
Remarkable reduction benefits for NOx and PM2.5 are shown; they are equivalent to 4.6% and 10.2% in CS_II and 5.6% and 11.5% in CS_V for the total NOx and PM2.5 from mobile sources in Guangdong in 2019, respectively [26]. These results are consistent with the research conclusions of Tan R. et al., Yu X. et al., and Shafique M. et al. [27,28,29], indicating that the promotion of electric commercial vehicles is an important way for Guangdong to achieve the goals of pollutant mitigation and air quality improvement in the future. Moreover, it is highlighted that continuously optimizing the electric energy structure in Guangdong could further enhance the emission reduction benefits of vehicle electrification, despite the amelioration impacts from power structure optimization not being as large as those from electrification.
In addition, the CO2 emission reduction effects before and after the implementation of electrification in Guangdong are also calculated, as shown in Figure 6. It can be seen that the promotion of commercial vehicle electrification can bring about significant CO2 emission reduction benefits throughout the entire fuel cycle. In 2025, the ratio of CO2 emission reduction in BECVs to ICECVs could reach more than 65%. The emission reduction ratios of the four different scenarios in 2030 further increased to more than 70%. Comparing CS_III with CS_II, as well as comparing CS_VI with CS_V, it can be seen that a substantial power structure optimization will cause an approximately 3.7% CO2 emission reduction. Based on these results, persistent power structure optimization will also play a positive and significant role in promoting commercial vehicle electrification and bringing benefits to CO2 emission reduction.
The air pollutant and CO2 emission reductions’ amounts and proportions for commercial vehicle electrification in the public service sector in Guangdong are pictured in Figure 7 and Figure 8. It can be observed that there are differences between the emission reduction benefits of different vehicles in either scenario. Light-duty trucks obtain the most remarkable reduction potential among all, as a sharp emission depletion can be seen from 2020 to 2030. Overall, the electrification of buses and light-duty trucks contributes the most to the emission reduction in NOx, PM2.5, and VOCs, and CO2. In CS_V and CS_VI, the electrification of these two types of vehicles account for more than 75% of the NOx, PM2.5, and VOCs reduction. However, the increase in SO2 from the electrification of these two types of vehicles is concerning, accounting for more than 70% of the increase in SO2 emissions in 2030. Dump truck electrification contributes to the lowest fractions of the emission reduction in air pollutants. Even in CS_VI, it contributes no more than 4% to the reduction in NOx, PM2.5, and VOCs, and contributes no more than 4.1% to the CO2 reduction. Figure 7 and Figure 8 reaffirm that optimizing only the power structure will not have a significant impact on the reduction in NOx, PM2.5, and VOCs and will only benefit CO2 reduction and slow the increase in SO2.

4. Discussion

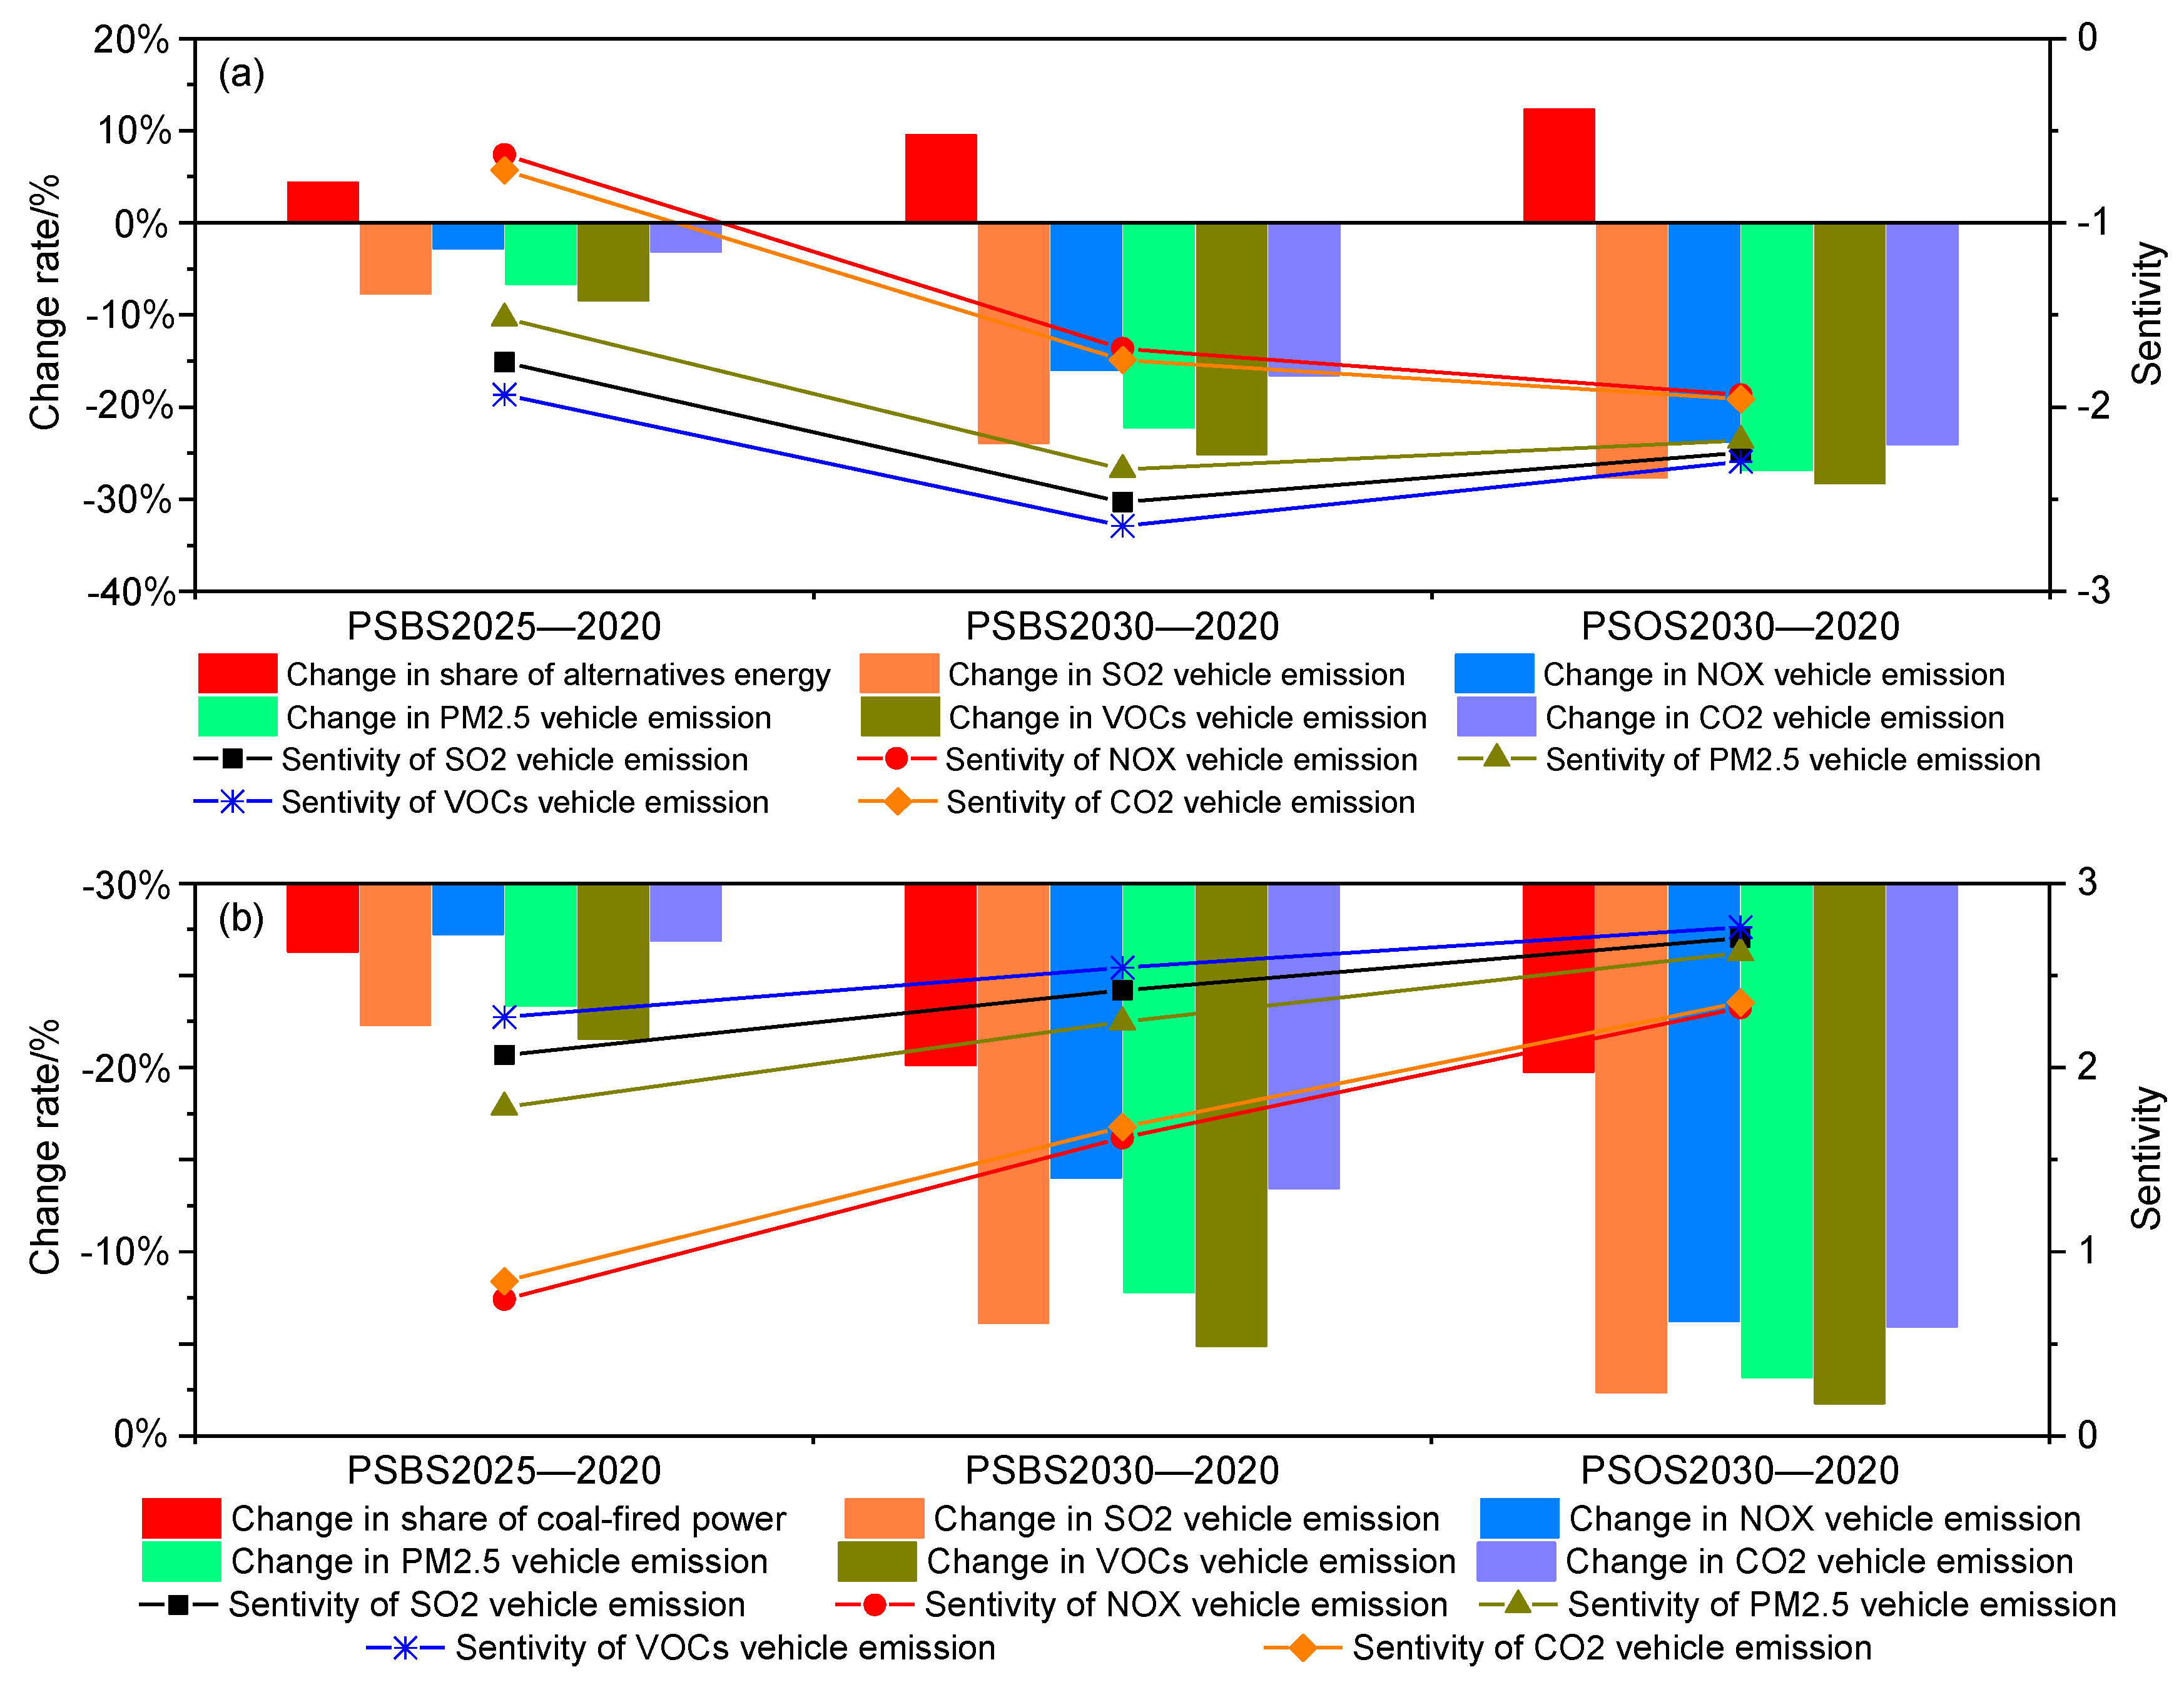
4.1. Sensitivity Analysis of BECVs Emission to Power Structure

Compared to ICECVs, the air pollutants (i.e., NOx, PM2.5, and VOCs) and GHG (i.e., CO2) emissions from the fuel cycle of BECVs show obvious declines, consistent with previous results [30,31,32,33]. However, the optimization of the power structure in 2030 cannot have significant emission reduction effects of BECVs. The sensitivity of BECVs emissions to the optimization of the power structure refers to the impact on the emission level of BECVs when a certain component of the power structure changes by a certain proportion. This sensitivity is expressed by the ratio of the change rate of pollutant emissions to the change rate of the power generation mode. The greater the absolute value of the ratio is, the higher the sensitivity will be. This can be attributed to the fact that the main way to optimize the power energy structure is to increase the proportion of renewable energy power generation and reduce the use of coal power. Therefore, in order to further analyze the sensitivity of the emissions in the fuel cycle of BECVs to optimizing the power structure, the proportion of renewable energy power generation and coal power generation are taken as sensitive factors affecting the emissions of BECVs in the paper; these are listed in Figure 9. The main factor affecting the fuel cycle emissions of BECVs is the proportion of coal-fired power generation in the power structure. This explains our finding that the optimization of the power structure in 2030 will not bring significant emission reduction effects for BECVs. Therefore, in order to achieve greater emission reduction benefits for commercial vehicle electrification, it is necessary to accelerate the alternative process of coal-fired power.

4.2. Uncertainty Analysis of Emission Estimation of CVs

In this study, the benefits of reductions in air pollutants and GHG emissions brought about by the substitution of ICECVs with BECVs in the public service sector (i.e., electric buses, coaches, light-duty trucks, dump trucks, and waste haulers) are calculated based on reasonable estimations. However, the air pollutant and GHG emission reductions obtained for ICECVs and BECVs are influenced by many sophisticated factors, such as vehicle type, motor vehicle emission standards, power generation, and electric power structure. Any uncertainties due to these factors could severely restrict the accuracy and validity of the benefits of air pollutant and GHG emission reductions. First of all, the uncertainty surrounding the predicted ownership of commercial vehicles and the number of BECVs replacing ICECVs has introduced great uncertainty into the results for air pollutants and GHG emissions. Secondly, the China VI emission standards for heavy-duty diesel vehicles have only just begun to be implemented in China, and currently there are few studies on the actual emission levels of China VI diesel commercial vehicles. Hence, the uncertainties regarding the emission factors of the China VI diesel commercial vehicles used in this study are based on calibrations of the emission factor of the corresponding China V model. Moreover, the research and formulation of China VII motor vehicle emission standards have been put on the agenda, and it is possible that they will be implemented after 2025. These drawbacks could cause the proposed results to deviate from the actual values for the target years. In addition, constant energy consumption levels are used to measure the fuel consumption and power consumption of various commercial vehicles in the target year, ignoring the energy-saving and emission-reduction benefits that could be gained from technological progress. Additionally, these might lead to some errors occurring in the calculation of the emission reduction benefits of BECVs in the fuel cycle. Therefore, in the future efforts should be made to further identify the effects of various factors on the benefits of air pollutant and GHG emission reductions for ICECVs and BECVs. This would help us to obtain more detailed information on the air pollutant and CO2 emission reduction benefits brought about by the electrification of commercial vehicles.

4.3. Promotion Strategies of Commercial Vehicle Electrification

Despite uncertainties existing in the calculation of the emission reduction benefits, it is vital to promote the use of BECVs in the future. This research distinguishes the emission reduction differences brought about by the use of various BECVs. This could be beneficial in helping us to identify the management priority for pollutant and CO2 emission reductions. The importance of air quality amelioration and peaking carbon emissions is indisputable for Guangdong Province [34], as well as for the whole of China [35,36]. Therefore, further attention should be paid to the electrification of buses and light-duty trucks, which could provide a potential solution for Guangdong regarding controlling the emissions of ozone precursors (i.e., NOx and VOCs) and the emissions of CO2. In general, it is recommended that decision-makers should give higher priority to bus and light-duty truck electrification, which will bring enormous benefits to air quality amelioration and peaking carbon emissions in Guangdong Province, as well as in other regions.

5. Conclusions

The reductions in the emissions of air pollutants and CO2 in the fuel cycle brought about by commercial vehicle electrification in the public service sector were calculated under six different combination scenarios. Additionally, the fossil fuel consumption reduction brought about by the electrification of commercial vehicles was also evaluated in the paper. Our results indicate that by 2030 the electrification of the five commercial vehicles mentioned here in OECVBS2030 could save 3.5 × 10⁶ tons fossil fuel, with an annual emission reduction of 19.3 × 10³ tons NOx, 0.5 × 10³ tons PM2.5, 9.5 × 10³ tons VOCs, and 8.5 × 10⁶ tons CO2 in CS_II. The outcomes for OECVPS are consistent with those for OECVBS, as well as with better energy conservation and emission reduction effects. Moreover, this study also indicates that unless the proportion of coal power generation can be reduced effectively while increasing the proportion of renewable energy power, the air quality amelioration benefits of the electrification of commercial vehicle might be ambiguous, yet electrification will still help in CO2 reduction.
The environmental and climate benefits achieved by the promotion of BECVs will play a key role in local air quality improvement and help us to meet the peaking carbon emissions target for Guangdong. Under the premise of realizing a 100% electrification of buses, higher priority should be given to the electrification of light-duty trucks, which would provides a potential solution to Guangdong for controlling the emissions of ozone precursors (i.e., NOx and VOCs) and CO2. In addition, these results could stimulate the introduction of advanced pollution mitigation and peaking carbon policies by policy makers in Guangdong, as well as those of other regions of China.

Supplementary Materials

The following are available online at https://0-www-mdpi-com.brum.beds.ac.uk/article/10.3390/su131911098/s1, Figure S1: Air pollutants and CO2 emission factors of power production, Figure S2: Air pollutants and CO2 emission factors of diesel in production, storage, transportation and marketing, Table S1: Average energy consumption of commercial vehicles, Table S2: Air pollutants emission factors of China VI commercial vehicles.

Author Contributions

Writing—original draft preparation and editing: J.L. Writing—review and editing, supervision: J.C. Writing—review and editing, Y.L. (Yixi Li). Methodology and data curation: Y.L. (Yinping Luo) and Q.Z. Supervision: Y.L. (Yutao Luo). All the authors have contributed to the interpretation, discussion, review, and editing of the manuscript. All authors have read and agreed to the published version of the manuscript.

Funding

This research was funded by the Key-Area Research and Development Program of Guangdong Province (2020B1111360003) and the Energy Foundation China.

Institutional Review Board Statement

Not applicable.

Informed Consent Statement

Not applicable.

Data Availability Statement

Not applicable.

Acknowledgments

This research was financially supported by the Key-Area Research and Development Program of Guangdong Province (2020B1111360003) and the Energy Foundation China. The authors are grateful to the anonymous reviewers for their insightful comments.

Conflicts of Interest

The authors declare no conflict of interest.

References

  1. Ministry of Ecology and Environment of the People′s Republic of China (MEE). China Mobile Source Environmental Management Annual Report 2020; MEE: Beijing, China, 2020. Available online: https://www.mee.gov.cn/hjzl/sthjzk/ydyhjgl/ (accessed on 6 October 2021).
  2. Zhang, L.; Qin, Q. China’s new energy vehicle policies: Evolution, comparison and recommendation. Transp. Res. Part A Policy Pract. 2018, 110, 57–72. [Google Scholar] [CrossRef]
  3. Jia, L.; Meng, Q.; Yi, L. Analysis of the development trend of commercial vehicle electrification in China. Transp. Energy Conserv. Environ. Prot. 2021, 17, 21–24. [Google Scholar]
  4. Alimujiang, A.; Jiang, P. Synergy and co-benefits of reducing CO2 and air pollutant emissions by promoting electric vehicles—A case of Shanghai. Energy Sustain. Dev. 2020, 55, 181–189. [Google Scholar] [CrossRef]
  5. Jiao, J.; Huang, Y.; Liao, C. Co-benefits of reducing CO2 and air pollutant emissions in the urban transport sector: A case of Guangzhou. Energy Sustain. Dev. 2020, 59, 131–143. [Google Scholar]
  6. Zheng, Y.; He, X.; Wang, H.; Wang, M.; Zhang, S.; Ma, D.; Wang, B.; Wu, Y. Well-to-wheels greenhouse gas and air pollutant emissions from battery electric vehicles in China. Mitig. Adapt. Strateg. Glob. Chang. 2020, 25, 355–370. [Google Scholar] [CrossRef]
  7. Ke, W.; Zhang, S.; He, X.; Wu, Y.; Hao, J. Well-to-wheels energy consumption and emissions of electric vehicles: Mid-term implications from real-world features and air pollution control progress. Appl. Energy 2017, 188, 367–377. [Google Scholar] [CrossRef]
  8. Wu, Y.; Zhang, L. Can the development of electric vehicles reduce the emission of air pollutants and greenhouse gases in developing countries. Transp. Res. Part D Transp. Environ. 2017, 51, 129–145. [Google Scholar] [CrossRef]
  9. Yang, L.; Yu, B.; Yang, B.; Chen, H.; Malima, G.; Wei, Y. Life cycle environmental assessment of electric and internal combustion engine vehicles in China. J. Clean. Prod. 2020, 285, 124899. [Google Scholar] [CrossRef]
  10. Huo, H.; Cai, H.; Zhang, Q.; Liu, F.; He, K. Life-cycle assessment of greenhouse gas and air emissions of electric vehicles: A comparison between China and the US. Atmos. Environ. 2015, 108, 107–116. [Google Scholar] [CrossRef]
  11. Kong, W.; Huang, B.; Li, Q.; Wang, X. Study on development path of electric vehicle in China from a view of energy conservation and emission reduction. Appl. Mech. Mater. 2014, 525, 355–360. [Google Scholar] [CrossRef]
  12. Yu, D.L.; Zhang, H.S. The life cycle analysis of energy consumption and emission of pure electric van and diesel van. Acta Sci. Circumstantiae 2019, 39, 2043–2052. [Google Scholar]
  13. Wong, E.Y.C.; Ho, D.C.K.; So, S.; Tsang, C.W.; Chan, E.M.H. Life cycle assessment of electric vehicles and hydrogen fuel cell vehicles using the greet model—A comparative study. Sustainability 2021, 13, 4872. [Google Scholar] [CrossRef]
  14. Qiao, Q.; Zhao, F.; Liu, Z.; He, X.; Hao, H. Life cycle greenhouse gas emissions of electric vehicles in China: Combining the vehicle cycle and fuel cycle. Energy 2019, 177, 222–233. [Google Scholar] [CrossRef]
  15. Mao, F.; Li, Z.; Zhang, K. Carbon dioxide emissions estimation of conventional diesel buses electrification: A well-to-well analysis in Shenzhen, China. J. Clean. Prod. 2020, 277, 123048. [Google Scholar] [CrossRef]
  16. Yang, J.; Dong, J.; Lin, Z.; Hu, L. Predicting market potential and environmental benefits of deploying electric taxis in Nanjing, China. Transp. Res. Part D Transp. Environ. 2016, 49, 68–81. [Google Scholar] [CrossRef] [Green Version]
  17. Li, N.; Chen, J.P.; Tsai, I.C.; He, Q.; Chi, S.Y.; Lin, Y.C.; Fu, T.M. Potential impacts of electric vehicles on air quality in Taiwan. Sci. Total Environ. 2016, 566, 919–928. [Google Scholar] [CrossRef] [PubMed]
  18. Ma, Y.; Ke, R.Y.; Han, R.; Tang, B.J. The analysis of the battery electric vehicle’s potentiality of environmental effect: A case study of Beijing from 2016 to 2020. J. Clean. Prod. 2017, 145, 395–406. [Google Scholar] [CrossRef]
  19. Dong, B.; Dai, J.; Zhang, W.; Guo, J.; Liu, Z. Research on strategy of Guangdong energy and source development. South. Energy Constr. 2018, 5, 37–43. [Google Scholar]
  20. Ministry of Ecology and Environment of the People′s Republic of China (MEE). Announcement about Releasing Five National Technical Guidelines of Air Pollutant Emissions Inventory [EB/OL]; MEE: Beijing, China, 2014. Available online: https://www.mee.gov.cn/gkml/hbb/bgg/201501/t20150107_293955.htm (accessed on 6 October 2021).
  21. Wang, T.; Zhang, Z.; Sun, X. Carbon emission analysis on gasoline and diesel production stages in refining and chemical enterprise. Mod. Chem. Ind. 2020, 40, 241–244. [Google Scholar]
  22. Liu, X.; Guo, D.; Li, J.; Ge, Y.; Tan, J.; Lü, L. Study on emission characteristics of Volatile Organic Compounds (VOCs) from heavy duty diesel vehicles. China Environ. Sci. 2021, 7, 1–11. [Google Scholar] [CrossRef]
  23. Liu, Y.; Tan, J. Green traffic-oriented heavy-duty vehicle emission characteristics of china vi based on portable emission measurement systems. IEEE Access 2020, 8, 106639–106647. [Google Scholar] [CrossRef]
  24. Song, L.; Ge, S.; Feng, L. Comparative Life Cycle Energy Consumption and Emissions Assessment of Electric and Diesel Trucks; Environmental Engineering 2017 Supplement 2; Editorial Department of Environmental Engineering, Industrial Construction Magazine Agency: Beijing, China, 2017; p. 6. [Google Scholar]
  25. Wu, Y.; Yang, Z.; Lin, B.; Liu, H.; Wang, R.; Zhou, B.; Hao, J. Energy consumption and CO2 emission impacts of vehicle electrification in three developed regions of China. Energy Policy 2012, 48, 537–550. [Google Scholar] [CrossRef]
  26. Department of Ecological Environment of Guangdong Province. Ecological Environment Statistical Bulletin of Guangdong Province in 2019. Available online: http://gdee.gd.gov.cn/tjxx3187/content/post_3247449.html (accessed on 6 October 2021).
  27. Tan, R.; Tang, D.; Lin, B. Policy impact of new energy vehicles promotion on air quality in Chinese cities. Energy Policy 2018, 118, 33–40. [Google Scholar] [CrossRef]
  28. Xie, Y.; Wu, D.; Zhu, S. Can new energy vehicles subsidy curb the urban air pollution? Empirical evidence from pilot cities in China. Sci. Total Environ. 2020, 754, 142232. [Google Scholar]
  29. Shafique, M.; Azam, A.; Rafiq, M.; Luo, X. Life cycle assessment of electric vehicles and internal combustion engine vehicles: A case study of Hong Kong. Res. Transp. Econ. 2021, 101112. [Google Scholar] [CrossRef]
  30. Shi, S.; Zhang, H.; Yang, W.; Zhang, Q.; Wang, X. A life-cycle assessment of battery electric and internal combustion engine vehicles: A case in Hebei Province, China. J. Clean. Prod. 2019, 228, 606–618. [Google Scholar] [CrossRef]
  31. Shi, X.; Wang, X.; Yang, J.; Sun, Z. Electric vehicle transformation in Beijing and the comparative eco-environmental impacts: A case study of electric and gasoline powered taxis. J. Clean. Prod. 2016, 137, 449–460. [Google Scholar] [CrossRef]
  32. He, X.; Zhang, S.; Ke, W.; Zheng, Y.; Zhou, B.; Liang, X.; Wu, Y. Energy consumption and well-to-wheels air pollutant emissions of battery electric buses under complex operating conditions and implications on fleet electrification. J. Clean. Prod. 2017, 171, 714–722. [Google Scholar] [CrossRef]
  33. Wang. X., R.; Liu, W.F.; Zhang, L.W.; Zhang, M. CO2 emission reduction effect of electric bus based on energy chain in life cycle. J. Transp. Syst. Eng. Inf. Technol. 2019, 19, 19–25. [Google Scholar]
  34. Zhao, W.; Gao, B.; Lu, Q.; Zhong, Z.; Liang, X.; Liu, M.; Ma, S.; Sun, J.; Chen, L.; Fan, S. Ozone pollution trend in the Pearl River Delta region during 2006–2019. Environ. Sci. 2021, 42, 97–105. [Google Scholar]
  35. Wang, T.; Xue, L.; Brimblecombe, P.; Lam, Y.F.; Li, L.; Zhang, L. Ozone pollution in China: A review of concentrations, meteorological influences, chemical precursors, and effects. Sci. Total Environ. 2016, 575, 1582–1596. [Google Scholar] [CrossRef] [PubMed]
  36. Li, K.; Jacob, D.J.; Shen, L.; Lu, X.; De Smedt, I.; Liao, H. Increases in surface ozone pollution in China from 2013 to 2019, anthropogenic and meteorological influences. Atmos. Chem. Phys. 2020, 20, 11423–11433. [Google Scholar] [CrossRef]
Figure 1. Forecast results of the progress of commercial vehicle electrification.
Sustainability 13 11098 g001
Figure 2. Electricity consumption and fuel savings brought about by BECVs. In the picture, (a) Electricity consumption increased by BECVs. (b) Fuel consumption saved by BECVs.
Sustainability 13 11098 g002
Figure 3. The unit-vehicle air pollutant emission levels of fuel and electric vehicles. In the pictures (ad), unit-vehicle SO2, NOx, PM2.5, and VOCs emission levels of China VI ICECVs and BECVs.
Sustainability 13 11098 g003aSustainability 13 11098 g003b
Figure 4. The unit-vehicle CO2 emission levels of fuel and electric vehicles.
Sustainability 13 11098 g004
Figure 5. Comparison of air pollutant emissions before and after the electrification of commercial vehicles. In picture (a), negative emission reductions in SO2 denote the slight increase in SO2 emissions after the implementation of electrification. In the pictures (bd), the emission reductions for NOx, PM2.5, and VOCs come from the implementation of electrification.
Sustainability 13 11098 g005
Figure 6. Comparison of CO2 emissions before and after the electrification of commercial vehicles (note: the emission reductions in CO2 come from the implementation of electrification).
Sustainability 13 11098 g006
Figure 7. The proportion of air pollutant emission reduction brought about by the electrification of different vehicles. In the pictures, (ad) are the emission reductions for SO2, NOx, PM2.5, and VOCs, respectively. Additionally, it should be noted that the negative emission of SO2 denotes that no emission reduction has occurred.
Sustainability 13 11098 g007
Figure 8. The proportion of CO2 emission reduction brought about by the electrification of different vehicles.
Sustainability 13 11098 g008
Figure 9. The sensitivity of electric bus emissions to the proportion of renewable energy power generation and coal power generation. (a) The sensitivity of electric bus emissions to the proportion of renewable energy power generation. (b) The sensitivity of electric bus emissions to the proportion of coal power generation.
Sustainability 13 11098 g009
Table 1. Description of different scenarios.
Combined ScenarioOwnership of BECVsPower Structure
CS_IOECVBS2025PSBS2025
CS_IIOECVBS2030PSBS2030
CS_IIIOECVBS2030PSOS2030
CS_IVOECVPS2025PSBS2025
CS_VOECVPS2030PSBS2030
CS_VIOECVPS2030PSOS2030
Table 2. Average mileage of commercial vehicles (unit: km/year).
VehiclesBusCoachLight-Duty TruckDump TruckWaste Hauler
Mileage60,00058,00036,00048,00054,000
Publisher’s Note: MDPI stays neutral with regard to jurisdictional claims in published maps and institutional affiliations.

