
Virtual Engineering Using Realistic Virtual Models in Brownfield Factory Layout Planning


Department of Industrial and Materials Science, Division of Production Systems, Chalmers University of Technology, 412 96 Gothenburg, Sweden
*
Author to whom correspondence should be addressed.
Sustainability 2021, 13(19), 11102; https://0-doi-org.brum.beds.ac.uk/10.3390/su131911102
Submission received: 30 August 2021
/
Revised: 2 October 2021
/
Accepted: 3 October 2021
/
Published: 8 October 2021
(This article belongs to the Special Issue New and Renewed Manufacturing Paradigms for Sustainable Production)
Abstract
:As more pressure is put on manufacturing companies to increase productivity and reduce waste as a means to remain competitive due to increased globalization and digitalization, many companies find themselves investing in their production systems, leading to changes in their existing factories and production systems. This process is usually performed with 2D CAD drawings and data of varying quality, leading to several challenges along the way. This longitudinal research follows up on eight years of industrial studies where researchers have applied 3D laser scanning and immersive virtual reality to improve the brownfield factory layout planning processes in real industrial scenarios, a novel approach in the research field. By interviewing key stakeholders at each company and analyzing the findings, challenges in data availability and accuracy of existing data, grasping scale and perspective, and challenges gathering input and communicating around planned changes are identified and shown to be substantially alleviated by the application of the technological tools and allowing more people to be part of the factory layout planning process. By using virtual engineering, industries can improve their brownfield factory layout planning process and take well-informed decisions leading to sustainability benefits via fewer costly mistakes, improved employee engagement, and less need for travel.
1. Introduction
As an effect of increased globalization and digitalization, manufacturing companies are expected to increase productivity and decrease waste to stay competitive. The productivity of a manufacturing company’s production system depends on many different factors, such as the level of automation, product and process flow, production scheduling, supplier arrangements, and facility layout. A manufacturing company’s production system evolves over time to accommodate product changes and introductions, either through a redesign of the existing system or through designing a new additional or replacement system [1]. Designing or redesigning production systems is often done in project structures, in which many problems and factors are considered [2]. One key activity is layout planning, where the positions of workstations, machines, and other parts of the production system are decided [3]. Solving how to adequately position these production system elements is called the facility layout problem. Approaches such as the virtual factory [4] and simulation optimization approaches [5] have been applied to improve facility layouts, as a well-handled facility layout problem could contribute to the overall efficiency of operations leading to a reduction of total operating costs of between 2% and 15% [6]. As such, the planning of layouts extends beyond just the planning stage. The layout must also be realized correctly during the installation phase and utilized in the operational phase. Any problem not identified in the planning stage will cause larger problems in the installation phase, and if not solved then, even costlier ones in the operational phase.
As observed already in 1950, layout planning is most often performed in the brownfield setting [7]. This still holds true today, as adapting existing factories and facilities is often more appropriate and a better overall solution than building a completely new one. For example, the investment in a new machine often leads to changes to the layout in parts of the factory that are already in use. In typical brownfield factory layout planning settings, both the quality and availability of data can vary. Companies that often invest in new machines or workstations are more likely to have accurate drawings than, for example, a company that rarely changes its production layout. Considering this factor, and the fact that there are unique circumstances around each layout planning project performed in an industrial setting, any solution assuming that all data are available and accurate is likely to struggle when applied. Performing brownfield factory layout planning in industrial settings is more akin to a wicked problem [8] rather than one solvable by optimization.
Virtual engineering has received attention in recent years as a tool that enables improved competitiveness and productivity [9], leading to improved sustainability by improving the amount of output per input, allowing for less resource use. It is often used in various design processes [10] and offers significant improvement potential particularly in the early design phases of manufacturing systems, which in turn yields improvements in sustainability via reduced lead time and higher end-result quality. A virtual engineering approach to improve brownfield factory layout planning in industrial settings in recent years is to use realistic virtual models that provide the viewer with realistic visual fidelity in three dimensions instead of the commonly used two-dimensional drawings. Realistic virtual models make use of modern technologies such as 3D laser scanning and virtual reality (VR) to make models as life-like and accurate as possible, both in details and immersion. These types of models have been applied in collaborations between researchers and industrial practitioners multiple times over the past decade; however, the effects of using realistic virtual models have not been followed up on. There are challenges in attributing the effects of changes to the way industrial practitioners perform their layout planning; is the identified effect, for example, due to using more accurate models, immersive virtual reality, an increased amount of early feedback by inviting more people to take part in the development process, or a mix? This paper is the first of its kind to follow up after the layout changes have been planned, installed, and put into operation. By studying multiple cases performed over the last decade with realistic virtual models used in real factory layout planning cases, the aim is to identify the impact of using said models.
2. Materials and Methods
2.1. Brownfield
“Brownfield”, a term connected to the more widely used “greenfield”, comes from the field of urban development and can be defined as “denoting or relating to urban sites for potential building development that have had previous development on them” [11]. A brownfield setting may be the construction of an apartment building where an existing building is in place, while the same task in a greenfield setting could be to build it outside of city limits on a field or otherwise undeveloped land. When it comes to production systems, the main domain of this paper, brownfield projects need to consider the condition and limitations of an existing site, as opposed to greenfield projects, which have a wider solution space due to little or no historical limitations [12]. Greenfield production systems that allow for an optimal design according to current best practices are a rare occurrence in industry, as production sites most often are up and running when layouts are being changed [13,14]. Brownfield projects come with more limitations than greenfield ones as, for example, machines, people, and culture puts constraints on the system design [13]. The dimensions of the existing production area also constrain any layout solution in brownfield settings more than in greenfield projects [15].
2.2. Factory Layout Planning
Factory layout planning can be divided into two separate problems: the design problem and the optimization problem [3]. The problem type called design problem is subjective in nature and hard to quantify, while optimization problems are quantifiable and can be solved mathematically [3]. The procedures of layout planning can be divided into construction layout methods, planning of empty factories, and improvement procedures where changes are made based on existing production systems [16]. The execution of layout planning projects can be split into three different levels [17]:
- Level 1:
- Systemization of the planning principles in accordance with the planning activities and project definition.
- Level 2:
- Implementation of ideal layout planning in accordance with the project development planning activities.
- Level 3:
- Implementation of real layout planning in accordance with the project development planning activities taking real restrictions into account.
These levels of execution correspond to a type of layout, namely ideal layout, approximate layout, and real layout, for each level respectively [17]. The best possible solution created without constraints or restrictions is the ideal layout, while the approximate layout pays special consideration to building parameters. The real layout considers many different factors, restrictions, and requirements and represents the layout most likely to live up to expectations in the settings of a real factory. The different approaches and their relation to real and ideal factories are summarized in Table 1.
2.3. Previous Work on Factory Layout Planning
Research has focused on the optimization-type problem, often called the facility layout problem, where multiple algorithms have been developed over the years [18] and several other more recent literature surveys and reviews [19,20] that show plenty of research on the optimization problem and connected solutions. The most frequently applied meta-heuristic algorithm approaches have been genetic algorithms and simulated annealing [19]. While there is much research on the optimization problem, there is relatively little work on all the different considerations, compromises, and challenges faced in industry when performing brownfield planning and approaching it as a design problem. Some research has approached the problem this way, such as [21,22], where systematic layout planning (SLP), a method developed to provide practical help with the design problem. has been applied. This method provides hands-on systematic procedures, methods, and tools to use when planning layouts [23]. The SLP method has however not been completely adapted to today’s factories, which are becoming more and more digitalized and connected, as it requires a lot of manual pen and paper labor without a direct software solution to support using the method. Despite a large body of previous work on factory layout planning, most of it is performed exclusively in the planning or pre-planning phase of a production system. Rarely are the studies longitudinal; however, one such published piece of research does exist where the authors return to the studied company and follow up on the effect of the layout changes in a somewhat simple fashion by looking at the production system output [24].
2.4. Technological Tools as Decision Support
2.4.1. 3D Laser Scanning
Three-dimensional laser scanning is an active optical non-contact measurement technology [25] that is used in, for example, surveying, archeology, and construction [26]. The technology is often applied to document and digitize spatial properties of parts of the real world to enable users to digitally work on, analyze, and perform simulations using the measurement data. The scanner works by emitting either a pulse or a continuous wave of light and recording the returning light beam to calculate the distance to the surface upon which the beam bounced. A laser scanner can perform over a hundred thousand of these measurements per second while simultaneously, in a controlled fashion, slightly altering the axis of data gathering, resulting in a 360-degree data capture cycle with tens of millions of measurements [27]. In addition, many scanners also have a secondary sensor to capture color. This is often done after the distance measurement, adding time to the data-gathering cycle, and adds an RGB color to each of the tens of millions of measurements, resulting in a point cloud of data in natural colors. In the realm of the manufacturing industry, 3D laser scanning has been implemented for large-scale factory-wide 3D documentation [28] as a way to provide input to engineering activities such as industrial robot path planning [29].
2.4.2. Virtual Reality
Virtual reality (VR) is not a new term, but it has gained an increased amount of popularity among not only the private sector but also in academia and industry. It can be categorized based on the amount of immersion, where complete immersion implies that the user cannot tell what is real and what is virtual. The three main categories of VR systems are:
- non-immersive, such as desktop systems;
- semi-immersive, such as projection systems;
- immersive.
Immersive VR systems can in turn be categorized into two different systems depending on the technology and approach used:
- Cave automatic virtual environment (CAVE), where the environment is projected and directed to multiple walls of a room-sized cube.
- VR systems using head-mounted displays (HMDs).
The different types of VR have different uses and require specific setups, and the option used in this research for immersive VR was VR systems using HMDs. Immersive VR has recently been used frequently in urban planning [30,31,32] as the technology allows the user to experience the plans in ways previously impossible, such as standing in places that have no structure to get a good view or augmenting information. In the realm of the manufacturing industry, VR has often been applied due to the powerful visualization and flexibility of interactions for other applications training [33], product development [34], process simulation [35], and factory layout planning [36,37].
2.5. Methodology
This study is based on a series of industrial studies performed over a period of eight years where knowledge builds into the next study by applying action research design in an iterative, cyclic knowledge-building fashion. The cycle of action research design starts with planning the research, followed by performing an action, gathering results, then reflecting upon the study to build knowledge into the next cycle [38].
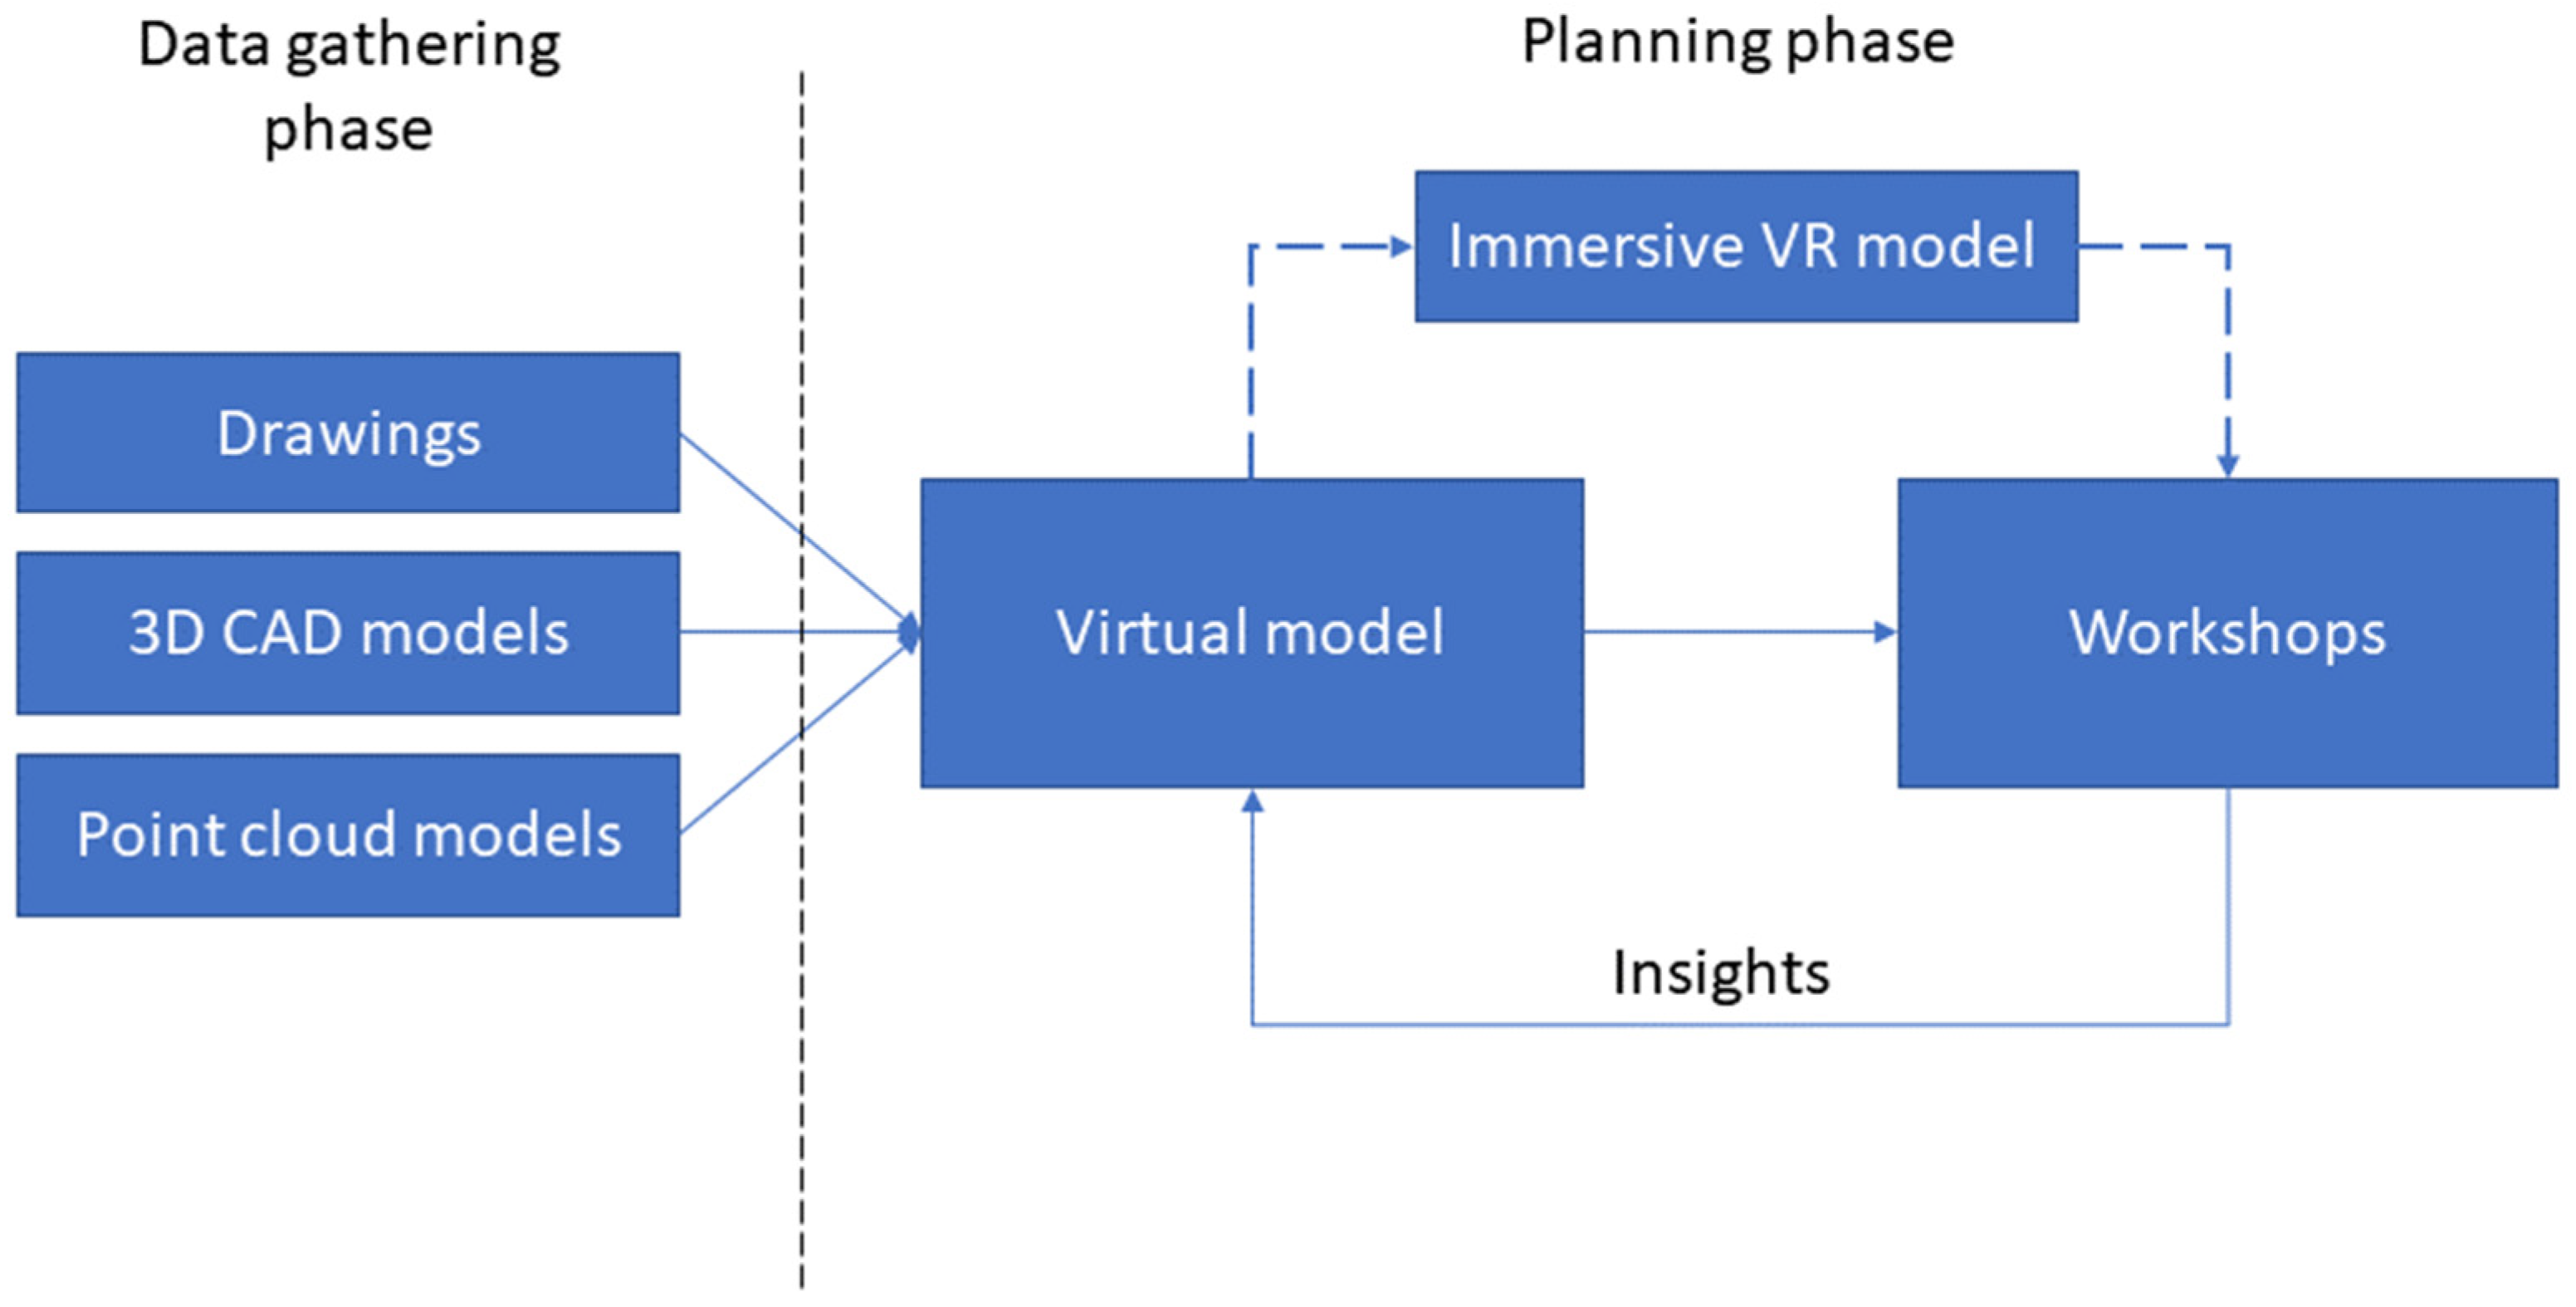
Although the industrial studies were performed over eight years and by different leading researchers, in essence, they all followed a similar methodology. To begin with, data was gathered in the form of drawings, 3D computer-aided design (CAD) models, and point cloud models via 3D laser scanning. These data sources were then processed and combined into a virtual model that was used in meetings and workshops to gather insights that fueled improvements and changes to the planned layout model. In all cases but the first two (chronologically), Case A and Case B, the virtual model was also adapted for use in immersive VR build in the software Unity3D. This flow is visualized in Figure 1. A further description of the different steps is given in Section 2.5.1.
The study performed in this paper consisted of two main parts; first, gathering data via mixed structure interviews that were both structured and semi-structured, then analyzing and compiling that data to better grasp the effects of using 3D laser scanning and VR in brownfield factory layout change processes. In total, seven interviews of roughly one hour each were performed, following up on seven different industrial cases. The interviews were performed and recorded virtually and executed based on an interview guide that was iteratively developed together with an experienced interviewer (more so than the author) and tested on a subject matter expert to ensure that the guide would cover the most important areas. The recordings were then transcribed, and the responses were color-coded depending on which challenge area they regarded. The color-coded responses were grouped together and further analyzed to provide more insights and generalizable findings.
2.5.1. Development and Utilization of the Realistic Virtual Models
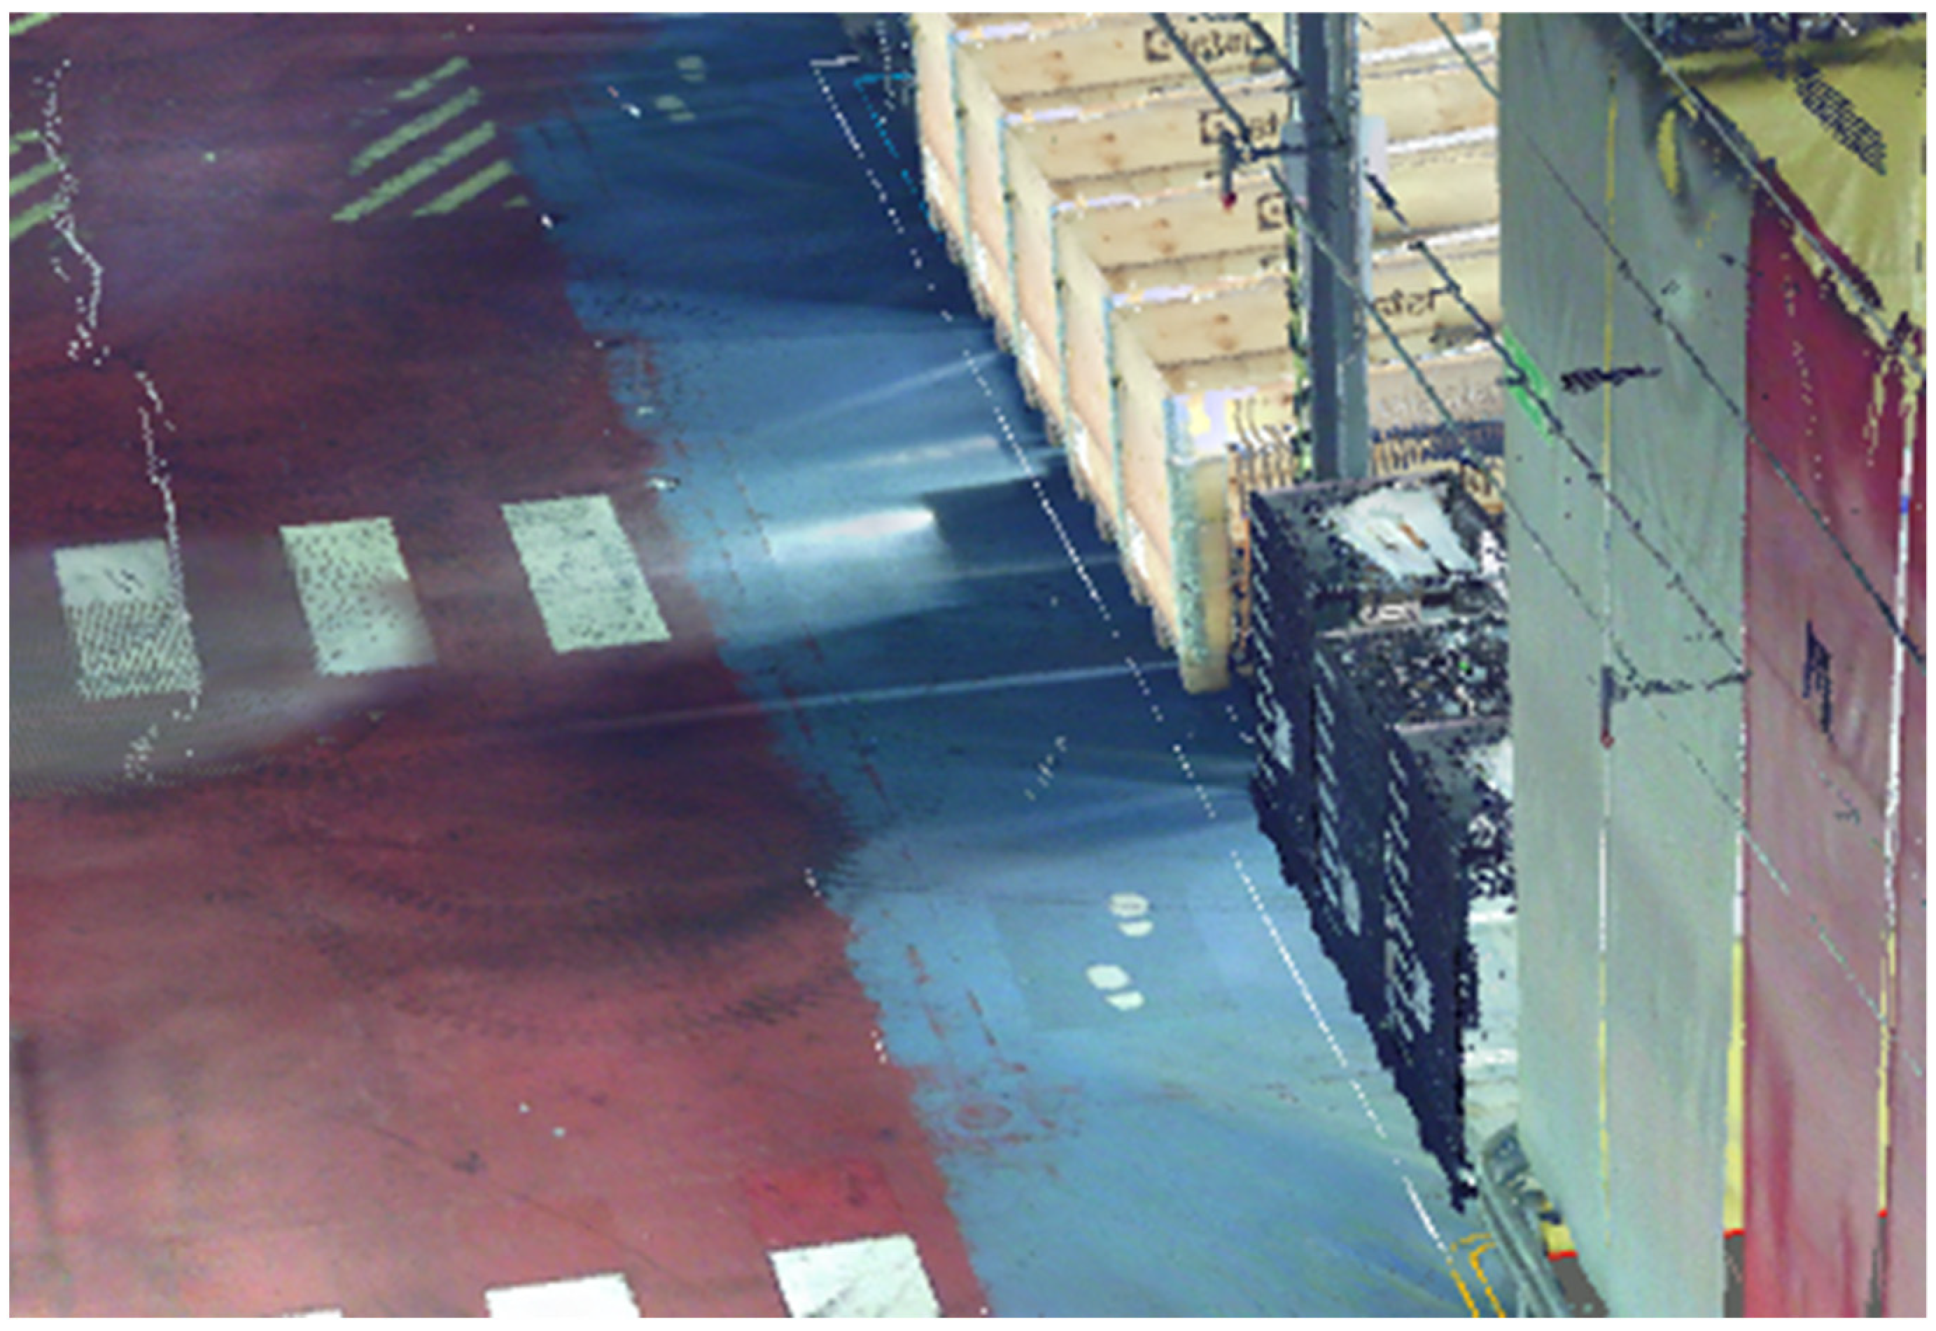
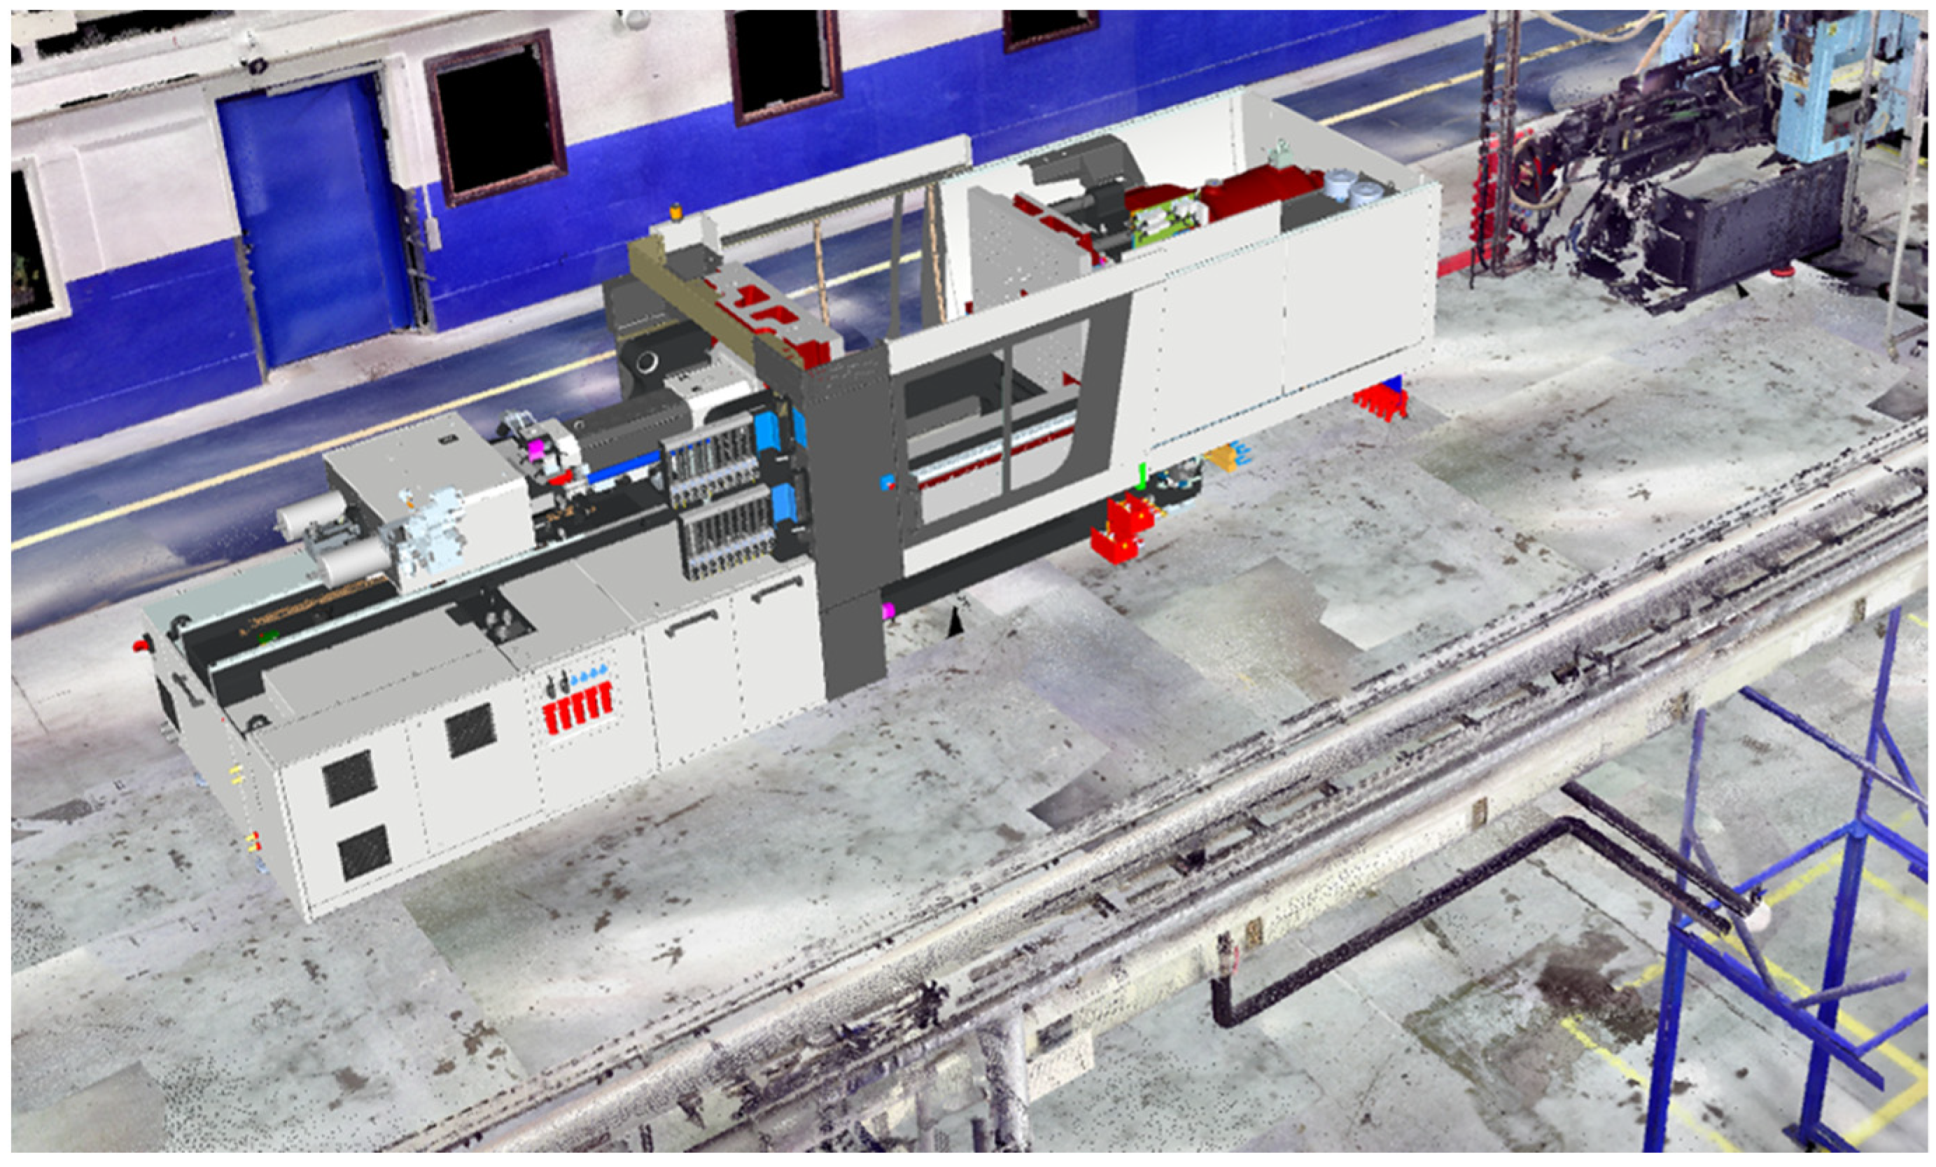
As shown in Figure 1, the initial step of developing the realistic virtual models used in these studies was data gathering of three separate data sources. First and foremost, 3D laser scanning of the area in question to have neutral and accurate point cloud data, down to 2 mm, to work with during the studies. This was performed by positioning the 3D laser scanner around the factory floor in a controlled and planned manner to ensure complete coverage, based on the experience of the scanning operator. After the area was scanned, the resulting individual point clouds was be registered together as one large point cloud that represented the complete data capture, which was done using either Faro Scene or Autodesk ReCap in these studies. If the scanning operator was inexperienced, registration of the point cloud could have been very troublesome or impossible as there needs to be enough data overlap between individual scans to merge them together without impacting registration and ending point cloud quality. As the resulting data only represents the as-is, 3D CAD models, if available, of non-existing machines and other items required in the new layout also needed to be gathered. The preference here was to use as accurate data as possible, but if there was no accurate and detailed 3D CAD model of, for example, a machine that is to be installed, a volumetrically accurate box that can represent the same volume that the machine is expected to occupy was used until a more accurate model was available. Finally, drawings are required for both current and future states as that is how all participating companies work with layout changes. The current state drawing was used to align the point cloud data as shown in Figure 2, and the future state drawing was used as a basis when constructing the realistic virtual model and easily hidden to avoid distractions as visualized in Figure 3. Once the realistic virtual model was produced, meetings and workshops were held together with the studied company in order to learn more about the production area in question and improve the layout in iterations. Immersive VR using HMD was also applied in several cases and a structured workshop [39] was applied to develop the best solution possible. Development of the realistic virtual model for viewing in immersive VR in Unity3D was a multiple-step process which is described in [40]. The process for building these specific models for immersive VR in Unity3D has evolved over time and has become more efficient over time; however, there still are a lot of manual steps and hoops to jump through to efficiently visualize point cloud data in immersive VR without a heavy impact on performance.
2.5.2. Interviewing Methodology
As a method for collecting data, interviews can be divided into three types depending on their execution and design: structured, semi-structured, or unstructured [41]. A structured interview is an interview that follows a fixed sequence of well-defined questions that yield responses that require little interpretation and lead to less qualitative results [41]. A semi-structured interview relies on an interview guide consisting of prepared questions for specific topics that should be covered in the interview but leaves some room for the interviewee in their replies [41]. Finally, an unstructured interview is one where the interviewer uses near to no prepared questions on specific topics but instead relies on pursuing points that the interviewer feel is worth following up, more akin to a conversation than an interview [41].
This study relied on interviews that had a mix of structured and semi-structured parts. The structured part of the interview was to define the background for the industrial studies in order to gain a fair understanding of the context, while the semi-structured parts aimed to gain insight into the challenges faced during each industrial study and if the applied technological tools had any effect on them.
2.5.3. Development of Interview Guide
The interview guide upon which all the interviews performed in this study were based was developed in iterations together with an experienced interviewer from the field of design and human factors and was test-run on a subject matter expert to ensure the quality of the interview guide. The key changes to the interview guide due to the involvement of the experienced interviewer and the test run were:
- Neutralize the questions posed,
- Ask how familiar the interviewee was with the equipment and production process to be installed in the area,
- Ask if the interviewee had a sufficient understanding of the methodology applied in the industrial study they were part in, or if they would like to learn more on how to proceed,
- Some clarifications and specifications of the questions themselves, as well as
- A change in the sequence of the questions in the third part of the interview.
The interviews were performed in Swedish, the native tongue for both the interviewees and the interviewer. A translated version of the interview guide is presented in Table A1 in Appendix A.
2.5.4. Analysis of Interview Material
The recorded interviews were transcribed verbatim three weeks after the interview. The three weeks were to allow the interviewee to be able to add more information or alter a statement if needed. Following the transcription of the recording, a qualitative analysis was performed on the responses where sentences were color-coded depending on which area they correlated most to. An example of this is the answer that the height of a CAD model was incorrect when the interviewee was describing challenges or issues during the planning phase. This answer was colored and grouped with other responses that talked about the accuracy and/or availability of data, while the response that a part of the layout was considered too narrow but deemed to be spacious enough after an operator walked there in immersive VR was colored and grouped with other responses relating to scale and perspective. All the text pieces with the same color-coding were grouped for further interpretation and analysis in order to form the findings of this study and lead to the final conclusions with some degree of generalization.
3. Results
The results section of this paper concerns the results of the interview study as a whole and presents the data in a summarized fashion. First, the summarized case descriptions are presented, including more information on all of the cases and the researchers’ involvement in them, followed by a summary of the learnings from all the cases along with some examples.
3.1. Describing the Cases
Case conditions are summarized in Table 2 in the following categories:
- Sequence, the sequence of each industrial study in relation to each other,
- Task and purpose, the summarized task and purpose of the layout change,
- Area (m2), the size of the area relevant for the layout change,
- Full/separate/part, whether the relevant area was the whole factory, a walled of separated part of a factory, or just a part of a factory,
- Requirements, describing if there were any specific prerequisites or requirements that the layout needed to consider,
- Time for planning, describing the time from initiating the layout change project until installation needed to be started,
- Time for installation, describing the time from starting the. installation until the installation needed to be completed, and
- Ramp-up, describing the time following the installation until full-speed production was required.
More information about the cases and the layout change project and the involvement of researchers are summarized in Table 3 in the following categories:
- Group composition, describing the project group composition in terms of size and roles of the participants as decided by the industrial company based on their normal working process,
- Stakeholders, describing how many people were affected by the layout change project,
- Technological tools, describing which of the two tools the researchers applied in each case,
- Involvement, summarizing what the researchers’ task was in each of the cases,
- Time, describing the extent of time that the researchers were involved in each of the cases, and
- Phases, defining which of the planning/installation/operation phases that the researchers were involved in.
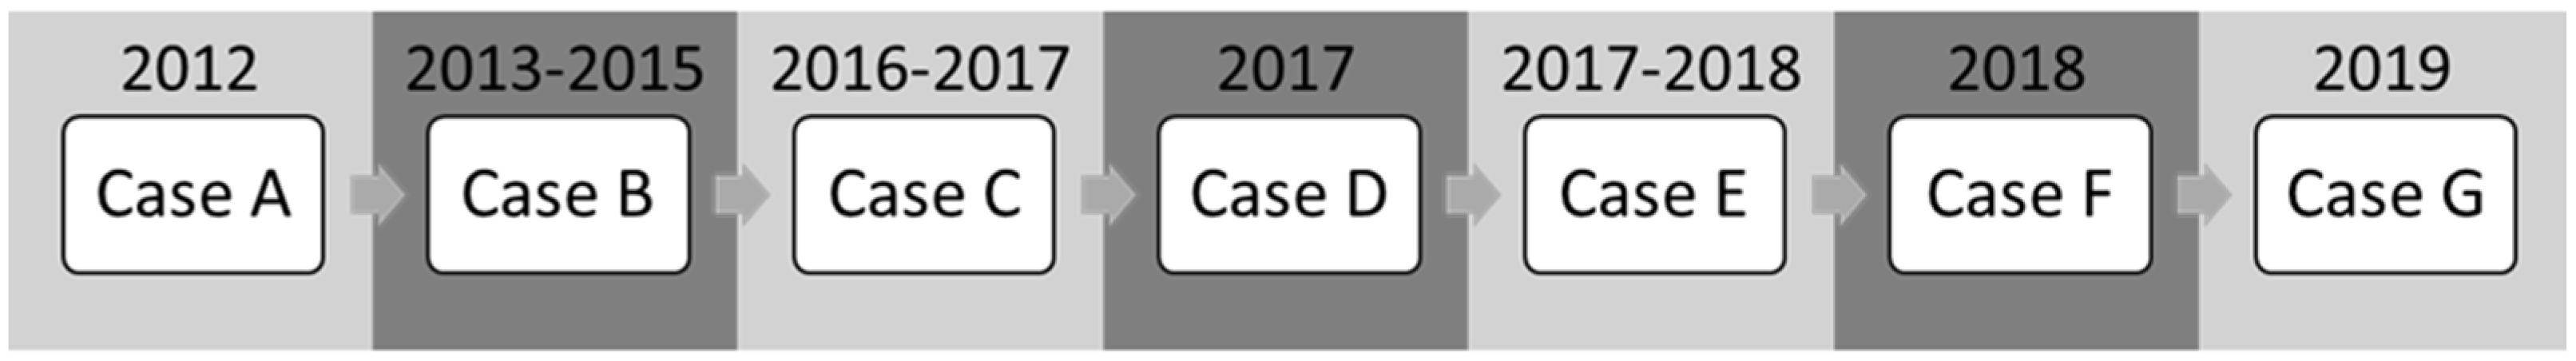
In each case, there were between one and four researchers involved in performing different tasks. One or two would be working with the 3D and immersive VR models. Figure 4 shows a rough timeline of the cases as the knowledge from each case was built into the next case in some form.
3.2. Summarized Outcome
The outcome of this study is two-fold. On one hand, looking back at all the cases and summarizing them as displayed in Table 2 and Table 3 gives some insights. One such insight is that full factory layout planning rarely is executed; however, the area covered varies significantly. Another insight is that the time for planning can vary heavily depending on the case; in Case B, for example, the project grew over time while Case F was performed in a more known environment. The time for installation is also noteworthy, as it varied between a weekend and up to two years depending partially on the business area but also the task. In the extreme case where the company only had a weekend to install the layout changes, there was also no time for ramp-up as full production pace was expected right away, while at the other extreme, production would ramp up alongside installation. Looking at all the studied cases, the number of people involved in the project work varied as did the number of stakeholders affected by the changes to be implemented. The researchers’ involvement focused on supporting the project teams with realistic models in their work and took place exclusively in the planning phase for all cases, generally on and off for a few months except for Case D where the researchers’ involvement was performed within a week.
The second outcome of this study is one that relates to the semi-structured parts of the interview guide as summarized in Table 4, focused on the challenges encountered during brownfield factory layout change processes. The challenge areas were data, scale and perspective, and input and communication. All cases encountered challenges with data, be it incompleteness, accuracy, or availability when it comes to planning layouts. All but one case, Case E, believed that the methods and technological tools applied in the studies either solved or made the challenge a much smaller one, while the remaining feedback was that there still was a need to go from the neutral 3D laser scanned data to 3D/2D CAD data in order to perform the installation; hence, this specific challenge was not significantly less impactful. Cases B, C, E, F, and G all encountered and sufficiently reduced challenges related to the scale and perspective of changes; for example, if a certain area was too narrow for an operator or if it was comfortable enough to walk around in the area. The same cases also stated that they usually encountered problems gathering input and feedback on the proposed changes and communicating the planned changes efficiently to stakeholders, and these cases also reported that these types of challenges were much less of an issue with the researchers’ involvement. All cases stated that the installation phase went fine with no particular issues, though multiple interviewees mentioned the difficulty of not being able to use the virtual model from the planning phase to support installation, so they still needed to generate 2D drawings. All cases also stated that their entire change projects were successful, reaching the desired results in the expected time and on budget. Some other challenges were mentioned during the interviews such as difficulties learning new ways of working, challenges with computer performance using point cloud models, and issues with data security specifically since the point cloud models are very detailed. A highlighted potential use case for the virtual models with major benefits was to have virtual safety rounds together with the safety representative, allowing the company to find and solve potentially major issues that would impact ramp-up and potentially cause conflict after installation. Finally, something that was mentioned in most of the interviews was the need for a business case that shows that the benefits of using these technological tools in factory layout planning scenarios outweigh the cost.
4. Discussion
4.1. Limitations
Regarding the methodology of this study, there were several significant difficulties worth discussing. The idea prior to starting the interviews was to have at least one interview with a shop-floor employee who had been affected by the entire layout change process; however, it was quickly realized that this would be impossible due to the high turn-over of the employees at the case companies. The initial plan was also to follow up on the layout changes with 3D laser scanning to compare the final plan versus the real result, and hopefully gain more understanding of what could lead to any resulting deviations by digging deeper into those; however, the COVID-19 pandemic has put a halt to most factory visits. Another methodology-related challenge was in relation to the amount of time that had passed since the researchers’ involvement in all of the cases, particularly the earlier ones. The interviewees were working on other projects and sometimes with completely different tasks in the time since the case. Although no interviewees seemed to have any significant issues remembering the specific case in question, specific details were not always easy to remember. For a future similar study, a good idea could be to decide on a date and method for following up the case, around 6–12 months after installation, and include several stakeholders such as a shop-floor employee and project participants in order to gather more input, perhaps in a group discussion format. This type of setup would benefit the layout planning field significantly due to the lack of longitudinal research in the area. Any action research performed together with industry in the field should preferably follow some sort of structured methodology for following up and gathering more insights. It may also be of interest to utilize quantitative research methodology as well, quantifying the layout solutions, efficiency of work methodology, and amount of feedback received. This may lead to support findings that may help to justify the industrial transition to utilizing modern technologies and tools more when performing layout planning.
Some limitations on the findings from this study stem from a somewhat narrow selection of case companies. All the companies were large Swedish companies, although one case took place in Brazil with a mix of Brazilian and Swedish participants. The findings could be different in other countries or smaller companies, as the challenges, needs, and ways of working may differ. A way to overcome this limitation could be to perform more case studies using students and their theses, as the technology is rather mature and could be applied without significant expert knowledge at the time of writing. Another detail to discuss is that different researchers performed the technological parts in the cases, a total of four different researchers that all were part of the same research group at the same university. Hence, changing the person did not seem to have an impact with the limited data set available, indicating that the application of the technological tool may be the major factor in play. With regards to research quality, the transferability of the research is high as findings have transferred from one case to the next, and with regards to confirmability, the transcribed interviews and analyses of them are available for evaluation.
All of the industrial studies, the cases, utilized the qualitative data collection method participant observation. It is often used to gather data on situations and allows the researcher to gain insight into the specific context, relationships, and behaviors [42]. Participant observation can be distinguished by the researchers’ level of participation in the group activities, ranging from full participant where the researcher is fully participating in the group activities while concealing their researcher role, to full observer when the researcher is covert and unknown to the studied group [43]. Neither of these roles was possible to apply in any of the cases, as the resulting role ended up in between the two extremes. It could be possible to learn more by being able to apply the full observer role, should the company be skilled enough to use the technological tools independently.
4.2. Industrial Implications
Modern industries are often driven by profit. As a direct effect of this, most interviewees mentioned the need for an economic incentive, a kind of business case, that would help them motivate upper management on why the slight increase in cost is worth it. This study serves as a motivation for that slight cost increase, as working with better data, grasping scale and perspective, and benefiting from improved communication are things that have an impact. The difficult part is quantifying that impact. While involving a consultant to aid in the projects in the same way the researcher did would imply a direct cost that the consultant can quote, the direct payoff is not easy to calculate. Avoiding costly mistakes and having a more complete plan, ensuring the smoothness of installation, and running a successful project are all things that are positive but hard to quantify. As the manufacturing industry further adopts the virtual engineering paradigm, working with accurate 3D data may be the norm and the step to working with point cloud data may be much smaller than it is today. Similarly, as more engineers become used to working with it, the cost of applying it is reduced. Hence, lifting the virtual engineering paradigm to involve neutral and accurate point cloud data from 3D laser scanners and visualizing things in immersive VR could be natural next steps. This study and its related findings are important for this to happen as it shows generalizable benefits from eight years of research in multiple cases at different companies. A takeaway for industries that is useful straight away is to involve more people in the planning phase and utilize technological tools to find new ways of communicating and evaluating design ideas. The company in Case E did not fully appreciate the use of point cloud data in terms of cost/benefit, but they started using immersive VR to assess layout changes as that allowed them to involve more people and gather more feedback in early phases for nearly no cost.
4.3. Findings
The findings of this study were not shocking to the authors, as the challenge areas and the effects of the technological tools have been seen through performing the industrial studies over the years. Defining the challenge areas into data, scale and perspective, and input and communication came naturally as an effect of having performed the industrial studies. None of the interviewees had any different opinions on these.
Data, while a broad area, often presents a challenge in multiple ways, but those working in the projects are used to it and often take it for granted. Data are considered unreliable in some cases, such as old 2D drawings that the project team expected to be outdated and could not rely on for measurements. In Case C, for example, the 2D drawings used were confirmed to be significantly lacking in both details and accuracy as some pillars were up to 30 cm off, and in Case B, important changes that had been made to the facility in the past years were missing when the facility was adapted to support a previous layout. The cost of not identifying these early on can be difficult to specify, but these two examples would see significant delays during the installation project as that is when that issue would likely have been noticed.
In a similar fashion to data, challenges with gathering input and communicating around the planned changes were the norm at the studied companies. Shop-floor employees would often come with improvement suggestions after installation, and often once it was too late to realistically implement the changes as it could require installing machines in different positions, for example. In a similar fashion, challenges maintaining the equipment would often be brought up for the first time once the equipment needed maintenance.
Scale and perspective, on the other hand, is a challenge that perhaps was not as obvious. For example, whether an area is too tight to comfortably work in is hard to assess. Whether 60 cm is enough for a human worker or not is very hard to subjectively answer even when performing layout planning in 3D CAD; however, once the employee who would be working in the layout area of concern could walk around in immersive VR, the subjective feelings became easy to define and share with the rest of the project group. Having margins to walk around narrow areas and to turn around carrying products, for example, can be very difficult to define numerically but building the scene and trying it out virtually in immersive VR gave clear feedback. This type of feedback was very hard to get otherwise, and even if acquired, the project group needed to ask itself if it really could be trusted as a basis for decisions. In Case G, the idea was to use multiple levels of production as the product is large and can be worked on both from above and below at the same time. By applying the realistic virtual model, workers could assess the experience of working underneath the product and subjectively give feedback on lighting, height, reachability, and general comfort. As immersive VR with point cloud data yields a realistic model with an accurate scale viewed from the proper perspective, any employee could be invited to the layout planning process and be involved in the change process. Several interviewees mentioned that this reduced change resistance and improved overall involvement mainly from shop-floor employees who rarely were otherwise involved in such projects.
The three challenge areas connect to each other as the foundation of work needs to be accurate data. Measurements taken need to be correct, or as correct as needed for the specific application, and anything of significance simply cannot be missing. If the data is inaccurate or incomplete, plans made based on it may run into significant difficulties when it comes to installation and operation. The actual economic impact of this differs per case; however, in Case F, for example, the installation needed to both be completed the same weekend it started as the customer required products the following workday. If that is not fulfilled, the fines would be significant, and eventually, the company would no longer be viewed as a potential sub-supplier for future products. If the data challenge has been overcome, both the other challenges are possible to overcome as well. Grasping scale and perspective is possible by viewing realistic virtual models in immersive VR, and the realism of these virtual models enables the gathering of input and improved communication. These latter two challenge areas are more tightly connected to social sustainability, as it enables inclusion by allowing more employees to take part in the layout planning activities, while also allowing more employees’ voices to be heard. This was highly appreciated in all the cases; however, this may be culturally connected and the view on this may differ in other hierarchical structures. The typical Swedish hierarchy is quite flat and shop-floor employees are often involved in engineering activities.
For the virtual engineering paradigm to be improved by these findings, it is important to reach out with the technological tools that enable benefits such as improved environmental sustainability, as doing things right reduce rework and enabling offline work reduces the need for travel, social sustainability as more people can be involved in the change process, and economical sustainability simply by taking more well-informed decisions. While most of the interviewees mentioned the need for a business case to clarify the economic incentive, it is worthwhile to highlight that one of the participating companies started using immersive VR populated entirely with 3D CAD models before finalizing any layout changes and that another company is building a new factory by also relying on 3D CAD models but with less focus on immersive VR. While this is not the full extent of the solutions used in the industrial studies, it is a step in the right direction towards adopting the virtual engineering paradigm. 3D laser scanning is becoming more used by the manufacturing industry as tools have been developed that enable web-viewing and collaborative working with the data, and support for point cloud data has been added in several of the most popular software suites, thus enabling engineers to work with it if they have the skills and computing power required.
5. Conclusions
This longitudinal study follows up on eight years of industrial studies to understand the challenges in brownfield factory layout planning and if virtual engineering using realistic models helps alleviate or eliminate those challenges. Longitudinal studies in the factory layout planning field are rare as much focus is placed on the planning part of a production system’s life-cycle, however, production system layouts can be in use for several decades. Challenges were identified and summarized in three categories; data, both in terms of availability and accuracy, scale and perspective, and input and communication. Applying 3D laser scanning and immersive virtual reality significantly alleviated or eliminated all of these challenges in almost every scenario, indicating that these technologies may be the best way of working with brownfield factory layout planning. By incorporating these technologies in the virtual engineering paradigm, companies can work with more accurate and realistic data and make well-informed decisions that can yield long-term positive effects from their production systems, while simultaneously inviting nearly any employee to the brownfield factory layout planning process.
Author Contributions
Conceptualization, D.N. and B.J.; Methodology, D.N. and B.J.; Software, D.N.; Validation, D.N. and B.J.; Formal Analysis, D.N.; Investigation, D.N.; Resources, D.N.; Data Curation, D.N.; Writing—Original Draft Preparation, D.N.; Writing—Review & Editing, D.N. and B.J.; Visualization, D.N.; Supervision, B.J.; Project Administration, B.J.; Funding Acquisition, B.J. All authors have read and agreed to the published version of the manuscript.
Funding
This research was funded by FFI through VINNOVA for the DIP project, grant number 2018-02698 and by EIT manufacturing for the TWINGOALS project, grant number 21019.
Institutional Review Board Statement
Ethical review and approval were waived for this study due to the complete anonymity of the study.
Informed Consent Statement
Informed consent was obtained from all subjects involved in the study.
Data Availability Statement
Transcribed interviews and the interview guide are stored physically at the Chalmers University of Technology and available upon request.
Acknowledgments
The authors gratefully thank Chalmers Production Area of Advance and all the involved companies and previous research projects and involved researchers for helping spur the development of realistic virtual models.
Conflicts of Interest
The authors declare no conflict of interest.
Appendix A
The translated interview guide is presented in Table A1.

Table A1.
Interview guide translated from Swedish that was used in all of the interviews. The structured part of the interview is in italics.
Table A1.
Interview guide translated from Swedish that was used in all of the interviews. The structured part of the interview is in italics.
| Category | Question |
| Case description | How large was the area in the planning scope? Was the area part of a larger factory, a separate secluded part, or the entire factory? What was the time frame for the layout change process work? How long before the installation phase did planning start? How much time did you have for the installation part? Can you describe the phase immediately after installation when the operation was ramping up? How much of a rush was it? Did you have enough time to reach the expected production rate? How many weeks of ramp-up did you have at the start of operations? What was the task and purpose of the changes? (For example, in with new out with old, adapt to customer demand, new capabilities, increased productivity...) (What did you want to achieve and what was the main task?) How familiar were you with the new parts of the changes? (Machines/technology/production process) Were there any requirements (limiting circumstances) on the new layout that needed to be considered during the change process? (For example, considering adjacent areas, adjacent truck traffic, utilizing existing installations/foundations, etc.) How many people were involved during the planning process and which roles did they have? How many and which people were affected by the change process? (For example, operators, logistic personnel, maintenance personnel, etc.) For how long were the researchers involved? In which phases were the researchers involved? Which technical tools were applied? (3D scanning, VR, AR) Can you describe what the researchers did? |
| Planning | Can you tell me about the planning process? Bigger challenges/problems, significant changes? |
| Installation | How was the installation process? Anything that did not go according to expectations? |
| Operation | How was the change in operation? Did you reach the sought-after effect? |
| Other | In summary, what do you believe are the biggest differences brought along by working with these technological solutions in layout planning? Did you get the sought-after effect? Mainly, how did you experience working with this? Did you run into any specific challenges/problems during the work that can be attributed to the technological solutions? Did you change your way of working after this case? Why/why not? If not, do you feel ready to start working with these technologies? Do you have any other feedback and thoughts that we have not already talked about? |
| Known challenges to bring up during the interview, ask interviewee to compare to normal state | How was the quality of incoming data? (Ordinarily vs. the case) How was the process of gathering feedback and communicating planned changes? How was it to grasp scale and perspective? Could you comment on the richness of detail in the planning state, how complete was the model? Did you get (too) late insights on missed details and improvements? Was the evaluation process noticeably more time-consuming when more people were involved? How was the process of adapting the layout to reality? |
References
- Jung, K.; Choi, S.; Kulvatunyou, B.; Cho, H.; Morris, K.C. A reference activity model for smart factory design and improvement. Prod. Plan. Control 2017, 28, 108–122. [Google Scholar] [CrossRef]
- Schuh, G.; Aghassi, S.; Orilski, S.; Schubert, J.; Bambach, M.; Freudenberg, R.; Hinke, C.; Schiffer, M. Technology roadmapping for the production in high-wage countries. Prod. Eng. 2011, 5, 463–473. [Google Scholar] [CrossRef]
- Heragu, S.S. Facilities Design; CRC Press: Boca Raton, FL, USA, 2008. [Google Scholar]
- Debevec, M.; Simic, M.; Jovanovic, V.; Herakovic, N. Virtual factory as a useful tool for improving production processes. J. Manuf. Syst. 2020, 57, 379–389. [Google Scholar] [CrossRef]
- Zupan, H.; Herakovic, N.; Zerovnik, J.; Berlec, T. Layout Optimization of a Production Cell. Int. J. Simul. Model. 2016, 16, 603–616. [Google Scholar] [CrossRef]
- Tompkins, J.A.; White, J.A.; Bozer, Y.A.; Tanchoco, J.M.A. Facilities Planning, 4th ed.; John Wiley and Sons: Hoboken, NJ, USA, 2010. [Google Scholar]
- Immer, J.R. Layout Planning Techniques; McGraw-Hill: New York, NY, USA, 1950. [Google Scholar]
- Conklin, J. Dialogue Mapping: Building Shared Understanding of Wicked Problems; Wiley: Hoboken, NJ, USA, 2006. [Google Scholar]
- Ahmad, B. A Component-Based Virtual Engineering Approach to PLC Code Generation for Automation Systems. Doctoral Dissertation, Louhgborough University, Loughborough, UK, 2014. [Google Scholar]
- Harrison, R.; Vera, D.; Ahmad, B. Engineering the smart factory. Chin. J. Mech. Eng. 2016, 29, 1046–1051. [Google Scholar] [CrossRef]
- Oxford University Press. Definition of brownfield in English. Available online: https://www.lexico.com/definition/brownfield (accessed on 6 October 2021).
- Vallhagen, J.; Stahre, J.; Johansson, B. Visual Production—Strategic manufacturing system development tools for aerospace industry. In Proceedings of the International Symposium on Air Breathing Engines, Gothenburg, Sweden, 12–16 September 2011. [Google Scholar]
- Vaughn, A.; Fernandes, P.; Shields, J.T. Manufacturing System Design Framework Manual. 2002. Available online: https://dspace.mit.edu/handle/1721.1/81902 (accessed on 6 October 2021).
- Bader, S.R.; Wolff, C.; Vossing, M.; Schmidt, J.P. Towards Enabling Cyber-Physical Systems in Brownfield Environments Leveraging Environmental Information to Derive Virtual Representations of Unconnected Assets. In Exploring Service Science; Satzger, G., Patricio, L., Zaki, M., Kuhl, N., Hottum, P., Eds.; Lecture Notes in Business Information Processing; Springer International Publishing: New York, NY, USA, 2018; Volume 331, pp. 165–176. [Google Scholar]
- Stäbler, M.; Weber, J.; Paetzold, K. Implementing Changeability in a System with Prioritization Indicators. Procedia CIRP 2016, 44, 50–54. [Google Scholar] [CrossRef] [Green Version]
- Tompkins, J.A.; White, J.A.; Bozer, Y.A.; Frazelle, E.H.; Tanchoco, J.M.A.; Trevino, J. Facilities Planning, 2nd ed.; John Wiley and Sons: Hoboken, NJ, USA, 1996. [Google Scholar]
- Schenk, M.; Wirth, S.; Müller, E. Factory Planning Manual: Situation-Driven Production Facility Planning; Springer: Berlin/Heidelberg, Germany, 2010. [Google Scholar]
- Drira, A.; Pierreval, H.; Hajri-Gabouj, S. Facility layout problems: A survey. Annu. Rev. Control 2007, 31, 255–267. [Google Scholar] [CrossRef]
- Hosseini-Nasab, H.; Fereidouni, S.; Fatemi Ghomi, S.M.T.; Fakhrzad, M.B. Classification of facility layout problems: A review study. Int. J. Adv. Manuf. Technol. 2018, 94, 957–977. [Google Scholar] [CrossRef]
- Ahmadi, A.; Pishvaee, M.S.; Akbari Jokar, M.R. A survey on multi-floor facility layout problems. Comput. Ind. Eng. 2017, 107, 158–170. [Google Scholar] [CrossRef]
- Lin, Q.-L.; Liu, H.-C.; Wang, D.-J.; Liu, L. Integrating systematic layout planning with fuzzy constraint theory to design and optimize the facility layout for operating theatre in hospitals. J. Intell. Manuf. 2015, 26, 87–95. [Google Scholar] [CrossRef]
- Maina, E.C.; Muchiri, P.; Keraita, J.N. Improvement of Facility Layout Using Systematic Layout Planning. IOSR J. Eng. 2018, 8, 33–43. [Google Scholar]
- Muther, R. Systematic Layout Planning; Cahners Books: Boston, MA, USA, 1973. [Google Scholar]
- Aghazadeh, S.M.; Hafeznezami, S.; Najjar, L.; Huq, Z. The influence of work-cells and facility layout on the manufacturing efficiency. J. Facil. Manag. 2011, 9, 213–224. [Google Scholar] [CrossRef]
- Besl, P.J. Active, optical range imaging sensors. Mach. Vis. Appl. 1988, 1, 127–152. [Google Scholar] [CrossRef]
- Sansoni, G.; Trebeschi, M.; Docchio, F. State-of-The-Art and Applications of 3D Imaging Sensors in Industry, Cultural Heritage, Medicine, and Criminal Investigation. Sensors 2009, 9, 568–601. [Google Scholar] [CrossRef] [PubMed]
- FARO Technologies. FARO Laser Scanner Focus3D Manual; FARO Technologies: Lake Mary, FL, USA, 2013. [Google Scholar]
- Johansson, J.; Simonsson, E. In Context Manufacturing Development Using 3D Laser Scanning at Volvo Car Corporation. Master’s Thesis, Chalmers University of Technology, Gothenburg, Sweden, 2015. [Google Scholar]
- Tafuri, S.; Shellshear, E.; Bohlin, R.; Carlson, J.S. Automatic collision free path planning in hybrid triangle and point models: A case study. In Proceedings of the 2012 Winter Simulation Conference (WSC), Berlin, Germany, 9–12 December 2012. [Google Scholar]
- Edler, D.; Keil, J.; Wiedenlübbert, T.; Sossna, M.; Kühne, O.; Dickmann, F. Immersive VR Experience of Redeveloped Post-industrial Sites: The Example of “Zeche Holland” in Bochum-Wattenscheid. KN—J. Cartogr. Geogr. Inf. 2019, 69, 267–284. [Google Scholar] [CrossRef] [Green Version]
- Jamei, E.; Mortimer, M.; Seyedmahmoudian, M.; Horan, B.; Stojcevski, A. Investigating the Role of Virtual Reality in Planning for Sustainable Smart Cities. Sustainability 2017, 9, 2006. [Google Scholar] [CrossRef] [Green Version]
- Ma, Y.; Wright, J.; Gopal, S.; Phillips, N. Seeing the invisible: From imagined to virtual urban landscapes. Cities 2020, 98, 102559. [Google Scholar] [CrossRef]
- Sun, S.-H.; Tsai, L.-Z. Development of virtual training platform of injection molding machine based on VR technology. Int. J. Adv. Manuf. Technol. 2012, 63, 609–620. [Google Scholar] [CrossRef]
- Liang, J.S.; Chao, K.-M.; Ivey, P. VR-based wheeled mobile robot in application of remote real-time assembly. Int. J. Adv. Manuf. Technol. 2013, 64, 1765–1779. [Google Scholar] [CrossRef]
- Tůma, Z.; Tůma, J.; Knoflíček, R.; Blecha, P.; Bradáč, F. The Process Simulation Using by Virtual Reality. Procedia Eng. 2014, 69, 1015–1020. [Google Scholar] [CrossRef] [Green Version]
- Gong, L.; Berglund, J.; Saluäär, D.; Johansson, B. A Novel VR Tool for Collaborative Planning of Manufacturing Process Change using Point Cloud Data. Procedia CIRP 2017, 63, 336–341. [Google Scholar] [CrossRef]
- Berglund, J.; Gong, L.; Sundström, H.; Johansson, B. Virtual Reality and 3D Imaging to Support Collaborative Decision Making for Adaptation of Long-Life Assets; Springer International Publishing: Berlin/Heidelberg, Germany, 2017; pp. 115–132. [Google Scholar]
- Oosthuizen, M. Action research. In Topics in Australasian Library and Information Studies, Research Methods for Students, Academics and Professionals, 2nd ed.; Kirsty Williamson, A.B., Burstein, F., Darke, P., Harvey, R., Johanson, G., McKemmish, S., Oosthuizen, M., Saule, S., Schauder, D., Shanks, G., et al., Eds.; Chandos Publishing: Cambridge, UK, 2002; pp. 159, 175. [Google Scholar]
- Lindskog, E.; Vallhagen, J.; Johansson, B. Production system redesign using realistic visualisation. Int. J. Prod. Res. 2017, 55, 858–869. [Google Scholar] [CrossRef]
- Gong, L.; Berglund, J.; Fast-Berglund, Å.; Johansson, B.; Wang, Z.; Börjesson, T. Development of virtual reality support to factory layout planning. Int. J. Interact. Des. Manuf. (IJIDeM) 2019, 13, 935–945. [Google Scholar] [CrossRef] [Green Version]
- Bryman, A.; Bell, E. Business Research Methods; Oxford University Press: Oxford, UK, 2007. [Google Scholar]
- Mack, N.; Woodsong, C.; MacQueen, K.M.; Guest, G.; Namey, E. Qualitative Research Methods: A Data Collector’s Field Guide; Family Health International: Durham, NC, USA, 2005. [Google Scholar]
- Kawulich, B.B. Participant Observation as a Data Collection Method. Forum Qual. Soc. Res. 2005, 6, 22. [Google Scholar]
Figure 1.
An overview of the steps involved in the different studies, divided into steps in the data-gathering phase and steps in the planning phase. The VR modeling part is dashed as it was not part of the first two studies.
Figure 1.
An overview of the steps involved in the different studies, divided into steps in the data-gathering phase and steps in the planning phase. The VR modeling part is dashed as it was not part of the first two studies.

Figure 2.
Alignment of the point cloud data to a 2D CAD drawing.

Figure 3.
Future state model consisting of a mix of point cloud data and 3D CAD data.

Figure 4.
Timeline of the cases involved in this study.

Table 1.
Different factory layout planning approaches and their correlation to real or ideal factories.
Table 1.
Different factory layout planning approaches and their correlation to real or ideal factories.
| Ideal Factories | Real Factories | Reference | |
|---|---|---|---|
| Type of problem | Optimization | Design | [3] |
| Procedure applied | Construction layout methods | Improvement procedures | [16] |
Table 2.
Summary of the case conditions at the different industrial studies.
| Case A | Case B | Case C | Case D | Case E | Case F | Case G | |
|---|---|---|---|---|---|---|---|
| Sequence | 1 | 2 | 3 | 4 | 5 | 6 | 7 |
| Sector | Aerospace | Aerospace | Aerospace | Aerospace and defense | Personal & household goods | Plastic manufacturing | Aerospace and defense |
| Task & purpose | Relocation of a machine to a new area | Changing method of production, new technology, change materials, reduce waste | Increase production capacity | New production technology and methods for new products | Installation of conveyors and weight stations to improve quality in production and reduce waste | Adapt the production system and change the machines due to product change | Build a production system to enable the production of certain components as part of a contract |
| Area (m2) | 100 | 6000 | 2000 | 600 | 40 | 600 | 5000 |
| Full/separate/part | Part | Part | Part | Separate | Part | Part | Full |
| Requirements | Existing foundation | Nothing in particular | An installation to be used for a while longer and existing truck traffic lane | Many existing machines and an existing logistical system to remain | Adapt changes to the existing system, not moving the machines | Utilize existing high-bay storage and transport aisles | Utilize the overhead crane in the facility, utilize the existing loading bay |
| Time for planning | 1–3 months | 2–3 years | 3–4 months | 6–12 months | 1 year | 6 months | 1 year |
| Time for installation | Less than 1 month | 3–4 months for the machine, ~1 year for robot cells | 3–4 months | 6 months | 1 month | 1 weekend | 1½–2 years |
| Ramp-up | None | 3–4 weeks for machines | 3–4 weeks | 3–6 months | 3–4 weeks | None | Alongside installation |
Table 3.
Layout project-related information and researcher involvement in the different industrial studies (3DLS = 3D laser scanning, VR = virtual reality).
Table 3.
Layout project-related information and researcher involvement in the different industrial studies (3DLS = 3D laser scanning, VR = virtual reality).
| Case A | Case B | Case C | Case D | Case E | Case F | Case G | |
|---|---|---|---|---|---|---|---|
| Group composition | 5 people. Technical manager production development, senior project engineer, production development, discrete event simulation, and layout engineer. | 15–30 people. Purchasing, layout engineers, logistics, economy, receiving manager, facility, and technicians. | 6–8 people. Computer-aided manufacturing programmers, managers, operators, logistics, and safety officer. | ~10 people. Operators, purchasing, maintenance, production technicians, and process planners. | 8 people. Flow simulation, project leader, operators, safety officer, automation engineers, and maintenance. | 4. Production engineers, process planners, and project leader. | 10–15 people. Production technicians, layout engineers, CAD engineers, and security responsible. |
| Stakeholders | ~20 per shift | 200–300 people | 30–40 people | 20–30 people | 14 people | 100–110 people | ~50 people |
| Technological tools | 3DLS | 3DLS | 3DLS, VR | 3DLS, VR | 3DLS, VR | 3DLS, VR | 3DLS, VR |
| Involvement | Support project team with realistic models in their work | Support project team with realistic models in their work | Support project team with realistic models in their work | Support project team with realistic models in their work | Support project team with realistic models in their work | Support project team with realistic models in their work | Support project team with realistic models in their work |
| Time | 1 month | 2–3 years | 4–6 months | 1 week | 3–4 months | 3–4 months | 4–6 months |
| Phases | Planning | Planning | Planning | Planning | Planning | Planning | Planning |
Table 4.
Summary of findings from the cases in relation to the three challenge areas. Brackets mean that the challenge was identified, and an x inside the brackets indicates that the challenge was solved or much less of an issue using the method and technologies applied in the case study.
Table 4.
Summary of findings from the cases in relation to the three challenge areas. Brackets mean that the challenge was identified, and an x inside the brackets indicates that the challenge was solved or much less of an issue using the method and technologies applied in the case study.
| Challenge Area | Case A | Case B | Case C | Case D | Case E | Case F | Case G |
|---|---|---|---|---|---|---|---|
| Drawings/models/data | [x] | [x] | [x] | [x] | [ ] | [x] | [x] |
| Scale and perspective | [x] | [x] | [x] | [x] | [x] | ||
| Input/communication | [x] | [x] | [x] | [x] | [x] |
Publisher’s Note: MDPI stays neutral with regard to jurisdictional claims in published maps and institutional affiliations. |
© 2021 by the authors. Licensee MDPI, Basel, Switzerland. This article is an open access article distributed under the terms and conditions of the Creative Commons Attribution (CC BY) license (https://creativecommons.org/licenses/by/4.0/).
Share and Cite
MDPI and ACS Style
Nåfors, D.; Johansson, B. Virtual Engineering Using Realistic Virtual Models in Brownfield Factory Layout Planning. Sustainability 2021, 13, 11102. https://0-doi-org.brum.beds.ac.uk/10.3390/su131911102
AMA Style
Nåfors D, Johansson B. Virtual Engineering Using Realistic Virtual Models in Brownfield Factory Layout Planning. Sustainability. 2021; 13(19):11102. https://0-doi-org.brum.beds.ac.uk/10.3390/su131911102
Chicago/Turabian StyleNåfors, Daniel, and Björn Johansson. 2021. "Virtual Engineering Using Realistic Virtual Models in Brownfield Factory Layout Planning" Sustainability 13, no. 19: 11102. https://0-doi-org.brum.beds.ac.uk/10.3390/su131911102
Note that from the first issue of 2016, this journal uses article numbers instead of page numbers. See further details here.