Article

Sound Water and Nitrogen Management Decreases Nitrogen Losses from a Drip-Fertigated Cotton Field in Northwestern China

1
Agricultural College, Shihezi University, Shihezi 832003, China
2
Institute of Soil, Fertilizer and Agricultural Water Conservation, Xinjiang Academy of Agricultural Sciences, Urumqi 830091, China
3
Key Laboratory of Agricultural Environment of Northwest Oasis, Ministry of Agriculture and Rural Affairs, PR China, Urumqi 830091, China
*
Authors to whom correspondence should be addressed.
Sustainability 2021, 13(2), 1002; https://0-doi-org.brum.beds.ac.uk/10.3390/su13021002
Submission received: 6 December 2020 / Revised: 14 January 2021 / Accepted: 16 January 2021 / Published: 19 January 2021
(This article belongs to the Section Sustainable Agriculture)

Abstract

:
Drip irrigation systems are becoming more and more mature and are now widely used to improve crop yield and nitrogen use efficiency in Xinjiang, NW China. However, it is not known if leaching is occurring or not and whether leaching will harm the water environment following N fertilization and drip irrigation. The purpose of our study was to estimate the leaching volumes, nitrogen losses, forms of nitrogen losses, and nitrogen loss coefficients under different N fertilization, P fertilization, K fertilization and irrigation regimes. A long-term field experiment was conducted from 2009 to 2015 in Baotou Lake farm in Korla City, Xinjiang, with drip-irrigated cotton (Gossypium hirsutum L.) being grown under different N fertilizer and irrigation regimes. The treatments were designed comprising 0 N, 0 P, and 0 K with an irrigation of 480 mm as the control(N0P0K0W480) and the following three other treatments: (1) 357 kg N·hm−2, 90 kg P·hm−2, 0 kg K2O hm−2, and irrigation of 480 mm (N357P90K0W480); (2) 357 kg N·hm−2, 90 kg P·hm−2, 62 kg K·hm−2, and irrigation of 420 mm (N357P90K62W420); and (3) 240 kg N·hm−2, 65 kg P·hm−2, 62 kg K·hm−2, and irrigation of 420 mm (N240P65K62W420). The results showed the following: (1) the leaching volume was determined by nitrogen fertilization, phosphorus fertilization, and the irrigation amount. In general, the leaching volume was highest under treatment N357P90K0W480. (2) The nitrogen loss was highest under treatment N357P90K0W480. (3) Nitrate nitrogen (NO3) was the main form of nitrogen lost, followed by ammonium nitrogen (NH4+). (4) The annual nitrogen loss coefficients followed the order of: N357P90K0W480 > N357P90K62W420 > N240P65K62W420 > N0P0K0W480, with values of 0.85, 0.55, 0.30, and 0, respectively. The leaching volume, nitrogen loss, nitrate nitrogen, ammonium nitrogen, and annual nitrogen loss coefficient were lowest under the N240P65K62W420 treatment, except in the N0P0K0W480treatment. These results demonstrate that optimizing the management of water and nitrogen (N240P65K62W420 treatment) can effectively reduce nitrogen losses under drip fertigation and plastic mulching.

1. Introduction

Nitrogen (N) is one of the main essential plant nutrients and it is taken up by crops throughout the growing season, thereby affecting the plant growth and the yield [1,2]. Nitrogen (N) often comes from urea for field use because of its high N content, low cost, fast conversion, easy dissolution and easy storage [3]. The conversion of urea into ammonium is rapid. Mineralization and nitrification processes convert organic N and NH4+ into NH4+ and NO3, respectively, which can be absorbed and utilized by crops. The mineralization and nitrification processes depend on climatic and edaphic factors, such as the soil moisture and temperature [4].
Cotton (Gossypium hirsutum L.) is the main cash crop in Xinjiang, located in northwestern China [5]. Because of arid climate in Xinjiang, drip irrigation is very popular in this area, especially for cotton. Drip fertigation allows the control of the amount of water applied and the concentrations of nutrients supplied to crops, thereby conserving water resources and reducing fluctuation in the concentrations of nutrients in the soil during the crop growing season [6]. The appropriate application of nitrogen fertilization and water can meet the needs of crops and so increase crop yields [7]. However, nitrogen accumulation in the soil, as well as leaching and percolating from the soil profile may occur when the amounts of nitrogen fertilization and water applied exceed the crop’s requirements [8]. Furthermore, leaching and percolation can transfer nitrogen (N) from farmlands into aquatic systems [9], thereby leading to water pollution, which is one of the most significant environmental problems at present [10], i.e., non-point source pollution [11].
Many scholars have done a lot of research on cotton under mulch drip irrigation. Dai and Dong [12] discussed the advantages and disadvantages of applying nitrogen fertilization to grow cotton under drip irrigation and plastic mulching in China. Nitrogen fertilization improves cotton production, and it is especially important during cotton growth, but excessive application is detrimental to the environment [13]. Several studies have investigated the effects of nitrogen application on N leaching during drip-irrigated maize production and the losses of nitrogen from the soil. Jia et al. [14] found that high application rates of nitrogen fertilization and irrigation could increase nitrogen leaching from the soil and lead to the over-consumption of fresh water resources in summer maize (Zea mays L.). Wang and Xing [15] showed that the leaching of nitrate nitrogen from the soil was lower under plastic mulching than without plastic mulching in maize (Zea mays L.), and nitrate nitrogen was the main form of nitrogen leached from the soil. Although various studies have investigated N leaching in maize, most focused on the effects of soil and plastic mulching on nitrogen losses, whereas few considered the losses of nitrogen in leachate water. In addition, it is not clear whether the leaching that occurs under maize production is similar to that with cotton. In addition, most recent studies of N leaching were conducted using laboratory soil columns [16,17], whereas little information is available regarding the N leached in leachate water in long-term field experiments under nitrogen fertilization and drip irrigation in arid regions, especially for cotton. Cotton is one of the most important cash crops in Xinjiang and its production consumes large amounts of N fertilization. Increasing the plant N use efficiency and reducing leaching are an important goal for the development of sustainable agriculture [18].
Therefore, the objectives of this study were: (1) to verify whether nitrogen leaching occurs in cotton fields under drip irrigation in northwest China; (2) to assess how much nitrogen is leached under different nitrogen fertilization and irrigation treatments based on long-term field observations; (3) to examine the nitrogen losses and patterns in the leachate water; (4) to determine the nitrogen loss coefficients under different treatments in order to understand the law of nitrogen leaching in cotton field under drip irrigation in Northwest China, and provide reference for reasonable water and nitrogen management.

2. Materials and Methods

2.1. Site Description and Soil Properties

Experiments were conducted in each cotton growing season from 2009 to 2015 in different fields at the long-term positioning monitoring base on Baotou Lake farm in Korla City, Xinjiang, China (41.6903° N, 85.8719° E). The annual precipitation is 56.2 mm and the evapotranspiration is 2497.4 mm. The effective accumulated temperature is 4252.2 °C and the frost free period is 205 days. The groundwater level is 2 to 2.5 m. Field soil belongs to sandy loam soil in Chinese soil classification, with medium fertility. The bulk density of topsoil (0–20 cm) in the field is 1.23 g·cm−3. In 2009, the properties of the surface soil at the trial site were: pH = 8.46, organic matter = 7.51 g·kg−1, total N = 0.45 g·kg−1, total P = 0.046 g·kg−1, available phosphorus (P) = 4.99 mg·kg−1, available potassium (K) = 95.93 mg·kg−1, NO3-N = 7.27 mg·kg−1, and NH4+-N = 3.61 mg·kg−1.

2.2. Experimental Design and Agronomic Management

For each treatment, it was set up in a factorial design comprising 0 N as urea, 0 P2O5 as calcium phosphate, 0 K2O as K2SO4, and irrigation of 480 mm(N0P0K0W480)for the control, and the following three treatments: (1) 357 kg N·hm−2 as urea, 90 kg P·hm−2 as calcium phosphate, 0 K as K2SO4, and irrigation of 480 mm (N357P90K0W480); (2) 357 kg N hm−2 as urea, 90 kg P hm−2 as calcium phosphate, 62 kg K hm−2 as K2SO4, and irrigation of 420 mm (N357P90K62W420); and (3) 240 kg N hm−2 as urea, 65 kg P hm−2 as calcium phosphate, 62 kg K hm−2 as K2SO4, and irrigation of 420 mm (N240P65K62W420). The nitrogen application rate was set as 357 kg hm2 and the irrigation amount as 480 mm based on the average yields verified by long-term trials and production in the region [19]. N357P90K0W480 treatment represented conventional N fertilization and irrigation. N357P90K62W420 treatment represented conventional N fertilization and optimal irrigation. N240P65K62W420 treatment represented optimal N fertilization and irrigation. All of the plots received P as calcium phosphate and K as K2SO4 by hand spreading, and they were into the soil using a rotator before sowing. Granular urea was applied where 20% of the total N was spread into field by hand before sowing for the three treatments, except for N0P0K0W480, and the remaining 80% of N was solubilized and applied with irrigation water according to the proportions used in the different treatments after planting (Table 1). For cotton, the first and last drip irrigation is only irrigation without fertilization. For the N357P90K0W480 treatment, the remaining 80% of solubilized N was applied in the second, third, and fourth irrigation events with 36.8%, 21.6%, and 21.6%, respectively. For the N240P90K62W420 treatment, the remaining 80% of solubilized N was applied in the second, third, fourth, and fifth irrigation events with 32%, 20%, 16%, and 12%, respectively. For the N240P65K62W420 treatment, the remaining 80% of solubilized N was applied in the second, third, fourth, and fifth irrigation events with 32%, 20%, 16%, and 12%, respectively. Irrigation time was based on the dates, and these dates were critical periods for cotton growth. In generally, cotton was planted in late April, then the first irrigation started at the beginning of June only with irrigation, the last irrigation was carried out in mid-August only with irrigation. The remaining six irrigations were usually irrigated once a week, and may be shorter than once a week with irrigation and fertilization. The second irrigation was the bud stage of cotton. The third irrigation was the full bud stage of cotton. The fourth irrigation was the initial flowering stage of cotton. The fifth irrigation was the full flowering stage of cotton. The sixth irrigation was the flowering stage of cotton. The seventh irrigation was the cotton boll opening period. The specific irrigation times and fertilization rates are shown in Table 1. The treatments were randomized into a complete block design with three replicates. The size of each plot was 4.5 × 7.4 m.
In the experiment, cotton (variety Xinluzao 38) was planted in late April. Drip irrigation pipes and the plastic mulch were applied before planting using a custom built tractor-drawn seeder. Seeds were seeded with a film of four rows, and the distance between rows was 60 cm and the distance between seeds within a row was 30 cm. The plastic mulch is composed of high-density, airtight transparent polyethylene film, covering two rows. Standard management practices were used to control weeds and pests using herbicides and pesticides.

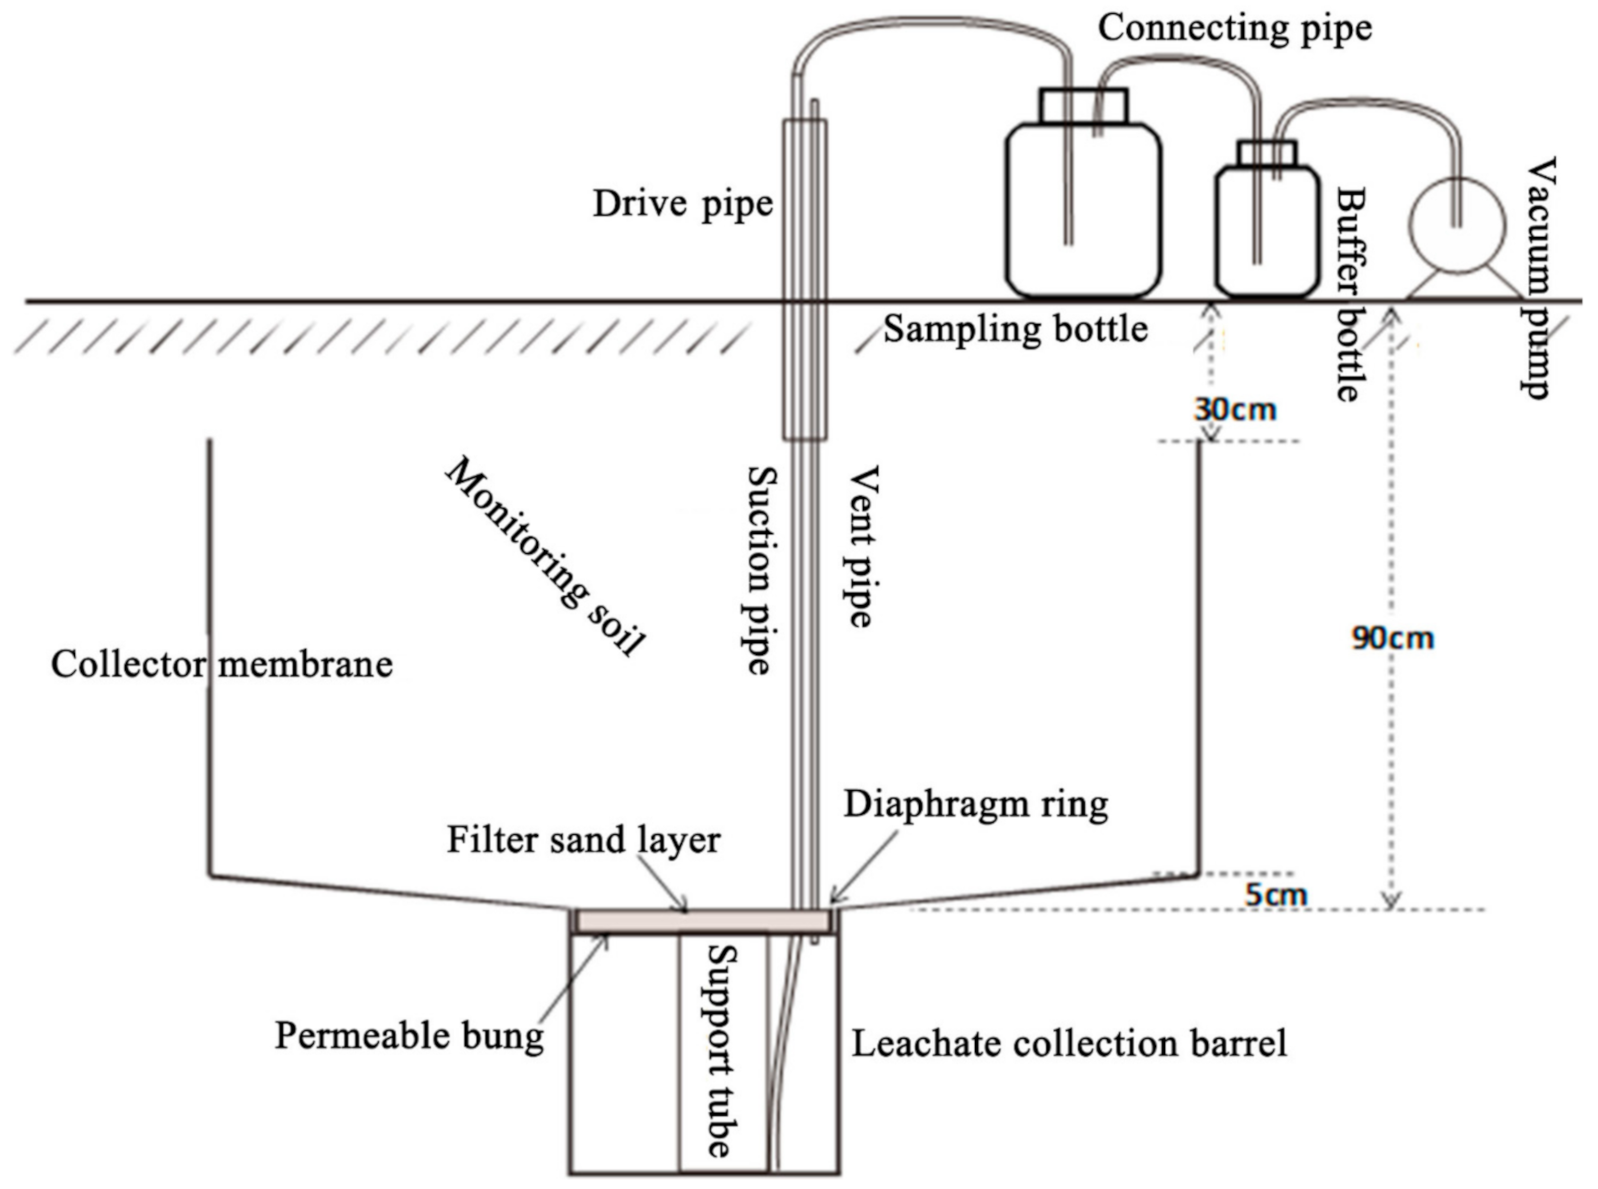
2.3. Installation of Experimental Device and Analysis of NO3andNH4+ Levelsin Underground Leachate Samples

The NO3 and NH4+concentrations were determined in samples of leachate water obtained underground using a drainage collector. The drainage collector comprised a special polyvinyl chloride dish (0.30 m long × 0.60 m wide × 0.08 m high) and a 25 l polyvinyl chloride bucket, which were connected by plastic pipes (Figure 1). A plastic pipe extended from the water storage bucket as a water intake pipe. A set of drainage collectors was buried in each plot. First, a concrete enclosure was prepared by forming a rectangular boundary with a length of 150 cm and width of 80 cm in the middle of the plot. Next, the soil profile was dug to a depth of 90 cm in the designated area. The bottom of the section was cut into an inverted trapezoid where the periphery was slightly higher than the middle (by 5 cm). The leaching barrel was then placed vertically into a small round depression. Finally, the soil was backfilled layer by layer according to the reverse order that the soil was excavated and compaction was applied up to the original bulk density while backfilling. In our study, leaching water was taken nine times every year after one time of spring irrigation and eight times for drip irrigation. Leaching water samples were collected on the third day after each irrigation was applied. Although the annual precipitation of 56.2 mm, which mainly concentrated in April and was divided into several rainfall events, then absorbed by soil. In addition, each experimental plot had a ridge to prevent fertilizer from channeling and store water. The drip irrigation started in June every year, while the rainfall only fell in April and the intensity of the rainfall was small, so the leaching samples did not occur and we neglect the leaching from rainfall events.
The leachate volume was measured using a graduated cylinder measuring 1 l. The nitrate and ammonium concentrations in the leachate water were determined using colorimetric procedures with a continuous flow analytical system (TRAACS 2000). The total nitrogen concentration in the leachate water was determined by potassium persulfate oxidation–ultraviolet spectrophotometry.

2.4. N Loss Analysis

The growing season annual nitrogen loss (LN) and N loss coefficient (θN) for each different treatment was calculated as:
Annual   nitrogen   loss :   L N = i = 1 m c i × v i   ,
where LN represents the annual nitrogen loss, ci represents the nitrogen concentration in the leachate, vi is the volume of the leachate, i is the sampling time and m is the total number of leachate.
N loss coefficient θN = (LN,A − LN,CK)/MN,A × 100, where θN represents the N loss coefficient, LN,A represents the annual nitrogen loss under A treatment, LN,CK represents the annual nitrogen loss under N0P0K0W480 treatment, and MN,A represents the N applied as fertilization under A treatment.

2.5. Statistical Analysis

Differences in annual leaching volumes among different treatments were analyzed by one-way parametric analysis of variance using SPSS version 11.5 (SPSS, Chicago, IL, USA). Line charts were prepared to assess the changes in the annual nitrogen loss, annual nitrate nitrogen, and ammonium nitrogen losses under different treatments. The relationships between the leaching volumes and N, P, and K fertilization and irrigation regimes were analyzed by linear regression using SPSS version 11.5 (SPSS, Chicago, IL, USA).

3. Results

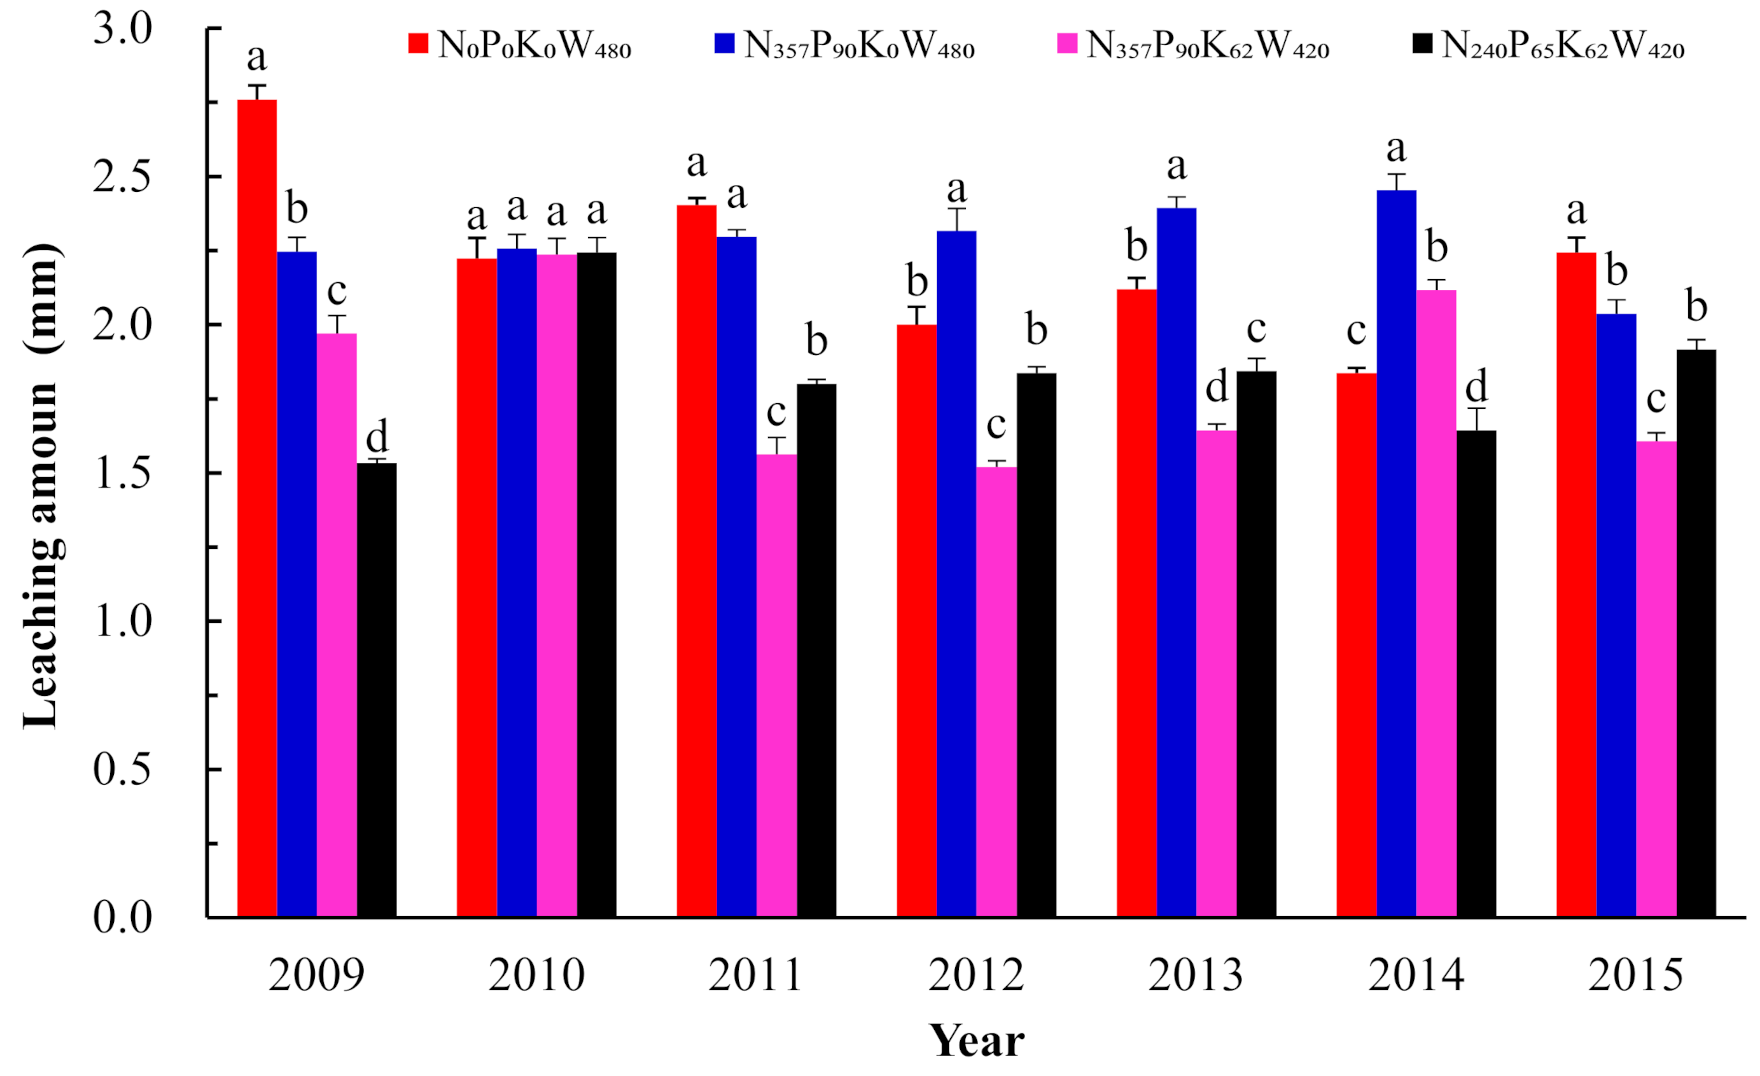
3.1. Irrigation and Leachate Volumes

The experimental plots had a continental arid climate with annual precipitation of 56.2 mm, mainly concentrated in April, divided into several rainfall events and rainfall intensity was small, which was much less than the irrigation regimes, and the drip irrigation started in June every year, thus we did not consider the rainfall. The annual irrigation input regimes were 480, 480, 420, and 420 mm for the N0P0K0W480, N357P90K0W480, N357P90K62W420, and N240P65K62W420 treatments, respectively (Table 1). For the four treatments of this experiment, the leachate volumes were greater when the irrigation regimes were higher in generally. Figure 2 shows the trends change among years. In general, the volume of leachate under N0P0K0W480 was significantly higher compared with the other treatments in 2009, 2011 and 2015. No fertilization was applied under N0P0K0W480treatment, so the growth of cotton was poor and less water was needed, and thus the leachate water volume was high [20]. The leachate volumes were significantly higher under treatment N357P90K0W480 compared with the other N fertilization treatments because the irrigation regimes were greater. The irrigation regimes were the same for treatments N357P90K62W420 and N240P65K62W420 but the trends in the leachate volumes differed, probably because the growth of cotton varied and the cotton yields under both treatments differed among years according to the amount of fertilization applied (Table 3) [21].

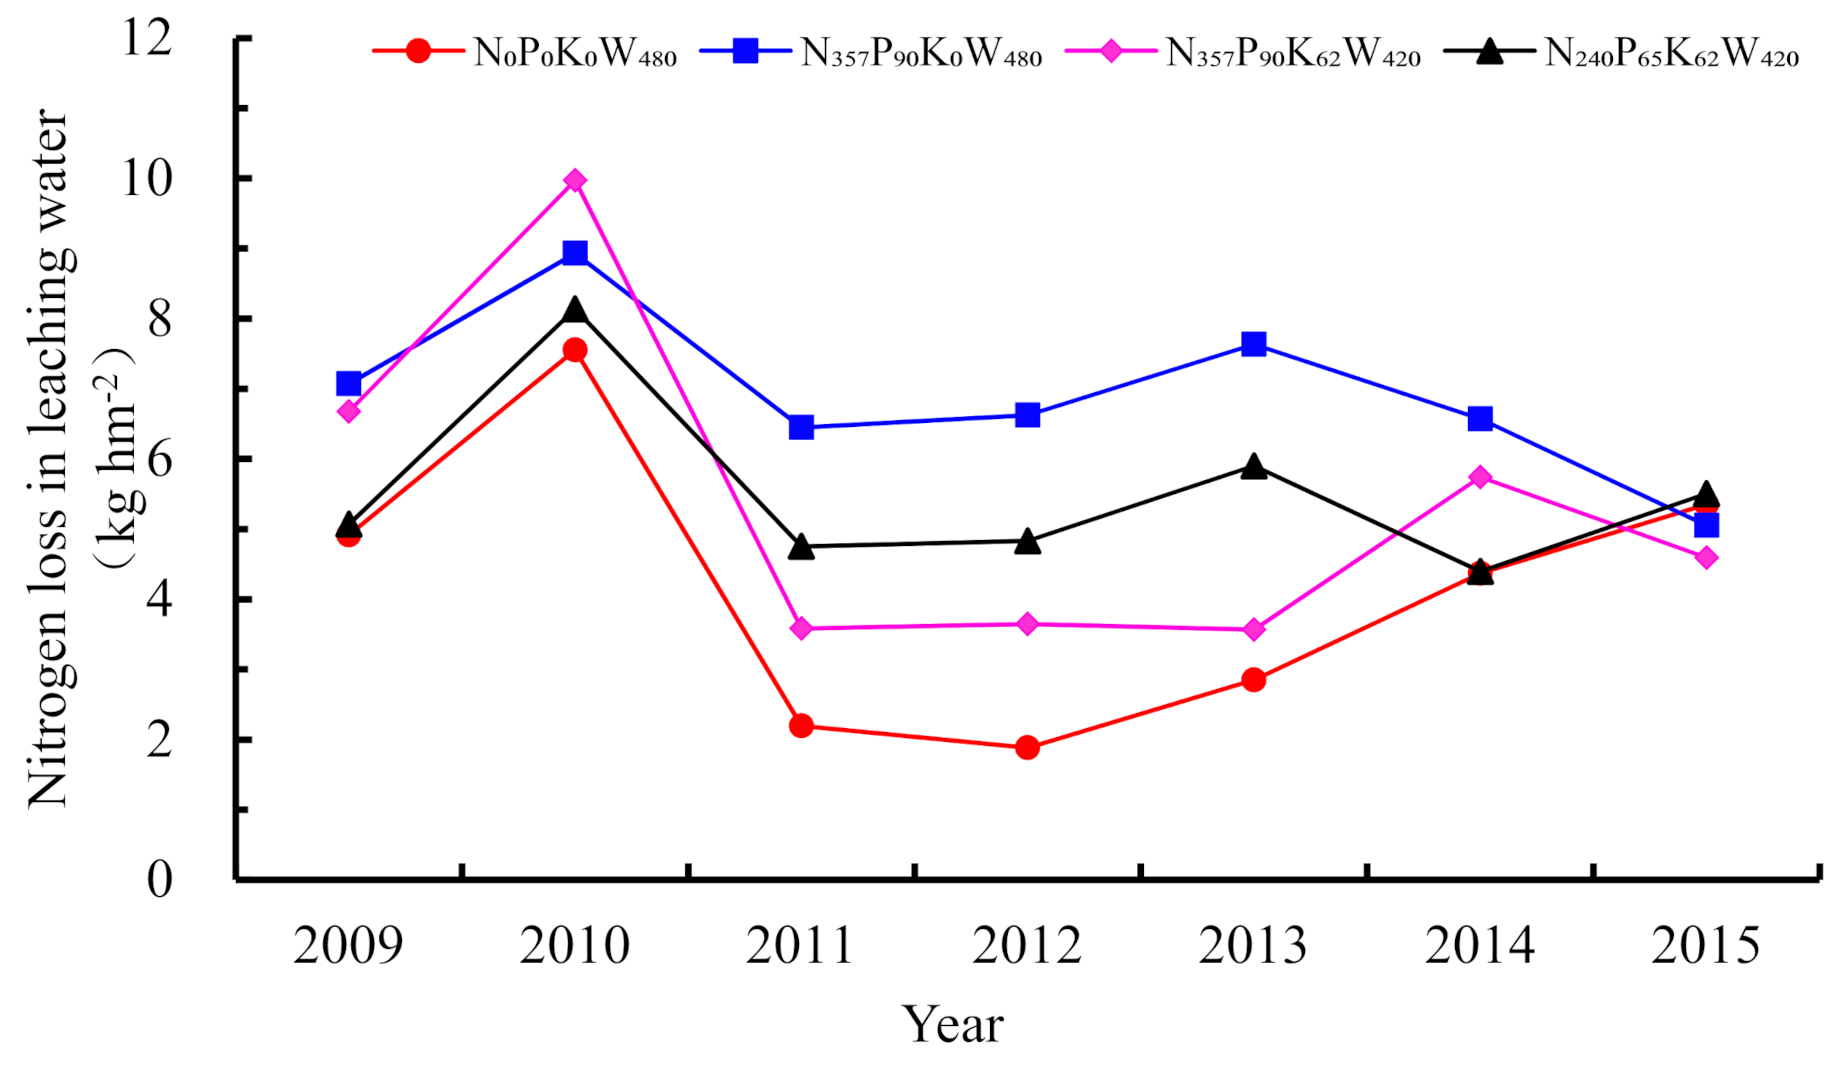
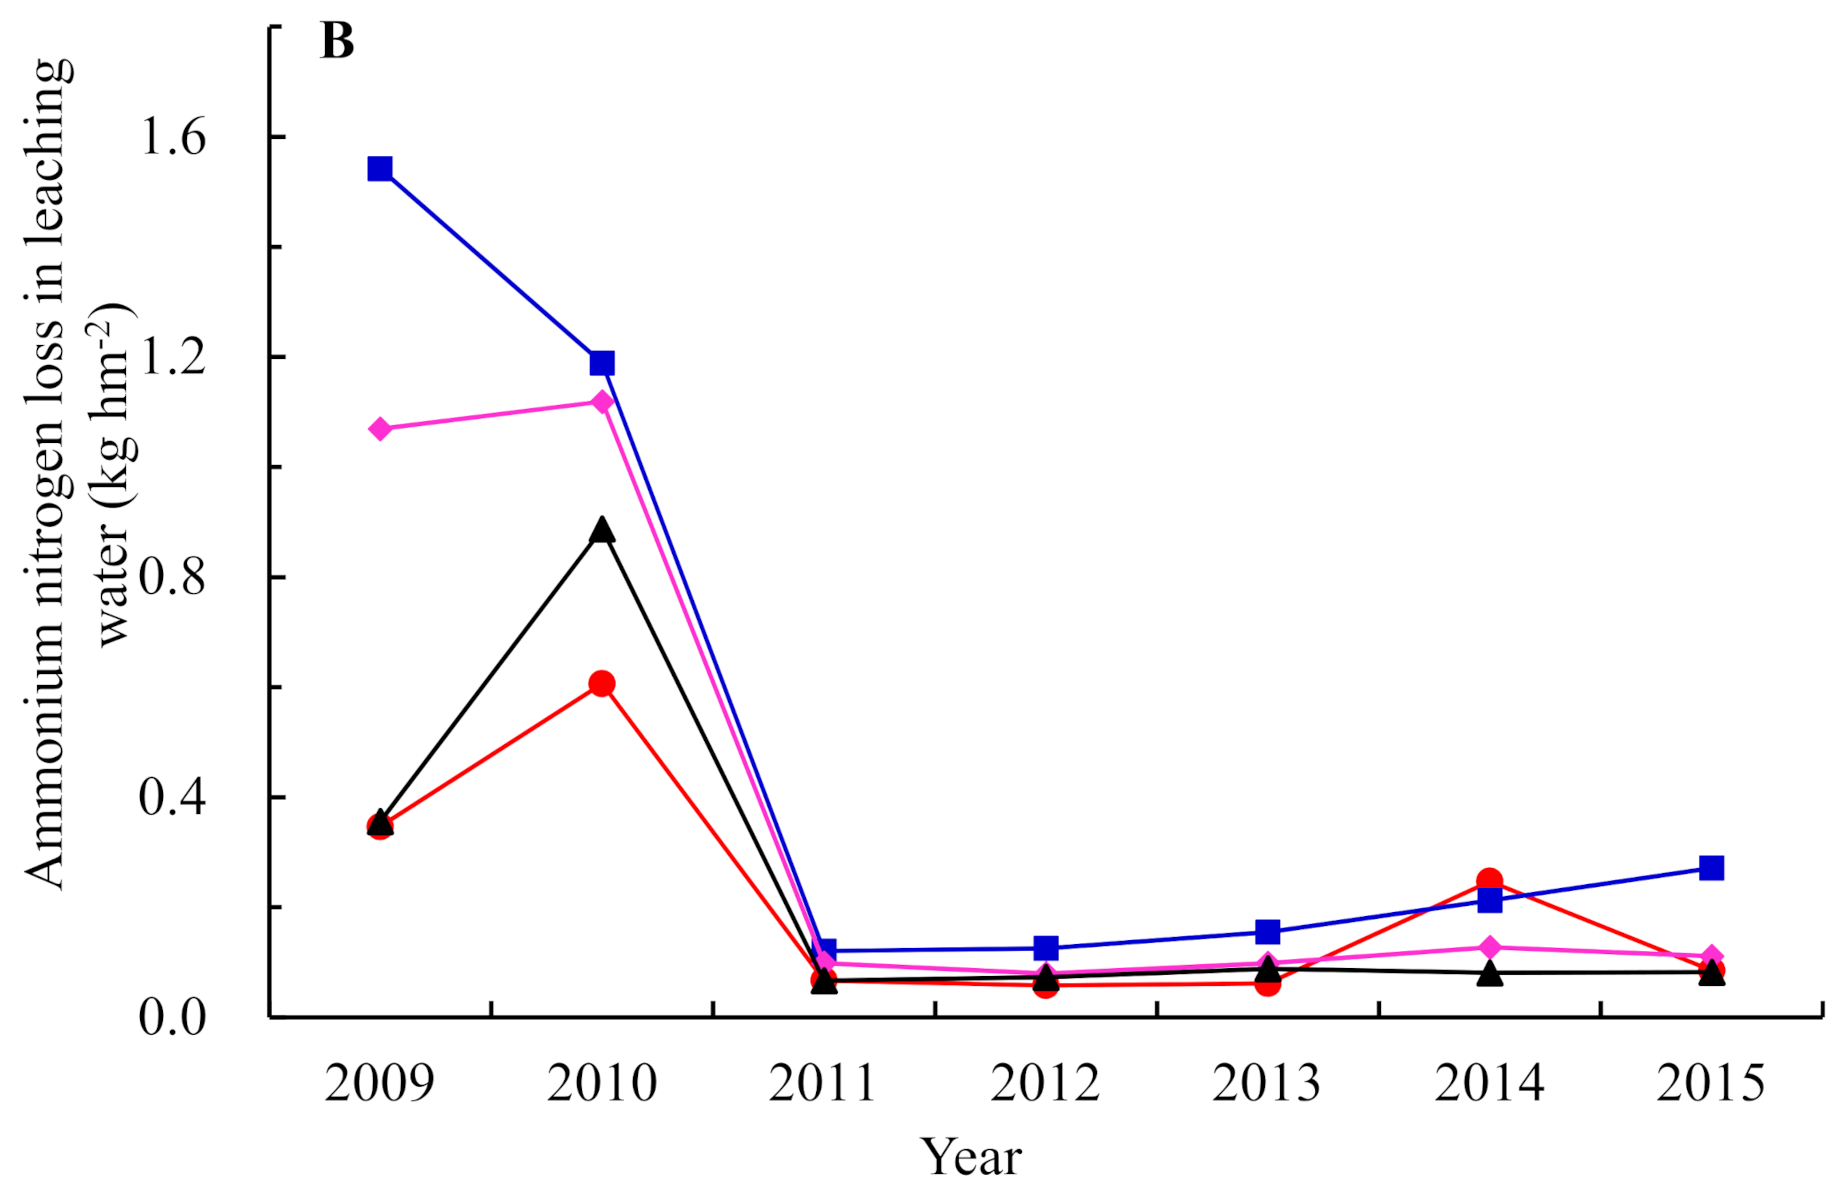
3.2. Effects of Fertilization on Nitrogen Losses in Leachate Water

The nitrogen losses in the leachates under the four treatments are presented as breakthrough curves in Figure 3. The nitrogen losses in the leachate water ranged from 4.92 to 7.07 kg·hm−2 in the first year. The nitrogen losses in the leachate water were largest during 2010 under all four treatments. Over the seven years, the maximum annual nitrogen losses in the leachate water followed the order of: N357P90K0W480 > N240P65K62W420 > N357P90K62W420 > N0P0K0W480, with values of 6.89, 5.57, 5.36, and 4.79 kg·hm−2, respectively. In general, the nitrogen loss in the leaching water was lower under the N357P90K62W420treatment compared with the other N fertilization and irrigation treatments.
According to the overall trends determined for each treatment, the nitrogen losses in the leachate water were highest under treatment N357P90K0W480. For theN0P0K0W480 treatment irrigated without fertilization, but the residual N in the soil was leached with irrigation, and the N loss in the leached water showed the same trend. Compared with N0P0K0W480, the losses of nitrogen ranged from 0.78 to 2.11 kg hm−2 in the N357P90K0W480 and N240P65K62W420 treatments, and between 0 and 0.57 kg hm−2 in the N357P90K62W420 treatment.

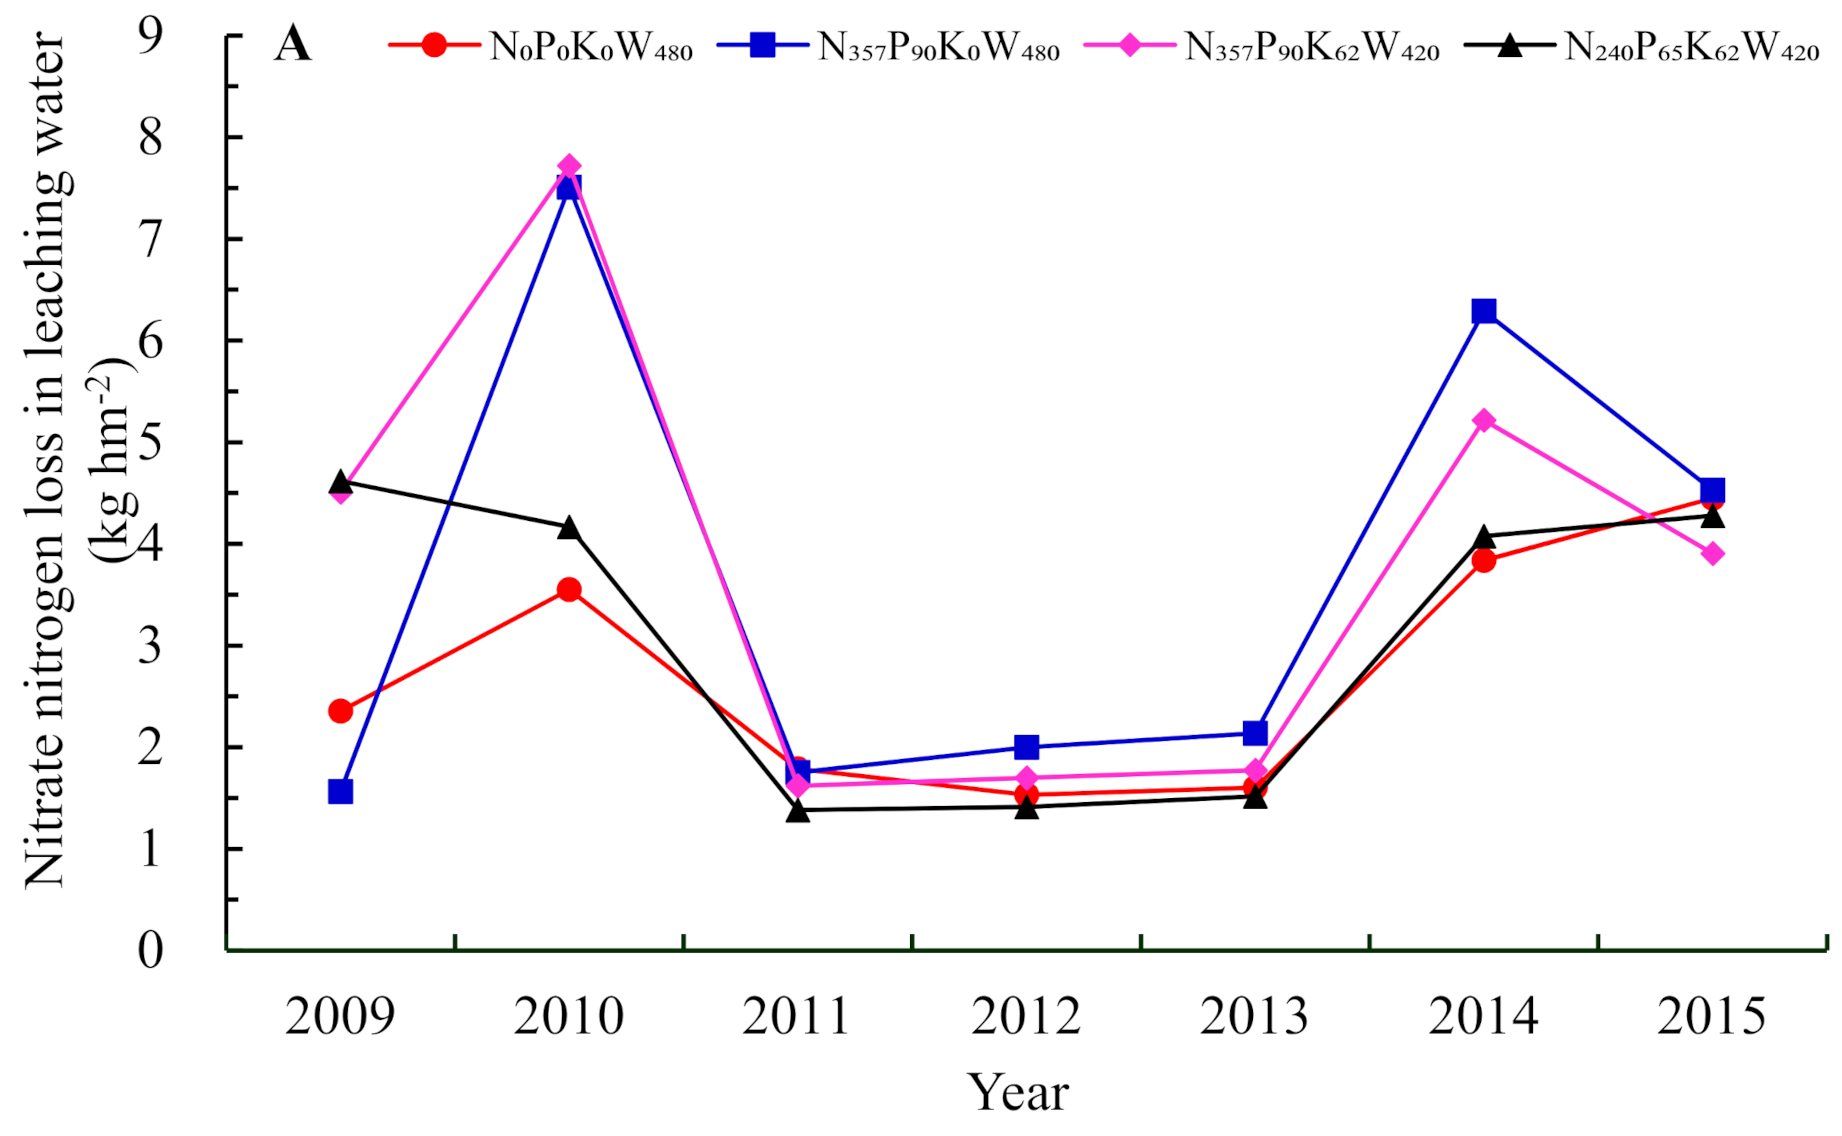
3.3. Nitrogen Loss Patterns under Different Treatments

Figure 4A shows the annual losses of NO3 in the leachates from the four treatments. The nitrate nitrogen losses in the leachate water ranged from 1.56 to 4.62 kg·hm−2 in the first year. The highest annual NO3 losses occurred in 2010 coinciding with maximum total nitrogen losses. Similar trends were observed for all four treatments.
The ammonium nitrogen losses in the leachates under all four treatments are shown as break through curves in Figure 4B. The ammonium nitrogen losses in the leachates ranged from 0.35 to 1.54 kg hm−2 in the first year. The peak losses of NH4+ in the leachate water were 1.17 and 1.24 kg hm−2 in N357P90K62W420 and N357P90K0W480, respectively in 2010, and they decreased in the leachate water samples in the next few years. Compared with N0P0K0W480 without nitrogen application, the losses of NH4+ ranged from 0.04 to 1.19 kg·hm−2 in the N0P0K0W480 treatment, and the N357P90K62W420 treatment resulted in NH4+ losses of 0 to 0.27 kg hm−2.

3.4. Annual Nitrogen Loss Coefficients

The annual nitrogen loss coefficients was higher when the irrigation regimes was larger under the same nitrogen application level (N357P90K0W480 and N357P90K62W420) and when the nitrogen application level was larger under the same amount of irrigation (N357P90K62W420 and N240P65K62W420). The nitrogen loss coefficient was reduced from0.55 to 0.3 (Table 2) by reducing the amount of nitrogen while retaining the same amount of irrigation (N357P90K62W420 and N240P65K62W420). In addition, the nitrogen loss coefficient decreased from0.85 to 0.55by reducing the amount of irrigation and applying the same amount of nitrogen (Table 2) (N357P90K0W480 and N357P90K62W420). The cotton yields under the N357P90K62W420 and N240P65K62W420 treatments verified this finding (Table 3).

4. Discussion

4.1. Nitrogen Leaching and Leachate Volumes

Nitrogen that is not taken up by crops due to the excessive application of irrigation or nitrogen is likely to be leached. Nitrogen leaching depends on the irrigation treatment, fertilizer type, and fertilizer rate, and there is a strong interaction between the irrigation treatment and fertilizer rate [22]. In our study, increasing the irrigation by 14.3% increased N leaching under all of the fertilizer treatments, and by almost two times (Figure 3). This result showed that the amount of irrigation accounted for a large part in leaching. The D-value of N leaching (Figure 3) was larger under N357P90K62W420 and N357P90K0W480 treatments in 2013, while there was significant difference in yield (Table 3), which may be attributed to a higher K rate. Til et al. [23] found that mineral K fertilization acts positively on irrigation [24]. Thus, the leaching under N357P90K62W420 treatment was smaller than that under N357P90K0W480 treatments. Then, the N loss under N357P90K62W420 treatment was smaller than that under N357P90K0W480 treatments. So, the difference of cotton yield among different treatments in 2013 may be due to the difference of nitrogen loss. The total N loss under N357P90K62W420 was higher than that under N357P90K0W480 in 2010, possibly because the absorption of N by cotton was less than in N357P90K0W480 treatment. The leachate volume per year ranged from 1.48 to 2.67 mm, and it depended on the fertilization rate. There were significant differences in the total leaching amounts among the four treatments (Figure 2). The leachate volume per year was significantly higher with an annual irrigation amount of 480 mm compared with 420 mm. The leachate volumes also differed significantly with the same amount of irrigation (N0P0K0W480 and N357P90K0W480, and N357P90K62W420 and N240P65K62W420), possibly because the cotton growth was poor, the root water uptake was decreased, thereby leading to greater transpiration and less leaching in N0P0K0W480 compared with N357P90K0W480 in some years [20]. The same reasons could explain the variations under the N357P90K62W420 and N240P65K62W420 treatments. The leachate volumes also significantly differed with the same quantity of fertilizer (N357P90K0W480 and N357P90K62W420 treatments), which could be attributed to differences in the amount of irrigation or the higher plant growth and water uptake at a higher K rate. Furthermore, this result indicates that irrigation at 480 mm hm−2 may have been excessive. These results are consistent with those obtained by Barton, Wan, and Colmer [22]. Parmodh et al. [25] found that the leaching volumes varied with the different plant time for onion, which due to the depth of the onion roots. These results suggest that proper timing of sowing for vegetables may help reduce leaching. This conclusion may be suitable for vegetables. For the cotton, we should set different sowing times for cotton to verify it.
Some previous studies of N leaching found that 30% to 50% of the urea-based N fertilizer applied may be lost and as much as 60% under favorable environmental conditions, and irrigation was recommended to reduce the losses due to volatilization [4,26]. Other studies mainly focused on the nitrogen loss dynamics in the soil after large rainfall events or irrigation [27,28]. By contrast, we investigated the amounts and properties of the leachate water after irrigation. By analyzing the data obtained in several consecutive years, we found that the irrigation of 480 and 420 mm have resulted in leaching. Further research is required to ensure that the cotton yield will not decline by: (1) setting up different total irrigation amount, and adjusting each irrigation amount during the cotton growth according to the potential evapotranspiration; and (2) determining the dynamic changes in nitrogen and ammonia volatilization after irrigation, and understanding the changes in nitrogen in leachate water to identify reasonable water and fertilizer management practices in arid areas where irrigation is required.
For cotton, the amount of water needed to irrigate varies among different regions. Liu et al. (2011) found that the amount of irrigation acts negatively on irrigation water productivity, with the higher irrigation the smaller water efficiency [29]. Thevs et al. (2015) found the amount of cotton water requirement was 500–660 mm·hm−2 for cotton [30], Deng et al. (2013) illustrated the optimal amount of irrigation was 585 mm·hm−2 [31], and Shen et al. (2013) reported 670 mm·hm−2 average water requirement of cotton [32]. For the Kullu area in Southern Xinjiang, the average water requirement of cotton was 480–525 mm·hm−2. In our study, eight irrigation events were set up during the whole cotton growth period. Thevs et al. (2015) found that irrigation frequency showed no significant effect on cotton yield [30]. Hunsaker et al. (1998) identified increasing irrigation frequency could increase cotton yield [33], but Bordovsky et al. (2012) found reducing irrigation frequency could increase cotton yield [34]. Although a large number of studies have been conducted on cotton, most of them focused on the use of water and fertilizer management to improve cotton yield. There are few studies on whether unreasonable water and fertilizer management could produce leaching, and whether it causes pollution to surface and groundwater. Therefore, long-term monitoring is necessary to collect the subsurface leaching of drip irrigated cotton fields under different water and fertilizer treatments.

4.2. Nitrogen Loss Patterns

Abundant irrigation and/or precipitation can greatly increase the leaching of NO3, especially from sandy soils [35]. Parmodh et al. (2012) found that irrigation was the most important factor affecting leaching [25]. In our study, we determined the concentrations of NO3 and NH4+ in the leachate water samples. As expected, the ammonium nitrogen losses in the leachate water remained at relatively low levels (<4 kg hm−2) compared with the losses of nitrate nitrogen, which accounted for most of the N leaching losses. Similar results were obtained by Mahboubeh and Mohsen [36] in column experiments. The nitrate nitrogen, ammonium nitrogen, and nitrogen losses were highest under N357P90K0W480treatment, probably because this treatment employed the highest amounts of irrigation and N fertilizer. The losses varied considerably in the early years, possibly because the soil structure was disturbed when the leaching bucket was installed and the recovery from the soil disturbance was slow. The losses of nitrogen, nitrate nitrogen, and ammonium nitrogen varied under the continuous inputs of nitrogen fertilizer, but they all tended to stabilize in2011, 2012 and 2013, but there was a significant increase of nitrate leaching in 2014 and 2015, probably because of the lower temperature with the weaker transpiration, the less water needed, and the more leaching, vice versa. Nitrate was still the main form of nitrogen lost under all four treatments. However, the total nitrogen loss was greater than the sum of the nitrate nitrogen loss and ammonium nitrogen loss under four treatments, and we only focused on the inorganic nitrogen absorbed and utilized by plants directly, whereas we did not consider the dissolved organic nitrogen. Maybe the differences in organic N are much higher than the differences in ammonium or nitrate or a considerable proportion of urea is leached without being mineralized. Gao et al. studied the dynamic changes in nitrogen leaching under different fertilization treatments and found that nitrate nitrogen (NO3), dissolved organic nitrogen, and ammonium nitrogen (NH4+) were the main forms of nitrogen in the leachate water, where they accounted for 72.1%, 26.2%, and 1.7% of the total nitrogen leached, respectively [37]. In future research, we will investigate the ammonia losses, which accounted for some of the inorganic nitrogen losses, in order to provide a reference for more reasonable water and fertilizer management. Jariani et al. (2020) found that DON also was the dominant N form in stormwater runoff [38]. In addition, DON has been regarded as a crucial component of the terrestrial nitrogen (N) cycle [39]. This conclusion suggests that in terms of N loss, we should consider not only inorganic N, but also organic N.
Wright reported a strong positive correlation between the concentrations of N and P in the leaves of various species, thereby suggesting that the uptake of N by plants is affected by the availability of P [40]. However, Liu et al. demonstrated that the field N balance between N fertilization inputs and the plant total N uptake was significantly affected only by water management practices and not by the P rate or any treatment interactions [41]. In our experiments, the contents of various forms of nitrogen in the leachate water differed significantly among the treatment sand they were influenced by the availability of P and N as well as by the water management practices. Clearly, the conversion of nitrogen is a complex process in a field environment. Yuan et al. (2017) found N input from atmospheric deposition was significantly increased, with an average annual growth rate of 6.1% [42]. In this study, we only considered the losses of nitrogen in leachate water under different fertilization application and irrigation quantity treatments. The loss coefficients of nitrogen residues in different layers of the soil profile require further investigation. In addition, in order to figure out the nitrogen balance, we must take nitrogen deposition into account. Yuan S and Peng X B found that Larger increase in N input from atmospheric deposition was observed, with an average annual growth rate of 6.1% [42]. Next, we not only focus on the nitrogen from the soil and plant, but also the atmosphere should be included. Soil salt concentration is a serve problem in southern Xinjiang. Wang et al. (2010) found when the soil salt concentration exceeded 0.58%, the cotton seedlings was low and no yield [43]. Therefore, winter irrigation is a widely effective measure to treat soil salinization. The optimal irrigation amount for winter irrigation in northern Xinjiang is still guided by experience rather than by research, and the leaching would occur [44]. This phenomenon also exists in southern Xinjiang. In this study, we only analyze the average leaching amount all the year, next we should (1) make clear that the leaching volumes after each irrigation (2) compare the leaching volume under winter or spring irrigation in order to develop a reasonable irrigation system.
In particular, a long-term field study is required to determine whether the loss coefficients are similar for nitrogen and phosphorus under the same conditions. In addition, phosphate is much less soluble than nitrate, so that P leaching is considerably lower than N leaching and may lead to eutrophication of surface waters. In our study, we have only examined N element although several P gradients have been set, whether P leaching would occur and the amount of P loss under different treatments with the interannual variation is still unclear. So, P leaching is necessary for our next study. This measure would provide important reference for reasonable water and fertilizer management of cotton field in arid area.

5. Conclusions

Our results showed that leaching would occur in Xinjiang, northwest China, while the leaching volume was less. Under the same amount of N fertilization, the leachate volume increased by 8% to 52% (N357P90K0W480 and N357P90K62W420). Under the same irrigation amount, the leachate volume decreased by 11% to 29% (N357P90K62W420 and N240P65K62W420). The loss of total nitrogen under convention fertilization and irrigation was 6.89 kg hm−2, which was 2.10 kg hm−2 higher than that under optimizing fertilization and irrigation. The nitrogen losses occurred mainly in the form of nitrate nitrogen and the least was lost in the form of ammonium nitrogen. The nitrogen loss coefficients were generally 0.55 higher under the high irrigation and fertilization treatments than that under the low irrigation and fertilization conditions (N357P90K0W480 and N240P65K62W420). Further studies are needed to monitor the nitrogen residues in the soil and N deposition in long term positioning station in order to estimate the nitrogen balance after nitrogen fertilization.

Author Contributions

H.M. conceived and designed the experiments, performed the experiments, analyzed the data, contributed reagents/materials/analysis tools, prepared figures and/or tables, authored or reviewed drafts of the paper, and approved the final draft. T.Y. and X.N. conceived and designed the experiments, authored or reviewed drafts of the paper, and approved the final draft. Z.H. and X.M. conceived and designed the experiments, analyzed the data, authored or reviewed drafts of the paper, and approved the final draft. All authors have read and agreed to the published version of the manuscript.

Funding

This research was supported financially by the National Key Research and Development Program of China (2018YFD0800804). The funders had no role in the study design, data collection and analysis, decision to publish, or preparation of the manuscript.

Institutional Review Board Statement

“Not applicable” for studies not involving humans or animals.

Informed Consent Statement

“Not applicable” for studies not involving humans.

Data Availability Statement

Not applicable.

Acknowledgments

The authors would like to express appreciation to the editors and reviewers for their help. We thank International Science Editing (http://www.internationalscienceediting.com) for editing this manuscript.

Conflicts of Interest

The authors declare no conflict of interest.

References

  1. Khalil, A.; Singh, D.K.; Singh, A.K.; Khanna, M. Modeling of nitrogen leaching from experimental onion field under drip fertigation. Agric. Water Manag. 2007, 89, 15–28. [Google Scholar] [CrossRef]
  2. Fallovo, C.; Colla, G.; Schreiner, M.; Krumbein, A.; Schwarz, D. Effect of nitrogen form and radiation on growth and mineral concentration of two Brassica species. Sci. Hortic. 2009, 123, 170–177. [Google Scholar] [CrossRef]
  3. IFA. International Fertilizer Industry Association. Yara Fertilizer Industry Handbook. 2017. Available online: https://www.yara.com/siteassets/investors/057reports-and-presentations/other/2017/fertilizer-industry-handbook_2017_slides_only.pdf (accessed on 1 April 2018).
  4. Dawar, K.; Zaman, M.; Rowarth, J.S.; Blennerhassett, J.; Turnbull, M.H. Urease inhibitor reduces N losses and improves plant bioavailability of urea applied in fine particle and granular forms under field conditions. Agric. Ecosyst. Environ. 2011, 144, 41–50. [Google Scholar] [CrossRef]
  5. Ma, Z.W.; Gao, X.P.; Mario, T.; Kuang, W.N.; Gui, D.W.; Zeng, F.J. Urea fertigation sources affect nitrous oxide emission from a drip-fertigated cotton field in northwestern China. Agric. Ecosyst. Environ. 2018, 265, 22–30. [Google Scholar] [CrossRef]
  6. Baryosef, B. Advances in fertigation. Adv. Agron. 1999, 65, 1–75. [Google Scholar] [CrossRef]
  7. Kuang, W.N.; Gao, X.P.; Gui, D.W.; Tenuta, M.; Flaten, D.N.; Yin, M.Y.; Zeng, F.J. Effects of fertilizer and irrigation management on nitrous oxide emission from cotton fields in an extremely arid region of northwestern China. Field Crop. Res. 2018, 229, 17–26. [Google Scholar] [CrossRef]
  8. Yang, X.L.; Lu, Y.L.; Tong, Y.A.; Yin, X.F. A 5-year lysimeter monitoring of nitrate leaching from wheat–maize rotation system: Comparison between optimum N fertilization and conventional farmer N fertilization. Agric. Ecosyst. Environ. 2015, 199, 34–42. [Google Scholar] [CrossRef]
  9. Xu, N.; Tan, G.C.; Wang, H.Y.; Gai, X.P. Effect of biochar additions to soil on nitrogen leaching, microbial biomass and bacterial community structure. Eur. J. Soil Biol. 2016, 74, 1–8. [Google Scholar] [CrossRef]
  10. Diana, S.; Bruno, B.; Sandy, M.; Adam, R.; Philip, R.G.; Zhao, J.H. The Need for a coupled human and natural systems understanding of agricultural nitrogen loss. Bioscience 2015, 65, 571–578. [Google Scholar] [CrossRef] [Green Version]
  11. Chen, H.Y.; Teng, Y.G.; Wang, J.S. Load estimation and source apportionment of nonpoint source nitrogen and phosphorus based on integrated application of SLURP model, ECM, and RUSLE: A case study in the Jinjiang River, China. Environ. Monit. Assess. 2013, 185, 2009–2021. [Google Scholar] [CrossRef]
  12. Dai, J.L.; Dong, H.Z. Intensive cotton farming technologies in China achievements, challenges and countermeasures. Field Crop. Res. 2014, 155, 99–110. [Google Scholar] [CrossRef] [Green Version]
  13. Khan, A.; Tan, D.K.Y.; Afridi, M.Z.; Luo, H.H.; Tung, S.A.; Ajab, M.; Fahad, S. Nitrogen fertility and abiotic stresses management in cotton crop: A review. Environ. Sci. Pollut. Res. 2017, 24, 14551–14566. [Google Scholar] [CrossRef]
  14. Jia, X.C.; Shao, L.J.; Liu, P.; Zhao, B.Q.; Gu, L.M.; Dong, S.T.; Bing, S.H.; Zhang, J.W.; Zhao, B. Effect of different nitrogen and irrigation treatments on yield and nitrate leaching of summer maize (Zea mays L.) under lysimeter conditions. Agric. Water Manag. 2014, 137, 92–103. [Google Scholar] [CrossRef]
  15. Wang, X.K.; Xing, Y.Y. Effects of mulching and nitrogen on soil nitrate-N distribution, leaching and nitrogen use efficiency of maize (Zea mays L.). PLoS ONE 2016, 11, e0161612. [Google Scholar] [CrossRef] [PubMed] [Green Version]
  16. Rajput, T.B.S.; Patel, N. Water and nitrate movement in drip irrigated onion under fertigation and irrigation treatments. Agric. Water Manag. 2006, 79, 293–311. [Google Scholar] [CrossRef]
  17. Chen, X.M.; Wu, H.S.; Wo, F. Nitrate vertical transport in the main paddy soils of Tai Lake region, China. Geoderma 2007, 142, 136–141. [Google Scholar] [CrossRef]
  18. Karolina, M.; Ewa, W.; Nicole, N.; Lidia, D. Seasonal contributions of nutrients from small urban and agricultural watersheds in northern Poland. PeerJ 2020, 8, e8381. [Google Scholar] [CrossRef]
  19. Yao, Q.Q.; Yang, T.; Ma, X.W.; Xue, X.R.; Niu, X.X.; Wang, B. Effects of water and fertilizer regulation strategies on cotton canopy structure and yield under mulch drip irrigation. Cotton Sci. 2013, 25, 73–80. (In Chinese) [Google Scholar]
  20. Yahdjian, L.; Sala, O.E. Size of precipitation pulses controls nitrogen transformation and losses in an arid Patagonian ecosystem. Ecosystems 2010, 13, 575–585. [Google Scholar] [CrossRef]
  21. Song, X.H.; Tufail, A.W.; Biangkham, S.; Saif, A.; Huang, Y.; Yuan, Y.; Yang, G.Z. Nitrogen fertilizer and Its residual effect on cotton yield and biomass accumulation. Cotton Sci. 2018, 30, 145–154. (In Chinese) [Google Scholar]
  22. Barton, L.; Wan, G.G.Y.; Colmer, T.D. Turfgrass (Cynodon dactylon L.) sod production on sandy soils: II. Effects of irrigation and fertilizer regimes on N leaching. Plant Soil 2006, 284, 147–164. [Google Scholar] [CrossRef]
  23. Til, F.; Ling, Y.K.; Nan, H.; Lin, L.; Nurbay, A.; Haifeng, X.; Reiner, D. Determinants of cotton farmers’ irrigation water management in arid Northwestern China. Agric. Water Manag. 2017, 187, 1–10. [Google Scholar] [CrossRef]
  24. Han, M.; Zhao, C.Y.; Feng, G.; Yan, Y.Y.; Sheng, Y. Evaluating the effects of mulch and irrigation amount on soil water distribution and root zone water balance using HYDRUS-2D. Water 2015, 7, 2622–2640. [Google Scholar] [CrossRef] [Green Version]
  25. Parmodh, S.; Manoj, K.S.; Theodore, W.S.; Pradip, A. Nitrate-Nitrogen leaching from onion bed under furrow and drip irrigation systems. Appl. Environ. Soil Sci. 2012, 1–17. [Google Scholar] [CrossRef]
  26. Soares, J.R.; Cantarella, H.; Menegale, M.L.C. Ammonia volatilization losses from surface-applied urea with urease and nitrification inhibitors. Soil Biol. Biochem. 2012, 52, 82–89. [Google Scholar] [CrossRef]
  27. Peng, X.L.; Maharjan, B.; Yu, C.L.; Su, A.Y.; Jin, V.L.; Ferguson, R.B. A laboratory evaluation of ammonia volatilization and nitrate leaching following nitrogen fertilizer application on a coarse-textured soil. Agron. Soils Environ. Qual. 2015, 107, 871–879. [Google Scholar] [CrossRef]
  28. Bijesh, M.; Rodney, T.V.; Carl, R. Fertilizer and irrigation management effects on nitrous oxide emissions and nitrate leaching. Agron. J. 2014, 106, 703–714. [Google Scholar] [CrossRef] [Green Version]
  29. Liu, M.X.; Yang, J.S.; Li, X.M.; Yu, M.; Wang, J. Effects of irrigation amount and frequency on soil water distribution and water use efficiency in a cotton field under mulched drip irrigation. Chin. J. Appl. Ecol. 2011, 22, 3203–3210. (In Chinese) [Google Scholar]
  30. Thevs, N. Water scarcity and allocation in the tarim basin: Decision structures and adaptations on the local level. J. Curr. Chin. Aff. 2011, 40, 113–137. (In Chinese) [Google Scholar] [CrossRef] [Green Version]
  31. Deng, Z.; Bai, D.; Zhai, G.L.; Zong, J.; Li, Y.; Cai, J.M.; Feng, J.J. Effects of water and nitrogen regulation on the yield and water and nitrogen use efficiency of cotton in south Xinjiang, Northwest China under plastic mulched drip irrigation. Chin. J. Appl. Ecol. 2013, 24, 2525–2532. (In Chinese) [Google Scholar]
  32. Shen, Y.; Li, S.; Chen, Y.; Qi, Y.; Zhang, S. Estimation of regional irrigation water requirement and water supply risk in the arid region of Northwestern China 1989–2010. Agric. Water Manag. 2013, 128, 55–64. [Google Scholar] [CrossRef]
  33. Hunsaker, D.J.; Clemmens, A.J.; Fangmeier, D.D. Cotton response to high frequency surface irrigation. Agric. Water Manag. 1998, 37, 55–74. [Google Scholar] [CrossRef]
  34. Bordovsky, J.P.; Emerson, C.L.W.; Mustian, J.T. Irrigation interval effects on cotton production using subsurface drip systems. In Proceedings of the American Society of Agricultural and Biological Engineers Annual International Meeting 2012, ASABE 2012, Dallas, TX, USA, 29 July–1 August 2012; pp. 1375–1384. [Google Scholar]
  35. Daniele, M.; Bianca, O.; Martina, C.; Pietro, M.G.; Giacomo, C.; Antonio, F. Assessing the Reliability of Thermal and Optical Imaging Techniques for Detecting Crop Water Status under Different Nitrogen Levels. Sustainability 2017, 9, 1548. [Google Scholar] [CrossRef] [Green Version]
  36. Mahboubeh, Z.; Mohsen, J. Leaching of nitrogen from calcareous soils in western Iran: A soil leaching column study. Environ. Monit. Assess. 2012, 184, 7607–7622. [Google Scholar] [CrossRef]
  37. Gao, Z.X.; Yang, X.Y.; Zhou, J.B.; Wang, X.; Wang, H. Forms and amounts of nitrogen in leachates affected by different fertilization after one wheat-maize rotation. J. Agro-Environ. Sci. 2010, 29, 1624–1632. (In Chinese) [Google Scholar]
  38. Jariani, J.; Yun-Ya, Y.; Mary, G.; Lusk, G.S.T. Composition of nitrogen in urban residential storm water runoff: Concentrations, loads, and source characterization of nitrate and organic nitrogen. PLoS ONE 2020, 15, 0229715. [Google Scholar] [CrossRef] [Green Version]
  39. Jiang, L.L.; Wang, S.P.; Pang, Z.; Wang, C.S.; Meng, F.D.; Lan, Z.C.; Zhou, X.Q.; Li, Y.M.; Zhang, Z.H.; Luo, C.Y.; et al. Abiotic and biotic controls of soil dissolved organic nitrogen along a precipitation gradient on the Tibetan plateau. Plant Soil 2020, 1–14. [Google Scholar] [CrossRef]
  40. Wright, I.J.; Reich, P.B.; Westoby, M.; Ackerly, D.D.; Baruch, Z.; Bongers, F.; Cavenderbares, J.; Chapin, T.; Cornelsen, J.H.C.; Diemer, M.; et al. The worldwide leaf economics spectrum. Nature 2004, 428, 821–827. [Google Scholar] [CrossRef]
  41. Liu, K.; Zhang, T.Q.; Tan, C.S.; Astatkie, T.; Price, G.W. Crop and soil nitrogen responses to phosphorus and potassium fertilization and drip irrigation under processing tomato. Nutr. Cycl. Agroecosyst. 2012, 93, 151–162. [Google Scholar] [CrossRef]
  42. Yuan, S.; Peng, S.B. Exploring the trends in nitrogen input and nitrogen use efficiency for agricultural sustainability. Sustainability 2017, 9, 1905. [Google Scholar] [CrossRef] [Green Version]
  43. Wang, C.X.; Wang, Q.J.; Liu, J.J.; Su, L.J.; Dan, Y.Y.; Zhuang, L. Effects of mineralization of irrigation water and soil salinity on cotton emergence rate in Southern Xinjiang Uygur Autonomous Region of China. Trans. CSAE 2010, 26, 28–33. [Google Scholar]
  44. Li, L.; Liu, H.G.; He, X.L.; Lin, E.; Yang, G. Winter Irrigation Effects on Soil Moisture, Temperature and Salinity, and on Cotton Growth in Salinized Fields in Northern Xinjiang, China. Sustainability 2020, 12, 7573. [Google Scholar] [CrossRef]
Figure 1. Drainage collector.
Sustainability 13 01002 g001
Figure 2. Annual leaching volumes under different treatments (mm). Different lowercase letters indicate significant differences among leaching volumes under different treatments at p < 0.05. Bars denote standard errors.
Sustainability 13 01002 g002
Figure 3. Annual nitrogen losses in leachate water under different treatments.
Sustainability 13 01002 g003
Figure 4. Annual nitrate nitrogen and ammonium nitrogen losses under different treatments.
Sustainability 13 01002 g004aSustainability 13 01002 g004b
Table 1. Specific N drip fertilization rates (kg hm−2).
TreatmentTotal N Fertilization AmountAmount of Fertilization Applied Before Sowing1st Amount of Fertilization2nd Amount of Fertilization3rd Amount of Fertilization4th Amount of Fertilization5th Amount of Fertilization6th Amount ofFertilization7th Amount of Fertilization8th Amountof Fertilization
20th April8th June17th June25th June5th July13th July21st July29th July10th August
N0P0K0W4800000000000
N357P90K0W48035771.40131.37677.11277.1120000
N357P90K62W42035771.40114.2471.457.1242.84000
N240P65K62W42024048076.84838.428.8000
Table 2. Annual nitrogen loss coefficients (%) under different treatments.
Treatment2009201020112012201320142015Average
N0P0K0W480
N357P90K0W4800.60 ± 0.050.68 ± 0.111.19 ± 0.021.33 ± 0.021.34 ± 0.210.62 ± 0.020.26 ± 0.020.85
N357P90K62W4200.49 ± 0.140.39 ± 0.050.72 ± 0.050.83 ± 0.010.85 ± 0.160.38 ± 0.010.21 ± 0.080.55
N240P65K62W4200.06 ± 0.010.24 ± 0.070.58 ± 0.120.74 ± 0.130.30 ± 0.020.01 ± 0.010.19 ± 0.110.30
Table 3. Cotton yields (t·hm−2) under different treatments.
Treatment2009201020112012201320142015
N0P0K0W4804.21 ± 0.32b1.77 ± 0.08c1.68 ± 0.05c1.72 ± 0.07b1.76 ± 0.02c1.68 ± 0.03c1.71 ± 0.01b
N357P90K0W4805.72 ± 0.16a6.63 ± 0.35a6.28 ± 0.26ab6.61 ± 0.14a6.45 ± 0.03b6.45 ± 0.03b6.51 ± 0.04a
N357P90K62W4206.47 ± 0.19a6.87 ± 0.28a6.68 ± 0.09a6.66 ± 0.26a6.81 ± 0.01a6.50 ± 0.02b6.70 ± 0.22a
N240P65K62W4206.42 ± 0.22a5.56 ± 0.32b6.06 ± 0.14b6.49 ± 0.20a6.50 ± 0.02b6.81 ± 0.01a6.44 ± 0.04a
Publisher’s Note: MDPI stays neutral with regard to jurisdictional claims in published maps and institutional affiliations.

