Customer Behavioral Reactions to Negative Experiences during the Product Return


1
Department of Logistics and Process Engineering, University of Information Technology and Management in Rzeszow, 35-225 Rzeszow, Poland
2
Department of Management Systems and Logistics, Rzeszow University of Technology, 35-959 Rzeszow, Poland
*
Author to whom correspondence should be addressed.
Sustainability 2021, 13(2), 448; https://0-doi-org.brum.beds.ac.uk/10.3390/su13020448
Submission received: 14 December 2020
/
Accepted: 31 December 2020
/
Published: 6 January 2021
(This article belongs to the Special Issue Supply Chain Management for Sustainable Development)
Abstract
:This paper takes a closer look at customer experience during product return and the customer’s ability to share information about it. The research process included the development of research tools such as questionnaires. Anonymous surveys were conducted by computer assisted web interview among individual customers from Poland on a sample 327 respondents. Non-stratified random sampling was used, as we considered it to be the most effective in terms of the effort-benefit ratio of the survey. A contingency table was constructed from the responses, the observed values and expected values were compared, and the Pearson Chi-square and the p-value of Fisher’s exact test were calculated. The research process carried out as well as the analysis of the obtained results allowed us to respond to the research questions. As a result, it can be stated that the clients, both satisfied (80.1%) and dissatisfied (84,4%), tended to share their opinion about return experience with other potential clients. Moreover, 42.2% of the respondents declared that they would not buy again from a seller after an unsuccessful return operation. The presented conclusions enrich the theoretical understanding of customer behavior and their purchase intention. It also offers retailers a quantitative benchmark and new perspective on the design of return policy in order to improve customer satisfaction.
1. Introduction
Sustainable consumption and production are two of the most significant challenges of sustainable development, which requires a comprehensive approach and cooperation of all links participating in the entire supply chain, from suppliers to consumers [1]. This process assumes, among other things, that conducting educational activities for consumers raises their awareness of sustainable consumption, and thus allows them to more conscious purchasing decisions [2]. In turn, supply chains should base their offer on customer expectations, which requires adaptation of basic logistics subsystems to market requirements. It is worth pointing out that the implementation of sustainable management in the supply chain is associated with the need to develop, implement and improve concepts that integrate various spheres of operation of enterprises, which were usually considered separately. Therefore, SSCM (sustainable supply chain management) requires the improvement of such areas as product design and development (reduction of consumption components, wide use of recycling, looking for alternative components that are more environmentally friendly, etc.), procurement (including ecological and social criteria in supplier selection procedures, maintaining partnership relations, developing a common pro-ecological, philosophy etc.), distribution and transport (selection of environmentally friendly means of transport, minimization of empty runs, load consolidation, reduction of exhaust emissions, etc.) and production (rational waste management, implementation of environmental management systems, compliance with environmental and social standards, investment into clean technologies, etc.) [3,4,5]. In addition, there is a need to change the mentality of consumers, who will make conscious purchases, seek to reduce waste and have a greater resistance to temporary fashion [6]. However, cooperation between the supply chain and the consumer is very complex and requires constant communication and knowledge of end-user preferences [7]. In the literature, there is a significant amount of studies on the improvement of the basic aspects of SSCM [8,9,10]. However, there are still no studies dealing with the subject of consumer behavior in reverse logistics. This knowledge is necessary not only for the optimal design of products, but also helps to improve the forms of after-sales service and create sustainable forms of SCM (supply chain management). In view of the above, the article attempts to examine consumer preferences regarding the offered forms of the return policy. The importance of return policy in gaining customer satisfaction is particularly important, as it represents to consumers an indicator of the level of service of a company and is a key aspect that contributes customer loyalty. The relationship between returns rules offered by the seller and customer perception and their purchase intention is now widely acknowledged and has led to a major research thrust in recent years. Petersen and Kumar [11] find that lenient return policies lead to both higher purchase and higher returns. Baiman et al. [12] showed that an unconditional full return policy will affect positively customer perception of product quality, but it also can increase unnecessary returns. In turn Wood [13] and Wang [14] find that lenient return policies increase purchase without increasing returns. Harris [15] recommends restrictive return policies because they minimize logistics costs. Anderson and Hansen [16] believe that companies should find an optimal point of leniency/restrictiveness. Chen and Chen [17], investigated when retailers should offer full refunds or no returns. In turn Yan [18] found that a partial return policy is the best choice for the retailer, especially in ecommerce. Stock et al. [19] have shown that handling returns is costly for retailers. Zhang et al. [20] investigated return strategies which are better for the manufacturer that considers the consumer’s utility. Janakiraman [21] suggests that product return decisions are more complex than product purchase decisions because the effect of the different leniency factors is likely to vary not just on the degree of their effect on return, but also on the valence or the direction of their effect on return decisions. Janakiraman and Ordónez [22], have found that longer deadlines increase the endowment effect for products and lead to consumers postponing or delaying their return decisions. According to Davis [23] a full refund policy leads to unnecessary returns and this type of policy is not optimal for the company. Feng et al. [24] identified the condition in which the manufacturer/retailer should reveal product quality in the presence of consumer returns. Bahn and Boyd [25] explored the role of assortment-related information in moderating consumers’ negative reactions to more restrictive product return policies.
In summary, while researchers have examined the causes and effects of return policy, we still do not know enough about the customer’s ability to share information about their return experience, both negative and positive. The present study aims to fill this gap by adding more new knowledge in this field. For this purpose, survey research was carried out among individual customers from Poland on a sample 327 respondents. Hypotheses are formally defined as follows:
Hypothesis 1 (H1).
The customer will not purchase again after a bad return experience.
Hypothesis 2 (H2).
The customer will recommend the store to his friends after a successful return experience.
Hypothesis 3 (H3).
The customer will definitely share information with friends and write a negative opinion on social media after a bad return experience.
The intention of the article is to highlight the relationship between the return process and customer perception of this process and the ability of customers to share their experience, both negative and positive. This paper has four additional sections. The next section provides a review of the literature related to customer satisfaction and loyalty and consumer behavior in terms of returns in support of the questions addressed in this research. Section 3 formulates the research questions and explains the research methodology, while Section 4 presents the results. Section 5 provides a discussion of the study findings, including theoretical implications. This section includes limitations of the study, conclusions and areas for future research.
2. Review of the Literature
2.1. Customer Satisfaction and Loyalty
Customer satisfaction is defined as a customer’s overall evaluation of the performance of an offering to date [26]. Satisfied customers have a higher probability of repeating their purchases over time [27], and, moreover, sharing this source of satisfaction with others [28], and becoming less sensitive to the competitor’s offerings [29]. Customer satisfaction is one of the most important reasons for consumer retention and loyalty. This overall satisfaction has a strong positive effect on customer loyalty [30]. According to research by Pong and Yee [31], customer satisfaction has a stronger influence on service loyalty than the perceived quality of services. The relation of these concepts is as follows—the quality of products, services and communication affects customer satisfaction, which in turn is the basis and condition for loyalty. According to Deming [32], it is not enough for customers to be only satisfied, because satisfied customers may still go to another company. A satisfied customer can also go to the competition, when he loses little and can gain more. Profit in business is provided by regular customers, those who praise the company’s products and services and who bring their friends to it. Griffin [33] believes that a loyal customer is a person who makes regular purchases, spreads positive information about his company and is resistant to slight price increases and promotional activities of competitors. So, a satisfied customer is not necessarily a loyal customer, but a loyal customer is always satisfied. According to Kandampully [34], building a loyalty-based and true relationship between a company and its customers is possible through the organization’s ability to create emotional and long-term relationships with its customers. Loyalty is not only about behavior, but also about emotions between the parties. Oliver [35] suggests a four-stage loyalty model proposing that loyalty consists of belief, affect, intentions and action. Cognitive loyalty focuses on the customer’s perception and perception of the brand, emotional loyalty or affective loyalty consists in establishing a positive emotional relationship with the company, loyalty of beliefs manifests itself when the customer is focused on the willingness to make another purchase and action loyalty is reflected in the readiness to repeat purchases.
In order to retain the customer for longer, the company must ensure high-quality communication with him, especially in difficult situations, when the customer has changed his mind and wants to return the goods, or when he is dissatisfied with the quality and submits a complaint [36,37]. It is important to create a system of effectively handling returns, complaints and grievances, which will allow for mutual benefits—the customer will feel that he has been heard and the company cares about him. Consequently, the company will receive a signal about which aspects of the business should improve and will have a chance to gain a loyal customer. In this paper, the concept of returns means all flows that take place from the consumer to the retailer and the producer, regardless of the reason for their occurrence. Currently, after-sales service is not only related to maintaining contact with the customer, it is also important to deliver spare parts or pick up a damaged or broken product. Such additional services provided by companies contribute to achieving a competitive advantage [23]. Moreover, companies which use returns management for strategic purposes, positioning themselves as a “citizen company”, engaging socially and helping the less privileged [38]. Companies that have expanded their supply chain to include reverse flows have a better reputation for caring for the environment, as they try to extend the life cycle of products by repairing them or recycling [19]. Every conscious customer prefers to cooperate with a company that cares not only about the financial result, but also about nature and sustainability [39]. It is also important that, apart from the financial benefits, the management of the flow of returns is a source of very valuable information about customer behavior and expectations. A well-served customer in the post-trade phase will share his opinion with the company, suggest what to change, and probably make a purchase again, and may even recommend the company to friends.
Experts from The Corporate Executive Board Company [40], researching both consumers and companies, concluded that 20% of satisfied customers declared their willingness to leave the company, while 28% of dissatisfied customers were classified as loyal. Often, the client gets so used to the company that he does not try to find a replacement or the company plays a monopoly role, e.g., it is the only one close to work or home and the client, having no choice, has to use its services. Research shows that among customers who decide to change supplier, approximately 65–85% are satisfied with the product they received [41]. In this case, the reason for leaving may be poor or average customer service or ineffective handling of returns or complaints. The client did not feel that the company cared about him. In this situation, service recovery paradox may prove itself [42]. It refers to a situation where, after solving a problem, the customer is more satisfied and loyal than they would be if nothing happened.
2.2. Consumer Behavior and SCM
Customers’ purchasing decisions depend on many factors and complex processes, which must be recognized and included in the supply chain strategy. As rightly noted by Naoui [43], thanks to the development and general access to new information technologies, the client very quickly changes his tastes, preferences and views. Today, most consumers are faster and smarter than ever—they navigate market realities more often, more efficiently and with more energy. That is why customer acquisition and retention become the most important value for enterprises. Korpela et al. [44] emphasizes that currently, managers strive to design the supply chain in such a way that it provides customers with goods and services at low costs but at a high level of service at every stage. Therefore, supply chains that want to achieve market success must obtain detailed knowledge about buyers, collect information about their individual needs and skillfully adapt the offer to consumer behavior [45]. The term consumer behavior should be understood as all activities related to the acquisition, use and disposal of all products and services, supported by decisions preceding and conditioning these activities [46,47]. In addition, it can be interpreted as a way in which the buyer prioritizes his needs, chooses products and services that can meet his expectations and finally uses the possessed goods. Researchers of customer behavior in the market believe that consumer behavior covers all mental and physical activities, along with their causes and motives, concerning the entire consumption cycle [48]. Under the described term, we understand: the acquisition, possession and use of specific goods. Purchasing products and services is preceded by a choice made on the basis of the assumed criteria. Therefore, it can be assumed that consumer behavior consists of the following elements. Based on the above considerations, it can be concluded that the effectiveness and efficiency of supply chains to a large extent depends on the recognition and appropriate interpretation of the expectations, requirements, tastes and preferences of customers. [49]. This view is shared by Yan et al. [50] claiming that customer relationship management plays a major role in conditions of increased competition. Supply chains should therefore focus their activities on shaping long-term relationships with customers and on developing and offering additional benefits to customers and thus improving their competitive advantage. Sharma and Lambert [51] argue that properly structured logistics customer service in the supply chain is creating a sustainable competitive advantage, but priority should be given to customer segmentation.
According to Yan et.al. [52] logistic customer service should have a special focus on meeting customer requirements in terms of: time, convenience, reliability, flexibility, completeness and communication. However, it is worth noting that customer service in the supply chain significantly exceeds the area of logistic activities and must combine a number of activities in the field of marketing, quality management and finance. Therefore, customer service management in the supply chain should be considered as a broader philosophy leading to the development of optimal strategies and standards of customer service. It is important to introduce individual customer service logistics strategies to the individual logistics subsystems, which have different goals and tasks [53].
2.3. Consumers’ Returning Behaviour
The topic of managing returns in supply chains and its impact on consumer behavior is relatively rarely discussed in the literature of the subject and is worth continuous research and analysis. [54]. The tastes and preferences of customers are subjects of constant changes and modifications. According to managers, it is important to adapt the features and characteristics of the product to customer requirements and to develop effective forms of logistic customer service that include not only product delivery but also a whole range of after-sales facilities. [55,56]. However, this requires the development of optimal channels of communication with customers, in which retailers who have direct contact with consumers play a special role. [57]. Currently, consumers are aware of their key role in supply chain management [58], which is why the number of customer returns is increasing. In addition, they have more expectations about specific product features and are increasingly demanding in the form of after-sales service [59]. Customers have gained additional confidence in their purchasing decisions in the knowledge that they have a wider spectrum of return options and, therefore, are likely to increase the tendency of returns. Nowadays the main reason for consumer returns is no longer problems with the quality of products, but the impulse to make a return decision because of minor shortcomings or remorse after making impulsive purchases [11]. With increasing quality improvement, recently most of the product returns are referred to returns prompted/stimulated by the discrepancy between consumer expectations and actual product offerings [59]. According to [60], consumer returns are often caused by an impulse or are the result of a sudden emotion. It happens that customers buy a certain product because they want to check how it will behave or look (e.g., its color or size) in everyday use. Customers often abused their right to returns. In some cases, the customer did not even have the opportunity and time to check the quality of the purchased goods at home. Very often the customers are not “dissatisfied” with the goods, but are “dishonest” towards the seller. Impulsive behavior is a personality feature defined as a tendency towards acting without forethought, making quick cognitive decisions without considering the long-term consequences of their actions [61]. Customers who shop based on emotions and impulse in some cases are likely to regret their purchases when they get back control of their emotions and then start returning their items to the shop. Considering the aspects of impulsive buying, the consumer is likely to generate a problem with returns for the retailers. This has implications for the volume of returned products, returns physical network design and return logistics processes [62], especially when looking at this problem from a sustainability perspective. That is why currently it is difficult to predict why consumers make returns. For this reason, consumer behavior regarding returns should be carefully examined. Retailers should use technologies (CRM) which make it possible to segment customers and allow lenient return policies only for those whose past positive experience warrants it. It is also necessary for retailers to introduce to their customers understandable terms of returns, as well as a harmonized and unified return policy. Return policies are a consumer risk reliever often used by retailers to increase consumer demand [63]. However, higher demand also likely leads to higher product returns [36]. The particular return policy offered by retailers can vary from more to less restrictive. Return policy leniency can be analyzed from five dimensions [21]: time leniency (e.g., 60 day vs. 30 day return policy), monetary leniency (e.g., offering 100 percent money back vs. 80percent money back), effort leniency (e.g., no forms required vs. forms required), scope leniency (e.g., accepting returns on sale items vs. not), and exchange leniency (e.g., cash back vs. store credit). The pro-consumer return policy is characterized by a high focus on customer needs, high personal culture of employees directly serving customers, and a fast and efficient logistics system. However, a pro-consumer return policy alone is not enough to keep customers satisfied. It must be based on efficient logistics systems that guarantee consumers a free, fast, and informal procedure for the return of goods and their complaints. Thus, the logistic handling of returns increases customer satisfaction and loyalty to the brand [64]. Logistic handling of returns shows how quickly and efficiently the company can respond to the diverse needs of its customers [65]. The most important challenge for modern companies that want to gain a regular customer is to work out the optimum between customer expectations and their logistic capabilities. This is only possible when a high level of customer service is included in the company’s strategy that all employees implement [66].
3. Methodology
In this research, for measuring the factors of customer return, a questionnaire was used as the main data collection tool. The questionnaire included the questions related to the expectations of the customers and their ability to share information about their experience, both negative and positive. The subject of empirical research was consumer returns occurring in B2C relation both in stationary and online business on the Polish market. We convey our expectations regarding the relationship between the customer return experience and customer after purchase behavior in H1–3.
The selection of the sample was non-random, and the applied selection method was a quota selection. The quota selection was used due to the inability to obtain a sampling frame that would allow us to determine the exact number of units included in the general population (adult residents of Poland returning a product at least once in their life), and thus the procedure of drawing respondents for the sample; therefore, it was necessary to select non-probabilistically. Before starting the survey, it was assumed that demographic variables such as gender, place of residence, age and education are the features that can differentiate the respondents in terms of the obtained results. The amounts established before the survey reflected the demographic structure of the Polish population. The following gender and age amounts were used in the study:
- -
- 48% of male and 52% of female,
- -
- 60% of people aged 25 to 46.
The research process related to the collection of primary data consisted of two stages: pilot and proper studies. In each of them, questionnaire surveys were used to collect primary data. Surveys of anonymous nature were made by CAWI technique among individual customers from Poland on a sample 327 respondents in April and May 2018. Care was taken to ensure that the respondents had realized a return at least once. According to the Central Statistical Office, 38.434 million people lived in Poland at the time of the research. Non-stratified random sampling was used, as we considered it to be the most effective in terms of the effort-benefit ratio of the survey. Representativeness was tested additionally, with all variables finding a relatively good fit with the overall population. The sample copies relatively well the overall distribution of the population in terms of age, gender, place of residence, education, average net income and professional situation (Table 1).
The Chi-square test was used to analyze the differences. Two variables always entered this test, depending on which research questions we wanted to examine. Most of them were variables of nominal type, while we analyzed the numbers of all categories of answers. A contingency table was constructed from the responses, the observed values and expected values were compared, and the Pearson Chi-square and the p-value of Fisher’s exact test were calculated. If the p-value was less than 0.05, we considered the null hypothesis to be rejected and statistical significance between the variables was confirmed.
4. Analysis of Test Results
At this stage of the research, first of all, the willingness to make repeated purchases was examined in a situation where the return operation was not successful, e.g., it took too long or the store did not accept the return for various reasons. In order to better examine the motives leading to service recovery, we decided to use two positive options—one for positive contracts with the seller and the other for the offered value of purchase (good and price). Based on this, we were later able to explore in more depth the possibilities that can be regained by the customer (Figure 1).
42.2% of the respondents declared that they would not buy from a seller again because they were afraid that they would face the same situation. These consumers have lost trust to the seller. From the point of view of the store, this is the worst situation that can happen. One mistake cost the loss of a customer forever. 31.8% of respondents will come back and make new purchases, because previous positive contacts with the company stay in the memory for longer than one made mistake. 15.3% will return to the store due to the price or uniqueness of the goods offered by the store. It can be said that for these consumers a given company plays a monopoly role. 10.7% of the respondents had no opinion. This could be because they never had any trouble returning the goods or were not honest when filling out the survey.
In the analysis of the relationship between the willingness to purchase from the same seller after a failed return operation and sociodemographic variables, the chi-square test result showed a statistically significant relationship (p < 0.05) between the willingness to buy from the same seller after a failed return operation and net income of respondents. People with the highest (over PLN 4000) and the lowest (up to PLN 1000) monthly income were the least likely to indicate that they are not willing to buy again due to the fear that the unpleasant situation would repeat (Table 2).
The respondents with the lowest income are likely to have the least demands on the company. Often when shopping, these customers are only guided by the price offered by the store. If the price is right, such a customer will not go to the competition, but will stay with the seller because he has no choice. In the case of customers with higher incomes, the obtained result can be explained by the fact that such customers are much better educated, know the specifics of the offer and its quality, but are more price sensitive than occasional buyers. The customer with higher income also pays attention to the price and is also more devoted to the company, but this is not due to compulsion, as in the case of poorer customers, but from higher awareness and experience. A wealthier client can appreciate the relationship with the company and forgive the mistakes that have occurred.
Next, the relationship between the return operation and consumer behavior after purchase was investigated. Consumers were asked about the willingness to share their opinion with others in two situations: when they experienced a successful return operation and a one-time unsuccessful one.
As shown in Figure 2, almost half of the respondents declared that after a successful return operation, they would recommend the store to their friends. Of those, 22.3% will not only tell their close friends about it, but also write about it on social networks, and the message will reach a wider audience, 12.8% will be shared only in the case when someone asks for an opinion, and 8% of respondents will share their opinion only on the Internet. Only 4% of the respondents did not have an opinion, and for 3.1% the issue of returns is not worth attention at all.
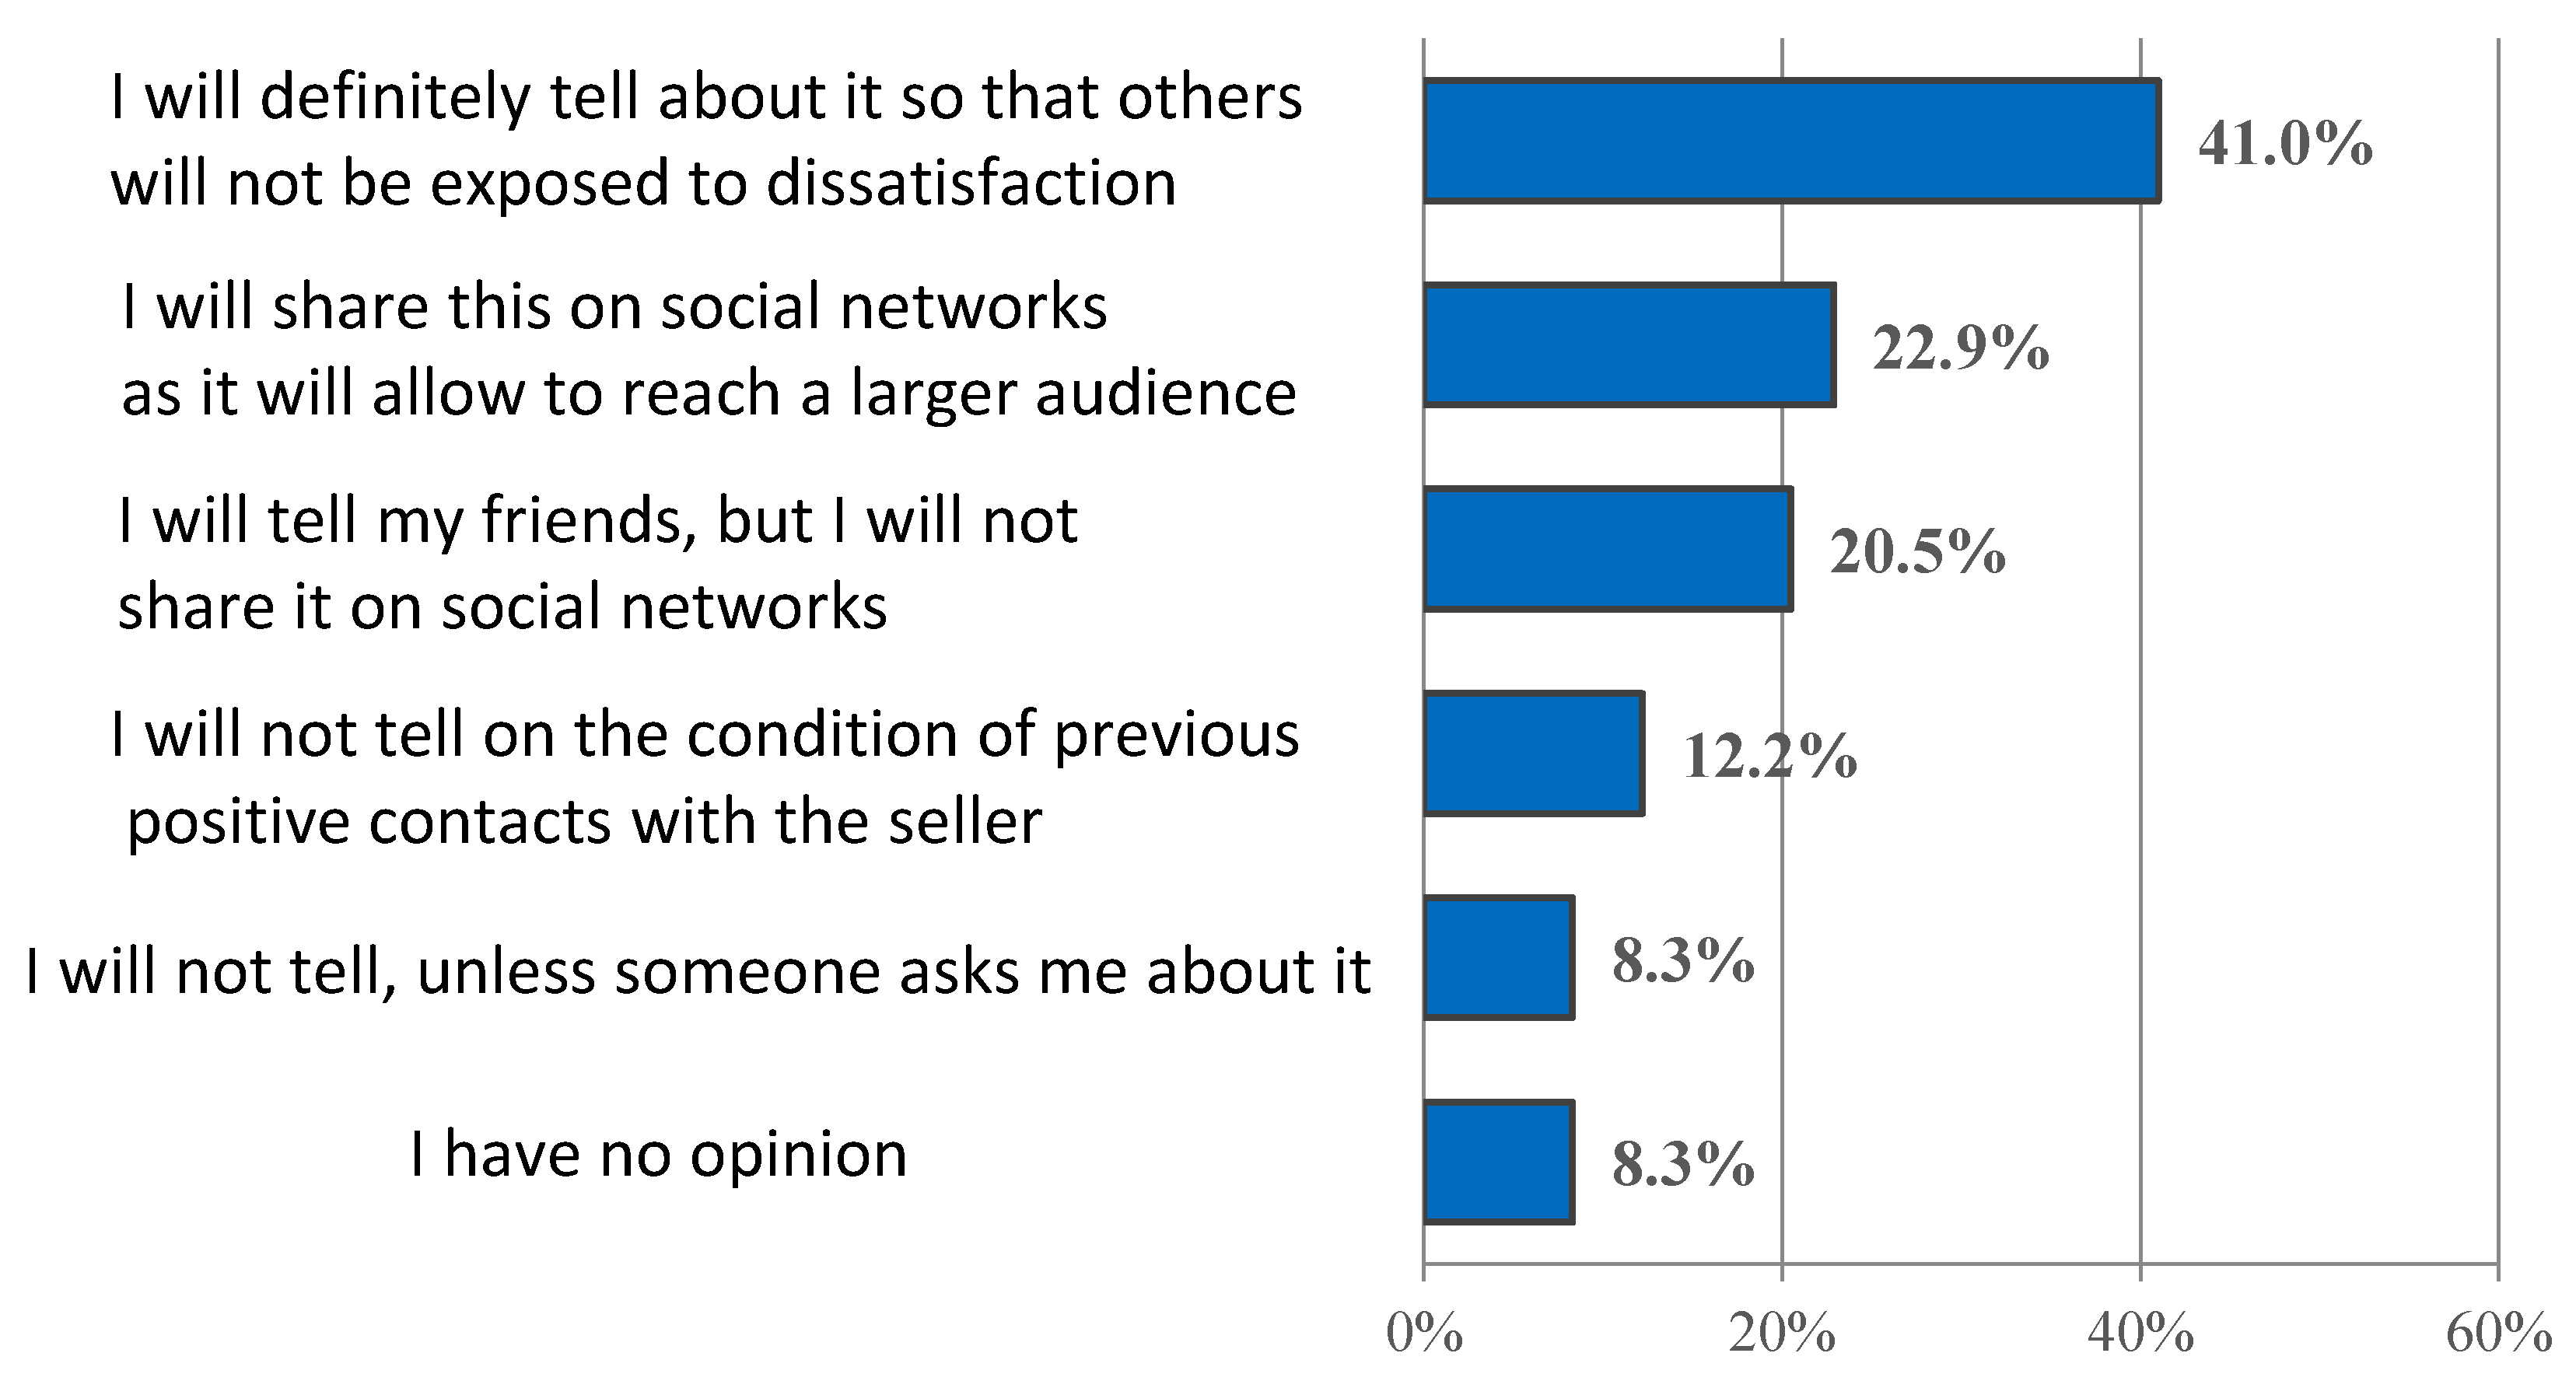
In response to a situation where a consumer had a failed one-time return operation (e.g., non-recognition of a return), 41% said they would definitely talk about it to warn others. Of the respondents, 22.9% will share their opinion on social networks in order to reach the largest possible audience, 20.5% will only tell their friends about it, and will not write on the Internet, 12.2% are the most loyal consumers because previous positive contacts with the seller are more valuable to them than one wrong return, 8.3% do not have an opinion and another 8.3% will not tell anyone about it, unless someone asks themselves (Figure 3).
Willingness not to share information with others about dissatisfaction with a one-time operation of return on the condition of previous positive contacts with the seller depended on age (Table 3). The oldest people chose this answer most often (19.1%), and it obtained the lowest percentage of responses in the youngest age category (4.9%). This may be due to the fact that young people are less attached to stores and brands, and forget the previous positive contacts. For elderly people, relationships with the company are the most important—if they are at a high level, these customers are more likely to forgive faster and not to share a negative opinion with their friends. This shows a very high level of loyalty.
5. Discussion
In discussion, it is worth saying that one mistake in the form of a faulty return operation on the part of the company can contribute to the loss of customers and deteriorate reputation in the eyes of both current and potential customers. Companies must take care of the customer and guarantee him the most pro-consumer return policy [67]. Consumers may return a product for a variety of reasons, such as the product having the wrong color or size, having poor functionality, being damaged during shipment or simply prompting regret for an impulsive purchase. Retailers generally provide lenient return policies not only because they may signal high quality but also because they act as risk relievers for consumers’ purchasing decision processes [68]. It’s easier than ever for customers to publicly share their experiences, because of the Internet. If something does not go well for the consumer, he quickly shares it with other network users [69]. It is very important that the client also shares positive experiences from cooperation with the company online. Companies must take this into account and try to use it to their advantage. For example, if for any reason the customer is not satisfied with the course of the return operation, the company must surprise him with some positive experience. This could be an apology email or a discount on subsequent purchases, or free shipping. It takes 12 positive experiences to repair the damage caused by a single unresolved negative one [70]. During a crisis situation, the client expects empathy and quick response from the company, because the high level of customer service is directly related to the qualifications and the use of empathy by the staff towards the consumer.
An overview of the relationship between the return process and customer perception of this process and the customers’ ability to share their experience, both negative and positive, made it possible to identify more new information. In this section, the above conclusions will be summarized.
Hypothesis 1 (the customer will not purchase again after a bad return experience) was confirmed on the basis of empirical research. Dissatisfaction with the return and complaint processing is closely related with the willingness to buy again. Firms must try to change the minds of the first group of customers—those who have lost faith in the company and are dissatisfied with its services. This is the basis for building effective customer service. A crisis situation should be treated as an opportunity to gain a loyal customer. Of the respondents, 42.2% declared that they would not buy from a seller again because they were afraid that they would face the same situation. This is a very large group of potential customers who expect the company to apologize, sometimes to compensate or simply to send a friendly e-mail. Along with the apology, there should also be an explanation of the situation. Merely “sorry” is not enough until the customer finds the real cause of the error.
Hypothesis 2 (the customer will recommend the store to his friends after a successful return operation) was confirmed on the basis of empirical research. It can be said that as many as 80.1% of respondents are loyal customers who are willing to recommend the store to their friends. These customers are able to risk their own reputation by recommending a particular seller. They became brand ambassadors. This is also confirmed by the e-commerce management platform Narvar [71]. According to a recent survey 95% of online shoppers polled said they would shop again with a retailer that provided a satisfactory return experience. Also, 82% of the survey participants who had already returned an item to a retailer confirmed they were repeat shoppers of the store. If retailers can meet customers high expectations, they can use returns to improve customer satisfaction, inspire loyalty and achieve a competitive advantage.
Hypothesis 3 (the customer will definitely share information with friends and write a negative opinion on social media after a bad return experience) was confirmed on the basis of empirical research. Dissatisfaction with the return and complaint processing is closely related with the willingness to share their opinion. After an unsuccessful return or complaint operation, most customers (84.4%) will tell their friends about it, and half of them will write about it on social media. Moreover, 63.9% will share with others information about dissatisfaction with a one-time return operation using social media. So, the client, both satisfied and dissatisfied, tends to convey his opinion to other potential clients, but the greater percentage is in the case of satisfied people.
5.1. Finding and Implications
The findings of the study have a range of implications for practitioners, policy makers and managers. Retailers can use this information to structure their returns policies, interactions and processes to better meet and exceed customer expectations. Moreover, it can be helpful for entrepreneurs to improve their after-sales service. The presented knowledge is necessary for a better understanding of customer behavior after a return process. The presented conclusions enrich the theoretical understanding of customer behavior and their purchase intention. It also offers retailers a quantitative benchmark and new perspective on the design of return policy in order to improve customer satisfaction.
5.2. Limitations and Future Research
As with other studies of this type, the findings and implications are limited because of the research design and methods employed. However, these limitations also indicate potential avenues of future research. There are many challenges to conducting research in the area of customers satisfaction and loyalty in terms of returns. The topic is dynamic and multidisciplinary, and it requires different points of view. Although some future directions of research can be related to understanding of different customer profiles who make returns, under what circumstances and also the reasons for their returns. A similar study can be done on a wider research sample by questioning respondents from different countries, analyzing the behavior of different customers with different mentality.
6. Conclusions
Satisfaction does not determine loyalty, but it is a necessary condition for its occurrence. The difference between a loyal and simply satisfied customer is that a loyal customer is able to risk his reputation by recommending an offer to others, actively participates in the life of the company and cares about the best results of its activities. Companies need to know that changing the approach to a more consumer-friendly one and investing in logistics systems is the best way to achieve a competitive advantage. In this case, it is worth analyzing all return flows in the company and trying to manage them efficiently. Managing consumer returns has a direct impact on customer satisfaction, because the cheaper and faster the return and complaint operation is, the more likely the customer will appreciate it and use it as an incentive to make further purchases.
Considering the relationship between the return experience and the willingness to share opinion with others, the following results were obtained. The majority of respondents declared that they will not make repeat purchases after experiencing an unsuccessful operation returns or complaints. Moreover, after an unsuccessful return or complaint operation, most customers will tell their friends about it, and half of them will write about it on social media. Similar results were obtained for a successful return or complaint operation—most customers will share this with their friends. This study suggests that the client, both satisfied and dissatisfied, tends to share his opinion about returns with other potential clients.
In times of full enterprises orientation to meet customer requirements, it is necessary to improve the logistic forms of customer service and enable them to freely return the purchased goods. On the other hand, entrepreneurs must understand that current and future generations expect them to increasingly implement sustainable solutions in their supply chains. Therefore, managers must develop new management methods and invest in campaigns leading to increased environmental awareness of customers and external stakeholders. Nowadays it is a great challenge for managers to reconcile the challenges posed by advancing globalization, business ethics and the desire to gain a competitive advantage. The key to developing effective business models is the integration of economic, environmental and social considerations. However, the biggest challenge will be to convince consumers that their conscious purchasing decisions have a great impact on shaping the SSCM strategy. Customers need to understand that their mistakes and comfort degrade the environment. Customers need to understand that their errors or convenience affects and stimulates the degradation of the environment.
Author Contributions
Conceptualization, K.L.-R.; methodology, K.L.-R.; formal analysis, K.L.-R.; data curation, K.L.-R.; writing—original draft preparation, K.L.-R., D.Z.; writing—review and editing, K.L.-R.; visualization, K.L.-R., D.Z.; supervision, K.L.-R.; project administration, K.L.-R.; funding acquisition, K.L.-R. All authors have read and agreed to the published version of the manuscript.
Funding
This research received no external funding.
Conflicts of Interest
The authors declare no conflict of interest.
References
- Chkanikova, O.; Sroufe, R. Third-party sustainability certifications in food retailing: Certification design from a sustainable supply chain management perspective. J. Clean. Prod. 2020, 124344. [Google Scholar] [CrossRef]
- Zimon, D.; Tyan, J.; Sroufe, R. Drivers of sustainable supply chain management: Practices to alignement with un sustainable development goals. Int. J. Qual. Res. 2020, 14, 219–236. [Google Scholar] [CrossRef]
- Kros, J.F.; Falasca, M.; Dellana, S.; Rowe, W.J. Mitigating counterfeit risk in the supply chain: An empirical study. TQM J. 2020. [Google Scholar] [CrossRef]
- Roy, V.; Schoenherr, T.; Charan, P. The thematic landscape of literature in sustainable supply chain management (SSCM): A review of the principal facets in SSCM development. Int. J. Oper. Prod. Manag. 2018, 38, 1091–1124. [Google Scholar]
- Reefke, H.; Ahmed, M.D.; Sundaram, D. Sustainable supply chain management—Decision making and support: The SSCM maturity model and system. Glob. Bus. Rev. 2014, 15, 1–12. [Google Scholar] [CrossRef] [Green Version]
- Cavaliere, A.; Pigliafreddo, S.; De Marchi, E.; Banterle, A. Do Consumers Really Want to Reduce Plastic Usage? Exploring the Determinants of Plastic Avoidance in Food-Related Consumption Decisions. Sustainability 2020, 12, 9627. [Google Scholar] [CrossRef]
- Hill, J.; Lee, H. Young Generation Y consumers’ perceptions of sustainability in the apparel industry. J. Fash. Mark. Manag. 2012, 16, 477–491. [Google Scholar] [CrossRef]
- Zimon, D.; Madzik, P.; Sroufe, R. The Influence of ISO 9001 & ISO 14001 on Sustainable Supply Chain Management in the Textile Industry. Sustainability 2020, 12, 4282. [Google Scholar]
- Baliga, R.; Raut, R.; Kamble, S. The effect of motivators, supply, and lean management on sustainable supply chain management practices and performance: Systematic literature review and modeling. Benchmarking Int. J. 2019, 27, 347–381. [Google Scholar] [CrossRef]
- Panigrahi, S.S.; Bahinipati, B.; Jain, V. Sustainable supply chain management: A review of literature and implications for future research. Manag. Environ. Qual. 2019, 30, 1001–1049. [Google Scholar] [CrossRef]
- Petersen, J.A.; Kumar, V. Can Product Returns Make You Money? MIT Sloan Manag. Rev. 2010, 51, 85. [Google Scholar]
- Baiman, S.; Fischer, P.E.; Rajan, M.V. Information, contracting, and quality costs. Manag. Sci. 2000, 46, 776–789. [Google Scholar] [CrossRef]
- Wood, S.L. Remote Purchase Environments: The Influence of Return Policy Leniency on Two-Stage Decision Processes. J. Mark. Res. 2001, 38, 157–169. [Google Scholar] [CrossRef]
- Wang, X. Retail Return Policy, Endowment Effect, and Consumption Propensity: An Experimental Study. BE J. Econ. Anal. Policy 2009, 9, 38. [Google Scholar] [CrossRef]
- Harris, L.C. Fradulent return proclivity: An empirical analysis. J. Retail. 2008, 84, 461–476. [Google Scholar] [CrossRef]
- Anderson, E.T.; Hansen, K. The option value of returns: Theory and empirical evidence. Mark. Sci. 2009, 28, 405–423. [Google Scholar] [CrossRef] [Green Version]
- Chen, B.; Chen, J. When to introduce an online channel, and offer money back guarantees and personalized pricing? Eur. J. Oper. Res. 2017, 257, 614–624. [Google Scholar] [CrossRef]
- Yan, R. Product categories, returns policy and pricing strategy for e-marketers. J. Prod. Brand Manag. 2009, 18, 452–460. [Google Scholar] [CrossRef]
- Stock, J.R. The 7 Deadly Sins of Reverse Logistics. Mater. Handl. Manag. 2001, 56, 5. [Google Scholar]
- Zhang, R.; Li, J.; Huang, Z.S.; Liu, B. Return strategies and online product customization in a dual-channel supply chain. Sustainability 2019, 11, 3482. [Google Scholar] [CrossRef] [Green Version]
- Janakiraman, N.; Syrdal, H.A.; Ryan Freling, F. The Effect of Return Policy Leniency on Consumer Purchase and Return Decisions: A Meta-analytic Review. J. Retail. 2016, 92, 226–235. [Google Scholar] [CrossRef]
- Janakiraman, N.; Ordónez, L. Effect of Effort and Deadlines on Consumer Product Returns. J. Consum. Psychol. 2012, 22, 260–271. [Google Scholar] [CrossRef]
- Davis, S.; Gerstner, E.; Hagerty, M. Money back guarantees in retailing: Matching products to consumers Tastes. J. Retail. 1995, 71, 7–22. [Google Scholar] [CrossRef]
- Feng, Z.; Xiao, T.; Yu, Y.; Robb, D.J. Quality disclosure strategy in a decentralized supply chain with consumer returns. Int. Trans. Oper. Res. 2020, 27, 2139–2156. [Google Scholar] [CrossRef]
- Bahn, K.D.; Boyd, E. Information and its impact on consumers’ reactions to restrictive return policies. J. Retail. Consum. Serv. 2014, 21, 415–423. [Google Scholar] [CrossRef]
- Johnson, M.D.; Fornell, C. A Framework for Comparing Customer Satisfaction Across Individuals and Product Categories. J. Econ. Psychol. 1991, 12, 267–286. [Google Scholar] [CrossRef] [Green Version]
- Zeithaml, V.; Berry, L.; Parasuraman, A. The behavioral consequences of service quality. J. Mark. 1996, 60, 31–46. [Google Scholar] [CrossRef]
- Reynolds, K.; Arnold, M. Customer loyalty to the salesperson and the store: Examining relationship customers in an upscale retail context. J. Pers. Sell. Sales Manag. 2000, 20, 89–97. [Google Scholar]
- Fitzell, P. The Explosive Growth of Private Labels in North America; Exclusive Brands Llc.: Livonia, MI, USA, 1998. [Google Scholar]
- Fornell, C. A National Customer Satisfaction Barometer: The Swedish Experience. J. Mark. 1992, 56, 6–21. [Google Scholar] [CrossRef]
- Pong, L.T.; Yee, P.T. An Integrated Model of Service Loyalty; Academy of Business & Administrative Sciences International Conferences: Brussels, Belgium, 2001. [Google Scholar]
- Deming, W. Out of the Crisis; Cambridge University Press: Cambridge, UK, 1986; pp. 34–36. [Google Scholar]
- Griffin, J. Customer Loyalty: How To Earn It, How To Keep It; Jossey-Bass Publishers: San Francisco, CA, USA, 1997; pp. 213–220. [Google Scholar]
- Kandampully, J. Service Quality to Service Loyalty: A Relationship Which Goes Beyond Customer Services. Total Qual. Manag. 1998, 9, 431–443. [Google Scholar] [CrossRef]
- Oliver, R.L. Whence Consumer Loyalty? J. Mark. 1999, 63, 33–44. [Google Scholar] [CrossRef]
- Barlow, J.; Møller, C. A Complaint is a Gift. Recovering Customer Loyalty when Things Go Wrong; Berrett-Koehler Publishers: Oakland, CA, USA, 2008. [Google Scholar]
- Woźniak, J. Identification of Mass Event Customers and Factors Exerting Influence upon their Satisfactionwith Participation in an Event. Qual. Access Success 2019, 20, 22–26. [Google Scholar]
- Wei, A.-P.; Peng, C.L.; Huang, H.C.; Yeh, S.P. Effects of corporate social responsibility on firm performance: Does customer satisfaction matter? Sustainability 2020, 12, 7545. [Google Scholar] [CrossRef]
- Vaz, C. Some Reasons to Implement Reverse Logistics on Companies. Int. J. Environ. Technol. Manag. 2013, 16, 467–479. [Google Scholar] [CrossRef] [Green Version]
- The Corporate Executive Board Company. An Excerpt from Shifting the Loyalty Curve Mitigating Disloyalty by Reducing Customer Effort; The Corporate Executive Board Company: Arlington, VA, USA, 2009; pp. 7–12. [Google Scholar]
- Stum, D.; Thiry, A. Building Customer Loyalty. Train. Dev. J. 1991, 45, 34–36. [Google Scholar]
- Krishna, G.; Dangayach, S. Sharma, Service Recovery Paradox: The Success Parameters. Glob. Bus. Rev. 2014, 15, 263. [Google Scholar] [CrossRef]
- Naoui, F. Customer service in supply chain management: A case study. J. Enterp. Inf. Manag. 2014, 27, 786–801. [Google Scholar] [CrossRef]
- Korpela, J.; Lehmusvaara, A.; Tuominen, M. Customer service based design of the supply chain. Int. J. Prod. Econ. 2001, 69, 193–204. [Google Scholar] [CrossRef]
- Wong, C.W.Y.; Lai, K.; Cheng, T.C.E.; Lun, Y.H.V. The role of IT-enabled collaborative decision making in inter-organizational information integration to improve customer service performance. Int. J. Prod. Econ. 2015, 159, 56–65. [Google Scholar] [CrossRef]
- Su, X.; Zhang, F. Strategic customer behavior, commitment, and supply chain performance. Manag. Sci. 2008, 54, 1759–1773. [Google Scholar] [CrossRef] [Green Version]
- Madzík, P.; Pelantová, V. Validation of product quality through graphical interpretation of the Kano model: An explorative study. Int. J. Qual. Reliab. Manag. 2018, 35, 1956–1975. [Google Scholar] [CrossRef]
- Madzík, P. Increasing accuracy of the Kano model–a case study. Total Qual. Manag. Bus. Excell. 2018, 29, 387–409. [Google Scholar] [CrossRef]
- Cho, D.W.; Lee, Y.H.; Ahn, S.H.; Hwang, M.K. A framework for measuring the performance of service supply chain management. Comput. Ind. Eng. 2012, 62, 801–818. [Google Scholar] [CrossRef]
- Yan, B.; Chen, X.; Cai, C.; Guan, S. Supply chain coordination of fresh agricultural products based on consumer behavior. Comput. Oper. Res. 2020, 123, 105038. [Google Scholar] [CrossRef]
- Sharma, A.; Lambert, D.M. Segmentation of Markets Based on Customer Service. Int. J. Phys. Distrib. Logist. Manag. 1994, 24, 50–58. [Google Scholar] [CrossRef]
- Yan, B.; Chen, Y.-R.; Zhou, X.-T.; Fang, J. Consumer behavior in the omni-channel supply chain under social networking services. Ind. Manag. Data Syst. 2019, 119, 1785–1801. [Google Scholar] [CrossRef]
- Gajewska, T.; Zimon, D.; Kaczor, G.; Madzík, P. The impact of the level of customer satisfaction on the quality of e-commerce services. Int. J. Prod. Perform. Manag. 2019, 69, 666–684. [Google Scholar] [CrossRef]
- Su, X. Consumer returns policies and supply chain performance. Manuf. Serv. Oper. Manag. 2009, 11, 595–612. [Google Scholar] [CrossRef] [Green Version]
- Woźniak, J.; Fill, K. Logistic organization of mass events in the light of SWOT analysis-case study. TEM J. 2018, 7, 105. [Google Scholar]
- Zimon, D.; Madzik, P.; Sroufe, R. Management systems and improving supply chain processes: Perspectives of focal companies and logistics service providers. Int. J. Retail Distrib. Manag. 2020, 48, 939–961. [Google Scholar] [CrossRef]
- Xiao, T.; Shi, J. Consumer returns reduction and information revelation mechanism for a supply chain. Ann. Oper. Res. 2016, 240, 661–681. [Google Scholar] [CrossRef]
- Cardoni, A.; Dumay, J.; Palmaccio, M.; Celenza, D. Knowledge transfer in a start-up craft brewery. Bus. Process. Manag. J. 2019, 25, 219–243. [Google Scholar] [CrossRef]
- Xu, L.; Li, Y.; Govindan, K.; Xu, X. Consumer returns policies with endogenous deadline and supply chain coordination. Eur. J. Oper. Res. 2015, 242, 88–99. [Google Scholar] [CrossRef]
- Blumberg, D.F. Introduction to Management of Reverse Logistics and Closed Loop Supply Chain Processes; CRC Press: Boca Raton, FL, USA, 2005. [Google Scholar]
- Barratt, E.S. Impulsivity: Integrating Cognitive, Behavioral, Biological, and Environmental Data. In The Impulsive Client: Theory, Research, and Treatment; American Psychological Association (APA): Worcester, MA, USA, 1993; pp. 39–56. [Google Scholar]
- Bernon, M.; Cullen, J.; Gorst, J. Online retail returns management: Integration within an omni-channel distribution context. Int. J. Phys. Distrib. Logist. Manag. 2016, 46, 584–605. [Google Scholar] [CrossRef]
- Greatorex, M.; Mitchell, V.W. Modelling Consumer RiskReduction Preferences from Perceived Loss Data. J. Econ. Psychol. 1994, 15, 669–685. [Google Scholar] [CrossRef]
- Sharma, A.; Grewal, D.; Levy, M. Customer satisfaction/logistics interface. J. Bus. Logist. 1995, 16, 14–21. [Google Scholar]
- Zhang, Q.; Vonderembse, M.A.; Lim, J. Logistics flexibility and its impact on customer satisfaction. Int. J. Logist. Manag. 2005, 16, 71–95. [Google Scholar] [CrossRef]
- Subramanian, K.R. The connection between your employees and customers. J. Adv. Res. Bus. Manag. Account. 2018, 4, 1–14. [Google Scholar]
- Rokonuzzaman, M.; Mukherjee, A.; Iyer, P.; Mukherjee, A. Relationship between retailers’ return policies and consumer ratings. J. Serv. Mark. 2020, 35, 621–633. [Google Scholar] [CrossRef]
- Ülkü, M.A.; Gürler, Ü. The impact of abusing return policies: A newsvendor model with opportunistic consumers. Int. J. Prod. Econ. 2018, 203, 124–133. [Google Scholar] [CrossRef]
- Rokonuzzaman, M.; Iyer, P.; Harun, A. Return policy, No joke: An investigation into the impact of a retailer’s return policy on consumers’ decision making. J. Retail. Consum. Serv. 2020, 102346. [Google Scholar] [CrossRef]
- Newell-Legner, R. Understanding Customers. Available online: http://ww2.glance.net/wp-content/uploads/2015/07/Counting-the-customer_-Glance_eBook-4.pdf (accessed on 10 December 2020).
- Narvar. Narvar Consumer Report. 2017. Available online: https://see.narvar.com/rs/249-TEC-877/images/Narvar_Consumer_Survey_ (accessed on 10 December 2020).
Figure 1.
Willingness to make a purchase from the same seller after an unsuccessful return operation. n = 327.
Figure 1.
Willingness to make a purchase from the same seller after an unsuccessful return operation. n = 327.
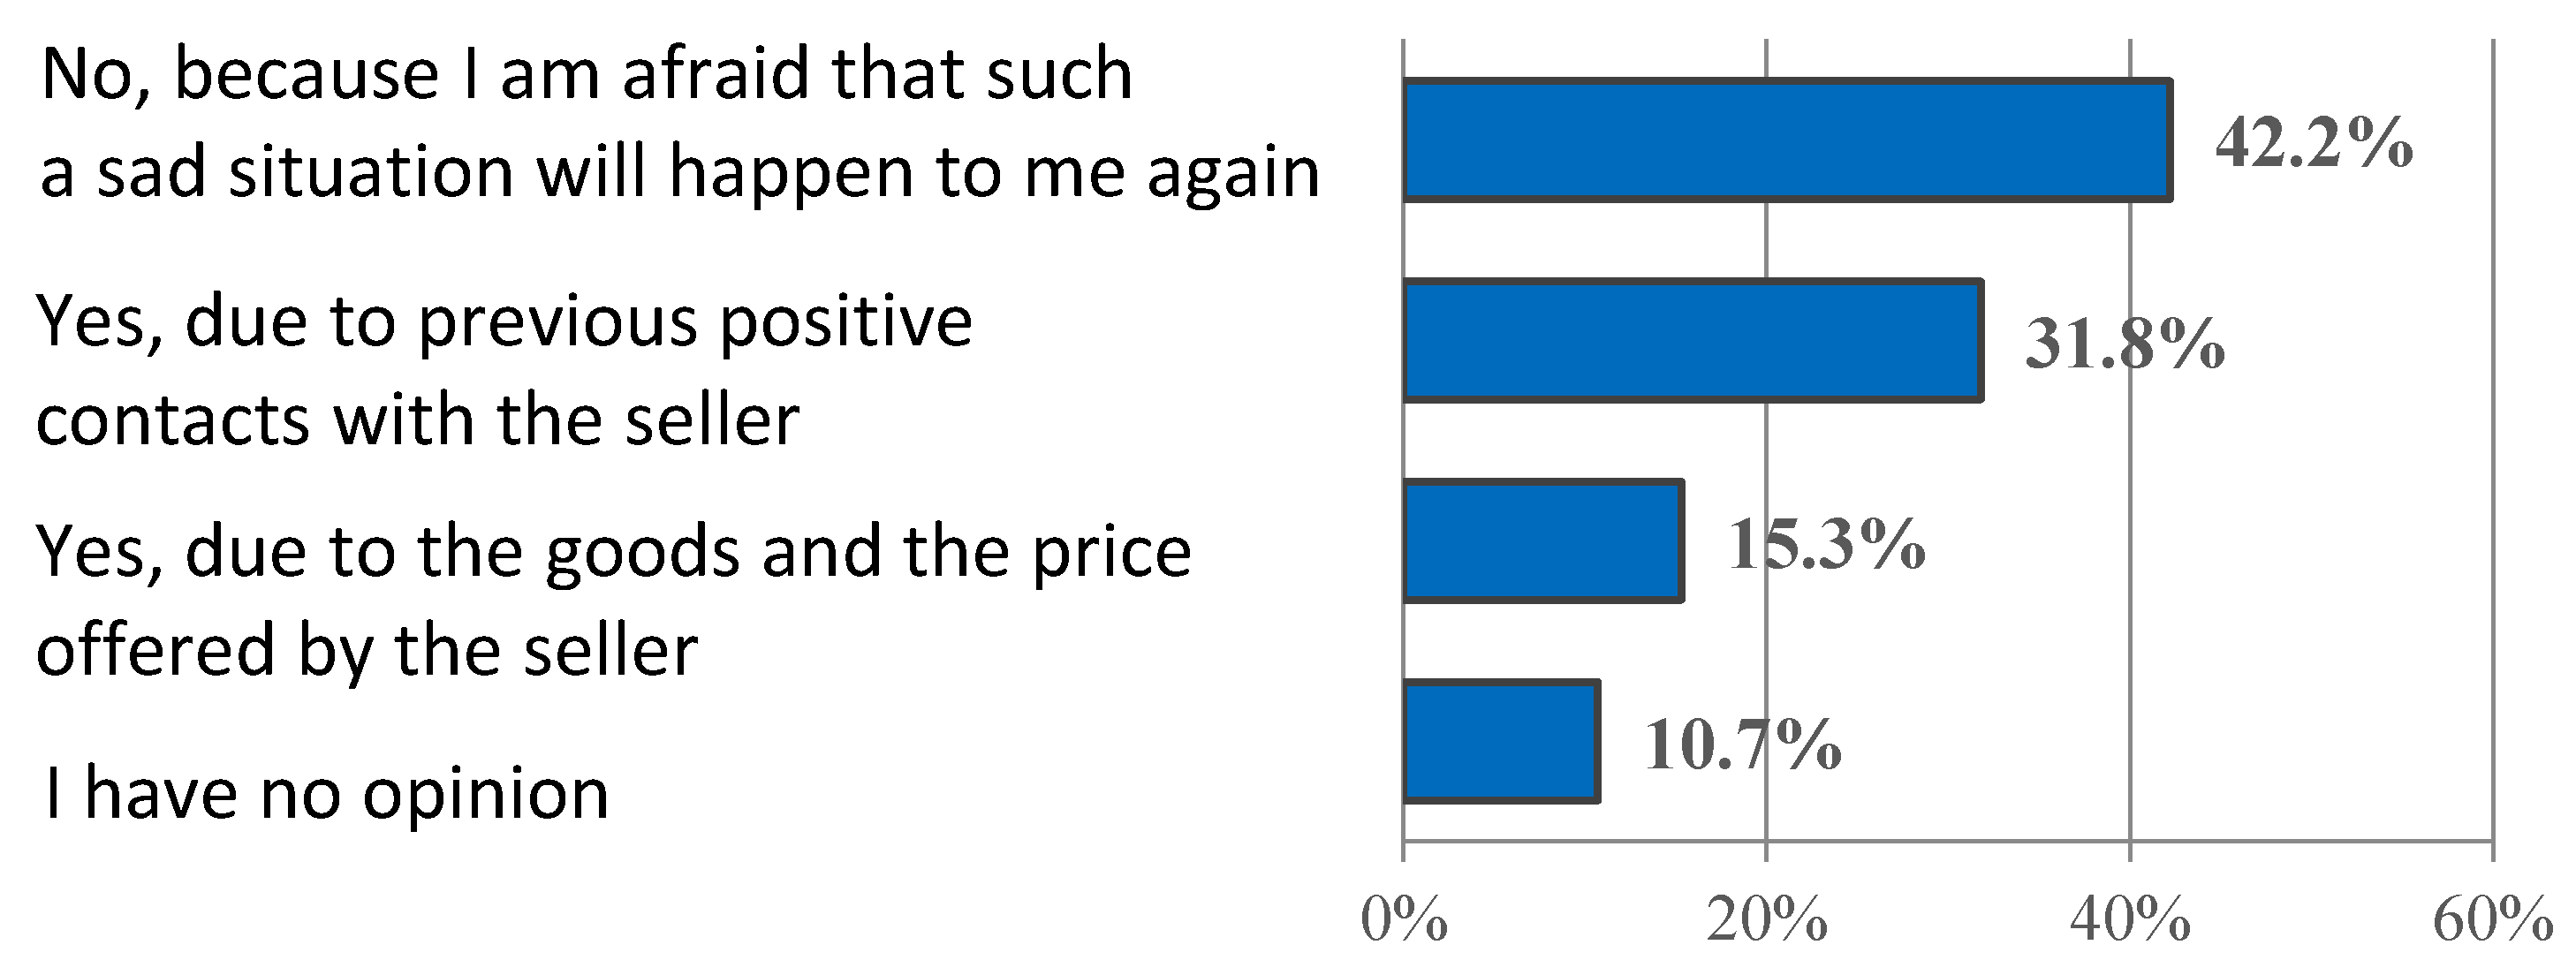
Figure 2.
Willingness to recommend a shop to friends after a successful return operation.
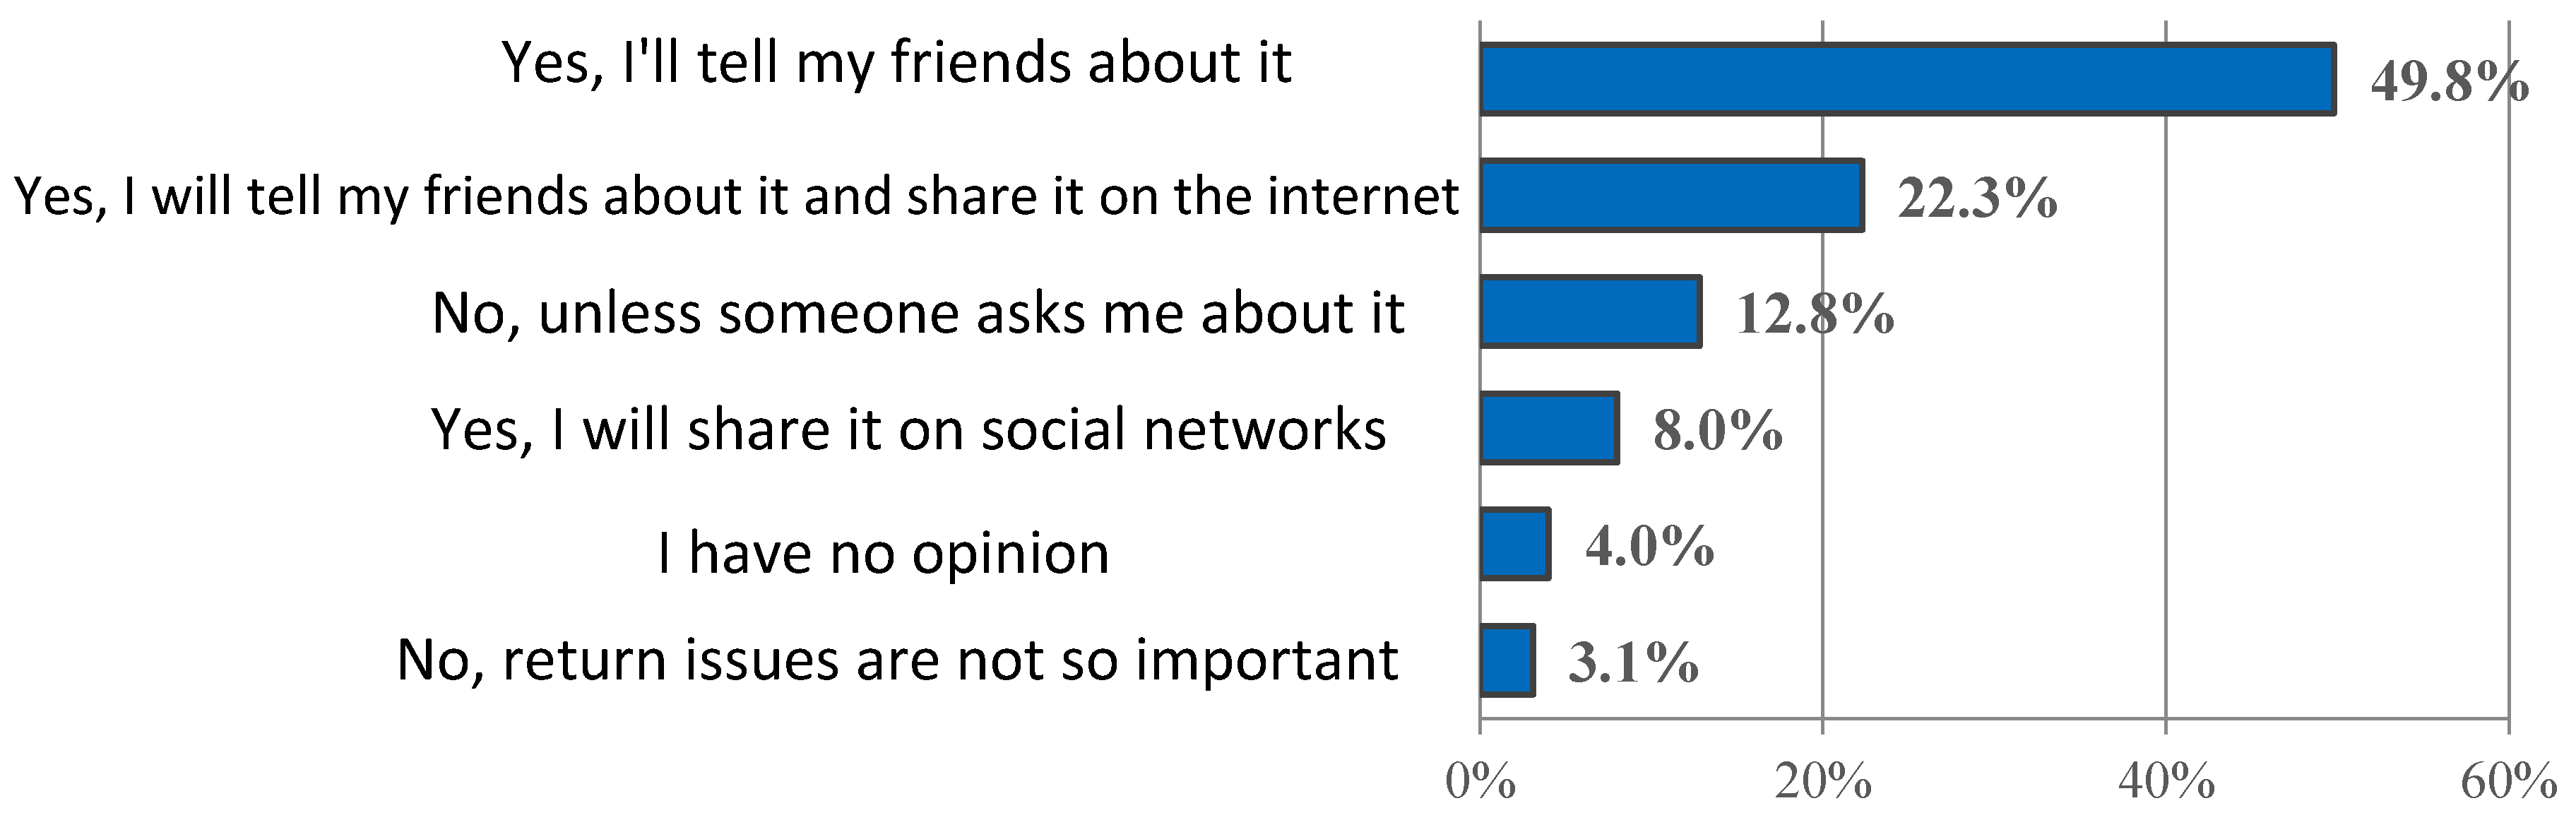
Figure 3.
Willingness to share with others information about dissatisfaction and the age of the respondents.
Figure 3.
Willingness to share with others information about dissatisfaction and the age of the respondents.


Table 1.
Sample profile.
| Question: | n | % |
|---|---|---|
| Age: | ||
| up to 25 years | 41 | 12.5% |
| 26–45 years | 128 | 39.1% |
| 46–60 years | 48 | 14.7% |
| over 60 years old | 110 | 33.6% |
| Sex: | ||
| female | 162 | 49.5% |
| male | 165 | 50.5% |
| Place of residence: | ||
| village | 125 | 38.2% |
| city up to 50,000 | 47 | 14.4% |
| city 50,000–150,000 | 42 | 12.8% |
| city 150,000–500,000 | 46 | 14.1% |
| city with over 500,000 | 67 | 20.5% |
| Education: | ||
| basic | 5 | 1.5% |
| professional | 17 | 5.2% |
| technical secondary | 82 | 25.1% |
| general secondary education | 93 | 28.4% |
| higher | 130 | 39.8% |
| Average net income: | ||
| Up to PLN 1000 | 23 | 7.0% |
| PLN 1001–2000 | 98 | 30.0% |
| PLN 2001–3000 | 93 | 28.4% |
| PLN 3001–4000 | 60 | 18.3% |
| over PLN 4000 | 53 | 16.2% |
| Professional situation: | ||
| unemployed | 30 | 9.2% |
| student | 21 | 6.4% |
| have own business | 12 | 3.7% |
| employed in a company/institution | 147 | 45.0% |
| pensioner | 117 | 35.8% |
| n = 327 | ||
Table 2.
The willingness to make a purchase from the same seller after a failed return operation broken down into the average net income of respondents per person in the household.
Table 2.
The willingness to make a purchase from the same seller after a failed return operation broken down into the average net income of respondents per person in the household.
| Answer | Up to PLN 1000 [n = 23] | PLN 1001–2000 [n = 98] | PLN 2001–3000 [n = 93] | PLN 3001–3000 [n = 60] | Over PLN 4000 [n = 53] |
|---|---|---|---|---|---|
| yes, due to the goods and the price offered by the seller | 13.0% | 17.4% | 9.7% | 21.7% | 15.1% |
| yes, due to previous positive contacts with the seller | 39.1% | 21.4% | 34.4% | 31.7% | 43.4% |
| no, because I am afraid that such a sad situation will happen to me again | 30.4% | 44.9% | 49.5% | 41.7% | 30.2% |
| I have no opinion | 17.4% | 16.3% | 6.5% | 5.0% | 11.3% |
| in total | 100.0% | 100.0% | 100.0% | 100.0% | 100.0% |
| Statistical significance | χ2 = 21.174185, df = 12, p = 0.047887 | ||||
n = 327.
Table 3.
Willingness to share with others information about dissatisfaction with a one-time operation of return, broken down by age of respondents.
Table 3.
Willingness to share with others information about dissatisfaction with a one-time operation of return, broken down by age of respondents.
| Answer | Up to 25 Years [n = 41] | 26–45 Years [n = 128] | 46–60 Years [n = 48] | Over 60 Years Old [n = 110] | Statistical Significance |
|---|---|---|---|---|---|
| I will definitely tell about it so that others will not be exposed to dissatisfaction | 34.2% | 40.6% | 37.5% | 45.5% | χ2 = 1.949238 df = 3 p = 0.583009 |
| I will share this on social networks as it will allow to reach a larger audience | 19.5% | 21.9% | 35.4% | 20.0% | χ2 = 5.119999 df = 3 p = 0.163218 |
| I will tell my friends, but I will not share it on social networks | 26.8% | 21.9% | 20.8% | 16.4% | χ2 = 2.315232 df = 3 p = 0.509609 |
| I will not tell on the condition of previous positive contacts with the seller | 4.9% | 8.6% | 12.5% | 19.1% | χ2 = 8.466746 df = 3 p = 0.037289 |
| I will not tell, unless someone asks me about it | 14.6% | 8.6% | 4.2% | 7.3% | – |
| I have no opinion | 9.8% | 11.7% | 4.2% | 5.5% | – |
n = 327, the data do not add up to 100%, because the respondents had the option to choose more than 1 answer.
Publisher’s Note: MDPI stays neutral with regard to jurisdictional claims in published maps and institutional affiliations. |
© 2021 by the authors. Licensee MDPI, Basel, Switzerland. This article is an open access article distributed under the terms and conditions of the Creative Commons Attribution (CC BY) license (http://creativecommons.org/licenses/by/4.0/).
Share and Cite
MDPI and ACS Style
Lysenko-Ryba, K.; Zimon, D. Customer Behavioral Reactions to Negative Experiences during the Product Return. Sustainability 2021, 13, 448. https://0-doi-org.brum.beds.ac.uk/10.3390/su13020448
AMA Style
Lysenko-Ryba K, Zimon D. Customer Behavioral Reactions to Negative Experiences during the Product Return. Sustainability. 2021; 13(2):448. https://0-doi-org.brum.beds.ac.uk/10.3390/su13020448
Chicago/Turabian StyleLysenko-Ryba, Kateryna, and Dominik Zimon. 2021. "Customer Behavioral Reactions to Negative Experiences during the Product Return" Sustainability 13, no. 2: 448. https://0-doi-org.brum.beds.ac.uk/10.3390/su13020448
Note that from the first issue of 2016, this journal uses article numbers instead of page numbers. See further details here.