Identification of Soil Heavy Metal Sources in a Large-Scale Area Affected by Industry


1
Institute of Soil and Solid Waste Environment, Chinese Research Academy of Environmental Sciences, Beijing 100012, China
2
Technical Centre for Soil, Agricultural and Rural Ecology and Environment, Ministry of Ecology and Environment, Beijing 100012, China
3
School of Information and Communication Engineering, Beijing Information Science and Technology University, Beijing 100101, China
*
Author to whom correspondence should be addressed.
Sustainability 2021, 13(2), 511; https://0-doi-org.brum.beds.ac.uk/10.3390/su13020511
Submission received: 17 December 2020
/
Revised: 2 January 2021
/
Accepted: 4 January 2021
/
Published: 7 January 2021
(This article belongs to the Collection Risk Assessment and Management)
Abstract
:Heavy metals (HMs) in soil are some of the most serious pollutants due to their toxicity and nonbiodegradability. Especially across large-scale areas affected by industry, the complexity of pollution sources has attracted extensive attention. In this study, an approach based on zoning to analyze the sources of heavy metals in soil was proposed. Qualitative identification of pollution sources and quantification of their contributions to heavy metals in soil are key approaches in the prevention and control of heavy metal pollution. The concentrations of five HMs (Cd, Hg, As, Pb and Cr) in the surface soil of the Chenzhou industrial impact area were the research objects. Multiple methods were used for source identification, including positive matrix factorization (PMF) analysis combined with multiple other analyses, including random forest modeling, the geo-accumulation index method and hot spot analysis. The results showed that the average concentrations of the five heavy metals were 9.46, 2.36, 2.22, 3.27 and 1.05 times the background values in Hunan soil, respectively. Cd was associated with moderately to strongly polluted conditions, Hg, As and Pb were associated with unpolluted to moderately polluted conditions and Cr was associated with practically unpolluted conditions. The mining industry was the most significant anthropogenic factor affecting the content of Cd, Pb and As in the whole area, with contribution rates of 87.7%, 88.5% and 62.5%, respectively, and the main influence area was within 5 km from the mining site. In addition, we conducted hot spot analysis on key polluting enterprises and identified hot spots, cold spots, and areas insignificantly affected by enterprises, used this information as the basis for zoning treatment and discussed the sources of heavy metals in the three subregions. The results showed that Cd originated mainly from agricultural activities, with a contribution rate of 63.6%, in zone 3. As originated mainly from sewage irrigation, with a contribution rate of 65.0%, in zone 2, and the main influence area was within 800 m from the river. This element originated mainly from soil parent materials, with a contribution rate of 69.7%, in zone 3. Pb mainly originated from traffic emissions, with a contribution rate of 72.8%, in zone 3, and the main influence area was within 500 m from the traffic trunk line. Hg was mainly derived from soil parent materials with a contribution rate of 92.1% in zone 1, from agricultural activities with a contribution rate of 77.5% in zone 2, and from a mixture of natural and agricultural sources with a contribution rate of 74.2% in zone 3. Cr was mainly derived from the soil parent materials in the whole area, with a contribution rate of 90.7%. The study showed that in large-scale industrial influence areas, the results of heavy metal source analysis can become more accurate and detailed by incorporating regional treatment, and more reasonable suggestions can be provided for regional enterprise management and soil pollution control decision making.
1. Introduction
In recent years, with the acceleration of global industrialization, the problem of heavy metal pollution in soil caused by industrial production has become increasingly prominent. Heavy metals in soil have caused widespread concern worldwide due to their high toxicity and nonbiodegradability [1,2]. Heavy metals accumulating in the soil are not only easily absorbed by crops, severely affecting their yield and quality, but can also accumulate in the human body through the food chain and endanger human health [3,4]. The heavy metals in soil have two sources: soil parent materials and human activities. Especially in industrially impacted areas, industrial waste, sewage irrigation, atmospheric dry and wet sedimentation and other factors caused by rapid industrialization have placed substantial pressure on the local environment [5,6]. These factors have led to a decline in the quality of the local environment over the past few decades and ultimately to an increase in heavy metal pollution. Studying the sources of heavy metals in soil in industrially impacted areas is of great significance for maintaining regional environmental health.
The ideal result of the analysis of the sources of heavy metals in soil is the quantitative determination of the contribution of each source to the total content of such heavy metals and the identification of how they enter the soil. Due to the diversity of human activities and the heterogeneity of the soil itself, it is difficult to identify the source of heavy metals. Previous studies have focused on receptor models, with pollutants as the research object. This type of model does not rely on the analysis of the chemical composition of the pollution source, the migration and transformation pathways of the pollutants do not need to be specified, and the data are relatively easy to obtain and realize [7,8,9]. Commonly used receptor models include chemical mass balance (CMB), principal component analysis/multilinear regression (PCA-MLR), positive matrix factorization (PMF) and UNMIX models [10,11,12]. However, the judgement of the results of receptor models is highly subjective, mostly relying on previous experience and expert assessment, and the analytical results are difficult to verify [13,14,15,16]. The current research on receptor models is, on the one hand, related to the applicability of the model, such as the appropriate scale, the amount of sampled data and the appropriate research object, and on the other hand based on the analytical process of the optimization model, usually in combination with other methods. The advantage of this method is to make the analytical results more accurate and to eliminate the uncertainty of subjective judgement in source identification. In recent years, with the development of stochastic simulation technology, random forest (RF) analysis has gradually been applied to the analysis of soil pollution sources [17,18,19]. This method overcomes the stringent requirements of traditional technology in terms of data analysis, and overfitting is not a concern. It is one of the important tools used to perform shared pollution source calculations. However, the model cannot quantitatively identify the contributions of the pollution sources [20,21]. Therefore, it is reasonable to make use of the respective strengths of the PMF model and RF model and apply these two tools in the analysis of heavy metal pollution sources.
The receptor model achieves dimensionality reduction through the mathematical conversion of the concentration of heavy metals and requires a large amount of sample data to ensure its accuracy. Therefore, this type of method is theoretically well applied in large areas. However, a prerequisite for the application of the receptor model is that the content of a pollutant is essentially equal to the sum of the contributions of all pollution sources [22]. In fact, affected by soil heterogeneity, certain local human activities, such as traffic emissions, sewage irrigation and industrial manufacturing, cannot affect the heavy metal content in the entire study area and the degree of their influence is often weakened in the analysis. However, their influence in local areas cannot be ignored. The receptor model includes the maximum load element of the extraction factor as an indicator, and the combination of existing knowledge and expert judgement is used to identify pollution sources. As a result, only one source of pollution is often identified by the load element. However, when the load element has multiple sources in the region, the category of the source is not well determined. Especially across large areas, the identification of pollution sources becomes more difficult due to the diversity of potential sources of heavy metals [23]. Some studies have noted that receptor models may be unsuccessful in identifying the distribution of soil heavy metal sources because they violate the assumption that all samples have the same source [24,25] and that the characterization of local point sources can influence the results of these models. Although there is inevitable uncertainty in the allocation of the contribution values of pollution sources, recent studies have shown that some improved models or improved methods can overcome inaccuracy in source allocation results to a certain extent [26,27]. The scale of the research area has been shown to have important effects on source allocation [19,24,28]. However, the methods that can be used to reduce the uncertainty in source allocation caused by scale have not attracted sufficient attention. Wu et al. (2020) studied the sources of heavy metals in agricultural soil based on a zoning treatment [15], but there has been no corresponding research on soil heavy metals under industrial influence in the past.
Based on the above considerations, the main purpose of this study was to explore the source of heavy metals in soils in large-scale industrially affected areas based on a zoning treatment. Considering the characteristics of heavy metal pollution in industrially affected areas, we conducted hot spot analysis on key polluting enterprises and identified hot spots, cold spots, and areas insignificantly affected by enterprises and used this information as the basis for zoning treatment. Then, we combined PMF and RF analysis for three subregions to establish a quantitative relationship between the sources and sinks of heavy metals and explored the sources of heavy metals in the subregions under different degrees of industrial influence for regional corporate management and soil pollution prevention measures to provide precise and reasonable suggestions. To the best of our knowledge, this study represents the first exploration of the sources of pollutants based on a zoning treatment in an industrially affected area.
2. Materials and Methods
2.1. Study Area and Subregions
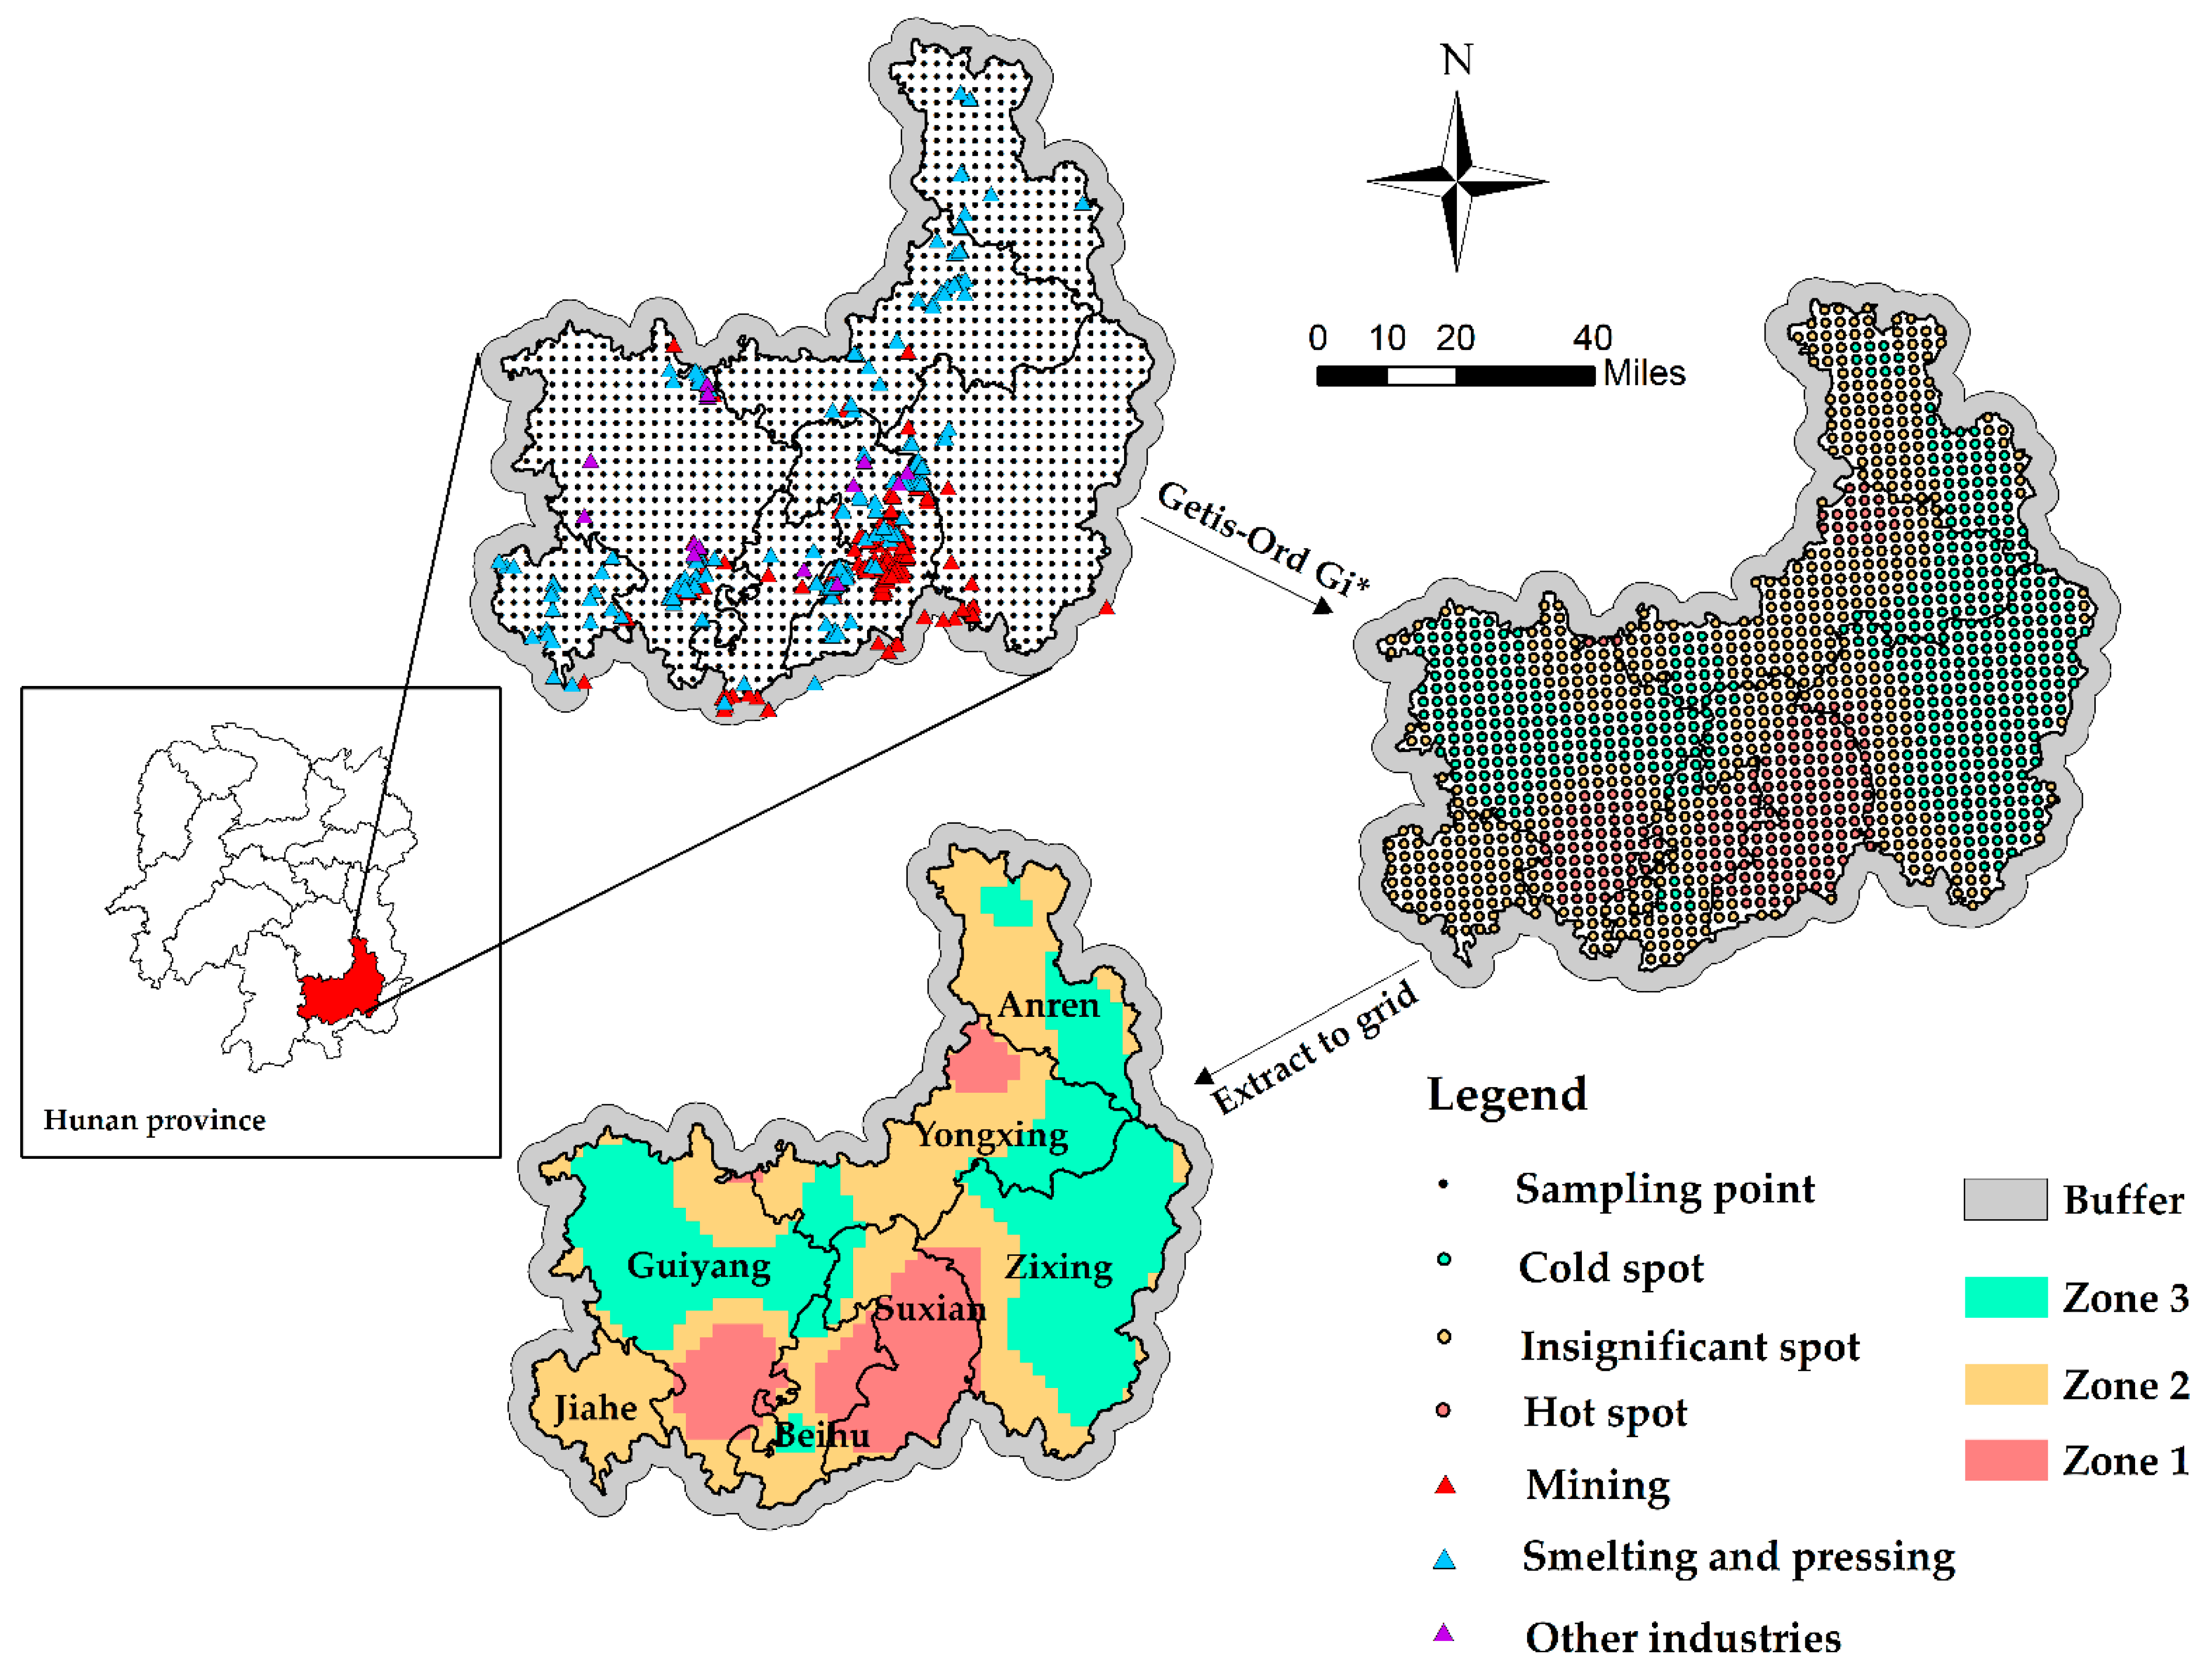
Chenzhou city, Hunan Province (112°53′55″ E–113°16′22″ E, 25°30′21″–26°03′29″ N), is located in southern China, with annual rainfall of 1452.1 mm and has a mid-subtropical monsoon humid climate. Chenzhou is rich in mineral resources and is known as the hometown of nonferrous metals. It hosts the Shizhuyuan polymetallic mine, state-owned Qiaokou lead-zinc mine, Manaoshan manganese mine and Dongbo lead-zinc mine. Large-scale industrial production has caused a series of environmental problems in the area. Regions with significant impacts from key polluting enterprises in Chenzhou city were used as the study area, including Beihu district, Suxian district, Guiyang county, Yongxing county, Jiahe county, Anren county and Zixing city, with a total area of 11,978 km2, and the area within five kilometers of the study area was considered a buffer zone.
The impact of key polluting enterprises on the content of heavy metals in the soil is closely related to the distance between sampling points and the enterprises. According to the result of hot spot analysis on key polluting enterprises, we identified hot spots, cold spots, and spots insignificantly affected by enterprises, and extracted the divided attribution of the spots to grid. On the basis of the border of different attribution of the grid, three subregions with different characteristics were thus formed.
Hot spot affected zone (Zone 1): the industrial enterprises in this region are highly concentrated, with a large number of key polluting enterprises with a dense distribution. The enterprises have a large impact on the soil, and sustainable development is restricted.
Insignificantly affected zone (Zone 2): the concentration of industrial enterprises in this area is low, the distribution of key polluting enterprises is sparse and the impact on the soil is small. Thanks to the neighboring spillover effect of industrial transfer, the speed of industrial development is increasing rapidly, but as the degree of industrial agglomeration increases, it may become an area experiencing rapid growth in pollution in the future.
Cold spot affected zone (Zone 3): there are almost no key polluting enterprises in this area and the concentration of industrial enterprises is low. Key polluting enterprises have little impact on the soil environment. Most of the area is non-industrial land. Figure 1 shows the locations of sampling points in the study area and the process of zoning.
2.2. Sampling and Chemical Analysis
2.2.1. Soil Heavy Metal Content Data Collection
We collected samples of surface soil in the study area in 2018 and used ArcGIS 10.3 to lay out 1347 grid cells within the area. The size of each grid was 3 × 3 km2, and GPS was used to accurately locate 1347 sampling points. The soil samples were collected with the plum-shaped dot method. At least six surface (0–20 cm) soil samples were collected from each grid using a wooden shovel. After the samples were evenly mixed, no less than 2 kg of soil was found to have been collected from each sampling point according to the four-point method, and the samples were then placed in a bag. Relevant information on the soil samples and the status of the surrounding land use was recorded. Weeds, gravel, animal and plant residues and other materials were discarded from the collected soil samples, which were mixed, air dried, and then ground in a mortar and passed through 100 mesh (with an aperture equal to 0.15 mm) for sieving and preservation. Twenty grams of each air-dried sample was removed, and 20 mL of degassed water was added; the mixture was then stirred evenly and left in place for 30 min. The pH value of the aqueous extract of the soil sample was measured according to the electric potential method [29]. The soil samples were digested with HCL-HNO3-HF microwave airtight digestion technology. The concentrations of Cd, Pb and Cr in the soil were determined with inductively-coupled plasma atomic emission spectrometry (ICP-AES), and the concentrations of Hg and As in the soil were determined according to the atomic fluorescence method.
2.2.2. Environmental Factors
In receptor model analysis, previous knowledge of the study area is required for the model execution and interpretation of results. According to the characteristics of soil heavy metal migration and transformation in the study area and on the basis of existing studies, 12 environmental factors related to the sources of heavy metals in the soil were selected. The selected 12 environmental factors involved the vast majority of the sources of heavy metals in soil, which could be divided into five categories: industrial, agricultural, natural, traffic and other. The 12 environmental factors were selected on the basis of two criteria: (1) they encompass the majority of heavy metals emitted in this region; (2) they are differentiable by means of most of these heavy metals [15]. The amounts of pesticides and fertilizers used were derived from the “henzhou City Statistical Yearbook 2018 and converted into annual usage per unit grid area. According to GB/T4754-2017 Classification of National Economic Industries, a total of 457 key polluting enterprises in the study and buffer areas were divided into three categories, including 232 mining (08 ferrous metal mining and dressing, 09 nonferrous metal mining selected industry), 211 smelting and processing (31 ferrous metal smelting and rolling processing industry, 32 nonferrous metal smelting and rolling processing industry), and 14 other industries (chemical raw materials and chemical products manufacturing, comprehensive utilization of waste resources, warehousing, ecological protection and environmental management). ArcGIS 10.3 was used to calculate the shortest distance between a sampling point and different industries. Similarly, the shortest distance between sampling points and rivers and traffic trunk lines was calculated with ArcGIS. Elevation and land-use type were derived from remote sensing data. Soil organic matter and agrotype data were obtained from resource and environmental data platforms. Table 1 shows the 12 selected environmental factors and their categories.
3. Data Analysis
3.1. Hot Spot Analysis
Hot spot analysis is based on local spatial autocorrelation theory, a method used to test whether the observed value of an element is significantly correlated with the observed value of adjacent spatial elements [30]. The Gi* statistic is calculated to reflect the locations of clusters of high or low values of elements in space [31]. A significantly positive Gi* indicates that the observed values of adjacent elements are clustered with high values in space, that is, hot spots. A significantly negative Gi* value indicates that the observed values of adjacent elements are clustered with low values in space, that is, cold points. The outliers of high-low clusters are insignificant points. The confidence intervals used in this study were set at 90%.
3.2. Geo-Accumulation Index
The geo-accumulation index (Igeo) was calculated according to the following equation:
where is the background value of element n in Chinese soil (Hunan) and is the measured concentration of element n [32]. The classification of Igeo was Igeo < 0: practically unpolluted; 0 < Igeo < 1: unpolluted to moderately polluted; 1 < Igeo < 2: moderately polluted; 2 < Igeo < 3: moderately to strongly polluted; 3 < Igeo < 4: strongly polluted; 4 < Igeo < 5: strongly to extremely polluted; and Igeo > 5: extremely polluted [33].
3.3. Receptor Model
The PMF model is a factor analysis receptor model proposed by Paatero [34]. The model decomposes the sampled data matrix (X) into a factor contribution matrix (G), factor component matrix (F) and residual matrix (E) [35]:
where n is the number of samples, m is the type of chemical substances measured and p is the number of factors (the number of main sources).
The PMF model is based on the weighted least squares method for limiting and iterative calculations and uses the concentration and uncertainty data of the sample to weight each point so that the objective function Q is minimized. The objective function Q is defined as follows [36]:
where xij is the content of the jth (j = 1, 2, ..., m) element in the ith (i = 1, 2, ..., n) sample, gik is the relative contribution of source k to the ith sample, is the uncertainty of the content of the jth element in the ith sample, fkj is the content of the jth element in the source, and eij is the residual. If a chemical element’s concentration was lower than or identical to the relative method detection limit (MDL), the calculation of uncertainty was expressed as
Otherwise, it was calculated as
where c denotes the concentration of a chemical element and r denotes the RSD. We applied PMF software (ver. 5.0, USEPA) for source apportionment.
3.4. Random Forest Algorithm
Developed from CART analysis, which produces a single tree, RF analysis combines a forest of uncorrelated trees created with the CART procedure [37]. Each tree is constructed with a randomly selected subset of training data. Classification and regression form the core of RF model analysis. The Gini importance of regression forests is a well-known variable importance metric used in CART tree and RF analysis. However, because of the bias of impurities in selecting split variables, the resulting variable importance metrics are, of course, also biased [38,39]. The permutation-based mean squared error (MSE) reduction approach suggested by Breiman (2002) has been employed as the state-of-the-art method of variable importance assessment by many authors [40,41,42]. Therefore, this permutation-based MSE reduction was also adopted as the RF importance criterion in the present study. We applied the random forest library of R 3.1.2 for RF analysis.
In addition, some parameters of the model needed to be set. mtry was the number of variables extracted from each decision tree, which was 1/3 of the number of all variables in the regression model [43]. The total number of covariate factors in this study was 12, so the number of node variables was set as four. On the basis of the number of samples, the number of decision trees was set as 500. In addition, parameters such as the minimum node size were set according to the default value of the model.
4. Results and Discussion
4.1. Heavy Metal Contamination Characteristics
4.1.1. Descriptive Statistics of the Heavy Metals
Descriptive statistics for Cd, Hg, As, Pb, Cr and basic soil properties are summarized in Table 2. The average contents of the five elements in the whole area exceeded the background values in Hunan province soils [32] by 9.46, 2.36, 2.22, 3.27 and 1.05 times, respectively. The coefficient of variation (C.V.) values of Cd, As, and Pb exceeded 1, reflecting a wider extent of variability in relation to their means, which may be attributed to the outliers from human inputs [44]. The C.V. values of Hg and Cr were small, reflecting that the degree of data dispersion was low. For the three subregions, the average contents of Cd, As and Pb were in the order of zone 1 > zone 2 > zone 3, indicating that the content of the three elements had a great relationship with the degree of influence of key polluting enterprises. The average Hg and Cr contents were relatively stable, indicating that key polluting enterprises had little influence on the contents of these two elements.
According to the National Environmental Quality Standards for Soils of China [45], the screening values are considered threshold values for soil environment risk. When the pollutant content is higher than the screening values, further monitoring measures should be taken. Among the heavy metals studied, Hg and Cr had almost no over-standard points. The exceeded rate of Cd was the highest, with a value of 90% in zone 1 and zone 2, indicating that pollution by Cd in these areas was relatively severe, and further monitoring and risk assessment measures are needed.
4.1.2. Pollution Assessment
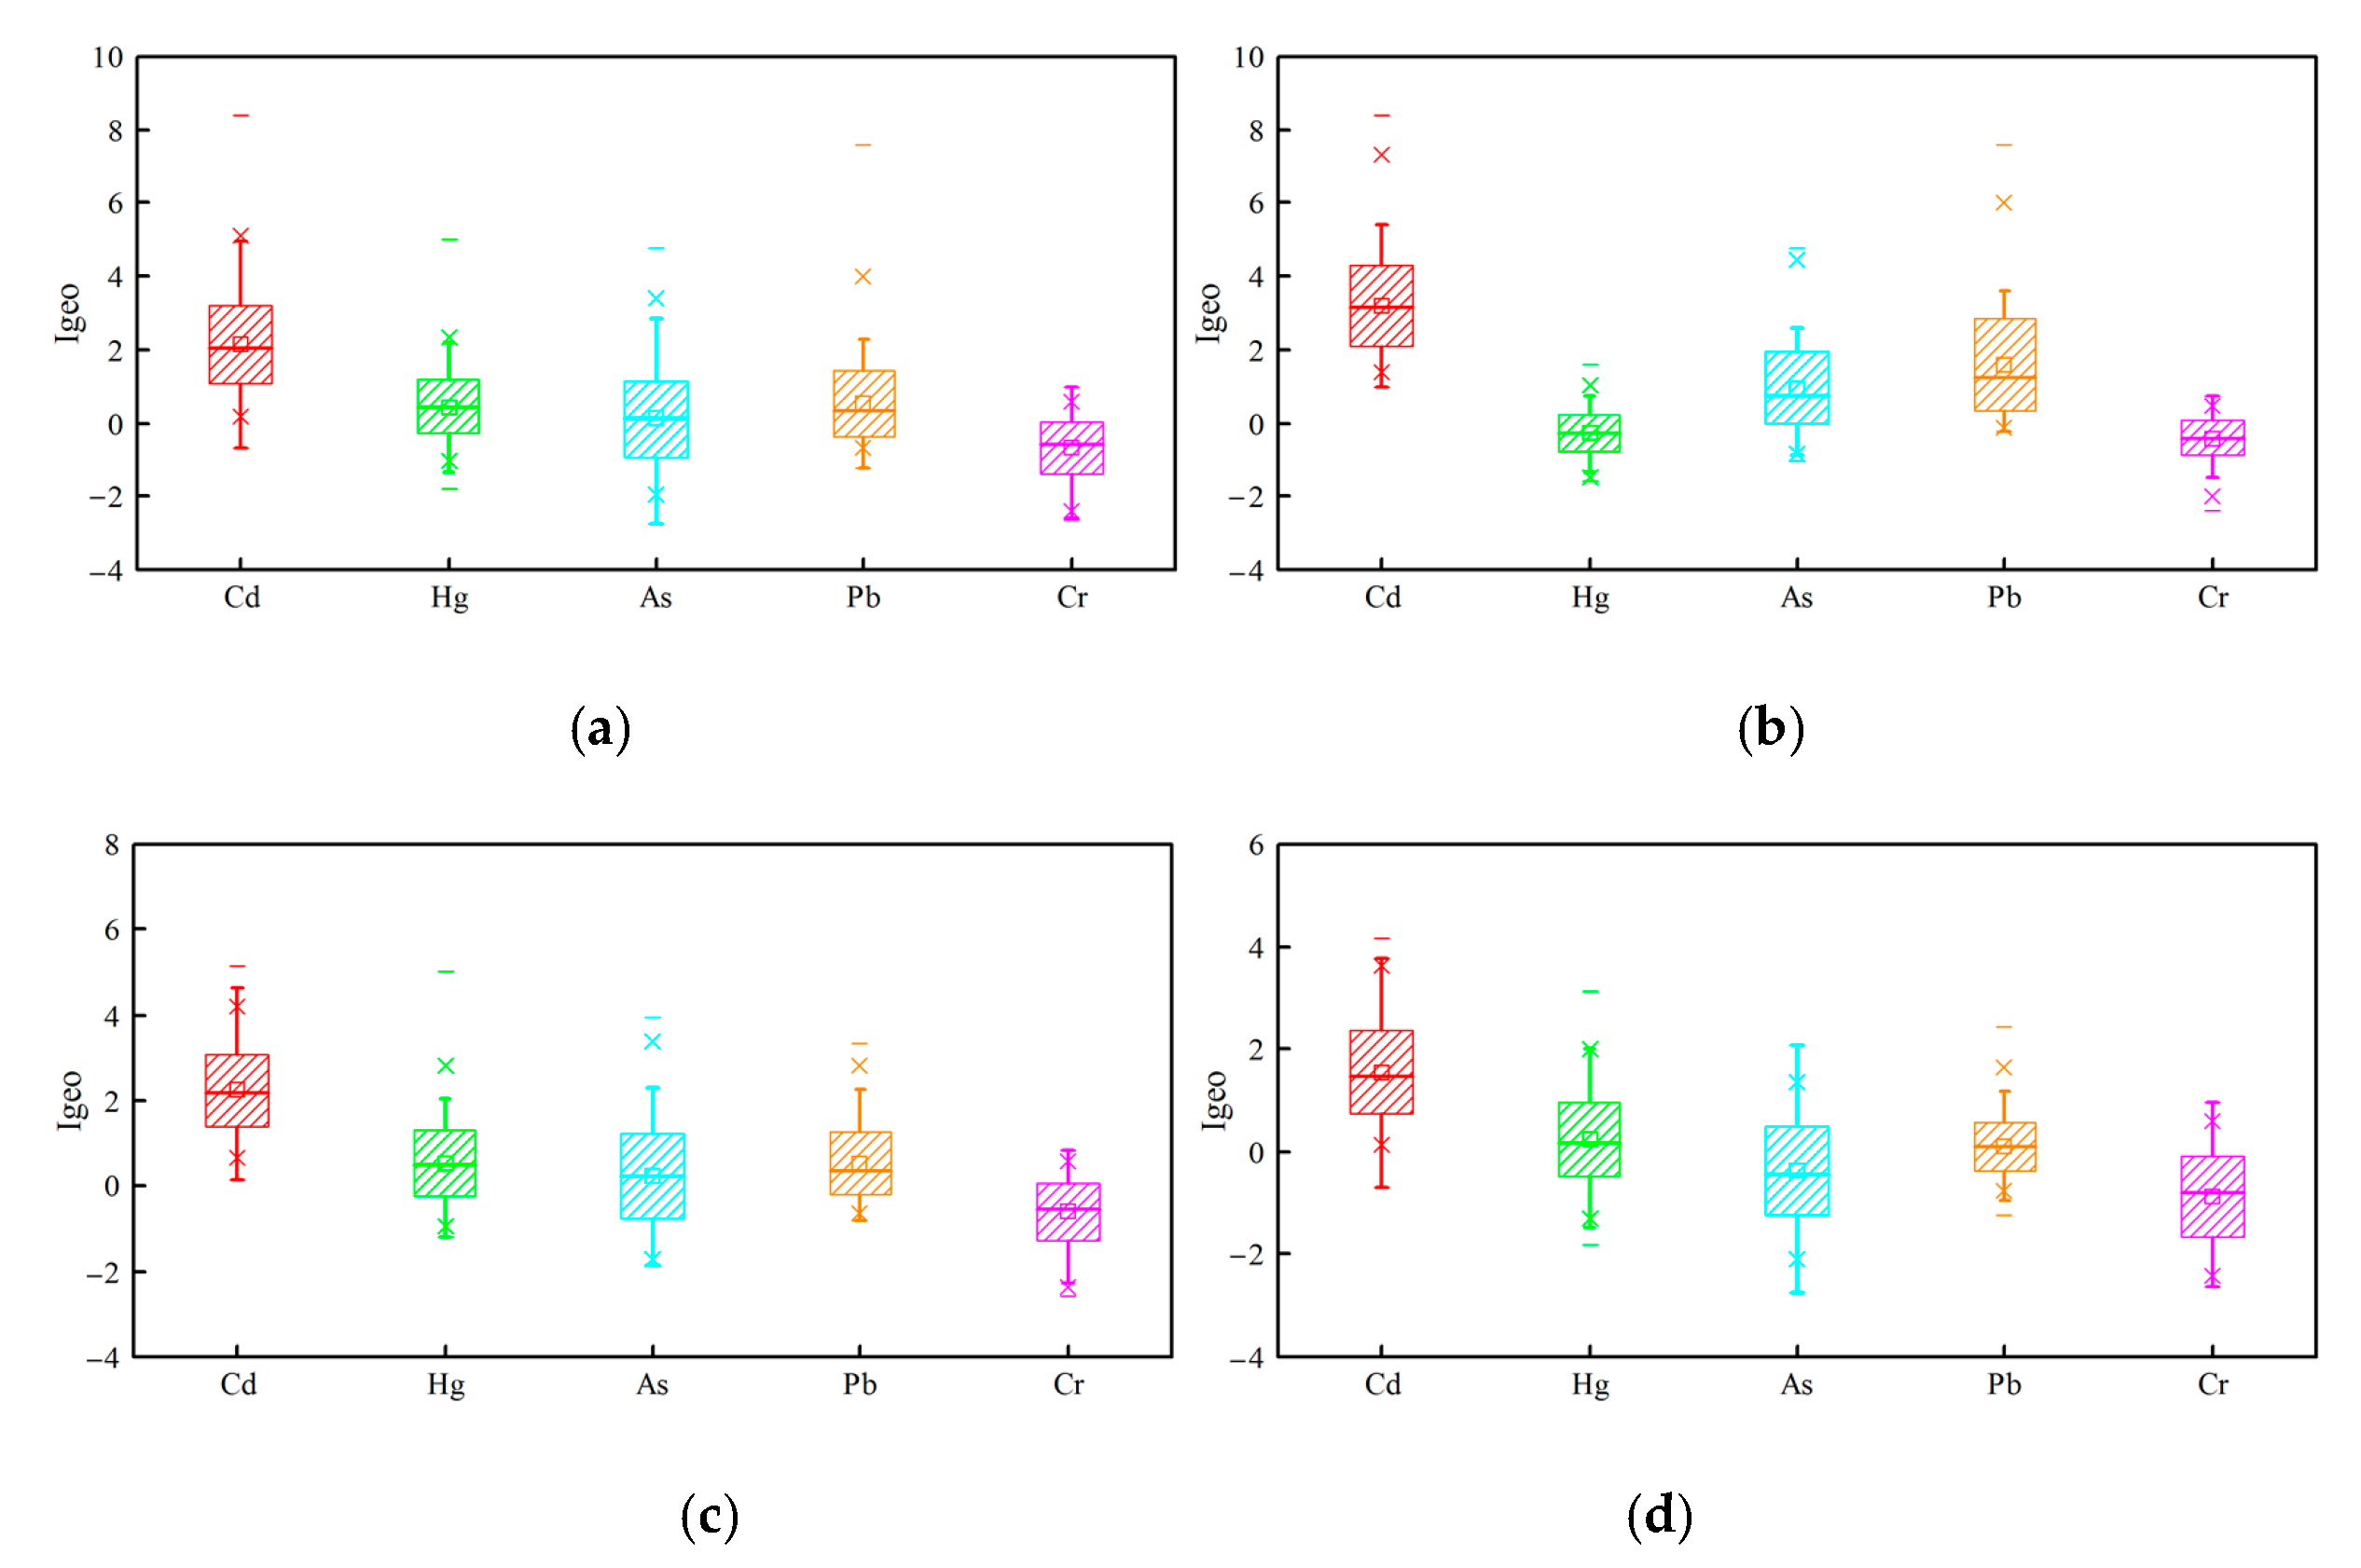
The Igeo value has been widely employed to estimate the degree of metal contamination risk in soil, and it can be used to identify the degree of anthropogenic pollution by different elements. Figure 2 shows the Igeo values of the five evaluated elements in the whole area and three subregions. In the whole area, the average values of Igeo were in the descending order of Cd > Hg > Pb > As > Cr. The average Igeo value of Cd exceeded 2, with a ranking of moderately to strongly polluted, which suggests that human activities are the main reason for the increase in the Cd content in the soil. The average Igeo values for Hg, As and Pb were between 0 and 1, which indicates an uncontaminated to moderately contaminated level. The average Igeo value for Cr was below 0, with a ranking of practically unpolluted, which suggests that Cr originated primarily from natural sources.
In the three subregions, the average Igeo values for the five elements all decreased from zone 1 to zone 3. It is notable that the average Igeo values for Hg in zone 1 and As in zone 3 were below 0 (−0.28 and −0.37, respectively), indicating that As in zone 3 and Hg in zone 1 originated from natural sources. The average Igeo values for Cr in the three subregions were all below 0, indicating that Cr was mainly derived from the soil material across the whole study area.
4.1.3. Difference Analysis
Independent-sample tests (Kruskal-Wallis H) were conducted to determine whether the mean element concentrations differed among the three subregions. The p values for all heavy metals were all lower than 0.05. According to the results, the concentrations of all elements in the three subregions significantly differed, indicating that key polluting enterprises had dissimilar effects on the increased heavy metal contents in the three subregions. It is reasonable to partition processing based on the hot spot analysis of the key polluting enterprises, as mentioned above.
4.2. Source Apportionment by PMF
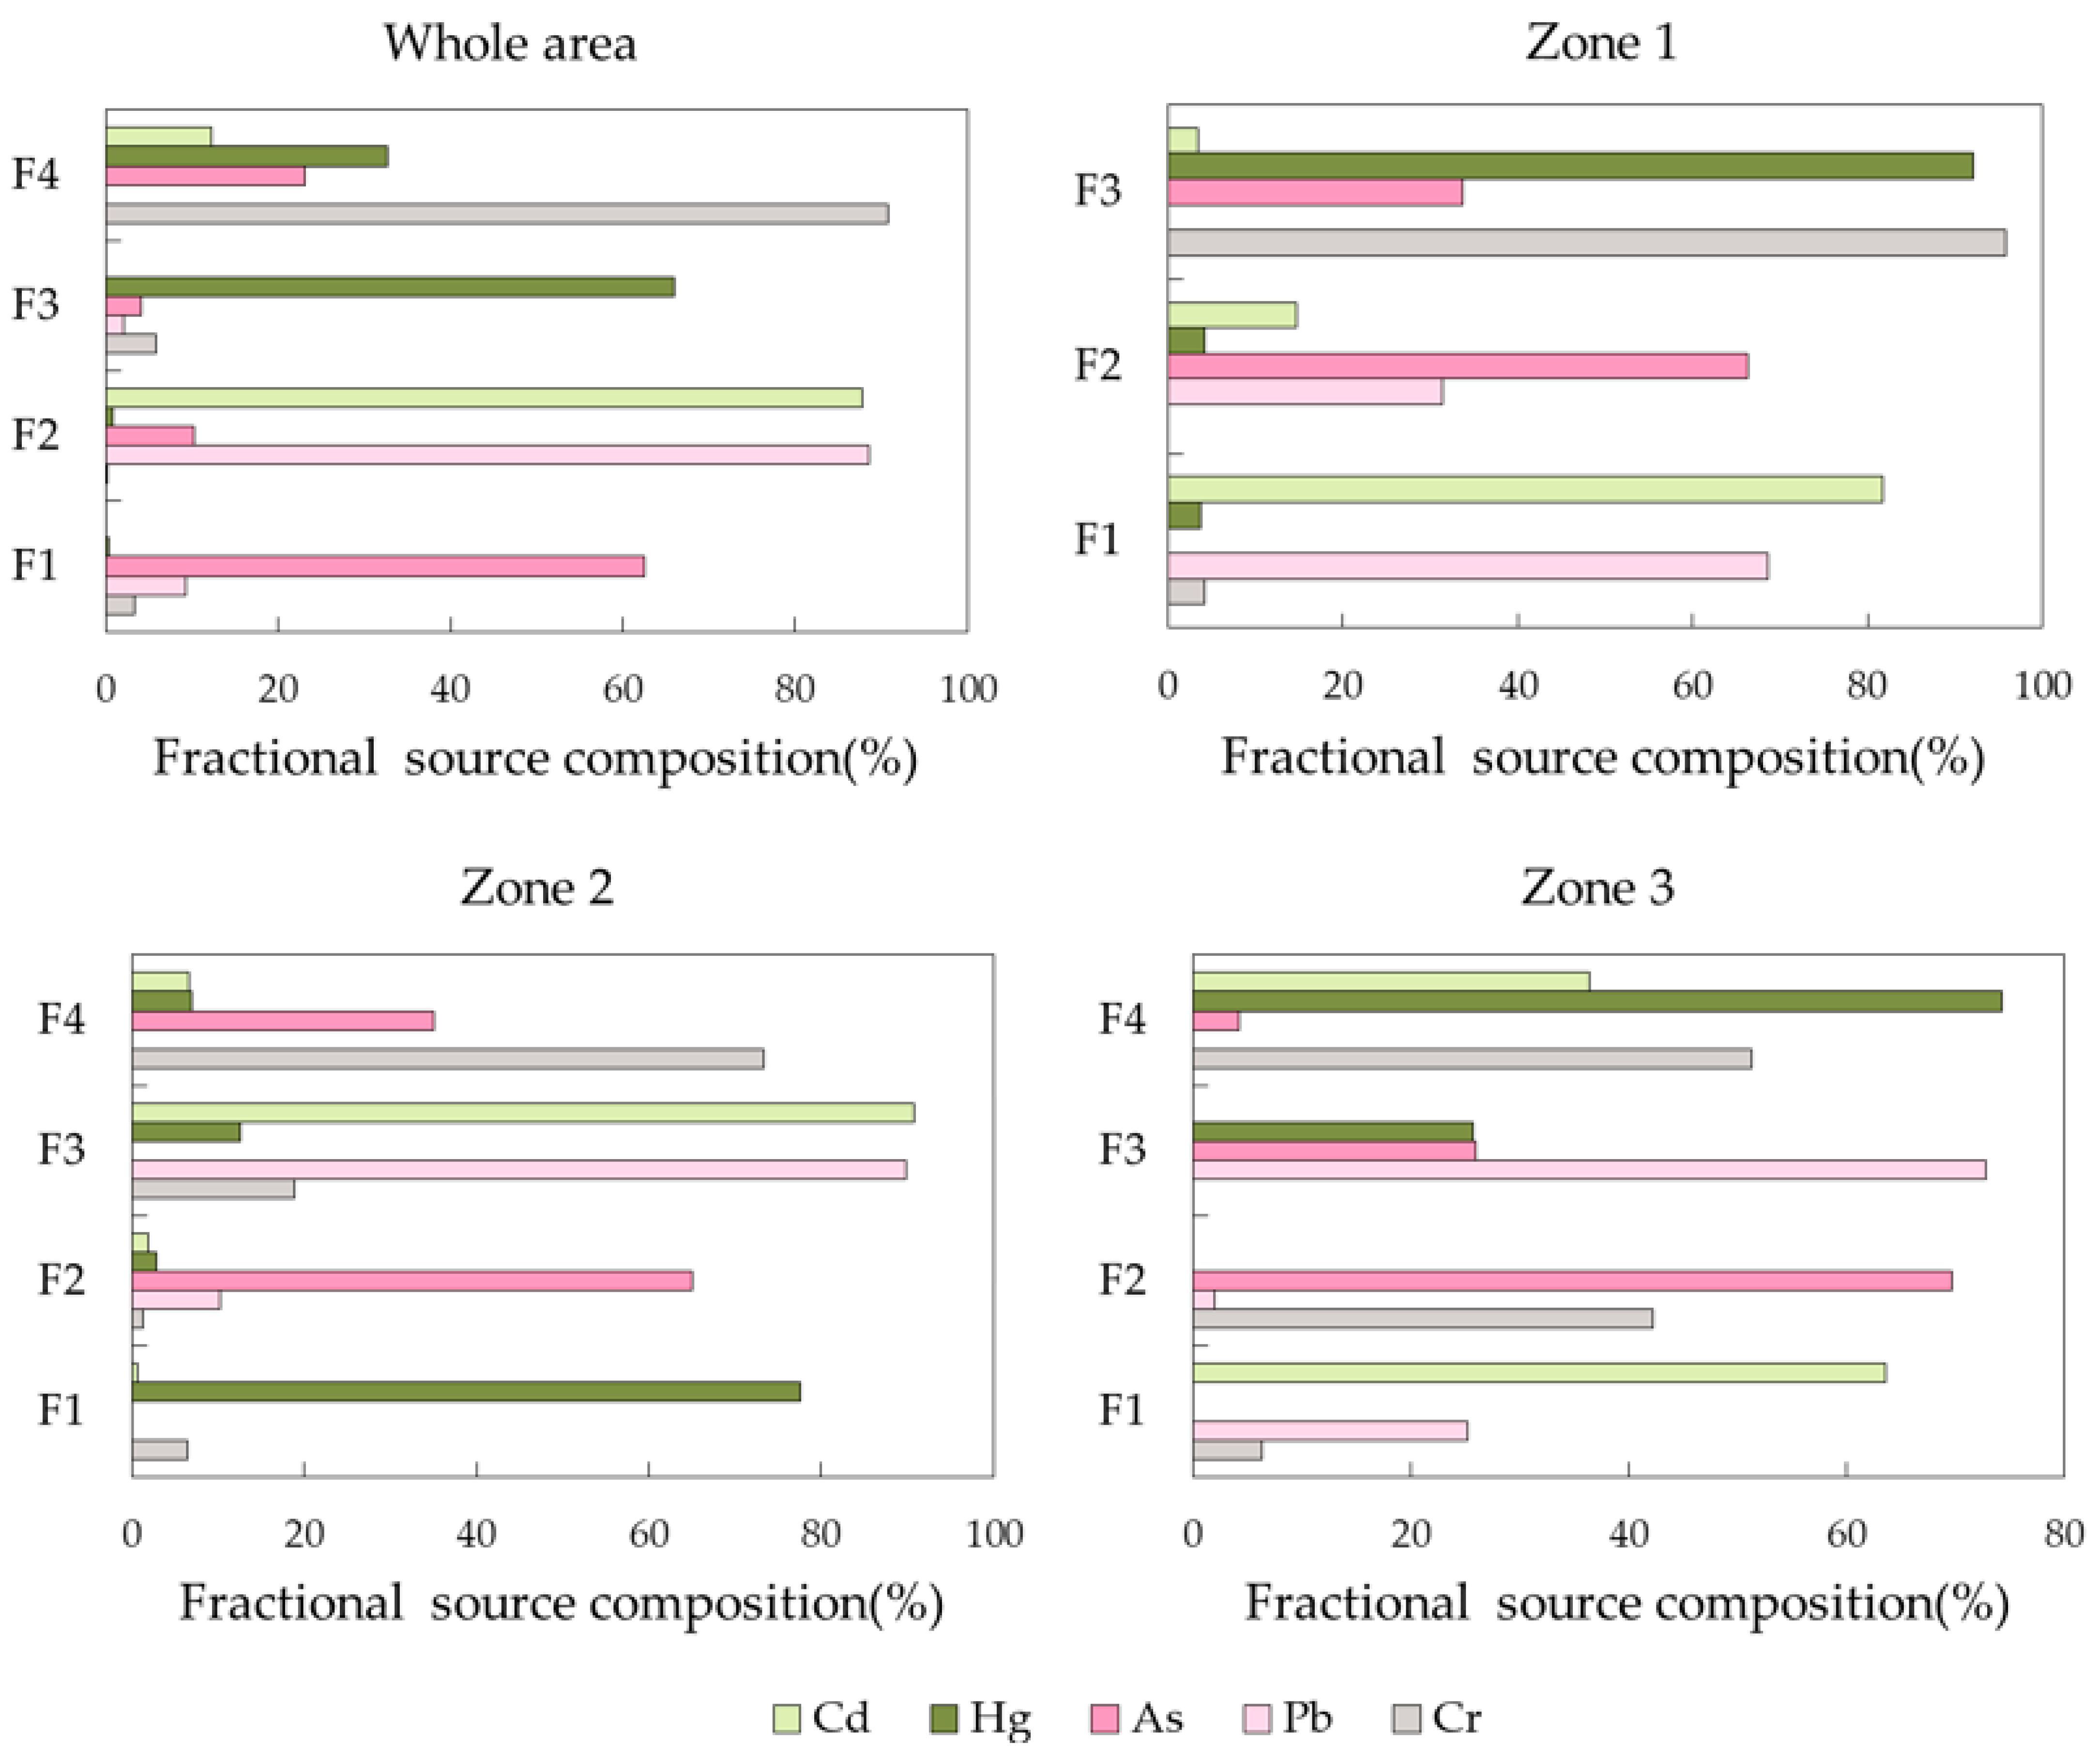
EPA PMF 5.0 was broadly applied to calculate the contributions of pollution sources. Figure 3 shows the results of the PMF model. The number of factors extracted according to PMF was the number of pollution sources, and the element loading on each factor was the contribution rate of the pollution source to the element. The results showed that four factors were extracted from the whole area, zone 2 and zone 3, while three factors were extracted from zone 1.
Igeo analysis is used to distinguish whether heavy metals mainly originate from natural or anthropogenic sources. The factor with the dominant loading of unpolluted heavy metals was identified as from natural sources, then anthropogenic sources were further screened according to local anthropogenic activities. On the condition that some sources have similar source profiles, the factor was identified as mixed sources.
Among these 15 factors, five elements were allocated to different pollution sources, and there were significant differences in source profiles among the different regions. According to the Igeo analysis, Cr in the whole area, Hg in zone 1 and As in zone 3 were found to mainly originate from natural sources, and F4 in the whole area, F3 in zone 1, F4 in zone 2 and F2 in zone 3 were determined as natural sources, and the contents of heavy metals were affected by soil parent materials. The extracted source profiles of Cd and Pb in zone 1 and zone 2 were very similar, indicating that Cd and Pb in these two areas had the same sources.
4.3. Qualitative Identification of Pollution Sources
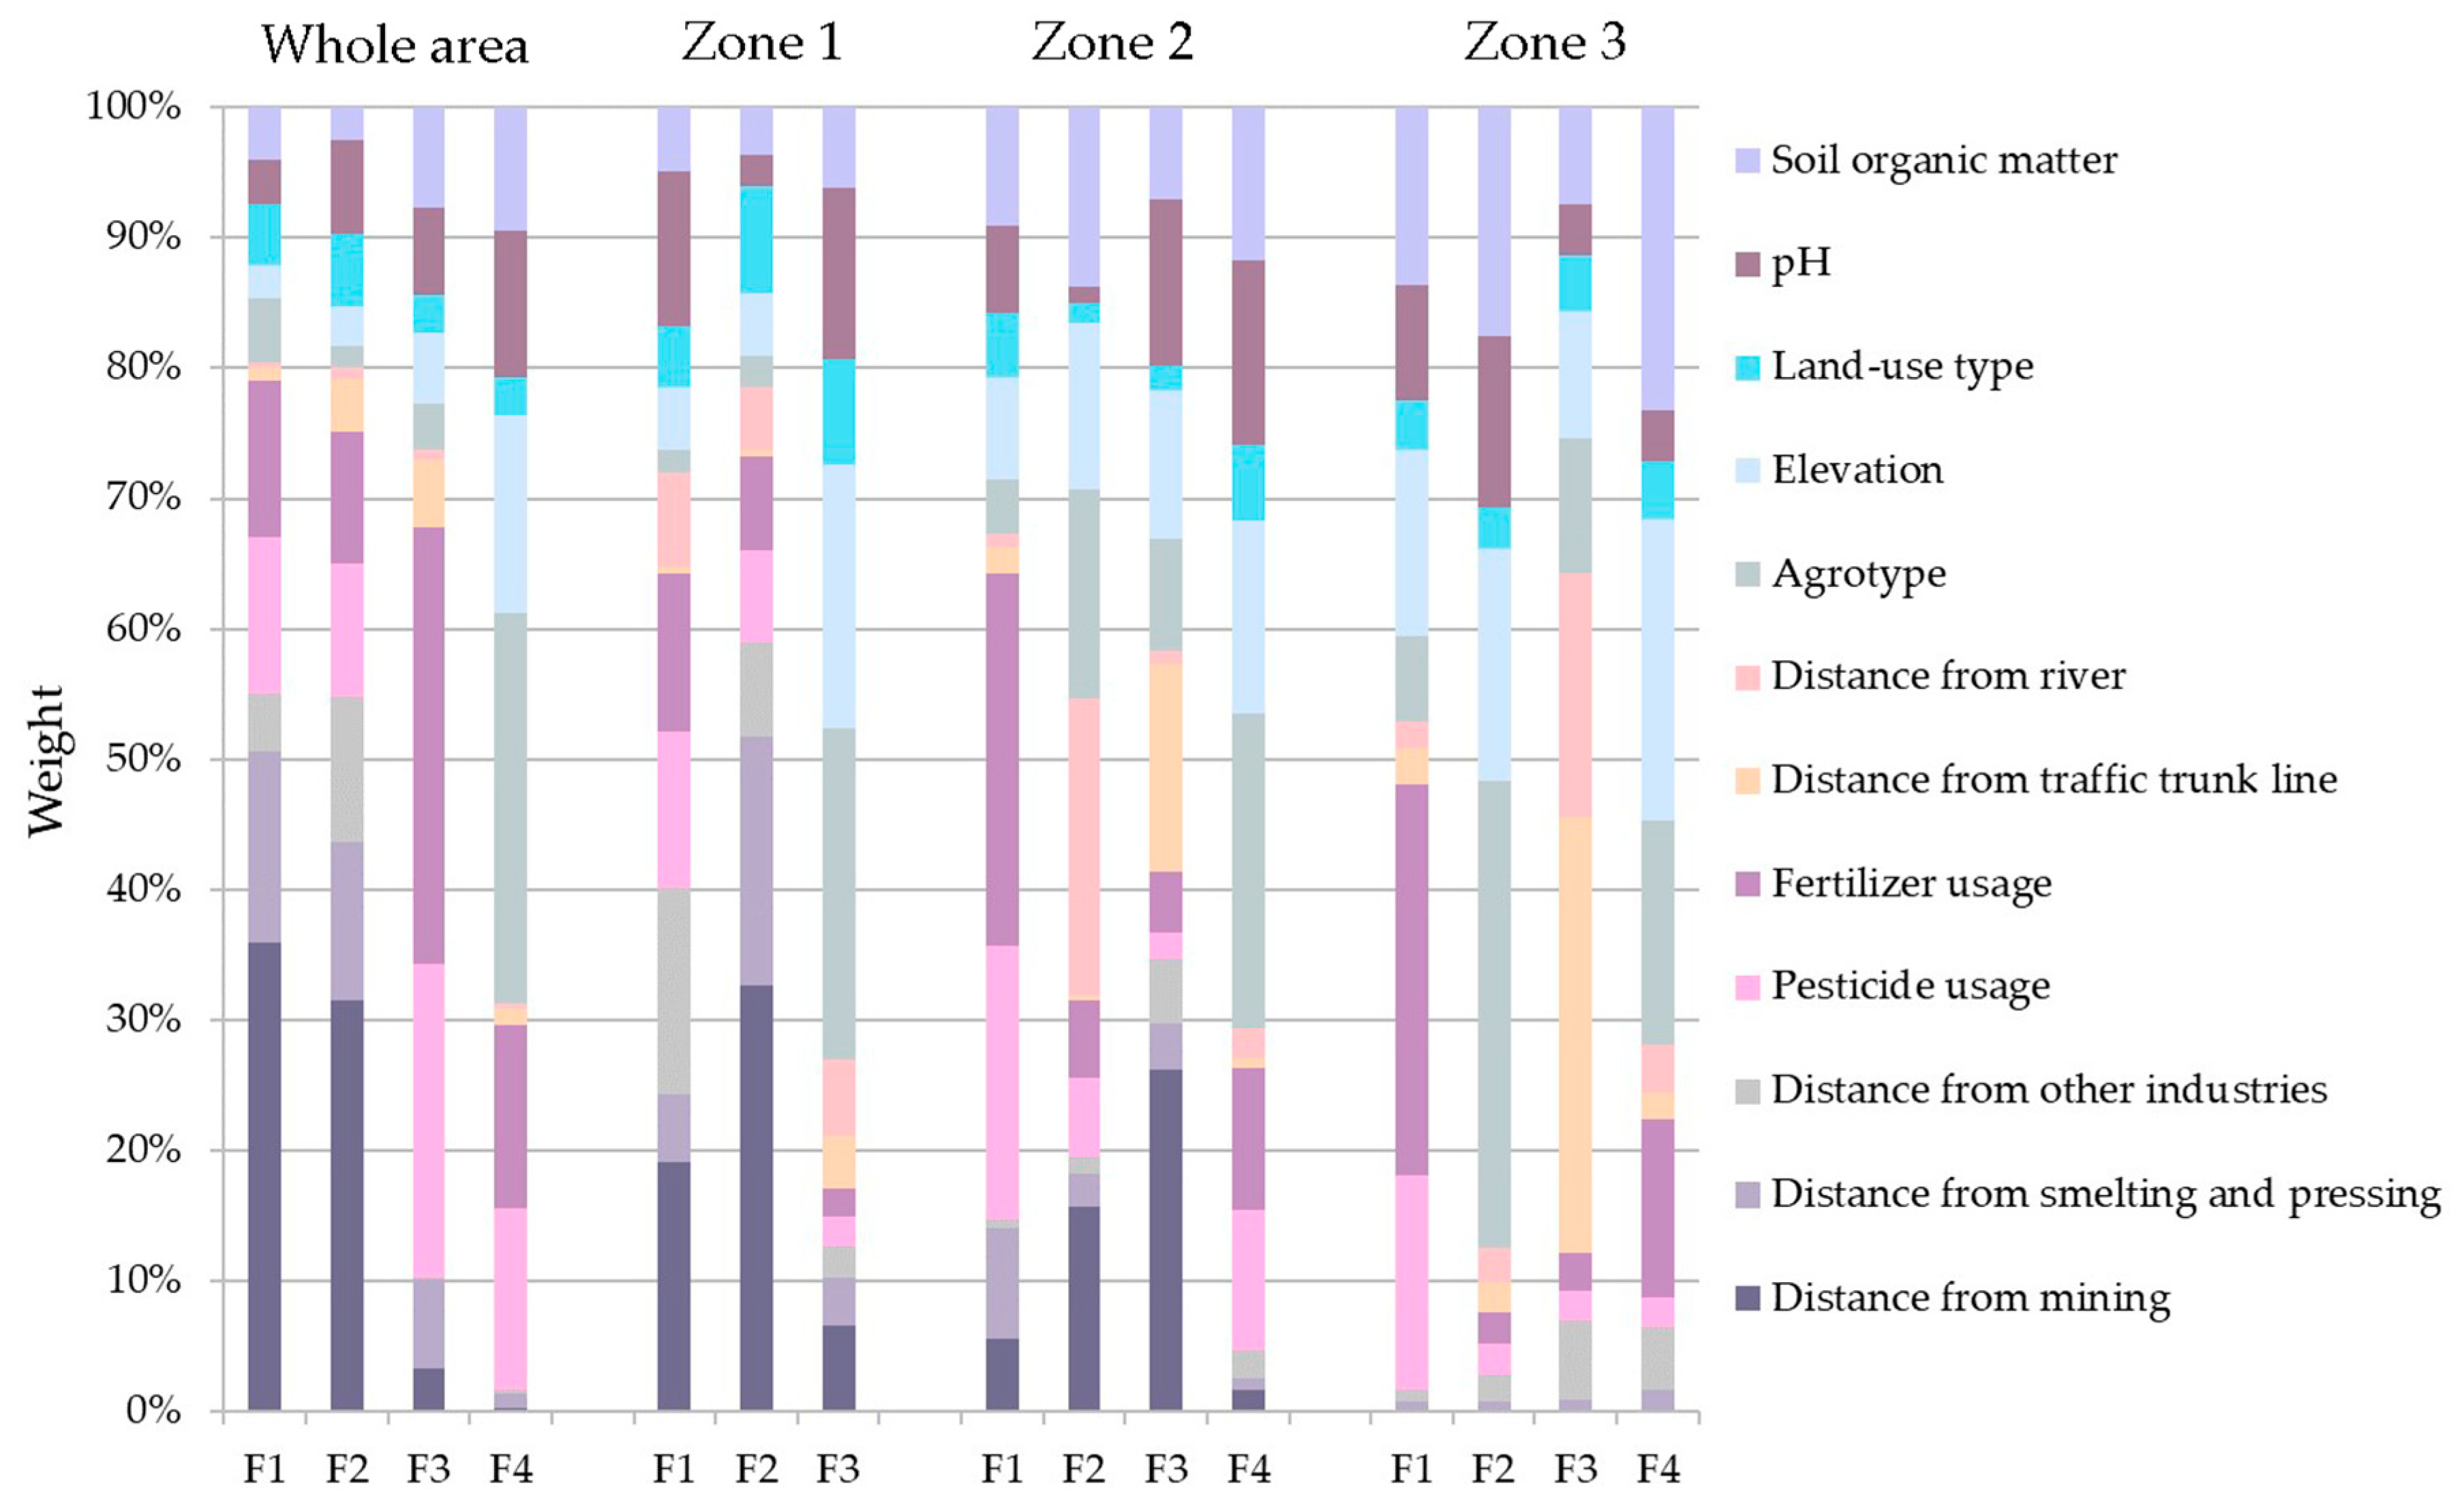
Through descriptive statistical analysis, Igeo analysis and PMF model analysis, the reasons for the increase in heavy metal content and spatial variability were gradually clarified. However, there is still no appropriate conclusion regarding the types of anthropogenic sources. Moreover, the above analysis was essentially a discussion of the sink of heavy metals. The analysis of the causes of soil heavy metal content accumulation and spatial variation on the basis of the receptor model was largely based on existing knowledge and expert judgement and did not establish a clear quantitative relationship between source and sink. Therefore, there was greater uncertainty in source identification. An RF regression model was used to construct a quantitative relationship between heavy metal sources and sinks. The importance of environmental factors to source contributions was calculated according to the RF regression model, and the types of pollution sources were determined. The contribution of the pollution sources to each sample can be easily determined by the factor score derived from the PMF model. For the RF model, MSE reduction was used as the measure of the importance of an environmental factor in pollution sources. Figure 4 shows the percentage weights of 12 environmental factors in regard to 15 pollution sources. The interpretability percentages of the spatial variation of Cd, Hg, As, Pb and Cr according to the constructed model were 94.43, 90.85, 91.41, 96.11 and 96.39%, respectively, with all showing extremely significant levels.
The higher the weight an environmental factor is, the greater the influence of the factor on pollution source contribution. The environmental factors that affect the contributions of pollution sources have roughly two characteristics. First, because it is affected by the spatial heterogeneity of the soil, the degree of influence of various environmental factors presents an unstable state, and the differences among regions are significant. Second, the main influencing factors of an element in different regions vary, indicating that the sources of a single element in different regions are not completely identical. Therefore, it is necessary to explore the sources of heavy metals through partition processing.
Across the whole area, the main influencing factors of the spatial variability in the four pollution source contributions were the distance from mining, distance from mining, fertilizer usage and agrotype. Combined with the results of the PMF model analysis, it can be seen that the long-term accumulation of Cd, Pb and As in the soil should be taken seriously because of the industrial waste discharged by the mining industry, with contribution rates of 87.7, 88.5 and 62.5%, respectively. This result is consistent with those from related studies [10,46,47,48]. Similarly, fertilizer usage and agrotype were the most significant factors affecting Hg and Cr, with contribution rates of 66 and 90.7%, respectively. The content of Cr had a strong relationship with the soil parent materials, confirming that Cr mainly originated from natural sources. Many studies have shown that an important source of Hg in soil is agricultural activities such as the use of mercury-containing fertilizers and livestock manure [49,50]. The results from these studies are consistent with the conclusion from the current study.
In zone 1, the main influencing factors of the spatial variability in the three pollution source contributions were distance from mining, distance from mining, and agrotype. Combined with the results of the PMF model analysis, it can be seen that Cd, Pb and As mainly originated from industrial waste discharged from mining operations in zone 1, with contribution rates of 81.8, 68.6 and 66.3%, respectively. Hg and Cr mainly originated from the soil parent materials, with contribution rates of 92.1 and 95.8%, respectively.
In zone 2, the main influencing factors of the spatial variability in the four pollution source contributions were fertilizer usage, distance from river, distance from mining, and agrotype. Similarly, Cd and Pb mainly originated from industrial waste discharged from mining, with contribution rates of 90.7 and 89.8%, respectively. As mainly originated from sewage irrigation in rivers, with a contribution rate of 65.0%. Hg mainly came from fertilizer usage, with a contribution rate of 77.5%, while Cr mainly originated from the soil parent materials with a contribution rate of 73.3%.
In zone 3, the main influencing factors of the spatial variability in the four pollution source contributions were fertilizer usage, agrotype, distance from traffic trunk line and soil organic matter. Obviously, Cd mainly came from the use of Cd-containing chemical fertilizers, with a contribution rate of 77.5%. Pb mainly originated from traffic sources, with a contribution rate of 72.8% and As mainly came from soil parent materials, with a contribution rate of 69.7%. The influence of soil organic matter on the content of heavy metals was multifaceted. In addition to that of soil organic matter, the effects of elevation, fertilizer usage and agrotype were also significant. The main load elements of factor 4 were Hg and Cr. Therefore, it was inferred that factor 4 was a mixed source composed of agricultural sources and natural sources, and the contribution rates to Cr and Hg were 74.2 and 51.3%, respectively.
To compare the results of the zoned and nonzoned apportionments, combined with the operation results of the two models, the influence degrees of the different environmental factors on the content of five elements were calculated. For the calculation of partition processing, the method proposed by Wu 2020 was used as a reference. Based on the results of the calculated contributions from each zone, the contributions of the major sources for the entire area were calculated by weighting the sum of the area proportion of each zone in relation to the whole study area [15]:
where Gk is the contribution of the kth source factor to the whole area, gmk is the contribution of the kth source factor to the mth zone, Am is the area of the mth zone, and A is the area of the whole study area. Figure 5 shows the importance of the different environmental factors to the five elements in the case of partitioning and not partitioning. The red bars denote partitioned and the blue bars denote nonpartitioned. The most significant influencing factors of the five elements were basically identical, but the weights of some environmental factors were quite different in the two cases of partitioning and nonpartitioning. Compared with those extracted for the zonal treatment, the pollution sources extracted without zonal treatment had the most significant comprehensive impact in the whole study area. However, in our analysis, it was found that this pollution source did not actually have the greatest impact on all regions. For Cd, compared with nonzonal processing, zonal processing highlighted the importance of agricultural activities for Cd enrichment. Studies have shown that the application of Cd-containing fertilizers is an important source of Cd in agricultural soils [51]. In addition, the consideration of specific zones highlighted the importance of soil organic matter and elevation for Hg accumulation. For As, the zonal treatment highlighted the importance of soil parent materials and sewage irrigation. The arsenic-containing wastewater discharged from mining operations enters the river and then causes soil pollution through river water irrigation, which often occurs in areas with developed mining industries [52]. It is obvious that the zonal treatment highlighted the importance of traffic sources to Pb accumulation, while the influence of traffic sources was not significant in the nonzonal treatment. A study by Choi et al. [53] showed that the wear of tires and brakes in cars, as well as exhaust emissions, can lead to Pb accumulation in the soil near roads. For Cr, in addition to the influence of agrotype, the zonal treatment highlighted the influence of soil organic matter.
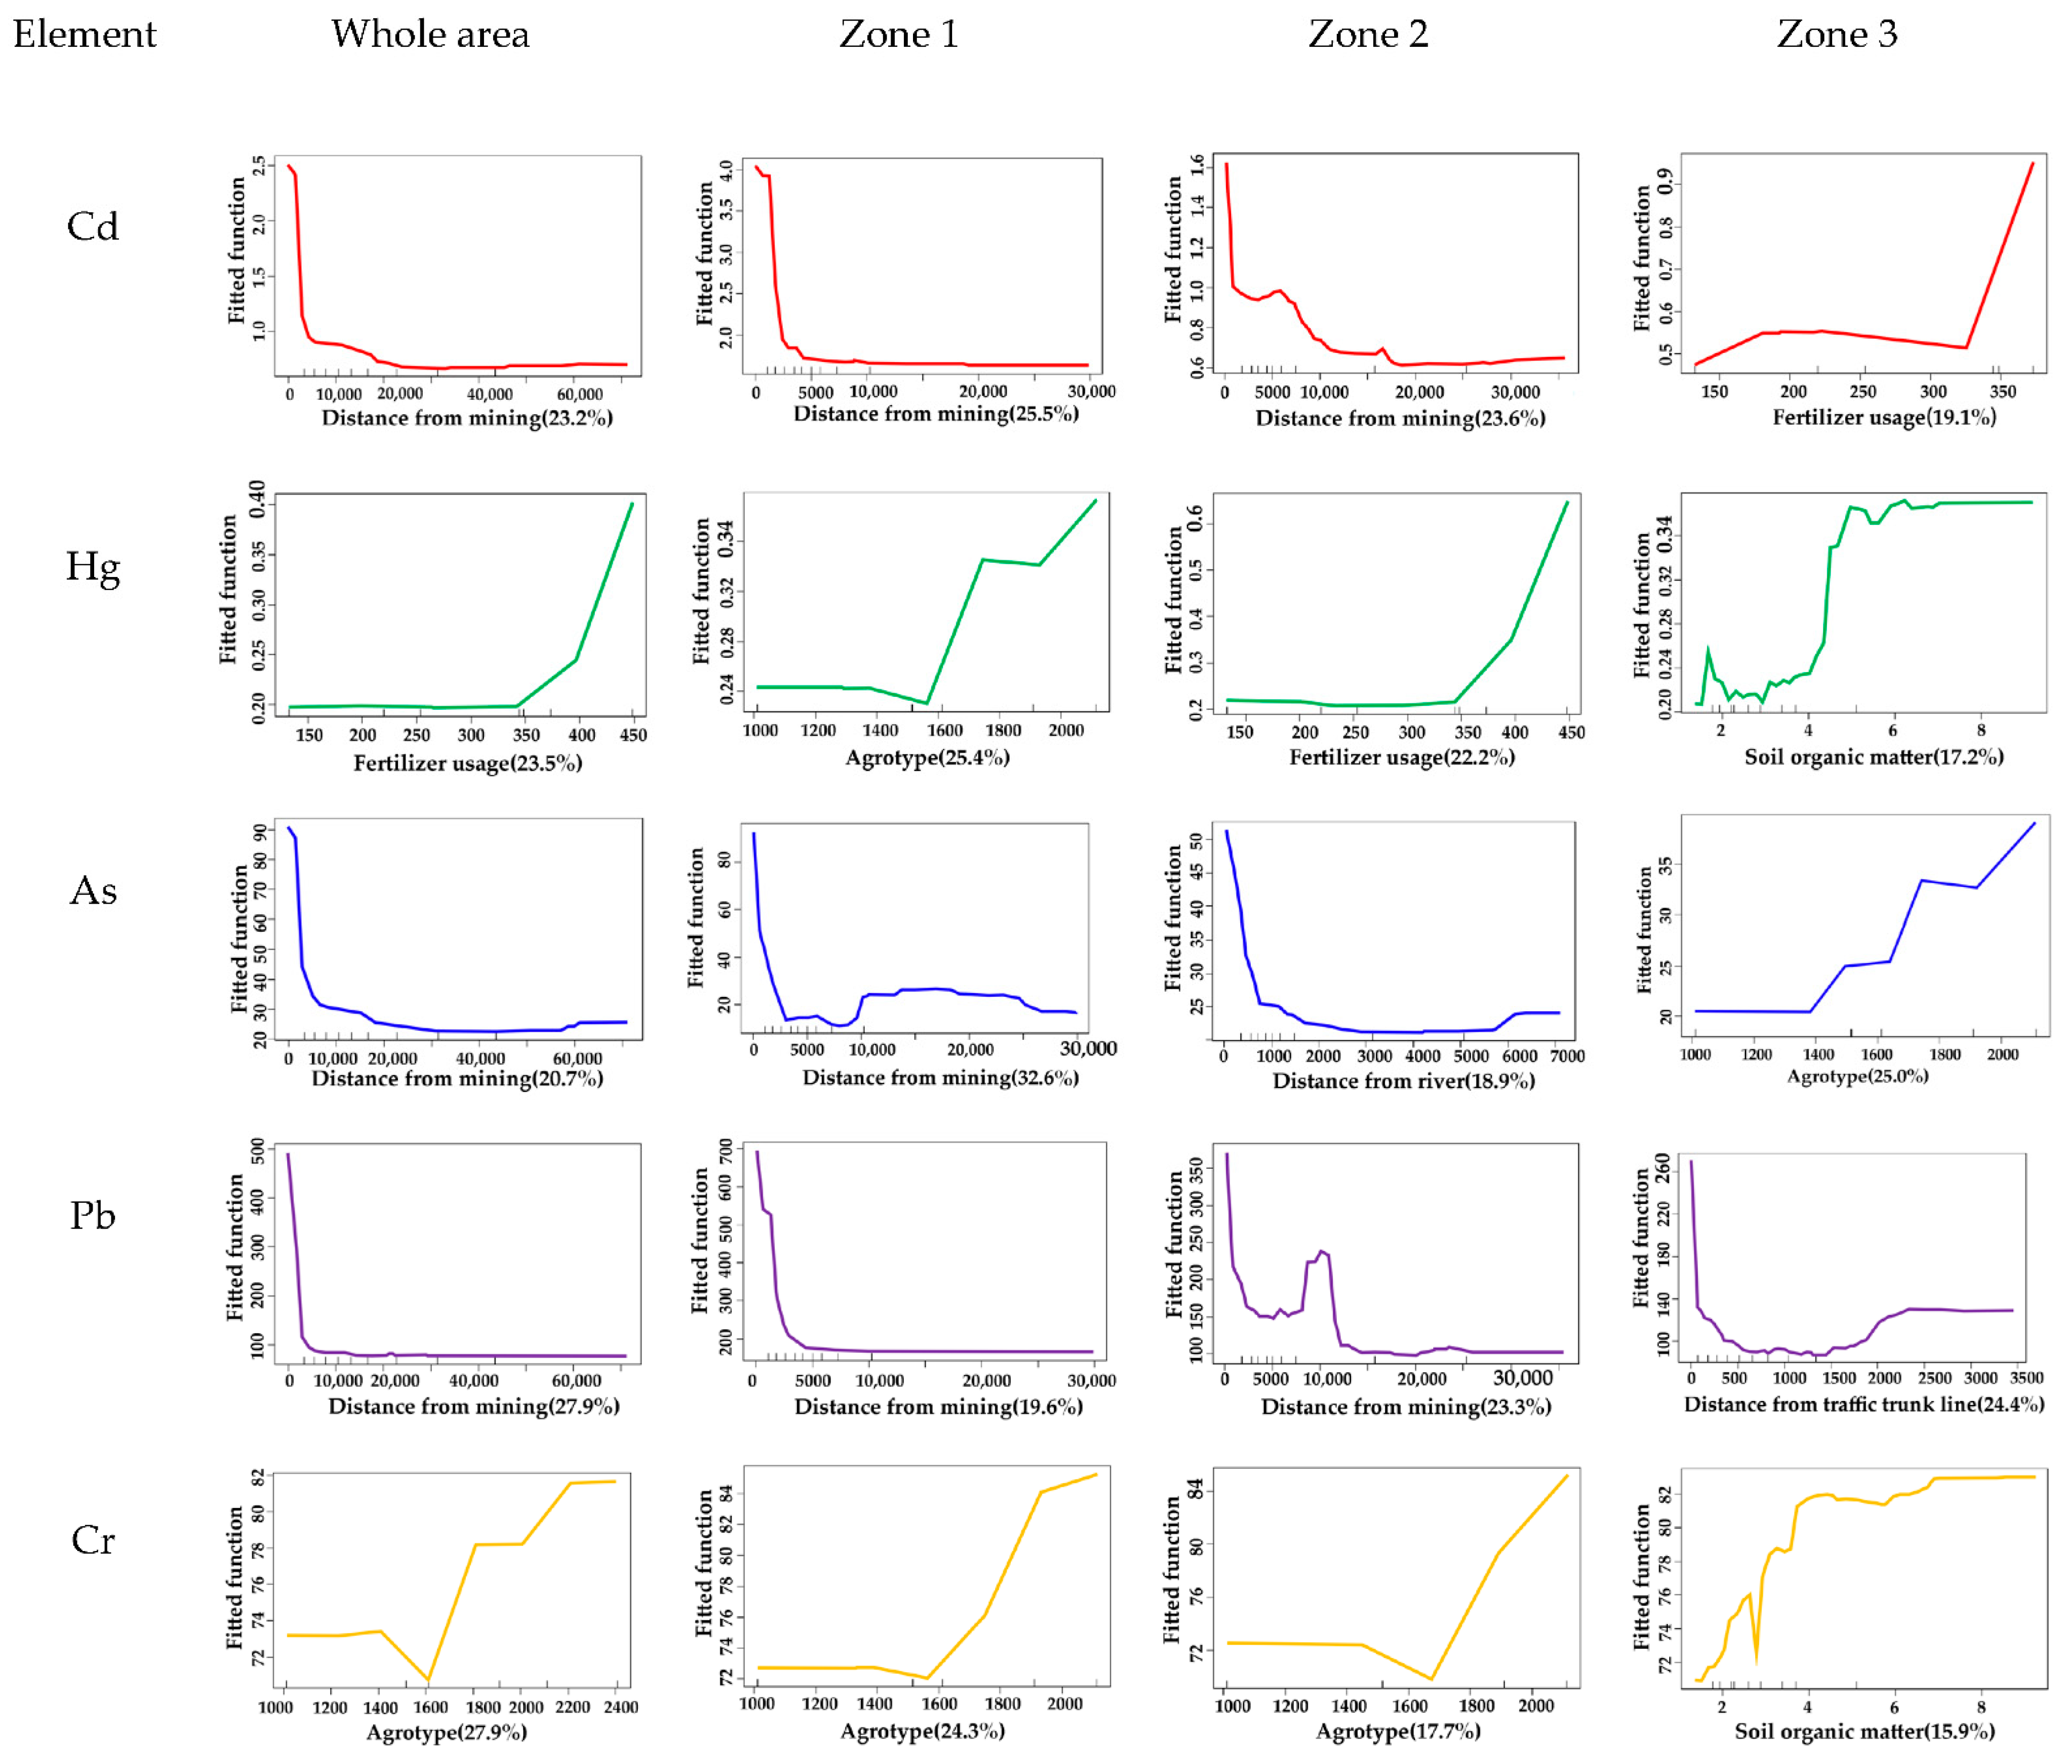
4.4. Dependence of Heavy Metals on Major Environmental Factors
According to the results of the PMF and RF analyses, the main influencing factors of the content of the five evaluated heavy metals in each region were selected to discuss the dependence between the content of heavy metals and the main anthropogenic influencing factors. Figure 6 shows the dependence of the five heavy metals on their main influencing factors in the different regions.
The main influences of the mining industry on Cd, Pb and As occurred within 5 km of the surrounding area. At distances greater than 5 km, the degree of influence should gradually stabilize. The industrial waste gas discharged by the mining industry is one of the important ways to accumulate heavy metals in soil. Heavy metals mainly enter the soil by means of atmospheric dry and wet sedimentation. Heavy metal pollutants in the atmosphere are affected by many factors during their migration, including wind, turbulence, weather patterns and geography [54]. In addition, the temperature of gas and the height of its emissions also affect how far it travels [55]. Relevant data show that the influence of industrial waste gas on the content of heavy metals in the surrounding soil drops to the background value at 5km [56], which is basically consistent with the conclusions obtained.
There was a turning point in the influence of fertilizer usage on Cd and Hg. Only when the annual usage per unit grid area reached 330 tons and 350 tons, respectively, did its influence become significant. The influence of rivers on As tended to be stable at 800 m. Within 800 m, there was a significant negative correlation with the distance between the sampling point and the river. The influence range of agricultural sources on heavy metals in soil are greatly influenced by external human intervention. For example, the type of fertilizers and pesticides, and the amount of water in rivers, can also influence the accumulation of heavy metals in soil. The influence of traffic sources on Pb tended to be stable at 500 m. Within 500 m, there was a significant negative correlation with the distance between the sampling point and traffic trunk line. Factors affecting the distribution pattern of soil heavy metals on side of the road mainly include traffic flow, vehicle type, green belt area and local natural conditions. Due to different influencing factors, the distribution and influence range of heavy metals on side of the road are quite different. Zechmeister et al. studied the accumulation of heavy metals in nine roads in Austria and found that the content of most heavy metals decreased exponentially with the distance from the road and dropped to the background value within 250 m. The influence range of roads with a large traffic flow in a single part may reach 1000 m [57].
Pollution of soil by heavy metals is a complex problem that intersects with nature and society, and industrial emissions are very important factors affecting the concentration of heavy metals in soil. Reducing the pollution of soil by heavy metals as a result of industrial activities is the only means for the sustainable development of industry. To reduce soil heavy metal pollution, it is necessary to identify the sources of heavy metals in detail and then use these key influencing factors to reduce the soil pollution through effective policy measures. Through zonal treatment in large-scale areas influenced by industry, not only can the major environmental factors affecting heavy metal concentrations be identified but also the secondary pollution sources at a local scale can be identified to clarify the multiple sources of heavy metals in complex environmental systems. This study represents the first approach based on zonal treatment to explore the sources of heavy metals in soils under industrial influence.
In this paper, through the combination of the PMF model and RF model, the quantitative relationship of the sources and sinks of heavy metals was established, and various sources of heavy metals in the soil under the influence of industry were revealed, including industrial waste discharged by the mining industry, irrigation, fertilizer, transportation and soil parent materials. Notably, sewage irrigation, traffic discharge and fertilizers were identified as new local artificial sources in the study area based on the zonal treatment, and these sources were not identified as independent factors on the basis of basic source apportionment alone. The results showed that zonal treatment based on the unique geographical characteristics of the study area was particularly powerful for providing valuable information about the sources of heavy metals in soil.
Theoretically, all the factors that can affect spatial heterogeneity can be regarded as the basis for partitioning, but different partitioning methods naturally have different research applications. In the industrial influence area, industrial discharge is the primary source of anthropogenic heavy metal pollution in soil and has the most significant influence on the spatial heterogeneity of such pollution. Therefore, it is most suitable to discuss the sources of pollution in the industrial influence area with the spatial distribution of key polluting enterprises as the basis of division. It has been proven that the spatial differences in heavy metal content in soil are very obvious in different subregions.
Of course, some uncertainties still exist in this study. In terms of the selection of environmental factors, although the 12 selected environmental factors involve various sources of heavy metals, it is not known whether some other special pollution sources exist in practice, which will cause some deviation in the quantitative identification of the sources and sinks of pollution sources. In the process of using the RF model, we assume that there is a simple linear relationship between environmental factors and heavy metal content, while there may be a limit on the impact of environmental factors on heavy metals in reality. When this limit is exceeded, the relationship between the environmental factors and heavy metal content is no longer linear. Moreover, there may be interactions between environmental factors.
The results showed that Cd, Pb and As were mainly affected by the mining industry, while they originated from different pollution sources (Cd and Pb originated from the same pollution source, while As was derived from another pollution source). This indicates that these three heavy metals were affected differently by the mining industry in different geographical locations (Cd and Pb were affected by the same location of the mining industry). In zone 3, among the four pollution sources extracted in the research results, F4 was a mixed source of natural sources and agricultural sources, and the main load elements were Hg and Cr. While Hg mainly originated from fertilizer usage, Cr was mainly affected by the soil parent materials, indicating that in zone 3, the high-value area for fertilizer usage was the same as the high-background-value area for Cr, and thus these two elements were extracted into the same source in the operation result. However, there is still no clear solution regarding how pollution sources affect the heavy metal content in detail. For example, why there is a turning point in the influence of fertilizer usage on Cd and Hg and how soil parent materials affect heavy metal contents needs further study and discussion.
5. Conclusions
This study focused on application values obtained from partition computing in relation to receptor model source apportionment. Based on the spatial distribution of key polluting enterprises, the study area was divided into three subregions with different characteristics, and the concentrations, pollution levels and pollution sources of five heavy metals in the subregions were discussed. The results of the study showed that the average concentrations of the five heavy metals were 9.46, 2.36, 2.22, 3.27 and 1.05 times the background values in Hunan soil. Igeo was applied to assess the soil status in each subregion. The order of the heavy metal Igeo values was Cd > Hg > Pb > As > Cr, with Cd associated with moderately to strongly polluted conditions, Hg, As and Pb associated with unpolluted to moderately polluted conditions, and Cr associated with practically unpolluted conditions. The Igeo values of the five heavy metals in the three subregions were not completely identical, and they all decreased to a certain extent from zone 1 to zone 3.
The analysis of heavy metal sources showed that the mining industry is the most significant anthropogenic factor affecting the content of Cd, Pb and As in the whole area, with contribution rates of 87.7, 88.5 and 62.5%, respectively, and the main influence area was within 5 km from the mining site. In addition, Cd originated mainly from agricultural activities, with a contribution rate of 63.6%, in zone 3. As mainly originated from sewage irrigation, with a contribution rate of 65.0%, in zone 2, and the main influence area was within 800 m from the river. As mainly originated from soil parent materials, with a contribution rate of 69.7%, in zone 3. Pb mainly originated from traffic emissions, with a contribution rate of 72.8%, in zone 3, and the main influence area was within 500 m from the traffic trunk line. Hg was mainly derived from soil parent materials with a contribution rate of 92.1% in zone 1, from agricultural activities with a contribution rate of 77.5% in zone 2, and from a mixture of natural and agricultural sources with a contribution rate of 74.2% in zone 3. Cr was mainly derived from the soil parent materials in the whole area, with a contribution rate of 90.7%. By using the receptor model to analyze pollution sources over a large scale, the results of heavy metal source analysis can be more accurate and detailed through regional treatment, and more reasonable suggestions can be provided for regional enterprise management and soil pollution prevention and control.
Author Contributions
Conceptualization, Y.X.; methodology, Y.X.; software, Y.X. and M.S.; validation, Y.X.; formal analysis, Y.X.; investigation, Y.X.; resources, Y.X.; data curation, Y.X.; writing—original draft preparation, Y.X.; writing—review and editing, H.S.; visualization, Y.X.; supervision, H.S., Y.F., C.W. and L.M.; project administration, H.S.; funding acquisition, H.S. All authors have read and agreed to the published version of the manuscript.
Funding
This research was funded by National Key Research and Development Program of China, grant number 2018YFC1800203; National Key Research and Development Program of China, grant number 2018YFF0213401; 2019 “Practical training plan” Project of Beijing Information Science and Technology University.
Institutional Review Board Statement
Not applicable.
Informed Consent Statement
Not applicable.
Data Availability Statement
Data sharing not applicable.
Acknowledgments
We thank the staff of Institute of Soil and Solid Waste Environment, Chinese Research Academy of Environmental Sciences, and Technical Centre for Soil, Agricultural and Rural Ecology and Environment, Ministry of Ecology and Environment for their help.
Conflicts of Interest
The authors declare no conflict of interest.
References
- Hu, B.; Wang, J.Y.; Jin, B.; Li, Y.; Shi, Z. Assessment of the potential health risks of heavy metals in soils in a coastal industrial region of the Yangtze river delta. Environ. Sci. Pollut. R. 2017, 24, 19816–19826. [Google Scholar] [CrossRef]
- Huang, J.H.; Guo, S.T.; Zeng, G.M.; Li, F.; Gu, Y.L.; Shi, Y.H.; Shi, L.X.; Liu, W.C.; Peng, S.Y. A new exploration of health risk assessment quantification from sources of soil heavy metals under different land use. Environ. Pollut. 2018, 243, 49–58. [Google Scholar] [CrossRef]
- Singh, U.K.; Kumar, B. Pathways of heavy metals contamination and associated human health risk in Ajay River basin, India. Chemosphere 2017, 174, 183–199. [Google Scholar] [CrossRef]
- Saleem, M.; Iqbal, J.; Shah, M.H. Non-carcinogenic and carcinogenic health risk assessment of selected metals in soil around a natural water reservoir, Pakistan. Ecotoxicol. Environ. Saf. 2014, 108, 42–51. [Google Scholar] [CrossRef] [PubMed]
- Shi, T.R.; Ma, J.; Wu, X.; Ju, T.N.; Lin, X.L.; Zhang, Y.Y.; Li, X.H.; Gong, Y.W.; Hou, H.; Zhao, L.; et al. Inventories of heavy metal inputs and outputs to and from agricultural soils:A review. Ecotoxicol. Environ. Saf. 2018, 164, 118–124. [Google Scholar] [CrossRef] [PubMed]
- Peng, H.; Chen, Y.L.; Weng, L.P.; Ma, J.; Ma, Y.L.; Li, Y.T.; Islam, M.S. Comparisons of heavy metal input inventory in agricultural soils in north and south China:A review. Sci. Total Environ. 2019, 660, 776–786. [Google Scholar] [CrossRef]
- Dong, B.; Zhang, R.Z.; Gan, Y.D.; Cai, L.Q.; Freidenreich, A.; Wang, K.P.; Guo, T.W.; Wang, H.B. Multiple methods for the identification of heavy metal sources in cropland soils from a resource-based region. Sci. Total Environ. 2019, 651, 3127–3138. [Google Scholar] [CrossRef] [PubMed]
- Wang, S.; Cai, L.M.; Wen, H.H.; Luo, J.; Wang, Q.S.; Liu, X. Spatial distribution and source apportionment of heavy metals in soil from a typical county-level city of Guangdong Province, China. Sci. Total Environ. 2019, 655, 92–101. [Google Scholar] [CrossRef] [PubMed]
- Huang, Y.; Deng, M.H.; Wu, S.F.; Japenga, J.; Li, T.Q.; Yang, X.E.; He, Z.L. A modified receptor model for source apportionment of heavy metal pollution in soil. J. Hazard. Mater. 2018, 354, 161–169. [Google Scholar] [CrossRef] [PubMed]
- Zhao, Y.J.; Deng, Q.Y.; Lin, Q.; Zeng, C.Y.; Zhong, C. Cadmium source identification in soils and high-risk regions predicted by geographical detector method. Environ. Pollut. 2020, 263, 114338. [Google Scholar] [CrossRef]
- Srishti, J.; Sudhir, K.S.; Manoj, K.S. Source apportionment of PM10 over three tropical urban atmospheres at Indo-Gangetic plain of India: An approach using different receptor models. Arch. Environ. Contam. Toxicol. 2019, 76, 114–128. [Google Scholar]
- Zhang, J.; Li, R.F.; Zhang, X.Y.; Bai, Y.; Cao, P.; Hua, P. Vehicular contribution of PAHs in size dependent road dust: A source apportionment by PCA-MLR, PMF, and Unmix receptor models. Sci. Total Environ. 2019, 649, 1314–1322. [Google Scholar] [CrossRef] [PubMed]
- Qing, X.D.; Yin, L.D.; Zhang, X.H.; Huang, Y.; He, M. A New Receptor model based on the alternating trilinear decomposition followed by a score matrix reconstruction for source apportionment of ambient particulate matter. Sci. J. Anal. Chem. 2020, 8, 93. [Google Scholar]
- Liu, Q.Y.; Gong, J.X. Assessment of source contributions to organic carbon in ambient fine particle using receptor model with inorganic and organic source tracers at an urban site of Beijing. SN Appl. Sci. 2020, 2, 291–333. [Google Scholar] [CrossRef]
- Wu, J.; Li, J.; Teng, Y.G.; Chen, H.Y.; Wang, Y.Y. A partition computing-based positive matrix factorization (PC-PMF) approach for the source apportionment of agricultural soil heavy metal contents and associated health risks. J. Hazard. Mater. 2020, 388, 121766. [Google Scholar] [CrossRef] [PubMed]
- Wang, Y.M.; Zhang, L.X.; Wang, J.N.; Lv, J.S. Identifying quantitative sources and spatial distributions of potentially toxic elements in soils by using three receptor models and sequential indicator simulation. Chemosphere. 2020, 242, 125266. [Google Scholar] [CrossRef] [PubMed]
- Wang, W.Z.; Xu, W.H.; Zhou, K.; Xiong, Z.T. Research progressing of present contamination of Cd in soil and restoration method. Wuhan Univ. J. Nat. Sci. 2015, 20, 430–444. [Google Scholar] [CrossRef]
- Qiu, L.F.; Wang, K.; Long, W.L.; Wang, K.; Hu, W.; Amable, G.S. A comparative assessment of the influences of human impacts on soil Cd concentrations based on stepwise linear regression, classification and regression tree, and random forest models. PLoS ONE 2017, 11, e0151131. [Google Scholar] [CrossRef] [Green Version]
- Hu, Y.N.; Cheng, H.F. Application of stochastic models in identification and apportionment of heavy metal pollution sources in the surface soils of a large-scale region. Environ. Sci. Technol. 2013, 47, 3752–3760. [Google Scholar] [CrossRef]
- Stojić, A.; Stojić, S.S.; Reljin, I.; Čabarkapa, M.; Šoštarić, A.; Perišić, M.; Mijić, Z. Comprehensive analysis of PM10 in Belgrade urban area on the basis of long-term measurements. Environ. Sci. Pollut. Res. 2016, 23, 10722–10732. [Google Scholar] [CrossRef]
- Zhou, X.Y.; Wang, X.R. Impact of industrial activities on heavy metal contamination in soils in three major urban agglomerations of China. J. Clean. Prod. 2019, 230, 1–10. [Google Scholar] [CrossRef]
- Adgate, J.L.; Willis, R.D.; Buckley, T.J.; Chow, J.C.; Watson, J.G.; Rhoads, G.G.; Lioy, P.J. Chemical mass balance source apportionment of lead in house dust. Environ. Sci. Technol. 1998, 32, 108–114. [Google Scholar] [CrossRef]
- Lv, J.S.; Liu, Y. An integrated approach to identify quantitative sources and hazardous areas of heavy metals in soils. Sci. Total Environ. 2019, 646, 19–28. [Google Scholar] [CrossRef] [PubMed]
- Zhi, Y.Y.; Li, P.; Shi, J.C.; Zeng, L.Z.; Wu, L.S. Source identification and apportionment of soil cadmium in cropland of Eastern China: A combined approach of models and geographic information system. J. Soils Sediments 2016, 16, 467–475. [Google Scholar] [CrossRef]
- Maier, M.L.; Balachandran, S.; Sarnat, S.E.; Turner, J.R.; Mulholland, J.A.; Russell, A.G. Application of an ensemble-trained source apportionment approach at a site impacted by multiple point sources. Environ. Sci. Technol. 2013, 47, 3743–3751. [Google Scholar] [CrossRef]
- Chen, H.Y.; Teng, Y.G.; Lu, S.J.; Wang, Y.Y.; Wu, J.; Wang, J.S. Source apportionment and health risk assessment of trace metals in surface soils of Beijing metropolitan, China. Chemosphere 2016, 144, 1002–1011. [Google Scholar] [CrossRef]
- Qu, M.K.; Wang, Y.; Huang, B.; Zhao, Y.C. Source apportionment of soil heavy metals using robust absolute principal component scores-robust geographically weighted regression (RAPCS-RGWR) receptor model. Sci. Total Environ. 2018, 626, 203–210. [Google Scholar] [CrossRef]
- Zhang, Y.M.; Li, S.; Wang, F.; Chen, J.; Wang, L.Q. An innovative expression model of human health risk based on the quantitative analysis of soil metals sources contribution in different spatial scales. Chemosphere 2018, 207, 60–69. [Google Scholar] [CrossRef]
- MEEC (Ministry of Ecology and Environment of the People’s Republic of China). Solid Waste–Determination of Metals–Inductively Coupled Plasma Mass Spectrometry (HJ 766-2015); MEEC: Kuala Lumpur, Malaysia, 2015.
- Rout, S.; Kumar, A.; Sarkar, P.K.; Mishra, K.; Ravi, P.M. Application of Chemometric methods for assessment of heavy metal pollution and source apportionment in Riparian zone soil of Ulhas River estuary, India. Int. J. Environ. Sci. 2013, 3, 1485–1496. [Google Scholar]
- Simeonov, V.; Massart, D.L.; Andreev, G.; Tsakovski, S. Assessment of metal pollution based on multivariate statistical modeling of ’hot spot’ sediments from the Black Sea. Chemosphere 2000, 41, 1411–1417. [Google Scholar] [CrossRef]
- CNEMC (China National Environmental Monitoring Center). The Background Concentrations of Soil Elements of China; China Environmental Science Press: Beijing, China, 1990. [Google Scholar]
- Chen, T.B.; Zheng, Y.M.; Lei, M.; Huang, Z.C.; Wu, H.T.; Chen, H.; Fan, K.K.; Yu, K.; Wu, X.; Tian, Q.Z. Assessment of heavy metal pollution in surface soils of urban parks in Beijing, China. Chemosphere 2005, 60, 542–551. [Google Scholar] [CrossRef] [PubMed]
- Paatreo, P.; Tapper, U. Positive matrix factorization: A non-negative factor model with optimal utilization of error estimates of data values. Environmetrics 1994, 5, 111–126. [Google Scholar] [CrossRef]
- Jiang, Y.X.; Chao, S.H.; Liu, J.W.; Yang, Y.; Chen, Y.J.; Zhang, A.C.; Cao, H.B. Source apportionment and health risk assessment of heavy metals in soil for a township in Jiangsu Province, China. Chemosphere 2016, 168, 1658–1668. [Google Scholar] [CrossRef] [PubMed]
- Chen, H.Y.; Teng, Y.G.; Li, J.; Wang, J.S. Source apportionment of trace metals in river sediments: A comparison of three methods. Environ. Pollut. 2016, 211, 28–37. [Google Scholar] [CrossRef] [PubMed]
- Breiman, L. Random forests. Mach. Learn. 2001, 45, 5–32. [Google Scholar] [CrossRef] [Green Version]
- Shih, Y.S.; Tsai, H.W. Variable selection bias in regression trees with constant fits. Comput. Stat. Data Anal. 2004, 45, 595–607. [Google Scholar] [CrossRef]
- Strobl, C.; Boulesteix, A.L.; Zeileis, A.; Hothorn, T. Bias in random forest variable importance measures: Illustrations, sources and a solution. Bioinformatics 2007, 8, 25. [Google Scholar] [CrossRef] [Green Version]
- Breiman, L. Manual on Setting Up, Using, and Understanding Random Forests V3.1. 2002. Available online: https://www.stat.berkeley.edu/~breiman/Using_random_forests_V3.1.pdf (accessed on 31 December 2020).
- Ramón, D.U.; Sara, A.A. Gene selection and classification of microarray data using random forest. Bioinformatics 2006, 7, 3. [Google Scholar]
- Ishwaran, H. Variable importance in binary regression trees and forests. Electron. J. Stat. 2007, 1, 519–537. [Google Scholar] [CrossRef]
- Genuer, R.; Poggi, J.M.; Tuleau, C. Random Forests: Some methodological insights. arXiv 2008, arXiv:0811.3619. [Google Scholar]
- Wu, J.; Teng, Y.G.; Wu, B.B.; Su, J.; Wang, J.S. Comparison of sources and spatial distribution of heavy metals at two peri-urban areas in Southwest Shenyang, China. Environ. Eng. Manag. J. 2019, 18, 31–39. [Google Scholar]
- MEEC (Ministry of Ecology and Environment of the People’s Republic of China). Soil Environmental Quality Risk Control Standard for Soil Contamination of Agricultural Land (GB 15618-2018); MEEC: Kuala Lumpur, Malaysia, 2018.
- Zhao, C.; Yang, J.; Zheng, Y.M.; Yang, J.X.; Guo, G.H.; Wang, J.Y.; Chen, T.B. Effects of environmental governance in mining areas: The trend of arsenic concentration in the environmental media of a typical mining area in 25 years. Chemosphere 2019, 235, 849–857. [Google Scholar] [CrossRef] [PubMed]
- Zhang, K.; Li, H.F.; Cao, Z.G.; Shi, Z.Y.; Liu, J. Human health risk assessment and risk source analysis of arsenic in soil from a coal chemical plant in Northwest China. J. Soils Sediments 2019, 19, 2785–2794. [Google Scholar] [CrossRef]
- Georgina, G.R.; Nadia, M.V.; Smolders, E. The labile fractions of metals and arsenic in mining-impacted soils are explained by soil properties and metal source characteristics. J. Environ. Qual. 2020, 49, 417–427. [Google Scholar]
- Facchinelli, A.; Sacchi, E.; Mallen, L. Multivariate statistical and GIS based approach to identify heavy metal sources in soils. Environ. Pollut. 2001, 114, 313–324. [Google Scholar] [CrossRef]
- Zhong, T.Y.; Chen, D.M.; Zhang, X.Y. Identification of potential sources of mercury (Hg) in farmland soil using a decision tree method in China. Int. J. Environ. Res. Public Health 2016, 13, 1111. [Google Scholar] [CrossRef] [Green Version]
- Rafique, N.; Tariq, S.R. Distribution and source apportionment studies of heavy metals in soil of cotton/wheat fields. Environ. Monit. Assess. 2016, 188, 309. [Google Scholar] [CrossRef]
- Wang, J.F.; Song, J.J.; Xie, R.H.; Li, Y.Y.; Xu, M.; Lu, J.; Xia, X.W.; Li, G.B. Source identification of heavy metals in surface sediments from a river in Anhui, China. Environ. Forensics 2020, 21, 167–175. [Google Scholar] [CrossRef]
- Young, C.J.; Hyeryeong, J.; Choi, K.Y.; Hong, G.H.; Yang, D.B.; Kim, K.; Kongtae, R. Source identification and implications of heavy metals in urban roads for the coastal pollution in a beach town, Busan, Korea. Mar. Pollut. Bull. 2020, 161, 111724. [Google Scholar]
- Ren, F.; Xu, G.D.; He, X.C. Study on the influence range of soil pollution in non-ferrous metal mining industry. China Min. Eng. 2018, 47, 26–30. (In Chinese) [Google Scholar]
- Zhu, Y.T.; Li, J.H.; Ling, H.; Li, J. An efficient diffusion model for a real-time gas diffusion simulation system. Adv. Mater. Res. 2013, 2493, 390–397. [Google Scholar] [CrossRef]
- Method for Determination of Particulate Matter in Fixed Source Exhaust and Sampling of Gaseous Pollutants (GBAT 1619196); MEEC: Beijing, China, 1996. (In Chinese)
- Zechmeister, H.G.; Hohenwallner, D.; Riss, A.; Hanus-Illnar, A. Estimation of element deposition derived from road traffic sources by using mosses. Environ. Pollut. 2005, 138, 238–249. [Google Scholar] [CrossRef] [PubMed]
Figure 1.
Soil sampling locations in the study area, which is divided into three zones.

Figure 2.
Box plots of geo-accumulation index (Igeo) values for heavy metals. (a) Whole area, (b) Zone 1, (c) Zone 2, (d) Zone 3.
Figure 2.
Box plots of geo-accumulation index (Igeo) values for heavy metals. (a) Whole area, (b) Zone 1, (c) Zone 2, (d) Zone 3.

Figure 3.
Contributions of soil heavy metal pollution sources.

Figure 4.
Degrees of influence of different environmental factors in different zones on each pollution source.
Figure 4.
Degrees of influence of different environmental factors in different zones on each pollution source.

Figure 5.
Variable importance of the individual factors for the partitioned and nonpartitioned soil heavy metal concentrations (the red bars denote partitioned and the blue bars denote nonpartitioned). (a) Variable importance of the individual factors for the concentration of Cd, (b) Variable importance of the individual factors for the concentration of Hg, (c) Variable importance of the individual factors for the concentration of As, (d) Variable importance of the individual factors for the concentration of Pb, (e) Variable importance of the individual factors for the concentration of Cr.

Figure 6.
Partial dependence plots for the random forest (RF) model of the soil heavy metal concentrations.
Figure 6.
Partial dependence plots for the random forest (RF) model of the soil heavy metal concentrations.


Table 1.
Categorization of factors influencing soil heavy metals in industrially affected area.
| Category | Factor | Category | Factor |
|---|---|---|---|
| Industrial | Distance from mining | Agricultural | Pesticide usage (element mesh) |
| Distance from smelting and pressing | Fertilizer usage (element mesh) | ||
| Distance from other industries | Distance from river | ||
| Other | Land-use type | Traffic | Distance from traffic trunk line |
| pH | Natural | Agrotype | |
| Soil organic matter | Elevation |
Table 2.
Descriptive statistics of heavy metal concentrations in soil from different zones.
| Statistics | Cd | Hg | As | Pb | Cr | |
|---|---|---|---|---|---|---|
| Local background values | 0.098 | 0.091 | 14 | 29.7 | 71.4 | |
| Screening values | 0.3 | 2.4 | 30 | 120 | 200 | |
| Whole area (n = 1347) | Minimum | 0.09 | 0.04 | 3.15 | 19.14 | 17.22 |
| Mean | 0.93 | 0.22 | 31.12 | 97.00 | 75.09 | |
| Maximum | 49.53 | 4.45 | 575.33 | 8547.76 | 208.76 | |
| C.V. | 2.09 | 0.86 | 1.27 | 3.13 | 0.45 | |
| Exceeded Rate (%) | 85.08 | 0.01 | 34.74 | 12.77 | 0.01 | |
| Zone 1 (n = 232) | Minimum | 0.29 | 0.09 | 10.31 | 38.73 | 20.40 |
| Mean | 2.16 | 0.24 | 55.67 | 260.09 | 84.76 | |
| Maximum | 49.53 | 0.83 | 575.33 | 8547.76 | 178.44 | |
| C.V. | 2.01 | 0.39 | 1.26 | 2.71 | 0.30 | |
| Exceeded Rate (%) | 99.57 | 0.00 | 64.66 | 41.81 | 0.00 | |
| Zone 2 (n = 573) | Minimum | 0.16 | 0.06 | 5.90 | 25.18 | 18.00 |
| Mean | 0.82 | 0.24 | 32.27 | 74.42 | 77.78 | |
| Maximum | 5.18 | 4.45 | 327.69 | 453.86 | 192.65 | |
| C.V. | 0.67 | 1.06 | 1.05 | 0.67 | 0.42 | |
| Exceeded Rate (%) | 94.24 | 0.01 | 37.00 | 11.69 | 0.00 | |
| Zone 3 (n = 542) | Minimum | 0.09 | 0.04 | 3.15 | 19.14 | 17.22 |
| Mean | 0.51 | 0.18 | 19.39 | 51.05 | 68.09 | |
| Maximum | 2.61 | 1.18 | 87.79 | 240.52 | 208.76 | |
| C.V. | 0.66 | 0.60 | 0.62 | 0.40 | 0.53 | |
| Exceeded Rate (%) | 69.19 | 0.00 | 19.56 | 1.48 | 0.01 |
Publisher’s Note: MDPI stays neutral with regard to jurisdictional claims in published maps and institutional affiliations. |
© 2021 by the authors. Licensee MDPI, Basel, Switzerland. This article is an open access article distributed under the terms and conditions of the Creative Commons Attribution (CC BY) license (http://creativecommons.org/licenses/by/4.0/).
Share and Cite
MDPI and ACS Style
Xu, Y.; Shi, H.; Fei, Y.; Wang, C.; Mo, L.; Shu, M. Identification of Soil Heavy Metal Sources in a Large-Scale Area Affected by Industry. Sustainability 2021, 13, 511. https://0-doi-org.brum.beds.ac.uk/10.3390/su13020511
AMA Style
Xu Y, Shi H, Fei Y, Wang C, Mo L, Shu M. Identification of Soil Heavy Metal Sources in a Large-Scale Area Affected by Industry. Sustainability. 2021; 13(2):511. https://0-doi-org.brum.beds.ac.uk/10.3390/su13020511
Chicago/Turabian StyleXu, Yuan, Huading Shi, Yang Fei, Chao Wang, Li Mo, and Mi Shu. 2021. "Identification of Soil Heavy Metal Sources in a Large-Scale Area Affected by Industry" Sustainability 13, no. 2: 511. https://0-doi-org.brum.beds.ac.uk/10.3390/su13020511
Note that from the first issue of 2016, this journal uses article numbers instead of page numbers. See further details here.