Measurement of 30-Year Urban Expansion Using Spatial Entropy in Changwon and Gimhae, Korea


1
Faculty of Department of Life Sciences, College of Natural Science, Yeungnam University, Gyeongsan 38541, Korea
2
National Institute of Ecology, Seocheon-gun 33657, Korea
*
Author to whom correspondence should be addressed.
Sustainability 2021, 13(2), 632; https://0-doi-org.brum.beds.ac.uk/10.3390/su13020632
Submission received: 1 December 2020
/
Revised: 4 January 2021
/
Accepted: 6 January 2021
/
Published: 11 January 2021
(This article belongs to the Special Issue Geospatial Analysis and Modeling of Urban Greening for Sustainability in Developing Countries)
Abstract
:Entropy is widely used for measuring the degree of urban sprawl. However, despite the intense use of the entropy concept in urban sprawl, entropy’s spatial context has been largely ignored. In this study, we analyzed urban sprawl in Changwon and Gimhae cities, as they shared a common boundary but differed in their population growth and urban expansion. The land cover type, “urban and dry area,” was used to identify urban areas in the two cities, and a land cover map showed the areas of expansion in the 1980s, 1990s, 2000s, and 2010s. Different zoning schemes, namely concentric rings and regular partitioning, were applied. Shannon’s and Batty’s spatial entropy indices were used to measure urban sprawl. The results showed that concentric ring zoning was not suitable for measuring urban sprawl in a decentralized and polycentric city. Batty’s spatial entropy was less affected by the zoning scheme used and reflected the pattern of urban expansion more accurately. Urban sprawl, a phenomenon occurring within a spatial context, can be better understood by measuring spatial entropy with appropriate zoning schemes.
1. Introduction
Urban population growth and accompanying urban expansion are global phenomena that significantly impact the environment and human life, and their scale and intensity are worsening over time [1]. Although there is no widely accepted rigorous definition for the term “urban sprawl” [2,3], it generally means disorderly and excessive urban expansion. Owing to the variation in the definition of urban sprawl [1,2,4], its measurement has been diversely developed and applied depending on the research purposes [1,5,6,7]. In this study, the definition of urban sprawl proposed by Jaeger and Schwick [5], “... a phenomenon that can be visually perceived in the landscape. A landscape suffers from urban sprawl if it is permeated by urban development or solitary building...” was applied. According to the definition, the degree of urban sprawl is measured by the dispersion or amount of artificial structures within a predefined area. The advantage of this definition is that urban sprawl can be intuitively identified. Another advantage is that the spatial distribution and amount of artificial structures can be easily calculated based on remote sensing or GIS (Geographic Information System) data.
Many indices proposed to measure urban sprawl use the quantity of the built-up area or proportion of it as important information for measuring urban sprawl. Due to the increasing number of satellite images and precise GIS data available, the quantity and quality of land cover and land use data have greatly improved. Accordingly, the quantity and configuration of artificial structures are more accurately identified, and the analysis of urban sprawls using these images and data has been greatly facilitated. [7,8,9,10]. Land cover maps are very useful for calculating the data of built-up areas. For example, the Ministry of the Environment for South Korea provides a periodic update of the land cover map that includes a category known as “urban and dry area,” which equates to Korea’s built-up areas.
Among various indices used for measuring urban sprawl [5,7], Shannon’s entropy method is widely used to measure the degree or intensity of urban sprawl [8,11,12,13,14,15]. Entropy is conceptually appropriate to measure the disorder of urban expansion. Urban sprawl’s intensity increases as built-up areas disperse widely across an entire city rather than concentrated in a restricted area. Such overdispersion of urban areas leads to an increase in entropy. Shannon’s entropy is a popular way of measuring the dispersion of an urban area. It is easy to understand and calculate with minimum data; however, its drawbacks include over-sensitivity to spatial configuration, such as zone partitioning, defining the city center [6]. Nazarnia, Harding, and Jaeger [6] articulated that Shannon’s entropy’s most crucial drawback is that it easily fails to reflect the difference of spatial characteristics, e.g., dispersed vs. compact built-up area arrangements. The difficulty of capturing spatial context is an inherent limitation of the non-spatial model. However, studies have widely ignored spatial attributes that affect entropy in spatial data analysis. Batty [16] pointed out that a measure that incorporates spatial size explicitly is essential to geography and proposed spatial entropy for the measurement. Although spatial entropy is a useful concept for capturing the spatial context of urban sprawl, the concept has not been fully applied in the study.
In this study, the difference between Shannon’s entropy, conceptually non-spatial entropy, and Batty’s spatial entropy, taking into account the spatial context of entropy, is explained. Subsequently, we applied the two entropy indices to measure urban sprawl in two cities (Changwon and Gimhae) in South Korea that have grown via a different urban expansion process over the past 30 years.
2. Methods
2.1. Shannon’s Entropy and Batty’s Spatial Entropy
Information entropy is a numerical value of the uncertainty of the information proposed by Shannon (1948), calculated as follows:
where n represents the number of distinct types, and represents the proportion of type i to the total quantity. The value of exists between 0 and log(n). When all the frequencies of n types are equal, becomes log(n). To standardize entropy, can be divided by log(n), and the value of exists between 0 and 1.
Shannon’s entropy is a well-known concept and has the advantage of being easy to calculate, but it originally does not consider the spatial context. To measure urban sprawl, an inherently spatial phenomenon, a target region needs to be partitioned into several zones according to the administrative boundary or arbitrary zone. A concentric ring zone or a regularly partitioned zone is common for an arbitrary zone. In measuring entropy for urban sprawl, only built-up coverage type is used. After partitioning with n zones, the proportion of built-up area ) contained in an ith zone divided by the total built-up area is calculated, and entropy is calculated as follows [12,17]:
where n_zone is the number of zones. This formula is widely used, but one of its limitations is that it does not take into account differences in the size of the area among zones. It is common for administrative districts to have large variations in size. The core area of an administrative district is smaller while its peripheral area is larger, although the built-up area is concentrated at the city center. This tendency is similar to concentric ring zones partitioned at the same interval. Thus, the results may be misleading if the area of the zone is not considered (Table 1 and Table 2). When the built-up area is evenly distributed, Shannon’s entropy is maximized (1.609 = loge(5), Table 1a). However, the degree of urbanization varies among the zones. Zone 2 and 5 are highly urbanized, while the other zones are not.
As Batty [16] extended Shannon’s discrete entropy to spatial entropy, Batty’s index calculates entropy in continuous space. The following formula defines Batty’s (spatial) entropy index [16,18]:
where is the area of compartment “a” when the total area A is divided into any section. is the ratio at which a specific event occurs within “a” (compartment) of the whole event; in this study, it is the ratio of the built-up area. When converges at zero, it can be considered to be a continuous entropy. Batty’s spatial entropy is useful because it can compare entropy under different compartment division schemes “in absolute terms” [16]. In addition, Batty’s spatial entropy makes it possible to compare different regions [16], which is difficult using Shannon’s entropy. In contrast to Shannon’s entropy, Batty’s spatial entropy is maximized when the built-up area is distributed proportionally to the zone’s area (Table 1b). Shannon’s entropy decreases to 58.7% of its maximum value (0.945/1.609). Conversely, when Shannon’s entropy is maximized, Batty’s spatial entropy decreases to 88.8% of its maximum level (7.561/8.517). The relative entropy (entropy/maximum entropy) is useful for comparing the entropies of different regions with different areas and the number of zones. We used relative entropy in this study. The maximum of Shannon’s entropy is log (n_zone). The study area’s entropy was divided by log (n_zone) to obtain the relative Shannon’s entropy. The maximum of Batty’s spatial entropy depends on the area of the target region and the number of zones. The maximum of Batty’s spatial entropy was calculated first and then used to calculate the relative Batty’s spatial entropy. It is worth noting that entropy is determined by the relative distribution of the entity (whether spatial or non-spatial), not by the total amount of the entity.
2.2. Center of the Built-Up Area
To analyze urban expansion characteristics, the center point of the built-up area for each period was calculated. The center point was obtained by finding the center of the mass (R). R represents the coordinates in which the sum of each mass (mi) in the system becomes zero, as shown by the following formula:
In this study, the mass of the built-up area pixels was considered to be 1, and the center point coordinates were obtained as follows:
where M is the total number of built-up area pixels. If a city expands radially or symmetrically, the center point will barely change, but if the city expands asymmetrically, the center point will change.
2.3. Zone Partitioning
In studies measuring urban sprawl, diverse ways of partitioning zones were adopted, such as using concentric ring zones [6,13,19], grid partitioning [14], and the administrative district [15]. The former two methods were applied in the present case study. The administrative district was not used because the number of districts varies from city to city. In addition, when using administrative districts, highly developed districts tend to have small areas. In the case of concentric ring partitioning, the center of the built-up area was used as the ring center, and the zone boundaries were determined so that each zone had the same area. As the center of the mass has been changing over the years, concentric zones changed as well. However, the grid zones were not changed because the boundary of the study area was fixed.
2.4. Study Area
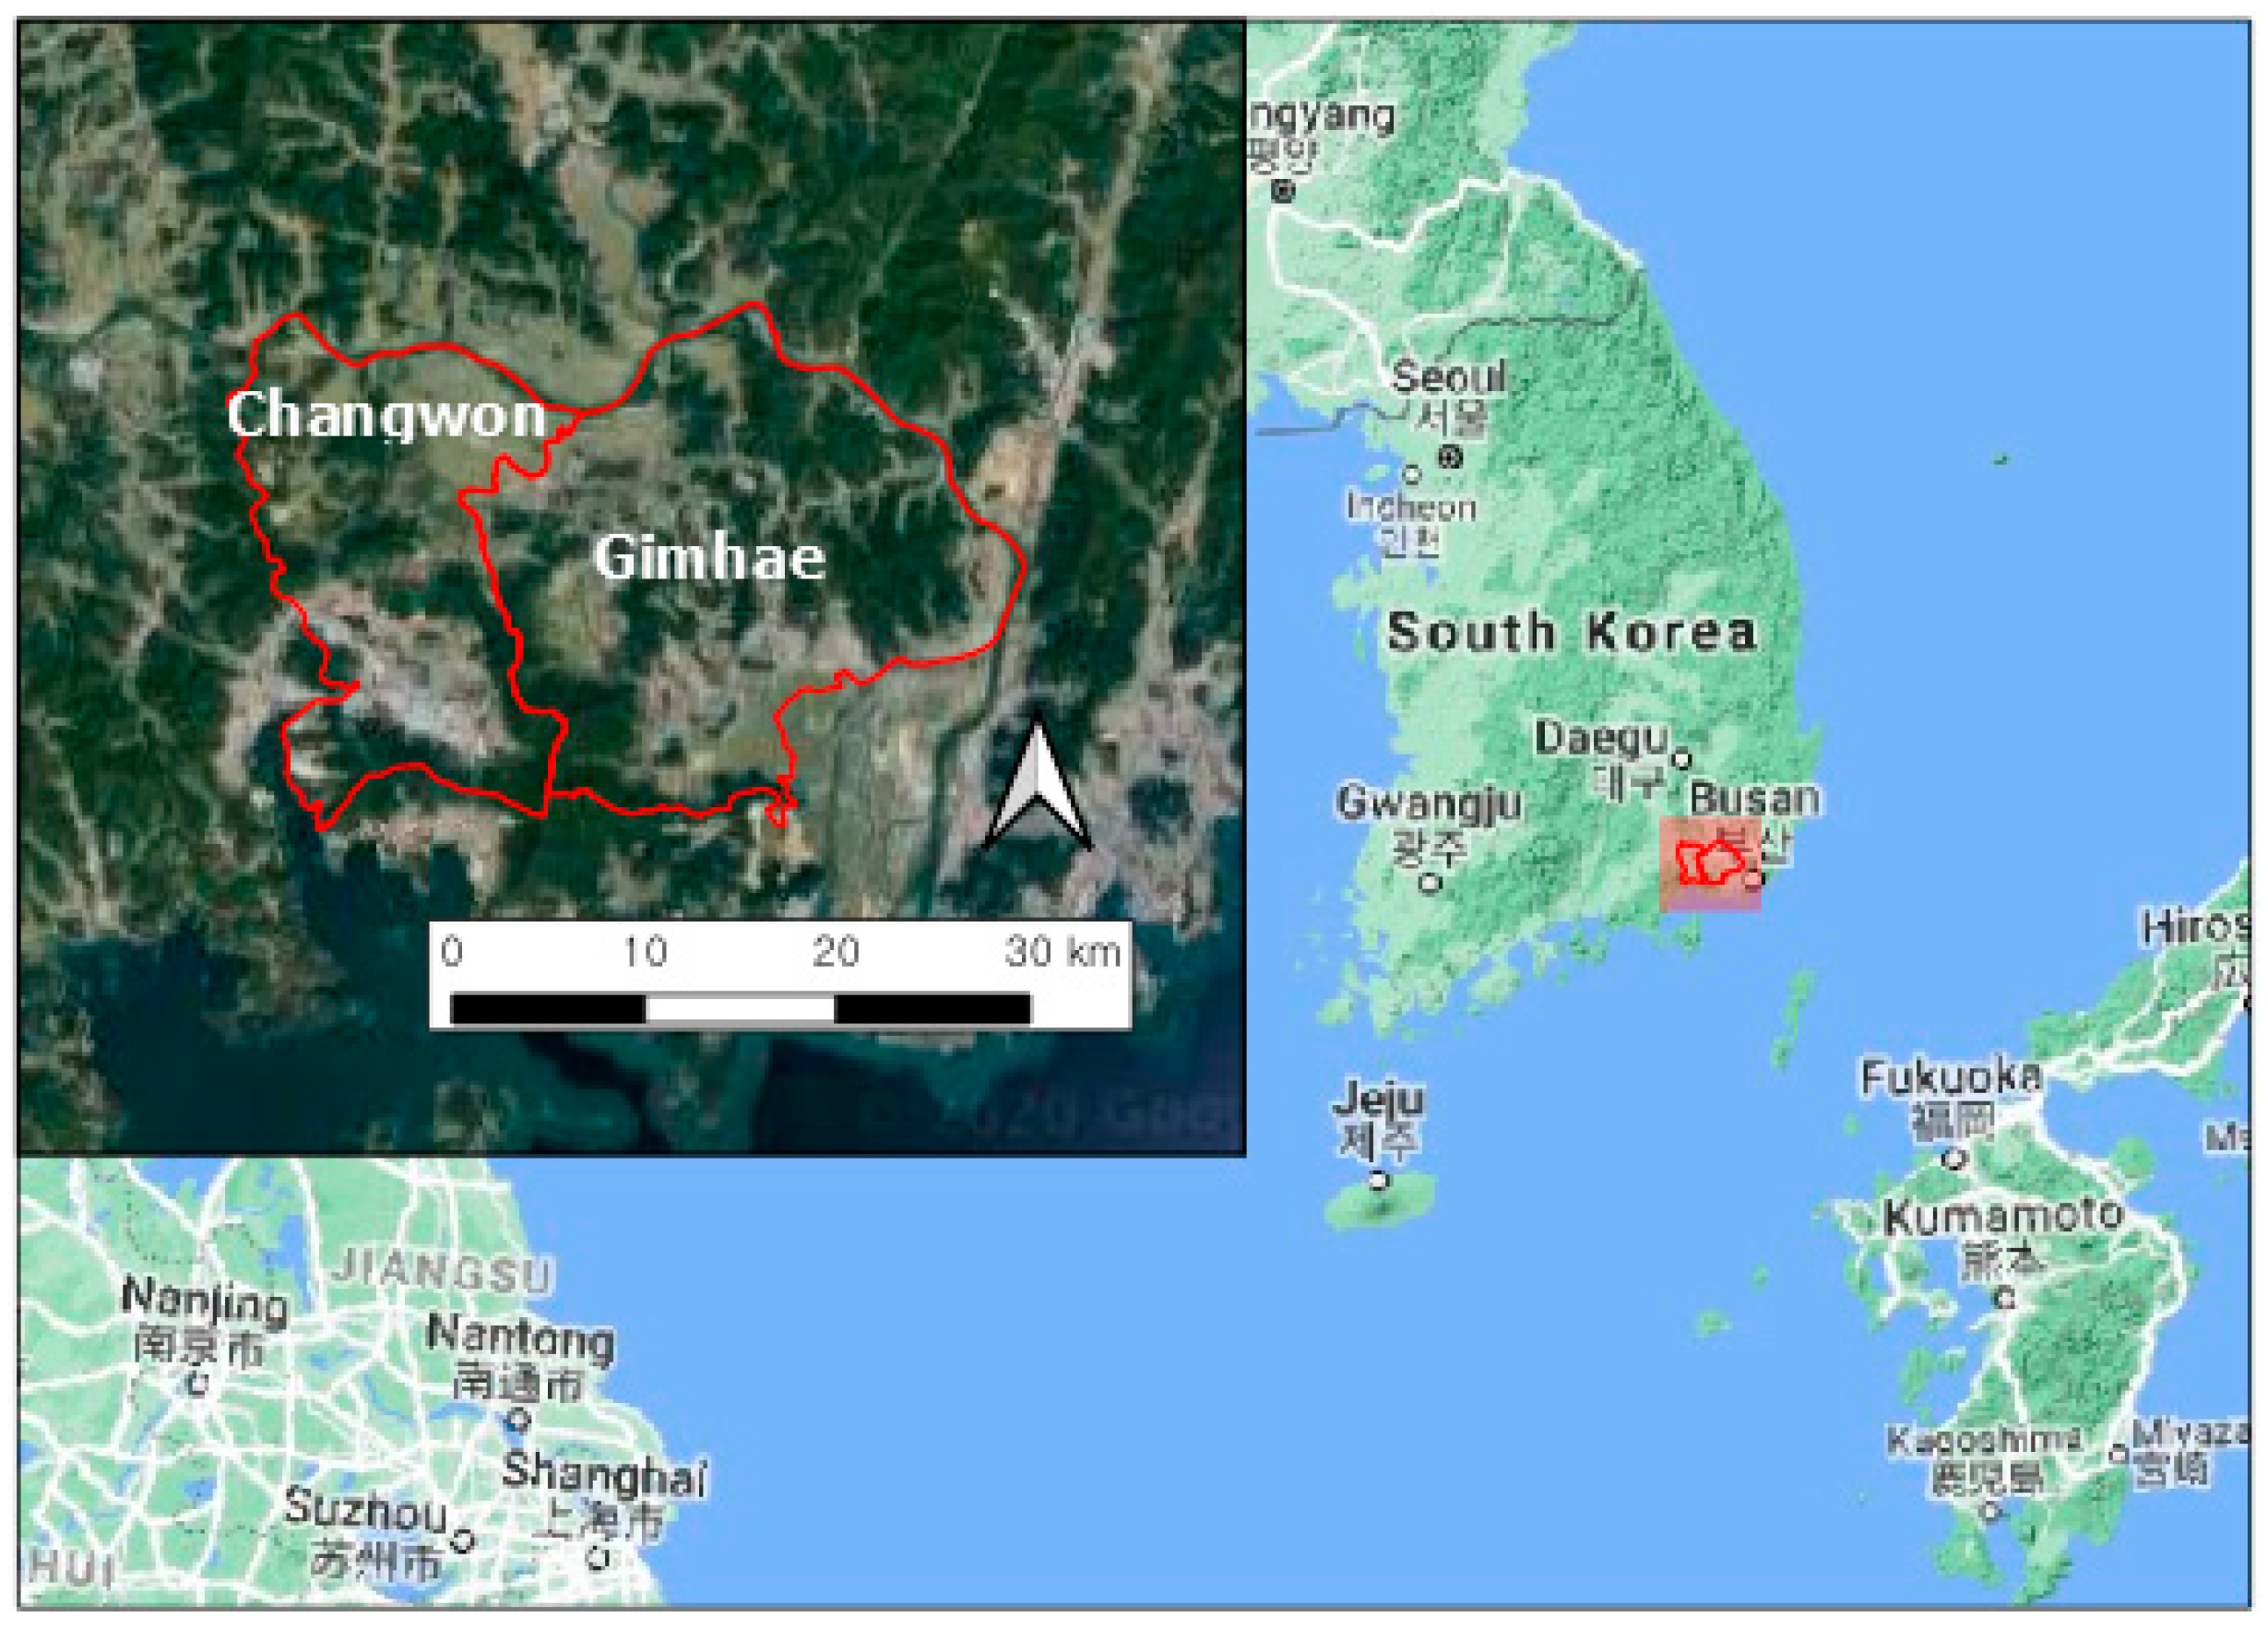
Changwon and Gimhae are adjacent cities (35°15′ N, 128°42′ E; Figure 1) in South Korea, but their urban development process has differed. Changwon was the first planned city in Korea, and its districts were divided into industrial, commercial, and residential areas. Until recently, most urban expansion was restricted to the southern part of the city. Gimhae suffered from severe and dispersive urban expansion, especially in recent decades. Changwon expanded after merging with neighboring cities, Masan and Jinhae, in 2010. The old Changwon area (presented in Figure 1) has maintained its characteristics as a planned city in contrast with Masan and Jinhae that developed naturally. Although the administrative boundary changed several times, we fixed the boundary of the study area to that which had lasted the longest and exploited the statistics and GIS data within the boundary for the sake of consistency.
2.5. Data and Analysis
Land cover maps produced and provided by the Ministry of Environment were used to analyze urban sprawl. Among the three different levels of maps provided, a level 1 map provided as raster data with a resolution of 30 × 30 m was used. There were six land cover types in the level, namely “urban and dry area”, “agricultural area”, “forest area”, “pasture”, “swamp”, “barren land”, and “water”. The “urban and dry area” was considered the built-up area. To speed up and ease the computation load, the original land cover map was aggregated to a 90 × 90 m resolution map. After calculating the number of “urban and dry areas” on the original map, pixels with five or more values of the class were designated as built-up area. Level 1 maps are provided on a 10-year basis, such as the 1980s and 1990s. The decadal land cover map was created based on the multi-year images and not representing a specific year. In contrast, population data are provided for each year, and data in the middle of each decade (1985, 1995, and so on) were used for analysis.
QGIS (QGIS Development Team 2020) was used for GIS data analysis, and R software (R Core Team 2020) was used for entropy calculation.
3. Results
3.1. Changes in the Population
The population of Changwon continued to grow until the 2000s (501,705 people in 2005), which declined slowly after 2010 (499,296 people in 2015) (Table 2). After a big jump between the 1980s and 1990s, the population hovered at around 500,000. Gimhae was a small city with a large agricultural land area and little urban area in the 1980s. The city expanded rapidly in the 1990s due to the influx of industry and people from the large neighboring cities of Changwon and Busan. The population of Gimhae was 173,204 in 1985. This figure was very similar to that of Changwon in 1985 (Table 2), but it was only half that of Changwon in 1995. However, the population has increased sharply since the 2000s. In 2015, Gimhae had a larger population than Changwon.
3.2. Changes in the Built-Up Area
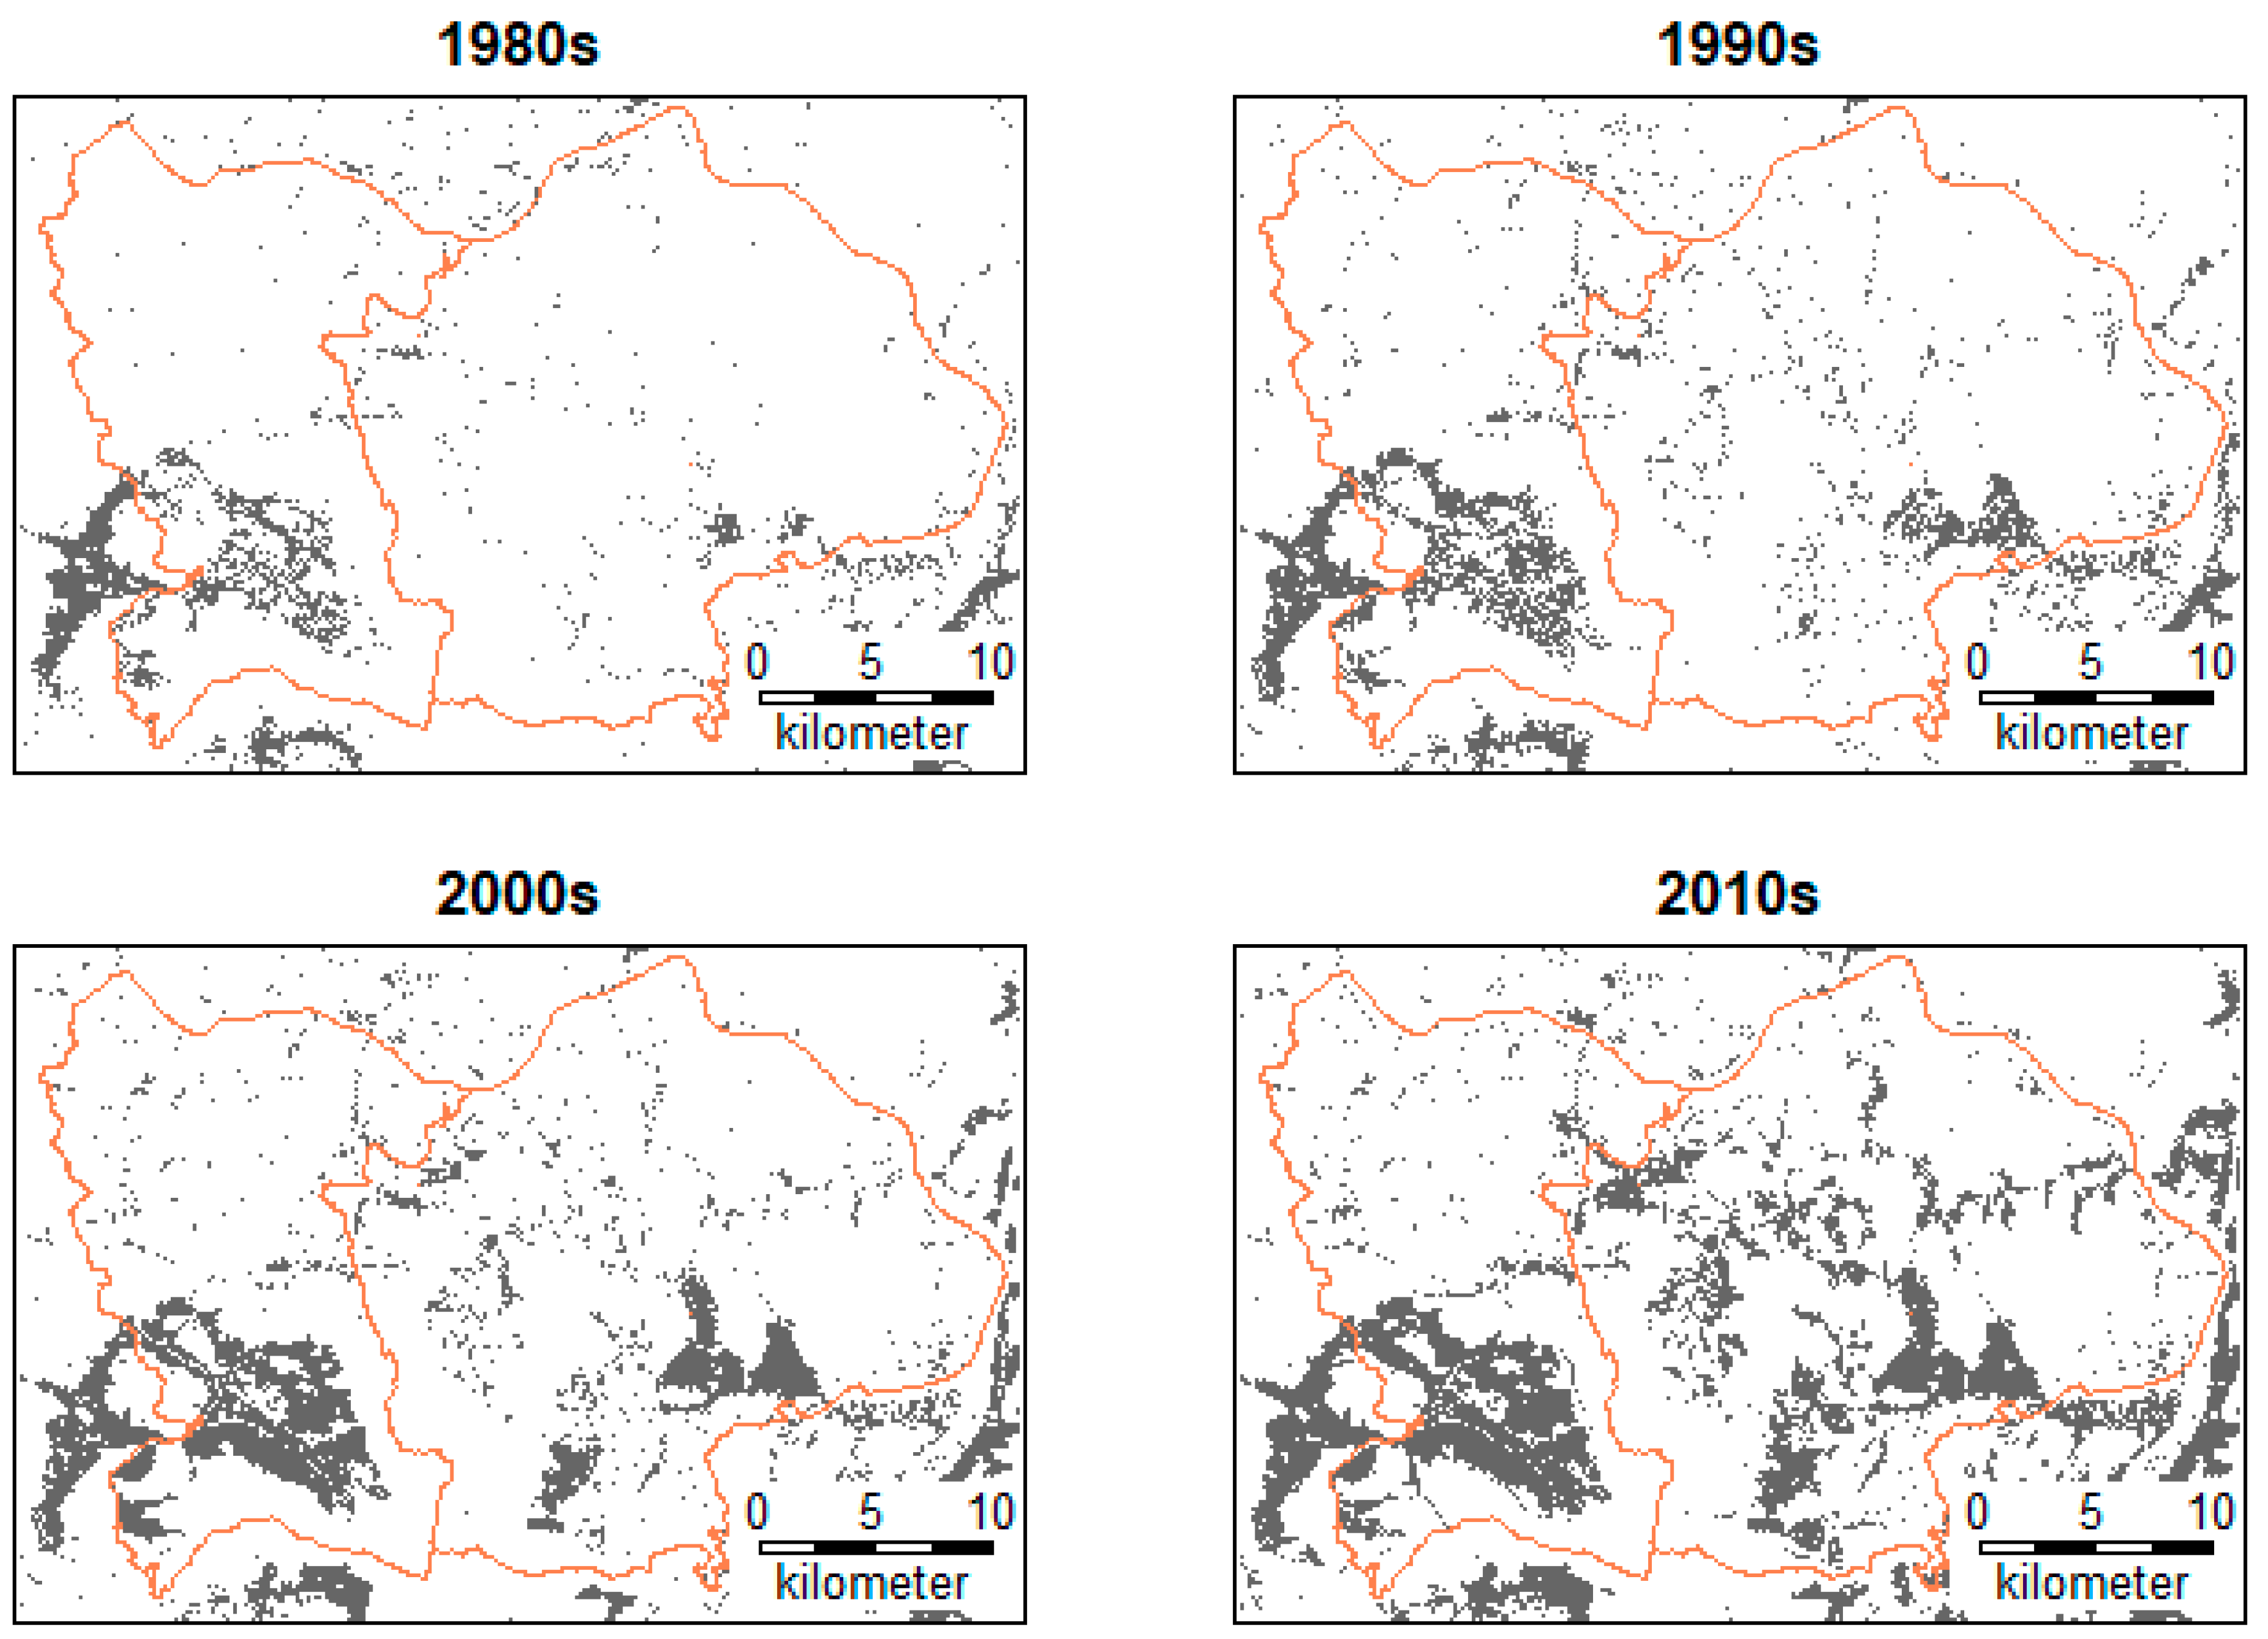
The distribution of built-up areas in Changwon and Gimhae changed between the 1980s and 2010s, as shown in Table 2 and Figure 2. Both cities steadily expanded, but the increase in built-up areas in Changwon was not as large as that in Gimhae. The percentage of built-up areas in Changwon was 18.0%, higher than that in Gimhae (15.8%) in the 2010s, but most of the newly formed built-up areas were limited to the southern part of Changwon until the 2000s (Figure 2). In contrast, Gimhae showed a rapid increase in built-up areas, and the increase in built-up areas was not limited to specific regions but was widely dispersed (Figure 2). Changwon reached peak population density (population/built-up area km2) in the 1990s, after which it decreased. Gimhae’s population density was the highest in the 1980s, and the built-up areas were very small compared to the population size. Since then, the population density in Gimhae has been monotonically declining due to the rapid expansion of built-up areas, despite population growth.
3.3. Changes in the Center of the Built-Up Area
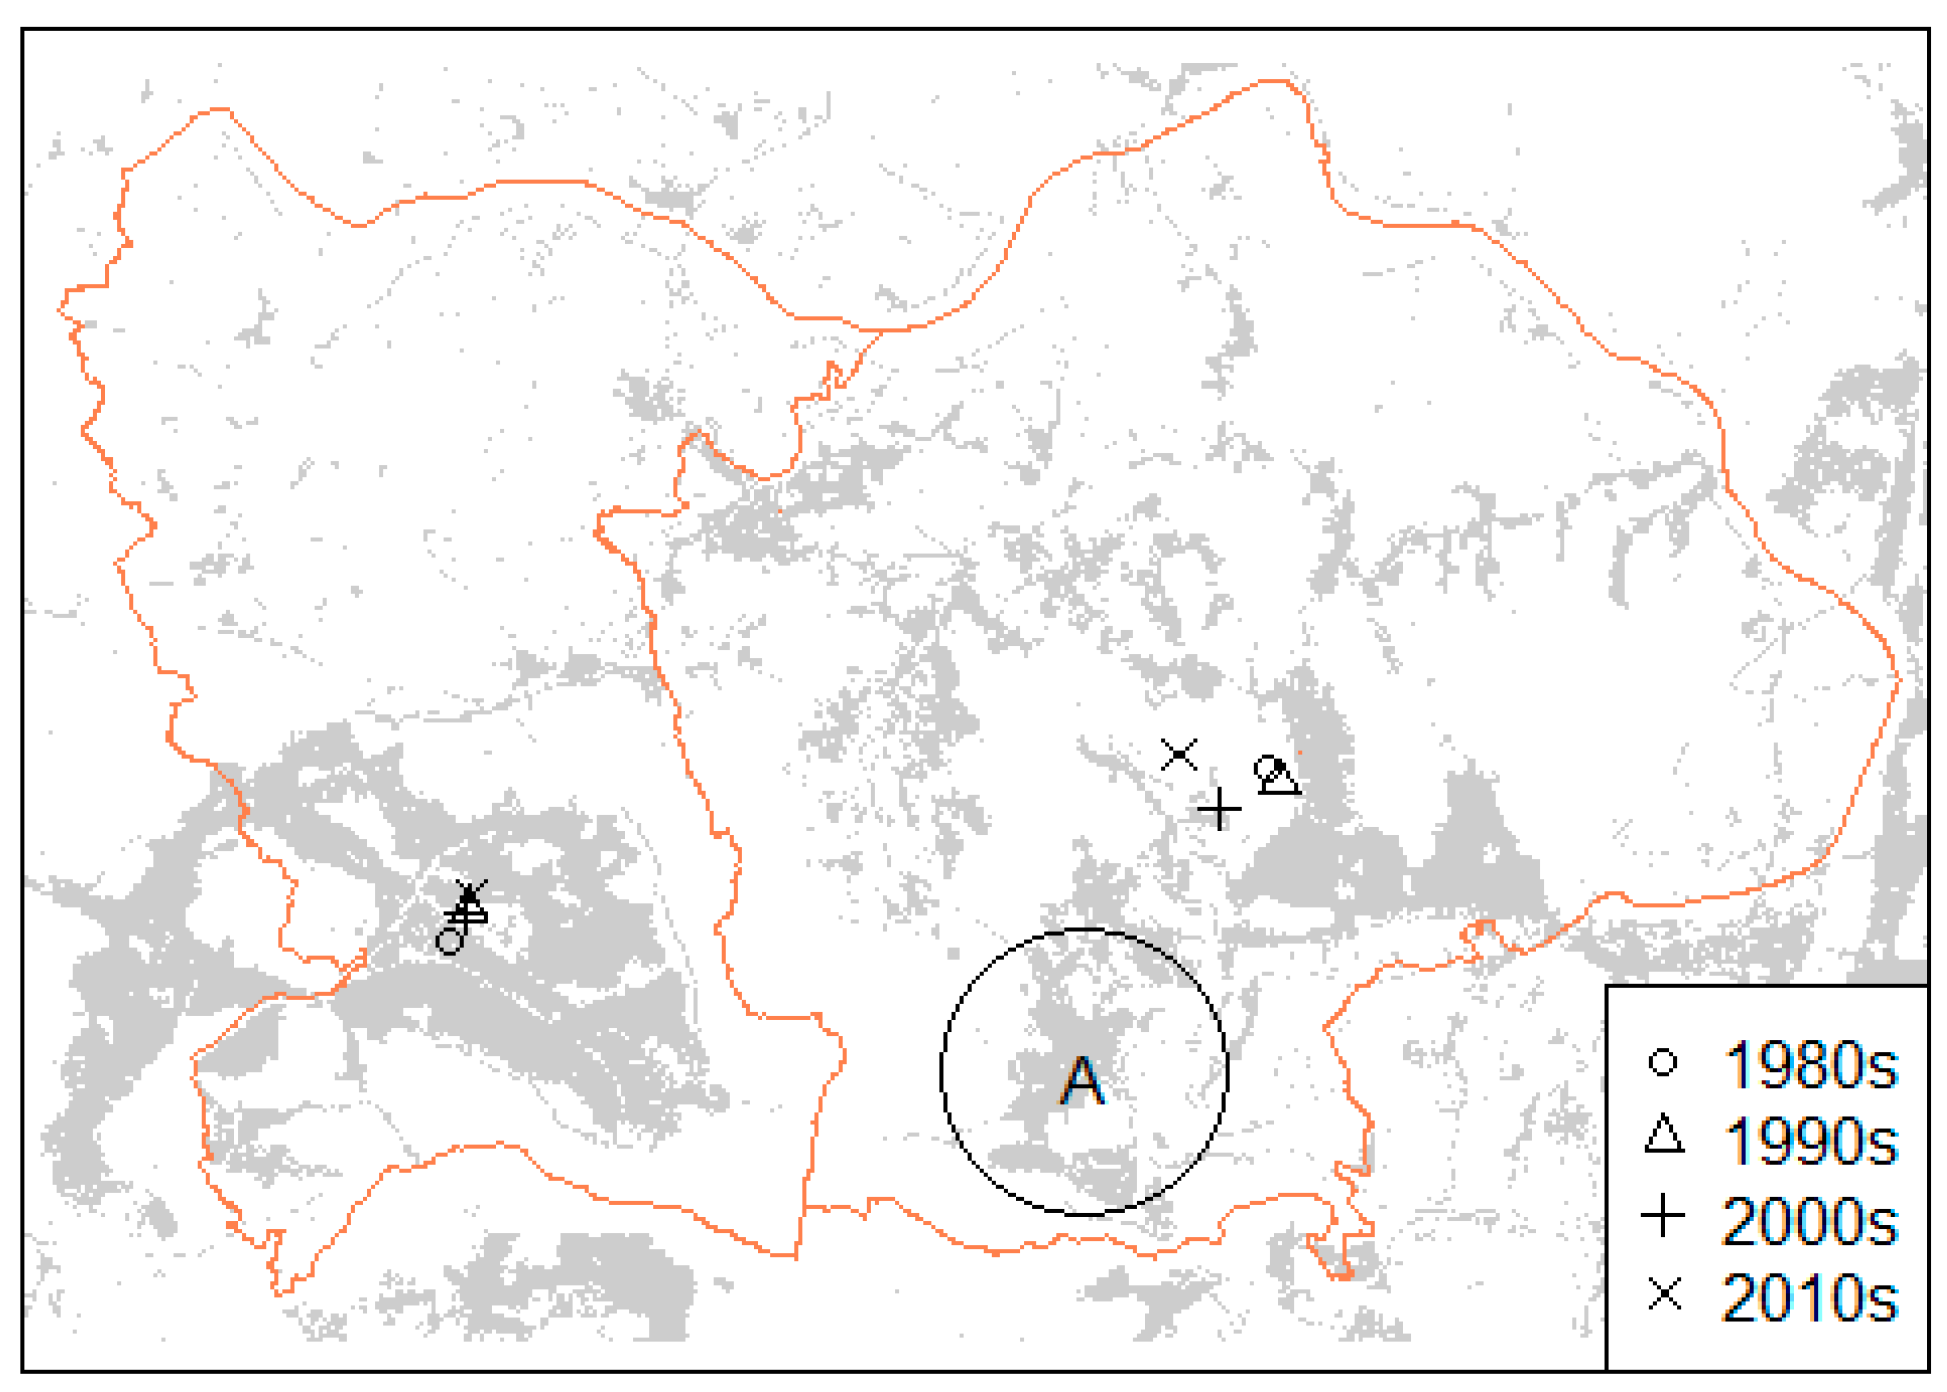
The change in the center point of the built-up area of Changwon was not significant (Figure 3). There was a tendency for the center to move northward over time, but the range of change was marginal. In comparison, Gimhae did not change much until the 1990s, but as Jangyu New Town developed in the southwest (indicated by “A” on the map; Figure 3) in the 2000s, the center point moved to the southwest, and as the built-up areas expanded in the northern parts of Gimhae, the center point also moved to the north.
3.4. Changes in Entropy
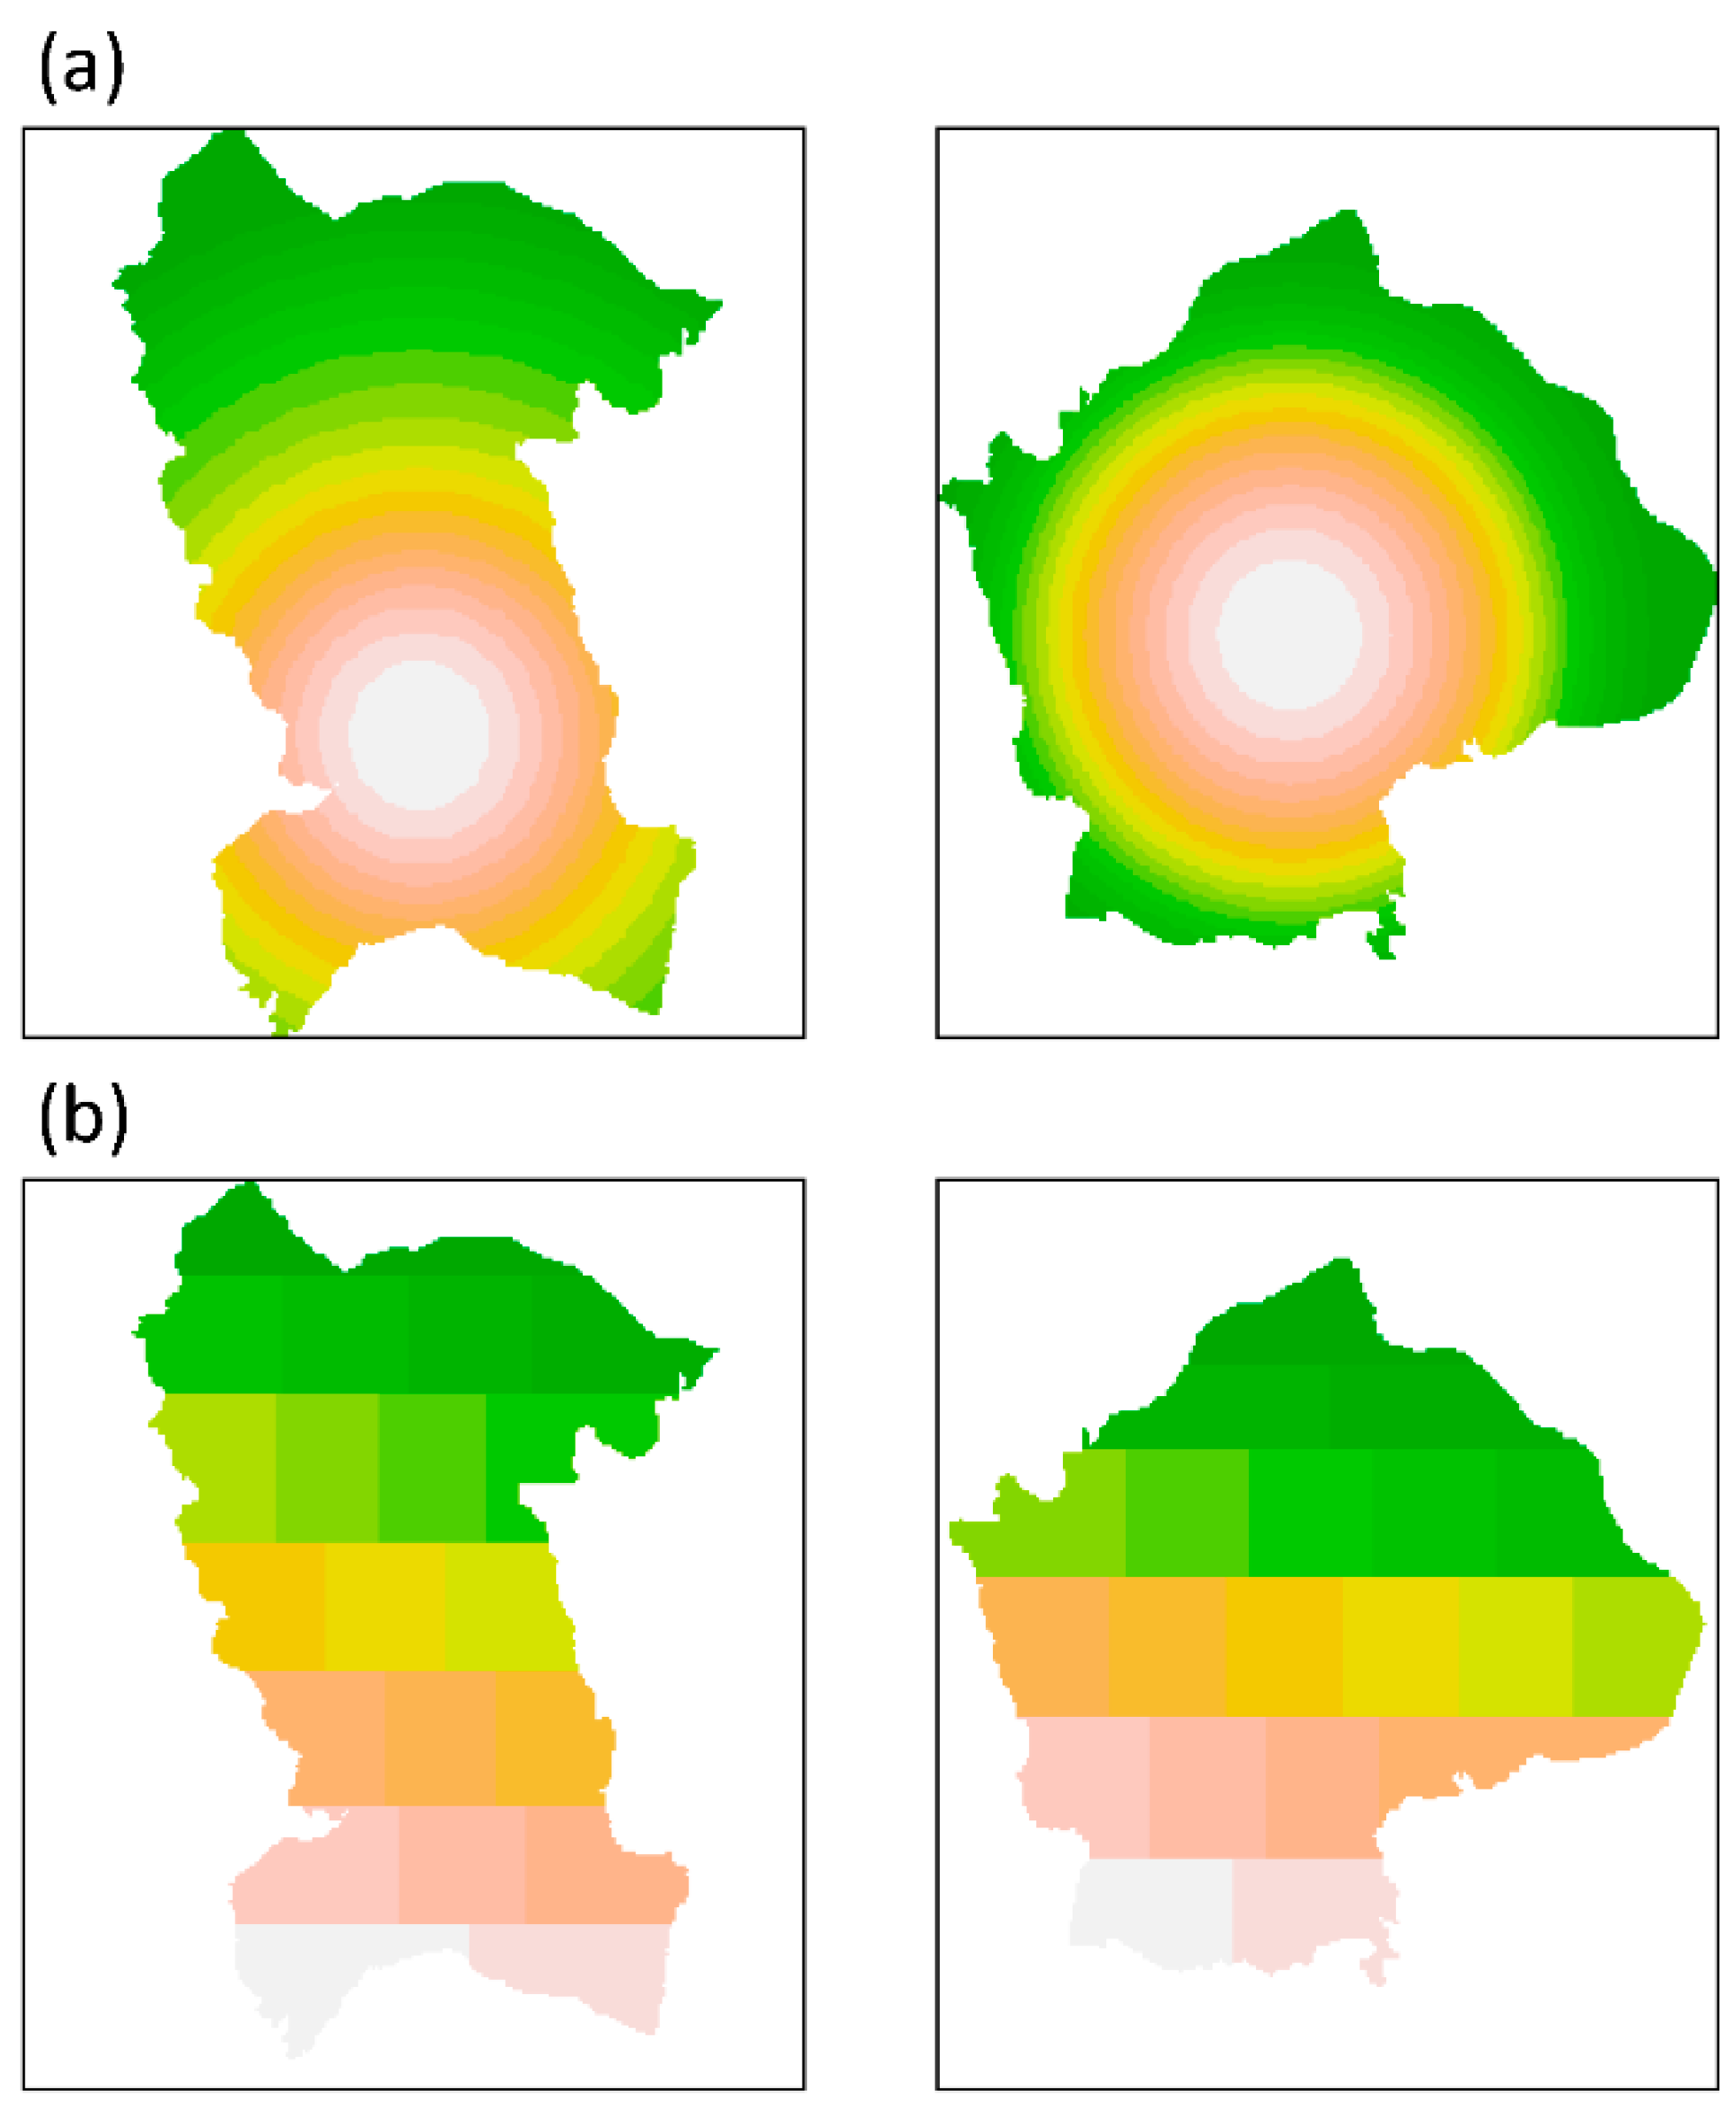
There were 15 neighborhoods in Changwon and 19 in Gimhae in 2015. Because entropy is sensitive to the number of zones [6,16,18], the same number was applied to both cities. Both cities were divided into 20 zones for convenience and in consideration of the number of original administrative districts. Zones were created in two ways: applying a concentric ring and regular partitioning (Figure 4). The center of the built-up area was used as the concentric ring center (Figure 4a). To partition the same area zone, the width of the ring changed according to the geographic shape of the cities. The ring center moved over time with urban development (as seen in Figure 3). The zone boundary was delineated in such a way to minimize the difference in zone area. The differences between the maximum and minimum zone area were less than 5% for both cities. Since the maximum Shannon’s entropy is determined only by the number of zones, the expected maximum of the 20 zones was 2.996 (loge (20)). The Batty’s spatial entropy is maximized when the built-up areas are distributed proportionally to the zone’s area. Because Batty’s spatial entropy is affected by the extent of area, the maximum entropies are different between cities. The maximum Batty’s spatial entropy was 10.510 for Changwon and 10.961 for Gimhae. The relative entropies (H/Hmax) are shown in Table 3. Both entropy indices increased over time. This tendency reflects the increase of built-up area in the two cities. In the case of ring zoning (Figure 4a), Gimhae showed higher entropy than Changwon in all periods. When applying regular partitioning (Figure 4b), however, entropy showed a different pattern. In the 1980s, Changwon had a higher entropy than Gimhae. But in the 1990s, Gimhae had a marginally higher entropy in both indices. The gap widened in the 2000s and 2010s. Changwon was hardly affected by the zoning type, as there was little difference in entropy between the zoning schemes. Gimhae, however, was affected by the zoning scheme. Ring zoning yielded higher entropy in Gimhae than regular zoning (Table 3). The difference in Shannon’s entropy between the ring and regular zoning was 0.261 in the 1980s. The difference narrowed to 0.027 in the 2010s. Batty’s spatial entropy was also affected by the zoning scheme in Gimhae, but the difference was much less. Batty’s spatial entropy’s maximum difference was 0.07 in the 1980s, and the minimum was 0.007 in the 2010s. The effect of the zoning scheme on the entropy was exaggerated by the difference in the built-up area arrangement. While Changwon is a typical centralized monocentric city, Gimhae is a decentralized polycentric city. These different spatial arrangements make a big difference between the two cities. For urban sprawl analysis, it is important to determine the center of the ring zone which is used to represent a specific spatial characteristic. However, it is difficult to define the center of ring, especially in a decentralized city.
4. Discussion
Urban sprawl has received considerable attention due to rapid global urbanization. In this study, urban sprawl was measured by entropy, which is easy to calculate and has well defined conceptual base among various measurement methods. Attempts to measure urban sprawl using entropy have become popular [6,8,12,15,20,21]; however, there have also been many discussions on the advantages and disadvantages of using entropy [6]. The way of zoning and the differences in the size of the area among zones have been largely unaddressed, although these two factors can dramatically affect entropy measurements. Concentric ring zoning has been applied in many studies [6,13,19] despite its weaknesses, such as sensitivity to the ring center. This zoning scheme has difficulty capturing the configuration of a polycentric city. The results show that ring zoning overestimated entropy in the decentralized city of Gimhae. Surprisingly, there has been little awareness of the effect of the zone area on the entropy. An equal-sized zoning scheme was applied in the present study to compare Shannon’s entropy with Batty’s spatial entropy under similar conditions. Some studies on urban sprawl use administrative districts as a zone [15]. While the administrative district of downtown areas is usually small, the built-up areas are concentrated in this district; however, rural areas show the opposite tendency. In the case, entropy can be misrepresented, as shown in Table 1, if the difference in area size is ignored. However, if Batty’s spatial entropy is used, which reduces the area effect by dividing the proportion of events by zone area, it can reduce the entropy deviation caused by the area difference between sections, thereby enabling intercity entropy comparisons [16].
A ring zone includes the opposite area of the diameter distance, so the areas that are far away are included in a single (outer) ring zone. For example, an area symmetrical from the center is bound to the same zone despite having a distance of twice the radius. When an urban area does not expand radially, as a city usually does not, the opposite area in the same ring zone may have different characteristics. However, regular (grid) zoning aggregates vicinity areas, and as a result, each zone can have relatively similar spatial features.
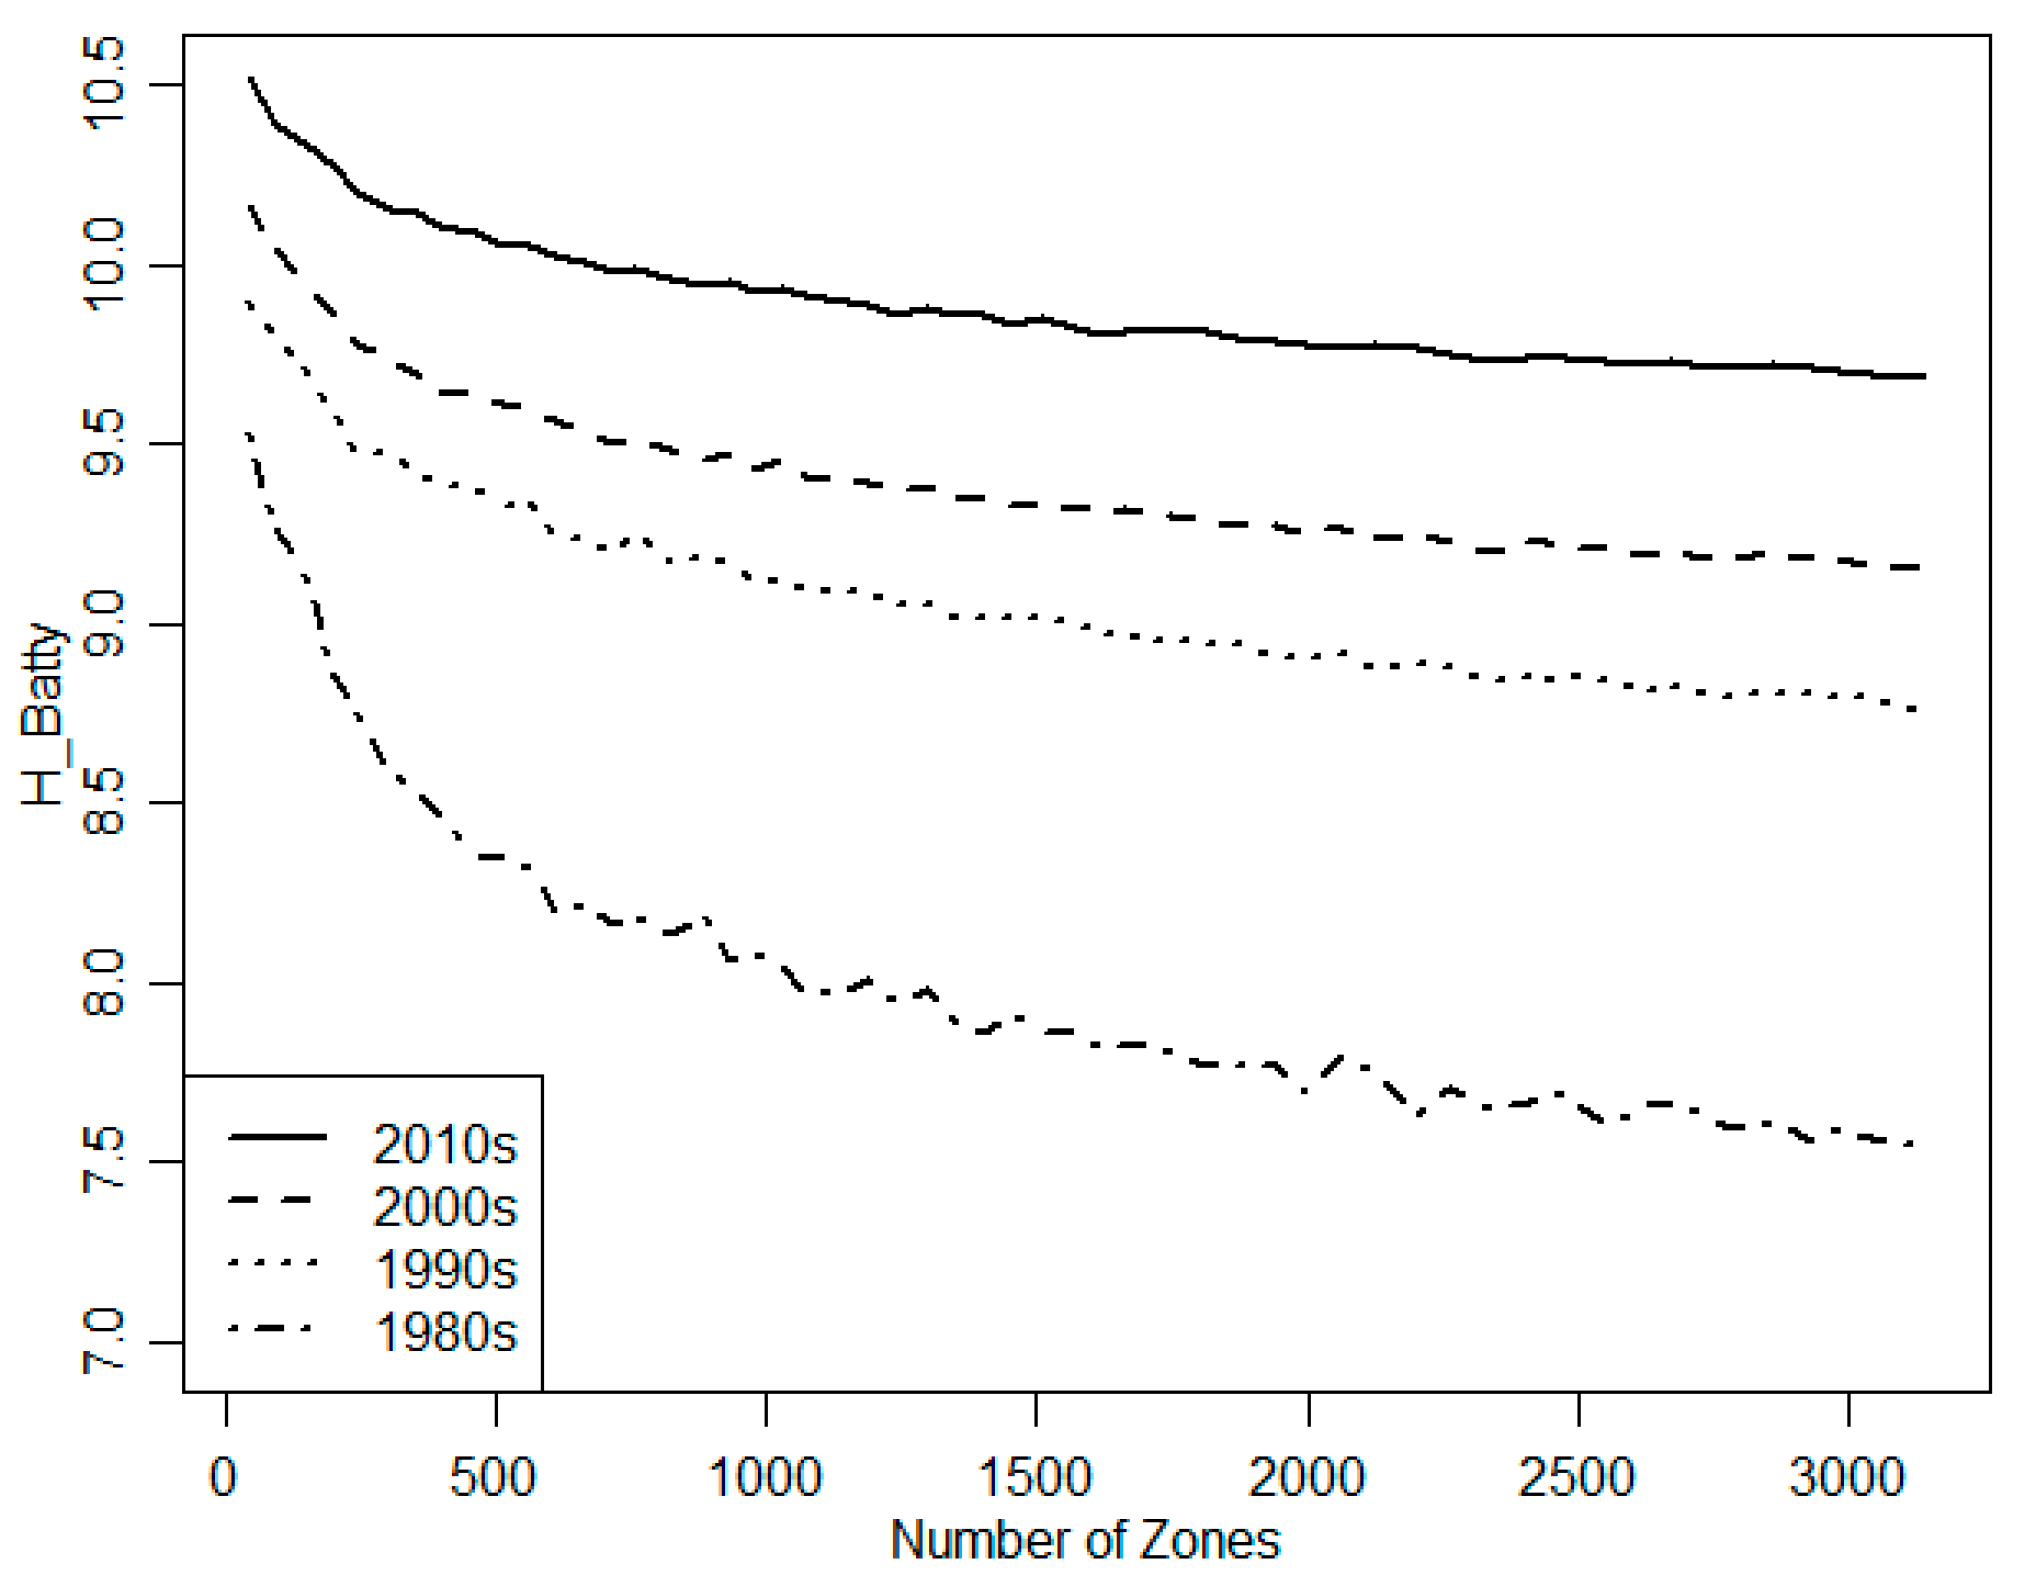
Batty’s spatial entropy has the advantage of extending Shannon’s entropy into continuous space to accurately reflect spatial distribution characteristics [16,18,22]. In the present study, Batty’s spatial entropy was more consistent across different zone boundaries (Table 3). Although Batty’s spatial entropy is more robust, its values are affected by the area size as well. Thus, it is important to be aware of the scale issue. Figure 5 shows the entropy changes according to the number of zones in Gimhae, when using a regular zoning scheme. As the number of zones increased, entropy decreased. Besides, after being divided into a sufficient number of zones, the decline rate tended to decrease. Entropy decreased the most in the 1980s, as there were few built-up areas, and as the zone area decreased, more zones had zero information (pi = 0), and thus total entropy decreased as well. For the opposite reason, the rate of decline was far lower in the 2010s.
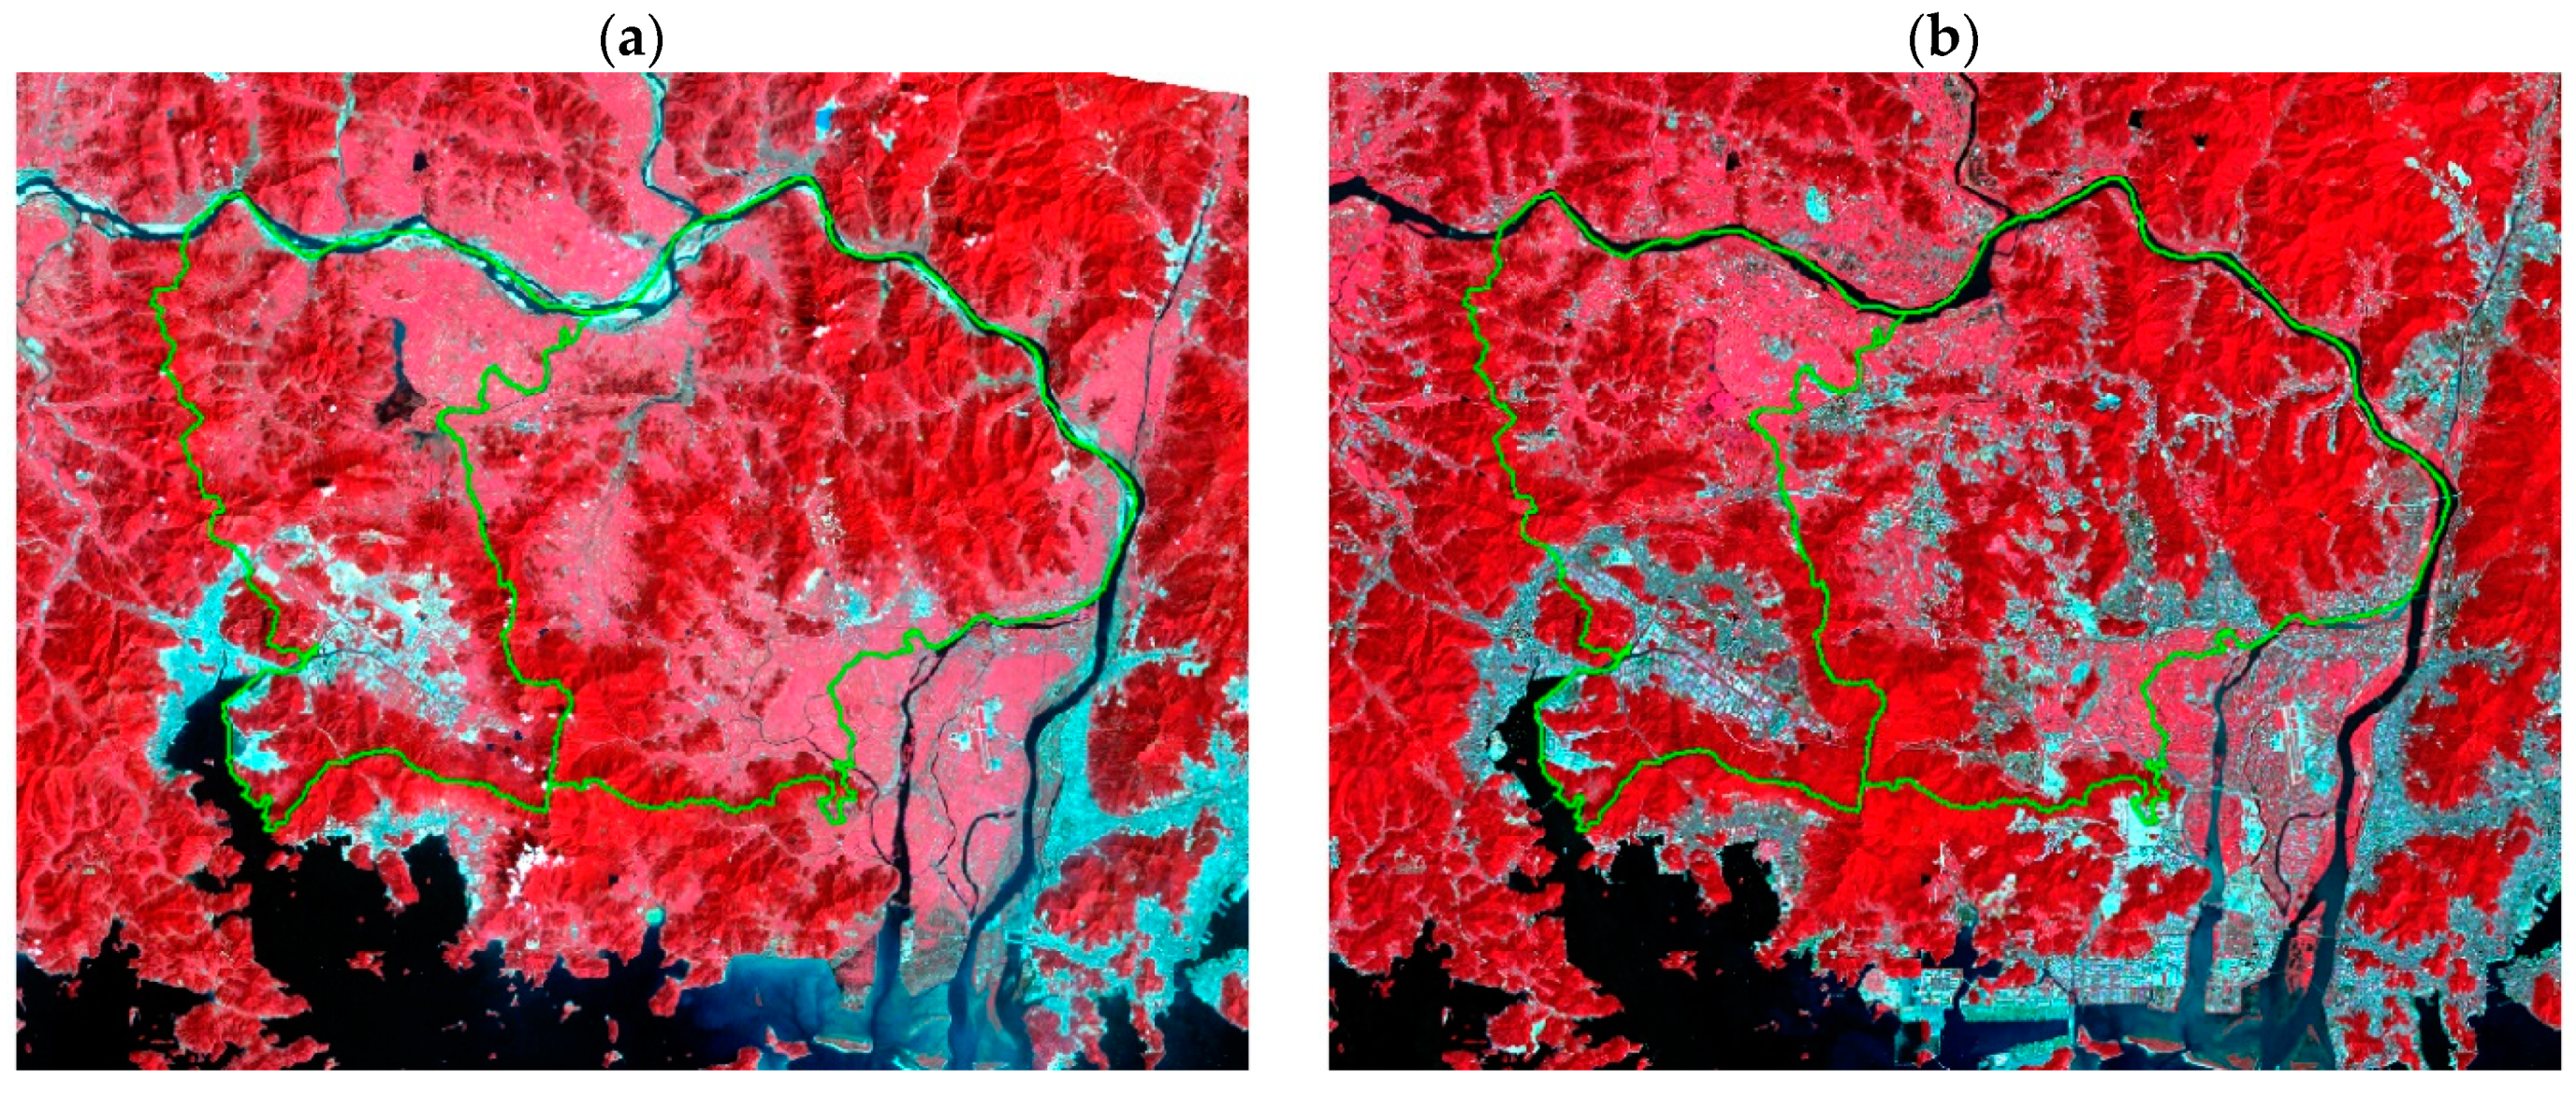
Changwon and Gimhae were similar in that they developed from rural to industrial cities in a short period, but their developmental processes were very different. Changwon maintained its zoning plan so that the distribution of built-up areas did not change much during the 1980s and 2010s. In comparison, Gimhae experienced urban sprawl since the 1990s, with built-up areas expanding widely throughout the city. Such an explosive urban expansion brought about environmental problems, such as changes in urban temperatures [23]. Additionally, the impact of urban expansion on the environment is not limited to the city’s boundaries. Indiscriminate urban expansion divides ecological systems and rapidly increases habitat fragmentation, as shown in Figure 6. In 1984, the lower central forests in Gimhae were connected to neighboring ecosystems, forests, and farmlands, without obstruction (Figure 6a). However, in 2017, the expansion of Gimhae and surrounding cities resulted in the disappearance of farmlands and the fragmentation of forest areas; the remaining forests were surrounded by built-up areas and isolated from other forests (Figure 6b).
The degree of urban sprawl of two adjacent cities was measured using two entropy indices: Shannon’s entropy, and Batty’s spatial entropy. The entropy is a useful index to measure the urban sprawl as both concepts are related to the order/disorder of the entity. These indices offer practical advantages, such as requiring minimum information (e.g., land coverage maps) and being easily calculated using basic software. However, as previously mentioned, it has disadvantages, including sensitivity to the zoning scheme and being affected by the area. More importantly, it only takes into account the relative distribution of built-up area rather than the absolute amount. It is essential to be aware of these indices’ strengths and weaknesses to avoid biased application. We suggest the grid-based zoning scheme and Batty’s spatial entropy for the study of urban sprawl.
5. Conclusions
Urban expansion is a significant phenomenon affecting the urban and natural environment. In urban planning and ecosystem management, it is important to quantitatively measure and analyze temporal changes in the urban environment and compare them with those aspects in other cities. Shannon’s entropy showed larger variations under the two different zoning schemes applied, while Batty’s spatial entropy yielded robust measurements. We found that concentric ring zoning was not a suitable method for measuring urban sprawl in a decentralized and polycentric city like Gimhae. In contrast, Batty’s spatial entropy was useful for measuring the urban sprawl because it considers the spatial context by explicitly including the zone’s area in its calculation. Thus, Batty’s spatial entropy was less affected by the zoning scheme used and reflected the pattern of urban expansion in Gimhae more accurately. Overall, we found that it outperformed Shannon’s entropy index, even when the zone areas were similar. Our findings show that urban sprawl, a phenomenon occurring within a spatial context, can be better understood by measuring spatial entropy with appropriate zoning schemes. Consequently, measurements and predictions on urban sprawl and its multi-layered effect can be researched more effectively.
Author Contributions
Conceptualization, K.H.C.; methodology, K.H.C.; software, K.H.C. and T.-S.K.; validation, K.H.C., T.-S.K., D.-H.L. and G.-S.J.; formal analysis, K.H.C.; investigation, K.H.C.; resources, K.H.C. and D.-H.L.; data curation, K.H.C. and T.-S.K.; writing—original draft preparation, K.H.C. and T.-S.K.; writing—review and editing, K.H.C., D.-H.L., T.-S.K. and G.-S.J.; visualization, K.H.C. and T.-S.K.; supervision, K.H.C. and G.-S.J.; project administration, K.H.C. and G.-S.J.; funding acquisition, G.-S.J. All authors have read and agreed to the published version of the manuscript.
Funding
This research received no external funding.
Institutional Review Board Statement
Not applicable.
Informed Consent Statement
Not applicable.
Data Availability Statement
Land cover data used in this study are openly available on the website of Ministry of Environment, Korea.
Acknowledgments
This research was supported by Yeungnam University Research Grants in 2019.
Conflicts of Interest
The authors declare no conflict of interest.
References
- OECD. Rethinking Urban Sprawl: Moving Towards Sustainable Cities; OECD Publishing: Paris, France, 2018. [Google Scholar] [CrossRef]
- Nechyba, T.J.; Walsh, R.P. Urban sprawl. J. Econ. Perspect. 2004, 18, 177–200. [Google Scholar] [CrossRef] [Green Version]
- Czamanski, D. Urban sprawl and ecosystems—Can nature survive? Int. Rev. Environ. Resour. Econ. 2008, 2, 321–366. [Google Scholar] [CrossRef] [Green Version]
- Jaeger, J.A.G.; Bertiller, R.; Schwick, C.; Kienast, F. Suitability criteria for measures of urban sprawl. Ecol. Indic. 2010, 10, 397–406. [Google Scholar] [CrossRef]
- Jaeger, J.A.G.; Schwick, C. Improving the measurement of urban sprawl: Weighted Urban Proliferation (WUP) and its application to Switzerland. Ecol. Indic. 2014, 38, 294–308. [Google Scholar] [CrossRef]
- Nazarnia, N.; Harding, C.; Jaeger, J.A.G. How suitable is entropy as a measure of urban sprawl? Landsc. Urban Plan. 2019, 184, 32–43. [Google Scholar] [CrossRef]
- Steurer, M.; Bayr, C. Measuring urban sprawl using land use data. Land Use Policy 2020, 97, 104799. [Google Scholar] [CrossRef]
- Sun, H.; Forsythe, W.; Waters, N. Modeling urban land use change and urban sprawl: Calgary, Alberta, Canada. Netw. Spat. Econ. 2007, 7, 353–376. [Google Scholar] [CrossRef]
- Dadras, M.; Shafri, H.Z.; Ahmad, N.; Pradhan, B.; Safarpour, S. Land use/cover change detection and urban sprawl analysis in Bandar Abbas city, Iran. Sci. World J. 2014, 2014, 690872. [Google Scholar] [CrossRef] [PubMed]
- Bhat, P.A.; Shafiq, M.U.; Mir, A.A.; Ahmed, P. Urban sprawl and its impact on landuse/land cover dynamics of Dehradun City, India. Int. J. Sustain. Built Environ. 2017, 6, 513–521. [Google Scholar] [CrossRef]
- Bhatta, B.; Saraswati, S.; Bandyopadhyay, D. Urban sprawl measurement from remote sensing data. Appl. Geogr. 2010, 30, 731740. [Google Scholar] [CrossRef]
- Yeh, A.G.-O.; Li, X. Measurement and monitoring of urban sprawl in a rapidly growing region using entropy. Photogramm. Eng. Remote Sens. 2001, 67, 83–90. [Google Scholar]
- Ozturk, D. Assessment of urban sprawl using Shannon’s entropy and fractal analysis: A case study of Atakum, Ilkadim and Canik (Samsun, Turkey). J. Environ. Eng. Landsc. Manag. 2017, 25, 264–276. [Google Scholar] [CrossRef]
- Singh, B. Urban growth using Shannon’s entropy: A case study of Rohtak city. Int. J. Adv. Remote Sens. GIS 2014, 3, 544–552. [Google Scholar]
- Jat, M.K.; Garg, P.K.; Khare, D. Monitoring and modelling of urban sprawl using remote sensing and GIS techniques. Int. J. Appl. Earth Obs. Geoinf. 2008, 10, 26–43. [Google Scholar] [CrossRef]
- Batty, M. Spatial entropy. Geogr. Anlysis 1974, 6, 1–30. [Google Scholar] [CrossRef]
- Theil, H. Economics and Information Theoy; North Holland Publishing Company: Amsterdam, The Netherlands, 1967. [Google Scholar]
- Batty, M. Entropy in spatial aggregation. Geogr. Analysis 1976, 8, 1–21. [Google Scholar] [CrossRef]
- Rahman, M. Detection of land use/land cover changes and urban sprawl in Al-Khobar, Saudi Arabia: An analysis of multi-temporal remote sensing data. ISPRS Int. J. Geo-Inf. 2016, 5, 15. [Google Scholar] [CrossRef]
- Kim, J.-H. A path modelling of urban sprawl and human health the case of Seoul Metropolitan Area. J. Transp. Res. 2013, 20, 129–148. [Google Scholar]
- Li, X.; Yeh, A.G.-O. Analyzing spatial restructuring of land use patterns in a fast growing region using remote sensing and GIS. Landsc. Urban Plan. 2004, 69, 335–354. [Google Scholar] [CrossRef]
- Batty, M.; Morphet, R.; Masucci, P.; Stanilov, K. Entropy, complexity, and spatial information. J. Geogr. Syst. 2014, 16, 363–385. [Google Scholar] [CrossRef] [Green Version]
- Song, B.-G.; Park, K.-H. A study on the relationship between land cover type and urban temperature—Focused on Gimhae city-. J. Korean Assoc. Geogr. Inf. Stud. 2019, 22, 65–81. [Google Scholar] [CrossRef]
Figure 1.
Location of the study area, including Changwon and Gimhae cities.

Figure 2.
Administrative borders of two cities, Changwon (east) and Gimhae (west), showing the changes in built-up areas (shaded in gray), 1980–2020.
Figure 2.
Administrative borders of two cities, Changwon (east) and Gimhae (west), showing the changes in built-up areas (shaded in gray), 1980–2020.

Figure 3.
Centers in the built-up areas of Changwon (east) and Gimhae (west), 1980–2020. “A” encircled on the map indicates Jangyu New Town in Gimhae, which developed in the 2000s.
Figure 3.
Centers in the built-up areas of Changwon (east) and Gimhae (west), 1980–2020. “A” encircled on the map indicates Jangyu New Town in Gimhae, which developed in the 2000s.

Figure 4.
Concentric ring zones in the 2010s (a) and regular (grid) zones (b, time-invariant zone) used to assess differences in entropy of Changwon (left) and Gimhae (right) cities.
Figure 4.
Concentric ring zones in the 2010s (a) and regular (grid) zones (b, time-invariant zone) used to assess differences in entropy of Changwon (left) and Gimhae (right) cities.

Figure 5.
Batty’s spatial entropy versus the number of zones in Gimhae city, 1980–2020.

Figure 6.
Overview of the study area and its surroundings: (a) 18 September 1984 (using 4-3-2 Landsat 5), and (b) 13 September 2017 (using 5-4-3 Landsat 8).
Figure 6.
Overview of the study area and its surroundings: (a) 18 September 1984 (using 4-3-2 Landsat 5), and (b) 13 September 2017 (using 5-4-3 Landsat 8).


Table 1.
Examples of Shannon’s entropy (HS) and Batty’s spatial entropy (HB) of five zones when Shannon’s entropy is maximized (a) or when Batty’s spatial entropy is maximized (b).
Table 1.
Examples of Shannon’s entropy (HS) and Batty’s spatial entropy (HB) of five zones when Shannon’s entropy is maximized (a) or when Batty’s spatial entropy is maximized (b).
| (a) Shannon’s Entropy maximum | |||||
| Zone | Area | Built-up area | HS | HB | |
| Zone 1 | 3350 | 40 | 0.2 | 0.322 | 1.945 |
| Zone 2 | 100 | 40 | 0.2 | 0.322 | 1.243 |
| Zone 3 | 1000 | 40 | 0.2 | 0.322 | 1.703 |
| Zone 4 | 500 | 40 | 0.2 | 0.322 | 1.565 |
| Zone 5 | 50 | 40 | 0.2 | 0.322 | 1.104 |
| Total | 5000 | 200 | 1 | 1.609 | 7.561 |
| (b) Batty’s spatial entropy maximum | |||||
| Zone | Area | Built-up area | HS | HB | |
| Zone 1 | 3350 | 134 | 0.67 | 0.268 | 5.707 |
| Zone 2 | 100 | 4 | 0.02 | 0.078 | 0.170 |
| Zone 3 | 1000 | 40 | 0.2 | 0.322 | 1.703 |
| Zone 4 | 500 | 20 | 0.1 | 0.230 | 0.852 |
| Zone 5 | 50 | 2 | 0.01 | 0.046 | 0.085 |
| Total | 5000 | 200 | 1 | 0.945 | 8.517 |
Table 2.
Built-up areas and population density statistics for Changwon and Gimhae cities, 1980s–2010s.
Table 2.
Built-up areas and population density statistics for Changwon and Gimhae cities, 1980s–2010s.
| 1980s | 1990s | 2000s | 2010s | |
|---|---|---|---|---|
| Changwon | ||||
| Built-up (km2) | 17.8 | 30.3 | 43.9 | 53.7 |
| Non-Built-up (km2) | 279.4 | 266.9 | 253.3 | 243.5 |
| Population (1985, 1995, 2005, 2015) | 173,508 | 481,694 | 501,705 | 499,296 |
| Population/built-up area (person/km2) | 9747 | 15,897 | 11,428 | 9298 |
| Gimhae | ||||
| Built-up (km2) | 4.5 | 17.8 | 37.8 | 73.6 |
| Non-Built-up (km2) | 461.9 | 448.7 | 428.7 | 392.8 |
| Population (1985, 1995, 2005, 2015) | 173,203 | 246,965 | 448,796 | 547,387 |
| Population/built-up area (person/km2) | 38,490 | 13,874 | 11,873 | 7437 |
Table 3.
Changes in entropy of the built-up area distributions in Changwon and Gimhae cities, 1980s–2010s, using different entropy indices.
Table 3.
Changes in entropy of the built-up area distributions in Changwon and Gimhae cities, 1980s–2010s, using different entropy indices.
| Shannon’s Entropy | ||||
| Ring zoning | Regular zoning | |||
| Changwon | Gimhae | Changwon | Gimhae | |
| 1980s | 0.681 | 0.825 | 0.681 | 0.564 |
| 1990s | 0.751 | 0.876 | 0.757 | 0.769 |
| 2000s | 0.766 | 0.890 | 0.767 | 0.842 |
| 2010s | 0.798 | 0.942 | 0.796 | 0.915 |
| Batty’s spatial entropy | ||||
| Ring zoning | Regular zoning | |||
| Changwon | Gimhae | Changwon | Gimhae | |
| 1980s | 0.909 | 0.952 | 0.909 | 0.882 |
| 1990s | 0.929 | 0.966 | 0.931 | 0.938 |
| 2000s | 0.933 | 0.970 | 0.933 | 0.957 |
| 2010s | 0.942 | 0.984 | 0.942 | 0.977 |
Publisher’s Note: MDPI stays neutral with regard to jurisdictional claims in published maps and institutional affiliations. |
© 2021 by the authors. Licensee MDPI, Basel, Switzerland. This article is an open access article distributed under the terms and conditions of the Creative Commons Attribution (CC BY) license (http://creativecommons.org/licenses/by/4.0/).
Share and Cite
MDPI and ACS Style
Cho, K.H.; Lee, D.-H.; Kim, T.-S.; Jang, G.-S. Measurement of 30-Year Urban Expansion Using Spatial Entropy in Changwon and Gimhae, Korea. Sustainability 2021, 13, 632. https://0-doi-org.brum.beds.ac.uk/10.3390/su13020632
AMA Style
Cho KH, Lee D-H, Kim T-S, Jang G-S. Measurement of 30-Year Urban Expansion Using Spatial Entropy in Changwon and Gimhae, Korea. Sustainability. 2021; 13(2):632. https://0-doi-org.brum.beds.ac.uk/10.3390/su13020632
Chicago/Turabian StyleCho, Ki Hwan, Do-Hun Lee, Tae-Su Kim, and Gab-Sue Jang. 2021. "Measurement of 30-Year Urban Expansion Using Spatial Entropy in Changwon and Gimhae, Korea" Sustainability 13, no. 2: 632. https://0-doi-org.brum.beds.ac.uk/10.3390/su13020632
Note that from the first issue of 2016, this journal uses article numbers instead of page numbers. See further details here.