Sustainable Use of the Environment, Planetary Boundaries and Market Power


Department of Economics, Colorado State University, Fort Collins, CO 80523, USA
*
Author to whom correspondence should be addressed.
Sustainability 2021, 13(2), 949; https://0-doi-org.brum.beds.ac.uk/10.3390/su13020949
Submission received: 17 December 2020
/
Revised: 8 January 2021
/
Accepted: 11 January 2021
/
Published: 19 January 2021
(This article belongs to the Collection Feature Papers in Sustainable Use of the Environment and Resources)
Abstract
:Many of the environment and natural resources that constitute key “safe operating spaces”, as designated by planetary boundaries, are being exploited by a handful of large firms with considerable market share. In this paper, we discuss how the environment and natural resources that occur within a safe operating space can be treated as an exploitable finite stock. We use an optimal depletion model to show how the extraction of these exhaustible assets can be managed optimally, and allow for adjustment in price paths due to technological innovation and environmental externalities. Given the growing market concentration and monopoly power in the key economic sectors that exploit the environment and resources that constitute many safe operating spaces, we then explore how monopoly conditions can alter the extraction and price path of the environmental assets over time compared to that under competitive market conditions. We show that the monopoly may be compatible with more sustainable use, by extending the life of the exploitable, depletable stock, at the expense of firms capturing excessive resource rents from exploitation. This tradeoff means that any policies implemented to tax the excessive monopoly rents need to be designed without compromising the sustainable use of the environment. The tax revenue raised can be channeled into protecting or regenerating natural assets that are essential for global environmental sustainability. If investment in regeneration efforts is sufficiently substantial, or if the wider social and environmental values associated with the exhaustible assets are taken into account, then the safe operating space may be conserved indefinitely. Such policy challenges will become increasingly important as dominant firms exert market power over the planet’s remaining environment and resources that constitute key “safe operating spaces”, as designated by planetary boundaries.
1. Introduction
The global community is facing unprecedented concerns about unsustainable extraction of our natural resources, pollution of our lands, water and air, and the conversion and alteration of ecological functions and systems. Due to the overuse and misuse of key environmental and natural resources, we are experiencing critical threats to the global environment—such as climate change, land-use conversion and biodiversity loss, freshwater scarcity, and deteriorating marine and coastal habitats.
Since 1970, trends in agricultural production, fish harvest, freshwater use, bioenergy production and harvest of materials have increased, in response to rising demand from population and income growth. Over this period, the global human population has more than doubled (from 3.7 to 7.6 billion), rising unevenly across countries and regions; and per capita gross domestic product is four times higher—with ever-more distant consumers shifting the environmental burden of consumption and production across regions [1]. The expansion of energy use, carbon dioxide emissions and fisheries production has been even greater than the doubling of the global population [2,3,4]. Freshwater use has largely kept pace with population growth and global agricultural land use has expanded more modestly, by 30 percent [5]. However, in low and top-income countries the expansion in crop and pasture land has been more significant, over 45 percent since 1970 [3].
Land-use change, habitat destruction and biodiversity loss in the tropics are primarily driven by the ongoing demand for agricultural production, mining and timber in these regions. As a consequence, tropical natural forests have declined by 11 percent since 1990 [6]. At the same time, we have experienced a 60% decline in the populations of mammals, birds, fish, reptiles and amphibians [7]. The nearly three-fold rise in fisheries production over the past several decades is one reason why marine life is on the brink of a precipice. At least one-third of fish stocks are now overfished, one-third to half of the vulnerable marine habitats have been lost, and a substantial fraction of the coastal ocean suffers from pollution, eutrophication, oxygen depletion and is stressed by ocean warming [8]. An additional disturbing trend in recent decades has been the exponential growth in marine plastic pollution. In 1970, there was an estimated 30,200 tonnes of plastic floating in global oceans. By 2020, this amount had risen to nearly 1.2 million tonnes [9,10].
Because of this mounting toll on the global environment, scientists are warning that humans are now on the verge of altering the Earth System irrevocably. Unless human impacts on the global environment are slowed down, and in some cases halted, we may inflict significant and long-lasting changes to the entire Earth System. Avoiding these outcomes and producing a relatively “safe” global environment is the greatest challenge facing humankind today. Some scientists suggest that, in order to protect key Earth System elements and processes, human impacts on the global environment should be kept within “planetary boundaries”. Establishing such boundaries may help us avoid exceeding “tipping points” or “thresholds” that could lead to irrevocable changes in the entire Earth System, with potentially catastrophic impacts for humanity [11,12,13,14,15,16,17,18]. According to the scientist Will Steffen and colleagues, establishing planetary boundaries “aims to help guide human societies away from such a trajectory by defining a “safe operating space” in which we can continue to develop and thrive” [14].
In a previous article in this journal, Barbier and Burgess show how the environment and natural resources that occur within a “safe operating space” can be treated as an exploitable finite stock. By developing an optimal depletion model, the authors show how the extraction of these resources can be managed optimally [19]. However, many of the environment and natural resources that constitute key “safe operating spaces”, as designated by planetary boundaries, are being exploited by a handful of large firms with considerable market [20]. Given the growing market concentration and monopoly power in the key economic sectors that exploit the environment and resources that constitute many safe operating spaces, it is important to explore how monopoly conditions can alter the extraction and price path of the environmental assets over time compared to that under competitive market conditions.
In this article, we extend and elaborate the economic modeling approach developed by Barbier and Burgess to explore the stewardship of the environment and natural resources that constitute key “safe operating spaces”, as designated by planetary boundaries [19]. We treat these natural resource and environmental assets as an exploitable finite stock and focus on the growing market concentration and monopoly power in the key economic sectors that exploit many safe operating spaces. We show that the monopoly may be compatible with more sustainable use, by extending the life of the exploitable, depletable stock, at the expense of firms capturing excessive resource rents from exploitation. We explore how taxation of excessive monopoly rents can be designed without compromising the sustainable use of the environment. The revenue raised may be channeled into technological innovation and protecting or regenerating natural assets that are essential for global environmental sustainability. We also show that if such technological innovation, investment in regeneration, or internalization of the wider social and environmental values associated with the exhaustible assets are sufficiently large then the safe operating space may be conserved indefinitely.
Our starting point in Section 2 is to review the relevant literature that identifies the need to establish planetary environmental boundaries in order to avoid exceeding “tipping points” or “thresholds”. We also provide a brief review of the literature on the economics of exploitation of a finite resource, and the impact of monopolistic resource use on this exploitation decision.
We discuss in Section 3.1 the concept of the safe operating space, as defined by planetary boundaries. A safe operating space is, in effect, a finite endowment of “natural capital” that is available for extractive use by human activities. In this way, the safe operating space can be regarded as an exploitable, depletable stock. We also examine how these environmental and natural resource assets are frequently exploited by dominant firms with considerable market power.
If our use of the global environment is limited by planetary boundaries, it is important to determine how to best manage the natural resources and environment available for use in the safe operating space [19]. In Section 3.2, we present an optimal depletion model to show how the extraction of these exhaustible assets can be managed optimally over time. In this model, we include the potential for regeneration of the environmental stock and the inclusion of wider social benefits, or “stock externalities”, associated with the safe operating space. As a depletable asset, any remaining safe operating space is also scarce. Therefore, the value of the asset will rise over time as exploitation proceeds. As a result, the market conditions governing the exploitation of a safe operating space will affect whether depletion of this asset is conducted efficiently and optimally, and how quickly it is used up.
In Section 4, we show and discuss the modeling results for competitive as opposed to monopoly conditions. We first present the optimal extraction and price path of the safe operating space under competitive market conditions. Given the growing market concentration and monopoly power in the key economic sectors that exploit the environment and resources that constitute many safe operating spaces, we then adapt the analysis to explore the role of monopolistic market structure. We compare and contrast this allocation decision to that under competitive market conditions.
Next, we discuss the policy implications of how a monopolistic market structure can impact the exploitation of the safe operating space (see Section 5). We show that monopoly conditions can alter the price path and use of the environment over time compared to the competitive market case. The monopoly is compatible with more sustainable use, by extending the life of the safe operating space. However, this is at the expense of firms capturing excessive resource rents from exploitation. This tradeoff means that policies need to be designed to tax the monopoly rents without compromising the sustainable use of the environment. We show how a tax can be designed so that it does not detrimentally affect the monopolists’ allocation decision.
In the remainder of Section 5, we discuss how the revenue raised by such taxation can be invested in technological innovation in substitute resources, which can lower the demand and extend the time until exhaustion for the environmental asset. We also explore how any revenues that are generated from taxing monopoly rent can be channeled into protecting or regenerating natural assets that are essential for global environmental sustainability, and for funding additional investment in green innovation and technology that reduce the economy’s reliance on depleting the various natural resources and sinks that constitute a safe operating space. We show that, if regeneration efforts are very substantial, or if the wider social and environmental values associated with these assets are taken into account, then the safe operating space may be conserved indefinitely.
Finally, our concluding Section 6 addresses additional issues for research. The presence of a few dominant firms managing the extraction of key environmental and natural resource assets can lead to inefficiencies and a loss of economic welfare compared to the competitive market situation, but can also provide an important opportunity to reduce the rate of exploitation and contribute towards more sustainable use of the safe operating space. We discuss how such policy challenges will become increasingly important as dominant firms continue to exert market power over the planet’s remaining scarce environment and natural resources.
2. Review of the Literature
The scientific literature is providing increasing evidence that human populations and economic activity are getting closer to, and even exceeding, the limits of essential sub-systems and processes of the global environment. Surpassing these limits could lead to irreversible changes, or “tipping points” in the Earth system [11,12,13,14,15,16,17,18]. This literature has noted that “nine such processes for which we believe it is necessary to define planetary boundaries: climate change; rate of biodiversity loss (terrestrial and marine); interference with the nitrogen and phosphorus cycles; stratospheric ozone depletion; ocean acidification; global freshwater use; change in land use; chemical pollution; and atmospheric aerosol loading.” [12] (p. 472).
For example, terrestrial net primary (plant) production could be used as a measurable limit for human consumption of Earth’s biological resources [13]. There also needs to be constraints placed on global and basin-wide consumptive uses of water to protect freshwater supplies and ecosystems [14,15]. Limits on biodiversity loss could be based on extinction rates and indicators of functional and genetic diversity and biome conditions [14,16]. Boundaries on land-system change could also be set, such forested land as a percentage of original forest cover or potential forest [14]. Finally, in order to prevent global warming from exceeding 1.5 °C or 2 °C, the global carbon budget could be used to constrain the cumulative amount of anthropogenic CO2 emissions [17].
The main reason to establish planetary boundaries is to identify a “safe operating space for humanity”. Within this safe operating space, natural resources and the environment can be safely exploited [12] (p. 472). In this way, the planetary boundaries set an absolute limit on the exploitation of critical global biophysical sinks or resources, in order to avoid potentially catastrophic tipping points. To date, the focus has been on how to characterizing and quantify such planetary boundaries, rather than “how to maneuver within the safe operating space in the quest for global sustainability” [14] (p. 744). However, if our use of the global environment is limited by planetary boundaries, it is important to determine how to best manage the natural resources and environment available for use in the “safe operating space” [18].
The environment and natural resources that occur within a “safe operating space” can be treated as an exploitable, finite stock. One of the earliest economic analyses of the optimal management of an exhaustible resource stock was undertaken by Gray [21], with respect to the choice of the quantity of mineral to extract over time from a fixed stock of ore in a mine. Hotelling subsequently examined the optimal extraction of a non-renewable resource from the perspective of a social planning agency, aiming to maximize the social welfare from mineral production at the industry level [22]. In order to maximize social welfare, the planner decides what are the net benefits of extracting some of the minerals today rather than waiting until tomorrow. The resulting “Hotelling’s rule” states that the price of the resource (or the resource rent) is expected to grow over time at a rate equal to the rate of interest [22]. Given Hotelling’s rule, an optimal extraction path for the nonrenewable resource can be determined that satisfies the stock constraint (i.e., resource availability) and the terminal condition (i.e., that all of the resource is used up in the final period of extraction).
Several extensions to the optimal extraction model have been developed [23]. For example, to take account of the availability of resource substitutes and whether the resource is necessary for the production of other goods in society, the impact of an increase in extractions costs, a rise in the rate of interest, declining quality of the stock and demand and reserve uncertainty [23,24,25,26,27,28,29,30]. The allocation and distribution impacts of resource exploitation decisions under different market structures, such as perfect competition, monopoly and oligopoly have also been explored [23,31,32,33,34]. The economic framework of this optimal extraction model for an exhaustible resource has been applied to several different types of resources, including mineral resources, energy stocks (especially gas and oil reserves) [35] and the management of groundwater resources [36]. In recent years, Barbier and Burgess have applied this framework to address the optimal management of “safe operating spaces” in the case of natural forests [37] and the global carbon budget [38]. However, as far as we are aware, this is the first paper to examine the optimal management of the environmental and natural resource assets demarked by safe operating space under monopolistic rather the perfectly competitive conditions.
3. Materials and Methods
3.1. Key Definitions and Concepts
The critical reason for establishing planetary boundaries on sub-systems and processes of the global environment is to avoid exceeding “tipping points” or “thresholds”. Surpassing these limits could lead to irreversible changes in the Earth system. This could potentially induce catastrophic impacts for humanity. As we noted in the Introduction, nine processes have been identified by scientists that should be subject to planetary boundaries [11,12,13,14,15,16]. These include: land-system change; biochemical flows (e.g., effluents that interfere with nitrogen and phosphorous cycles); climate change; freshwater use; loss of biosphere integrity (e.g., marine and terrestrial biodiversity loss); stratospheric ozone depletion; ocean acidification; atmospheric aerosol loading; and novel entities (e.g., new substances and modified organisms that have undesirable environmental impacts).
If human activity goes unchecked, overuse and misuse of these sub-systems and processes could place human population growth and economic welfare on an unsustainable path. Ultimately, such activity could exceed critical thresholds and de-stabilize the global environment and the global economy. The aim of establishing planetary boundaries is “to help guide human societies away from such a trajectory by defining a “safe operating space” in which we can continue to develop and thrive” [14] (p. 737). Furthermore, the boundary that establishes a safe operating space should include a “buffer” that take into account the “uncertainty in the precise position of the threshold” and “also allows society time to react to early warning signs that it may be approaching a threshold and consequent abrupt or risky change” [14] (pp. 737–738).
Once a planetary boundary has been established for critical Earth system resources and sinks, it is then important to determine the best way to manage the remaining safe operating space that is available for exploitation [14,18,19,39]. However, doing so requires understanding how the market conditions under which any safe operating space is exploited will impact its depletion over time. This is especially important given the growing market concentration and monopoly power in key economic sectors that exploit the environment and resources that constitute many safe operating spaces [20].
As Table 1 indicates, nine major economic sectors exploiting global environmental resources and sinks are dominated by a small number of large companies. These firms have considerable leeway in controlling the markets for their activities, as they are major transnational corporations (TNCs) operating globally. Consequently, “a handful of TNCs have a major direct or indirect influence on the world’s ocean, the global atmosphere and terrestrial biomes, components that serve critical functions in Earth’s dynamics” [20] (p.1397).
There is evidence that the economic activities of large, market-dominating TNCs operating in key sectors exploiting the global environment have endangered critical Earth System processes, such as climate stability. For example, the cumulative amount of anthropogenic CO2 emissions that would prevent global warming from exceeding 1.5 °C or 2 °C is known as the global carbon budget [8]. A substantial amount of the global carbon budget has been depleted since the Industrial Revolution, mainly by major producers of fossil fuel and cement [40]. Cumulative emissions by twenty major companies in these markets accounted for nearly 30% of industrial carbon emissions worldwide from 1751 to 2010, and 90 major emitters contributed 63% of total emissions [40]. Such large corporations need to be involved in the transition to sustainability if we are to protect critical Earth systems and the future for humanity [41,42,43,44,45]. However, transitioning to more sustainable corporate responsibility may be challenging for TNCs, and require further research and policy action on incentives for sustainable management, framework for reporting and assessment, and options for sustainable investment [41,42,43,44,45].
There has been little research to date on the potential for dominant firms that exert market power over the planet’s remaining environment and natural resources contained within “safe operating spaces” to act as stewards of these assets. Economic analysis of finite depletable assets has identified an important tradeoff from monopoly exploitation. On the one hand, by utilizing its market power a monopoly can capture excessive rents from depleting the asset as compared to a firm in a competitive market situation. On the other hand, under certain market conditions, the monopoly can extract the natural resource or exploit the environment at a slower rate initially and thus extend the lifetime of the asset well into the future [41,42,43,44]. If it is in the interest of a large corporation with market power to conserve more initially, it can have important spillover effects. That is, “should dominant TNCs impose effective sustainability standards throughout their supply chain, this could influence both upstream and downstream market actors, including small and medium enterprises” [20] (p. 1398).
The remainder of this article explores this tradeoff in more detail. We develop a model to illustrate how exploitation of the environment and resources that constitute many safe operating spaces differs under competitive as opposed to monopolistic market conditions. These are two extreme stylized cases, and there are numerous different types of market structures between these two extremes. Although we acknowledge that some market conditions could lead to excessive exploitation by a monopoly [31,32,33,34], here we focus on the case where it is compatible with extending the life of the safe operating space. However, this comes at the expense of a monopoly capturing excessive resource rents from exploitation. We then discuss, with real-world examples, evidence that this outcome could occur, and the need for policies to tax the monopoly rents without compromising the more sustainable use of the environment.
3.2. The Safe Operating Space as an Economic Asset
In our modeling approach, we treat the safe operating space as defined by planetary boundaries as an economic asset. Our modelling approach is based on an analysis that we developed in a previous article in this journal [19]. We replicate this approach here to derive the conditions for efficient management of a safe operating space and show how this is also compatible with optimal management [19].
First, let us assume that the initial safe operating space associated with a given planetary boundary be denoted as S0. This measurable stock of a depletable natural resource or environmental attribute would depend on the planetary boundary. For example, terrestrial net primary production, available freshwater for consumption, species richness, assimilative capacity for various pollutants, forest land area, or the global carbon budget [11,12,13,14,15,16,17]. Irrespective of how this planetary boundary is delineated and measured, S0 is a finite, depletable stock. This stock is available for use, exploitation or conversion through economic activity. The initial stock, or safe operating space, is thus considered an economic asset.
At time t, some of the initial S0 will already have been “used up” by the economy. Let us define as the cumulative amount of the safe operating space that has already been depleted by economic activity. The remaining stock of this asset at time t is therefore , and it follows that
where a dot over a variable indicates its derivative with respect to t.
Given that the safe operating space is an economic asset, standard economic theory tells us that its cumulative exploitation must earn a rate of return that is comparable to all other forms of capital in the economy. Let us assume that the average rate of return across all other assets in the economy be denoted as some interest rate r. We also assume that cumulative exploitation of the safe operating space up to time t is for various market-oriented activities. These activities have market prices that can be aggregated into some average price index . Finally, we assume for analytical convenience that the market price is net of any cost of exploitation. Therefore, cumulative exploitation is sold at this market price and the proceeds are invested at interest rate r.
Given the nature of the sub-system or process that is constrained by a planetary boundary, the available safe operating space at time t might increase. This could be due to regeneration of the assimilative capacity or due to natural (i.e., biological) growth. This may occur for any that is defined in terms of sinks of carbon, ocean recovery from acidification, nitrogen and phosphorus cycles, replenishment of freshwater ecosystems, and so on. This may also arise in the case of biological or land resources, such as forest land or species stocks. Representing such natural growth or recovery as , we assume that any such increase in the available safe operating space at time t can be immediately exploited at the rate . This regenerated stock can be sold at the same market price for cumulative exploitation.
We need to take account of two additional values of the safe operating space. First, the remaining natural asset may be subject to capital gains or losses if there is a change in market prices. These gains or losses at any time t are denoted by . Second, the available safe operating space may generate wider social benefits, or “stock externalities”, especially if it includes maintenance of important habitats, ecosystems or biological species. These additional values could include biodiversity benefits, carbon sequestration, watershed protection, ecotourism and so on. We assume that, for any remaining , the aggregate value of stock externalities is given by . This can be expressed as a “markup” v of the market price of exploiting the safe operating space. This is a simplifying assumption that is implemented for analytical convenience, but it allows flexibility to explore other possible alternatives. However, it is not realistic for all types of stock externalities. The reason for such markup is that if the social value of any stock externalities is less than or equal to the market price of exploiting the safe operating space, then S(t) would not be conserved. Under these assumptions, the social benefit that is obtained from any such stock externalities is given by .
The optimal management of the safe operating space at time t therefore requires choosing the amount of remaining that maximizes all the values derived from this asset. That is:
For analytical convenience, we will suppress the time argument. The first-order condition then yields
which is the optimal portfolio balance equation for . The left-hand side of the equation represents the marginal returns for holding on to the remaining safe operating space rather than exploiting it. The right-hand side of the equation gives the opportunity cost, in terms of foregone interest income from other economic assets, from retaining .
We note that that . This implies that the remaining safe operating space is at risk of rapid depletion if and v are small or if is large. In addition, if natural growth or recovery and stock externalities are negligible, then (3) corresponds to the Hotelling efficiency condition associated with a pure exhaustible resource, which is given by .
We assume that the marginal rate of biological growth of recovery is constant for analytical convenience. This lets us denote . This allows Equation (3) to be rewritten as which in turn gives us the following solution for the price path
Under these conditions, the market price associated with exploiting the safe operating space should grow at a rate equal to the net rate of return ρ earned from investing the proceeds from such resource use. So long as , then the price path is increasing. This suggests that there are positive benefits (i.e., net returns) from exploiting and investing the proceeds. As a result, it is worthwhile to exploit the safe operating space today. This implies that there will be less available for exploitation in future periods, and so p must rise over time. The other alternative is that, as , there are no positive benefits (i.e., net returns) to the invested proceeds earned from exploiting . Under these conditions, the safe operating space will be conserved indefinitely.
In [19], we show that the efficiency conditions given in (3) and (4) for managing the safe operating space as an economic asset also ensure that the remaining stock is optimally exploited. Here, we want to show the impact of market structure on exploitation. We first derive the conditions for exploitation in a competitive market, and show that this can correspond to the optimal and efficient outcome conditions (3) and (4). We then turn our attention to the case of a monopolistic market, and demonstrate that the existence of monopoly profits ensures that exploitation of is neither efficient nor optimal, but can lead to more conservative use of the remaining safe operating space in the long run.
4. Results
4.1. Exploitation in a Competitive Market
Suppose that the markets for all the goods and services derived from using the safe operating space are perfectly competitive, and that there are firms exploiting to supply these markets. All firms have equal and constant marginal cost of exploitation, and because of the competitive conditions, they all face the same market price net of cost . Given this price, each firm i chooses how much of the safe operating space to exploit in order to maximize their discounted profits over a finite time period, given by . The ith firm’s objective is to
subject to
where is the share of the remaining safe operating space available at any time t for the ith firm to exploit.
The discount rate for the ith firm’s profits given in (5) is the net rate of return that is earned from investing the proceeds of exploitation ρ derived earlier. In this way, each competitive firm’s exploitation of the safe operating space satisfies the optimal portfolio balance condition (3). This is required when managing , which is treated as an economic asset. If this does not happen, then a firm would quickly liquidate its proportion of the safe operating space, and invest the proceeds in other economic assets in the economy, as they would yield a better return. This also implies that the marginal value that each firm puts on conserving its proportion of the remaining safe operating space must be equivalent to the net price of exploitation.
Let us explore this further. Let be the shadow value with respect to profits for the ith firm of having another unit of . By definition, this is . As all firms face the same discounted profit maximization choice as represented by (5), then this shadow value is the same for all firms. The solution to the above optimal control problem (5) and (6) is determined by forming the corresponding Hamiltonian. Two necessary conditions for maximizing (5) with respect to (6) are therefore and . This confirms that the level of exploitation chosen by all competitive firms in each time period ensures that price is equal to the marginal value of the remaining safe operating space. This level of exploitation also requires . Given this, the price path must follow the condition given in (4). Consequently, under competitive market conditions, firms will exploit the safe operating space according to conditions (3) and (4), thus leading to efficient and optimal use of .
Condition (4) also ensures that the discounted marginal profit earned by each competitive firm must be constant over time. The marginal profit for the ith firm is always the net price , and from rearranging (4), we have . If discounted marginal profits were not the same over time, a firm could increase its profits by switching exploitation between time periods so that more would take place when discounted profits were high and less use when they were low.
Finally, the increase in the firm’s net price, or marginal profit, over time reflects the fact that the safe operating space is a finite asset and, as it is being exploited, that the remaining asset is growing increasingly scarce. Even though firms operate in competitive markets, the growing scarcity of the safe operating space ensures that each firm earns a scarcity rent as represented by , which must increase over time as the asset becomes depleted and increasingly scarce. In contrast, if there were no planetary boundary limiting the safe operating space to a fixed amount , then the sources or sinks available for exploitation exist in unlimited quantities. There would be no shadow value, or scarcity, associated with conserving any remaining and thus . However, this in turn means that the net price received by each competitive firm is also zero, as the (gross) price is always offset by marginal cost. There is no scarcity rent earned due to constraints imposed by planetary boundaries, because there are no planetary limits on Earth’s sub-systems and processes which in turn define a finite safe operating space to exploit.
4.2. Exploitation in a Monopolistic Market
We have argued that it is unlikely that the exploitation of remaining safe operating spaces will occur by firms operating in competitive markets. As discussed above, there is considerable evidence that many of the world’s remaining sources and sinks are already exploited for markets dominated by a small number of large firms (Table 1). These key large firms, or TNCs, have the potential to exert considerable market power, and through collusion and signaling, could act to control the net market price received by determining how much of the entire safe operating space they exploit and sell. In effect, exploitation would take place under monopolistic market conditions, as if all firms operated together as a single seller.
The objective of this single seller, or monopoly, is to choose an aggregate amount of exploitation of the remaining safe operating space so as to maximize its discounted profit over the time horizon , i.e.,
subject to (1).
Because of its market power, the monopoly can earn profits of in every time period. The discount rate applied to these profits is given by ρ, which is the net rate of return earned from investing the profits of exploitation. Under these conditions, the monopoly’s exploitation of the safe operating space satisfies the portfolio balance condition (3) that is required for managing as an economic asset. Otherwise, the monopoly would quickly liquidate any of the safe operating space that remains, and invest the proceeds in other economic assets in the economy. However, condition (4) no longer holds. For the monopoly, the marginal value that it places on conserving the remaining safe operating space is not equivalent to the net price of exploitation . The reason is that the monopoly is able to earn additional profit through its market power.
Let be the shadow value of the monopoly’s profits that are the result of having an extra unit of . Two necessary conditions for maximizing (7) with respect to (1) are and dµ/dt = ρµ. The first condition indicates that μ, the marginal value of the remaining safe operating space, equals the marginal profit earned from exploitation . The market price p exceeds the scarcity value of the remaining by the amount , which is the excess profit that the monopoly extracts through its market power. Denoting , and given that , it follows from the second condition that . Over time, the marginal profit of the monopoly increases at the rate of discount ρ, but since marginal profit does not equal , condition (4) no longer applies. Compared to firms operating in a competitive market, the monopoly does not exploit the safe operating space efficiently or optimally.
As for competitive firms, the discounted marginal profits of the monopoly must be constant over time, i.e., . This again guarantees that the monopoly could not increase its profits by switching exploitation between time periods so that more would take place when discounted profits were high and less use when profits were low.
The fact that the monopoly can extract excess profits, in addition to scarcity rent earned, from using the safe operating space means that, compared to firms in the competitive market, it can exploit less initially and thus impose a higher price. Under certain market conditions, this means that the monopoly may extend the time to depletion of the remaining safe operating space than firms in the competitive market [31,32,33,34]. We show these results next.
4.3. Comparing Monopoly and Competitive Exploitation of the Safe Operating Space
We know that for any positive net rate of return , when there is no additional terminal value obtained by maintaining the safe operating space at the end period T or beyond, then both the competitive and monopolistic exploitation will completely use up the safe operating space . So, by the terminal period T, and therefore . Under both monopolistic and competitive market conditions, when the net price that is established by the inverse demand function reaches some maximum or “choke” price, the exploitation of the safe operating space goes to zero. If we denote the maximum price or “choke price” by k, the outcome is that price reaches this level by time T. That is, . It follows on from this that full exploitation of the safe operating space over the time period T should display the following properties
Under conditions where there is an increase in the net rate of return ρ, the time horizon for exploiting the safe operating space will be shorter. This will lead to a more rapid depletion of the initial stock, or safe operating space, . In the case where there is a larger safe operating space, the time T for depleting this economic asset, will be extended. Finally, when there are no positive benefits (i.e., net returns) to the invested proceeds earned from exploiting, as , then the safe operating space will be conserved indefinitely.
Although (8) applies to both monopolistic and competitive market exploitation of a safe operating space given by , it is likely that a monopoly will defer complete exploitation of further into the future. This outcome occurs under specific market conditions [31,32,33,34], such as the case where the marginal profit curve of the monopolist lies below the demand curve and has a steeper slope. In order to demonstrate this, let us assume an inverse demand function and a corresponding marginal profit function .
By using (4) and the conditions and , we can see that the level of exploitation in the competitive market at any time t is given by , and the time to exhaustion of the safe operating space is given by . It follows that initial exploitation is . This outcome confirms that (8) applies to the exploitation of the safe operating space in a competitive market, since , T varies inversely with ρ but rises with a larger safe operating space , and .
For the monopoly, , which implies . Consequently, given that , exploitation by the monopoly at any time t is . This means that the time period for complete use of the safe operating space is . Initial exploitation is therefore . It is easy to verify that (8) also applies to the monopoly outcome.
However, exploitation of the safe operating space will differ in monopolistic as opposed to competitive markets. As , and , a monopoly will take longer to exploit fully the safe operating space. Initial exploitation will be at a lower level, and the net price will be higher. Consequently, the monopoly will restrict output to raise prices initially compared to the competitive market, exploitation will be lower at first but higher towards the end, and the rate at which prices rise under monopoly will be lower than under perfect competition.
Figure 1 illustrates the comparison of how the safe operating space is exploited under competitive and monopolistic markets. In the diagram, we assume a positive net rate of return . Because of this, is completely exhausted in finite time T. In Figure 1, the solid lines show the price paths and rate of exploitation under competitive market conditions, whereas the dotted lines indicate the corresponding paths under monopoly. In the monopolistic market, the initial price is higher. This price rises more slowly along the price path , and takes longer to reach the maximum or “choke” price, k. Given this, the lifetime of the safe operating space is now longer, increasing from T to T’. The new path of exploitation still depletes , but it takes longer for this to occur. That is, under monopolistic conditions, exploitation starts slowly and then speeds up as T’ approaches.
Although monopoly may appear to be beneficial, in that it delays eventual exploitation of the safe operating space and can be considered more sustainable, it comes with two additional costs. First, because the rate of resource exploitation is inefficient and non-optimal, there will be a deadweight loss to society in terms of foregone economic welfare (i.e., producer and consumer surplus), which occurs when supply and demand are out of equilibrium. Second, because a monopoly is able to use its market power to make excess profits, consumers are made worse off. Consumers will spend more in present value on the marketed output produced by the monopoly than under competitive market conditions. As Figure 1 illustrates, under monopoly, individuals will consume less but pay more initially. Eventually, the market price under monopoly will fall below the competitive price as the monopoly increases its output, but these lower prices and higher consumption will be worth less in present value terms compared to the higher prices and low output of earlier periods. The monopoly earns excess profit but at the cost of lower consumer welfare. Without including more specific functional forms in our two models, we cannot compare the changes in the present value of consumer surplus for monopoly versus perfect competition. However, in the top left-hand quadrant of Figure 1, you can see how consumer surplus changes in the initial period in the monopoly case compared to that under perfect competition, as given by the shift in to and to .
5. Discussion
Several important implications emerge from this analysis of how a monopolistic market structure can impact the exploitation of a safe operating space.
Even though a small number of firms, or even a single firm, may not have complete monopoly control of the markets for exploiting the safe operating space, as long as the firms or firm can exert some form of market power to affect price, the outcome depicted here is likely to occur. For example, suppose that the market consists of a small number of large firms, or TNCs, and a group of small firms comprising a competitive fringe. If the large firms are able to act collectively to restrict their output to force up prices, each of the competitive firms would have an incentive to exploit immediately its share of the remaining safe operating space to enable them to earn an excess profit. Alternatively, the large firms could simply use their increased profits to buy out each competitive firm’s share . Either way, the larger firms can induce smaller firms to give up their shares of the remaining safe operating space, thus strengthening the market power of the large firms acting as a monopoly. By acting together to keep prices high, the group of large firms can also protect their monopoly by creating price-based barriers to entry for new, smaller firms wishing to enter the industry. These possible outcomes may explain the growing market concentration and monopoly power in the key economic sectors that exploit the environment and resources that constitute many safe operating spaces (Table 1).
As we have seen, the tradeoff is that a monopoly may be compatible with more sustainable use, by extending the life of the safe operating space. However, this is at the expense of firms capturing excessive resource rents from exploitation. This tradeoff means that policies need to tax the monopoly rents without compromising the more sustainable use of the environment.
Suppose that τ is a tax imposed on the marginal profits earned by a monopoly, so that its post-tax profits at any time t are . However, this tax will have no effect on the exploitation decision, since , or . In other words, despite the profit tax, the monopolist will exploit the remaining safe operating space to ensure that its marginal profits rise over time at the rate of discount ρ. Under these conditions, the outcome depicted in Figure 1 will again occur. In fact, the profits tax can be chosen so that it extracts all the excess profit of the monopoly so that the monopoly is only earning post-tax the scarcity rent . Yet this post-tax outcome will not impact the monopoly’s exploitation path shown in Figure 1. Compared to competitive firms, the monopoly will still delay its exploitation and therefore lengthen the life of the safe operating space. In sum, in the case of a tax on marginal profits, the tax reduces the excess profits of the producer, but does not affect the equilibrium price or quantity produced in the monopoly market. Other types of taxes, such as a tax levied on the output of a monopoly, may increase the marginal costs of the producer and lead to a further reduction in the rate of resource exploitation. However, unlike a tax on excess profits, part of the burden of an output tax may be shifted to the consumers in the form of higher prices.
The revenues gained from taxing any monopoly profits could finance public support for technological innovations that can further lengthen the lifetime of the safe operating space. This extension in the lifetime of the safe operating space could possibly be indefinite. There are three main ways in which such technological innovations may occur. First, in order to reduce the economy’s dependence on and the demand for using the various natural resources and pollution sinks that may comprise a safe operating space, investments in technological change are required to prolong its exploitation. Technological innovations, such as improved efficiencies in end use design that decouple the production of goods and services from their natural resource inputs, can result in a reduction in demand for the natural resource assets contained within the safe operating space. This would rotate “inwards” the resource demand curve that is anchored at k, in the left-hand quadrant of Figure 1. This would lead to lower prices and extend the lifetime of the safe operating space, thus postponing eventual depletion [19].
Second, investments in technological change could also include innovations that reduce the emission of environmental pollutants associated with the productions of goods and services. For example, in the case of greenhouse gases (GHG), technological innovations may include carbon sequestration and capture, GHG abatement technologies, hybrid vehicles, and converting to renewables [46]. Finally, improvements in technologies to boost agricultural yields, improve sustainable management, create net-zero land degradation, and lower the land conversion pressure on natural habitats [47] can also reduce the demand for exploitation of the safe operating space. However, because private investors are unable to capture the full benefits of such technological advances as they quickly spread throughout the economy, they tend to undertake less investment in the research and development (R&D) than is necessary to establish new “green” innovations [48,49,50]. In order to overcome this disincentive, there needs to be “technology-push policies”. Such policies include public investments, subsidies to R&D, patents to protect intellectual property, and other initiatives [48,49]. In order to rectify the incentive for firms and industries to under-invest in green R&D and thus reduce demand for resource use and pollution, it is important to establish such technology-push policies directly.
Policies such as taxes on monopolies could be invested in protecting and regenerating many of the wider social benefits associated with remaining safe operating spaces. These include carbon sequestration, watershed maintenance, biodiversity benefits, and ecotourism. One type of investment that can simultaneously provide both global biodiversity and climate is “natural climate solutions” (NCS). The NCSs consist of conservation, restoration and sustainable land management activities that protect biodiversity and ecosystem services while simultaneously reducing greenhouse gas emissions [51]. Such NCS could increase f, which would also extend the lifetime of the safe operating space. If regeneration efforts are very substantial, then the net rate of return, given by ρ, may move towards zero. Under these conditions, the safe operating space will be conserved indefinitely.
NCS has proven to be a cost-effective method of storing carbon and protecting biodiversity, especially for countries with tropical forests [52,53]. However, the international community has provided inadequate financing of such investments in tropical countries [51,54]. The lack of support for avoided deforestation and reforestation is especially surprising, given their importance to combatting global warming and biodiversity loss. Only three percent of climate mitigation funding is allocated to controlling global land degradation and loss [55], yet tropical deforestation alone emits 4.8 GtCO2 annually in greenhouse gases, which makes it the third-largest contributor to global emissions behind China and the United States [56]. NCS to halt tropical forest loss and restore ecosystems can significantly impact global biodiversity, as over three-quarters of species are found in the tropics [57].
Recent scientific evidence shows that NCS, which include increasing soil carbon levels, reversing deforestation, establishing reforestation, and enhancing wetland maintenance, are increasingly considered to be cost-effective investments to reduce greenhouse gas emissions derived from land use [51,58,59]. In order to stabilize warming to below 2 °C, NCS can also provide over one-third of the cost-effective climate mitigation action required by 2030. Furthermore, they can do so at a low cost. One-third of these mitigation actions cost USD 10 per 103 tonnes of CO2e or less [51]. For example, the United States could abate nearly 300 million tonnes CO2e of greenhouse gas emissions each year through such NCS. These NCS would also provide other benefits, such as flood control, conservation of soils, water and air filtration, and protection of wildlife habitats [59].
Finally, an important issue is whether monopolies exploiting remaining safe operating spaces will have an incentive to take into account v, the wider social and environmental values associated with these assets. As we have shown previously [19], the markup v will be high under the conditions where these values are extremely large. When this happens, the net rate of return ρ earned from investing the profits from using the safe operating space will be lower. Given this, the price path will rise more slowly. Full exploitation of the remaining safe operating space will take longer. In the extreme case where stock externalities are very high, then the net rate of return ρ will approach zero. Here, will be conserved indefinitely.
However, there are a number of reasons why large companies with market power may fail to act as “biosphere stewards” [60,61]. For one, because of their global reach, many transnational corporations that exploit environmental resources and sinks operate in countries and regions that do not have strong political institutions. In these countries and regions, corruption, political instability, human rights violations, weak rules of law, and armed conflict may occur [61]. Additionally, many TNCs wield considerable political and lobbying power, which enables them to evade regulation of their environmental activities [61]. In addition, despite their market power, many large corporations differ widely in their incentives to be “biosphere stewards” across different economic sectors, as well as vary greatly in their agency and effectiveness to act on such incentives [61]. That is why, for example, “many car manufacturers are developing low-carbon vehicles while at the same time lobbying for less-stringent emissions standards, making them both “good” and “bad” at the same time” [61] (p. 493).
In some economic sectors dependent on exploiting key global environmental resources and sinks, large and dominant firms have little incentive to take into wider social and environmental values. This is especially true for the major producers of fossil fuel and cement that are responsible for much of the depletion of the global carbon budget [40]. Instead, these producers and markets have benefited commercially from the “underpricing” of fossil fuels. Researchers at the International Monetary Fund (IMF) estimate this underpricing through calculating the difference between consumer fuel prices in actual markets, compare to how much consumers would pay under conditions where prices reflect the full supply costs and any taxes correct for environmental damages, such as the costs of local pollution, climate change, traffic congestion, road damage and accidents, and additional revenue requirements [62,63]. At the global level, fossil fuel underpricing amounted to USD 5.2 trillion (6.5% of world GDP) in 2017 [63], which suggests that cement, fossil fuel and other carbon-intensive producers are not routinely taking into account the significant environmental damages from using fossil fuels to deplete the global carbon budget.
However, there are signs that some major companies in other sectors are acting on the longer-term benefits, and wider environmental and social impacts, of their exploitation. For example, as noted in Table 1, the control of 11–16% of global marine catch is in the hands of 13 seafood companies as well as 19–40% of commercially valuable stocks. Ten of these companies have come together to establish the Seafood Business for Ocean Stewardship initiative (SEABOS). SEABOS commits its members to more sustainable management of marine resources and the oceans [64]. For example, the world’s largest seafood retailer has stated its commitment to only harvesting seafood that is certified as sustainable. Such market leadership has encouraged other retailers to follow their example, and this has led to a rapid increase in global seafood certification [65]. Across many different sectors, as many as 300 leading companies have invested in the sustainable management of their natural resource and environmental assets over the past two decades, and several thousand other companies have incorporated sustainability considerations into their business strategies [20].
If large, dominant corporations are serious about stewardship of the biosphere, then they should take a more active role in leading international efforts to promote and finance global conservation [13,14,15,16,17,18,30]. For example, as we discussed in a previous study [54], key companies in natural resource and environmental sectors, such as agriculture and insurance, seafood, and forestry, have a financial incentive to avert the worldwide biodiversity crisis. It is in the interests of the TNC in these sectors to agree on targets for protecting forests, increasing marine stocks and reserves, preserve and protect habitats of wild pollinators and conserving coastal wetlands. TNC should pledge to establish and achieve such goals, as well as contributing assistance in terms of financial aid and technological development for natural resources and environmental conservation in developing countries. The increase in TNC revenues and profits for seafood, forestry and insurance firms from meeting such goals, targets and investments, could provide as much as USD 25–50 billion each year for global conservation [54]. Agricultural corporations, such as the dominant producers of commodities listed in Table 1, also have a financial incentive to sustain and restore the habitats of wild pollinators. Together with managed pollinators, these wild pollinators enhance global crop production by USD 235 billion to 577 billion each year [66]. Transitioning to more sustainable corporate responsibility and investment may be challenging for TNCs, and require support and a suitable framework for reporting and assessment [41,42,43,44,45].
6. Conclusions
In this paper, we discussed how planetary boundaries can be used to determine “safe operating spaces” for key environmental and natural resource assets. A safe operating space can be treated as a natural capital stock that is available for extraction or exploitation up until the point where the stock is depleted. Given that more and more of the key environmental and natural resources that comprise safe operating spaces are being exploited by a handful of large firms with considerable market power, we compare and contrast the perfectly competitive exploitation decision with that under monopolistic conditions. We also look at the constraints and opportunities that may arise for conservation and sustainable management of the safe operating space under conditions where market power is in the hands of a few dominant firms. We explore the role of voluntary contributions and the need for government intervention to achieve sustainable management, protection and restoration of critical environmental and natural resource assets.
This article shows that resource exploitation in a monopolistic market can lower the rate of extraction and extend the time to depletion of the safe operating space compared to that under perfect competition. Given this, monopolistic conditions may be considered to be compatible with more sustainable use of the safe operating space. However, these sustainability benefits of monopolistic extraction come at the cost of a loss in efficiency and also at the expense of monopolistic firms capturing excessive resource rents, or profits, from exploitation. Furthermore, if large, powerful corporations use their market power to protect their market share and lobby for less oversight of their resource extraction and environmental emissions, then the potential beneficial environmental impacts of monopolies may be undermined.
However, dominant corporations that are concerned with sustainably managing their environment and natural resource assets for their own private interests and for broader corporate environmental responsibilities that embrace stewardship of the biosphere, can potentially have an important role in leading international efforts to promote and finance global conservation of Earth systems and processes. Their ability to create excessive revenue through monopoly power can provide an important opportunity for TNCs to channel funds and investments into sustainable management, protection and regeneration of natural resource and environmental assets. The importance of corporate social responsibility is being increasingly recognized by TNCs, and is creating incentives for more sustainable business practices [67,68,69]. Further research is required to explore the conditions under which it is in the interests of TNCs to take a positive, leading role in managing their environmental and natural resource assets and embracing broader planetary environmental safeguards.
In the absence of voluntary environmental sustainability action by TNCs, government intervention may be required and any royalties or license fees need to be designed in such a way as to capture some of the monopoly rents without compromising the monopolists’ more conservative extraction and exploitation of the safe operating space. This tax revenue can be channeled into investments in new technologies to reduce dependence on the environmental asset, protect or regenerate natural assets that are essential for global environmental sustainability, and offset or reduce any external costs resulting from the loss of the wider environmental and social values associated with these assets. If such efforts are sufficiently substantial, then the safe operating space may be conserved indefinitely. More research is required to explore the potential for such investments and interventions to protect planetary boundaries and extend the lifetime of the environmental and natural resource assets contained within the safe operating space.
Although the presence of a few dominant firms managing the extraction of key environmental and natural resource assets can lead to inefficiencies and a loss of economic welfare compared to the competitive market situation, it can also provide an important opportunity for TNCs to reduce the rate of exploitation, lengthen the life of the safe operating space, and more broadly contribute towards broader global environmental objectives. As dominant firms continue to expand and exert market power over the planet’s remaining environment and resources that constitute safe operating spaces, it will become increasingly important that their corporate environmental responsibility and role as stewards of the biosphere is recognized, promoted and enforced.
In sum, this paper applies an optimal depletion model to the extraction of exhaustible assets contained within a safe operating space, as designated by planetary boundaries, under monopolistic conditions. Our results show that the monopoly may be compatible with more sustainable use of the safe operating space, by extending the life of the exploitable, depletable stock, at the expense of firms capturing excessive resource rents from exploitation. Policies implemented to tax the excessive monopoly rents can be designed without compromising the sustainable use of the environment. The revenue raised may be channeled into protecting or regenerating natural assets that are essential for global environmental sustainability. If technological innovation, investment in regeneration, or internalization of the wider social and environmental values associated with the exhaustible assets, are sufficiently large then the safe operating space may be conserved indefinitely. This topic has not been previously addressed in the existing literature, and in this way, this paper makes an original and important contribution to our understanding and analysis of the sustainable use of the environment, in the presence of planetary boundaries, under conditions of market power.
Author Contributions
E.B.B. and J.C.B. conceived and designed the research; E.B.B. developed the analysis; E.B.B. and J.C.B. wrote the paper. All authors have read and agreed to the published version of the manuscript.
Funding
This research received no external funding.
Institutional Review Board Statement
Not applicable.
Informed Consent Statement
Not applicable.
Data Availability Statement
Not applicable.
Conflicts of Interest
The authors declare no conflict of interest.
References
- IPBES. Global Assessment Report on Biodiversity and Ecosystem Services of the Intergovernmental Science-Policy Platform on Biodiversity and Ecosystem Services; Brondizio, E.S., Settele, J., Díaz, S., Ngo, H.T., Eds.; IPBES Secretariat: Bonn, Germany, 2019. [Google Scholar]
- Le Quéré, C.; Andrew, R.M.; Friedlingstein, P.; Sitch, S.; Hauck, J.; Pongratz, J.; Pickers, P.A.; Korsbakken, J.I.; Peters, G.P.; Canadell, J.G. Global carbon budget 2018. Earth Syst. Sci. Data 2018, 10, 2141–2194. [Google Scholar] [CrossRef] [Green Version]
- World Bank, World Development Indicators. Available online: https://databank.worldbank.org/reports.aspx?source=world (accessed on 16 July 2020).
- BP Statistical Review of World Energy. Available online: https://www.bp.com/en/global/corporate/energy-economics/statistical-review-of-world-energy.html (accessed on 5 June 2019).
- Ritchie, H.; Roser, M. CO2 and greenhouse gas emissions. World Data. Available online: https://ourworldindata.org/co2-and-other-greenhouse-gas-emissions (accessed on 17 July 2020).
- Food and Agriculture Organization of the United Nations (FAO) Forest Resources Assessment (FRA) 2015 Data. Available online: http://www.fao.org/forest-resources-assessment/explore-data/en (accessed on 29 July 2020).
- WWF. Living Planet Report—2018: Aiming Higher; Grooten, M., Almond, R.E.A., Eds.; WWF: Gland, Switzerland, 2018. [Google Scholar]
- Duarte, C.M.; Agusti, S.; Barbier, E.; Britten, G.L.; Castilla, J.C.; Gattuso, J.P.; Fulweiler, R.W.; Hughes, T.P.; Knowlton, N.; Lovelock, C.E. Rebuilding marine life. Nature 2020, 580, 39–51. [Google Scholar] [CrossRef] [PubMed]
- Ritchie, H. Where Does Our Plastic Accumulate in the Ocean and What Does That Mean for the Future? 2019. Available online: https://ourworldindata.org/where-does-plastic-accumulate (accessed on 17 July 2020).
- Lebreton, L.; Egger, M.; Slat, B. A global mass budget for positively buoyant macroplastic debris in the ocean. Sci. Rep. 2019, 9, 1–10. [Google Scholar] [CrossRef] [PubMed] [Green Version]
- Lenton, T.M.; Held, H.; Kriegler, E.; Hall, J.W.; Lucht, W.; Rahmstorf, S.; Schellnhuber, H.J. Tipping elements in the Earth’s climate system. Proc. Natl. Acad. Sci. USA 2008, 105, 1786–1793. [Google Scholar] [CrossRef] [Green Version]
- Rockström, J.; Steffen, W.; Noone, K.; Persson, A.; Chapin, A.S., III; Lambin, E.F.; Lenton, T.M.; Scheffer, M.; Foke, C.; Schellnhuber, H.J.; et al. A safe operating space for humanity. Nature 2009, 461, 472–475. [Google Scholar] [CrossRef]
- Running, S.W. A measurable planetary boundary for the biosphere. Science 2012, 337, 1458–1459. [Google Scholar] [CrossRef] [Green Version]
- Steffen, W.; Richardson, K.; Rockström, J.; Cornell, S.E.; Fetzer, I.; Bennett, E.M.; Biggs, R.; Carpenter, S.R.; de Vries, W.; de Wit, E.A.; et al. Planetary boundaries: Guiding human development on a changing planet. Science 2015, 347, 1259855. [Google Scholar] [CrossRef] [Green Version]
- Gerton, D.; Hoff, H.; Rockström, J.; Jägermeyr, J.; Kummu, M.; Pastor, A.V. Towards a revised planetary boundary for consumptive freshwater use: The role of environmental flow requirements. Curr. Opin. Sust. 2013, 5, 551–558. [Google Scholar] [CrossRef]
- Mace, G.M.; Reyers, B.; Alkemade, R.; Biggs, R.; Chapin, F.S., III; Cornell, S.E.; Díaz, S.; Jennings, S.; Leadley, P.; Mumby, P.J.; et al. Approaches to defining a planetary boundary for biodiversity. Glob. Environ. Chang. 2014, 28, 289–297. [Google Scholar] [CrossRef]
- Intergovernmental Panel on Climate Change (IPCC). Climate Change 2014: Synthesis Report. Contribution of Working Groups I, II and III to the Fifth Assessment Report of the Intergovernmental Panel on Climate Change; Core Writing Team, Pachauri, R.K., Meyer, L.A., Eds.; IPCC: Geneva, Switzerland, 2014. [Google Scholar]
- Smith, V.K. Environmental economics and the Anthropocene. Available online: https://0-doi-org.brum.beds.ac.uk/10.1093/acrefore/9780199389414.013.386 (accessed on 20 July 2020).
- Barbier, E.B.; Burgess, J.C. Natural resource economics, planetary boundaries and strong sustainability. Sustainability 2017, 9, 1858. [Google Scholar] [CrossRef] [Green Version]
- Folke, C.; Österblom, H.; Jouffray, J.-B.; Lambin, E.F.; Scheffer, M.; Crona, B.I.; Nyström, M.; Levin, S.A.; Carpenter, S.R.; Anderies, J.M.; et al. Transnational corporations and the challenge of biosphere stewardship. Nat. Ecol. Evol. 2019, 3, 1396–1403. [Google Scholar] [CrossRef] [PubMed] [Green Version]
- Gray, L.C. Rent under the assumption of exhaustibility. Q. J. Econ. 1914, 28, 466–489. [Google Scholar] [CrossRef]
- Hotelling, H. The economics of exhaustible resources. J. Political Econ. 1931, 39, 137–175. [Google Scholar] [CrossRef]
- Hartwick, J.M.; Olewiler, N.D. The Economics of Natural Resource Use; Harper and Row, Inc.: New York, NY, USA, 1986. [Google Scholar]
- Dasgupta, P.; Heal, G. The optimal depletion of exhaustible resources. Rev. Econ. Stud. 1974, 41, 3–28. [Google Scholar] [CrossRef]
- Dasgupta, P.S.; Heal, G.M. Economic Theory and Exhaustible Resources; Cambridge University Press: Cambridge, UK, 1979. [Google Scholar]
- Hartwick, J.M. Intergenerational equity and the investing of rents from exhaustible resources. Am. Econ. Rev. 1977, 67, 972–974. [Google Scholar]
- Stiglitz, J. Growth with exhaustible natural resources: Efficient and optimal growth paths. Rev. Econ. Stud. 1974, 41, 123–137. [Google Scholar] [CrossRef] [Green Version]
- Pindyck, R.S. The optimal exploration and production of nonrenewable resources. J. Political Econ. 1978, 86, 841–861. [Google Scholar] [CrossRef]
- Devarajan, S.; Fisher, A.C. Hotelling’s “economics of exhaustible resources”: Fifty years later. J. Econ. Lit. 1981, 19, 65–73. [Google Scholar]
- Solow, R.M. The economics of resources or the resources of economics. In Classic Papers in Natural Resource Economics; Palgrave Macmillan: London, UK, 1974; pp. 257–276. [Google Scholar]
- Stiglitz, J.E. Monopoly and the rate of extraction of exhaustible resources. Am. Econ. Rev. 1976, 66, 655–661. [Google Scholar]
- Stiglitz, J.E.; Dasgupta, P. Market structure and resource depletion: A contribution to the theory of intertermporal monopolistic competition. J. Econ. Theory 1982, 28, 128–164. [Google Scholar] [CrossRef] [Green Version]
- Lewis, T.R. Monopoly exploitation of an exhaustible resource. J. Environ. Econ. Manag. 1976, 3, 198–204. [Google Scholar] [CrossRef]
- Sweeney, J.L. Economics of depletable resources: Market forces and intertemporal bias. Rev. Econ. Stud. 1977, 44, 125–141. Available online: https://0-www-jstor-org.brum.beds.ac.uk/stable/2296977 (accessed on 29 July 2020).
- Salant, S.W. Exhaustible resources and industrial structure: A Nash-Cournot approach to the world oil market. J. Political Econ. 1976, 84, 1079–1093. [Google Scholar] [CrossRef]
- Brown, G., Jr.; Deacon, R. Economic optimization of a single-cell aquifer. Water Resour. Res. 1972, 8, 557–564. [Google Scholar] [CrossRef]
- Barbier, E.B.; Burgess, J.C. Scarcity and Safe Operating Spaces: The Example of Natural Forests. Environ. Resour. Econ. 2019, 74, 1077–1099. [Google Scholar] [CrossRef]
- Barbier, E.B.; Burgess, J.C. Depletion of the global carbon budget: A user cost approach. Environ. Dev. Econ. 2017, 22, 658–673. [Google Scholar] [CrossRef] [Green Version]
- Barbier, E.B. The concept of natural capital. Oxf. Rev. Econ. Pol. 2019, 35, 14–36. [Google Scholar] [CrossRef]
- Heede, R. Tracing anthropogenic carbon dioxide and methane emissions to fossil fuel and cement producers. Clim. Chang. 2014, 122, 229–241. [Google Scholar] [CrossRef] [Green Version]
- Sjåfjell, B. Sustainable value creation within planetary boundaries—Reforming corporate purpose and duties of the corporate board. Sustainability 2020, 12, 6245. [Google Scholar] [CrossRef]
- Yin, W. Integrating sustainable development goals into the Belt and Road Initiative: Would it be a new model for green and sustainable investment? Sustainability 2019, 11, 6991. [Google Scholar] [CrossRef] [Green Version]
- Quinn, J. The sustainable corporate objective: Rethinking directors’ duties. Sustainability 2019, 11, 6734. [Google Scholar] [CrossRef] [Green Version]
- Salzmann, O.; Ionescu-Somers, A.; Steger, U. The business case for corporate sustainability: Literature review and research options. Eur. Manag. J. 2005, 23, 27–36. [Google Scholar] [CrossRef]
- Tsalis, T.A.; Malamateniou, K.E.; Koulouriotis, D.; Nikolaou, I.E. New challenges for corporate sustainability reporting: United Nations’ 2030 Agenda for sustainable development and the sustainable development goals. Corp. Soc. Responsib. Environ. Manag. 2020, 27, 1617–1629. [Google Scholar] [CrossRef]
- van der Ploeg, F. The safe carbon budget. Clim. Chang. 2018, 147, 47–59. [Google Scholar] [CrossRef] [Green Version]
- Grainger, A. Is land degradation neutrality feasible in dry areas? J. Arid Environ. 2015, 112, 14–24. [Google Scholar] [CrossRef]
- Barbier, E.B. Nature and Wealth: Overcoming Environmental Scarcity and Inequality; Palgrave MacMillan: London, UK, 2015. [Google Scholar]
- Goulder, L. Induced Technological Change and Climate Policy; Pew Center on Global Climate Change: Arlington, VA, USA, 2004. [Google Scholar]
- Fankhauser, S.; Bowen, A.; Calel, R.; Dechezleprêtre, A.; Grover, D.; Rydge, J.; Sato, M. Who will win the green race? In search of environmental competitiveness and innovation. Glob. Environ. Chang. 2013, 23, 902–913. [Google Scholar] [CrossRef] [Green Version]
- Griscom, B.W.; Adams, J.; Ellis, P.W.; Houghton, R.A.; Lomax, G.; Miteva, D.A.; Schlesinger, W.H.; Shoch, D.; Siikamäki, J.V.; Smith, P.; et al. Natural climate solutions. Proc. Natl. Acad. Sci. USA 2017, 114, 11645–11650. [Google Scholar] [CrossRef] [PubMed] [Green Version]
- Busch, J.; Engelmann, J.; Cook-Patton, S.C.; Griscom, B.W.; Kroeger, T.; Possingham, H.; Shyanmsundar, P. Potential for low-cost carbon dioxide removal through tropical reforestation. Nat. Clim. Chang. 2019, 9, 463–466. [Google Scholar] [CrossRef]
- Griscom, B.W.; Busch, J.; Cook-Patton, S.C.; Ellis, P.W.; Funk, J.; Leavett, S.M.; Lomax, G.; Turner, W.R.; Chapman, M.; Engelmann, J.; et al. National mitigation potential from natural climate solutions in the tropics. Philos. Trans. R. Soc. B Biol. Sci. 2020, 375, 20190126. [Google Scholar] [CrossRef] [Green Version]
- Barbier, E.B.; Burgess, J.C.; Dean, T.J. How to pay for saving biodiversity. Science 2018, 360, 486–488. [Google Scholar] [CrossRef]
- CPI. Global Landscape of Climate Finance 2019. Available online: https://climatepolicyinitiative.org/wp-content/uploads/2019/11/GLCF-2019.pdf (accessed on 16 July 2020).
- Gibbs, D.; Harris, D.N.; Seymour, F. By the Numbers: The Value of Tropical Forests in the Climate Change Equation. World Resources Institute (WRI), 4 October 2018. Available online: https://www.wri.org/blog/2018/10/numbers-value-tropical-forests-climate-change-equation (accessed on 16 July 2020).
- Barlow, J.; França, F.; Gardner, T.A.; Hicks, C.C.; Lennox, G.D.; Berenguer, E.; Castello, L.; Economo, E.P.; Ferreira, J.; Guénard, B.; et al. The future of hyperdiverse tropical ecosystems. Nature 2018, 559, 517–526. [Google Scholar] [CrossRef]
- European Academies Science Advisory Council (EASAC). Forest Bioenergy, Carbon Capture and Storage, and Carbon Dioxide Removal: An Update. EASAC: Brussels, 2019. Available online: https://easac.eu/publications/details/forest-bioenergy-carbon-capture-and-storage-and-carbon-dioxide-removal-an-update/ (accessed on 1 June 2020).
- Fargione, J.; Bassett, S.; Boucher, T.; Bridgham, S.; Conant, R.; Cook-Patton, S.; Ellis, P.; Falucci, A.; Fourqurean, J.W.; Gopalakrishna, T.; et al. Natural climate solutions for the United States. Sci. Adv. 2018, 4, eaat1869. [Google Scholar] [CrossRef] [PubMed] [Green Version]
- Schneider, A.; Hinton, J.; Collste, D.; Sonetti González, T.; Cortes-Calderon, S.V.; Dutra Aguiar, A.P. Can transnational corporations leverage systemic change towards a ‘sustainable’ future? Nat. Ecol. Evol. 2020, 4, 491–492. [Google Scholar] [CrossRef] [PubMed]
- Etzion, D. Corporate engagement with the natural environment. Nat. Ecol. Evol. 2020, 4, 493. [Google Scholar] [CrossRef] [Green Version]
- Coady, D.; Parry, I.; Shang, B. How large are global fossil fuel subsidies? World Dev. 2017, 91, 11–27. [Google Scholar] [CrossRef]
- Coady, D.; Parry, I.; Le, N.-P.; Shang, B. Global Fossil Fuel Subsidies Remain Large: An Update Based on Country-Level Estimates; IMF Working Paper WP/19/89; International Monetary Fund: Washington, DC, USA, 2019. [Google Scholar]
- Österblom, H.; Joffray, J.-B.; Folke, C.; Rockström, J. Emergence of a global science-business initiative for ocean stewardship. Proc. Natl. Acad. Sci. USA 2017, 114, 9038–9043. [Google Scholar] [CrossRef] [Green Version]
- Lubchenco, J.; Cerny-Chipman, E.B.; Reimer, J.N.; Levin, S.A. The right incentives enable ocean sustainability successes and provide hope for the future. Proc. Natl Acad. Sci. USA 2016, 113, 14507–14514. [Google Scholar] [CrossRef] [Green Version]
- Pott, S.G.; Imperatriz-Fonseca, V.; Ngo, H.T.; Aizen, M.A.; Biesmeijer, J.C.; Breeze, T.D.; Dicks, L.V.; Garibaldi, L.A.; Hill, R.; Settle, J.; et al. Safeguarding pollinators and their values to human well-being. Nature 2016, 540, 220–229. [Google Scholar] [CrossRef]
- Scarpato, D.; Civero, G.; Rusciano, V.; Risitano, M. Sustainable strategies and corporate social responsibility in the Italian fisheries companies. Corp. Soc. Responsib. Environ. Manag. 2020, 27, 2983–2990. [Google Scholar] [CrossRef]
- Gatto, A. A pluralistic approach to economic and business sustainability: A critical meta-synthesis of foundations, metrics, and evidence of human and local development. Corp. Soc. Responsib. Environ. Manag. 2020. [Google Scholar] [CrossRef]
- Barbier, E.B.; Burgess, J.C. Innovative Corporate Initiatives to Reduce Climate Risk: Lessons from East Asia. Sustainability 2018, 10, 13. [Google Scholar] [CrossRef] [Green Version]
Figure 1.
This four-quadrant figure shows the exploitation and price paths over time for the resource comprising the safe operating space. The upper right quadrant shows the price path for the resource which is rising over time. The upper left quadrant shows the resource demand curve, with a choke price of k. The lower left quadrant shows the exploitation path of the resource stock. The lower right quadrant maps the time axes by a 45° line. The initial price is p0 at time t = 0, which rises over time to reach the choke price k at p(T), where the demand for the resource goes to zero. At this point, the accumulated extraction of the resource (the area within the exploitation path c(t)) is exactly equal to the total initial resource stock, S0. In this figure, we show a comparison of the exploitation of the safe operating space in competitive markets (solid lines) as opposed to a monopolistic market (dotted lines).


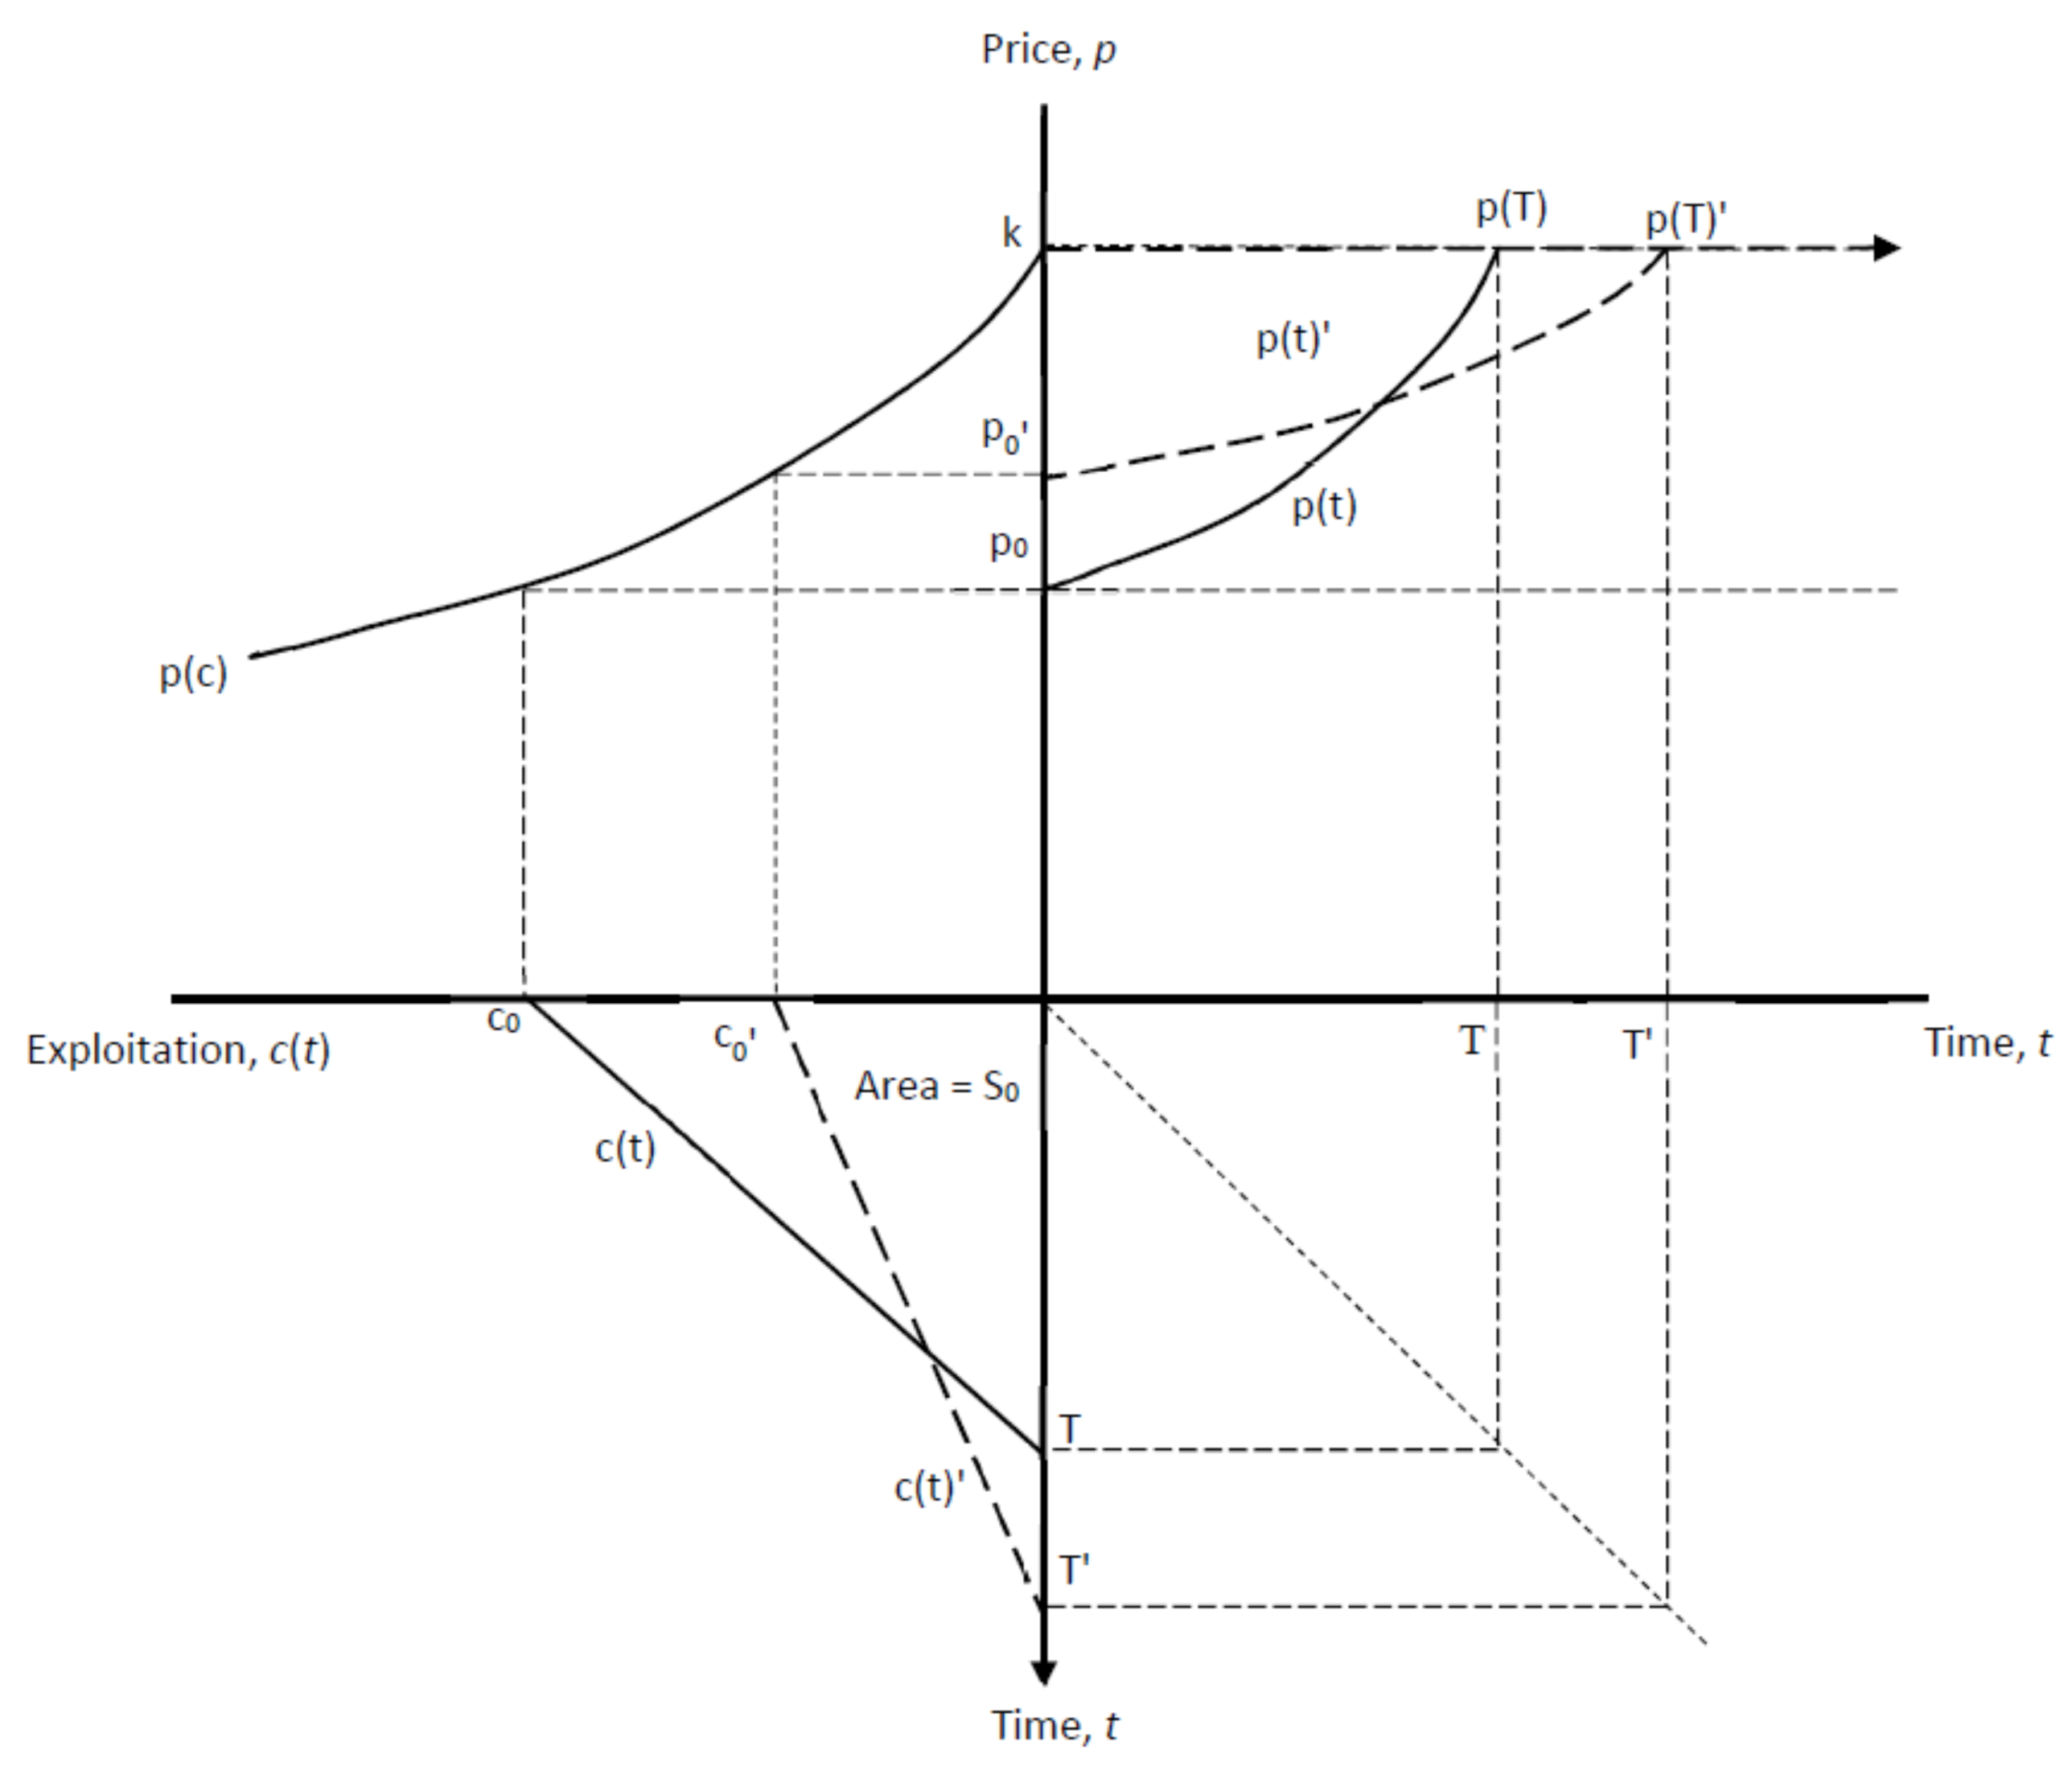
Table 1.
Market concentration in key economic sectors exploiting the global environment.
| Sector | Global Market Concentration |
|---|---|
| Agricultural commodities | Five companies account for 90% of palm oil trade, three companies control 60% of cocoa grindings, eight companies control 54% of soybean exports or processing, three companies account for 42% of banana exports, and ten companies process 42% of coffee. |
| Agrochemicals | Four companies control 84% of the pesticides market and 10 companies account for 56% of the fertilizers market. |
| Animal pharmaceuticals | Ten firms account for 83% of the market. |
| Commercial seeds | Three companies control 60% of the market. |
| Mining | Five companies produce 91% of platinum, 88% of palladium and 62% of cobalt. Ten companies produce 64% of nickel, 52% of iron, 50% of copper, 45% of zinc, 34% of silver and 30% of gold. |
| Fossil fuels | Ten companies control 72% of proved oil reserves and 51% of proved natural gas reserves. |
| Cement | Ten companies produce over 30% of the world’s cement. |
| Forestry | Ten companies produce 25% of paper and board. |
| Seafood | Thirteen companies catch 11–16% of marine harvest and 19–40% of commercially valuable marine stocks. Five companies are responsible for 48% of farmed Atlantic salmon. |
Source: Adapted from [20], Tables 1 and 2.
Publisher’s Note: MDPI stays neutral with regard to jurisdictional claims in published maps and institutional affiliations. |
© 2021 by the authors. Licensee MDPI, Basel, Switzerland. This article is an open access article distributed under the terms and conditions of the Creative Commons Attribution (CC BY) license (http://creativecommons.org/licenses/by/4.0/).
Share and Cite
MDPI and ACS Style
Barbier, E.B.; Burgess, J.C. Sustainable Use of the Environment, Planetary Boundaries and Market Power. Sustainability 2021, 13, 949. https://0-doi-org.brum.beds.ac.uk/10.3390/su13020949
AMA Style
Barbier EB, Burgess JC. Sustainable Use of the Environment, Planetary Boundaries and Market Power. Sustainability. 2021; 13(2):949. https://0-doi-org.brum.beds.ac.uk/10.3390/su13020949
Chicago/Turabian StyleBarbier, Edward B., and Joanne C. Burgess. 2021. "Sustainable Use of the Environment, Planetary Boundaries and Market Power" Sustainability 13, no. 2: 949. https://0-doi-org.brum.beds.ac.uk/10.3390/su13020949
Note that from the first issue of 2016, this journal uses article numbers instead of page numbers. See further details here.