Comparative Evaluation of Sustainable Framework in STEM Intensive Programs for Secondary and Tertiary Education


Faculty of Industrial Engineering and Robotics, University POLITEHNICA of Bucharest, 060042 Bucharest, Romania
*
Author to whom correspondence should be addressed.
Sustainability 2021, 13(2), 978; https://0-doi-org.brum.beds.ac.uk/10.3390/su13020978
Submission received: 25 November 2020
/
Revised: 26 December 2020
/
Accepted: 15 January 2021
/
Published: 19 January 2021
(This article belongs to the Section Sustainable Education and Approaches)
Abstract
:Sustainability of learning environments is a key pillar of all societal development frameworks. A variety of research address the development of education as a fine balanced relation between flexibility, adaptability, innovation, and efficient resource allocation. The main limitation of current approaches is the lack of correlation between various efficiency analyses and budget expenditure of learning environments. The current research aims at undertaking a comparative evaluation of a sustainable framework in STEM intensive programs for secondary and tertiary education. This was done using several established methods like the Plan, Do, Check, Act cycle for the development main framework, the Analytic Hierarchy Process for efficiency evaluation and Value Analysis for budget expenditure allocations and improvement identification. The main framework is based on learning objectives defined in accordance with Blooms’ revised taxonomy and student feedback was collected through surveys and group feedback. The main results of the study show that the framework had overall efficiencies over the 80% threshold in both secondary and tertiary education, whilst some of the components scored under 65%, identifying immediate improvement features. Further research involves the transition to an online and mixed teaching environment, by adapting the content and framework structure with the aid of smart learning environments.
1. Introduction
Sustainable education development is on the current agenda of all major international organizations like the European Commission, OECD and UNESCO. This is mainly due to the fact that a future sustainable society is reliant on the development and implementation of a sustainable education system. Additionally, The United Nations Education Scientific and Cultural Organization [1] is the main promoter of the Education for Sustainable Development (ESD) and the Global Action Program (GAP), investing in the development of new skills, values, and attitudes with the aim of creating a sustainable future in education.
Sustainable education development is often referred to as Sustainability Education or Education for Sustainable Development (ESD). UNESCO gives a comprehensive definition, stating that “ESD allows every human being to acquire the knowledge, skills, attitudes and values necessary to shape a sustainable future. ESD empowers learners to take informed decisions and responsible actions for environmental integrity, economic viability and a just society, for present and future generations, while respecting cultural diversity” [1]. In this context, it is important to evaluate the societal and economic impact of current educational frameworks and propose educational shifts that could lead to reliable ESD systems. Worldwide, there are several initiatives which address these impending issues, with additional requirements coming from the current SARS-CoV-2 epidemic, which is impacting education systems at an unprecedented level and with yet unknown outcomes [2].
The Organization for Economic Co-operation and Development (OECD) offers a variety of changes in principles for future education systems under the aegis of the Learning Framework 2030 [3]. OECD identifies the individual and collective well-being as a need for broader education goals, within the context of three main complex challenges: environmental, economic and social. Based on the OECD Key Competencies [4], the current framework further identifies a set of transformative competences, thus addressing the need for young people to be innovative, responsible and aware. A reliable ESD approach should consider these principles, whilst adapting the content and methods to area specific requirements, such as: cultural differences, economic development levels, diversity of attitudes and values, and last, but not least, availability of content specific resources.
According to the European Commission [5] department of Education and Training there are two main headline targets for 2020 in education and training, namely: lowering the percentage of early leavers from education and training under 10%; and increasing the percentage on tertiary educational attainment over 40%. The two targets are strictly linked, amongst others, to the level of work experience exposure of students during their studies. Early leaving from education and training between at an overall level across the EU, decreased from 13.4 in 2011 to 10.6 in 2017. The report shows that Romania (18.1%) is at the high end of the rate spectrum, and well over the EU 2020 target (10%) with no significant change over the years. Exposure to work experience between European countries vary from over 90% in Hungary, Netherlands, or Finland, to almost 10% in Romania, where students acquired verry little to no practical work experience during their studies. In an attempt to alleviate this issue, several national initiatives have been implemented [6,7]. These national initiatives have shown that there is a direct connection between the lack of work experience exposure of students and high early dropout rates, mainly due to employers’ request of previous work experience when hiring. A lack of work experience exposure in the curricula throughout tertiary education, reduces graduates’ chances to be hired within their major fields. This often leads to early drop out to ensure the work experience that employers require, but in less qualified fields. Competences and skills acquired through work experience are completely overlooked if a curriculum does not include such targeted designed modules, often leading to graduates not properly being qualified and experiencing difficulties in labor market integration. EDS should address this shortcoming in particular in order to provide a pathway for sustainable societal, economic and environmental development.
Moreover, education expenditure across EU is divided in four main categories such as, compensation of employees, intermediate consumption, other and gross capital formation. The main budget item in all countries is ‘compensation of employees’, with an average of 60% of the budget across EU [5]. Although, spending figures per se cannot be linked to good or bad performance of the education system, policymakers struggle to identify relevant indicators to orient their spending decisions towards policy choices that will improve the education system’s performance.
Considering the positive approach of the global climate on sustainable development of education, the current research analyses the development and implementation of a sustainable framework in STEM intensive programs for secondary and tertiary education, with emphasis on efficiency and value analysis. Effective teaching is considered a key component for the sustainable development of education systems [8]. Within this context, the proposed framework targets the alleviation of the main identified issues by developing blended learning modules with a high degree of practical activities, thus simulating on a small scale, the real activity that students carry out in an enterprise. Additionally, the framework is student centered and targets participants with high risks of early drop out. Although effectiveness and efficiency evaluation of educational systems are complex activities, which also rely on equity considerations, several studies and reports have addressed these topics.
Valderrama-Hernandez et al. [9] propose a comprehensive method of effectiveness analysis of Education for Sustainable Development within a higher education setting, linking learning objectives with curriculum development and acquired topic specific competences. The model is based on a four-point Likert survey and a sustainability presence map, whilst using Shapiro-Wilk Normality tests and Mann-Whitney U tests to evaluate the normal distribution and significant differences. Results showed the correlation between an objective oriented curriculum and acquired sustainability competences. Although inclusive, this method is limited to a tertiary education environment and cannot offer reproducibility criteria outside the studied environment. Moreover, their findings suggest that current learning frameworks do not show any significant improvement in student learning and selected subjects are failing to reach their ESD learning objectives.
Within the current research, learning objectives are constructed based on Bloom’s revised taxonomy [10,11], for both secondary and tertiary STEM intensive programs. Bloom’s revised taxonomy was chosen due to the potential gains in structuring curriculum described in his work by Irvine [12]. Due to the simplicity of application, the method is highly appropriate and recommended by a plethora of researchers in both secondary and tertiary curriculum development.
Lysenko et al. [13] analyze innovations, business, education development and competitiveness, as indicators of the effectiveness of regional innovation clusters in the higher education system. The research team has established a close relationship between the level of development of regional innovation clusters, indicators of business and innovations development, and the level of competitiveness, with direct impact on the development of higher education system (HEI). An important implication of their study is that in order to be sustainable, learning frameworks need to address real needs within the regional economical environment of the area in which the learning frameworks are implemented. Limitations of the study relate to a lack of curriculum specific criteria, which could greatly influence the outcome of the study depending on the region specifics. Additionally, there is no clear correlation between expenditure on HEIs and the proposed effectiveness indicators. This aspect is of particular importance when analyzing the efficiency of STEM education programs, which are known to be more resource intensive, compared to other educational programs [14].
STEM education addresses all levels of education, from elementary to tertiary, integrating content into a cohesive learning paradigm based on real-world applications. What separates STEM from the traditional science and math education is the blended learning environment and showing students how the scientific method can be applied to everyday life. STEM pillars are in accordance with the EC development strategy for 2020. Sustainable STEM education integrates STEM fields of knowledge and experience with social and emotional learning and civic engagement, by promoting inquiry-based learning and scientific thinking and practice and by encouraging interactive, learner-centered teaching that enables exploratory, action oriented, reflective, and transformative learning [15]. In this paper, the authors considered the secondary and tertiary STEM intensive programs as learning programs in which intensive courses (one/two-week programs) are taught focused on the development of practical skills in STEM fields. Within the current study, blended learning is used to define both the used multidisciplinary approaches and the blend of teaching techniques.
In a recent study, conducted by Christopoulos et al. [16] the research team explored the development of a learning analytics theoretical framework for STEM education for virtual reality applications, concluding on both the advantages and the limitations of their study. A key finding identified specific features which address the realistic needs of STEM students. Flexibility is promoted as a mandatory characteristic for successful curriculum development in STEM education. Lee et al. [17] analyses the implications of pedagogical flexibility in curriculum use and how their findings can promote mathematical flexibility in students. Based on these findings, authors developed a modular framework with interdisciplinary curriculum content, applicable to both secondary and tertiary learning environments. In this approach, flexibility can be expressed by either the curriculum developer, to cover specific needs of the target group, but also by the program participants who can chose modular alternative learning routs, depending on their personal preferences.
Furthermore, Roblyer [18] identifies three basic types of curriculum design, namely: subject-centered, learner-centered, and problem-centered design. Higher education curriculum development is typically based on subject-centered approaches, which focuses on a particular subject or discipline, the model being less concerned with individual learning styles compared to other forms of curriculum design. One major drawback of this approach is that students who are not responsive to this model tend to fall behind, because of decreased levels of engagement and motivation [19]. Thus, another key feature which was considered in the development of the STEM framework was the learning styles, as defined by Gardner [20].
Considering the abovementioned, the main limitations of current approaches can be summarized: lack of correlation between various efficiency analyses and budget expenditure of learning environments; absence of an efficiency evaluation on an integrated curriculum approach, which considers multiple design variables; gap in STEM interdisciplinary approaches which consider work experience exposure in correlation with future integration of participants into the workforce market.
Based on the EC conclusion that “efficiency is usually referred to as the relation between the resources put into the production process and the output obtained” [5] the authors propose an efficiency evaluation method for the sustainable framework in STEM intensive programs for secondary and tertiary education. To correlate spending decisions and customer value of the framework, the current study deploys Value Analysis (VA), aiming at identification of targeted improvement areas. Value Analysis (VA) has been proven to be very efficient when measuring value creation within the design process, weather it is targeted at physical products [21] or at system processes.
The main objective of the study is to present the development and implementation of a sustainable framework for STEM intensive programs within secondary and tertiary education, based on four central dimensions, such as: efficiency, effectiveness, growth and control. It follows both the similarities and differences within the framework, between the two levels of education, in terms of pedagogical approach, content structure, learning objectives, learning styles, delivering formats, instructional strategies and assessment methods. The framework addresses the limitations of current initiatives, while providing a comprehensive comparison between secondary and tertiary education.
2. Materials and Methods
The current study proposes the development and implementation of a sustainable framework for two STEM intensive programs within secondary and tertiary education.
The two intensive programs are currently being implemented at University POLITEHNICA of Bucharest (UPB) through external funding grants, awarded for three years, each. Both projects are currently in their second year of implementation. The funding grant calls targeted specifically students and pupils with learning difficulties and from disadvantaged areas, focusing on closing the gap between Romania and other EU countries on the percentage of early leavers from education and training, and the percentage on tertiary educational attainment. Thus, the proposed sustainable framework in STEM intensive programs for secondary and tertiary education was designed to address specific learning environments. The two projects, MOTIV and TecHUB 4.0, are described further on.
MOTIV (Mobilization, Organization and Objectives for Future University Education–REASON for the future!) is a STEM focused project aimed at improving the results, access and participation of disadvantaged students from secondary level education, into the higher education system. With an overall target group of 350 national high school students, MOTIV implemented in July–August 2019 its’ first intensive STEM program with 100 eligible participants and 8 extra volunteer participants. The objective of the program was to orient the target group participants in terms of further study options in technical higher education, facilitating the transition from secondary to tertiary education, by providing an integrated package of STEM courses and other relevant activities. Designed as a two-week intensive program the curricula was constructed based on STEM topics integrated with career counselling, social and cultural activities. Seven modules constituted the core curricula components, namely: Mathematics, Physics, Informatics, Computer Aided Design (CAD), 3D Printing, Mechatronics and Robotics. Apart from the intensive program implemented in 2019, two more similar educational programs will be funded through the MOTIV project. The scope is to implement and test the structural and content related changes revealed during feedback.
TecHUB 4.0 (TecHnology and EntrepreneUrship Education–Bridging the Gap for Smart Product Development) is an Erasmus+ funded project which aims at promoting Additive Manufacturing (AM) entrepreneurship towards young students, who wish to design and develop smart products in an interactive environment, through the involvement of professors, industry specialists, researchers, managers and entrepreneurs. It is currently being implemented with one national partner and two international partners, as follows: “Lucian Blaga” University of Sibiu (ULBS) from Romania; Czestochowa University of Technology (PCz) from Poland; Lancaster University (LU) from the United Kingdom of Great Britain. Amongst other activities, TecHUB 4.0 targets the implementation of two intensive summer school programs, one of which was deployed in early July 2019. Designed as a one-week intensive STEM focused program the educational event had a target group of 100 national and international students and 4 additional volunteers. In both secondary and tertiary intensive educational programs, volunteers were considered active participants in the study and a part of the target groups. Apart from the level of knowledge, the main difference between the two programs was that TecHUB 4.0 promoted a multi-disciplinary approach to module delivery. Although the content of the modules included knowledge and development of competencies in mathematics, physics, informatics, 3D printing, CAD and mechatronics and robotics, the programs’ structure was built on the broader idea of teams developing a technical Start-up [19]. This was done considering that eligible participants were accepted from both bachelor and masters’ programs, thus their level of competences [19] entailed a more complex learning environment.
For both programs, gamification elements were used to implement all activities. A complex reward system was developed and used to deploy all activities, substituting the classic grading and scoring systems [22,23]. For the secondary education STEM intensive program, the content was gamified using several important elements, such as: guest, levels, achievements, reward system and time tracking. The reward system included badges, tokens, privileges, incentives, passes, virtual and physical goods [23]. The reward system was comprised of the following elements: financial incentives–scholarships; “survival kit”–incentives; level maps and activity plans; diplomas; individual and team trophies; public recognition; tokens and badges; privileges; passes for participation at social and recreational activities; competitive advantage at social and recreational activities based on Level and Achievement performance [23]. When designing the gamified learning content for the tertiary education STEM intensive program, a basic three-tiered framework [24] was considered: goal-focused activities, reward mechanisms and progress tracking. To address these, some of the most used elements in gamifications [25] were considered: credit points (CP), progress and ranking graphs and levels [22].
Infrastructure was made available by UPB within four of its’ faculties: Faculty of Industrial Engineering and Robotics (FIIR), Faculty of Applied Sciences (FSA), Faculty of Biotechnical Systems Engineering (FISB) and Faculty of Mechanical Engineering and Mechatronics (FIMM). Infrastructure requirements were similar for both programs due to their STEM focused curriculum and to maintain unity throughout the framework and entailed the usage of: four main technical laboratory rooms with work benches and storage areas for 30 participants at a time; one large learn and lounge space for both learning experiences and recreational activities; one amphitheater with 300 places for large group activities; 150 personal computers; 6 video projectors (one in each room, one in the learn and lounge space and one in the amphitheater); 60 FDM and SLA 3D printers; 20 complex Arduino kits; 20 pre-programmed robots; topic specific instruments (e.g., vacuum chamber, calipers, electronic scale etc.) and software (for CAD; 3D printing; Programming; Web design etc.). Catering, accommodation, travel and adequate office supplies for all participants were funded through the two abovementioned projects.
Learning objectives (LO) were comprehensively defined, for both intensive programs, using Bloom’s revised taxonomy [10,11], considering a 3-tiered approach of each program: Methods and Structure, Professional Development, Overall Performance. Learning levels were considered throughout the development process. Learning objective structure was kept as clear and concise as possible by following these three steps: (1) Who will be able to perform a certain learning activity? (2) What is the activity to be performed? (verb + goal); (3) How and under what circumstances will the activity be performed? (conditional).
Instructional strategies, as defined by White and Braddy [26], were evaluated and selected to be used in the two STEM intensive programs, primarily due to the student-centered advantages that they bring. Step-by-step learning with innovative approaches, both guided and independent practice and tackling real-life situations using case studies, were mostly used in MOTIV educational program implementation. Due to the specificity of the target group and the content structure, TecHUB 4.0 instructional strategies aimed at the advantages brought by project-based learning, team-based and blended learning approaches. Most often, cooperative learning, interactive instruction, reciprocal teaching and group activities were used. The most appropriate instructional strategies were selected and particularized for each target group and module, allowing participants to display their skills, ideas and their existing knowledge on a particular subject. They were encouraged throughout the learning experience to self-monitor and assess their learning, regardless of their knowledge levels in different modules. Selection of the most appropriate instructional strategies was made via a pilot course implemented at UPB before the design of the sustainable framework. The pilot course was deployed in three sessions and targeted different modules of the curriculum content. Results were gathered using ongoing feedback collected by the trainer, as well as a survey completed at the end of each session of the pilot study by the participants. Participants were selected randomly amongst eligible UPB students. Results were processed by authors and brainstorming and nominal group technique were used to select the final instructional strategies, corelated with module content.
Pedagogical approaches often pass as elaborated instructional strategies [27]. Defined as the broadest structured environment for theory and practice of learning, pedagogical approaches assess how this process influences, and is influenced by, the social, political and psychological development of learners. In this context, six main pedagogical approaches were used during the implementation of both intensive programs: secondary–inquiry learning, differentiated instruction; experiential learning; tertiary–open-ended instruction, integrated learning, locus of control. Peer teaching, cooperative learning and case studies were used in both programs [28].
To accurately calculate efficiency of the implemented intensive programs, the authors proposed a quantitative approach, by designing 20 components (Section 3.2) which define the core characteristics of the programs. A targeted survey was constructed and deployed amongst all participants, in order to evaluate the overall performance of these 20 components. Individual efficiencies were calculated for each of the components and an importance coefficient was assigned by using the Analytic Hierarchy Process (AHP) tools [29]. Value analysis (VA) was undertaken [30] to establish the cost-value benefits of the two programs and identify which components need improvement in terms of either cost reduction or increase in added value [31].
Effectiveness of the programs was ensured by dividing the LO into tasks and making sure the trainers, speakers and tutors completed them by using written guides and progress charts for each discipline and module within both programs.
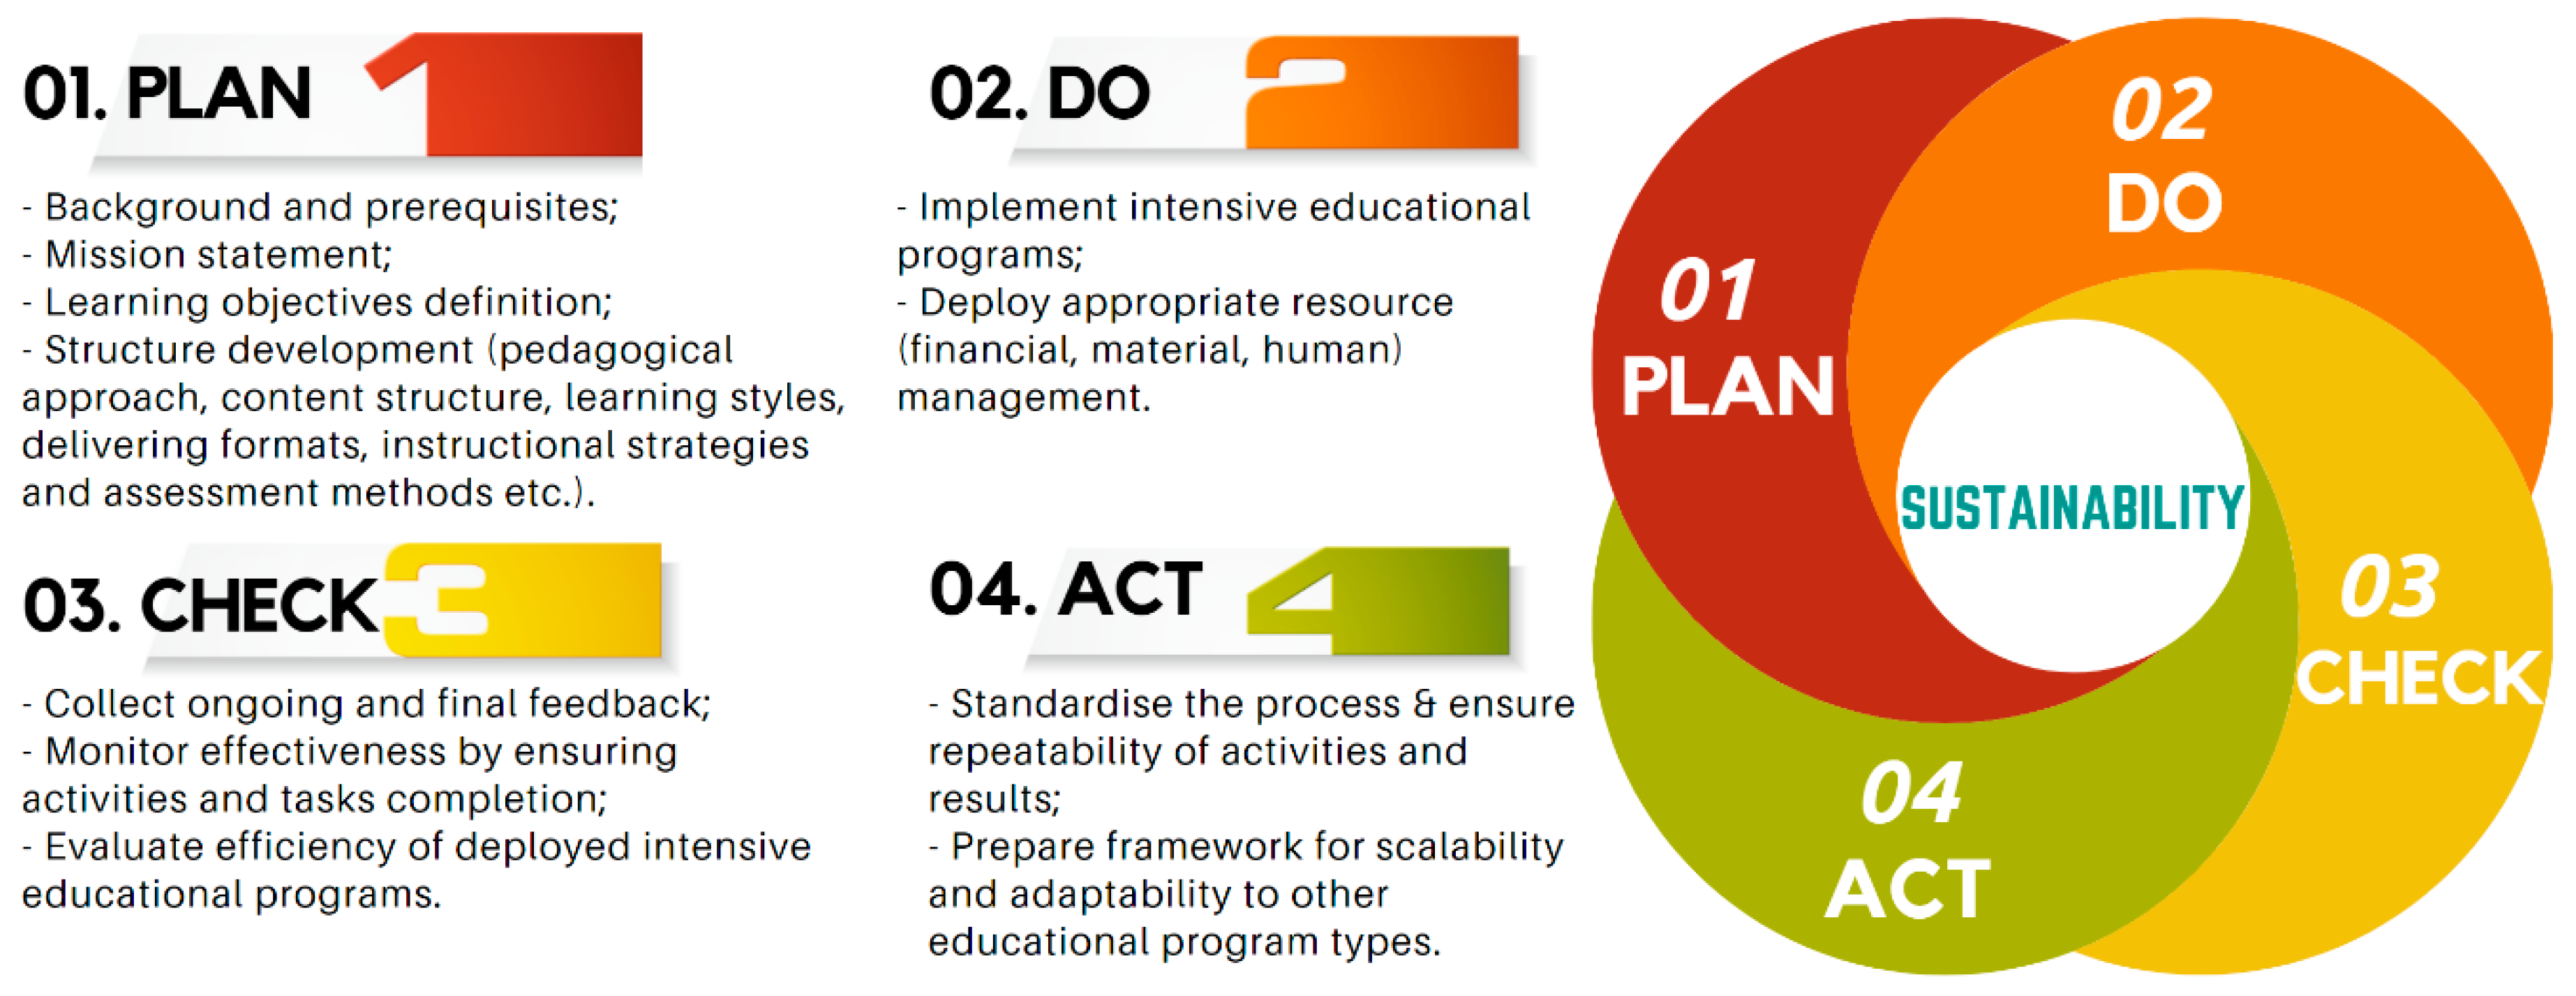
Control and growth were implemented through a multitude of complementary tools all throughout the third and the fourth stages of the proposed PDCA cycle (Figure 1). Control meant following highly standardized quality procedures imposed by national regulatory structures [32,33], as well as European guidelines [34]. Control also entailed the accurate planning and implementation of ongoing feedback tools and final student surveys. The main ongoing feedback tools were shared ideas and stories, questions, quizzes, polls, volunteers’ “suggestion box” and direct dialog. Generally, ongoing feedback was deployed for individual tasks and used to improve activities on the spot. Final feedback was deployed as a survey and targeted the efficiency calculations of all program components, enabling structural improvements for future programs.
Considering the abovementioned, the sustainable framework was designed based on four central dimensions, namely: efficiency, effectiveness, growth and control. This was achieved by integrating the four dimensions with a continuous development PDCA (Plan, Do, Check, Act) cycle (Figure 1).
3. Results
Design and implementation of such complex educational programs, which target highly rated results, came with several challenges.
Firstly, the developers of the programs aimed at designing more than a complex curriculum, but rather a highly efficient and rewarding learning experience for all participants involved. In this regard, the authors thoroughly analyzed the general objective of each learning module within the intensive program and proposed an extensive set of LO, aimed at ensuring high rates of content retention, amassment of positive learning experience, specific competence development and expression of student’s beliefs of self-awareness, worth and value within their own professional growth environment (Appendix A—Table A1, Table A2 and Table A3). LOs were defined based on Bloom’s revised taxonomy, in accordance with the procedure described in the previous section and considering the 3-tiered approach of each program, namely: Methods and Structure, Professional Development, Overall Performance.
Secondly, the designed framework was aimed at being flexible in terms of adaptability to other domains and subjects and in terms of repeatability of obtained results. This meant the usage of theoretical and scientifical approaches in all PDCA cycle phases. Thus, based on the LO and module structure of both programs, a correlation matrix (Table 1) has been developed between all structural learning environment elements, namely: learning objectives, content structure, pedagogical approach, learning styles, delivering formats, instructional strategies and assessment methods. To calculate the efficiency of the learning experiences based on the proposed matrix structure and validate the sustainability of the framework, authors used targeted surveys, AHP and VA.
Thirdly, resource management (financial, material, human) was an intensive and particularly demanding process, which required specialized personnel and software tools in order to be accurately deployed. Resource management was done two months prior to the start date of both programs and it took into consideration all aspects of the programs, without being stringent to the target group. For example, high school students had 24-h tutoring and monitoring, using a shift schedule for volunteer tutors. The activity was presented to students as a part of the rewarding system, each group of students earning through their learning activities certain access codes to a variety of activities performed together with their group tutor.
3.1. Structural Development of Intensive Programs
Structural development of the STEM intensive programs was based on an eleven-step process, as follows: (1) Set the background and the rationale of the program; (2) State a clear mission for the program in the context of the prior established background; (3) Design the story and identify how all activities are going to unfold; Put in place an appropriate reward system, corelated with the story of the program; (4) Identify the modules which need to be introduced in the story so as to fulfill the stated mission; (5) Establish the role of each module within the programs’ structure and amongst each other; (6) Design the learning objectives of each module using Bloom’s revised taxonomy; (7) Develop the learning content which will allow students to reach the set objectives; (8) Select the most appropriate pedagogical approaches and instructional strategies in relation to the content and LO’s; (9) Set learning style of each module or a mix of learning styles that will best ensure the accomplishment of the LO’s; (10) Establish the most appropriate delivering format or a mix of them; (11) Put in place formative and summative assessment methods.
Based on the abovementioned process, before the implementation stage begun, the authors engaged in a proper resource management process and risk analysis.
A comprehensive list of learning objectives was defined in correspondence with the general goals of the framework and with the content and structure of each intensive program. Bloom’s revised taxonomy [10,11] was the basis for learning objective structure. Learning objectives have been divided in two main categories, overall learning objectives (OLO) and content specific learning objectives. OLO are the same for both intensive programs, as they target the development of student competences in relation to the applied methods, content structure and overall learning framework performance (Appendix A—Table A1). Content specific learning objectives are defined and analyzed for each one of the two programs, as they address competences focused on learning modules, targeting specific knowledge areas and levels of improvement. For the secondary education program, a list of 31 content specific learning objectives (LOS) were defined and analyzed based on 7-module curricula (Appendix A—Table A2). The tertiary education program was implemented based on 24 content specific learning objectives (LOT), which were defined considering a 6-module curricula structure (Appendix A—Table A3). Due to the transdisciplinary characteristics of the tertiary modules, the content specific learning objectives have been defined in a non-hierarchical fashion, but rather in the order of the complementary activities within each module.
Based on the previous research conducted by the authors [6,7,19,20,35] and their professional experience, curriculum design considered the correlation of content module with the following: learning objective, pedagogic approach/instructional strategy, learning style, delivering format, assessment. The importance of considering the abovementioned elements when designing curriculum is also emphasized by results outlined by a variety of studies [3,17,36,37].
The proposed STEM framework focuses on blended learning, including learner-centered, and problem-centered design of curriculum content, thus, learning styles are of particular importance in these hypotheses. Furthermore, the design process of the framework appealed to eight learning styles based on psychologist Gardner’s [38] theory of multiple intelligences, namely: visual; verbal; logical; auditory; social; intrapersonal; physical and naturalistic [20]. For maximum learning efficiency, these learning styles were paired with learning objectives, delivery formats, instructional strategies/pedagogical approaches, assessment methods and module content.
Considering the abovementioned, a correlation matrix was put together to show the general designed structure of the intensive programs (Table 1). The matrix was constructed using brainstorming and nominal group technique (NGT), corelated with resource (human, material, financial) requirements and availability of UPB. The brainstorming and NGT sessions were moderated by the authors and ideas were prioritized into hierarchical solutions. The results of the sessions were correlated with the pilot course results obtained in a previous step. Additionally, recommendations from teachers and trainers who previously implemented standard STEM subjects were gathered using interview sessions, either face-to-face, either using various media devices. Answers were recorded on interview data sheets and duplicates were eliminated. Ideas were ranked with the most important receiving a rank of 5, and the least important receiving a rank of 1. These methods were overlapped in order to minimize the bias that could have been generated throughout the process.
If deployed together for a similar program, the proposed eleven-step process (Figure 1) and correlation matrix (Table 1) will ensure the repeatability of the learning experience, up to subjective reasoning and personal preference of individual participants. It is important to mention that the proposed matrix can be adapted to any STEM curriculum or any complementary learning subjects.
3.2. Efficiency Evaluation
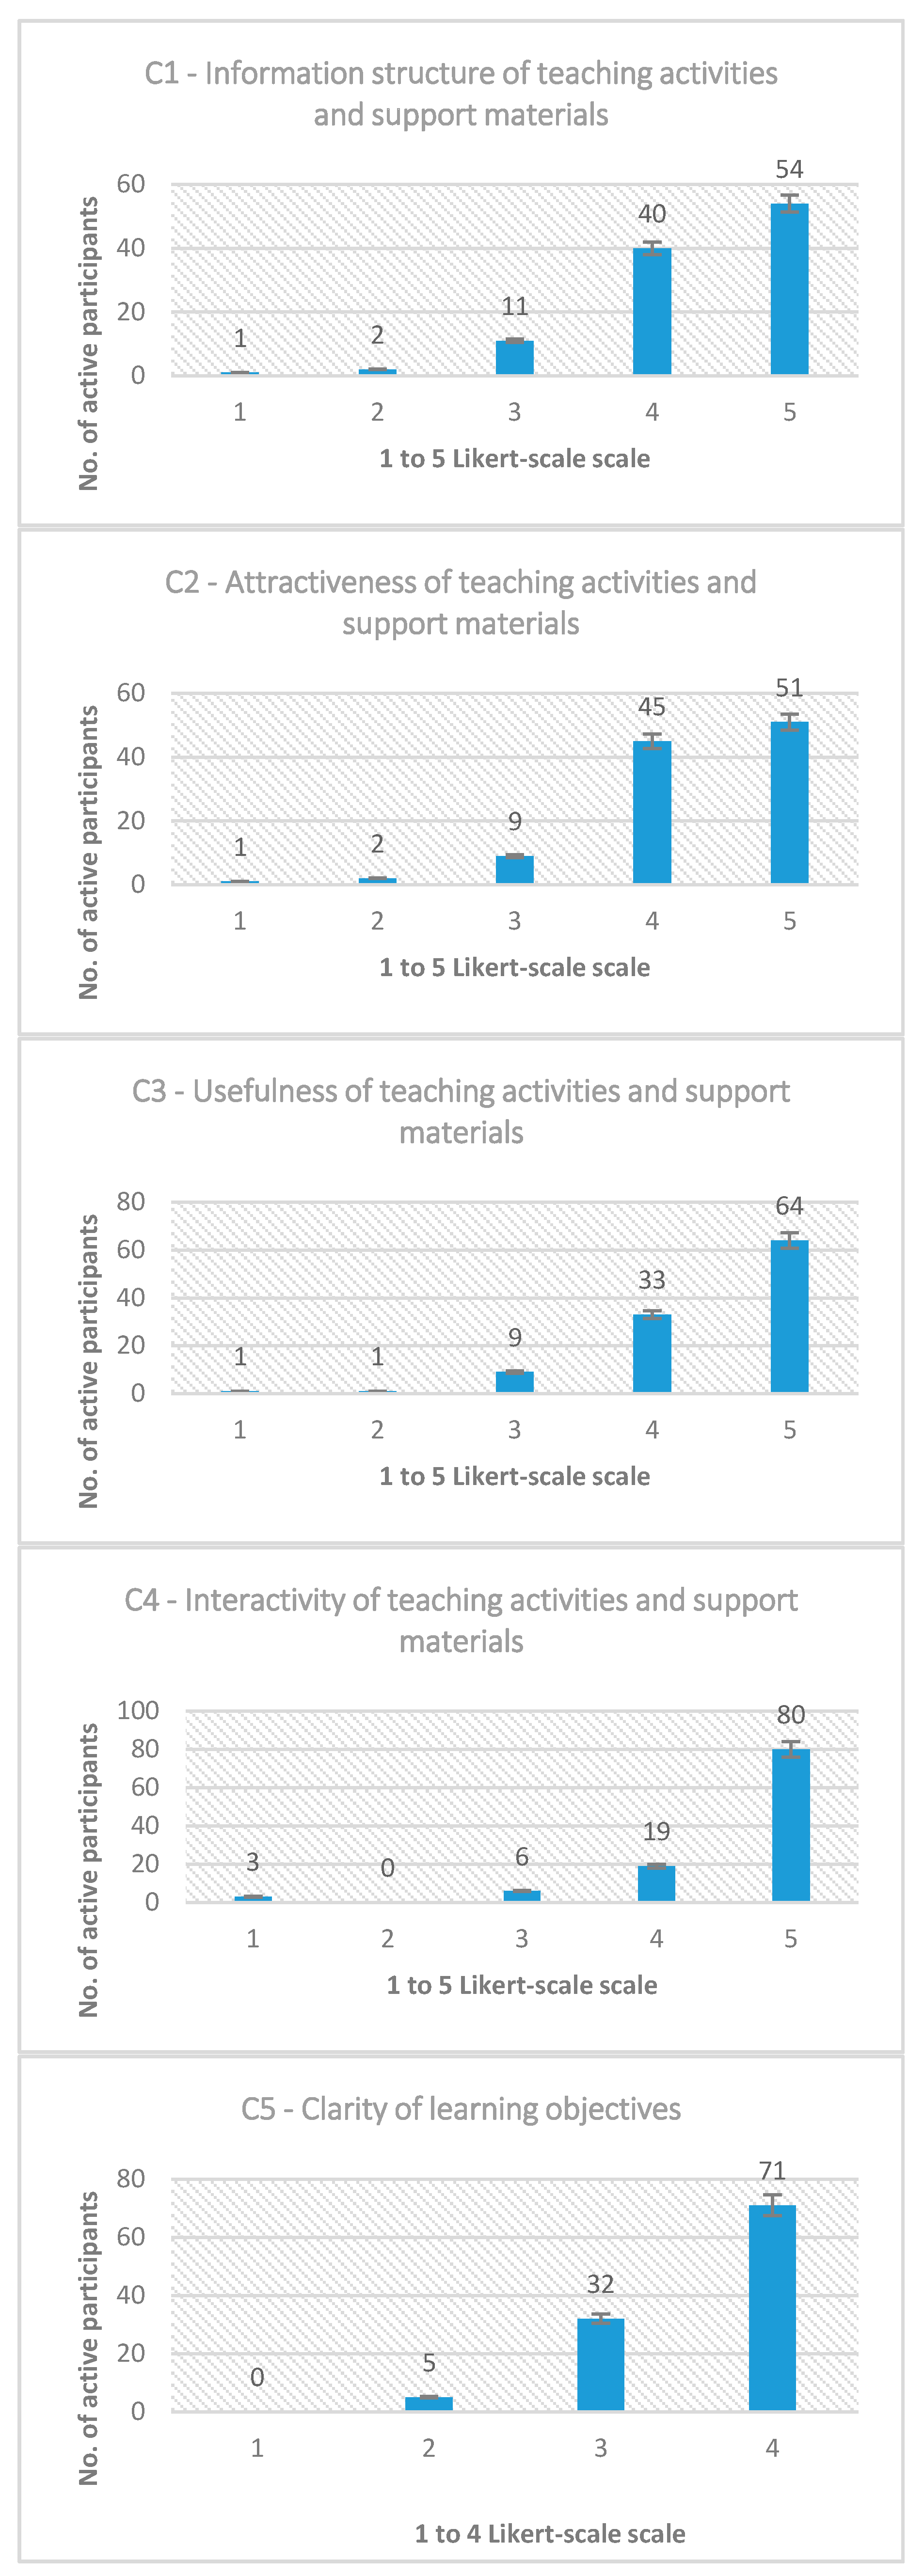
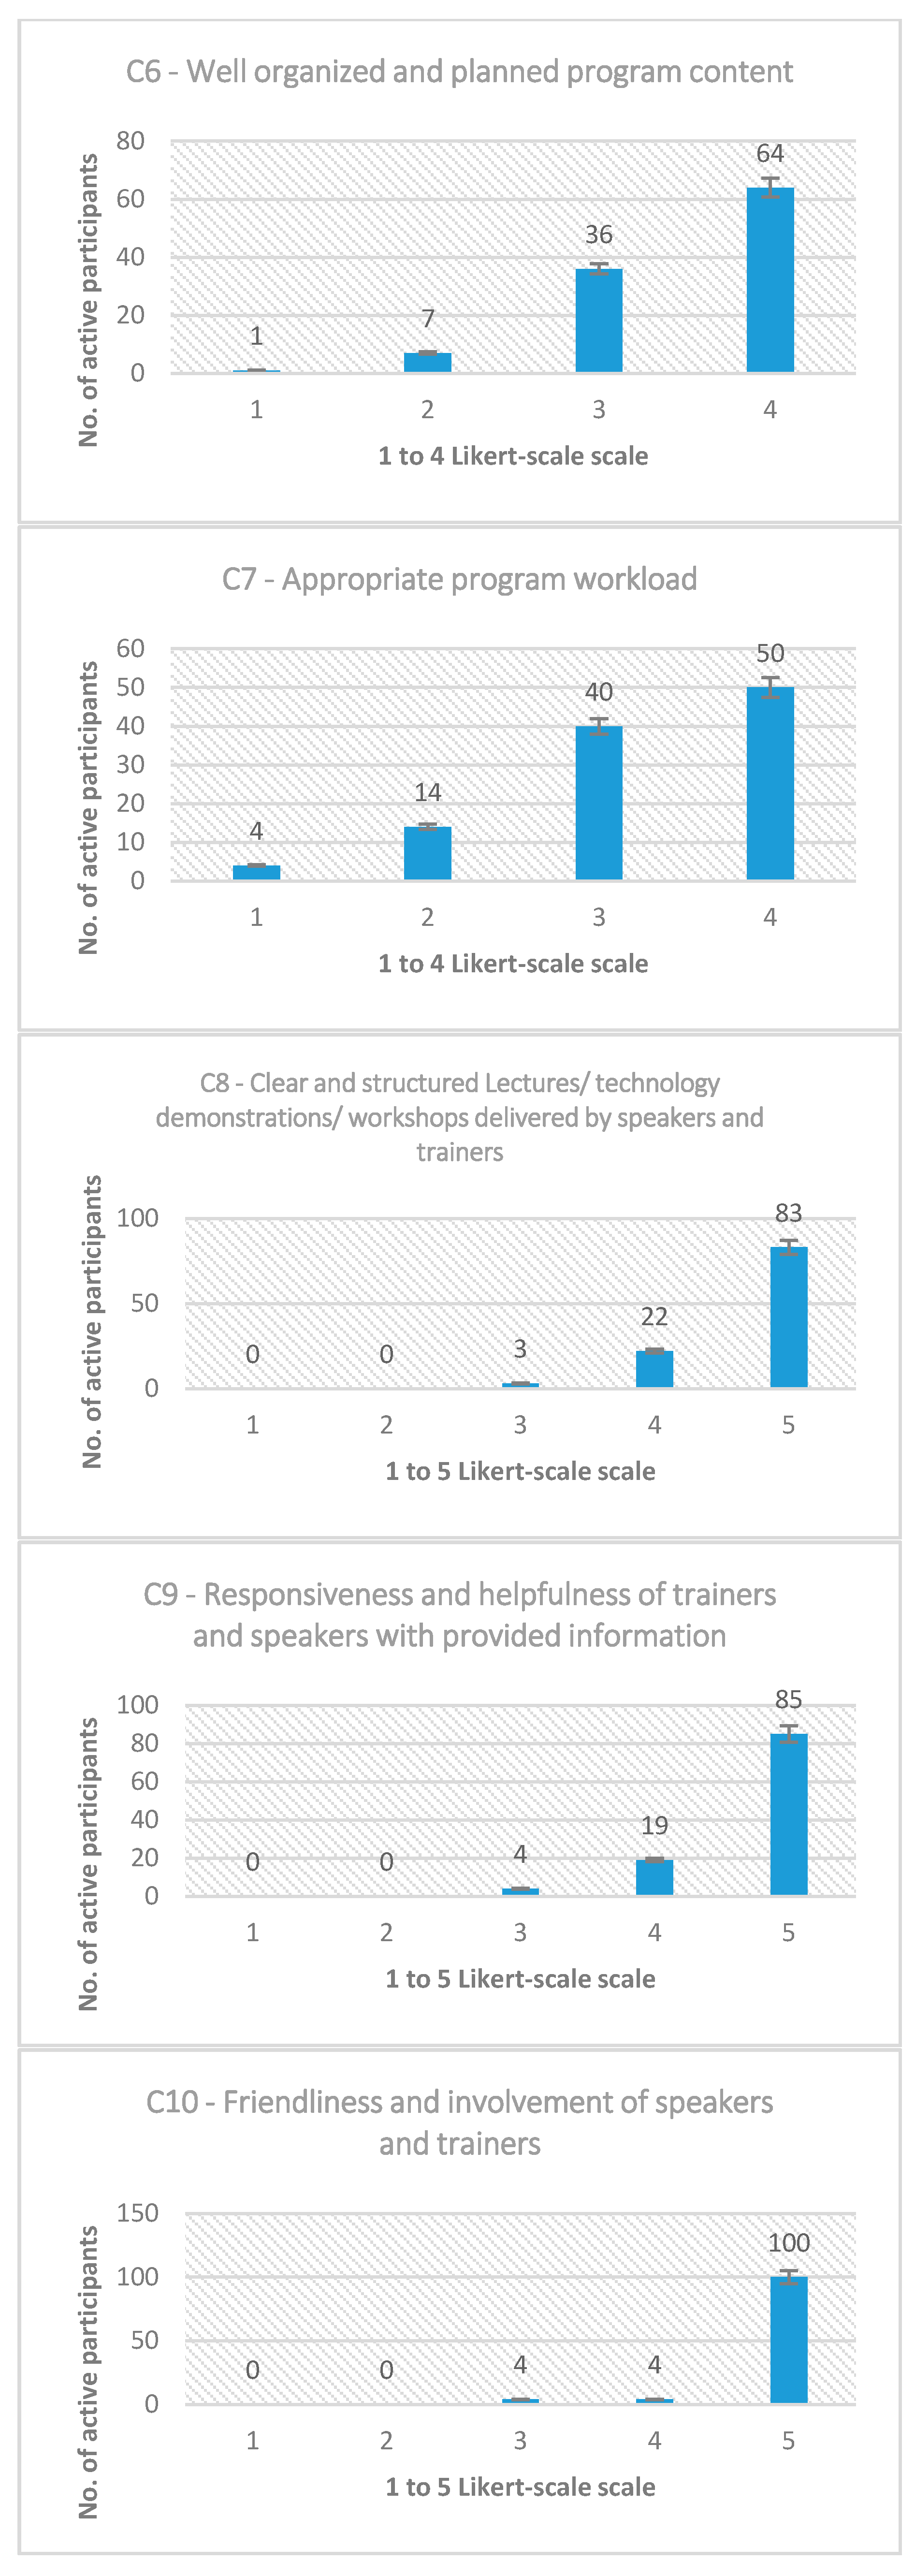
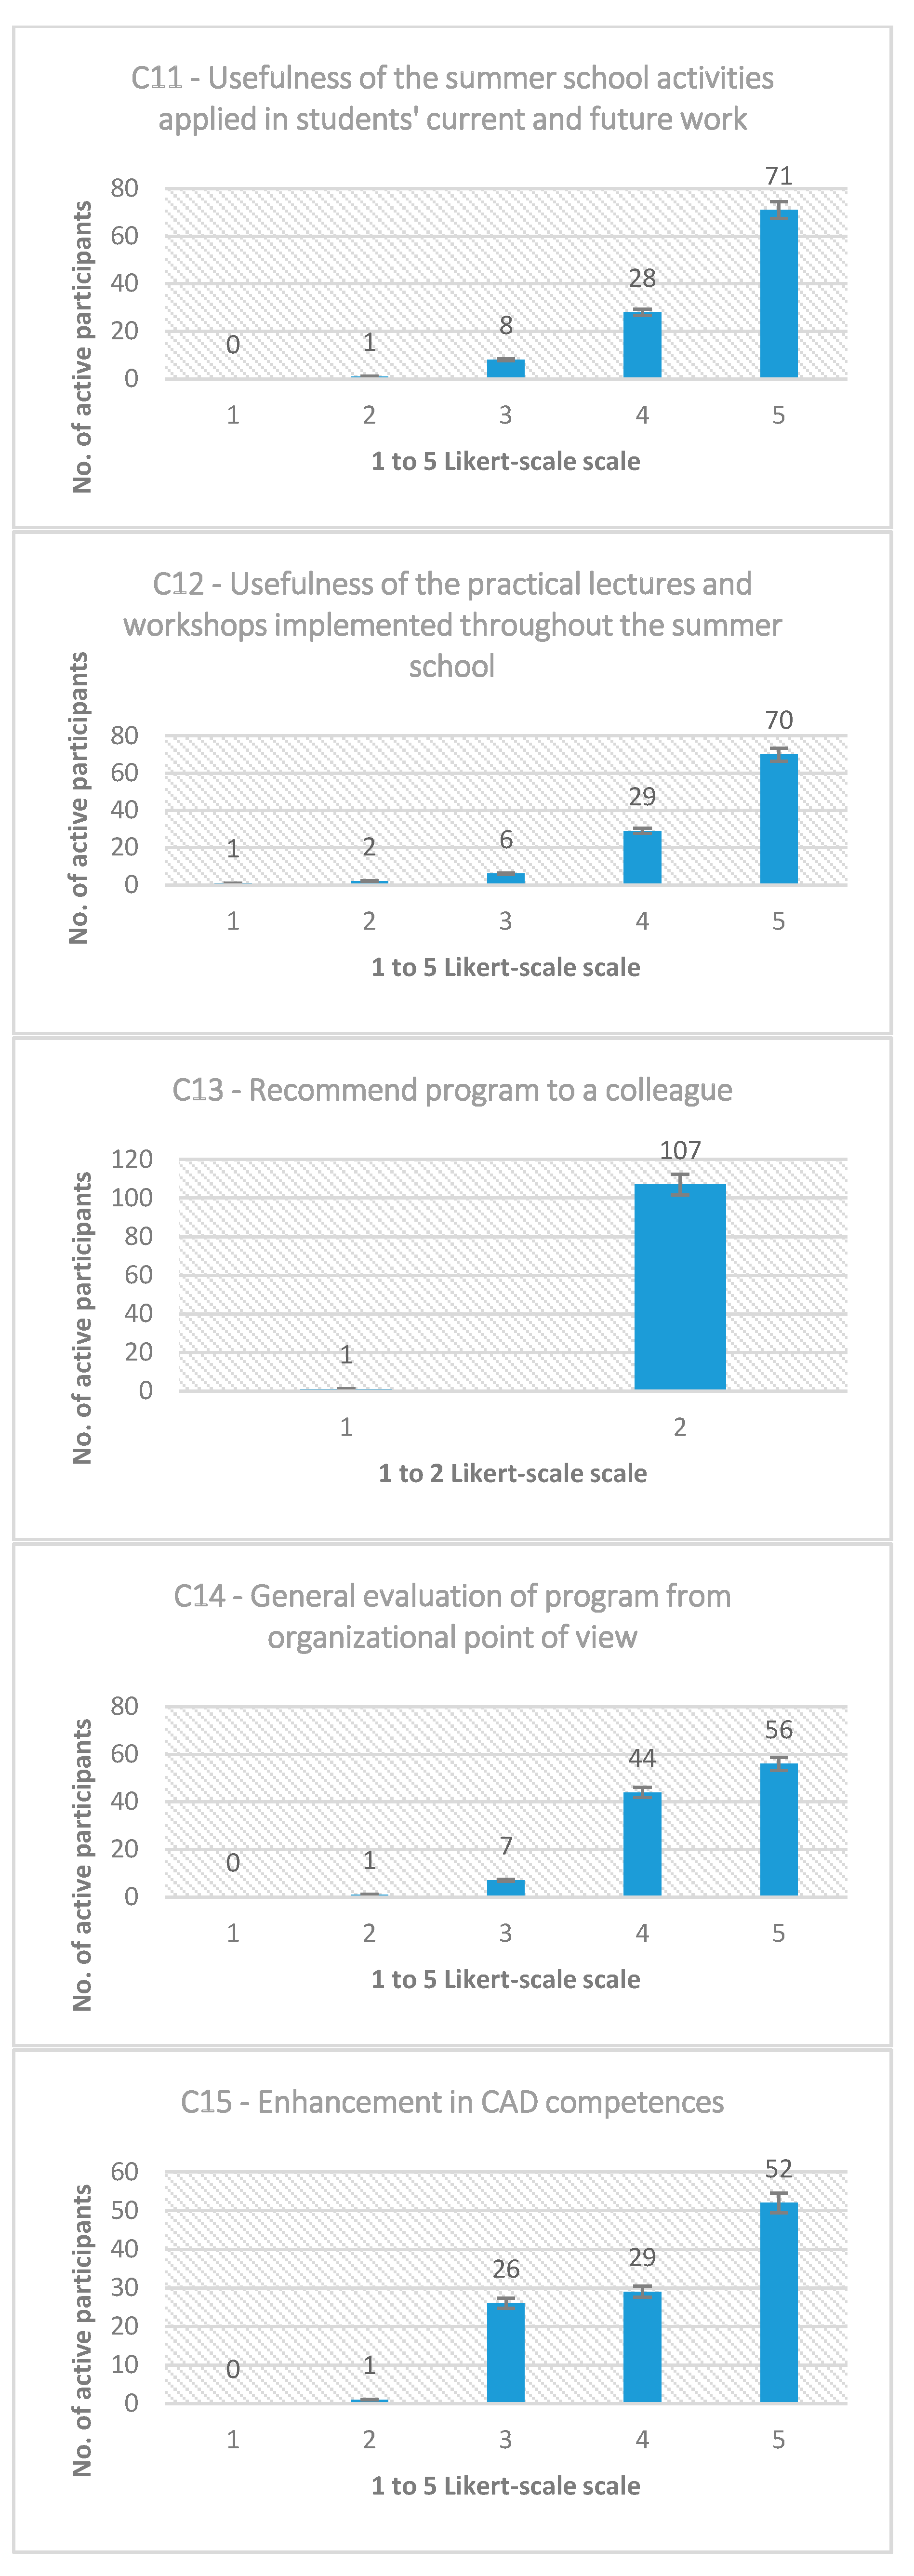
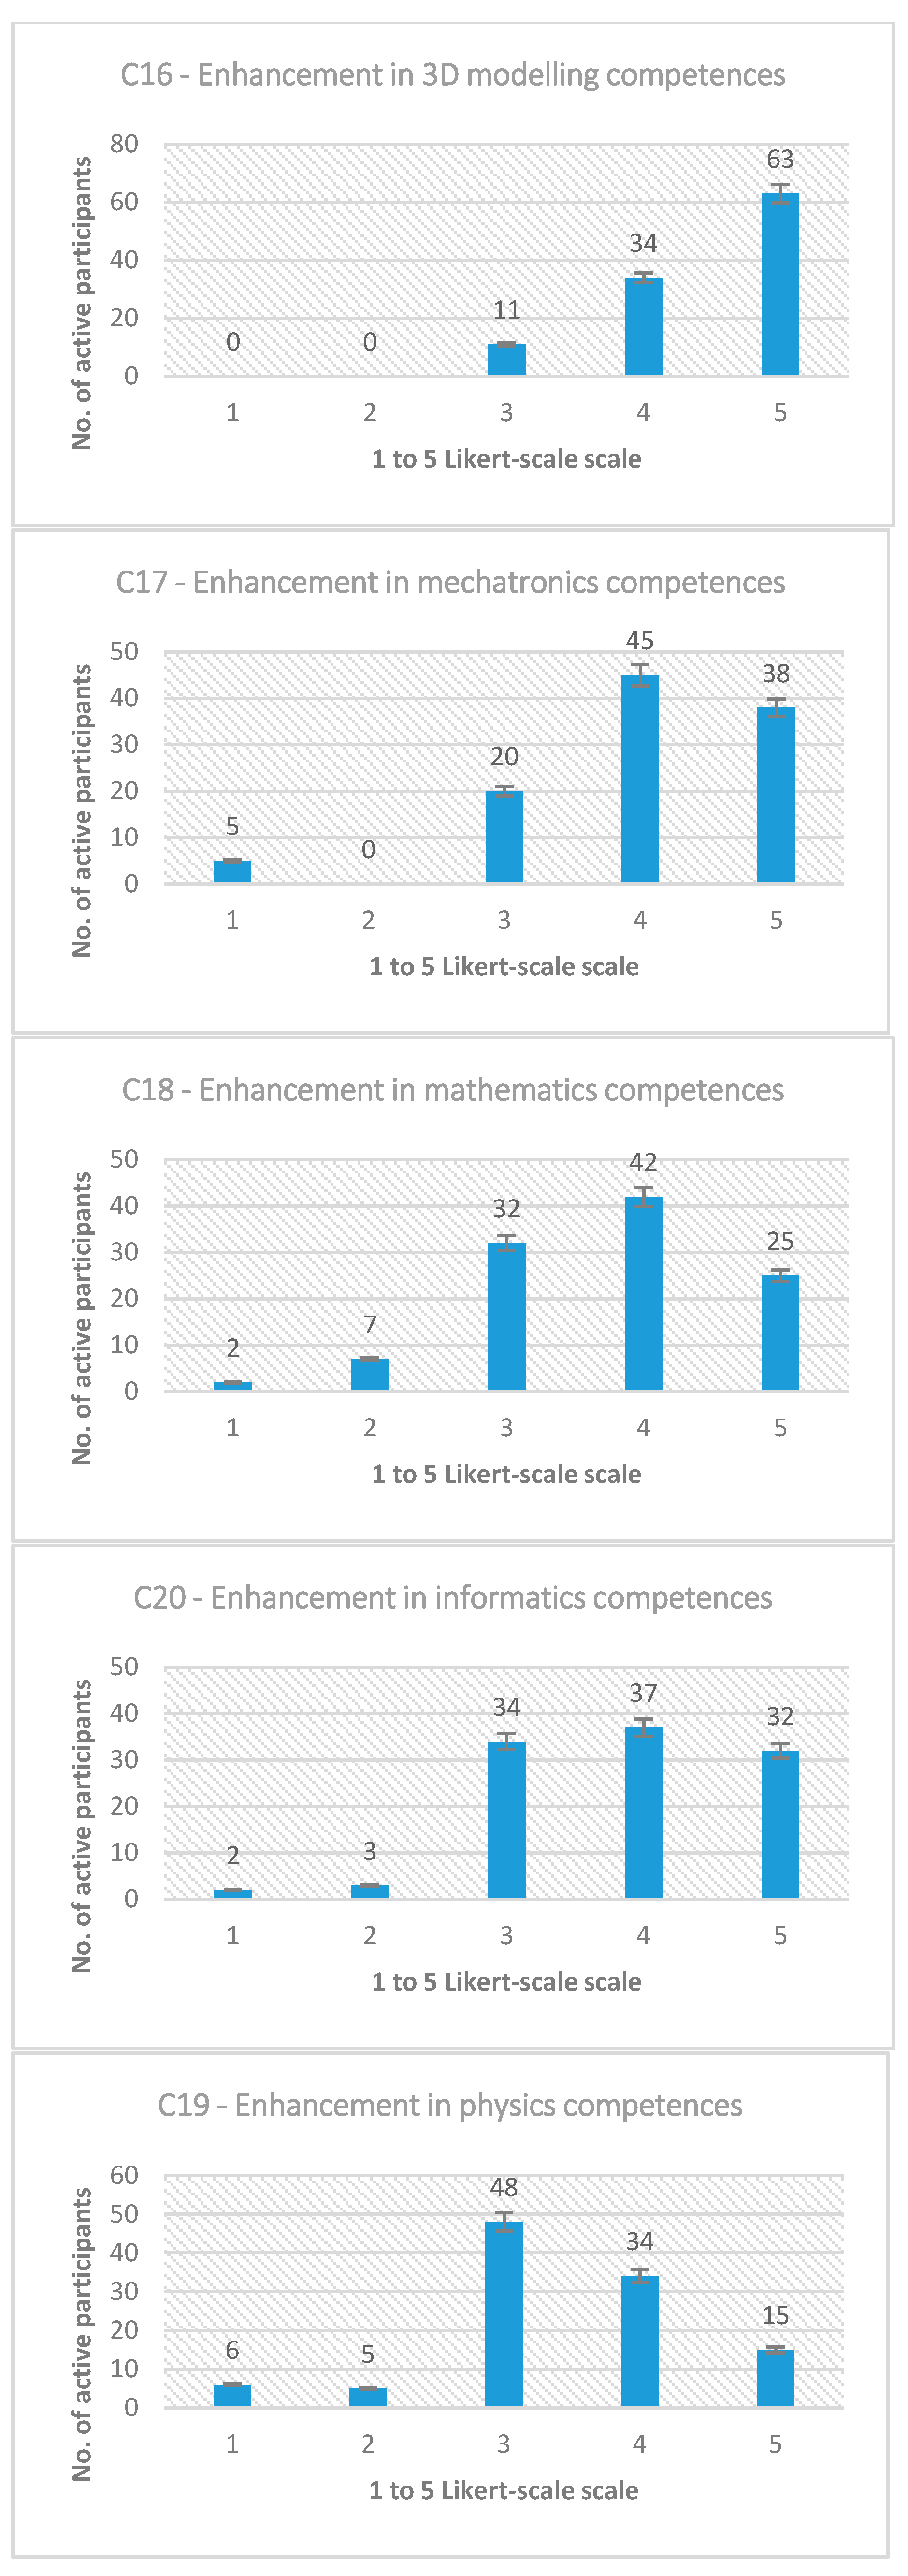
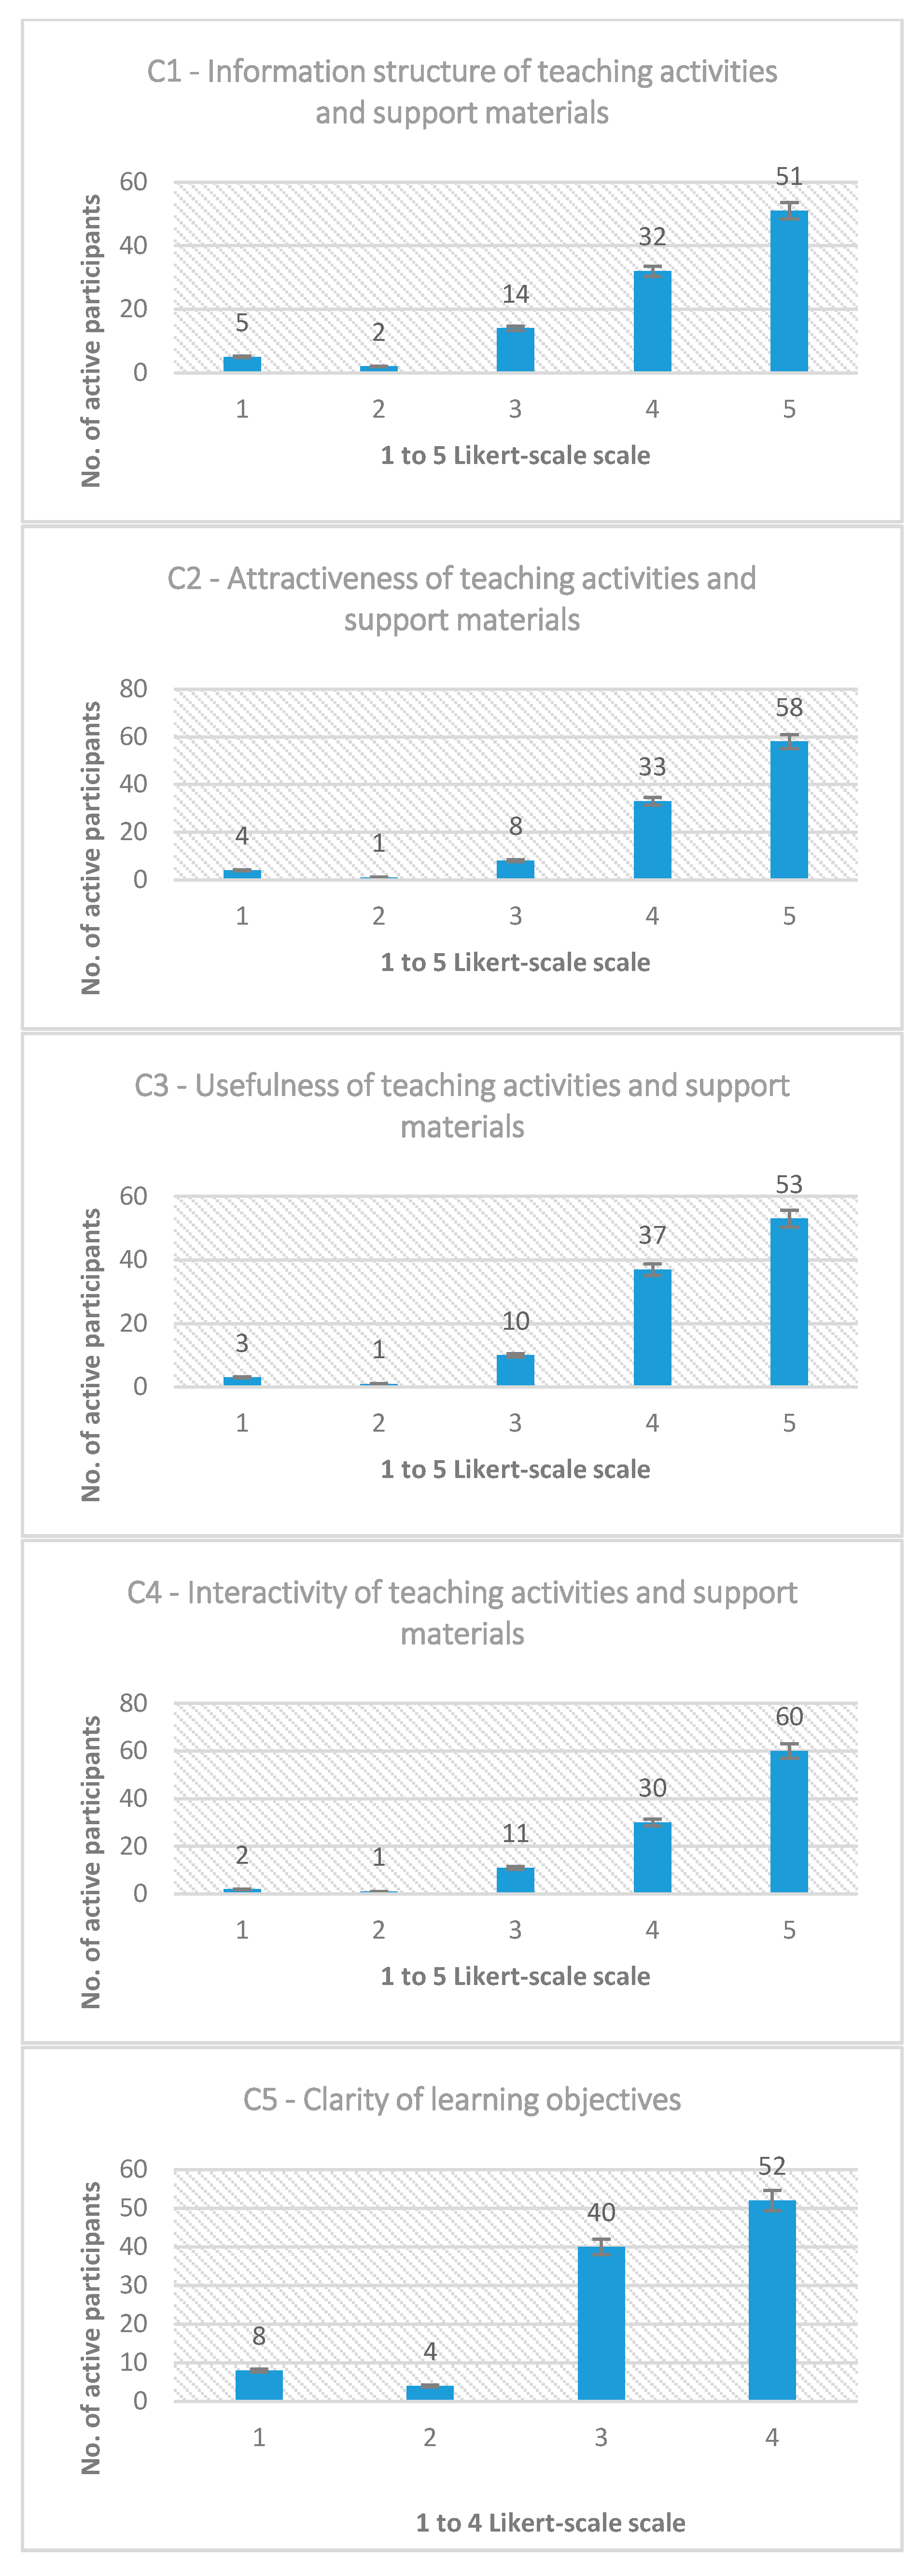
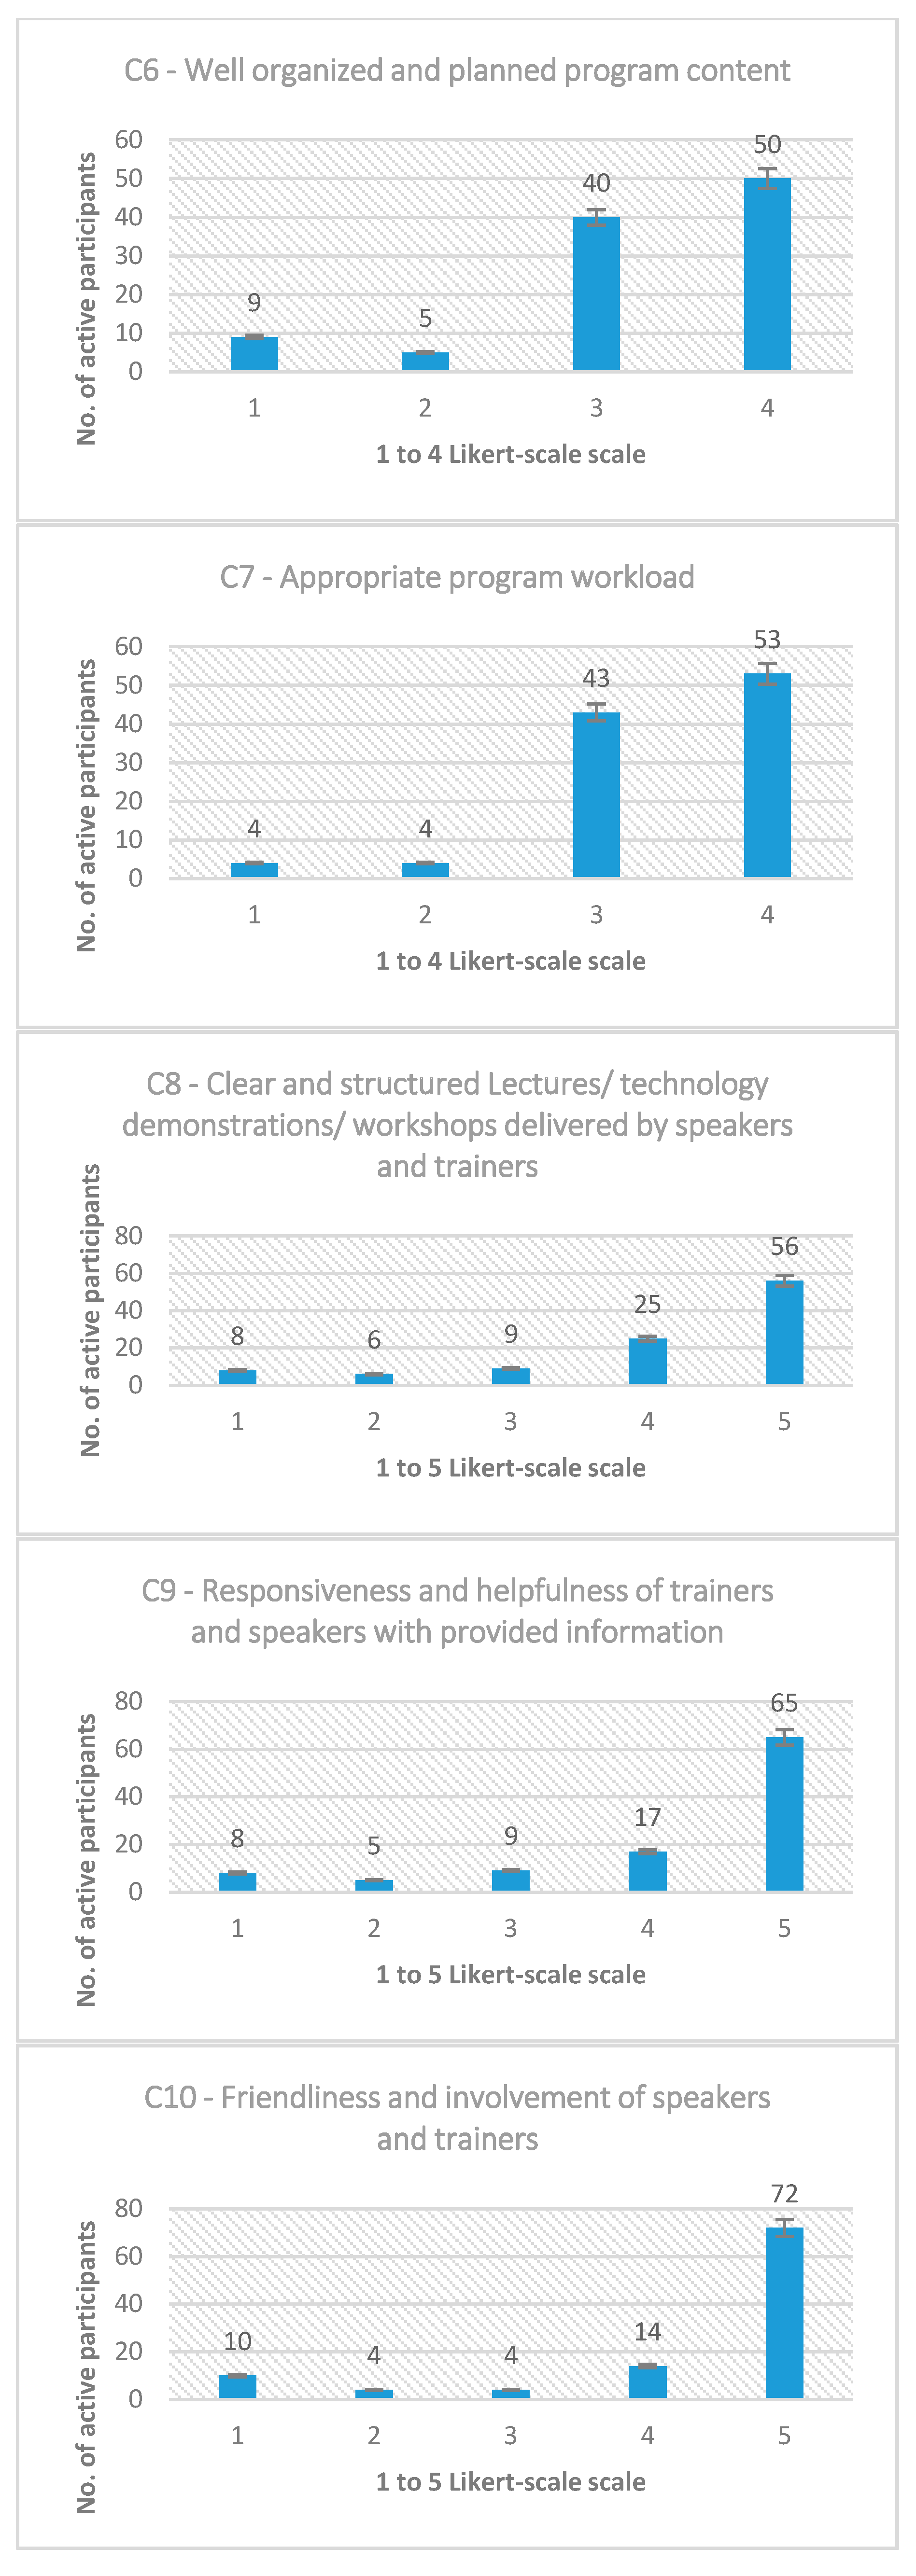
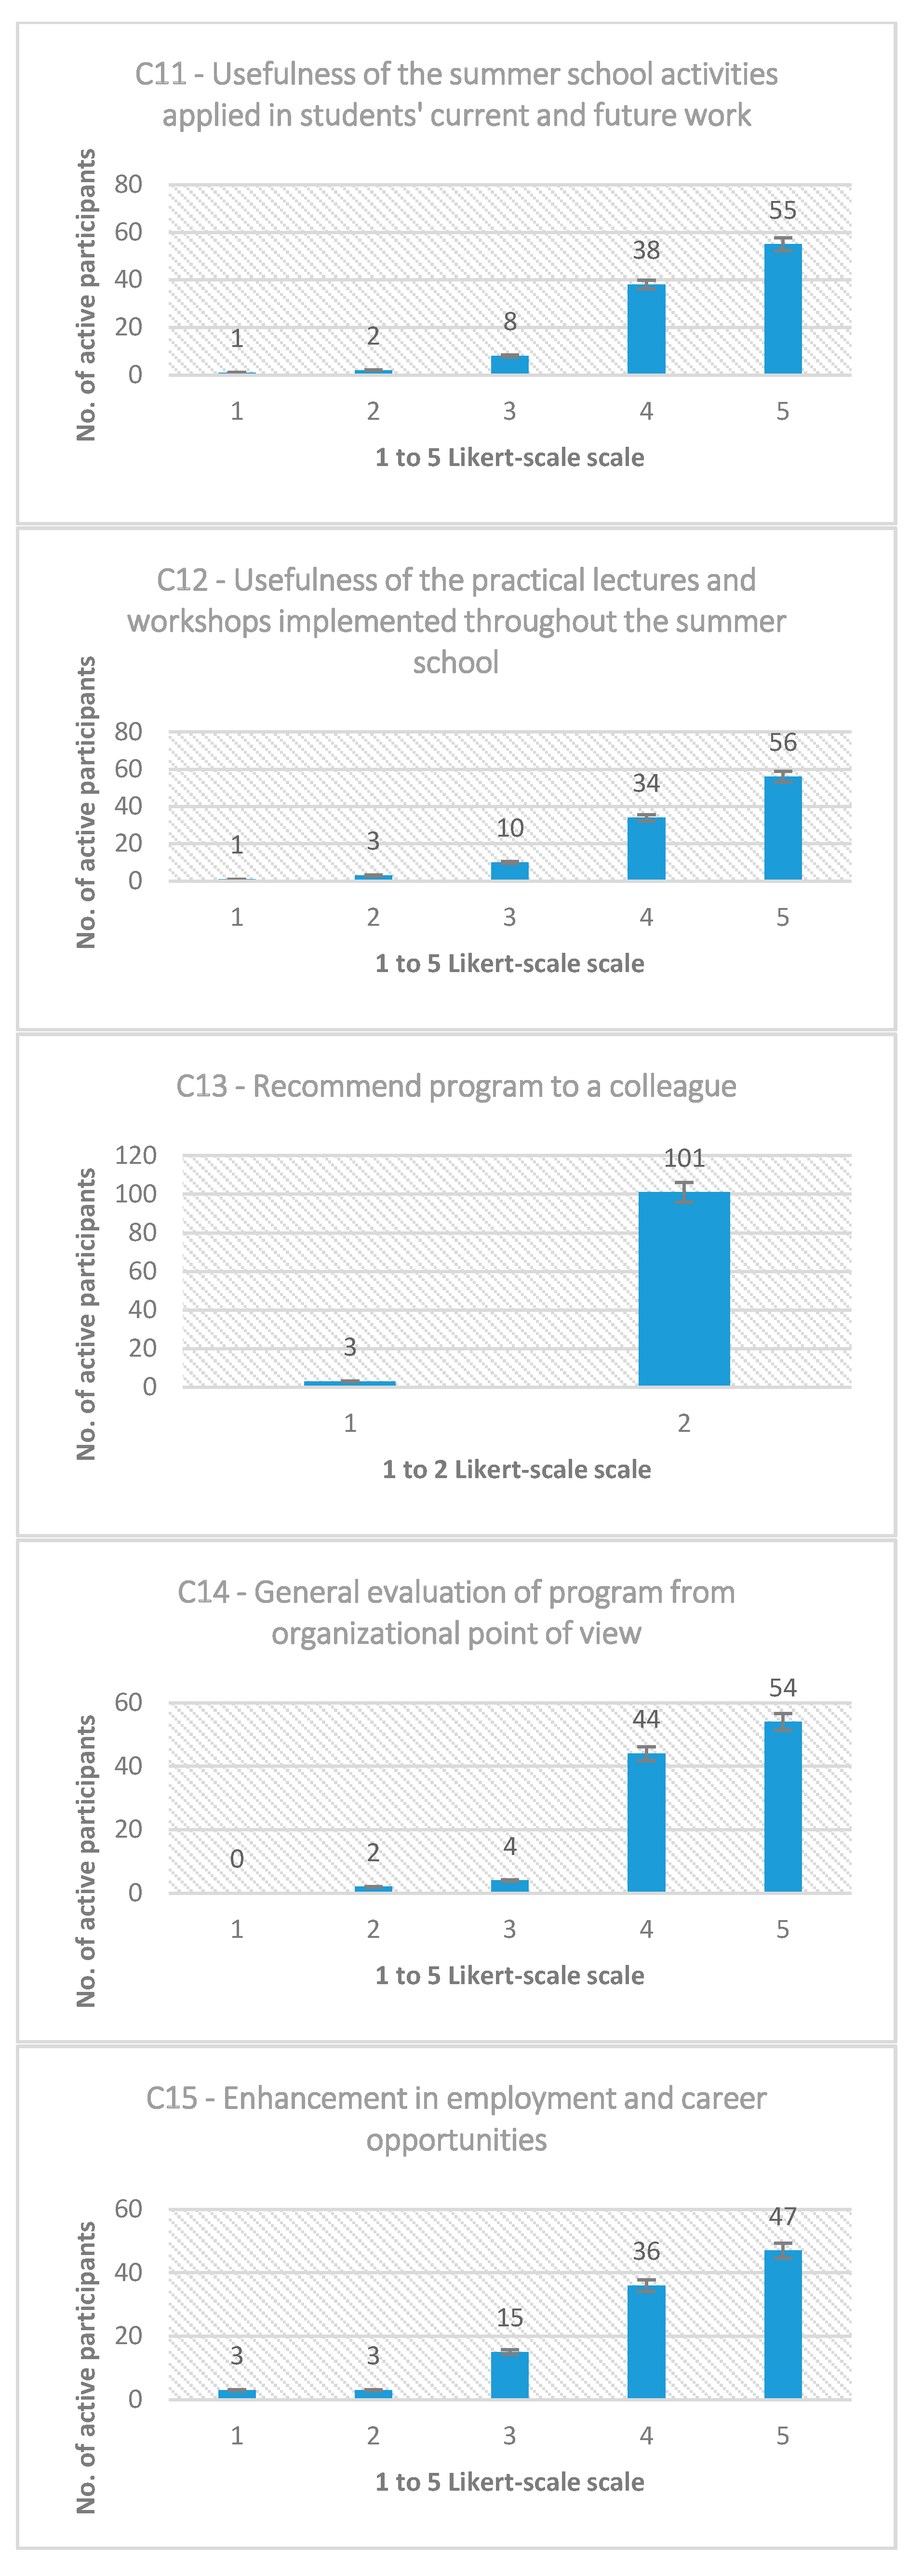
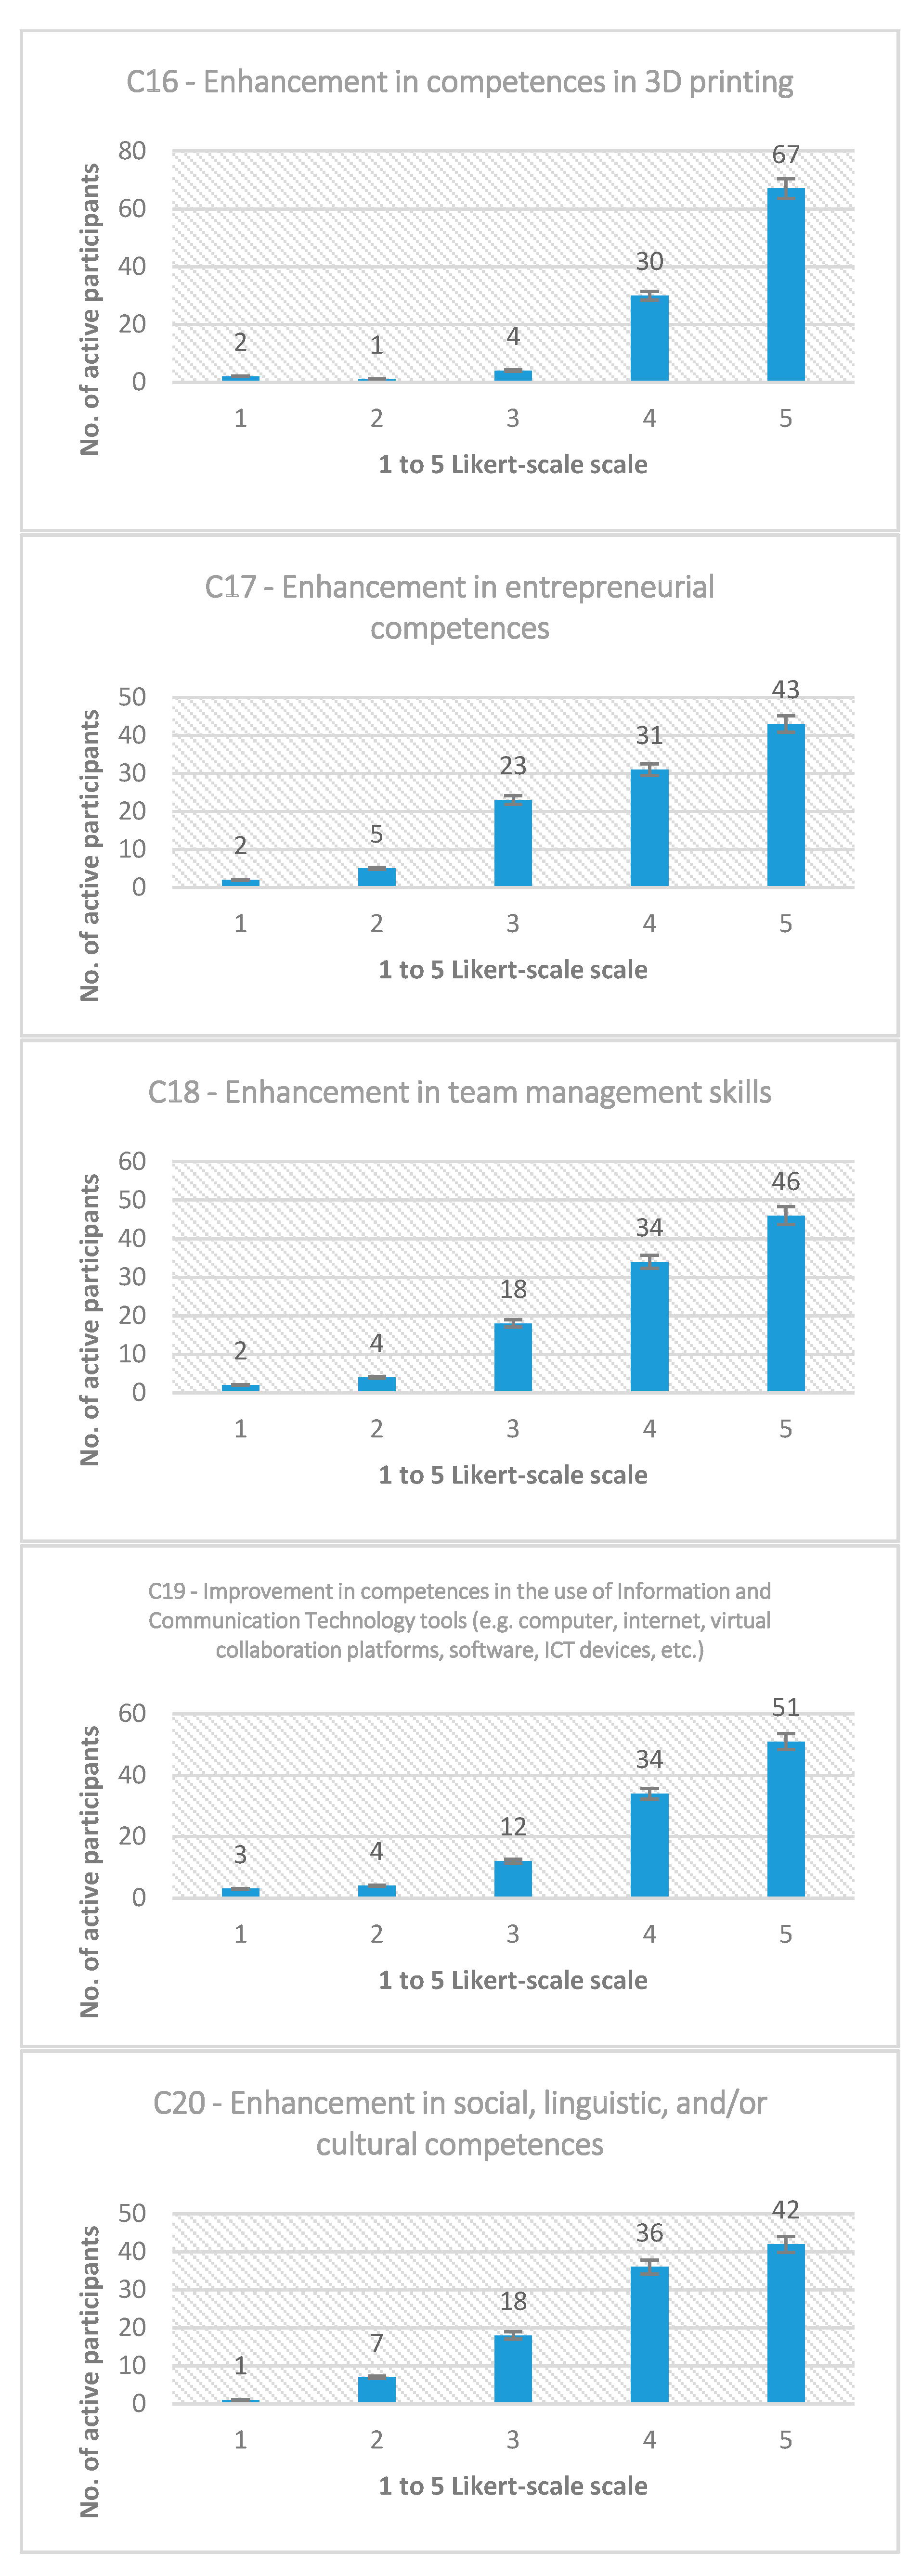
Final feedback of both programs entailed the design and implementation of a custom survey, which facilitated efficiency evaluation in correlation to the overall and content specific LO. The unprocessed survey results are presented in Appendix B. Figure A1 shows the survey results after implementation of the STEM intensive program for secondary education, whilst Figure A2 refers to the results of the tertiary intensive education program. Structured for the two aforementioned LO categories, the survey focused on 20 main components (Ci, ) which define the implemented activities (Table 2). The components were defined by the authors based on the learning objectives, thus the divided structure in overall and content specific components. Additionally, components considered the content of each curriculum module, based on research conducted and validated by the authors in their own work [6,7,19,20,22,23]. The custom survey was piloted by the authors in both STEM intensive programs, and applied in the last day of implementation, before the final award ceremonies. The questions strictly followed the components’ structure; thus, each survey was comprised of 20 items. In the last day of implementation, a QR code was provided to all STEM intensive programs participants, which opened on their mobile phones a Google Forms survey. Items with single and multiple answers were used. Authors received 104 answers for the tertiary educational program and 108 answers for the secondary intensive program.
Generally, each component was evaluated by active student participants on a 1 to 5 Likert-scale scale, 5 being Strongly agree/Very satisfied and 1 being Strongly disagree/Very dissatisfied [39]. Fifteen items used a 1 to 5 scale, four components used a 1 to 4 scale and one component used a Yes/No answer. In this last case, No got assimilated with value 1 and Yes with value 2.
Efficiency for each of the 20 components was calculated using the general Formula (1).
Resource investment was made for a maximum outcome; thus, the effort of each component (Efforti) was considered reached if all students scored with the upper limit of the given scales.
where, J is the upper limit of the used scale for each i component;
N—number of active participating students in the STEM intensive programs.
Effect was calculated based on the students’ feedback on each of the components, using a formula for each of the three scales, as follows:
where, j is the used scale for each i component; j can take values within , or ; nj—number of students which evaluated the i component within the j given scale, with a specific score.
For example, the efficiency for component C1 in the tertiary intensive program was calculated using relation (6), considering the following (based on Appendix B—Figure A2):
- The scale of C1 was from set from 1 to 5, thus J = 5;
- There were 104 active participants in the tertiary STEM intensive program, thus N = 104;
- The scale of C1 was from set from 1 to 5, thus ;
- Number of students which gave a specific score within the j scale: 51 students scored with 5; 32 students scored with 4; 14 students scored with 3; 2 students scored with 2; 5 students scored the C1 component with 1.
In a similar way and using Formulae (1), efficiency was calculated for each component of the program, as presented in Table 2.
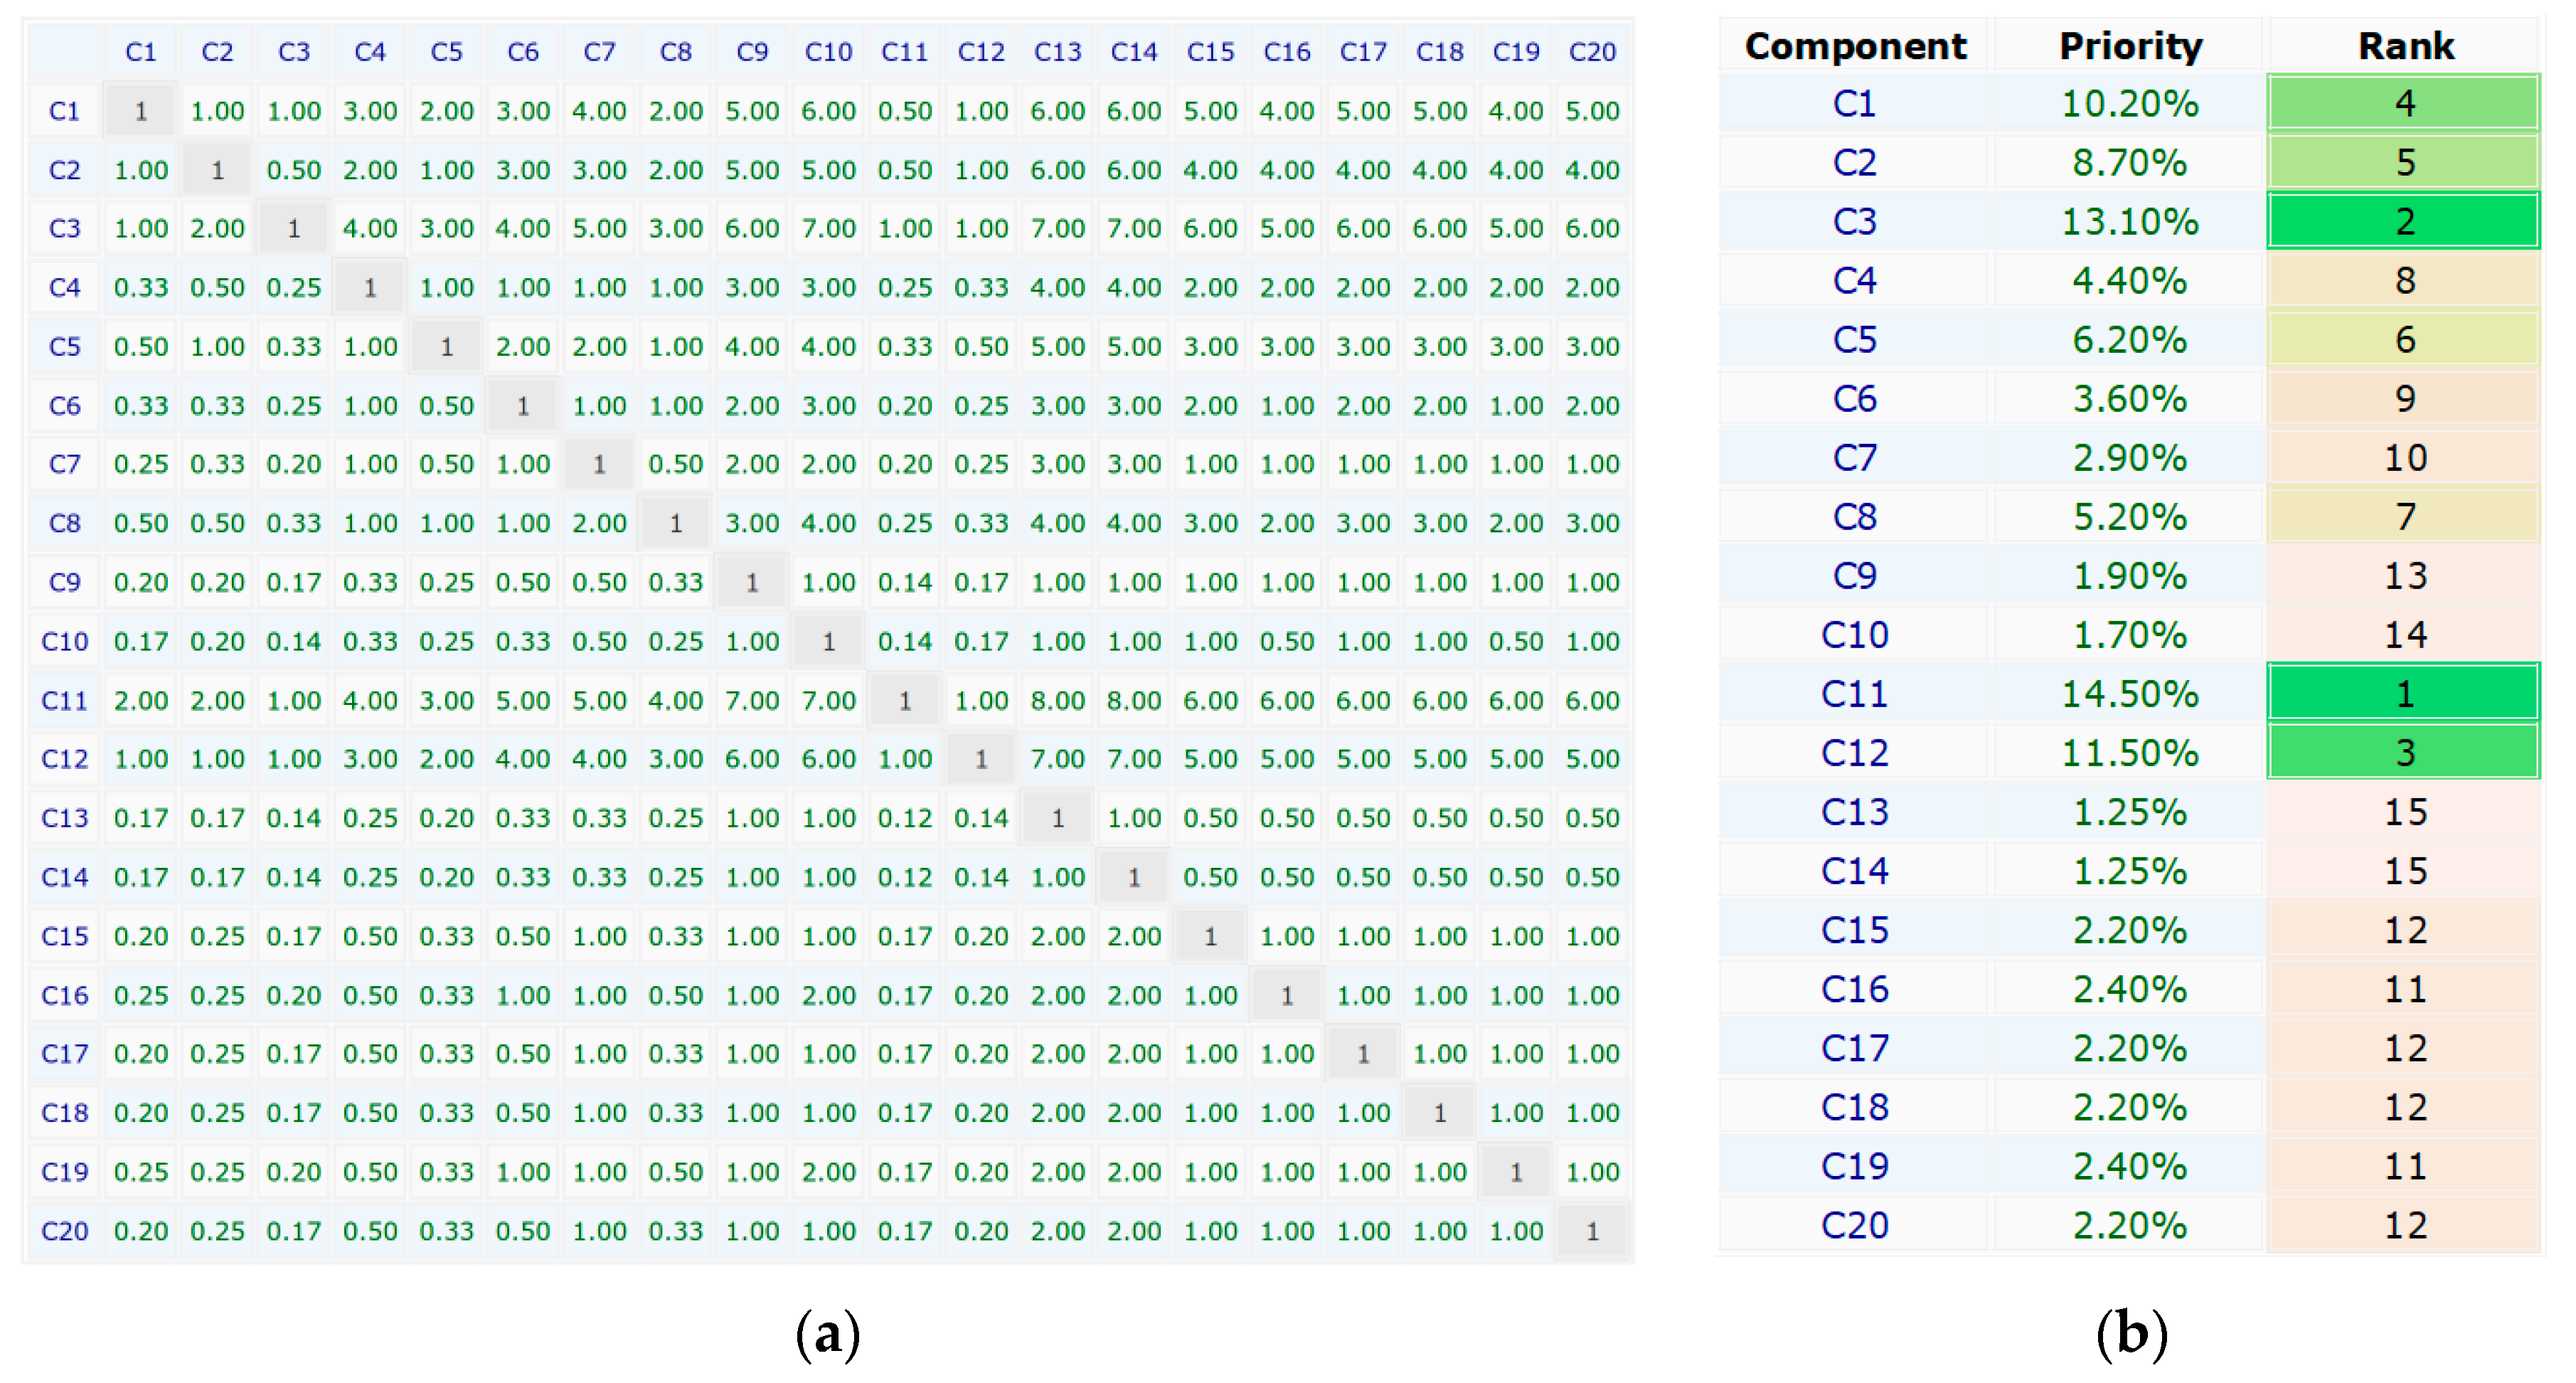
Given the complexity of the framework, each component efficiency was considered to have a different importance level within the program structure. Thus, a rigorous AHP methodology was applied to define the importance of each one of the 20 components, comparing one pair of components at a time. Authors considered AHP as the optimum method, as it reduces the predisposition to biases in the outcome of the decision-making process [40,41], the entire process requiring 190 comparisons between pairs of components.
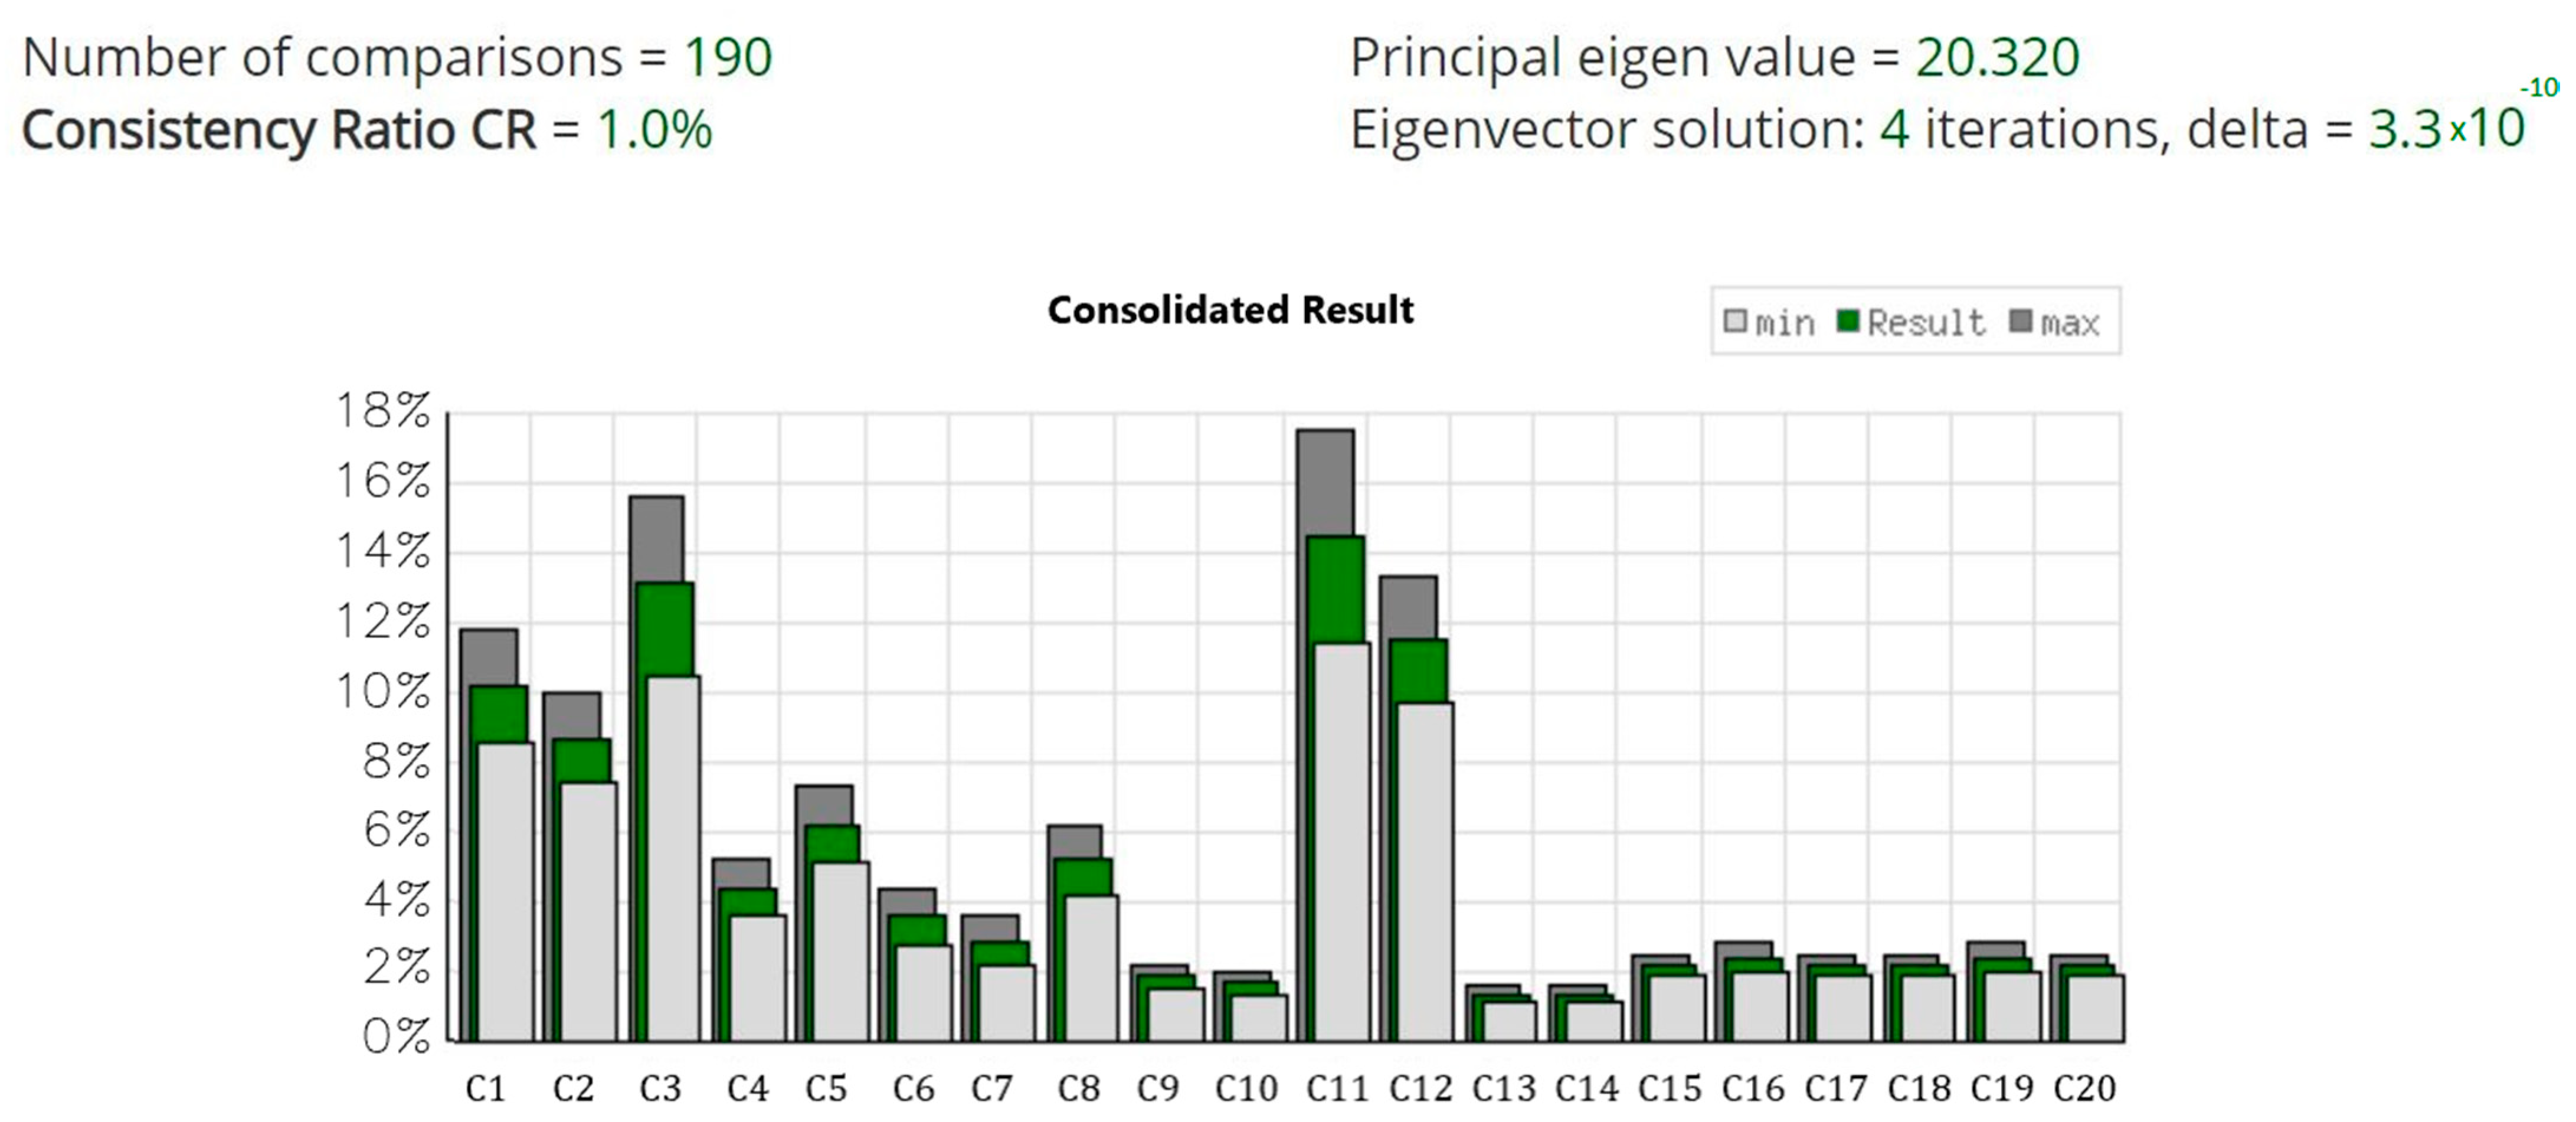
Inconsistencies within AHP are considered acceptable if the consistency ratio has a value below 10% [42], which is the standard applied in the current framework. Goepel’s AHP Online System was used to deploy the proposed tool [43]. The resulting weights of the evaluated components were based on the principal eigenvector of the decision matrix (Figure 2a). Component importance coefficient (ci) was given by the Priority in the AHP Ranking (Figure 2b) which was done based on the 190 pairwise comparisons.
AHP consolidated results show a consistency ratio of 1.0% (Figure 3), which is well below the imposed limit, thus the inconsistencies within the model are acceptable and the calculated importance coefficients can be used in further calculations.
The overall efficiency of each STEM intensive program was composed by using the formulae below:
where, EO—Overall efficiency of the program; EC1 ÷ EC20—Individual efficiencies of each component of the program; c1 ÷ c20—importance coefficients of individual efficiencies calculated with AHP.
Using relation (7) and the results obtained in Table 2 and Figure 1, the overall efficiencies for the secondary (EOS) and tertiary (EOT) programs are given below:
An efficiency value of over 80% is considered highly desirable, with only 20% possibility of improvement. As the tertiary program was implemented first, an increase in efficiency can be observed due to the amendments made based on the received feedback. There is still room for improvement, thus value analysis is undertaken to identify the specific program components which can be further amended.
3.3. Value Analysis
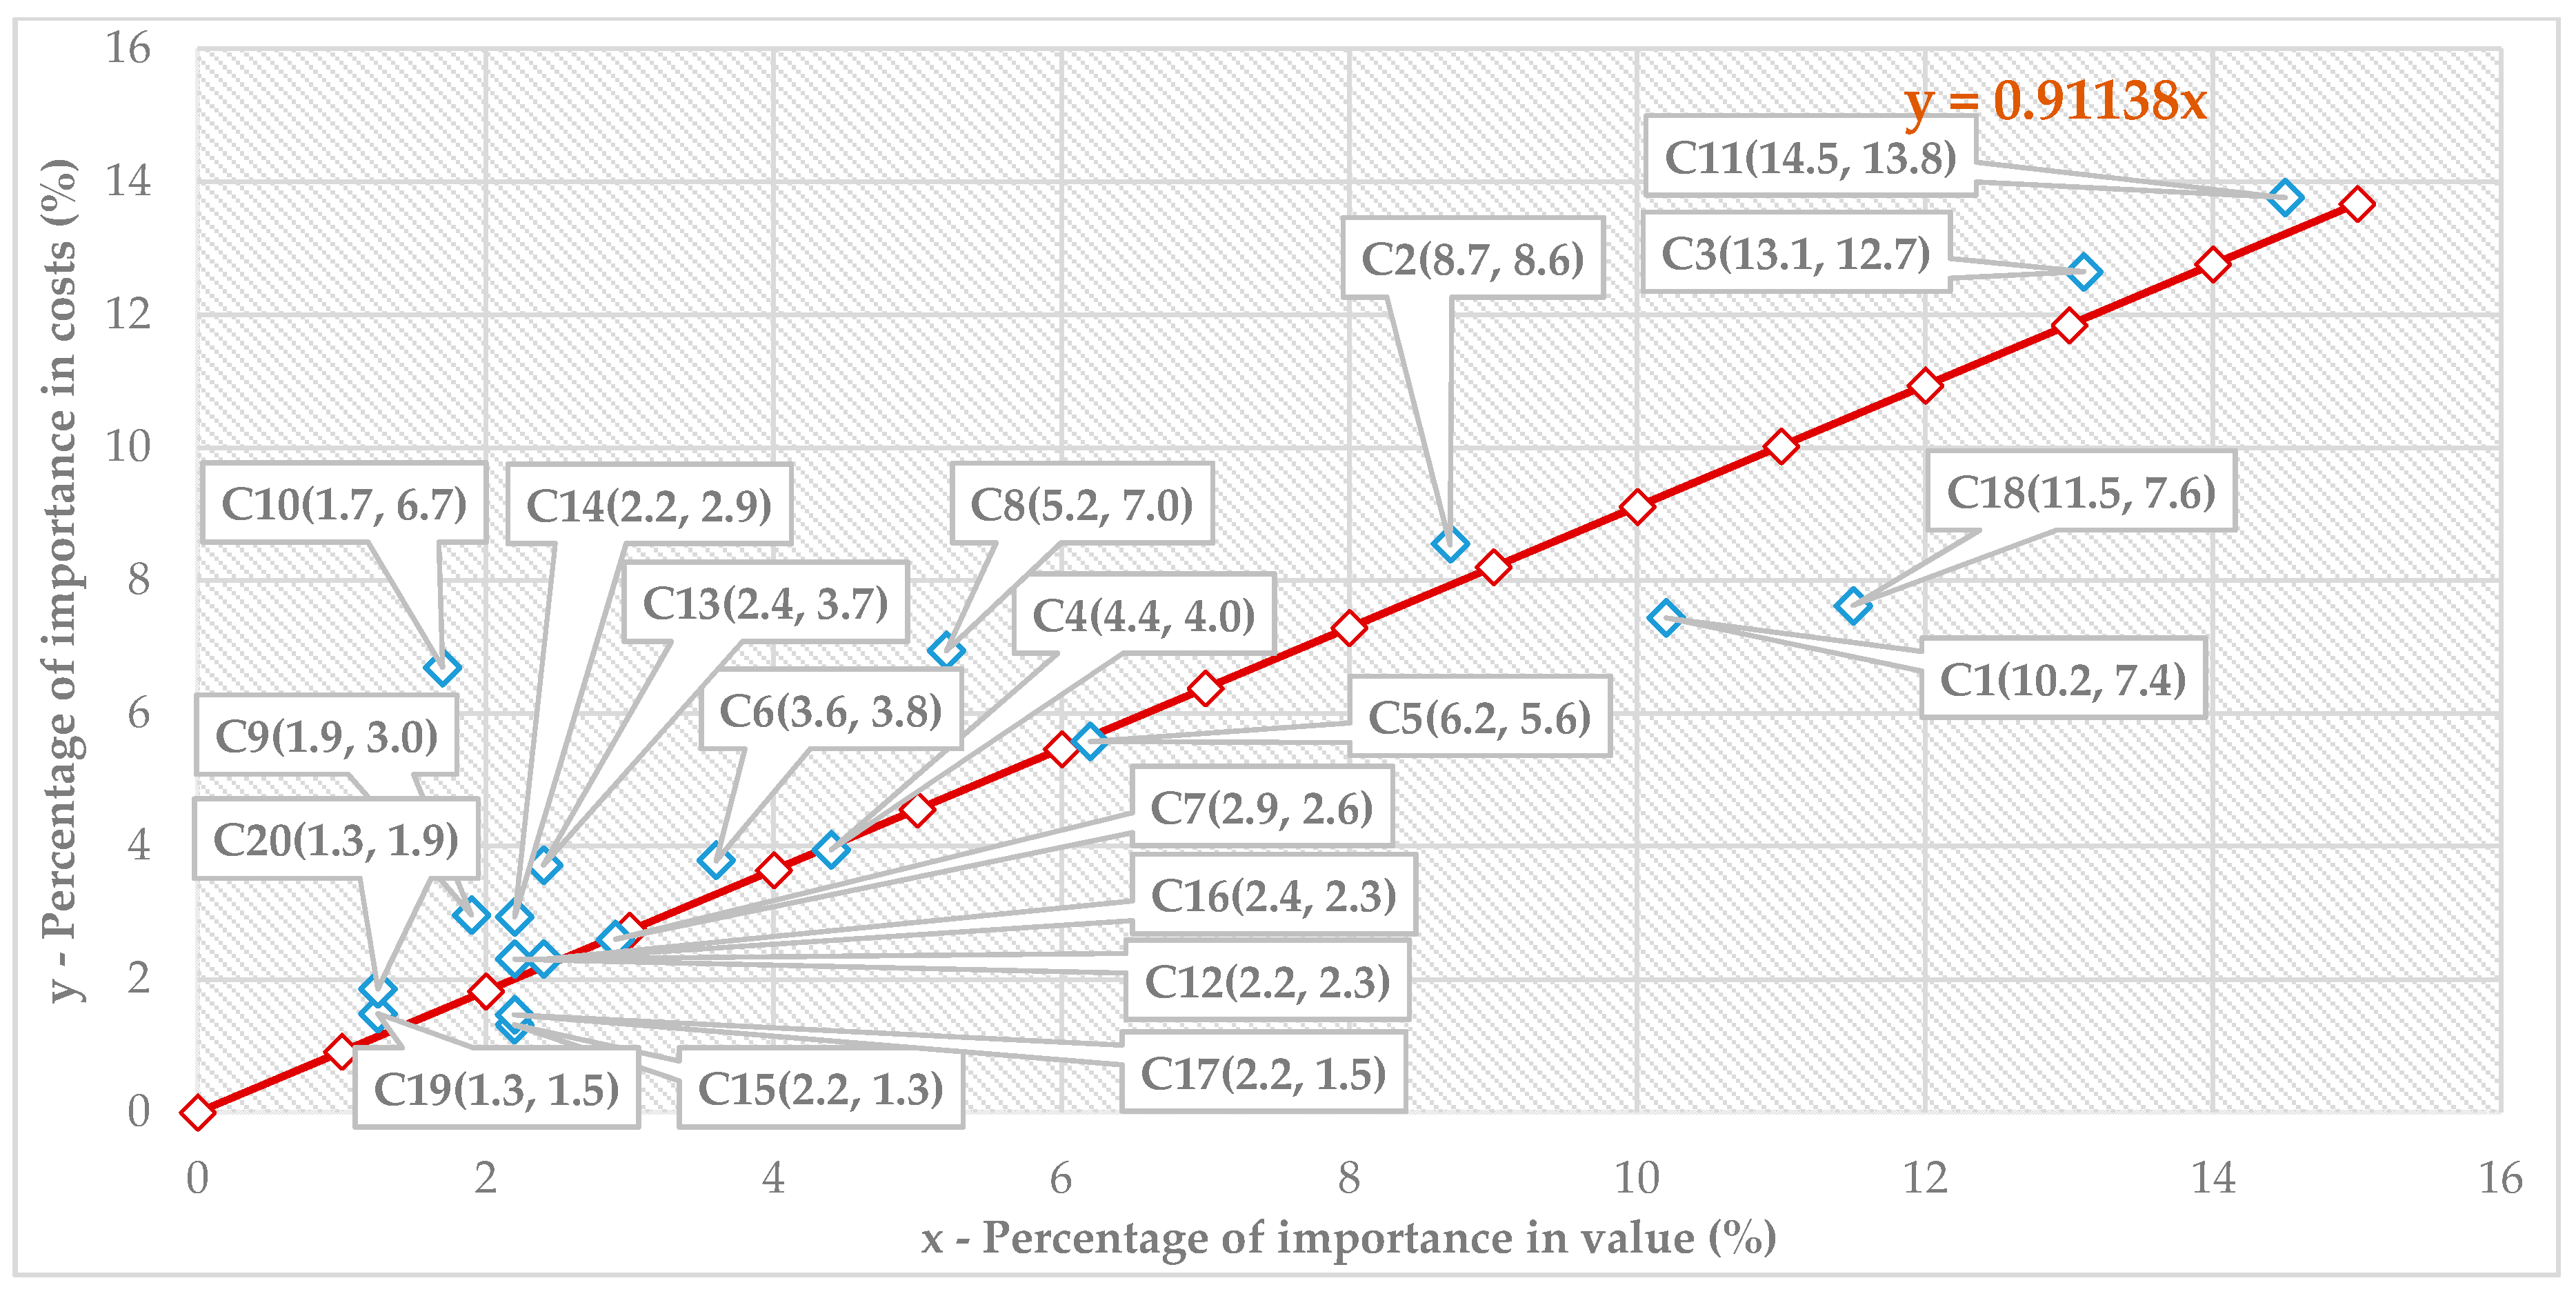
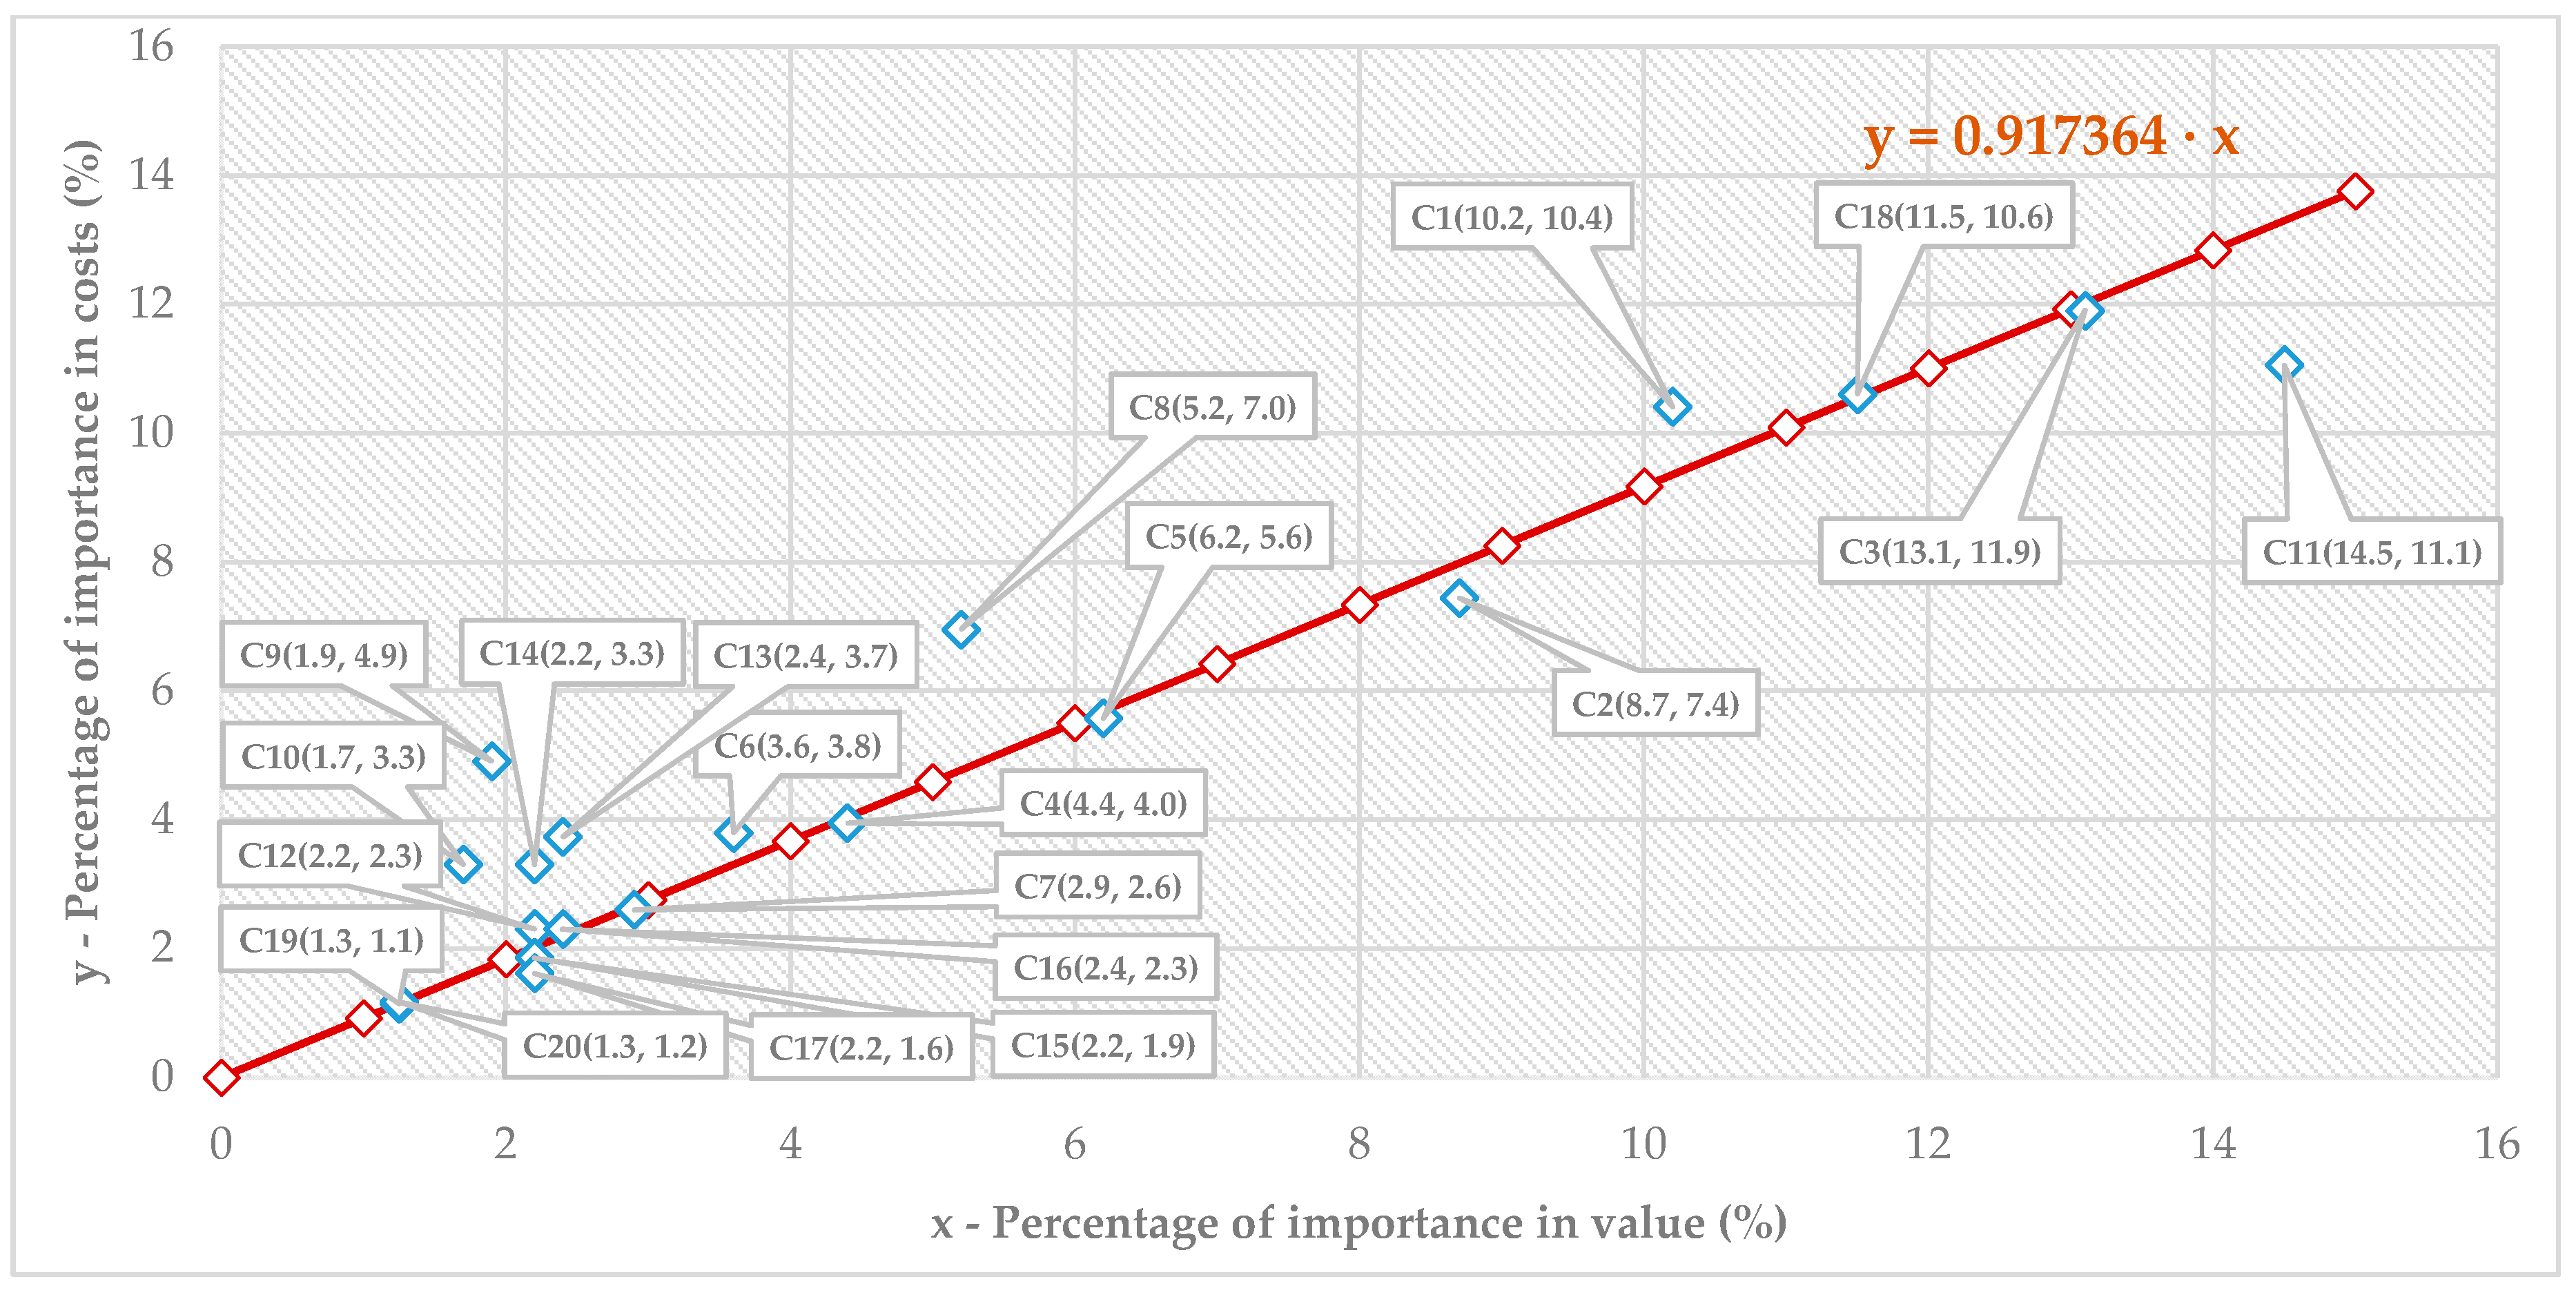
Value analysis (VA) is undertaken in order to address the relationship between high-quality educational outcomes and expenditure. Thus, the value of each program component is analyzed in relation to its’ correspondent cost. In this case the value weightings of the components are assimilated with their individual importance coefficients established previously using AHP and are further on noted with xi. Costs are given by the financial plan of each project and the co-financing plan of UPB and their weighting are further on noted with yi. VA uses the smallest squares method to accurately analyze the relation between components costs and value [31]. The smallest squares method leads with the hypothesis that an estimator S should tend to a minimum value, while an S’ dispersion should tend to zero. In order to do so, the components value and costs must be in perfect balance. in other words, value and costs weightings of all 20 designed components should tend to be perfectly aligned along a regression line. VA aims to reevaluate and redesign components that are above the regression line, by either increasing their value or decreasing their costs.
Further on VA is applied to both the secondary (Table 3, Figure 4) and the tertiary (Table 4, Figure 5) STEM intensive programs. As the two intensive programs were designed based on the same framework, the regression parameter a and angle α are very close in value, but components are distributed differently alongside the regression line (Figure 4 and Figure 5).
VA parameters have been obtained after processing the information in Table 3:
- Regression parameter, a = 0.91138;
- Angle α of the regression line, α = 42.34541;
- Regression estimator, S = 50.7213;
- Dispersion, S’ = 2 × 10⁻¹³.
Based on the above computational elements, the regression line is plotted in Figure 4, alongside all 20 components and their importance in value and costs.
VA parameters have been obtained after processing the information in Table 4:
- Regression parameter, a = 0.917364;
- Angle α of the regression line, α = 42.53214;
- Regression estimator, S = 28.8679;
- Dispersion, S’ = 1.3 × 10⁻¹⁴.
Based on the above computational elements, the regression line is plotted in Figure 5, alongside all 20 components and their importance in value and costs.
4. Discussion and Conclusions
Research results show that designing a sustainable learning framework for STEM intensive programs requires extensive use of high-quality technology, online interactive tools and face-to-face guidance. These findings are in accordance with previous conducted research, which show that amongst the most significant predictors of blended learning effectiveness are content design features, technology quality, online tools and trainer support [18,44,45].
The developed framework includes project-based, team-based and blended learning approaches, with the aim of targeting the proven benefits of each one [46,47,48,49]. The sustainable framework in STEM intensive programs for secondary and tertiary is constructed based on a PDCA cycle with eleven main steps: 1. Background and the rationale of the STEM intensive programs should be defined in correlation with the existing requirements; 2. The mission of the STEM intensive programs must be clearly stated considering the previously established background; 3. A Gantt chart should be set up defining all activities and necessary resources, accompanied with the story of the programs; An appropriate reward system, corelated with the story of the program must be detailed; 4. The most appropriate modules which can fulfill the stated mission should be identified and puzzled together within the storyline of the curriculum; 5. Each module should have a specific role within the programs’ structure and amongst each other; 6. Module LO’s should be designed based on Bloom’s revised taxonomy; 7. Learning content is developed in close correlation with the LOs, which will allow participants to reach the set objectives; 8. Pedagogical approaches and instructional strategies are selected in relation to the content and LO’s; 9. Learning style is selected for each module or a mix of learning styles that will best ensure the accomplishment of the LO’s. 10. The most appropriate delivering format or a mix is established; 11. Formative and summative assessment methods are selected and prepared in correlation with module content and LO’s. The eleven-step framework is divided in four tiers, as shown in Figure 1.
In order to validate the framework structure and content, alongside with its benefits, efficiency evaluation was constructed and deployed. Both of the obtained overall efficiency values are acceptable but show that there are still components which need improvement. Both programs registered their highest component efficiency values for C13–Recommend program to a colleague. This shows that the overall learning experience of both target groups were positive within the designed framework. The lowest registered component efficiency value in the secondary program was 68.7% for C19–Enhancement in physics competences. This result was discussed during the final feedback session and it was concluded that the variety of problem types, problem formulation and scenario development must be improved. The tertiary program recorded its’ lowest component efficiency value (80.76%) for C17–Enhancement in entrepreneurial competences. Although over the threshold of 80%, results and feedback show that this component lacked in diversity of best-practice applications, the prevalent delivering formats being interactive lectures and seminars.
It has been demonstrated that AHP is dominantly applied in higher learning institutions for measuring quality education with many benefits [29]. Within our research, AHP was used to prioritize the components within the designed framework and eliminate any bias which might have occurred during the process up to that point. Thus, overall efficiency was calculated with high accuracy. The overall efficiencies for the secondary (EOS—88.41%) and tertiary (EOT—85.57%) programs registered values over the desired threshold, but with almost 15% possibility of improvement. Improvement of overall efficiency of the framework targets a feedback adapted redesign of the structural development for both STEM intensive programs. Identification of specific components to be improved was undertaken using VA, in accordance with LD Miles adapted method [30,31]. The method was chosen due to its long-time proven results on efficiency improvement and cost savings [50]. The objective of VA was to redesign and diminish costs or increase the value for the components corresponding to the points above the regression line. By changing those specific points and re-plotting the diagram, the slope of the regression line modifies, and a new situation of VA can be evaluated. The process is usually iterative, and it is undertaken until both the customer and manufacturer requirements are met. VA of the STEM intensive programs revealed common components which needed readdressing, either, in terms of value increase, either, in terms of cost reductions. The common identified components were C6, C8 and C13, all of them target content and delivery format structure and organization. Overspending on these three components influenced the regression angle for both analyses. In this case, the preferred approach to obtain a better fit onto the regression line, will be value increase through the following: pre-program target group assessment; use of advanced interactive devices during the learning experience; live feedback paired with on the spot adaptive delivery formats; improvement in participative learning techniques. The most unbalanced component within the STEM intensive secondary program is C10–Friendliness and involvement of speakers and trainers. This component received a very poor evaluation from the target group, probably since they were unfamiliar with the trainers and the higher education approach. For the STEM intensive tertiary program, the target group previously knew the trainers and even had different courses together. Future improvement of this component involves both reducing costs and improving value, by hiring high school professors who are already familiar with the target group. All other program components that are above the regression line of the secondary program analysis will be targeted with cost optimization tools [51]. Responsiveness and helpfulness of trainers and speakers with provided information–C9, was the component which registered the poorest value-cost ratio within the tertiary program analysis. With a difference of 3 points, this component is the most unbalanced due to low value attribution. In this regard, in accordance with other significant research [36,52] we conclude that all endeavors of technology integration, curriculum development and learning environment enrichens should take place as student-centered approaches, but only with consideration of trainers’ background, competences and beliefs [53,54]. Additionally, in support of improving the efficiency and increasing the value of this component, an artificial intelligence assistant is intended to be developed and used for all implemented modules. This is a relatively new addressed avenue for sustainable curriculum planning [37,55]. Other components within the tertiary regression analysis will be addressed through cost reduction.
It is important to notice that the content specific components have the best fit onto the regression line, for both of the STEM intensive programs, showing that the value to cost ratio was designed appropriately. Another noticeable aspect is that the regression points compiled for the tertiary program have a better fit alongside the regression line, than those calculated for the secondary program. This shows that although the efficiency of the secondary program was higher, the cost-value distribution still needs improvement.
Implemented using a mixed educational approach between existing methods and tools [38,56,57], the currently proposed framework is expected to be a sustainable approach to STEM intensive programs for secondary and tertiary education, with high potential of reproducibility.
Furthermore, UNESCO highlights [1] that learning objectives play a key role in sustainable development goals, but their inclusion is still under exploited by education systems. To align with this finding, the sustainable framework based on a PDCA cycle for intensive educational programs (Figure 1) identifies the learning objectives, together with structure development tools and methods, early on within the first stage. Thus, results obtained by the current study with VA in C5 component, shows that the proposed framework was well above average (90.28%–secondary and 82.69%–tertiary) in delivering clear learning objective-based content and structure.
The added value of the research is showcased by its’ innovative approach, whilst addressing the limitations of other studies identified in the introduction of this research. The innovation aspect is given primarily by the following: definition and calculation of a new efficiency indicator for STEM intensive educational programs; correlation between the efficiency analysis and budget expenditure for STEM programs; efficiency evaluation of an integrated curriculum approach, which considers multiple design variables; design of a STEM interdisciplinary approach which considers work experience exposure in correlation with future integration of participants into the workforce market; design of a scalable and reproductible sustainable framework; correlation between secondary and tertiary design frameworks in order to construct an integrated approach for curriculum design in STEM intensive programs; aggregation into a single curriculum structure of theoretical courses with practical workshops, aiming at a mix of competencies and abilities acquired by the participants in order to increase the employability. The conducted research is a direct response to the identified need of an integrated approach of STEM field subjects, focusing on alleviating early dropout rates due to limited practical work experience exposure.
Unforeseen additional implications based on the study results considered mainly aspects related to personal experience of target group participants and trainers. Some of the most important are: students were much more receptive to learning content, up to overstaying the established schedule and demanding additional activities; learning content retention rate was improved due to the continuity of the taught concepts compared to traditional approaches; for pupils, the participation in the program was an insight into an engineering education; trainers from different universities expressed the intent to apply the framework within their home institutions.
Limitations of the study include the quantitative focused analysis, to the detriment of a full comprehensive qualitative analysis. This was a conscious choice of the authors, providing that the current quantitative approach allows better reproducibility of the research results, consequently a very similar implementation of the proposed framework. Additionally, the research did not include a preliminary study of efficiency levels for the 20 components, as this would involve a highly complex evaluation matrix, since the proposed STEM intensive programs are inter- and multidisciplinary. Currently, based on the structure of the STEM intensive programs and on the obtained results of the present study, the authors are designing a framework to evaluate a compound efficiency of individual disciplines, as they are studied in the regular curriculum of secondary and tertiary education programs, such as: mathematics, physics, informatics, 3D printing, CAD etc. In the future, this will be the basis of a comparison evaluation in performance increase.
Another mentionable limitation is the fact that AHP is a labor-intensive tool and for a large amount of analyzed criteria (e.g., 20 components) requires special training of the expert in order to obtain a consistency ratio under 10%. This should be taken into consideration when replicating or scaling the proposed framework.
Further research involves the transition to an online and mixed teaching environment, by adapting the content and framework structure with the aid of smart learning environments. Further assessment is needed in order to address the changing needs of the educational system, currently going through major transformations, due to the SARS-CoV-2 epidemic. In the short term, the online adapted framework will be tested and evaluated during the second STEM intensive program of TecHUB 4.0, in the summer of 2021. Results of the adapted framework will be compared with the currently presented programs and feedback will be considered for improvement. In the medium term, authors consider applying and testing the proposed framework within STEM master’s programs in the field of industrial engineering (http://www.imst.pub.ro/Upload/2020/Planuri_de_invatamant_2020-2021/LICENTA/IELicenta2020.pdf), engaging courses like: Experimental Research, Mechanical Behavior of Engineering Materials, Additive Manufacturing, Robotics and Mechatronics, Industry 4.0, Factory Simulation etc. Long term development includes the proposal of a new curriculum structure, based on the obtained results after thorough testing. The proposal will be submitted to the national regulatory structure in charge of tertiary education in Romania, ARACIS (Romanian Agency for Quality Assurance in Higher Education).
Author Contributions
Conceptualization, M.-E.U. and C.-V.D.; methodology, M.-E.U.; software, P.S.; validation, M.-E.U., C.-V.D. and P.S.; formal analysis, C.-V.D.; investigation, M.-E.U.; resources, M.-E.U.; data curation, P.S. and C.-V.D.; writing—original draft preparation, M.-E.U.; writing—review and editing, C.-V.D. and P.S.; visualization, M.-E.U.; supervision, C.-V.D.; project administration, P.S.; funding acquisition, P.S. All authors have read and agreed to the published version of the manuscript.
Funding
This research was funded by the National Agency for Community Programs in the Field of Vocational Education and Training (ANPCDEFP) through Erasmus+ Project Nr. 2018–1-RO01-KA203-049511, “TecHnology and EntrepreneUrship Education–Bridging the Gap for Smart Product Development”–TecHUB 4.0, 2018–2021. This research was funded by the Ministry of Education and Research (MEC) through project ROSE AG 144/SGU/PV/II “Mobilization, Organization and Objectives for Future University Education—REASON for the future!”–MOTIV, 2019–2022.
Institutional Review Board Statement
Not applicable.
Informed Consent Statement
Not applicable.
Data Availability Statement
The data presented in this study are available in Appendix A and Appendix B.
Acknowledgments
Authors would like to acknowledge the contribution of University POLITEHNICA of Bucharest for the support given in the form of infrastructure and other resources not covered through the funded projects.
Conflicts of Interest
The authors declare no conflict of interest. The funders had no role in the design of the study; in the collection, analyses, or interpretation of data, in the writing of the manuscript, or in the decision to publish the results.
Appendix A

Table A1.
Overall Learning Objectives of intensive programs for secondary and tertiary education (OLO).
Table A1.
Overall Learning Objectives of intensive programs for secondary and tertiary education (OLO).
| OVERALL LEARNING OBJECTIVES |
|---|
| OLO 1. Students will be able to distinguish and evaluate the information structure of teaching activities and support materials, during each program module. |
| OLO 2. Students will be able to describe three main attractiveness characteristics teaching activities and support materials. |
| OLO 3. Students will be able to illustrate one real-life scenario in which they use the support materials provided through the program. |
| OLO 4. Students will be able to apply at least one interactive tool during each program module. |
| OLO 5. Students will be able to identify at least one learning objective per deployed activity, during each program module. |
| OLO 6. Students will be able to cover all topics within the program content, in a relaxed timeframe and logical information flow. |
| OLO 7. Students will be able to execute all given tasks within the activities’ given timeframe. |
| OLO 8. Students will be able to evaluate specific characteristics of speakers and trainers’ performance in relation to module content. |
| OLO 9. Students will be able to defend the main advantages of undertaking the program in relation to their current and future activities and work. |
| OLO 10. Students will be able to rate the usefulness of the practical lectures and workshops implemented throughout the summer school, by using on a 1 to 5 scale. |
| OLO 11. Students will be able to assess the appropriateness of the program for other peers. |
| OLO 12. Students will be able to evaluate the general quality of the event organization by the end of the program. |
Table A2.
Specific Learning Objectives of the intensive program for secondary education (LOS).
| SPECIFIC LEARNING OBJECTIVES |
|---|
| LOS 1. High school students will be able to remember information already taught in high school regarding the mathematics curricula. |
| LOS 2. High school students will be able to select the most appropriate solving method for a specific math problem type, during one session of mathematics activities. |
| LOS 3. High school students will be able to solve problems from the following mathematics topics: geometry and trigonometry, algebra, and mathematical analysis. |
| LOS 4. High school students will be able to demonstrate working hypothesis and principles of math problems within the following topics: geometry and trigonometry, algebra, and mathematical analysis. |
| LOS 5. High school students will be able to explain the working principles applied in: Mechanics, Thermodynamics, Production and use of direct current and Optics. |
| LOS 6: High school students will be able to identify a specific type of solving method for given problems within specified physics areas. |
| LOS 7. High school students will be able to solve problems and demonstrate hypothesis and principles from the following areas: Mechanics, Thermodynamics, Production and use of direct current and Optics. |
| LOS 8. High school students will be able to understand the logical structure of specific problem type, during the initial program sessions. |
| LOS 9. High school students will be able to correlate between given problems and the most appropriate software structure or a combination of them, during the informatics activities. |
| LOS 10. High school students will be able to build software applications using conditionals, loops and other data structures (if, for, case, while and else). |
| LOS 11. High school students will be able to demonstrate the functionality of built software applications using conditionals, loops and other data structures. |
| LOS 12. High school students will be able to understand the 3D modelling software environment of Solid Works. |
| LOS 13. High school students will be able to identify the main volumes, sketches and 3D operations (Extrude, Revolve, Sweep, Loft) which constitute a virtual model. |
| LOS 14. High school students will be able to design at least two 3D models of real-life products using Solid Works software application. |
| LOS 15. High school students will be able to generate 2D drawings for designed parts; |
| LOS 16. High school students will be able to generate at least two photorealistic renderings of products, using Solid Works software application. |
| LOS 17. High school students will be able to identify appropriate 3D printing principles for given applications. |
| LOS 18. High school students will be able to select material and equipment for at least two 3D printing applications. |
| LOS 19. High school students will be able to validate build plate layout and 3D printing parameters in correspondence with product function. |
| LOS 20: High school students will be able to optimize build plate layout and process parameters for given application. |
| LOS 21. High school students will be able to 3D Print at least two given applications. |
| LOS 22. High school students will be able to perform post-processing steps and demonstrate functionality of their final products. |
| LOS 23. High school students will be able to understand the basic working principles of electronics, during the first mechatronics activity. |
| LOS 24. High school students will be able to correlate between the specific Arduino code structures and given tasks. |
| LOS 25. High school students will be able to design simple circuits using Arduino boards and three options of sensors. |
| LOS 26. High school students will be able to design Arduino code structures, compile and test run them on own circuits. |
| LOS 27. High school students will be able to identify the characteristics of an IR contrast sensor. |
| LOS 28. High school students will be able to plan the main displacements of an IR equipped robot. |
| LOS 29. High school students will be able to develop an obstacle racetrack for a preprogramed robot. |
| LOS 30. High school students will be able to demonstrate the working principle of an IR contrast sensor. |
| LOS 31. High school students will be able to apply gained knowledge and demonstrate functionality of the developed robotic product. |
Table A3.
Specific Learning Objectives of the intensive program for tertiary education (LOT).
| SPECIFIC LEARNING OBJECTIVES |
|---|
| LOT 1. Students will be able to identify at least two career paths by the end of the intensive program. |
| LOT 2. Students will be able to remember the information already learnt about manufacturing technologies, during the first module of the intensive program. |
| LOT 3. Students will be able to identify main AM technologies for business applications in a Start-up environment. |
| LOT 4. Students will be able to explain the advantages of 3D printing in creating an individual Start-up. |
| LOT 5. Students will be able to generate at least 4 3D printed product concepts within a specific topic of a Start-up company. |
| LOT 6. Students will be able to manufacture at least 4 prototypes using 3D printing technologies. |
| LOT 7. Students will be able to showcase the particularities of a 3D printing Start-up through best products and services. |
| LOT 8. Students will be able to define the mission of a 3D Printing Start-up. |
| LOT 9. Students will be able to carry out needs’ analysis for customers of a 3D Printing Start-up. |
| LOT 10. Students will be able to build products specifications for a custom 3D printed product range. |
| LOT 11. Students will be able to assess financial aspects related to the 3D Printing Strat-up. |
| LOT 12. Students will be able to manage operational aspects regarding necessary resources for a 3D Printing Start-up. |
| LOT 13. Students will be able to test the functionality of the manufactured prototypes. |
| LOT 14. Students will be able to validate improvements for final product range of a 3D Printing Start-up. |
| LOT 15. Students will be able to create Pitch Presentation for a completely developed 3D Printing Start-up. |
| LOT 16. Students will be able to defend Keynote presentation on the development process of a 3D Printing Strat-up. |
| LOT 17. Students will be able to Simulate functionality of designed products through live demonstrations. |
| LOT 18. Students will be able to decide the final product range for a 3D Printing Start-up. |
| LOT 19. Students will be able to design 3D Printing Start-up website. |
| LOT 20. Students will be able to design a Virtual Shop for a 3D Printing Start-up. |
| LOT 21. Students will be able to integrate social media accounts into company website for increased market visibility. |
| LOT 22. Students will be able to communicate effectively in multicultural teams. |
| LOT 23. Students will be able to evaluate personal team performance. |
| LOT 24. Students will be able to rate other teams’ performance. |
Appendix B
Figure A1.
Results for selected items within MOTIV project.


Figure A2.
Results for selected items within TECHUB 4.0 project.


References
- UNESCO. Education for the Sustainable Development Goals: Learning Objetctives; UNESCO: París, France, 2017; pp. 1–68. [Google Scholar]
- United Nations. Policy Brief: Education during COVID-19 and Beyond. 2020. Available online: https://www.un.org/development/desa/dspd/wp-content/uploads/sites/22/2020/08/sg_policy_brief_covid-19_and_education_august_2020.pdf (accessed on 9 November 2020).
- OECD. The Future of Education and Skills—Education 2030, OECD Report. 2018. Available online: https://www.oecd.org/education/2030-project/about/documents/E2030%20Position%20Paper%20(05.04.2018).pdf (accessed on 7 November 2020).
- OECD. Definition and Selection of Competencies: Theoretical and Conceptual Foundations (DeSeCo), OECD Background Paper. 2001. Available online: http://www.oecd.org/education/skills-beyond-school/41529556.pdf (accessed on 8 November 2020).
- European Commission. Education and Training Monitor; Publications Office of the European Union: Luxembourg, 2018; Available online: https://ec.europa.eu/education/sites/education/files/document-library-docs/volume-1-2018-education-and-training-monitor-country-analysis.pdf (accessed on 21 October 2020).
- Doicin, C.V.; Chircu, S.; Coteț, B.G.; Ulmeanu, M.E.; Sălvan, M.S. Study Regarding the Quality Improvement of the Higher Education System through Customized Career Counselling and Orientation Services. In Applied Mechanics and Materials; Trans Tech Publications: Zurich, Switzerland, 2016; Volume 834, pp. 225–230. [Google Scholar]
- Doicin, C.V.; Sălvan, M.S.; Ulmeanu, M.E.; Chircu, S.; Coteț, B.G. Research on the Influence of Internal and External Conditionings on Students’ Perception about Future Career. In Applied Mechanics and Materials; Trans Tech Publications: Zurich, Switzerland, 2016; Volume 834, pp. 231–236. [Google Scholar]
- Lai, Y.C.; Peng, L.H. Effective teaching and activities of excellent teachers for the sustainable development of higher design education. Sustainability 2020, 12, 28. [Google Scholar] [CrossRef] [Green Version]
- Valderrama-Hernández, R.; Sánchez-Carracedo, F.; Rubio, L.A.; Limón-Domínguez, D. Methodology to analyze the effectiveness of ESD in a higher degree in education: A case study. Sustainability 2020, 12, 222. [Google Scholar] [CrossRef] [Green Version]
- Gershon, M. How to Use Bloom’s Taxonomy in the Classroom: The Complete Guide, 1st ed.; Learning Sciences International: West Palm Beach, FL, USA, 2018; pp. 1–208. [Google Scholar]
- Hyder, I.; Bhamani, S. Bloom’s taxonomy (cognitive domain) in higher education settings: Reflection brief. J. Educ. Educ. Dev. 2018, 3, 288–300. [Google Scholar] [CrossRef]
- Irvine, J. A comparison of revised Bloom and Marzano’s new taxonomy of learning. Res. High. Educ. J. 2017, 33, 1–16. [Google Scholar]
- Lysenko, I.; Stepenko, S.; Dyvnych, H. Indicators of regional innovation clusters’ effectiveness in the higher education system. Educ. Sci. 2020, 10, 245. [Google Scholar] [CrossRef]
- Nguyen, T.P.L.; Nguyen, T.H.; Tran, T.K. STEM education in secondary schools: Teachers’ perspective towards sustainable development. Sustainability 2020, 12, 8865. [Google Scholar] [CrossRef]
- Pahnke, J.; O’Donnell, C.; Bascopé, M. Using science to do social good: STEM education for sustainable development. Position paper developed in preparation for the second “International Dialogue on STEM Education” (IDoS). In Proceedings of the Second “International Dialogue on STEM Education” (IDoS), Berlin, Germany, 5–6 December 2019; Available online: https://www.haus-der-kleinen-forscher.de/fileadmin/Redaktion/Englisch/IDoS/2019_Paper_STEM4SD_Education.pdf (accessed on 12 November 2020).
- Christopoulos, A.; Pellas, N.; Laakso, M.J. A learning analytics theoretical framework for STEM education virtual reality applications. Educ. Sci. 2020, 10, 317. [Google Scholar] [CrossRef]
- Lee, K.H.; Na, G.S.; Song, C.G.; Jung, H.Y. How does pedagogical flexibility in curriculum use promote mathematical flexibility? An exploratory case study. Mathematics 2020, 8, 1987. [Google Scholar] [CrossRef]
- Roblyer, M.D. Integrating Educational Technology into Teaching, 7th ed.; Pearson: London, UK, 2015. [Google Scholar]
- Ulmeanu, M.E.; Doicin, C.V.; Roșca, L. Curriculum development for an intensive summer school programme in smart product development. In Proceedings of the 34th International Business Information Management Association Conference (IBIMA), Madrid, Spain, 13–14 November 2019; Soliman, K.S., Ed.; IBIMA: New York, NY, USA, 2019; pp. 5222–5230. [Google Scholar]
- Ulmeanu, M.E.; Doicin, C.V.; Murzac, R.; Zaharia, C.; Ene, G.; Celik, H.K. Teaching material design and development for 3D printing applications. In Proceedings of the 34th International Business Information Management Association Conference (IBIMA), Madrid, Spain, 13–14 November 2019; Soliman, K.S., Ed.; IBIMA Publishing: New York, NY, USA, 2019; pp. 5231–5242. [Google Scholar]
- Giménez, Z.; Mourgues, C.; Alarcón, L.F.; Mesa, H.; Pellicer, E. Value analysis model to support the building design process. Sustainability 2020, 12, 4224. [Google Scholar] [CrossRef]
- Ulmeanu, M.E.; Spânu, P. Gamification in higher education technical disciplines. In Gaming in Action Engaging Adult Learners with Games and Gamification, 1st ed.; Lencastre, J.A., Spânu, P., İlin, G., Milios, P., Bento, M., Eds.; Publisher: Adana, Turkey, 2021. [Google Scholar]
- Doicin, C.V.; Ulmeanu, M.E. Gamification for high school level intensive summer school programs in technical sciences. In Gaming in Action Engaging Adult Learners with Games and Gamification, 1st ed.; Lencastre, J.A., Spânu, P., İlin, G., Milios, P., Bento, M., Eds.; Publisher: Adana, Turkey, 2021. [Google Scholar]
- Scepanovic, S.; Zaric, N. Gamification in higher education learning-state of the art, challenges and opportunities. In Proceedings of the 6th International Conference on e-Learning (eLearning-2015), Belgrade, Serbia, 24–25 September 2015. [Google Scholar]
- Subhash, S.; Cudney, E.A. Gamified learning in higher education: A systematic review of the literature. Comput. Hum. Behav. 2018, 87, 192–206. [Google Scholar] [CrossRef]
- White, D.; Braddy, A. Ready-to-Go Instructional Strategies That Build Collaboration, Communication, and Critical Thinking, 1st ed.; Corwin: Newbury Park, CA, USA, 2017. [Google Scholar]
- Lozano, R.; Merrill, M.Y.; Sammalisto, K.; Ceulemans, K.; Lozano, F.J. Connecting competences and pedagogical approaches for sustainable development in higher education: A literature review and framework proposal. Sustainability 2017, 9, 1889. [Google Scholar] [CrossRef] [Green Version]
- Resources for Rethinking. Pedagogical Approaches|Sustainability Classroom Resources at Resources for Rethinking. Available online: https://www.resources4rethinking.ca (accessed on 21 November 2020).
- Anis, A.; Islam, R. The application of analytic hierarchy process in higher-learning institutions: A literature review. J. Int. Bus. Enterp. Dev. 2015, 8, 166–182. [Google Scholar] [CrossRef]
- Miles, L.D. Value Methodology: A Pocket Guide to Reduce Cost and Improve Value through Function Analysis, 1st ed.; GOAL/OPC Inc.: Reston, VA, USA, 2008; pp. 1–194. [Google Scholar]
- Ulmeanu, M.E.; Doicin, C.V. Dezvoltarea Produselor Fabricate Aditiv—Aplicații ale Analizei Funcționale Tehnice (Additive Manufactured Product Development—Applications of Technical Functional Analysis); Bren: Bucharest, Romania, 2018; pp. 23–96. [Google Scholar]
- ARACIS. Romanian Agency for Quality Assurance in Higher Education. Available online: https://www.aracis.ro/en/about-aracis/ (accessed on 18 November 2020).
- ARACIP. Romanian Agency for Quality Assurance in Pre-University Education. Available online: https://aracip.eu/ (accessed on 18 November 2020).
- ENQA. European Association for Quality Assurance in Higher Education. Available online: https://enqa.eu/ (accessed on 16 November 2020).
- Ulmeanu, M.E.; Doicin, C.V.; Roșca, L.; Rennie, A.E.W.; Abram, T.; Bajdor, P. TecHUB 4.0—Technology and entrepreneurship education for bridging the gap in smart product development. MATEC Web Conf. 2019, 290, 13012. [Google Scholar] [CrossRef]
- Hrivnak, G.A. The increasing importance of curriculum design and its implications for management educators. J. Manag. Educ. 2019, 43, 271–280. [Google Scholar] [CrossRef]
- Marope, M.; Griffin, P.; Gallagher, C. Future Competences and the Future of Curriculum—A Global Reference for Curricula Transformation; UNESCO International Bureau of Education: Geneva, Switzerland, 2017. [Google Scholar]
- Gardner, H. Frames of Mind: The Theory of Multiple Intelligences, 3rd ed.; Basic Books: New York, NY, USA, 2011. [Google Scholar]
- Ho, G.W.K. Examining perceptions and attitudes: A review of Likert-type scales versus Q-methodology. West. J. Nurs. Res. 2017, 39, 674–689. [Google Scholar] [CrossRef]
- Kovbasiuk, I.; Lowe, W.; Ericsson, M.; Wingkiist, A. Quick decide—A tool to aid the analytic hierarchy process for group decisions. In Perspectives in Business Informatics Research; Matulevicius, R., Dumas, M., Eds.; Springer: Cham, Switzerland, 2015; pp. 179–196. [Google Scholar]
- Galarza-Molina, S.L.; Torres, A.; Moura, P.; Lara-Borrero, J. CRIDE: A case study in multi-criteria analysis for decision-making support in rainwater harvesting. Int. J. Inf. Technol. Decis. Mak. 2015, 14, 43–67. [Google Scholar] [CrossRef]
- Lane, E.F.; Verdini, W.A. A consistency test for AHP decision makers. Decis. Sci. 1989, 20, 575–590. [Google Scholar] [CrossRef]
- Goepel, K.D. BPMSG’s AHP Online System—Rational Decision Making Made Easy, Business Performance Management Singapore. Available online: https://bpmsg.com/ahp/docs/BPMSG-AHP-OS.pdf (accessed on 24 July 2020).
- Kintu, M.J.; Zhu, C.; Kagambe, E. Blended learning effectiveness: The relationship between student characteristics, design features and outcomes. Int. J. Educ. Technol. High. Educ. 2017, 14, 7. [Google Scholar] [CrossRef] [Green Version]
- Arkorful, V.; Abaidoo, N. The role of e-learning, the advantages and disadvantages of its adoption in higher education. Int. J. Educ. Res. 2016, 2, 397–410. [Google Scholar]
- Boss, S.; Larmer, J. Project Based Teaching: How to Create Rigorous and Engaging Learning Experiences, 1st ed.; ASCD: Alexandria, VA, USA, 2018. [Google Scholar]
- Rajalingam, P.; Rotgans, J.I.; Zary, N.; Ferenczi, M.A.; Gagnon, P.; Low-Beer, N. Implementation of team-based learning on a large scale: Three factors to keep in mind. Med. Teach. 2018, 40, 582–588. [Google Scholar] [CrossRef] [Green Version]
- Dias, S.B.; Diniz, J.A. Blended learning in higher education: Different needs, different profiles. Procedia Comput. Sci. 2012, 14, 438–446. [Google Scholar] [CrossRef] [Green Version]
- Okaz, A.A. Integrating blended learning in higher education. Procedia Soc. Behav. Sci. 2015, 186, 600–603. [Google Scholar] [CrossRef] [Green Version]
- Leber, M.; Bastic, M.; Mavrič, M.; Ivanišević, A. Value analysis as an integral part of new product development. Procedia Eng. 2014, 69, 90–98. [Google Scholar] [CrossRef] [Green Version]
- Bragg, S.M. Cost Reduction Analysis: Tools and Strategies, 1st ed.; Wiley: Hoboken, NJ, USA, 2010; pp. 1–416. [Google Scholar]
- Palak, D.; Walls, R.T. Teachers’ beliefs and technology practices. J. Res. Technol. Educ. 2009, 41, 417–441. [Google Scholar] [CrossRef]
- Schaffernicht, M.F.G.; Groesser, S.N. A competence development framework for learning and teaching system dynamics. Syst. Dyn. Rev. 2016, 32, 52–81. [Google Scholar] [CrossRef] [Green Version]
- Zobrist, L.; Brandes, D. What Key Competencies Are Needed in the Digital Age? The Impact of Automation on Employees, Companies and Education, Deloitte AG. 2017. Available online: https://www2.deloitte.com/content/dam/Deloitte/ch/Documents/innovation/ch-en-innovation-automation-competencies.pdf (accessed on 16 October 2020).
- Chiu, T.K.F.; Chai, C.S. Sustainable curriculum planning for artificial intelligence education: A self-determination theory perspective. Sustainability 2020, 12, 5568. [Google Scholar] [CrossRef]
- Davis, B.; Summers, M. Applying Dale’s Cone of Experience to increase learning and retention: A study of student learning in a foundational leadership course. In Q Science Proceedings, Proceedings of the World Congress on Engineering Education 2014, Doha, Qatar, 7–9 January 2014; HBKU Press: Doha, Qatar, 2015. [Google Scholar]
- Fry, H.; Ketteridge, S.; Marshall, S. A Handbook for Teaching and Learning in Higher Education—Enhancing Academic Practice, 3rd ed.; Routledge Taylor & Francis Group: New York, NY, USA, 2009. [Google Scholar]
Figure 1.
Sustainable framework based on PDCA cycle for intensive educational programs.

Figure 2.
AHP for 20 components of the intensive programs: (a) AHP Decision matrix; (b) AHP Ranking.
Figure 2.
AHP for 20 components of the intensive programs: (a) AHP Decision matrix; (b) AHP Ranking.

Figure 3.
AHP consolidated result for all 20 components of the intensive programs.

Figure 4.
Value and cost weightings for all 20 components of the STEM intensive secondary program.

Figure 5.
Value and cost weightings for all 20 components of the STEM intensive tertiary program.

Table 1.
Correlation matrix for STEM intensive programs.
| EL 1 | Content Module | Learning Objective | Pedagogic Approach/ Instructional Strategy | Learning Style | Delivering Format | Assessment 2 |
|---|---|---|---|---|---|---|
| SECONDARY | Mathematics | LOS 1–LOS 4 | Inquiry teaching/Interactive instruction | Logical Auditory | Interactive lecture Seminar | (F) Questions during learning activities; Feedback/(S) Six types of mathematics baccalaureate problems |
| Physics | LOS 5–LOS 7 | Inquiry teaching/Interactive instruction | Auditory Physical Naturalistic | Interactive lecture Seminar | (F) Quiz, feedback and discussions/(S) Six types of physics baccalaureate problems | |
| Informatics | LOS 8–LOS 11 | Inquiry teaching/Cooperative learning; Independent study | Logical Verbal | Seminar Case study | (F) Guided practice; Online-poll; Feedback/(S) Conditionals, loops and other data structures (if, for, case, while and else) | |
| CAD | LOS 12–LOS 16 | Differentiated instruction/Reciprocal teaching; Independent study | Visual Intrapersonal | Tech laboratory Case study | (F) Guided practice; Journal of CAD versions; Feedback/(S) 3D models of real-life objects | |
| 3D printing | LOS 17–LOS 22 | Experiential learning/Reciprocal teaching; Live demo | Visual Physical | Tech laboratory Hands-on workshop | (F) Target setting; Peer and self-assessment; Feedback/(S) Functional 3D printed prototypes | |
| Mechatronics | LOS 23–LOS 26 | Experiential learning/Group roles; Debate | Visual Physical | Tech laboratory Hands-on workshop | (F) Flash tasks during hands-on activities; Feedback/(S) Working electronic circuits for three incremental problems | |
| Robotics | LOS 27–LOS 31 | Experiential learning/Live demo; Debate | Visual Physical Social | Product live demo Best practice-example | (F) Guided debates and feedback/(S) Customized racetrack for a preprogramed robot equipped with an IR contrast sensor | |
| TERTIARY | Start-Up Inception (Mission, Vision, Strategy) | LOT 2–LOT 4, LOT 8, LOT 22 | Locus of control/Debate Group roles Think-pair-share | Social Verbal | Interactive lecture Seminar | (F) Questions during learning activities/(S) Clear, concise and cohesive Mission, Vision and Strategy for a start-up |
| Product Design and Development | LOT 5, LOT 9, LOT 10 | Cooperative learning/Portfolio development; Idea builders; Independent study | Logical Naturalistic Intrapersonal | Hands-on workshop Case study | (F) Quiz, feedback and discussions/(S) Eight product concepts and product requirements table | |
| 3D Print (incl. Functional prototype testing) | LOT 6, LOT 7, LOT 13, LOT 14 | Integrated learning/ Interactive instruction; Reciprocal teaching; Experiential learning | Physical Visual | Tech laboratory | (F) Questions during learning activities; Flash assignments/(S) Cohesive range of 3D printed products; Three tested prototypes. | |
| Business Plan Development | LOT 11, LOT 12 | Integrated learning/ Group discussion Strategic questioning | Logical Verbal | Best practice-example Seminar | (F) Quiz and open questions/(S) Cohesive business plan for a Start-up | |
| Website Development | LOT 18–LOT 21 | Cooperative learning/Brainstorming Interactive instruction | Logical Visual | Hands-on workshop Best practice-example | (F) Discussions and feedback/(S) One functional website per team, completed with mandatory structure | |
| Product Demo and Pitch | LOT 1, LOT 15–LOT 17, LOT 23, LOT 24 | Open-ended instruction/Live demonstration | Social Verbal Auditory | Product live demo | (F) Final Feedback/(S) Functional complex prototype manufactured with MEX or DLP; Final project presentation on Start-up design |
1 Education Level of intensive program; 2 Assessment methods are formative (F) and summative (S).
Table 2.
Efficiency of STEM intensive programs components for secondary and tertiary education.
| LO | Component | Secondary Education | Tertiary Education | ECS 2 (%) | ECT 1 (%) |
|---|---|---|---|---|---|
| OVERALL LO | C1 | Information structure of teaching activities and support materials | 86.666667 | 83.461538 | |
| C2 | Attractiveness of teaching activities and support materials | 86.481481 | 86.923077 | ||
| C3 | Usefulness of teaching activities and support materials | 89.259259 | 86.153846 | ||
| C4 | Interactivity of teaching activities and support materials | 92.037037 | 87.884615 | ||
| C5 | Clarity of learning objectives | 90.277778 | 82.692308 | ||
| C6 | Well organized and planned program content | 87.731481 | 81.490385 | ||
| C7 | Appropriate program workload | 81.481481 | 84.855769 | ||
| C8 | Clear and structured Lectures/technology demonstrations/workshops delivered by speakers and trainers | 94.814815 | 82.115385 | ||
| C9 | Responsiveness and helpfulness of trainers and speakers with provided information | 95.000000 | 84.230769 | ||
| C10 | Friendliness and involvement of speakers and trainers | 97.777778 | 85.769231 | ||
| C11 | Usefulness of the summer school activities applied in students’ current and future work | 91.296296 | 87.692308 | ||
| C12 | Usefulness of the practical lectures and workshops implemented throughout the summer school | 90.555556 | 87.115385 | ||
| C13 | Recommend program to a colleague | 99.537037 | 98.557692 | ||
| C14 | General evaluation of program from organizational point of view | 88.703704 | 88.846154 | ||
| CONTENT SPECIFIC LO | C15 | Enhancement in CAD competences | Enhancement in employment and career opportunities | 84.444444 | 83.269231 |
| C16 | Enhancement in 3D modelling competences | Enhancement in competences in 3D printing | 89.629630 | 90.576923 | |
| C17 | Enhancement in mechatronics competences | Enhancement in entrepreneurial competences | 80.555556 | 80.769231 | |
| C18 | Enhancement in mathematics competences | Enhancement in team management skills | 75.000000 | 82.692308 | |
| C19 | Enhancement in physics competences | Improvement in competences in the use of Information and Communication Technology tools (e.g., computer, internet, virtual collaboration platforms, software, ICT devices, etc.) | 68.703704 | 84.230769 | |
| C20 | Enhancement in informatics competences | Enhancement in social, linguistic, and/or cultural competences | 77.407407 | 81.346154 | |
1 ECS–Efficiency for intensive program in secondary education; 2 ECT–Efficiency for intensive program in tertiary education.
Table 3.
Computational elements of VA for the secondary education STEM intensive program.
| CALCULATED ELEMENTS | xi | yi | xi2 | xi × yi | S | S” | |
|---|---|---|---|---|---|---|---|
| COMPONENTS | C1 | 10.2 | 7.441 | 104.04 | 75.8982 | 3.4413 | 37.8435 |
| C2 | 8.7 | 8.557 | 75.69 | 74.4459 | 0.39438 | −10.927 | |
| C3 | 13.1 | 12.65 | 171.61 | 165.715 | 0.50541 | −18.626 | |
| C4 | 4.4 | 3.951 | 19.36 | 17.3844 | 0.00349 | 0.51982 | |
| C5 | 6.2 | 5.581 | 38.44 | 34.6022 | 0.00484 | 0.86247 | |
| C6 | 3.6 | 3.795 | 12.96 | 13.662 | 0.26423 | −3.701 | |
| C7 | 2.9 | 2.605 | 8.41 | 7.5545 | 0.00144 | 0.22041 | |
| C8 | 5.2 | 6.954 | 27.04 | 36.1608 | 4.90545 | −23.034 | |
| C9 | 1.9 | 2.971 | 3.61 | 5.6449 | 1.53606 | −4.7096 | |
| C10 | 1.7 | 6.696 | 2.89 | 11.3832 | 26.4881 | −17.499 | |
| C11 | 14.5 | 13.765 | 210.25 | 199.593 | 0.30249 | −15.95 | |
| C12 | 2.2 | 2.306 | 4.84 | 5.0732 | 0.09058 | −1.3242 | |
| C13 | 2.4 | 3.72 | 5.76 | 8.928 | 2.34913 | −7.3569 | |
| C14 | 2.2 | 2.939 | 4.84 | 6.4658 | 0.87229 | −4.1094 | |
| C15 | 2.2 | 1.32 | 4.84 | 2.904 | 0.46927 | 3.01416 | |
| C16 | 2.4 | 2.306 | 5.76 | 5.5344 | 0.01409 | −0.5697 | |
| C17 | 2.2 | 1.469 | 4.84 | 3.2318 | 0.28733 | 2.35856 | |
| C18 | 11.5 | 7.626 | 132.25 | 87.699 | 8.15027 | 65.6619 | |
| C19 | 1.25 | 1.488 | 1.5625 | 1.86 | 0.12164 | −0.8719 | |
| C20 | 1.25 | 1.86 | 1.5625 | 2.325 | 0.51952 | −1.8019 | |
| TOTAL | 100 | 100 | 840.555 | 766.065 | 50.7213 | −2 × 10⁻¹³ | |
Table 4.
Computational elements of VA for the tertiary education STEM intensive program.
| CALCULATED ELEMENTS | xi | yi | xi2 | xi × yi | S | S” | |
|---|---|---|---|---|---|---|---|
| COMPONENTS | C1 | 10.2 | 10.417 | 104.04 | 106.253 | 1.12337 | −21.622 |
| C2 | 8.7 | 7.441 | 75.69 | 64.7367 | 0.29167 | 9.39709 | |
| C3 | 13.1 | 11.905 | 171.61 | 155.956 | 0.01265 | 2.94651 | |
| C4 | 4.4 | 3.951 | 19.36 | 17.3844 | 0.00729 | 0.75152 | |
| C5 | 6.2 | 5.58 | 38.44 | 34.596 | 0.01159 | 1.33491 | |
| C6 | 3.6 | 3.795 | 12.96 | 13.662 | 0.24255 | −3.5459 | |
| C7 | 2.9 | 2.604 | 8.41 | 7.5516 | 0.00318 | 0.32685 | |
| C8 | 5.2 | 6.953 | 27.04 | 36.1556 | 4.76422 | −22.7 | |
| C9 | 1.9 | 4.911 | 3.61 | 9.3309 | 10.0363 | −12.038 | |
| C10 | 1.7 | 3.311 | 2.89 | 5.6287 | 3.06769 | −5.955 | |
| C11 | 14.5 | 11.068 | 210.25 | 160.486 | 4.98973 | 64.7794 | |
| C12 | 2.2 | 2.307 | 4.84 | 5.0754 | 0.08341 | −1.2707 | |
| C13 | 2.4 | 3.739 | 5.76 | 8.9736 | 2.36338 | −7.3792 | |
| C14 | 2.2 | 3.311 | 4.84 | 7.2842 | 1.67133 | −5.6883 | |
| C15 | 2.2 | 1.86 | 4.84 | 4.092 | 0.02503 | 0.69608 | |
| C16 | 2.4 | 2.306 | 5.76 | 5.5344 | 0.01088 | −0.5008 | |
| C17 | 2.2 | 1.618 | 4.84 | 3.5596 | 0.16016 | 1.76088 | |
| C18 | 11.5 | 10.603 | 132.25 | 121.935 | 0.00284 | −1.2263 | |
| C19 | 1.25 | 1.148 | 1.5625 | 1.435 | 1.7 × 10⁻⁶ | −0.0032 | |
| C20 | 1.25 | 1.172 | 1.5625 | 1.465 | 0.00064 | −0.0632 | |
| TOTAL | 100 | 100 | 840.555 | 771.095 | 28.8679 | 1.3 × 10⁻¹⁴ | |
Publisher’s Note: MDPI stays neutral with regard to jurisdictional claims in published maps and institutional affiliations. |
© 2021 by the authors. Licensee MDPI, Basel, Switzerland. This article is an open access article distributed under the terms and conditions of the Creative Commons Attribution (CC BY) license (http://creativecommons.org/licenses/by/4.0/).
Share and Cite
MDPI and ACS Style
Ulmeanu, M.-E.; Doicin, C.-V.; Spânu, P. Comparative Evaluation of Sustainable Framework in STEM Intensive Programs for Secondary and Tertiary Education. Sustainability 2021, 13, 978. https://0-doi-org.brum.beds.ac.uk/10.3390/su13020978
AMA Style
Ulmeanu M-E, Doicin C-V, Spânu P. Comparative Evaluation of Sustainable Framework in STEM Intensive Programs for Secondary and Tertiary Education. Sustainability. 2021; 13(2):978. https://0-doi-org.brum.beds.ac.uk/10.3390/su13020978
Chicago/Turabian StyleUlmeanu, Mihaela-Elena, Cristian-Vasile Doicin, and Paulina Spânu. 2021. "Comparative Evaluation of Sustainable Framework in STEM Intensive Programs for Secondary and Tertiary Education" Sustainability 13, no. 2: 978. https://0-doi-org.brum.beds.ac.uk/10.3390/su13020978
Note that from the first issue of 2016, this journal uses article numbers instead of page numbers. See further details here.