The Impact of Airport Managerial Type and Airline Market Share on Airport Efficiency


Business School, Korea Aerospace University, Gyeonggi 10540, Korea
*
Author to whom correspondence should be addressed.
Sustainability 2021, 13(2), 981; https://0-doi-org.brum.beds.ac.uk/10.3390/su13020981
Submission received: 19 December 2020
/
Revised: 14 January 2021
/
Accepted: 14 January 2021
/
Published: 19 January 2021
(This article belongs to the Special Issue Technologies and Innovations for Sustainable Air Transportation)
Abstract
:This paper investigates the impact of airport managerial type and airline market structure on airport efficiency. It explores whether the market shares of the largest airlines differ depending on the managerial type of the airport. In this study, the efficiency scores for the sample airport are measured through DEA (Data Envelop Analysis), and the impacts of the airport managerial type and dominant carrier market share on airport efficiency are subsequently estimated through CEM (Coarsened Exact Matching). This paper concludes that group airports are more efficient than the standalone airports, and the market shares of the largest airlines have a positive impact on enhancing airport efficiency. In addition, the market shares of the largest airlines are found to be higher for group airports than for standalone airports. These findings can serve as practical guidelines for governments and airport authorities by suggesting that efficiency improves when multiple standalone airports are operated as a group through the M&A of airports or the establishment of airport operation agencies. While facing unprecedented challenges from the spread of COVID 19, this paper also suggests that an increase in airline market share through airport–airline cooperation has a positive impact on airport efficiency.
1. Introduction
The growing interest in airport efficiency among stakeholders has fueled research in this field in recent years. Efficiency is often known to be measured using the ratio of output to total input. Airports seek to improve efficiency by either minimizing input or maximizing outputs. Some of key input variables of airport industry include terminal area, number of runways, number of employees and financial costs while output variables include number of passengers, number of flights, and commercial revenue [1,2,3,4]. In the mid-1990s, efficiency evaluation, which had been widely used in several industries, was studied for applications in the airport sector and has more recently evolved into studies on airport efficiency [1,3,5]. However, the majority of research has focused on the efficiency of individual airports regardless of whether they belonged to an airport group. Few studies have compared efficiency scores between group and standalone airports.
Moreover, existing research on the efficiency of airport managerial types has been inconclusive. Adler et al. (2013) [6] asserted that standalone airports achieved higher efficiency scores than their peers that were operating within an airport system, explaining that standalone airports were more focused and unencumbered by a head office. Ferreira et al. (2016) [7] also found that standalone airports were more efficient than group airports in their study comparing the efficiency of the holding business model and standalone management model of airports. On the other hand, other studies have compared the efficiency between group airports and standalone airports and showed no significant differences in efficiency between the two [8].
Airports belonging to an airport group (hereafter referred to as group airports) may benefit from cost savings and knowledge transfer to a greater extent than standalone airports. It is worth noting that in terms of efficiency, group airports may enjoy more favorable conditions than their counterparts, which runs against the findings of the existing studies.
Operating multiple airports as a group elicits changes in airport services and business strategies. The services that an airport offers to airlines and the business strategies employed by an airport will influence competition in the downstream airline market and within airline–airport vertical relations [9]. With that in mind, this paper has investigated whether and how operating airports as a group affects downstream airline market structures. As above, airport services and business strategies influence the airport–airline vertical relationship, which means that markets downstream from the airlines also affect airport performance. Accordingly, it is necessary to explore the relationship between downstream market structures and airport efficiency.
Prior studies have asserted that airline market structures affect airport performance. For instance, Chang et al. (2013) [10] suggested that airports served by more airlines enjoyed greater technical efficiency, implying that the dominance of one or a few airlines had a negative effect on airport efficiency. Meanwhile, Ha et al. (2013) [11] found an inverted U-shaped relationship between airport efficiency and airline market concentration. Both studies suggested that highly fragmented carrier markets led to greater competition for passengers and cargo, contributing to airport efficiency, while emphasizing that a highly concentrated market also had a positive impact on airport efficiency due to the enhanced cooperation between the airlines and airports.
However, it should be noted that highly fragmented carrier markets at an airport can frequently harm the efficiency of that airport by preventing the adequate use of airport resources such as slots, gates, and counters, which are considered critical to enhancing efficiency. Airports are heavily regulated by so-called grandfather rights, which quite often limit the efficient use of resources, particularly when the market is heavily fragmented by a variety of airlines. Therefore, this paper emphasizes that the dominance of the largest carriers has a positive impact on airport efficiency, considering the newly developing relationship of cooperation and integration between airports and dominant airlines [9].
In short, this paper first measures the efficiency of airports with DEA (Data Envelop Analysis), a popular approach for efficiency evaluation using frontier analysis methods, and then compares the efficiency between group and standalone airports and tests the impact of the dominance of the largest airlines on airport performance based on the efficiency estimation of airports in Europe and Asia.
2. Theory and Hypothesis
2.1. Integrated Management of Multiple Airports and Knowledge Transfer
Knowledge is critical to success in all aspects and is a highly desirable asset for organizations [12]. To enhance performance, tacit knowledge in particular should be able to be shared, disseminated, and used companywide so that it becomes a potential asset [13]. Tacit knowledge is, however, hard to transfer from one organization to another [14].
Airports managed by an airport group are in a better position to enhance efficiency through knowledge transfer within the integrated system. Airports, big or small, within an integrated system take advantage of the knowledge accumulated at the airport group level. It is easier and less costly to convey and diffuse knowledge among group airports than standalone airports because knowledge can be conveyed through frequent meetings and communication, personnel movement, training, individual contacts, and collaboration, which can be better facilitated in an integrated system than in an isolated system. Kogut and Zander (1993) [15] found that the more tacit the technology, the more likely the technology would be transferred within firm affiliates. Darr (1995) [16] suggested that more knowledge was transferred between affiliated organizations than between independent organizations.
The Korea Airports Corporation (KAC), a government-owned airport group in Korea and a five-time Air Transport Research Society (ATRS) efficiency award winner, holds companywide meetings (virtual and actual) on a regular basis and rotates its personnel among its airports and head office when the need arises. Moreover, being connected online companywide, KAC member airports collaborate frequently and promptly to share good practices on managerial and operational activities. In addition, any innovation in one airport can be easily taught to, shared with, or spread across airports within the KAC system. In another example, Spanish Airports and Air Navigation (Aeropuertos Españoles y Navegación Aérea (Aena)) developed a plan to enhance the mobility of workers as part of an effort to improve efficiency at the group level [17]. The interaction, which is enabled by enhanced mobility, allows them to understand and use knowledge in a common context. For instance, the airport group can acquire information and learn internally between airports in various geographical locations, which can serve as an important resource to secure a competitive advantage [18]. It is notable that, where the number of airports within the group grows with the construction of new airports, acquisitions, or the winning of airport concessions, the marginal costs of sharing knowledge with newly incorporated airports is not likely to grow as it would if the airports were managed in a standalone fashion.
Knowledge can be shared even with a completely separate organization external to the company, such as when a consulting firm shares its expertise with clients [19]. However, for standalone airports, external knowledge sourcing is difficult and costly because strategically valuable knowledge is tacit and context-dependent [20]. Argote and Ingram (2000) [14] also pointed out that knowledge is hard to transfer because it is embedded in members, tools, and/or networks. For these reasons, standalone airports can find it difficult to stay agile and efficient compared to their peers managed systematically within an airport group.
2.2. Centralized Management of Multiple Airports and Scale and Scope Economies
Many airport groups, especially those that are state-owned, adopt centralized management as they are normally responsible for the operations of all airports within a nation, including not only major hub airports but also small airports. Aena (Spain), Avonor (Norway), KAC (Korea), and AOT (Thailand) are typical airport authorities that centrally manage their airports in their respective nations. Centralized management implies that an airport group will make key decisions on airport management and operations, including user charges, gate allocation to airlines, concession management, and the allocation of slots and check-in counters [21]. Previous studies have found that standalone airports under an individual management model achieve higher efficiency than their counterparts being operated within a system, explaining that standalone airports are more focused and unencumbered by a head office [6]. However, centralized airport systems can allow the benefits of economies of scale and scope for each activity and help coordinate airport investment on a system-wide basis [19].
KAC centrally manages all commercial airports other than Incheon International Airport in Korea. As the majority of regional airports that are small in size and volume cannot financially sustain themselves, they are all managed and supported by the head office in many ways. For its 14 airports, KAC’s head office develops strategies for growth, mid- and long-term land use, landside and airside operations, and safety and retail management. It also provides its airports with a variety of engineering assistance to maintain airport facilities in compliance with national and international standards and make operation activities smarter. Management supports recruitment, training, reporting financials, and managing a smart work system; all of these activities help alleviate administrative burden for the airports. For all of the aforementioned reasons, the overall costs distributed across airports are likely to be less than the total sum of the costs that would be incurred if they were managed individually [6,19,21] Even if the airport group were to add more airports into its system via construction or ownership acquirement, the marginal costs of the aforementioned activities would not grow to the same extent as they would if the airports were individually managed.
The centralized management of airports has also been maintained in Spain on the basis that small airports cannot exploit scale economies. Any financial losses are compensated for through a cross-subsidy system [17]. This idea corresponds to the conventional perspective on airport operations, which views small airports (i.e., serving less than one million passengers) as unprofitable given their apparent inability to recover costs under increasing returns to scale [22]. In June 2012, the Spanish government, therefore, left Aena’s centralized management model unchanged while requiring Aena to present an airport efficiency plan in a bid to improve the performance of regional airports [21]. The Norwegian government has also adopted a centralized system in which the Avinor Group operates 46 airports in central and rural regions [19]. As with KAC, cost-savings have been possible for airports belonging to the two European airport groups, Aena and Avinor, through prudent centralized management even though they were once found to be relatively inefficient in some airport benchmarking studies [17,19].
2.3. Bargaining Power of Multiple Airports
The bargaining power of airports is determined by the degree of competition among them. Overlap between airport catchment areas mostly in multi-airport regions will elicit this competition (ITF, 2009) [23], limiting each airport’s bargaining power. Many of the major cities in Europe and Asia are served by multiple airports, where competition for air service can be intense. In such cases, airlines wield more bargaining power than airports.
However, an airport group can acquire bargaining power by softening competition among its airports in attracting new airline services [21]. In other words, where multiple airports serving one city or overlapped catchment areas are managed by an airport group, the competition between the airports will certainly go down, allowing greater bargaining power for the airports.
This is similar with small regional airports managed by an airport group. Small regional airports in most cases are in a weak position to bargain with airlines not only because of competition with neighboring peer airports but also due to the higher dependency on airlines. Small airports have low demand and less traffic, and their survival is heavily dependent on airlines. The airlines maintain pressure on airports to obtain support for their operations on new routes [24]. The airlines, particularly low-cost carriers (LCCs), are mobile and can easily switch to other airports that offer better terms and conditions for their operations. As a consequence, the bargaining power of small airports is much more limited than that of larger airports [25]. Airport groups can soften competition not only between small airports in adjacent regions but also between smaller and larger airports, thus resulting in greater bargaining power for small airports.
Meanwhile, airports occasionally negotiate with other stakeholders, including but not limited to governments, ground handlers, local communities, and environmental civic groups. They negotiate for deals such as route allocation, price caps, land use plans, noise abatement programs, biological preservation, and emission controls. Being a bigger organization with multiple airports under its management, an airport group is likely to wield more bargaining power against its counterparts in negotiations [21,25].
With enhanced bargaining power, airports can secure better deals with airlines and other stakeholders, which are likely to lead to better overall airport efficiency with regard to favorable deals coming from greater bargaining power on airport charges, slot allocation, congestion management, and other areas of airport business.
Hypothesis 1 (H1).
Group airports are more efficient than standalone airports.
2.4. Market Share of Dominant Carrier and Airport Efficiency
There are two studies showing rather different results on the relationship between airline market power and airport efficiency. On one hand, research has shown an inverted U-shaped relationship between efficiency scores and an airline user’s power or concentration; for instance, either too much or too little airline concentration is associated with airport inefficiency [11]. On the other hand, Chang et al. (2013) [10] analyzed the efficiency of 41 Chinese airports using the DEA method and then regressed the environmental factors that affected airport efficiency, subsequently proving that an airport’s efficiency was enhanced with increases in the number of airlines using the airport. The present paper further investigates the relationship between the efficiency of airports and airline concentration.
With the ongoing pressure for airports worldwide to improve financial performance, regardless of ownership changes, airports have tended to increase cooperation with a particular airline, typically the dominant carrier, when facing competition with either neighboring airports sharing the same catchment area or major airports competing for connecting traffic [9]. When a dominant carrier operates a hub at a particular airport, that airport can guarantee itself secured traffic and revenue in the future. It is notable that airports can also benefit in the form of airport charges from the higher markup of airlines, which becomes possible with the hub operation of dominant carriers. Borenstein (1989) [26] found that the dominance of major airports derived from one or two carriers would result in higher fares for consumers who want to fly to or from these airports.
The monopoly power of the dominant airline is also sufficiently strong to the extent that cost reduction exploited from airports might not be passed on to passengers, and consequently, it fails to benefit the airport with sufficient growth in traffic [11]. However, in many cases, airport market power is argued to be sufficiently large to make socially efficient deals with dominant carriers (Oum and Fu, 2008) [9], thereby preventing cost exploitation. Moreover, the possibility still exists that even dominant carriers are keen on attracting passengers in partnership with airports to maintain their dominant position. Learning from the fact that airline markets have become more fragmented with the growth of LCCs and that the market share of dominant carriers has contracted, these dominant carriers are willing to engage in fierce competition for passengers, contributing to enhanced airport efficiency [26].
It is noteworthy that different patterns of airport–airline cooperation are possible because of the ever-growing pressures for airports to improve their financial performance. For example, since concession revenue has become increasingly important, airports and airlines now use various agreements to internalize the positive demand externally between aviation services and concession services [9]. Fu and Zhang (2010) [27] analytically studied various forms of concession revenue sharing arrangements. One of their findings was that when a carrier had significant competitive advantages over other carriers, a price regulated airport could enhance its own profit by cooperating with the dominant airline. Overall, they found that cooperation between airlines and airports, such as the case of revenue sharing, could be a source of welfare gains.
As suggested in a previous study, too much airline concentration might lead to airport inefficiency [11]. However, the majority of international airports around the world are subject to bilateral or multilateral air service agreements between governments, implying that it is hard for any downstream dominant carriers to achieve a greater than appropriate share of the international market. A higher level of airline concentration might be possible if all of the markets served at an airport were fully liberalized. However, in reality, liberalized markets at international airports are limited by bilateral or multilateral relationships between governments. If extreme concentration is difficult in the real world due to the bilateral nature of the international aviation market, it might be difficult to find reasons for airport inefficiency to set in as the market share of a dominant carrier reaches an overly high level of concentration. In addition, even if dominant carriers control 100 percent of the market, it might still be possible to achieve efficiency through prudent cooperation with airports without restrictions from the grandfather rights of diverse airlines in a fragmented market.
Taking into account all of the above, the growing dominance of the largest airlines and socially efficient negotiations enabled by balanced market power between airports and airlines will lead to the enhanced efficiency of airports. As such, this study presents the following hypothesis.
Hypothesis 2 (H2).
The market share of a dominant airline has a positive relationship with airport efficiency.
Airline market dominance is, in part, driven by airport groups. Both the airport and airline industries offer network services, meaning that their services can be characterized by considerable economies of density and scope [28]. The industries provide complementary services to each other, serving the need to link cities by air transport. Airport groups operating multiple airports can enhance the economies of scope and scale through coordinated operations among their airports. Some airport groups coordinate flight services by allocating types of flight services to their airports and developing specific airports to appeal to specific traffic types [28]. The domestic links between airports constituting an airport group are generally very strong. This is especially the case with national or regional state-owned airport corporations like Aena, KAC, Avinor, and Finavia (Finland). The share of domestic available seats from one airport to another within airport groups, relative to the overall supply of seats, is usually over 90 percent (though the international share is below 10 percent), enabling airport groups to better coordinate domestic flight services [28].
For the efficient allocation of traffic, slots, and infrastructure at airports, airport groups seek cooperation and/or consolidation with the largest airlines at their airports, contributing to increases in the dominance of their home base carriers. It is reasonable and practical for airport groups to first reach the largest carrier serving the traffic that they target and form cooperative agreements and/or alliances with the carrier rather than with small-sized multiple airlines serving various types of traffic.
The dominance of the largest airlines served by an airport group can further rise because the possible long-term arrangements based on airport–airline cooperation can create entry barriers to the market, particularly for airlines that were previously not represented at the airport [29]. While airport–airline coordination might improve the customer experiences and operational efficiency of the combined airport group, it reduces competition in the downstream airline markets (Oum and Fu, 2008) [9], facilitating the dominance of home base carriers in cooperation with airport groups.
Hypothesis 3 (H3).
The dominance of the largest carriers at group airports is higher than that at standalone airports.
3. Methodology
3.1. Data
Data have been collected from the Airport Benchmarking Report of the ATRS and the Database of the Center for Aviation (CAPA). The Airport Benchmarking Team of ATRS surveys 205 airports for benchmarking purposes on an annual basis. These include 53 airports in the Asia/Pacific region, 71 airports in Europe, and 81 airports in North America. It publishes its “Airport Benchmarking Report” annually based on the survey, from which all of the data, including input and output measures for the DEA analysis, have been obtained for this study. The sample airports include 53 airports in the Asia/Pacific region and 71 airports in Europe, totaling 124 airports. The North American Airports were excluded from the sample because, unlike in the other two regions, there are no airports managed by airport groups, and as a result, it is difficult to balance samples between group airports and standalone airports. Our analysis is based on panel data for the 124 airports over the period from 2013 to 2017. The data for the control variables, including “state share” and “competition”, have all been collected from the CAPA database. Table 1 shows the geographic distribution by management models of the sample airports for this study.
3.2. Model
In this study, first, the efficiency scores for the sample airports are measured via a data envelope analysis (DEA). Using the efficiency scores obtained from the analysis, the impact of the managerial type of the airports (group vs. standalone) and the market share of the dominant carrier on airport efficiency is subsequently estimated using coarsened exact matching (CEM) and a regression analysis.
3.2.1. Data Envelopment Analysis (DEA)
DEA is a non-parametric method, and it is thus employed in this study to measure the efficiencies of the sample airports. Currently, it is considered as one of the most frequently used methods for measuring performance. It was developed by Charnes et al. (1978) [2] as a tool for measuring the efficiency and productivity of decision-making units (DMUs). Since its initial introduction, it has rapidly been recognized as an excellent tool for measuring performance.
The DEA-VRS (variable returns to scale) model is used in this study as the airport industry often achieves variable returns to scale [30]. Previous literature on airport benchmarking has often assumed that airports operate under variable returns to scale (VRS) rather than constant returns to scale (CRS) due to the fact that airports are not flexible in determining input levels [31].
DEA models assess efficiency in two ways: input-oriented models and output-oriented models. An input-oriented model aims to minimize the level of inputs and maintain the current level of outputs, whereas the output-oriented model aims to maximize the level of outputs given the current level of inputs [32]. The output-oriented model is selected for this study to focus on the maximization of outputs assuming the same level of inputs. The output-oriented approach is common in airport efficiency studies because once airport investments have been made in the building of new terminals and the construction of runways, it is very difficult for airport operators to disinvest to save costs by changing their input variables, thereby invalidating the input orientation [5,33].
The output-oriented VRS model evaluates the relative efficiency of n airports (DMUk, k¼1, 2, …, n). Every DMUk uses m inputs (I ¼1, 2, …, m) and produces s outputs (r ¼1, 2, …, s). The relative efficiency value of DMUk can then be obtained as follows:
where hk is the efficiency value of airport k, yrj is the rth outputs of the jth DMU, xij is the ith inputs of the jth DMU, ur is the weight of the rth output of airport k, and vi is the weight of the ith input of airport k. Further, ε represents the extremely small positive number to make all ur vi positive, and ua is equivalent to an intercept. From the above model, the optimal input/output multipliers can be determined [4].
r = 1,2,…,s and ua free in sign
3.2.2. Coarsened Exact Matching (CEM)
This study employs the CEM method developed by Iacus et al. (2009) [34], which is a treatment effect approach that is able to analyze the differences in efficiency between group airports and standalone airports, as well as the relationship between the market share of dominant carriers and airport efficiency. The treatment effect approach has been applied to solve fundamental problems in policy evaluation [35]. It sheds light on the causal effects of the treated and untreated individuals, and it is widely used in social, economic, and medical fields, mainly for the evaluation of policy benefits and treatment [36]. The estimation of a treatment effect is quantitatively-economically used in various ways, such as with structural equation modeling, the instrumental variable model, the regression discontinuity model, and the matching method.
Simple matching was developed by studies such as those by Cochran and Cox and Rubin, which were related to statistical treatment effects [37]. Matching is a nonparametric method of controlling the confounding effects of pre-treatment control variables in observational data, which means that after matching, the empirical distribution of covariates (X) in the treatment and control groups converges [34].
In general, matching is not an estimation method but can be viewed as a pre-processing method that estimates treatment effects through the generation of less model-dependent matching data [34]. Prior treatment via matching is known to reduce model dependence and statistical convenience compared to non-matching methods [38].
3.3. Variable
3.3.1. Dependent Variables
To select the DEA variables to estimate efficiencies for sample airports, extensive literature has been reviewed. Ha et al. (2013) [11] investigated the impact of airline market structures on airport productivity, using both DEA and a stochastic frontier analysis, in which runway length, terminal size, and number of employees were selected as input variables and combined passengers and cargo as the sole output variable.
Ülkü (2015) [31] compared the efficiency of Spanish and Turkish airports via DEA using staff costs, other operating costs, and total runway area as input variables and three traffic variables—the number of passengers, air traffic movements, and tons of cargo and commercial revenues—as the output. In another study, boarding gates, employees, length of runways, and operational costs were used as the input, and flight and passengers were used as the output when comparing the efficiency of the group managerial model with the individual management model of airports [7].
The effects of government institutions on the performance of U.S. airports were explored in a study in which institutional form was selected as an input variable, and the number of flights, number of passengers, and tonnage of cargo and mail were selected as the output [39]. Another study evaluated the operating efficiency changes of 39 Greek airports during the years of the economic crisis in Greece (2010–2014) by using DEA where three variables—runway length, apron size, and passenger terminal size—were included as the input, and aircraft movements, passenger numbers, and tons of cargo were included as the output [3].
Together with the studies introduced above, additional studies showing input and output variables for the estimation of airport efficiency are summarized in Table 2.
Based on the literature review summarized in Table 2 and data availability, we selected four output and input variables, respectively, for the efficiency evaluation of the sample airports. The input variables obtained for this study are the number of employees, terminal size, number of gates, and variable costs. The outputs included in the study are passenger throughput, cargo throughput, net operating profit, and operating margin. Unlike previous studies, this paper includes operating margins as one of the output variables because it is an excellent indicator of profitability and is often used to compare the profitability of companies and industries of different sizes. As the airports to be studied in this paper vary in size and volume, operating margin is an excellent tool that enables a balanced comparison of efficiency among them. Variables for the DEA analysis are listed and defined in Table 3.
A summary of the statistics of input and output variables for 124 sample airports is presented in Table 4.
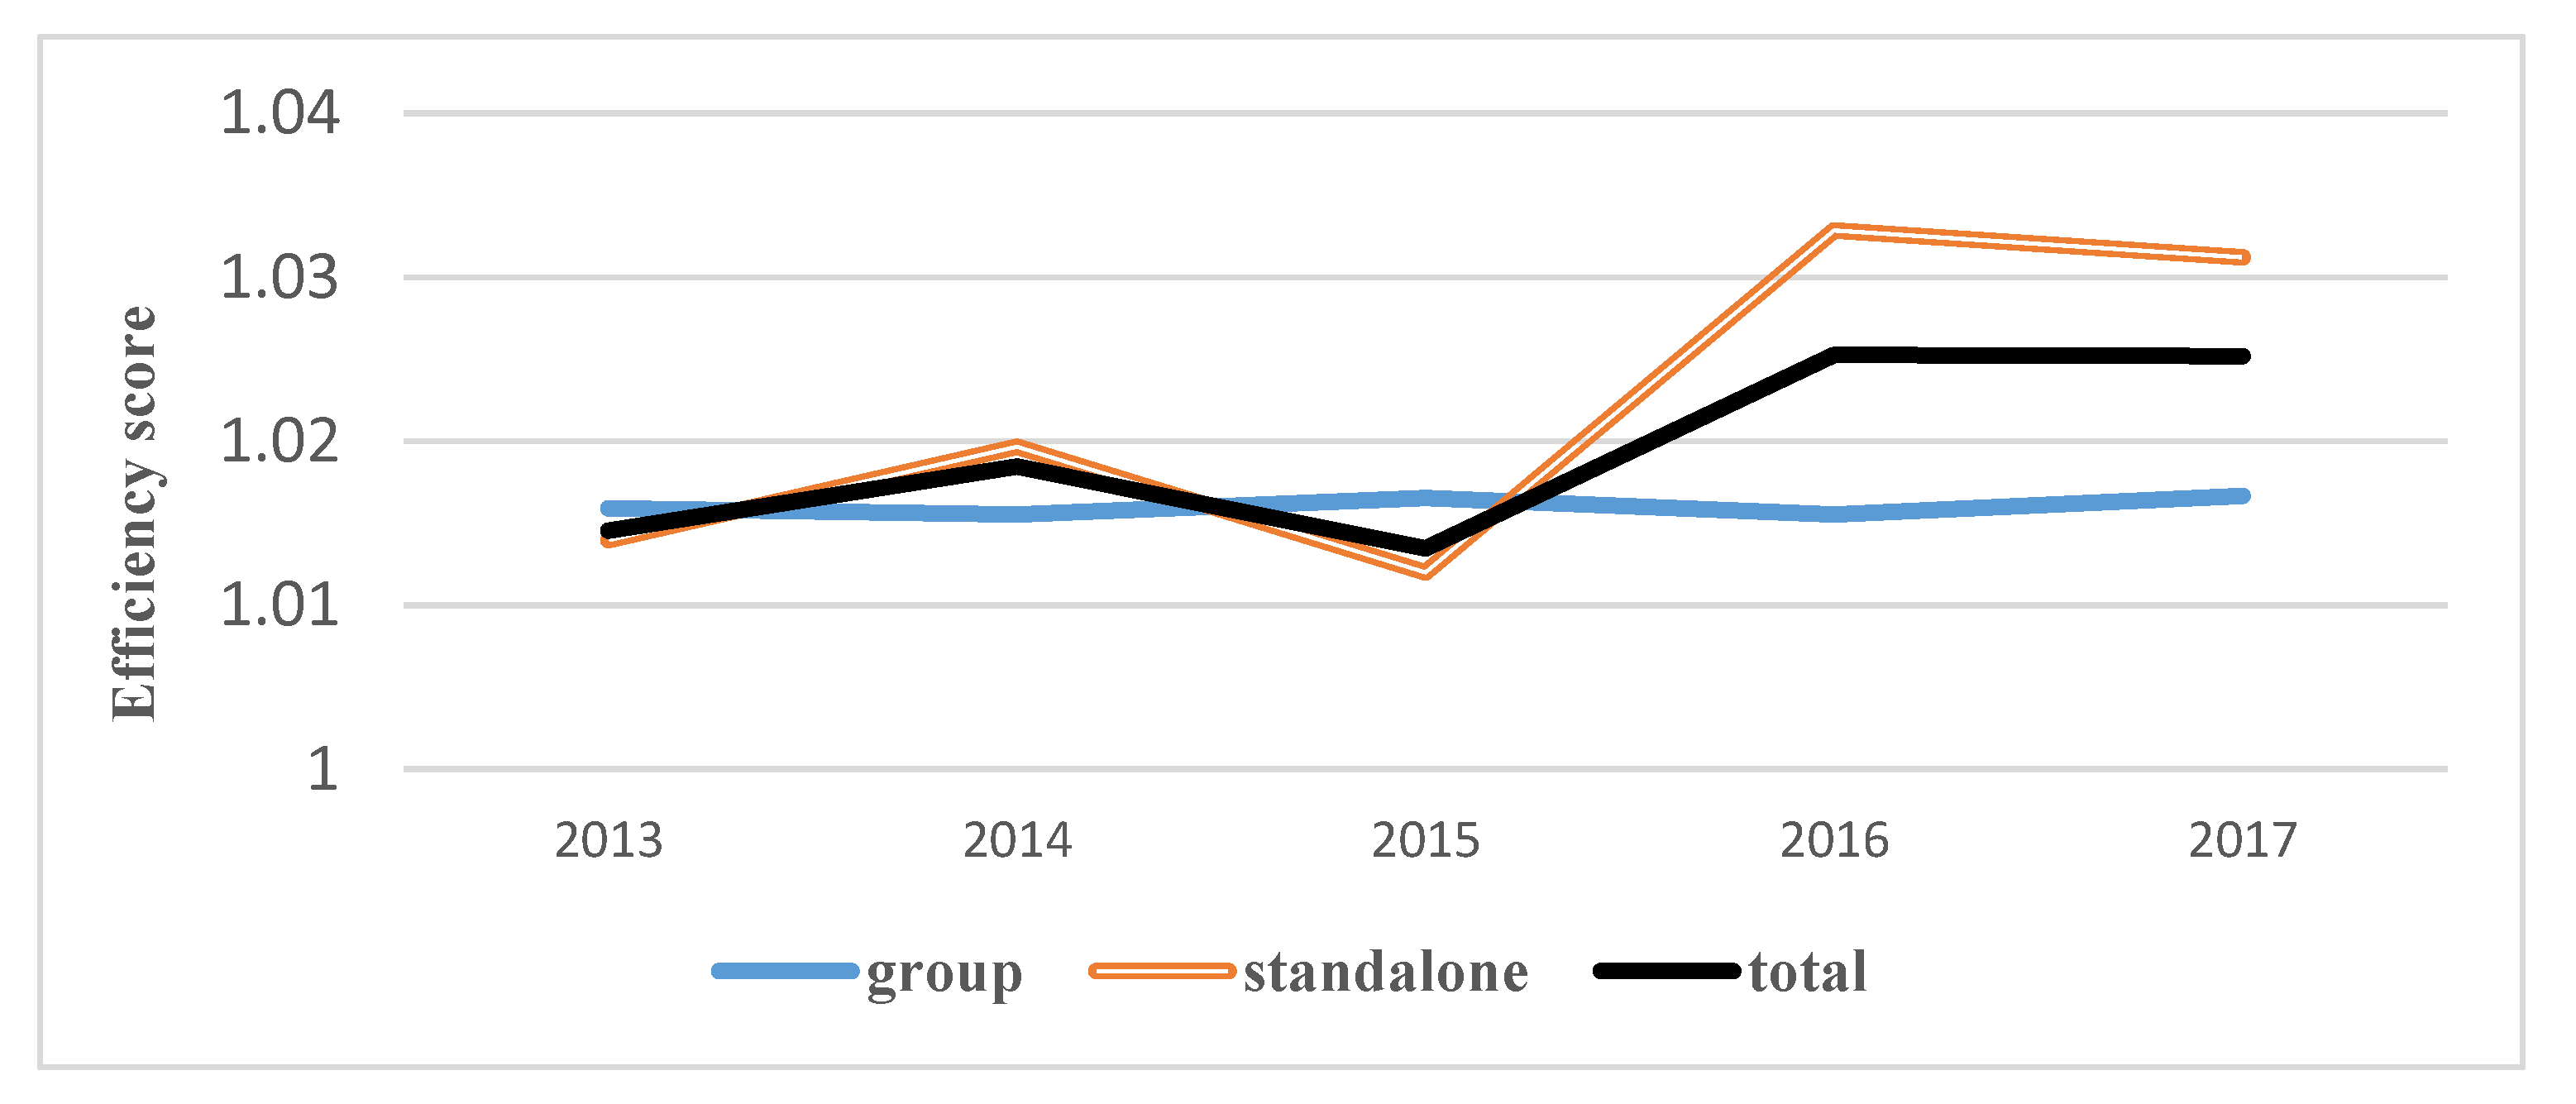
Figure 1 shows the average efficiency scores of 124 airports divided into two types: 79 standalone airports and 45 group airports. As shown in Figure 1, from 2013 to 2017, the red double-lined curve of the standalone airports rises and exceeds the blue curve of group airports, which indicates that the efficiency of standalone airports worsens compared to that of the group airports. The efficiency score was calculated under the output-orientation assumption, meaning that the degree of inefficiency increases as the efficiency score value increases.
3.3.2. Independent Variables
(1) Managerial type of airports is one the independent variables. It distinguishes airports into two types: group airports and standalone airports. Group airports refer to airports belonging to an airport group. Standalone airports are defined as the airports that do not belong to any airport group. A total of 45 of the 124 sample airports are classified as group airports, and the other 79 airports are standalone airports. Using this variable, tests are carried out to determine whether group airports are more efficient than standalone airports.
(2) Market share of the dominant carrier is selected as the second independent variable to investigate the relationship with airport efficiency. Due to data limitations, this paper uses the share of passenger traffic of the largest carrier at an airport as a proxy for the dominant airline market share. It is suggested that as the dominance of the largest airline increases, the efficiency of the airport will increase thanks to the socially efficient negotiations enabled by the balanced market power between the airport and airline. The market shares of the dominant carriers serving our 124 sample airports range from 8 to 91 percent. The three airports that are dominated to the largest extent by the largest carriers have efficiency scores of 1, meaning that they are the most efficient.
3.3.3. Control Variables
The variables that have been found in preceding studies to affect the efficiency of airports have included governance, competition, and international traffic share. In this study, these variables are used as control variables [11].
The variables selected thus far for the regression analysis are listed and defined in Table 5.
4. Results
Table 6 summarizes the descriptive statistics and correlations. A variance inflation factor (VIF) test is also conducted to check for systematical multicollinearity. All of the VIF scores are below 2, and the mean VIF score is 1.56. Therefore, multicollinearity does not pose a serious concern.
4.1. Efficiency of Group Airports and Standalone Analysis
Using matched data with reduced model dependence obtained through CEM, a parametric estimation (OLS) is performed with matched weights to control the imbalance remaining after matching. Table 7 shows data for the matched units obtained via CEM.
Table 8 shows the variate imbalance computed from the CEM analysis. After CEM, not only the L1 of the univariate imbalance but also the multivariate L1 is significantly reduced. This indicates that the balance of variables has improved through matching. The final matched information after CEM shows that the unmatched observations have a weight of 0 and are not used in the parametric analysis (OLS).
Table 9 shows the results of the OLS analysis based on weights assigned after CEM that measure the relationship between several variables and airport efficiency scores.
As seen in Table 9, the “treated” units are very significant after CEM, meaning that group airports are more efficient than standalone airports. Hypothesis (H1) proposed that group airports were more efficient than standalone airports, and the estimated coefficient of the treated is statistically significant (β = −0.0189, p < 0.01) after CEM. Thus, Hypothesis (H1) is supported. The computed figure shown in Table 9 is negative because the efficiency estimation is performed under the output-oriented assumption.
These results differ from those in previous studies. Adler et al. (2013) [6] and Ferreira et al. (2016) [7] found standalone airports to be more efficient than their peers within an airport system. The different results can be partly explained by the fact that the airport groups that have recently emerged from a process of privatization have become well equipped with business-oriented knowledge to attract airlines and passenger traffic, explore commercial opportunities, and make efficient use of resources. In particular, leading private business groups, equipped with knowledge and private orientation, such as Manchester Airport Group, Airport Development Group, Vinci, Australian Pacific Airports Corporation (APAC), and Fraport have actively sought the efficient use of resources at their airports to cope with financial pressure from shareholders.
In addition, government-controlled airport groups have also become keen on improving efficiency along with private airport groups due to the growing pressure from governments and taxpayers. The airports belonging to state-owned airport groups are frequently monitored and benchmarked by numerous studies and government initiatives in attempts to enhance efficiency. In addition, they are operated from a central perspective with greater opportunities to enjoy scale/scope economies and bargaining power. As a result, the overall efficiency of the state-controlled airport groups has improved.
4.2. Airline Dominance and Airport Efficiency
Table 9 shows that the estimate of airline dominance is significant after CEM, meaning that the larger the dominance of the largest carrier, the higher the airport efficiency. Hypothesis (H3) proposed that an airline’s share increase would have a positive impact on airport efficiency. The estimated coefficient of the dominant carrier is statistically significant (β = −0.000978, p < 0.01) after CEM. Thus, Hypothesis (H3) is supported.
Previous studies have suggested that increases in the number of airlines at an airport would lead to competition that would in turn improve airport efficiency [10,11]. Yet, it should be noted that at an airport in which a variety of diverse airlines compete for passengers and cargo, it is difficult to coordinate airport operations due to the grandfather rights that are widely accepted in the aviation industry. Coordination becomes easier with dominant carriers than with many airlines in a fragmented market. For instance, airport slots have significant commercial value for both airlines and airports and must be well coordinated and allocated to exploit maximum levels of traffic and commercial opportunities. Airports can be very flexible in coordinating slots where there are only a limited number of dominant carriers. However, if the airport serves a variety of airlines with different interests and markets vested with grandfather rights, it becomes more challenging to coordinate the slots to maximize passenger and cargo traffic.
As a method of coping with the growing financial pressure from stakeholders, airports tend to increase partnerships with a particular airline, typically the dominant carrier, which facilitates the dominance of the largest carrier at an airport. This practice makes efficient use of airport resources, including slots, gates, counters, terminals, and hangers. Furthermore, different patterns of airport–airline cooperation have emerged in recent years, promoting the dominance of the largest carrier. For example, since concession revenue is increasingly important, airports and airlines now use various agreements to internalize the positive demand externality between aviation services and concession services [9].
Table 10 shows the results of the two-step regression analysis that measured the relationship between explanatory variables, including airline dominance (the market share of the largest airline at an airport) and airport efficiency scores. Model 1 is the result of a regression analysis only for control variables, and Model 2 is the result of a regression analysis of group airports for explanatory variables, including airline dominance (market share of the largest airline at an airport). Model 3 is the result of a regression analysis of standalone airports for explanatory variables such as the dominance of an airline (market share of the largest airline at an airport). As seen in Model 2, the relationship between airline dominance and group airports is shown to be very significant. In contrast, Model 3 shows that the relationship between airline dominance and standalone airports is insignificant.
Therefore, Hypothesis (H3) is supported. Airline market dominance is strengthened at group airports rather than at standalone airports.
The results correspond to the suggestion that, while coordination improves the operational efficiency of the combined airport group, it reduces competition not only between airports in the region but also downstream from the airline markets [9]. There is a greater possibility of enhanced coordination between group airports than with standalone airports. This enhanced coordination reduces competition downstream from the airline market. With the reduced competition between airlines, airports better utilize airport resources such as slots, gates, and terminal facilities in partnership with dominant carriers. Consequently, airline market dominance becomes stronger at group airports than at standalone airports.
Standalone airports also seek close cooperation with airlines to raise efficiency. Yet it is difficult for them to offer coordinated services with other airports. Rather, they have greater exposure to competition with airports sharing overlapped catchment areas and markets.
5. Discussion
This paper analyzed the effects of airport managerial type (group vs. standalone) and airline market structure on airport efficiency by using DEA, CEM, and Tobit regression. It also examined whether the market share of the largest airlines differed depending on the airport managerial type. First, it was determined that group airports were more efficient than standalone airports, and it was also verified that the market share of the largest airlines had a positive effect on enhancing airport efficiency. In addition, the market share of the largest airlines was found to be higher at group airports than at standalone airports.
This paper attempted to apply a matching technique, unlike most existing studies on efficiency, in testing the hypotheses. This was carried out to reduce the model dependence of the analysis through controlling the confounding effects of pre-treatment control variables in the observational data.
As a factor influencing the efficiency of airports, this study highlighted group airports from a new perspective. In previous studies, it was argued that standalone airports were more efficient [6,7], but this study demonstrated that group airports were more efficient. It can be assumed that centralized management and bigger bargaining enjoyed by airport groups play a part in enhancing efficiency. In addition, this paper showed that the relationship between the market share of the largest airlines and airport efficiency differed from the results in previous studies. That is, previous studies showed that the market share of the largest airlines had negative or inverse U-shaped relationships with airport efficiency, but this study demonstrated that as the market share of the largest airline increased, airport efficiency also increased. It was also found for the first time that the share of the largest airlines could be higher at group airports than at standalone airports.
This paper offers practical guidelines to governments and airport authorities by suggesting that efficiency can be improved if multiple standalone airports are operated as a group through mergers and acquisitions or through the establishment of airport operation agencies. It also shows that when greater cooperation between airports and airlines becomes necessary due to the unprecedented challenges of global crises like COVID 19, the increase in airline market share through airport–airline cooperation has a positive impact on airport efficiency.
This paper did not evaluate the possible differences in efficiency between airport groups with member airports with different scales. Even if two airport groups operate the same number of airports, the efficiency of the airport groups will inevitably differ if the airports under their scope are significantly different in traffic volume. Therefore, in future research, it will be necessary to empirically study how the efficiency of airport groups can change according to the concentration of each airport group.
Author Contributions
Conceptualization, J.H.P. and J.H.K.; methodology, J.H.P. and J.H.K.; software, J.H.K.; validation, J.H.K.; formal analysis, J.H.P. and J.H.K.; investigation, J.H.P. and J.H.K.; resources, J.H.P.; data curation, J.H.P.; writing—original draft preparation, J.H.P.; writing—review and editing, J.H.K.; supervision, J.H.K.; project administration, J.H.P. All authors have read and agreed to the published version of the manuscript.
Funding
This research received no external funding.
Institutional Review Board Statement
Not applicable.
Informed Consent Statement
Not applicable.
Data Availability Statement
Data presented in this study is available through purchase of the Airport Benchmarking Report of the Air Transport Research Society (ATRS) and the license for the Database of the Center for Aviation (CAPA).
Conflicts of Interest
The authors declare no conflict of interest.
References
- Assaf, A.G.; Gillen, D.; Tsionas, E.G. Understanding relative efficiency among airports: A general dynamic model for distinguishing technical and allocative efficiency. Transp. Res. Part B Methodol. 2014, 70, 18–34. [Google Scholar] [CrossRef]
- Charnes, A.; Cooper, W.W.; Rhodes, E. Measuring the efficiency of decision making units. Eur. J. Oper. Res. 1978, 2, 429–444. [Google Scholar] [CrossRef]
- Fragoudaki, A.; Giokas, D.; Glyptou, K. Efficiency and productivity changes in Greek airports during the crisis years 2010–2014. J. Air Transp. Manag. 2016, 57, 306–315. [Google Scholar] [CrossRef]
- Lai, P.; Potter, A.T.; Beynon, M.J.; Beresford, A.K.C. Evaluating the efficiency performance of airports using an integrated AHP/DEA-AR technique. Transp. Policy 2015, 42, 75–85. [Google Scholar] [CrossRef]
- Gillen, D.; Lall, A. Developing measures of airport productivity and performance: An application of data envelopment analysis. Transp. Res. Part E: Logist. Transp. Rev. 1997, 33, 261–273. [Google Scholar] [CrossRef]
- Adler, N.; Ülkü, T.; Yazhemsky, E. Small regional airport sustainability: Lessons from benchmarking. J. Air Transp. Manag. 2013, 33, 22–31. [Google Scholar] [CrossRef]
- Ferreira, D.C.; Marques, R.C.; Pedro, M.I. Comparing efficiency of holding business model and individual management model of airports. J. Air Transp. Manag. 2016, 57, 168–183. [Google Scholar] [CrossRef]
- Yoo, S.-C.; Meng, J.; Lim, S. An analysis of the performance of global major airports using two-stage network DEA model. J. Korean Soc. Qual. Manag. 2017, 45, 65–92. [Google Scholar] [CrossRef] [Green Version]
- Oum, T.H.; Fu, X. Impacts of airports on airline competition: Focus on airport performance and airport-airline vertical relations. Int. Transp. Forum 2008, 13, 123–137. [Google Scholar]
- Chang, Y.-C.; Yu, M.-M.; Chen, P.-C. Evaluating the performance of Chinese airports. J. Air Transp. Manag. 2013, 31, 19–21. [Google Scholar] [CrossRef]
- Ha, H.-K.; Wan, Y.; Yoshida, Y.; Zhang, A. Airline market structure and airport efficiency: Evidence from major Northeast Asian airports. J. Air Transp. Manag. 2013, 33, 32–42. [Google Scholar] [CrossRef]
- Pasaribu, B.I.; Afrianti, A.; Gumilar, G.; Rizanti, H.; Rohajawati, S. Knowledge Transfer: A Conceptual Model and Facilitating Feature in Start-up Business. Procedia Comput. Sci. 2017, 116, 259–266. [Google Scholar] [CrossRef]
- Lahti, R.K.; Beyerlein, M.M. Knowledge transfer and management consulting: A look at “the firm”. Vez. Manag. Bus. J. 2000, 31, 91–99. [Google Scholar] [CrossRef] [Green Version]
- Argote, L.; Ingram, P. Knowledge Transfer: A Basis for Competitive Advantage in Firms. Organ. Behav. Hum. Decis. Process. 2000, 82, 150–169. [Google Scholar] [CrossRef] [Green Version]
- Kogut, B.; Zander, U. Knowledge of the Firm and the Evolutionary Theory of the Multinational Corporation. J. Int. Bus. Stud. 1993, 24, 625–645. [Google Scholar] [CrossRef] [Green Version]
- Darr, E.D.; Argote, L.; Epple, D. The Acquisition, Transfer, and Depreciation of Knowledge in Service Organizations: Productivity in Franchises. Manag. Sci. 1995, 41, 1750–1762. [Google Scholar] [CrossRef] [Green Version]
- Fageda, X.; Voltes-Dorta, A. Efficiency and Profitability of Spanish Airports: A Composite Nonstandard Profit Function Approach; Universitat de Barcelona: Barcelona, Spain, 2012. [Google Scholar]
- Francis, G.; Humphreys, I.; Fry, J. The benchmarking of airport performance. J. Air Transp. Manag. 2002, 8, 239–247. [Google Scholar] [CrossRef]
- Müller, J.; Niemeier, H.M.; Adler, N. Comparative Study (Benchmarking) on the Efficiency of Avinors Airport Operations; Norwegian Ministry of Transport and Communication: Berlin, Germay, 2012. [Google Scholar]
- Von Hippel, E. “Sticky Information” and the Locus of Problem Solving: Implications for Innovation. Manag. Sci. 1994, 40, 429–439. [Google Scholar] [CrossRef] [Green Version]
- Bitzan, J.D.; James, H.P. The Economics of Airport Operations (Advances in Airline Economics); Emerald Publishing Limited: Bingley, UK, 2017; Volume 6, pp. 1–14. [Google Scholar]
- Doganis, R. Airport Business; Routledge: London, UK; New York, NY, USA, 1992. [Google Scholar]
- ITF. Competitive Interaction between Airports, Airlines and High-Speed Rail. In Proceedings of the ITF Round Tables, Paris, France, 2–3 October 2008. [Google Scholar]
- Červinka, M. Small regional airport performance and Low cost carrier operations. Transp. Res. Procedia 2017, 28, 51–58. [Google Scholar] [CrossRef]
- Bölke, S. Strategic Marketing Approaches within Airline Management: How the Passenger Market Causes the Business Concepts of Full Service Network Carriers, Low Cost Carriers, Regional Carriers and Leisure Carriers to Overlap; Anchor Academic Publishing: Hamburg, Germany, 2015. [Google Scholar]
- Borenstein, S. Hubs and High Fares: Dominance and Market Power in the U.S. Airline Industry. RAND J. Econ. 1989, 20, 344. [Google Scholar] [CrossRef]
- Fu, X.; Zhang, A. Effects of Airport Concession Revenue Sharing on Airline Competition and Social Welfare. J. Transp. Econ. Policy 2010, 44, 119–138. [Google Scholar]
- Forsyth, P.; Niemeier, H.-M.; Wolf, H. Airport alliances and mergers—Structural change in the airport industry? J. Air Transp. Manag. 2011, 17, 49–56. [Google Scholar] [CrossRef]
- Albers, S.; Koch, B.; Ruff, C. Strategic alliances between airlines and airports—theoretical assessment and practical evidence. J. Air Transp. Manag. 2005, 11, 49–58. [Google Scholar] [CrossRef]
- Banker, R.D.; Cooper, W.W.; Seiford, L.M.; Thrall, R.M.; Zhu, J. Returns to scale in different DEA models. Eur. J. Oper. Res. 2004, 154, 345–362. [Google Scholar] [CrossRef]
- Ülkü, T. A comparative efficiency analysis of Spanish and Turkish airports. J. Air Transp. Manag. 2015, 46, 56–68. [Google Scholar] [CrossRef]
- Örkcü, H.H.; Balıkçı, C.; Dogan, M.I.; Genç, A. An evaluation of the operational efficiency of turkish airports using data envelopment analysis and the Malmquist productivity index: 2009–2014 case. Transp. Policy 2016, 48, 92–104. [Google Scholar] [CrossRef]
- Oum, T.H.; Adler, N.; Yu, C. Privatization, corporatization, ownership forms and their effects on the performance of the world’s major airports. J. Air Transp. Manag. 2006, 12, 109–121. [Google Scholar] [CrossRef] [Green Version]
- Iacus, S.M.; King, G.; Porro, G. CEM: Software for Coarsened Exact Matching. J. Stat. Softw. 2009, 30, 1–27. [Google Scholar] [CrossRef] [Green Version]
- Heckman, J.J.; Vytlacil, E.J. Chapter 70 Econometric Evaluation of Social Programs, Part I: Causal Models, Structural Models and Econometric Policy Evaluation. Handb. Econom. 2007, 6, 4779–4874. [Google Scholar] [CrossRef]
- Kim, S. Understanding and Using the CEM Method; Focusing on the Effect of Public R&D Subsidies. Korean J. Econ. Stud. 2016, 64, 125–151. [Google Scholar]
- Qin, S. Comparing the Matching Properties of Coarsened Exact Matching, Propensity Score Matching, and Genetic Matching in a Nationwide Data and a Simulation Experiment; University of Georgia: Athens, GA, USA, 2011. [Google Scholar]
- Ho, D.E.; Imai, K.; King, G.; Stuart, E.A. Matching as Nonparametric Preprocessing for Reducing Model Dependence in Parametric Causal Inference. Political Anal. 2007, 15, 199–236. [Google Scholar] [CrossRef] [Green Version]
- Craig, S.; Airola, J.; Tipu, M. The Effect of Institutional form on Airport Governance Efficiency; Unpublished Manuscript; Department of Economics, University of Houston: Houston, TX, USA, 2005. [Google Scholar]
- Wanke, P.F. Efficiency of Brazil’s airports: Evidences from bootstrapped DEA and FDH estimates. J. Air Transp. Manag. 2012, 23, 47–53. [Google Scholar] [CrossRef]
Figure 1.
Average efficiency score.


Table 1.
Geographic distribution by management models of sample airports.
| Management Model | Region | Number of Airports |
|---|---|---|
| Group | Asia/pacific | 19 |
| Europe | 26 | |
| Subtotal | 45 | |
| Standalone | Asia/pacific | 34 |
| Europe | 45 | |
| Subtotal | 79 | |
| Total | 124 | |
Table 2.
Input and output variables derived from the literature review.
| Author | Sample Airports | Input Variables | Output Variables |
|---|---|---|---|
| [11] | 11 Northeast Asian airports | runway length terminal size number of employees | tonnage of the combined passengers and cargo |
| [31] | 41 Spanish airports 32 Turkish airports | staff costs operating costs total runway area | number of passengers air traffic movements tons of cargo commercial revenues |
| [7] | Total 145 airports: 51 in Europe 26 in Asia/Pacific 68 North America. | boarding gates (no.) employees (no.) total length of runways (m) other operational costs (V) | flight numbers passenger numbers |
| [39] | 52 US airports | governmental structure | number of flights number of passengers tonnage of cargo and mail |
| [3] | 39 Greek airports | runway length apron size passenger terminal size | aircraft movements passenger numbers tons of cargo |
| [40] | 65 Brazilian airports | number of landings and takeoffs | Passengers cargo and of mail. |
| [32] | 21 Turkish airports | number of runways, dimension of runway units (m), passenger terminal areas | number of flights passenger throughputs cargo throughputs |
Table 3.
Input and output variables for DEA analysis.
| Variable | Measure | Definition | |
|---|---|---|---|
| Input | Number of employees | In persons | Total number of employees of airport operator |
| Terminal size | Total area of passenger and cargo terminal | ||
| Number of gates | unit | Total number of gates for enplanement and deplanement | |
| Variable cost | USD | Variable cost per passenger | |
| Output | Passenger throughput | In persons | Number of annual passengers handled at airport |
| Cargo throughput | Ton | Tons of annual cargos handled at airport | |
| Net profit | Millions USD | Net profit/Total revenue | |
| Operating margin | Operating profit/Total revenue |
Table 4.
Summary of the statistics of input and output variables.
| Variable | Obs | Mean | Std. Dev. | Min | Max | |
|---|---|---|---|---|---|---|
| Input | Employees | 103 | 1547.592 | 2360.143 | 19 | 18,120 |
| Terminal size | 113 | 284,417.2 | 372,679.2 | 7257 | 2,122,474 | |
| Gates | 123 | 58.03252 | 47.14486 | 5 | 228 | |
| Variable costs | 97 | 11 | 7.026735 | 2 | 39 | |
| Output | Passengers | 123 | 24,849.06 | 22,237.48 | 973 | 95,786 |
| Cargo | 114 | 468,095.6 | 824,184.6 | 430 | 4,600,000 | |
| Net operating profit (millions) | 94 | 283.2185 | 390.405 | −27 | 2358 | |
| Operating income | 91 | 47.45055 | 17.02148 | 13 | 80.8 |
Table 5.
Variables for regression analysis.
| Variable | Definition | |
|---|---|---|
| Independent Variables | ||
| Managerial type | Group vs. standalone | If an airport is a group airport or standalone airport |
| Market power | Market share of dominant carrier | Passenger share of dominant carrier at an airport |
| Control Variables | ||
| Governance | State share | State share of an airport |
| Competition | Competition | If there exist other airports competing with the airport in question |
| Traffic share | International traffic share | International traffic share |
Table 6.
Descriptive statistics and correlations.
| Mean | S.D. | (1) | (2) | (3) | (4) | (5) | (6) | |
|---|---|---|---|---|---|---|---|---|
| (1) Airport efficiency | 1.037 | 0.044 | 1 | |||||
| (2) Ownership transfer | 0.496 | 0.5 | 0.052 | 1 | ||||
| (3) Intl pax share | 63.449 | 32.07 | 0.166 * | 0.024 | 1 | |||
| (4) Airport competition | 0.374 | 0.484 | −0.079 | 0.006 | 0.078 | 1 | ||
| (5) Group/Standalone | 0.363 | 0.481 | 0.090 | 0.023 | −0.135 * | 0.250 * | 1 | |
| (6) Dominant carriers | 40.194 | 17.07 | −0.021 | −0.015 | 0.047 | 0.080 | −0.008 | 1 |
Notes. * p < 0.05.
Table 7.
Matching summary of the CEM analysis.
| Number of units | Treated | Untreated |
|---|---|---|
| Total units | 208 | 116 |
| Matched | 60 | 46 |
| Unmatched | 148 | 70 |
| Total strata | 109 | |
| Matched strata | 20 | |
Table 8.
Variate imbalance.
| Variables | L1 |
|---|---|
| Multivariate | 0.26293996 |
| Ownership transfer | 2.8 × 10⁻¹⁷ |
| International passenger share | 0.04348 |
| Airport competition | 1.4 × 10⁻¹⁷ |
| Dominant carrier | 0.08489 |
Table 9.
OLS estimates on airport efficiency before and after CEM.
| VARIABLES | Before CEM | After CEM |
|---|---|---|
| Treated (0:standalone) 11:group | −0.00192 | −0.0189 *** |
| (0.00360) | (0.00667) | |
| Market share of dominant carrier | −0.00017 | −0.000978 *** |
| carriers | (0.00011) | (0.00026) |
| Intl pax share | 0.00016 *** | 0.00042 *** |
| (5.42 × 10⁻⁵) | (0.000101) | |
| Airport competition | −0.0119 *** | −0.0177 ** |
| (0.00360) | (0.00821) | |
| Ownership transfer | 0.0006 | −0.00299 |
| (0.0033) | (0.00724) | |
| Constant | 1.021 *** | 1.047 *** |
| (0.00586) | (0.0121) | |
| Observations | 324 | 106 |
| R-squared | 0.069 | 0.237 |
Note: *** p < 0.01, ** p < 0.05.
Table 10.
Regression results on efficiency scores.
| Variables | Model 1 | Model 2 | Model 3 |
|---|---|---|---|
| Airline dominance | −0.000423 *** | −0.000162 | |
| (0.000118) | (0.000158) | ||
| Ownership transfer | 0.000763 | −0.00103 | 3.34 × 10⁻⁵ |
| (0.00334) | (0.00393) | (0.00458) | |
| International pax share | 0.000148 *** | 0.000314 *** | 0.000131 * |
| (5.38 × 10⁻⁵) | (6.73 × 10⁻⁵) | (7.35 × 10⁻⁵) | |
| Airport competition | −0.0126 *** | 0.00865 ** | −0.0247 *** |
| (0.00347) | (0.00386) | (0.00524) | |
| Constant | 1.014 *** | 1.009 *** | 1.026 *** |
| (0.00438) | (0.00603) | (0.00848) | |
| Observations | 324 | 116 | 208 |
| R-squared | 0.060 | 0.212 | 0.106 |
*** p < 0.01, ** p < 0.05, * p < 0.1. (1) Standard errors in parentheses; (2) year dummy included.
Publisher’s Note: MDPI stays neutral with regard to jurisdictional claims in published maps and institutional affiliations. |
© 2021 by the authors. Licensee MDPI, Basel, Switzerland. This article is an open access article distributed under the terms and conditions of the Creative Commons Attribution (CC BY) license (http://creativecommons.org/licenses/by/4.0/).
Share and Cite
MDPI and ACS Style
Park, J.H.; Kim, J.H. The Impact of Airport Managerial Type and Airline Market Share on Airport Efficiency. Sustainability 2021, 13, 981. https://0-doi-org.brum.beds.ac.uk/10.3390/su13020981
AMA Style
Park JH, Kim JH. The Impact of Airport Managerial Type and Airline Market Share on Airport Efficiency. Sustainability. 2021; 13(2):981. https://0-doi-org.brum.beds.ac.uk/10.3390/su13020981
Chicago/Turabian StylePark, Jae Hee, and Ji Hee Kim. 2021. "The Impact of Airport Managerial Type and Airline Market Share on Airport Efficiency" Sustainability 13, no. 2: 981. https://0-doi-org.brum.beds.ac.uk/10.3390/su13020981
Note that from the first issue of 2016, this journal uses article numbers instead of page numbers. See further details here.