The Impact of China’s Tightening Environmental Regulations on International Waste Trade and Logistics


1
Japan Maritime Center, Tokyo 102-0083, Japan
2
Faculty of Commerce, Takushoku University, Tokyo 113-8656, Japan
*
Author to whom correspondence should be addressed.
Sustainability 2021, 13(2), 987; https://0-doi-org.brum.beds.ac.uk/10.3390/su13020987
Submission received: 16 November 2020
/
Revised: 17 January 2021
/
Accepted: 18 January 2021
/
Published: 19 January 2021
(This article belongs to the Special Issue Global and International Logistics)
Abstract
:In recent years, China’s influence as the dominant importer of waste products has reshaped global waste trade through restrictive programs such as Operation Green Fence in 2013 and National Sword in 2017. These restrictions have greatly affected not only China’s import of waste products but also the international trade and global logistics of these products. China’s import restrictions in 2017 decreased the country’s import of waste plastic by 92% and used paper by 56%. It also increased the unit value of these two categories of waste by 27% and 13%, respectively, showing an improvement in the quality of imported waste. Most of these impacts originate from intensive margins. The restrictions diverted the flow of waste mostly to the low- and middle-income countries of the East Asian and Pacific regions along with Europe and Central Asia, as their imports increased by 161% and 266% for waste plastic and 101% and 77% for used paper, respectively. Compared with Operation Green Fence, the impact of the 2017 National Sword has been much higher, with shipping companies faced with a lack of products on backhaul routes and forced to change their longstanding practices.
1. Introduction
The global trade of waste and scrap has increased rapidly since the 1990s, and most of it flows into developing countries [1]. The argument for “buying” waste is that it is relatively cheaper than primary material and easier to access in a situation of limited resources and technological ability [2,3]. The argument for “selling” waste is to skirt stringent regulations on waste disposal by exporting it to countries with lax environmental regulations, the so-called waste haven hypothesis proposed by Baggs [4] and Kellenberg [5]. This should not be confused with the pollution haven hypothesis [6], which emphasizes the relocation of pollution-intensive manufacturing sectors to countries with less stringent environmental policies. China as well as other developing countries fit right into this narrative. China is the world’s largest importer of solid waste, accounting for around 40% of the world’s imports of plastic waste and used paper in 2018 [7]. The logistics industry also benefits from the global waste trade by using (backhaul) empty containers to carry low-value products including waste plastic, and uses paper on their return haul, earning additional revenue [8].
While China utilizes waste as a relatively cheap input for production to meet domestic and export demand, it simultaneously suffers from poor management of waste and rampant waste smuggling [9]. Jambeck et al. [10] estimate that China produces 8.82 million metric tons of waste plastic per year, and 76% of the waste is mismanaged. Illegal imports of hazardous waste also contribute to waste mismanagement in China. Consequently, the country started regulating solid waste imports with policies such as Operation Green Fence (OGF) of 2013 and the recent National Sword of 2017 that banned the import of several types of solid waste.
OGF was an enforcement campaign that ran from February 2013 to November 2013 with the objectives of stopping the illegal hazardous-waste trade and increasing the quality of imported waste via stricter inspections. During this period, “nearly every container” arriving in China was inspected [11]. Shipments with higher contamination than the permissible 1.5% of their weight were rejected [9]. However, as we will show later, the impact of OGF was short-lived.
National Sword was launched in February 2017 to stop “foreign garbage” from flooding the country [12]. As part of this program, every container of waste plastic and paper entering the country was checked from March 2017 to November 2017. China notified the World Trade Organization (WTO) in July 2017 about the ban on the import of 24 kinds of solid waste by the end of 2017. This included plastic waste (all four kinds of class HS3915) and unsorted used paper (HS470790) [12]. It was planned that other solid waste that can be replaced by local resources would have been gradually phased out by the end of 2019. The limit for contaminated waste is 0.5%, which is much lower than that of OGF. As these measures were abruptly introduced, they disrupted the recycling industry and global waste trade.
Blue Sky 2018 ran from March 2018 to December 2018 as a continuation of the National Sword policy, to monitor the import ban and prevent waste smuggling. These policies show that China’s government is strongly committed to reducing waste inflows into the country. In April 2020, China approved a revision to its solid waste management policies, aiming at “gradually realizing zero imports of solid waste” [13].
While international trade in non-hazardous waste follows the rules governing goods trade (such as the WTO), hazardous waste is governed by the Basel Convention. According to the convention, countries may ban hazardous waste imports and exporters must honor the ban. In 2019, the convention was amended to include plastic waste in a legally binding framework, which clarified the conditions for plastic waste to be hazardous and banned from imports. The amendment takes effect from 1 January 2021 [14]. China’s justification for the ban was written in its notification to the WTO as: “we found that substantial amounts of dirty wastes or even hazardous wastes are mixed in the solid waste that can be used as raw materials. This polluted China’s environment seriously” [12]. Plastic waste from living sources and unsorted wastepaper were therefore banned, despite other member countries expressing concern over the ban.
In this paper, we revisit the impacts of China’s import restriction with a focus on plastic waste and used paper. There are two main reasons for focusing on these two types of waste. First, China’s imports of used papers and used plastics cover 50% and 51%, respectively, of the world’s total imports in 2016, which are much higher than those of minerals (10%) and textiles (13%), according to the authors’ calculation from the United Nation Comtrade database (we follow OECD’s definition of waste but only focus on China’s list of banned waste. The corresponding HS codes for these wastes are used papers [HS4707], used plastics [HS3915], minerals [HS2619, 2620], textiles [HS5103, 5104, 5502, 5505, and 6310]). Second, these two types of waste have been transported by containers to utilize empty containers being repositioned from main haul routes [8]. According to the authors’ calculation based on the IHS Markit database, plastics and papers account for 68% and 24% of China’s total seaborne trade (due to product classification of IHS Markit database, we cannot distinguish between virgin materials and recycled materials. However, both are possibly transported in the same manner). For container trade, these two wastes account for 52% and 15%, respectively, much higher than minerals (0.2%) and textiles (4%). More data allow us to better evaluate the impact of National Sword on China’s waste imports. We found that while China’s import volumes of waste plastic (HS3915) and used paper (HS4707) decreased by 92% and 56%, respectively, their weighted mean unit values of China’s imports rose by 34.5% and 13.1%, respectively. We also observe the diversion of waste flow from China to other countries, mostly in East Asia and the Pacific region, Europe, and Central and South Asia (excluding high-income countries). When the two types of waste are compared, the impacts are more significant for waste plastic due to the stricter regulations in China. However, China will likely continue to reduce import license permits on used paper. Thus, a more persistent and greater impact is expected in the future.
The remainder of this paper is organized as follows. In the next section, we review the current literature and present theoretical frameworks. Section 3 describes the data and methodology. Section 4 discusses the impact of regulations on China’s waste imports, trade diversion to other regions, and the impact on the shipping industry. Section 5 concludes.
2. Literature Review
There have been several studies on the impact of OGF and National Sword on the international waste trade. Balkevicius, Sanctuary, and Zvirblyte [9] studied the effects of OGF on imports of all forms of waste (metal, plastic, used paper, rubber, and textiles). They showed that trade flows of low-quality waste from developed countries into China decreased and were diverted to other developing countries, regardless of the stringency of the host countries’ environmental regulations. Similarly, Sun [15] compared China’s imports of waste and non-waste and found a 9.48% decrease in imports of waste material and a 7.8% decrease in the import price after OGF was implemented. Brooks, Wang, and Jambeck [16] used historical data to estimate that 111 million tons of plastic waste would be displaced due to OGF. Wang et al. [17] outlined the impact of the ban on plastic waste imports on other countries’ policies. The ban has incentivized waste exporters such as Europe, the USA, and Japan to adopt more restrictions on the use of plastic packaging, utensils, and straws, and to improve the production of alternative materials. Since some trade was hastily shifted to China’s neighboring countries, India, Vietnam, Thailand, and others have announced restrictions on solid waste imports as well. Huang et al. [18] used an input-output model to analyze the impacts of the waste plastic ban. Sectors that accounted for substantial portions of China’s plastic waste imports, such as construction (30.6%) and electrical and machinery (12.9%), would be affected significantly. Similarly, Canada, Australia, Japan, and South Korea, which export most of their plastic waste to China, would also be impacted. Wang et al. [19] used network analysis tools to portray the development of the global waste plastic trade.
Our study relates to the literature on international trade in recycled materials and waste management. Baggs [4] showed that the amount of waste trade depends on exporters’ and importers’ income and trade cost, which resembles the literature of goods trade in general [20]. Kellenberg [5] showed that waste trade also depends on the gap between exporters’ and importers’ incomes, their recycling productivities, and the stringency of environmental regulations. In addition, he showed that countries with higher income per capita often have higher recycling productivities and stricter environmental regulations. More importantly, both these papers show that waste flows from countries with stricter environmental regulations (and higher income per capita) to countries with less stringent regulations (and lower income per capita). In terms of recycling productivity, Berglund and Söderholm [21] investigated the case of recycled papers during the period 1990–1996 and showed that wastepaper recovery rate and utilization rates depend on both economic and political factors and that rich countries often have higher recovery rates. Van Beukering and Bouman [22] also show that developing countries utilize wastepaper more and developed countries recover them more. In the case of plastic waste, mismanagement has become a huge threat to the environment. Jambeck et al. [10] showed that this problem is more serious in countries with larger populations, many of which are developing countries. Therefore, we divide our samples into two groups of high-income and low-income countries and expect that most of the waste flow to China is from high-income countries. We also expect that trade divergence will more likely go to low-income countries.
This paper also relates to the literature on trade policy. Although the targets of OGF are illegal waste, its stricter inspection policy acts as a technical standard to improve import quality. Contrarily, National Sword imposes quotas on sorted used paper and a ban on plastic waste and unsorted wastepaper, which targets import quantity. The impact of quotas resembles that of tariffs, that is, to reduce import quantities and increase domestic prices (and reduce exporter prices when the importer is a large country) [23]. Similarly, technical standards increase costs of production, which shift the supply curve, reduce import quantities, and increase domestic prices [24,25]. Contrarily, in the case of technical standards, the demand side may change due to a shift in consumer preference toward higher-quality products, so that technical standards can increase quantities and prices [26]. However, in the specific case of recyclable waste, it is not the consumers of final goods but the intermediate producers that affect the demand for imported waste. Technical standards also affect the extensive margin and duration of trade [25]. On the exporters’ side, it is more likely that developed countries export higher quality (with higher price) products and to more destinations [26]. From these arguments, we expect that both OGF and National Sword reduce the import quantity to China. In terms of price, we can observe a price increase, if an improvement in quality dominates the drop in exporter prices and vice versa.
Our paper also relates to the literature on container shipping under the effect of trade imbalances. Since the late 1990s, there has been an upward trend in trade imbalances in Transpacific and Far East–Europe routes due to the change in the global production network [27,28]. It is important to make a distinction between trade deficit and imbalances, where the first refers to the net value between export and import and the latter refers to the net quantity (often measured in twenty-foot equivalent units [TEUs]) between main haul and backhaul routes. Imbalances incur costs of repositioning ships for shipping companies [28,29]. Rodrigue [29] estimated that the repositioning cost paid by shipping companies amounted to about 16 billion USD or 15% of container management costs. Further, the Boston Consulting Group pointed out that 5–8% of the operating expenses of container carriers are repositioning expenses, and the burden on the shipping industry is 15–20 USD [30]. To offset these costs, shipping companies have filled empty containers on backhaul routes with wastes and cheap materials [8]. A drop in China’s import of these wastes will increase the gap between the main haul and backhaul, all else being equal.
Our study contributes to the literature in the following points. First, we are the first to discuss the extensive margin of trade for both plastic waste and used papers in the context of China’s import bans. Second, we are the first to discuss the potential effects of these regulations on the shipping industry in the context of trade imbalances. We have three main research questions. First, what is the impact of China’s waste import restrictions on China’s import quantities and prices? Second, what is the impact on other countries’ imports? Third, what is the impact on the shipping industry? The next sections describe the data and methodology to answer these questions.
3. Data and Methodology
We use data from the United Nations Comtrade Database [7], which has international trade statistics of commodities up to the six-digit level of the HS classification. The data report figures for imports, exports, reexports, and reimports in quantity and value. We use this information to calculate the unit value for each triplet exporter-importer-commodity (six-digit level). To focus on the impact of OGF and National Sword, we report data from 2010 to 2019 for all countries and the six-digit level of two classes: HS4707 and HS3915. However, we only review exporters that consistently appear over the entire period. Since both programs lasted a year, we did not include 2013 and 2017 in calculating the difference before and after these programs. We use two years before and after the event instead of one to calculate the quantity change and weighted mean unit value.
There are few countries in the dataset that have a substantial portion of reexports. The most prominent is Hong Kong, where 99% of imported waste is re-exported to China. Some authors add Hong Kong waste imports to China’s waste imports [9]. Since we are interested in unit values, doing so would ignore the gap between Hong Kong’s import price and its export price for China. Although the trends of these two prices are similar, the difference in size causes inaccuracy in aggregating prices for groups of commodities and groups of countries. Thus, we excluded Hong Kong from our dataset. We calculated another version that included Hong Kong and found that the results showed the same trend but were slightly different in magnitude.
We then aggregate quantity and unit value to a four-digit level and calculate the extensive changes (entry and exit) and intensive changes. We also confirm the intensive changes in quantity and unit value by running the two-sided and one-sided pairwise t-test for two samples of China’s imports from all available countries in the sample for two types of waste at the six-digit level. In the interest of brevity, we abstract the test results. In fact, only the change in quantities after National Sword is significantly different at 1%.
To aggregate unit value at region and/or four-digit level products, we use the share in quantity to calculate the weighted mean unit value. The change in weighted mean unit value can be divided into a change in price (given unchanged share) and a change in share (given unchanged price). We also report the margin of change, including exit, entry, and intensive. Exit (or entry) shows an increase (or decrease) in the number of a triplet exporter-importer-commodity (six-digit-level). Specifically, exit (entry) includes exporter-importer-commodity triplets that only exist before (after) the event. The intensive margin shows the change in quantity and price corresponding to a specific triplet exporter-importer-commodity (i.e., the triplet exists in the dataset before and after the event). The change in the unit value after the event is illustrated in the following equation:
where and are the weighted unit values of the commodity at the four-digit level after and before the event, respectively; and are the price of waste import of commodity k at the six-digit level from country i after and before the event. and are their respective import quantity shares, and and are the set of exporter-importer-commodity triplets after and before the event, respectively. Details of the calculation are presented in Appendix A.
It is quite straightforward to predict that the import quantity will decrease after the import ban, as explained in the previous section. However, the effect on the unit value is not as clear. Two major forces may affect the change in the unit value. A higher unit value shows a higher quality [9,25]. If the ban succeeds in preventing highly contaminated waste entry, we should expect a higher unit value after the policy. Even for waste without contamination, exporters will invest more in inspecting products before shipping to reduce the risk of rejection [11]. Alternatively, unit value can be interpreted as price, which is regulated by supply and demand forces. Since China is a large participant in the waste product market, its trade policies will affect the world’s waste market. A sudden import ban will cause an oversupply of waste in the world market, which would drive prices downward [23,24]. Sun [10] found this while examining the impact of OGF on China’s import price for waste.
In the case of used paper, the immediate effects of the ban are on unsorted wastepaper (HS470790). Other products of the same class are subjected to import licenses that are announced yearly. Between 2012 and 2019, these permits dropped by a third. The effect of permits resembles tariffs, which will reduce import volumes and increase import prices [23].
One may speculate that the impact of these regulations after 2017 may be mixed with the impact of the China-US trade conflict in late 2018 and early 2019. China’s demand for recyclable materials may decrease due to the slowdown of the economy because of this conflict. However, China’s growth in manufacturing investment doubled from 4.8% in 2017 to 9.5% in 2018, while its merchandise exports grew by 9.1% and inward foreign direct investment (FDI) increased by 21% [31]. Therefore, the decrease in China’s import of waste plastic and used paper more likely comes from the shock of National Sword in 2017 and its follow-up policies rather than the trade conflict.
4. Results and Discussion
4.1. The Impact of OGF and National Sword on Chinese Waste Imports
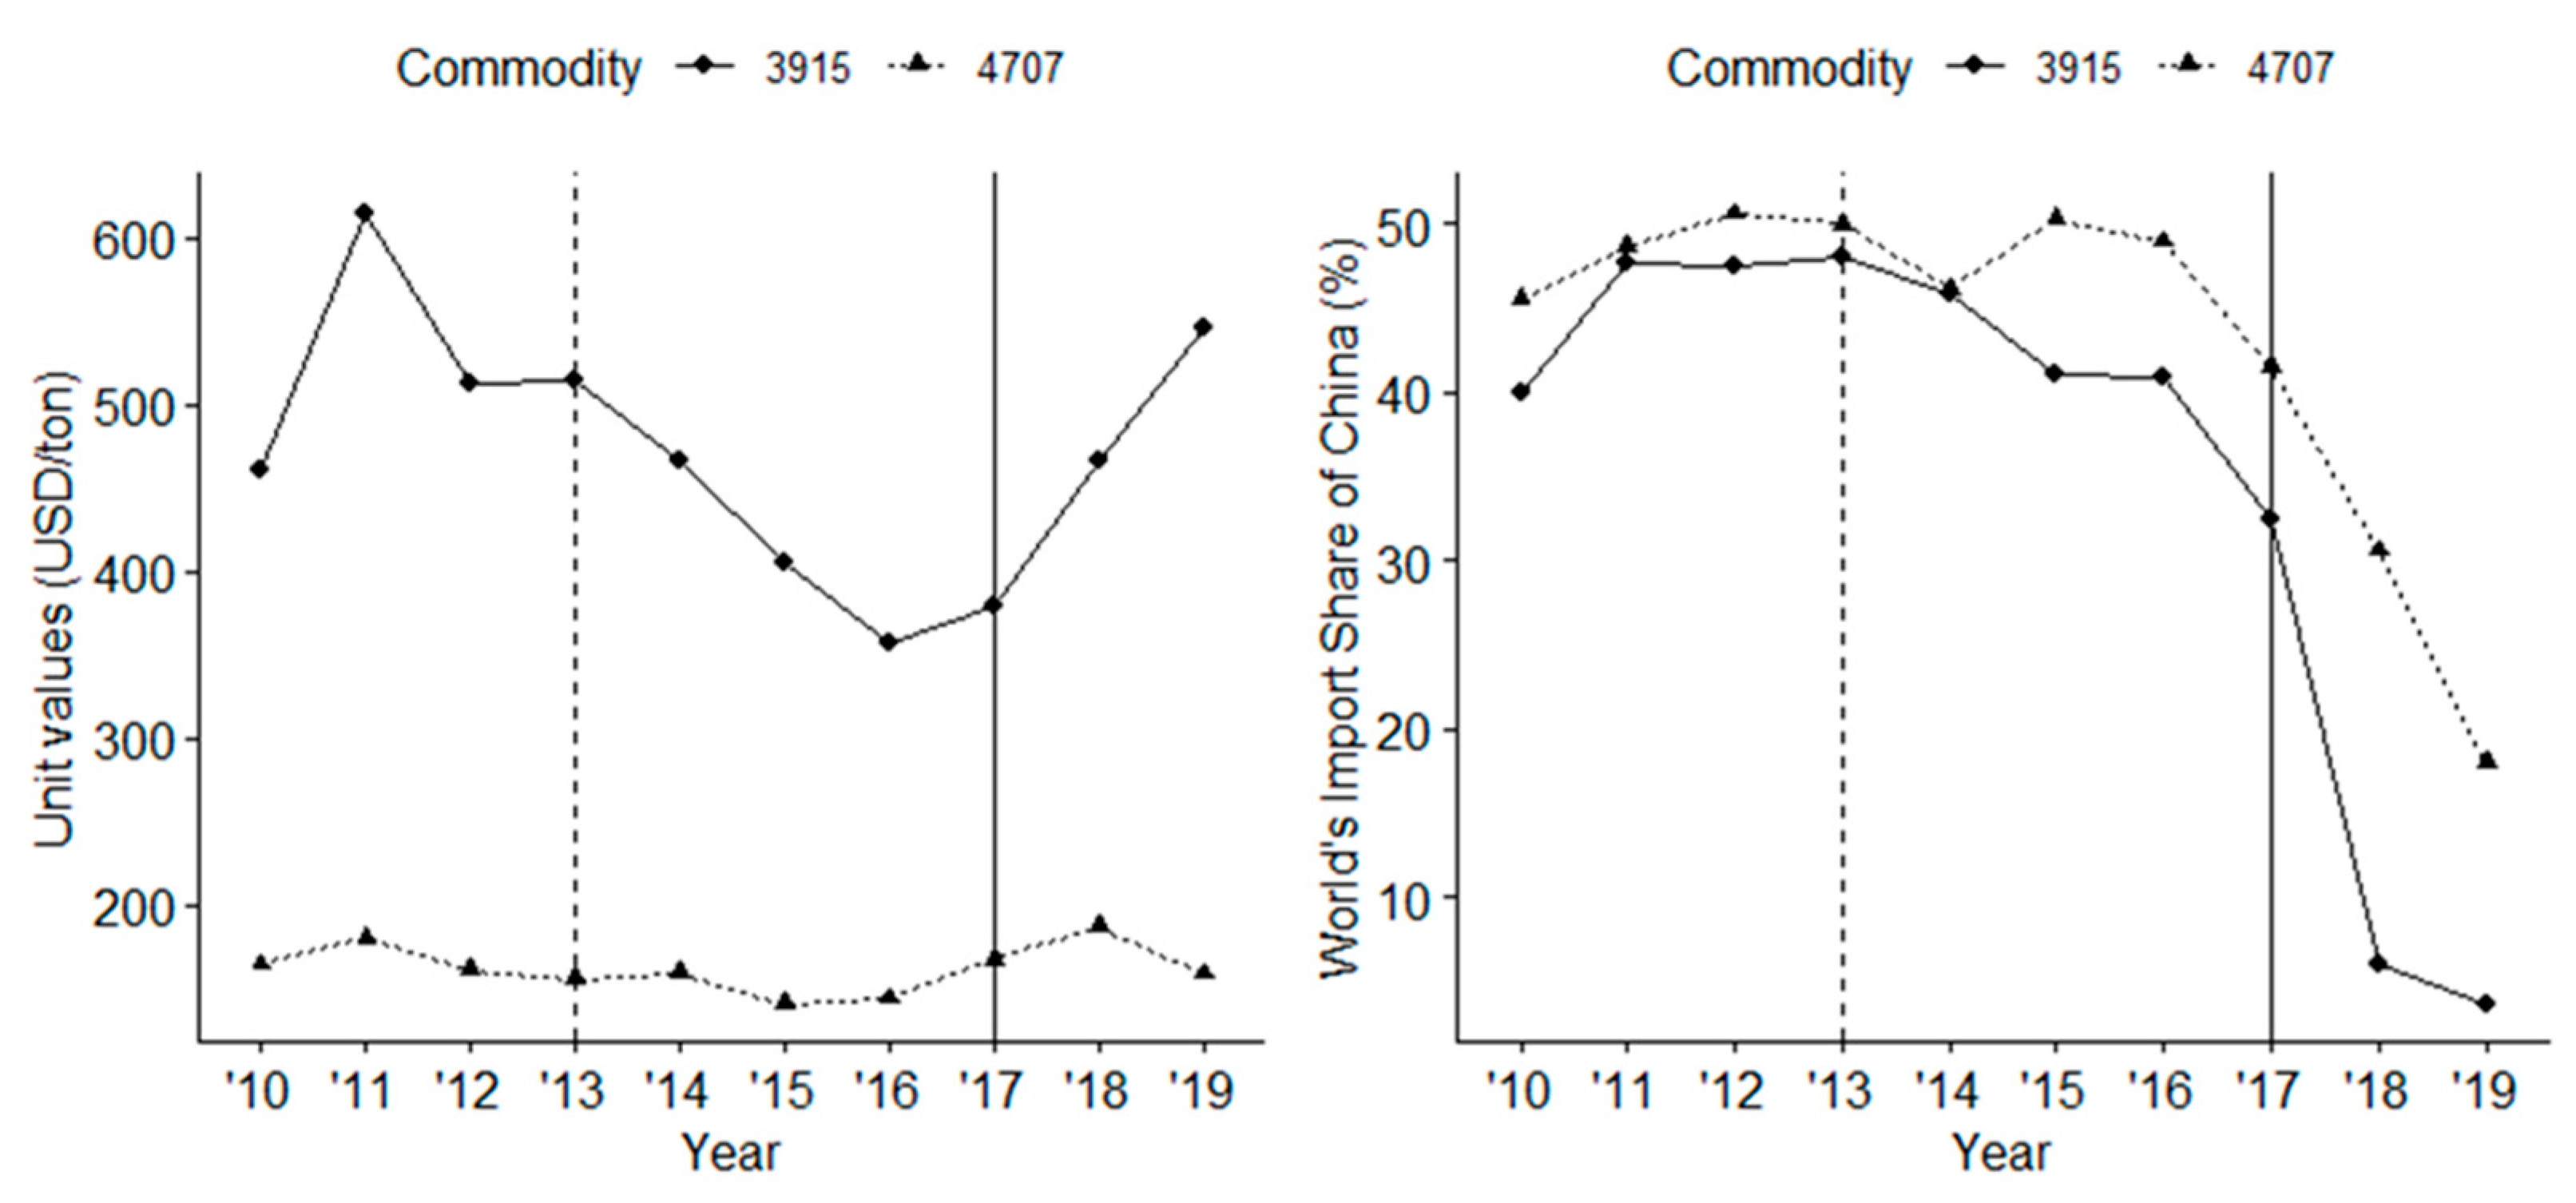
Figure 1 shows the overall trend of China’s waste imports from 2010 to 2019 in unit value and import share of waste plastic and used paper. From the right panel, for both types of waste, China’s import share has a declining trend from 2013 after OGF, but there is a sharper decrease in 2017 after National Sword. Table 1 shows that the import quantity of plastic waste and used paper decreased by 92% and 56%, respectively, after National Sword (2017). These are much steeper declines than the −7% and −9% experienced after OGF in 2013. In the left panel of Figure 1, the unit values of both types of waste decreased after OGF but increased after National Sword. As shown in Table 1, the percentage changes in the unit values of waste plastic and used paper are 27% and 13% (respectively) after National Sword, and −22% and −17% (respectively) after OGF. As argued before, a decrease in unit value indicates that the supply-demand adjustment force dominates the quality adjustment for OGF, which is in contrast with the case of National Sword. Notably, the magnitude of change in both quantity and unit value is much higher for plastic than that of used paper. This is because all types of plastic waste were banned while used paper trade was still allowed under restriction.
We also decompose the change in quantity into different margins, as shown in Table 1. In both events, OGF and National Sword, the intensive margin accounts for most of the changes. The only difference is for waste plastic after National Sword, where the exit margin accounts for a 3% decrease in import volume. However, in comparison to the total change, it only accounts for less than 0.05%. This implies that even with the ban in place, most countries maintain some level of exports to China, but with much less volume. Similarly, the changes in unit value come mostly from the intensive margin for both National Sword and OGF. However, the exit margin effect has become relatively larger for waste plastic after National Sword.
Furthermore, we can divide the change in aggregate unit value into pure change in unit value (given import share) and change in share (given unit value). In both events and for both types of waste, the change mostly comes from unit value change, rather than the change in the composition of import products and/or countries. Therefore, we can say that the increase in unit value after National Sword reflects an improvement in the quality of imported waste.
Table 2 shows the quantity and unit value change of the main exporting regions to China. Before 2017, for waste plastic, regions with high export shares were mostly high-income countries, except for low middle-income countries in East Asia and the Pacific region that are close to China. After 2017, all countries experienced a large decrease in import volumes. However, in terms of share, because the high-income countries from Europe, Central Asia, and East Asia and Pacific show a drastic drop, the export share of low- and middle-income countries near China increases. These may also reflect some shipments, which were re-routed from China to other South East Asian nations after the ban.
In terms of unit value change, all regions show an increase in unit value (given the unchanged share). For low- and middle-income countries in East Asia and the Pacific, the total change in unit value was quite high. This was due to a dramatic change in share, even though the unit value change (given unchanged share) is quite like other regions.
For used paper, exporters to China are more concentrated in high-income countries in three regions: North America, Europe, and Central Asia, and East Asia and Pacific. After the ban in 2017, exports from these regions to China dropped drastically in quantity but increased in the unit value. While the share of Europe and Central Asia decreases by five percentage points, the share of North America and East Asia and Pacific increases by two percentage points each. The unit value of Europe and Central Asia increased the least among the three regions. In fact, the import permits of used paper for North America in 2019 cover nearly half of China’s total permits, much higher than Japan and Europe. The increase in the unit value can be attributed to an increase in quality. In addition, it is also partly related to a surge in unit value (price) that occurred when buyers were rushing to purchase used papers to utilize the volumes available under their Chinese import permits [33]. As the other regions are low contributors to China’s total imports, their contribution to the percentage change in quantity is less than one percent.
4.2. The Trade Diversion Impact of OGF and National Sword
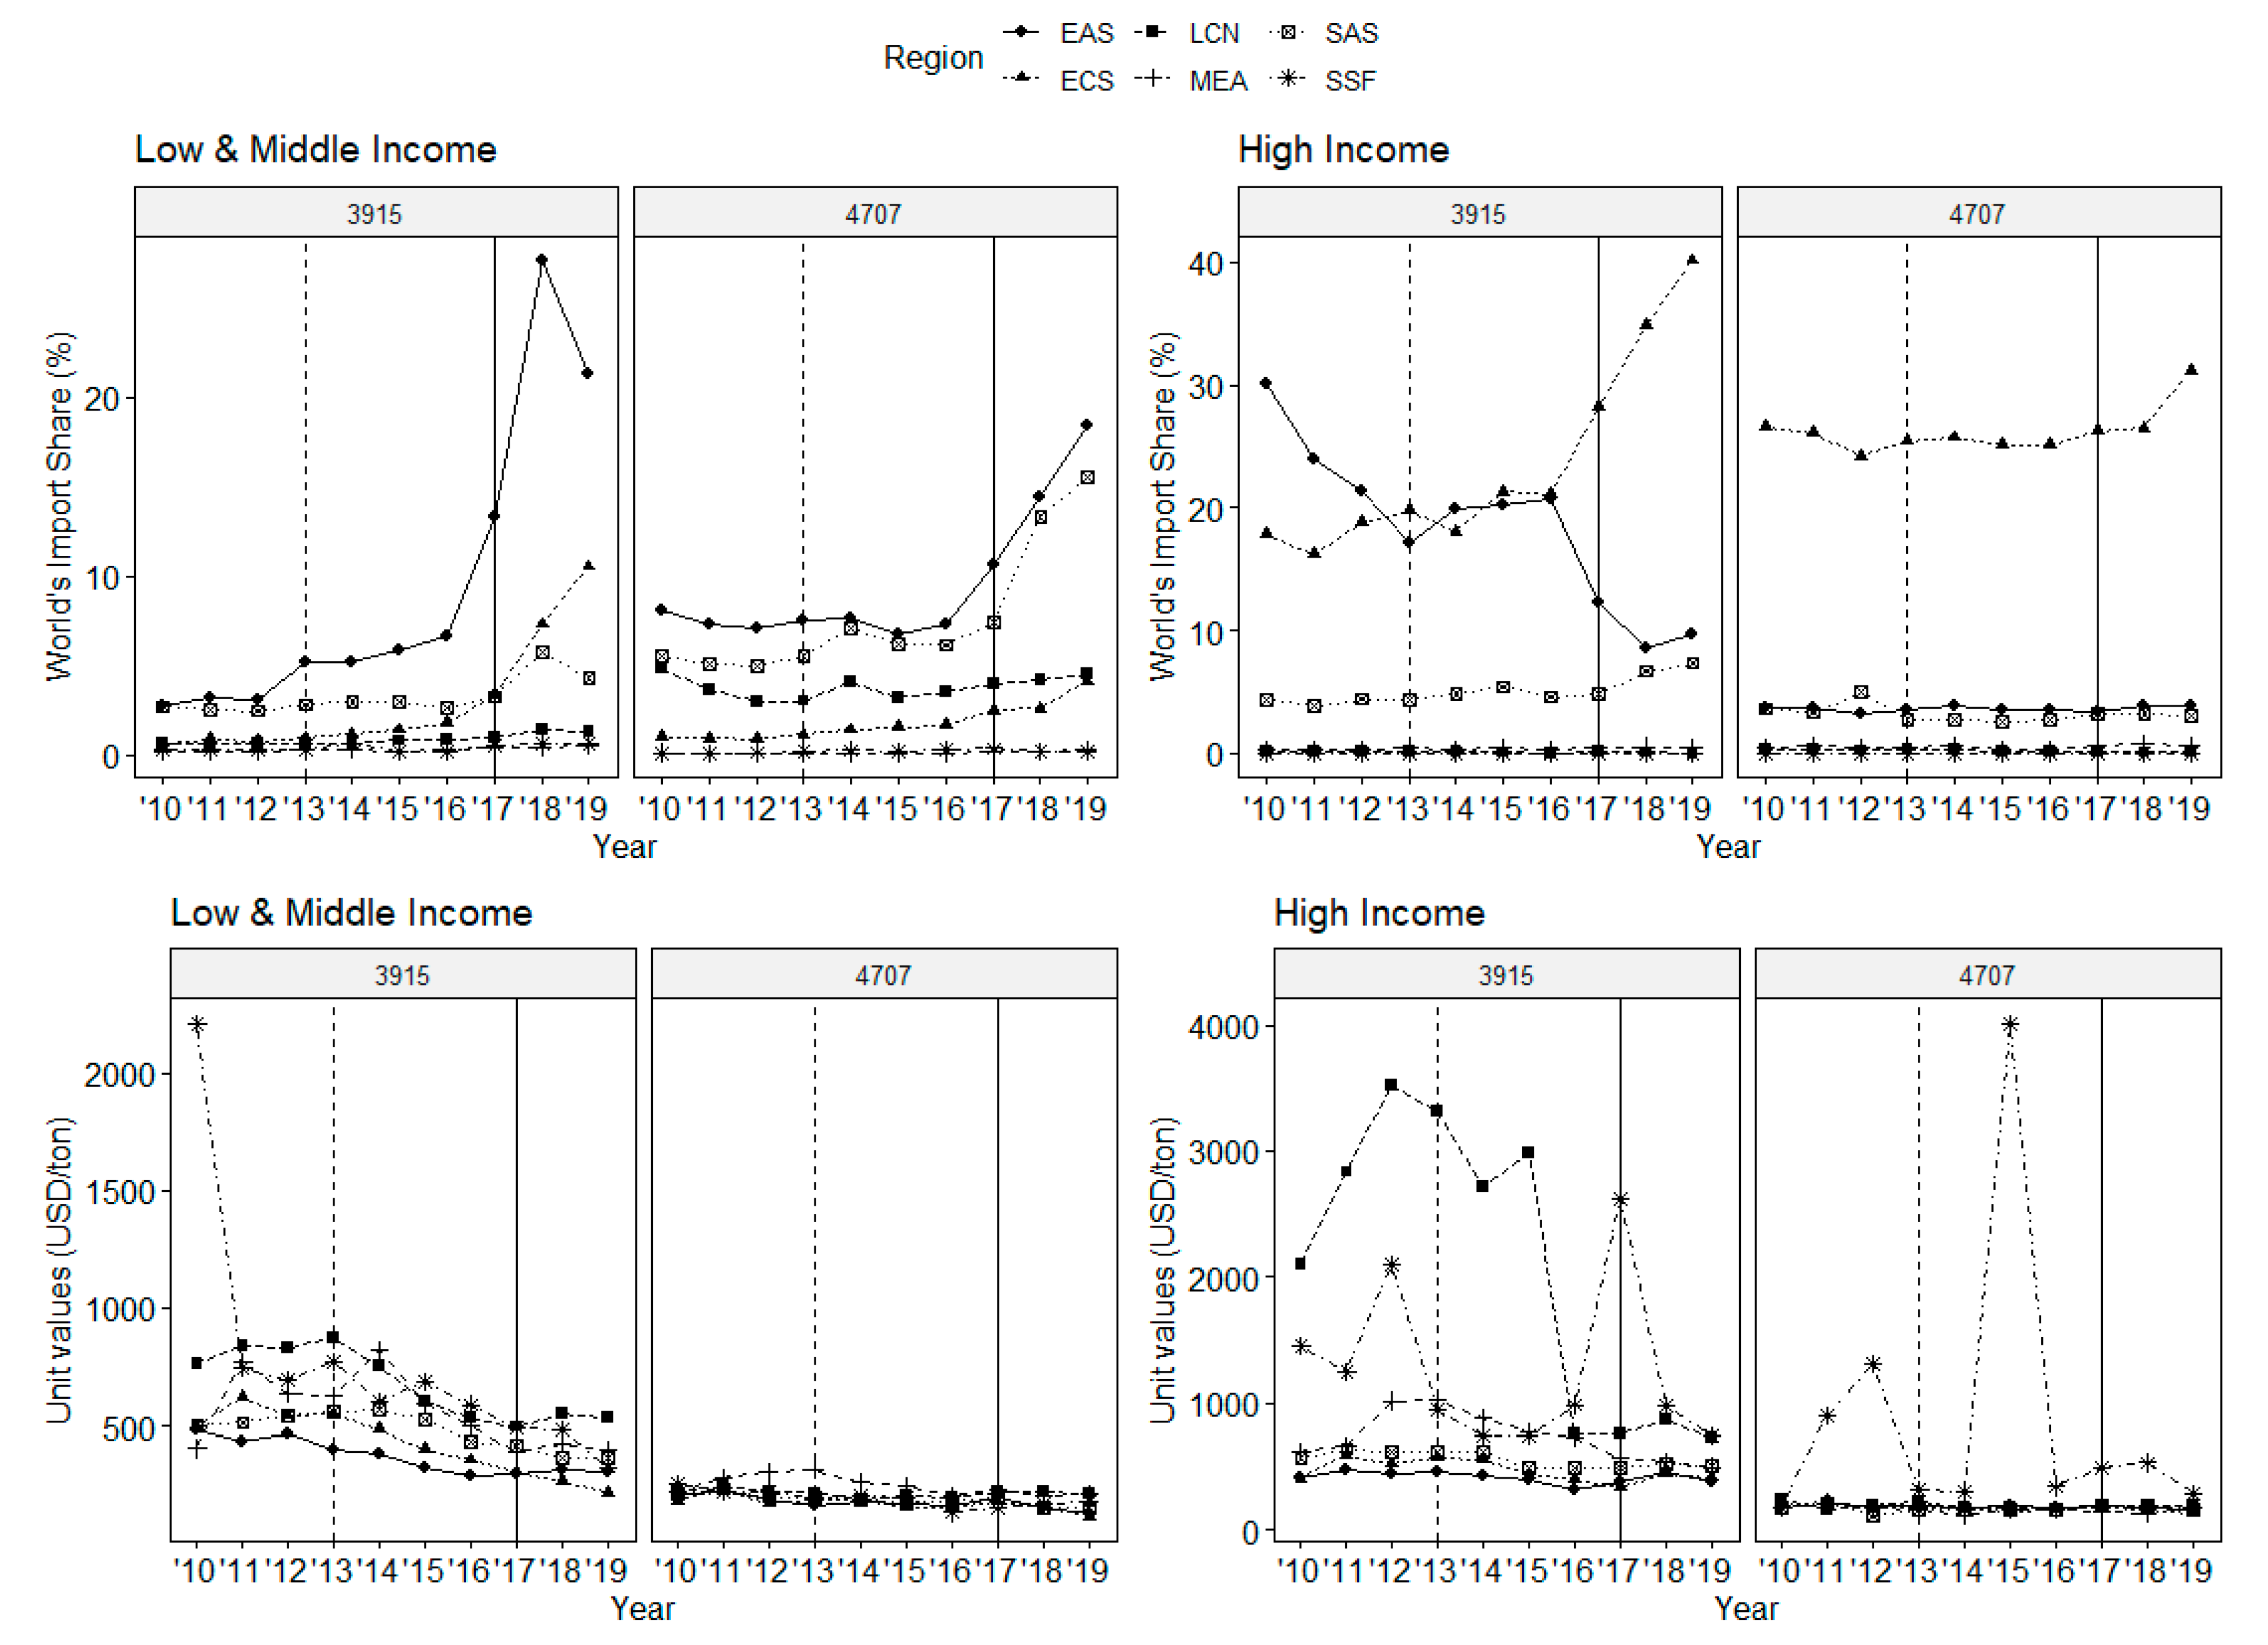
In this section, we examine the change in the total imports of regions other than China. As discussed, China’s share of global waste imports declined rapidly after National Sword. The question is, where does that share go? Figure 2 shows the trends in the shares of import volume of different regions as well as the unit value for the two types of waste. The upper panel reveals that the shares of low- and middle-income East Asia and Pacific region, low- and middle-income South Asia, and Europe and Central Asia increased rapidly after 2017. These changes are much more pronounced after National Sword than after OGF, except for South Asia.
As shown in Table 3, regions with the highest increase in shares after 2017 are the low- and middle-income East Asian and Pacific regions, and Europe and Central Asia, with changes of 161% and 266% for waste plastic and 101% and 77% for used paper. In addition, South Asia also experienced a significant increase in the import share of used paper after 2017. East Asia and the Pacific region, and South Asia are like China before the ban in terms of less stringent environmental policies and relatively low labor costs. They are also geographically close to China, which makes them an ideal alternative to China for rerouting the waste. However, the total import share of these regions before 2017 was much less than that of China (as in Figure 2). This indicates that they do not have enough recycling capacity to absorb the waste flow diverted from China. Many countries in these regions have an import ban on waste plastic, including India, Thailand, and Vietnam [34].
From Europe and Central Asia, Germany imported 4 million tons of used paper and 523 thousand tons of plastic waste, followed by the Netherlands (3 million tons and 425 thousand tons), Turkey (717 thousand tons and 399 thousand tons), and Poland (406 thousand tons and 207 thousand tons) in 2018. Except for Turkey, these high-income countries are more likely to have better waste management systems and more sophisticated disposal technology. These countries and Japan have passed laws to reduce plastic packaging and develop alternative materials [17]. However, these policies are expected to produce results in the long term rather than in the short term. In fact, many ports were crowded with waste container ships, as they did not meet the criteria of taking permission to unload. Some ships were sent back to the exporting countries despite high fuel and other costs [34].
The lower panel of Figure 2 shows the trend in the unit value for different regions. For waste plastic, both high-income and low-income countries show a declining trend from 2013 (except for the high-income category in 2017). This implies an oversupply in the world waste market due to China’s import ban. In terms of magnitude, the unit values of waste, in low- and middle-income and some high-income regions, are not vastly different, except for Latin America and the Caribbean (which include many tax haven countries like the Cayman or the British Virgin Islands with over-reporting of value).
4.3. Impact on Shipping Logistics
As China participates in the global trade network as the biggest exporter, container services between China and North America, China and Europe, and China and other East Asian countries are the most active. However, trade imbalances between these trading lines have become an issue for the shipping industry [27,28,29]. In 2019, the container flow from Asia to North America was 17.6 million TEUs, while the opposite flow was only 6.9 million TEUs (authors’ calculation from the Port Import/Export Reporting Service data). Similarly, from Asia to Europe, the main haul is 16.7 million TEUs and the backhaul is 8.2 million TEUs (authors’ calculation based on Container Trade Statistics [CTS] data). As shown in Table 4, these two routes have the highest imbalances. To cover the cost of the backhaul or return trip, shipping companies utilize empty containers for low-value products, such as waste plastic and used paper [8]. As discussed above, China’s import bans significantly reduced the flow of waste products into China, including those from its biggest export destinations, such as North America and Europe. This will result in a lower demand for transporting waste products to China. In comparison to 2017, the backhaul route from North America to the Far East decreased by 6.8% in 2019, while the main haul increased by 0.8%. Backhaul routes from Europe to the Far East increased by 4.2%, which was less than the increase of 5.4% in the main haul. Consequently, imbalances for these two routes increase by 6.4% and 6.5%, respectively. Other backhaul routes from the Far East also experienced a significant increase in imbalances and a decrease in backhaul or an increase in backhaul that is lower than the main haul.
Another problem that shipping companies face is the uncertainty of China’s policy and the risk of being rejected from entering China. In fact, apart from China, other South East Asian countries have also returned tons of waste plastic and wastepaper to the exporting countries. This is the so-called cargo abandonment, which the practitioners often try to avoid [8]. If the cargos were to be abandoned, they would have to pay an extra cost to bring them back and share some of the lost profit from the main haul cargo with the container shipping companies. Furthermore, when port calling is delayed or denied, they may be charged with demurrage cost, fuel cost, and operation cost. Thus, as of 31 August 2020, most of the shipping giants announced the suspension of transportation services for waste plastic and used paper. For example, for the year 2020, COSCO suspended services from 1 September, OOCL suspended services from 16 October, Yang Ming suspended services from 1 September, and HASCO and Wanhai suspended services after October.
Although the import ban affects the supply of waste transportation services to China, it is not likely to affect overall freight because the profit margin from providing backhaul services for low-value products is quite limited, and the revenue is often offset by the fuel cost [8].
The flow of trade and investment for alternative materials will also be affected. In addition, the lack of supply in waste plastic and used paper due to import restrictions will change the form of raw material procurement in China’s manufacturing industry. Waste plastic has been used as a material for construction and household goods manufacturing [18]. Recycled paper, among others, has been used to produce packing materials for e-commerce [35]. There has been an increase in the import of plastic raw materials as a substitute for waste plastic in recent years. For example, in the first five months of 2020, the container flow from North America to Asia (mostly China) for polymers of ethylene (HS3901) and polymers of propylene (HS3902) increased by 78% and 81%, respectively, when compared to the previous year. Chinese paper manufacturers have been increasingly moving into the US, Europe, and Southeast Asia because of the shortages in raw materials. This movement has two potential impacts. First, it is good for the environment to establish a system to process recyclable waste in countries where waste is generated. Second, there will be less movement of goods from the United States and Europe. Thus, a ban on importing waste plastics and used paper would lead to a change in logistics in China.
5. Conclusions
In this paper, we reviewed the literature on the impact of China’s import ban on waste plastic and used paper. The two direct impacts are the effect on China’s import volume and unit value, and the trade diversion to other countries. China’s import ban in 2017 has decreased the country’s import of waste plastic by 92% and used paper by 56%. It also increased the unit value of the two types of waste by 27% and 13%, indicating an improvement in the quality of imported waste. Most of these impacts come from the intensive margins. We also showed the contribution of different regions to the change in China’s imports. In line with the theory of waste trade flow, prior to the bans, high-income countries accounted for a lion’s share of China’s imports and experienced the highest drop in quantity after the bans. Imports from these countries also increased in the unit value. The flow of waste shifted from China to other countries, depending on the stringency of environmental regulations, types of waste, and geographical factors. The most affected region is the low-income East Asian and Pacific regions, which are close to China and often have lax regulations. These countries, however, have started to impose stricter regulations on their own. Some waste from Europe is flowing into high-income countries, such as Germany and the Netherlands. Even though these countries have strict regulations, they also have good waste management systems, so they can partly absorb diverted waste.
We compared the impact of OGF and National Sword and showed that the magnitude of the latter’s impact was much higher and may last longer. China’s restriction on waste imports is an ongoing program, and the Chinese government has expressed its commitment toward “Zero Waste” in its recent law revisions. Thus, we expect to see more products added to the ban list, which will have a greater impact on the international waste trade and shipping industry.
We summarize the effects on shipping logistics and suggest that, while the supply of backhaul services might be halted, it is not likely to affect the overall freight market. However, shipping companies may have to find diverse ways to address the backhaul problem. Some practices have been proposed, such as optimizing container logistics by unloading or loading in warehouses or distribution centers in the immediate hinterland of the relevant port [27] or containerizing bulk cargo [8] to improve demand and supply balances. These are ongoing efforts, and their effects would be an interesting subject for future research.
While the impact on trade and container shipping may seem negative in the short term, we expect a positive impact in the long run. Many countries have imposed stricter environmental regulations, and companies have moved toward greener production technology. Consumers have also been increasingly aware of their carbon footprints. Therefore, we expect a change in the global trade network that moves toward cleaner products, thereby creating more trade in the long run.
This study has some limitations. In our study, we have not used empirical methods, such as difference-in-difference or synthetic control methods, due to resource constraints. Thus, our results are mostly descriptive. We hope to resolve this limitation in our future research.
Author Contributions
Conceptualization, T.T. and H.G.; methodology, T.T.; validation, T.T., H.G. and T.M.; formal analysis, T.T.; investigation, T.T. and H.G.; resources, T.T., H.G. and T.M.; data curation, T.T. and H.G.; writing—original draft preparation, T.T. and H.G.; writing—review and editing, T.M. and T.T.; supervision, T.M.; project administration, T.M.; funding acquisition, T.M. All authors have read and agreed to the published version of the manuscript.
Funding
This work was supported by JSPS KAKENHI Grant Number JP 20H00286 and by Takushoku University Research Grant.
Institutional Review Board Statement
Not applicable.
Informed Consent Statement
Not applicable.
Data Availability Statement
Publicly available datasets were analyzed in this study. This data can be found here: https://comtrade.un.org/.
Acknowledgments
We would like to thank three anonymous reviewers for their comments on a previous version of the paper.
Conflicts of Interest
The authors declare no conflict of interest. The funders had no role in the design of the study; in the collection, analyses, or interpretation of data; in the writing of the manuscript, or in the decision to publish the results.
Appendix A

Table A1.
List of countries.
| High Income | Low & Middle Income | |
|---|---|---|
| East Asia & Pacific | Australia, Brunei Darussalam, French Polynesia, Japan, Korea Rep., New Caledonia, New Zealand, Singapore | Cambodia, Fiji, Indonesia, Lao PDR, Malaysia, Mongolia, Myanmar, Papua New Guinea, Philippines, Solomon Islands, Thailand, Vietnam |
| Europe & Central Asia | Austria, Belgium, Croatia, Cyprus, Czech Republic, Denmark, Estonia, Faroe Islands, Finland, France, Germany, Greece, Hungary, Ireland, Italy, Lithuania, Netherlands, Norway, Poland, Portugal, Romania, Slovak Republic, Slovenia, Spain, Sweden, Switzerland, United Kingdom | Albania, Belarus, Bulgaria, Russian Federation, Serbia, Turkey, Ukraine |
| Latin America & Caribbean | Antigua and Barbuda, The Bahamas, Barbados, Chile, Panama, Trinidad and Tobago, Uruguay | Argentina, Belize, Bolivia, Brazil, Colombia, Costa Rica, Cuba, Dominica, Dominican Republic, Ecuador, El Salvador, Guatemala, Guyana, Haiti, Honduras, Jamaica, Mexico, Nicaragua, Paraguay, Peru, St. Lucia, St. Vincent & the Grenadines, Suriname, Venezuela RB |
| Middle East & North Africa | Bahrain, Israel, Kuwait, Malta, Oman, Qatar, Saudi Arabia, United Arab Emirates | Algeria, Djibouti, Egypt Arab Rep., Iran Islamic Rep., Jordan, Lebanon, Morocco, Syrian Arab Republic, Tunisia, Yemen Rep. |
| North America | Canada, United States | |
| Sub-Saharan Africa | Mauritius | Cabo Verde, Cameroon, Congo Rep., Cote d’Ivoire, Ethiopia, Ghana, Kenya, Mali, Mauritania, Mozambique, Namibia, Nigeria, Senegal, Sierra Leone, South Africa, Sudan, Tanzania, Uganda, Zambia, Zimbabwe |
| South Asia | Afghanistan, Bangladesh, India, Nepal, Pakistan, Sri Lanka |
Source: World Bank [32].
Appendix B
This appendix shows the detailed calculation of the entry, exit, and intensive margin for the change in the average unit value. The change in average price is defined as follows:
Divide the set of countries and products before and after the event into three categories: entry (, exit ( and intensive (, we can rewrite the change as follows:
Add and deduct to the above equation and rearrange:
Divide both sides by to get the percentage change.
References
- Kellenberg, D. The economics of the international trade of waste. Annu. Rev. Resour. Econ. 2015, 7, 109–125. [Google Scholar] [CrossRef] [Green Version]
- Grace, R.; Turner, R.K.; Walter, I. Secondary materials and international trade. J. Environ. Econ. Manag. 1978, 5, 172–186. [Google Scholar] [CrossRef]
- Yore, G.W. Secondary materials and international trade: A comment on the domestic market. J. Environ. Econ. Manag. 1979, 6, 199–203. [Google Scholar] [CrossRef]
- Baggs, J. International trade in hazardous waste. Rev. Int. Econ. 2009, 17, 1–16. [Google Scholar] [CrossRef]
- Kellenberg, D. Trading wastes. J. Environ. Econ. Manag. 2012, 64, 68–87. [Google Scholar] [CrossRef]
- Copeland, B.R.; Taylor, M.S. Trade, spatial separation, and the environment. J. Int. Econ. 1999, 47, 137–168. [Google Scholar] [CrossRef] [Green Version]
- UN Comtrade. United Nations Commodity Trade Statistics Database. Available online: http://comtrade.un.org (accessed on 1 July 2020).
- Matsuda, T.; Hanaoka, S.; Kawasaki, T. Cost analysis of bulk cargo containerization. Marit. Policy Manag. 2020, 1–20. [Google Scholar] [CrossRef]
- Balkevicius, A.; Sanctuary, M.; Zvirblyte, S. Fending off waste from the west: The impact of China’s Operation Green Fence on the international waste trade. World Econ. 2020. [Google Scholar] [CrossRef]
- Jambeck, J.R.; Geyer, R.; Wilcox, C.; Siegler, T.R.; Perryman, M.; Andrady, A.; Narayan, R.; Law, K.L. Plastic waste inputs from land into the ocean. Science 2015, 347, 768–771. [Google Scholar] [CrossRef] [PubMed]
- Resource-Recycling. Operation Green Fence Is Deeply Affecting Export Markets, 2013. Resource Recycling News. 12 April 2013. Available online: https://resource-recycling.com/recycling/2013/04/12/operation-green-fence-is-deeply-affecting-export-markets/ (accessed on 14 September 2020).
- WTO. Catalogue of Solid Wastes Forbidden to Import into China by the End of 2017 (4 Classes, 24 Kinds). Notification No. G/TBT/N/CHN/1211. 2017. Available online: http://tbtims.wto.org/en/RegularNotifications/View/137356 (accessed on 1 July 2020).
- Resource Recycling. From Green Fence to Red Alert: A China Timeline. Resource Recycling News. 13 February 2017. Available online: https://resource-recycling.com/recycling/2018/02/13/green-fence-red-alert-china-timeline/ (accessed on 15 September 2020).
- Basel Convention. Questions and Answers Related to the Basel Convention Plastic Waste Amendments. Available online: http://www.basel.int/Implementation/Plasticwaste/PlasticWasteAmendments/FAQs/tabid/8427/Default.aspx (accessed on 14 September 2020).
- Sun, M. The effect of border controls on waste imports: Evidence from China’s Green Fence campaign. China Econ. Rev. 2019, 54, 457–472. [Google Scholar] [CrossRef]
- Brooks, A.L.; Wang, S.; Jambeck, J.R. The Chinese import ban and its impact on global plastic waste trade. Sci. Adv. 2018. [Google Scholar] [CrossRef] [PubMed] [Green Version]
- Wang, W.; Themelis, N.J.; Sun, K.; Bourtsalas, A.C.; Huang, Q.; Zhang, Y.; Wu, Z. Current influence of China’s ban on plastic waste imports. Waste Dispos. Sustain. Energy 2019, 1, 67–78. [Google Scholar] [CrossRef] [Green Version]
- Huang, Q.; Chen, G.; Wang, Y.; Chen, S.; Xu, L.; Wang, R. Modelling the global impact of China’s ban on plastic waste imports. Resour. Conserv. Recycl. 2020, 154, 104607. [Google Scholar] [CrossRef]
- Wang, C.; Zhao, L.; Lim, M.K.; Chen, W.-Q.; Sutherland, J.W. Structure of the global plastic waste trade network and the impact of China’s import Ban. Resour. Conserv. Recycl. 2020, 153, 104591. [Google Scholar] [CrossRef]
- Head, K.; Mayer, T. Chapter 3—Gravity Equations: Workhorse, Toolkit, and Cookbook. In Handbook of International Economics; Helpman, E., Gopinath, G., Rogoff, K., Eds.; Elsevier: Amsterdam, The Netherlands, 2014; Volume 4, pp. 131–195. [Google Scholar]
- Berglund, C.; Söderholm, P. An Econometric Analysis of Global Wastepaper Recovery and Utilization. Environ. Resour. Econ. 2003, 26, 429–456. [Google Scholar] [CrossRef]
- Van Beukering, P.J.H.; Bouman, M.N. Empirical Evidence on Recycling and Trade of Paper and Lead in Developed and Developing Countries. World Dev. 2001, 29, 1717–1737. [Google Scholar] [CrossRef]
- Helpman, E.; Krugman, P.R. Trade Policy and Market Structure; MIT Press: Cambridge, MA, USA, 1989. [Google Scholar]
- Maskus, K.E.; Wilson, J.S.; Otsuki, T. Quantifying the Impact of Technical Barriers to Trade: A Framework for Analysis; Policy Research Working Paper Series; World Bank: Washington, DC, USA, 2000; p. 2512. [Google Scholar]
- Bao, X.; Chen, W.C. The Impacts of Technical Barriers to Trade on Different Components of International Trade: Impacts of TBT on International Trade. Rev. Dev. Econ. 2013, 17, 447–460. [Google Scholar] [CrossRef]
- Hummels, D.; Klenow, P.J. The Variety and Quality of a Nation’s Exports. Am. Econ. Rev. 2005, 95, 704–723. [Google Scholar] [CrossRef] [Green Version]
- Theofanis, S.; Boile, M. Empty marine container logistics: Facts, issues and management strategies. GeoJournal 2009, 74, 51–65. [Google Scholar] [CrossRef]
- Tamvakis, M. International Seaborne Trade. In The Blackwell Companion to Maritime Economics; Tally, W., Ed.; Blackwell Publishing Ltd.: Hoboken, NJ, USA, 2012. [Google Scholar]
- Rodrigue, J.P. The Geography of Transport Systems, 4th ed.; Routledge: Abingdon, UK, 2017. [Google Scholar]
- Sanders, U.; Riedl, J.; Schlingmeier, J.; Roeloffs, C. Bringing the Sharing Economy to Shipping, The Boston Consulting Group. 2016. Available online: https://www.bcg.com/publications/2016/transportation-travel-tourism-bringingsharing-economy-to-shipping.aspx (accessed on 29 August 2018).
- Asian Development Bank. Strengthening Disaster Resilience. 2019. Available online: https://www.adb.org/documents/adb-annual-report-2019 (accessed on 14 December 2020).
- World Bank. List of Economies. June 2020. Available online: http://shop.ifrs.org/files/CLASS20.pdf (accessed on 1 July 2020).
- Resource-Recycling. OCC and Mixed Paper: A Tale of Two Exports, 2018. Resource Recycling News. 11 December 2018. Available online: https://resource-recycling.com/recycling/2018/12/11/occ-and-mixed-paper-a-tale-of-two-exports/ (accessed on 14 September 2020).
- TIME. Southeast Asia Pushes Back against Global Garbage Trade. 2019. Available online: https://time.com/5598032/southeast-asia-plastic-waste-malaysia-philippines/ (accessed on 10 September 2020).
- Berg, P.; Lingqvist, O. Pulp, Paper, and Packaging in the Next Decade: Transformational Change. McKinsey & Company. 2019. Available online: https://www.mckinsey.com/industries/paper-and-forest-products/ourinsights/pulp-paper-and-packaging-in-the-next-decade-transformationalchange (accessed on 10 September 2020).
Figure 1.
China’s import of plastic waste (HS3915) and used paper (HS4707). Source: Authors’ calculation based on UN Comtrade [7].
Figure 1.
China’s import of plastic waste (HS3915) and used paper (HS4707). Source: Authors’ calculation based on UN Comtrade [7].

Figure 2.
World waste export to regions other than China. Note: EAS: East Asia & Pacific; ECS: Europe & Central Asia; LCN: Latin America & Caribbean; MEA: Middle East & North Africa; SAS: South Asia; SSF: Sub-Saharan Africa. Source: Author’s calculation based on UN Comtrade [7].
Figure 2.
World waste export to regions other than China. Note: EAS: East Asia & Pacific; ECS: Europe & Central Asia; LCN: Latin America & Caribbean; MEA: Middle East & North Africa; SAS: South Asia; SSF: Sub-Saharan Africa. Source: Author’s calculation based on UN Comtrade [7].

Table 1.
Quantity and unit value change after OGF (2013) and National Sword (2017).
| Commodity | Margin | National Sword (2017) | Operation Green Fence (2013) | ||||||
|---|---|---|---|---|---|---|---|---|---|
| Quantity Change (%) | Unit Value Change (%) | Quantity Change (%) | Unit Value Change (%) | ||||||
| Total Change | UV Change | Share Change | Total Change | UV Change | Share Change | ||||
| Waste Plastic (3915) | Total | −92.1 | 27.4 | 31.5 | −4.1 | −7.3 | −22.3 | −22.0 | −0.3 |
| Entry | 0.0 | 0.6 | 0.0 | 0.6 | 0.1 | 0.1 | 0.0 | 0.1 | |
| Exit | −3.3 | −3.8 | −3.8 | 0.0 | −0.4 | −0.5 | −0.5 | 0.0 | |
| Intensive | −88.8 | 30.6 | 35.3 | −4.7 | −7.0 | −21.8 | −21.5 | −0.3 | |
| Used Paper (4707) | Total | −56.0 | 12.7 | 34.8 | −22.2 | −8.6 | −17.1 | −7.3 | −9.8 |
| Entry | 0.2 | 0.4 | 0.0 | 0.4 | 0.2 | 0.2 | 0.0 | 0.2 | |
| Exit | −0.3 | −0.3 | −0.3 | 0.0 | −0.2 | −0.1 | −0.1 | 0.0 | |
| Intensive | −55.9 | 12.6 | 35.1 | −22.6 | −8.6 | −17.2 | −7.2 | −10.0 | |
Source: Authors’ calculation based on UN Comtrade [7].
Table 2.
Quantity and unit value change by country group.
| Commodity | Country Group | Before 2017 | After 2017 | Quantity Change (%) | UV Change (%) | ||||||
|---|---|---|---|---|---|---|---|---|---|---|---|
| Quantity (1000 tons) | Share (%) | UV (USD/tons) | Quantity (1000 tons) | Share (%) | UV (USD/tons) | Total Change | Pure UV | Share Change | |||
| Waste Plastic (3915) | Europe & Central Asia (HIC) | 3,168 | 32% | 333 | 87 | 11% | 407 | −30.7 | −15.8 | 5.3 | −21.1 |
| East Asia & Pacific (HIC) | 2,168 | 22% | 371 | 82 | 10% | 570 | −20.8 | −5.6 | 10.1 | −15.7 | |
| East Asia & Pacific (LMY) | 2,000 | 20% | 477 | 511 | 64% | 511 | −14.8 | 59.0 | 10.8 | 48.1 | |
| North America (HIC) | 1,822 | 18% | 358 | 65 | 8% | 470 | −17.5 | −4.5 | 9.3 | −13.8 | |
| Latin America & Caribbean (LMY) | 415 | 4% | 373 | 15 | 2% | 512 | −4.0 | −2.5 | −1.5 | −1.1 | |
| Used Paper (4707) | North America (HIC) | 30,011 | 53% | 138 | 13,704 | 55% | 172 | −28.6 | 14.5 | 11.1 | 3.4 |
| Europe & Central Asia (HIC) | 17,360 | 30% | 143 | 6,201 | 25% | 178 | −19.6 | −1.6 | 4.3 | −5.9 | |
| East Asia & Pacific (HIC) | 8,886 | 16% | 156 | 4,561 | 18% | 193 | −7.6 | −1.2 | 20.0 | −21.2 | |
| Latin America & Caribbean (LMY) | 671 | 1% | 152 | 195 | 1% | 215 | −0.8 | −0.7 | −0.6 | −0.1 | |
| Middle East & North Africa (HIC) | 48 | 0% | 192 | 155 | 1% | 209 | 0.2 | 0.3 | −0.0 | 0.4 | |
| East Asia & Pacific (LMY) | 5 | 0% | 151 | 197 | 1% | 213 | 0.3 | 1.0 | 0.0 | 1.0 | |
Source: Authors’ calculation based on UN Comtrade [7]. HIC and LMY are short for high-income, low-income, and middle-income countries. See Appendix A for further details. Classification by income level follows the World Bank [32].
Table 3.
Quantity changes in world waste exports to regions other than China.
| Commodity | Margin | National Sword (2017) | Operation Green Fence (2013) | ||||||
|---|---|---|---|---|---|---|---|---|---|
| East Asia & Pacific (LMY) | Europe & Central Asia (LMY) | South Asia (LMY) | Europe & Central Asia (HIC) | East Asia & Pacific (LMY) | Europe & Central Asia (LMY) | South Asia (LMY) | Europe & Central Asia (HIC) | ||
| Waste Plastic (3915) | Total | 161.4 | 266.3 | 20.7 | 16.5 | 75.2 | 57.8 | 20.5 | 13.2 |
| Entry | 6.9 | 30.4 | 3.0 | 3.8 | 5.9 | 15.5 | 6.1 | 2.5 | |
| Exit | −1.0 | −1.9 | −3.1 | −1.1 | −4.7 | −6.1 | −1.9 | −2.7 | |
| Intensive | 155.5 | 237.8 | 20.8 | 13.8 | 74.0 | 48.4 | 16.2 | 13.5 | |
| Used Paper (4707) | Total | 101.4 | 76.7 | 104.0 | −0.2 | −5.6 | 52.9 | 23.7 | −5.1 |
| Entry | 5.5 | 8.8 | 1.1 | 0.3 | 1.5 | 8.9 | 0.8 | 0.9 | |
| Exit | −1.4 | −1.6 | −1.2 | −0.4 | −2.3 | −1.2 | −1.1 | −0.5 | |
| Intensive | 97.3 | 69.4 | 104.2 | −0.1 | −4.8 | 45.2 | 24.0 | −5.4 | |
Source: Authors’ calculation based on UN Comtrade [7].
Table 4.
Quantity changes in the world waste export to regions other than China.
| Routes | Main Haul | Backhaul | Imbalance | ||||||
|---|---|---|---|---|---|---|---|---|---|
| 2017 (mil. TEU) | 2019 (mil. TEU) | %Change | 2017 (mil. TEU) | 2019 (mil. TEU) | %Change | 2017 (mil. TEU) | 2019 (mil. TEU) | %Change | |
| FE-North America | 18.6 | 18.7 | 0.8 | 8.0 | 7.4 | −6.8 | 10.6 | 11.3 | 6.4 |
| FE-Europe | 15.8 | 16.7 | 5.4 | 7.8 | 8.2 | 4.2 | 8.0 | 8.5 | 6.5 |
| FE-IS and ME | 7.5 | 7.0 | −6.4 | 2.8 | 2.8 | −0.4 | 4.7 | 4.2 | −10.1 |
| Europe-IS and ME | 3.9 | 4.0 | 4.3 | 2.7 | 2.9 | 5.2 | 1.1 | 1.2 | 2.3 |
| Europe-North America | 4.7 | 5.1 | 9.1 | 2.7 | 3.0 | 10.2 | 1.9 | 2.1 | 7.5 |
| North America-South and Central America | 2.9 | 2.9 | 0.5 | 2.5 | 2.5 | 1.9 | 0.4 | 0.4 | −7.8 |
| FE-South and Central America | 3.6 | 3.9 | 6.5 | 1.8 | 1.9 | 8.0 | 1.8 | 1.9 | 5.0 |
| FE-Oceania | 2.6 | 2.6 | 0.4 | 1.6 | 1.6 | −1.8 | 1.0 | 1.0 | 3.8 |
| FE-Sub Saharan Africa | 2.8 | 3.2 | 13.8 | 1.2 | 1.3 | 9.9 | 1.7 | 1.9 | 16.5 |
| Europe-Sub Saharan Africa | 2.0 | 2.2 | 7.8 | 0.8 | 0.8 | 1.8 | 1.2 | 1.3 | 12.0 |
| Others | 7.0 | 7.5 | 7.4 | 4.7 | 5.1 | 8.2 | 2.3 | 2.4 | 5.8 |
Source: Authors’ calculation based on CTS. FE is short for the Far East (mostly East Asia and South East Asia). IS and ME are abbreviations for the Indian Sub-Continent and the Middle East and NA for North America. The route name is written in the direction of the main haul.
Publisher’s Note: MDPI stays neutral with regard to jurisdictional claims in published maps and institutional affiliations. |
© 2021 by the authors. Licensee MDPI, Basel, Switzerland. This article is an open access article distributed under the terms and conditions of the Creative Commons Attribution (CC BY) license (http://creativecommons.org/licenses/by/4.0/).
Share and Cite
MDPI and ACS Style
Tran, T.; Goto, H.; Matsuda, T. The Impact of China’s Tightening Environmental Regulations on International Waste Trade and Logistics. Sustainability 2021, 13, 987. https://0-doi-org.brum.beds.ac.uk/10.3390/su13020987
AMA Style
Tran T, Goto H, Matsuda T. The Impact of China’s Tightening Environmental Regulations on International Waste Trade and Logistics. Sustainability. 2021; 13(2):987. https://0-doi-org.brum.beds.ac.uk/10.3390/su13020987
Chicago/Turabian StyleTran, Trang, Hiromasa Goto, and Takuma Matsuda. 2021. "The Impact of China’s Tightening Environmental Regulations on International Waste Trade and Logistics" Sustainability 13, no. 2: 987. https://0-doi-org.brum.beds.ac.uk/10.3390/su13020987
Note that from the first issue of 2016, this journal uses article numbers instead of page numbers. See further details here.