The Influence of Sedimentation Ponds of the Former Soda “Solvay” Plant in Krakow on the Chemistry of the Wilga River


Department of Forest Ecology and Silviculture, Faculty of Forestry, University of Agriculture in Krakow, al. 29 Listopada 46, 31-425 Krakow, Poland
*
Author to whom correspondence should be addressed.
Sustainability 2021, 13(2), 993; https://0-doi-org.brum.beds.ac.uk/10.3390/su13020993
Submission received: 21 December 2020
/
Revised: 8 January 2021
/
Accepted: 13 January 2021
/
Published: 19 January 2021
(This article belongs to the Special Issue Wastewater Treatment and Solid Waste Management)
Abstract
:This paper explores how the chemistry of the Wilga River is affected by the sedimentation ponds at the former Soda “Solvay” Plant in Krakow. Despite the revitalization of the sedimentation ponds about 30 years ago, the chemistry of the samples was characterized by high EC (from 845 to 3000 µS cm−1), high concentration of Cl− (up to 800 mg L−1), Ca (up to 270 mg L−1), and SO42− (up to 115 mg L−1), and a high value for Na (up to 270 mg L−1) was noted—surface water quality standards were exceeded. The effect of high mineralization by those elements, generated in wastewater during soda waste production, were noted to have seasonal and vertical variability. We concluded that, despite the industrial shutdown and revitalization processes, the drainage of industrial water can have serious and long-term negative effects on quality of water and the Wilga River ecosystem. The Wilga River is one of the most important examples of important environmental problems in urban areas.
1. Introduction
Mine drainage is the process of generating wastewater as a result of industry and mining, and it has a huge influence on the environment. Particularly harmful are the acidification of water (AMD, which results in a pH below 3.5) and concentrations of iron (in the forms of Fe2+ and Fe3+) and trace elements, especially Mn2+, Zn2+, Cd2+, Pb2+, Cu2+, Ni2+ [1,2,3]. The AMD phenomenon is mostly connected with open strip lignite mining sites made of Miocene sands with high carbon content, areas with processing plants, and at sites where minerals have been mined using the Frasch method [3,4,5]. In the areas where polymetallic ores are found, ground and surface water contain large amounts of residual metals such as Ag, Au, Cu, Fe, Mn, Pb, Sb, Sn, W, Zn (from direct mining) and Cd and As (from ore paragenesis) [6]. The pollution of surface waters by AMD is still a global problem [7,8,9]. Water pollution occurs in other industrial areas besides mines. It is also connected with areas near landfills for municipal and post-production waste, high traffic routes, and non-channeled urban and rural areas [6,10,11]. The most common cause of ground and surface water pollution is improper insulation for areas surrounding post-industrial sites. There, leachates from various post-production landfills are the most common sources of pollution [11,12]. The opposite trend to AMD is excessive salinity of surface waters caused by natural processes like seepage from geological formations that contain salt, drought [13,14], or anthropogenic influences such as seepage of water from salinized agricultural fields [15] and industry. One of the most important industrial causes of increased soil and water salinity is related to the generation of byproducts from the Solvay process. The Solvay process is a method of obtaining sodium carbonate (Na2CO3), also known as soda ash, from the ground. Soda ash is a major commodity used in many industrial applications, such as the production of glass, and even in household applications like synthetic detergents [16]. In 2000, around 60% of the worldwide soda ash production used the Solvay process, 30% was produced by processing natural sodium carbonate, and about 10% came from other methods [16].
The main environmental concern associated with the Solvay process is the leaching of chloride salts into groundwater and surface waters [12]. The waste generated by the method is NaCl, CaCl2, Ca(OH)2, CaCO3, CaSO4, and SiO2. CaCO3 precipitation and the deposition of these wastes can be of fundamental importance for the biogeochemistry of lake ecosystems, since they link with cycles of other components, such as dissolved organic carbon, P, and suspended particles. In such cases, the rate of lake sedimentation often increases [17]. Soil and water salinization can lead to different environmental problems including negative impacts on plant growth and survival. This can then result in increased soil erosion and reduction of water quality [12]. High levels of salinity in water can render it unsuitable for agriculture (with negative implications for crop production) and households (non-potable water and corrosion of pipes and damaged pipe fixtures as well as problems with water supply, public health, and ecosystems) [15]. An example of high water salinity in Central Europe is the section of the Wilga River that flows through the sedimentation ponds of the former Soda “Solvay” Plant in Krakow. That plant constitutes a major threat to the quality of the nearby environment. The site is a reclaimed landfill of so-called sedimentation ponds, which were created as part of soda ash production. Potential threats to the environment posed by such sedimentation ponds include leachate to varying degrees of salinity, mules and lime deposits filling the ponds (which are strongly alkaline), and municipal waste deposited improperly and hidden during land reclamation [18].
The aim of this study is to examine: (i) the chemical state of the Wilga River along and surrounded by the sedimentation ponds (i.e., at the entry point before the ponds and the exit point after the area of sedimentation ponds); (ii) the dynamics of biogeochemical transformations as necessary monitoring elements; and (iii) the possible risk of long-term negative effects of soda ash production in the revitalized post-industrial area in the highly populated urban ecosystem (Krakow city).
2. Materials and Methods
2.1. Study Site
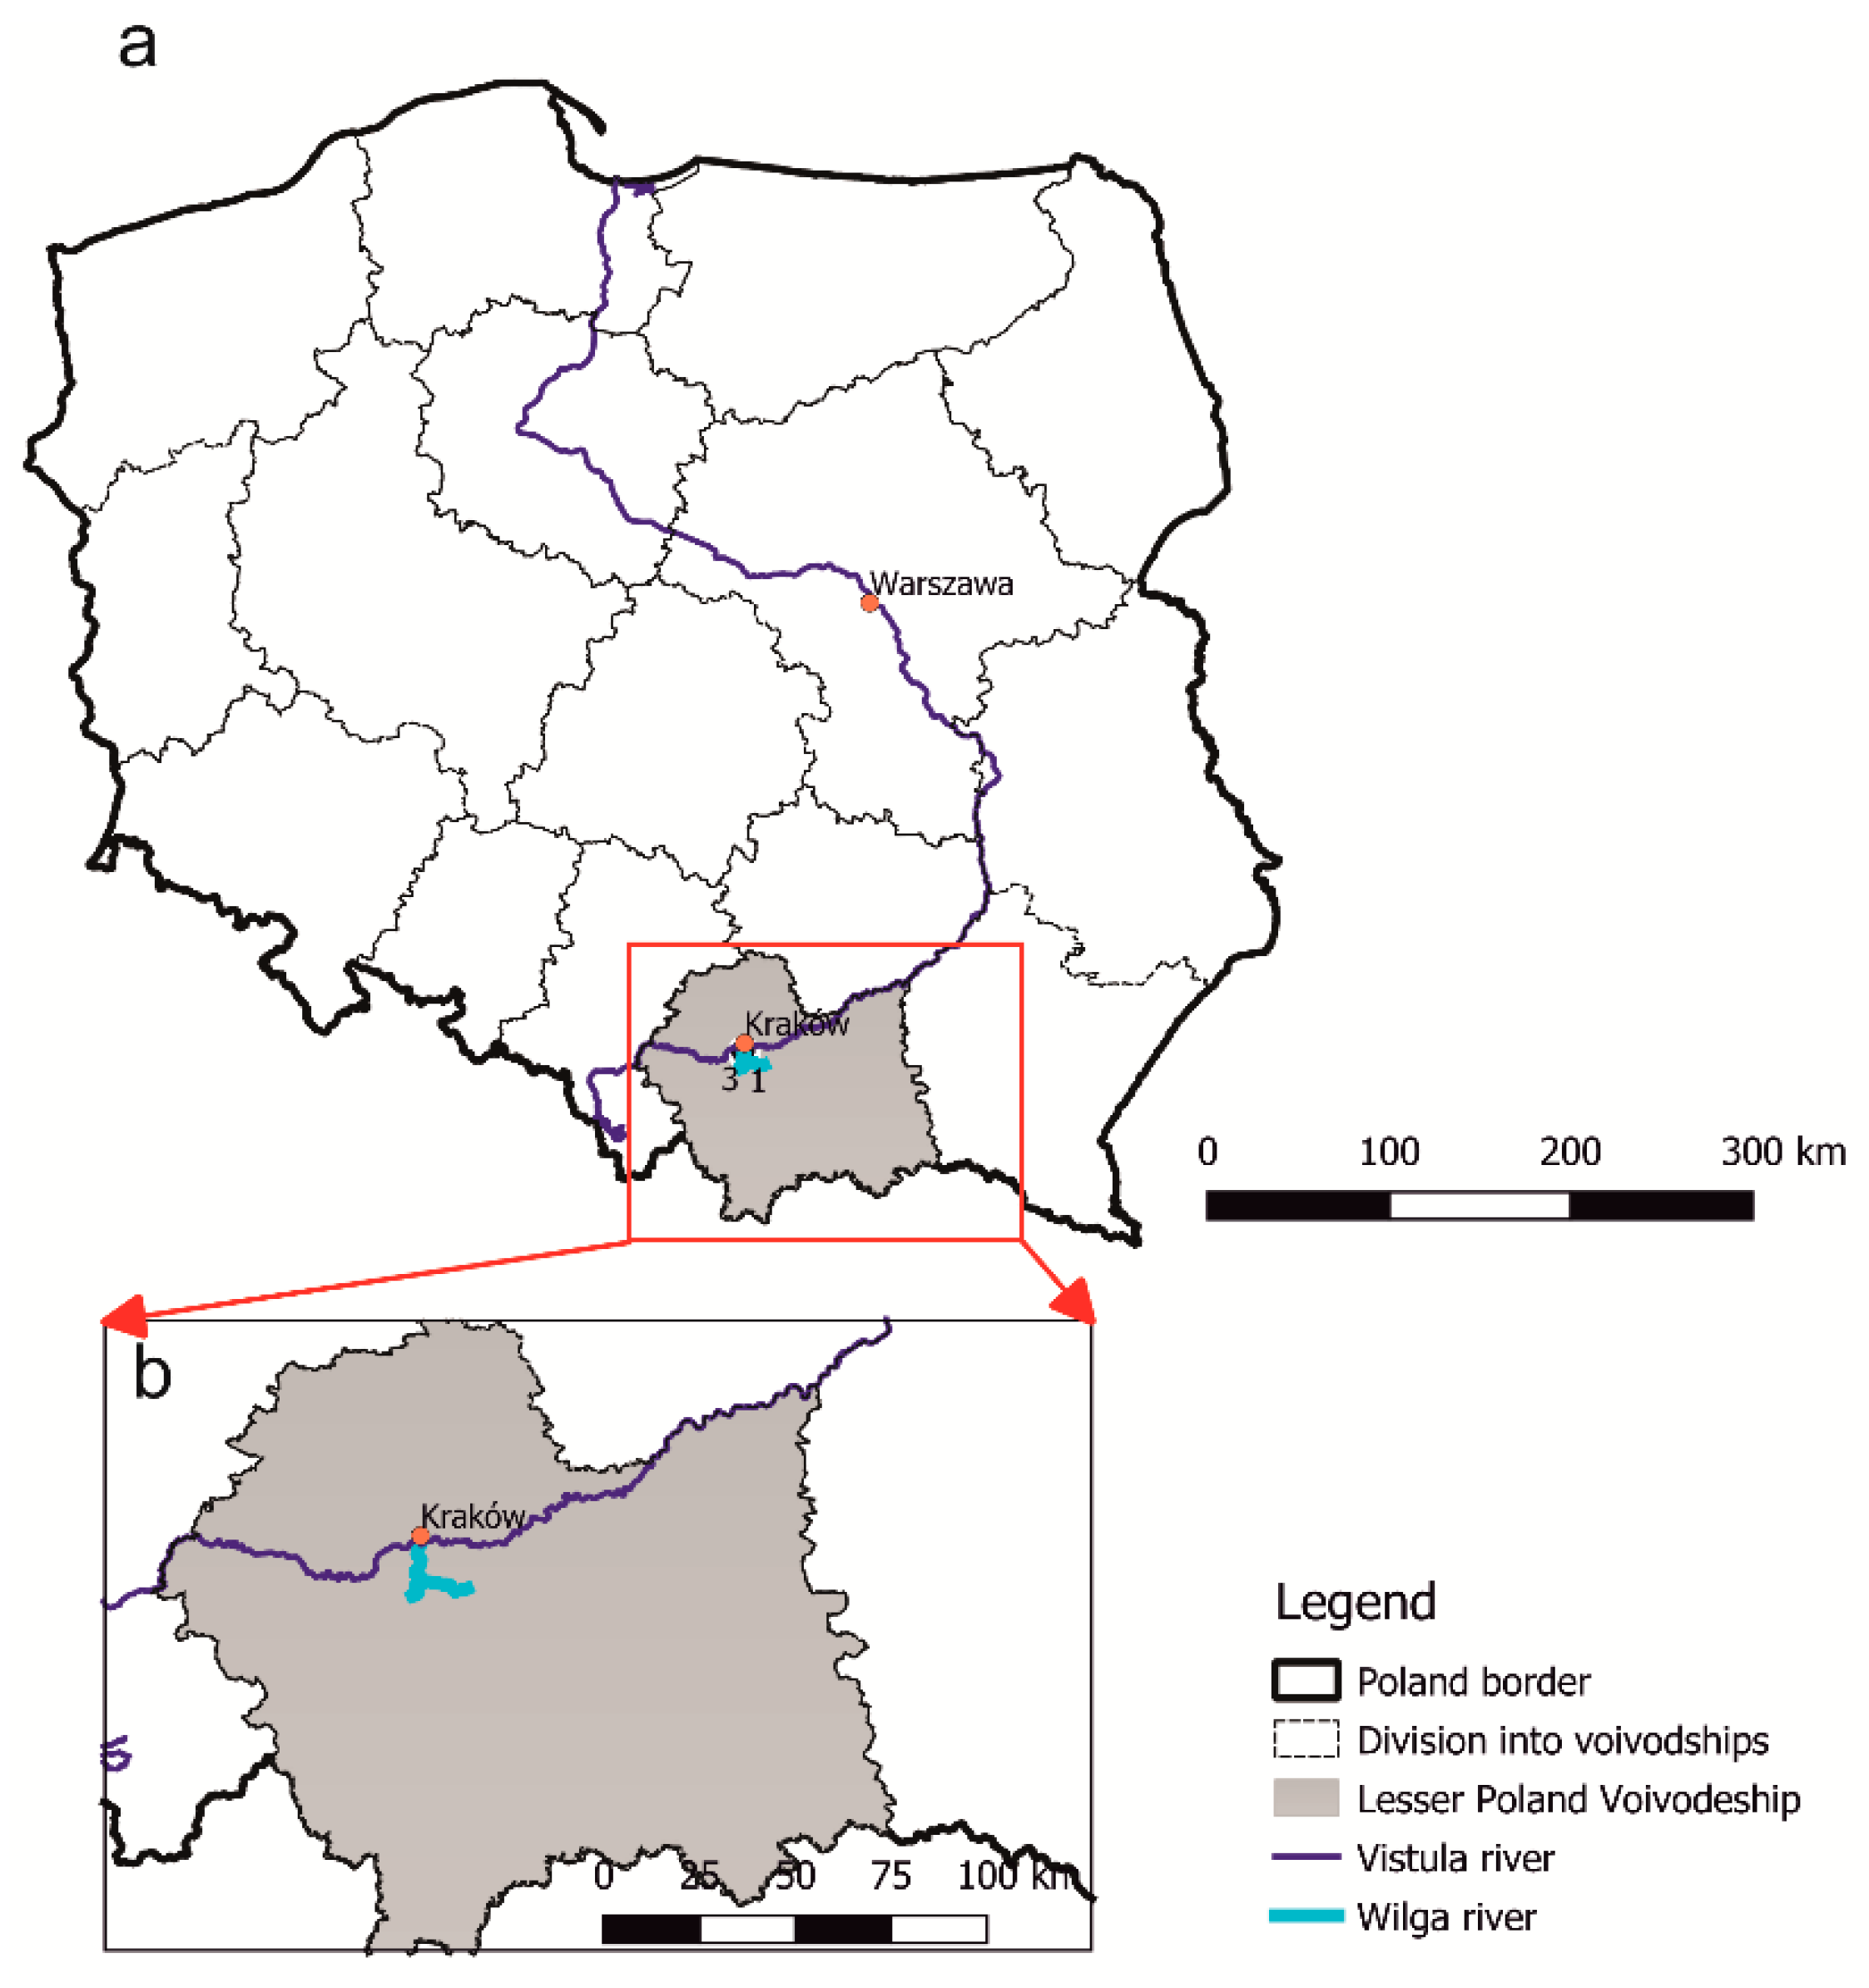
Monitoring studies were carried out on the fragment of the Wilga river flowing around the sedimentation ponds of the Soda “Solvay” Plant in Krakow (Figure 1 and Figure 2). The Solvay landfill was established on Quaternary alluvial deposits consisting mainly of sands and gravels interlayered with clay. These formations are located in Miocene clays with gypsum inserts, and they do not have an insulating layer (impermeable layer), so it is suspected that the sedimentation ponds may pollute surface and underground waters through leachate [18].
The Wilga River is 26.7 km long, with its source in the Lesser Poland Voivodeship (southern Poland; Figure 1). The catchment area of the Wilga River is about 100 km2. The Wilga River flow ranged from 0.93 to 1.35 m3 s−1 (reference data, no current measurement data) [19]. The Wilga is a submontane river characterized by two outflow maxima: spring and summer, and one autumn–winter minimum [19]. More than half of the Wilga River flows through Kraków, where it empties into the Vistula River (the right tributary of the Vistula).
In Krakow, part of the Wilga River flows past the reclaimed area of the former soda plants, the so-called sedimentation ponds. These sedimentation ponds, where the waste from processing soda was stored, were created in 1906. Due to the heavy contamination of the environment caused by the storage of post-production waste, the Environmental Protection Commission decided in 1989 to close the plants, and they ceased operation in 1996 [18]. The sedimentation ponds contain mostly post-production waste, including calcium carbonate CaCO3 (which comprises around 70% of the dry matter). The rest are silicon oxides SiO2, phosphorus oxides P2O5, calcium sulfate CaSO4, magnesium sulfate MgSO4, barium sulfate BaSO4, sodium chloride NaCl, and calcium chloride CaCl2 [18]. The sedimentation ponds were formed as a by-product of the production of sodium carbonate (Na2CO3) using the Solvay method developed in 1861 [16,18]. The height of the sediments ranges from several meters to about 30 m above the bottom of the valley. The slopes range from 1:1 to 1:1.5. The total amount of accumulated waste is estimated at about 5 million tons. The sedimentation ponds are separated from each other by a watercourse (Wilga River, Figure 2) [18].
2.2. Methods
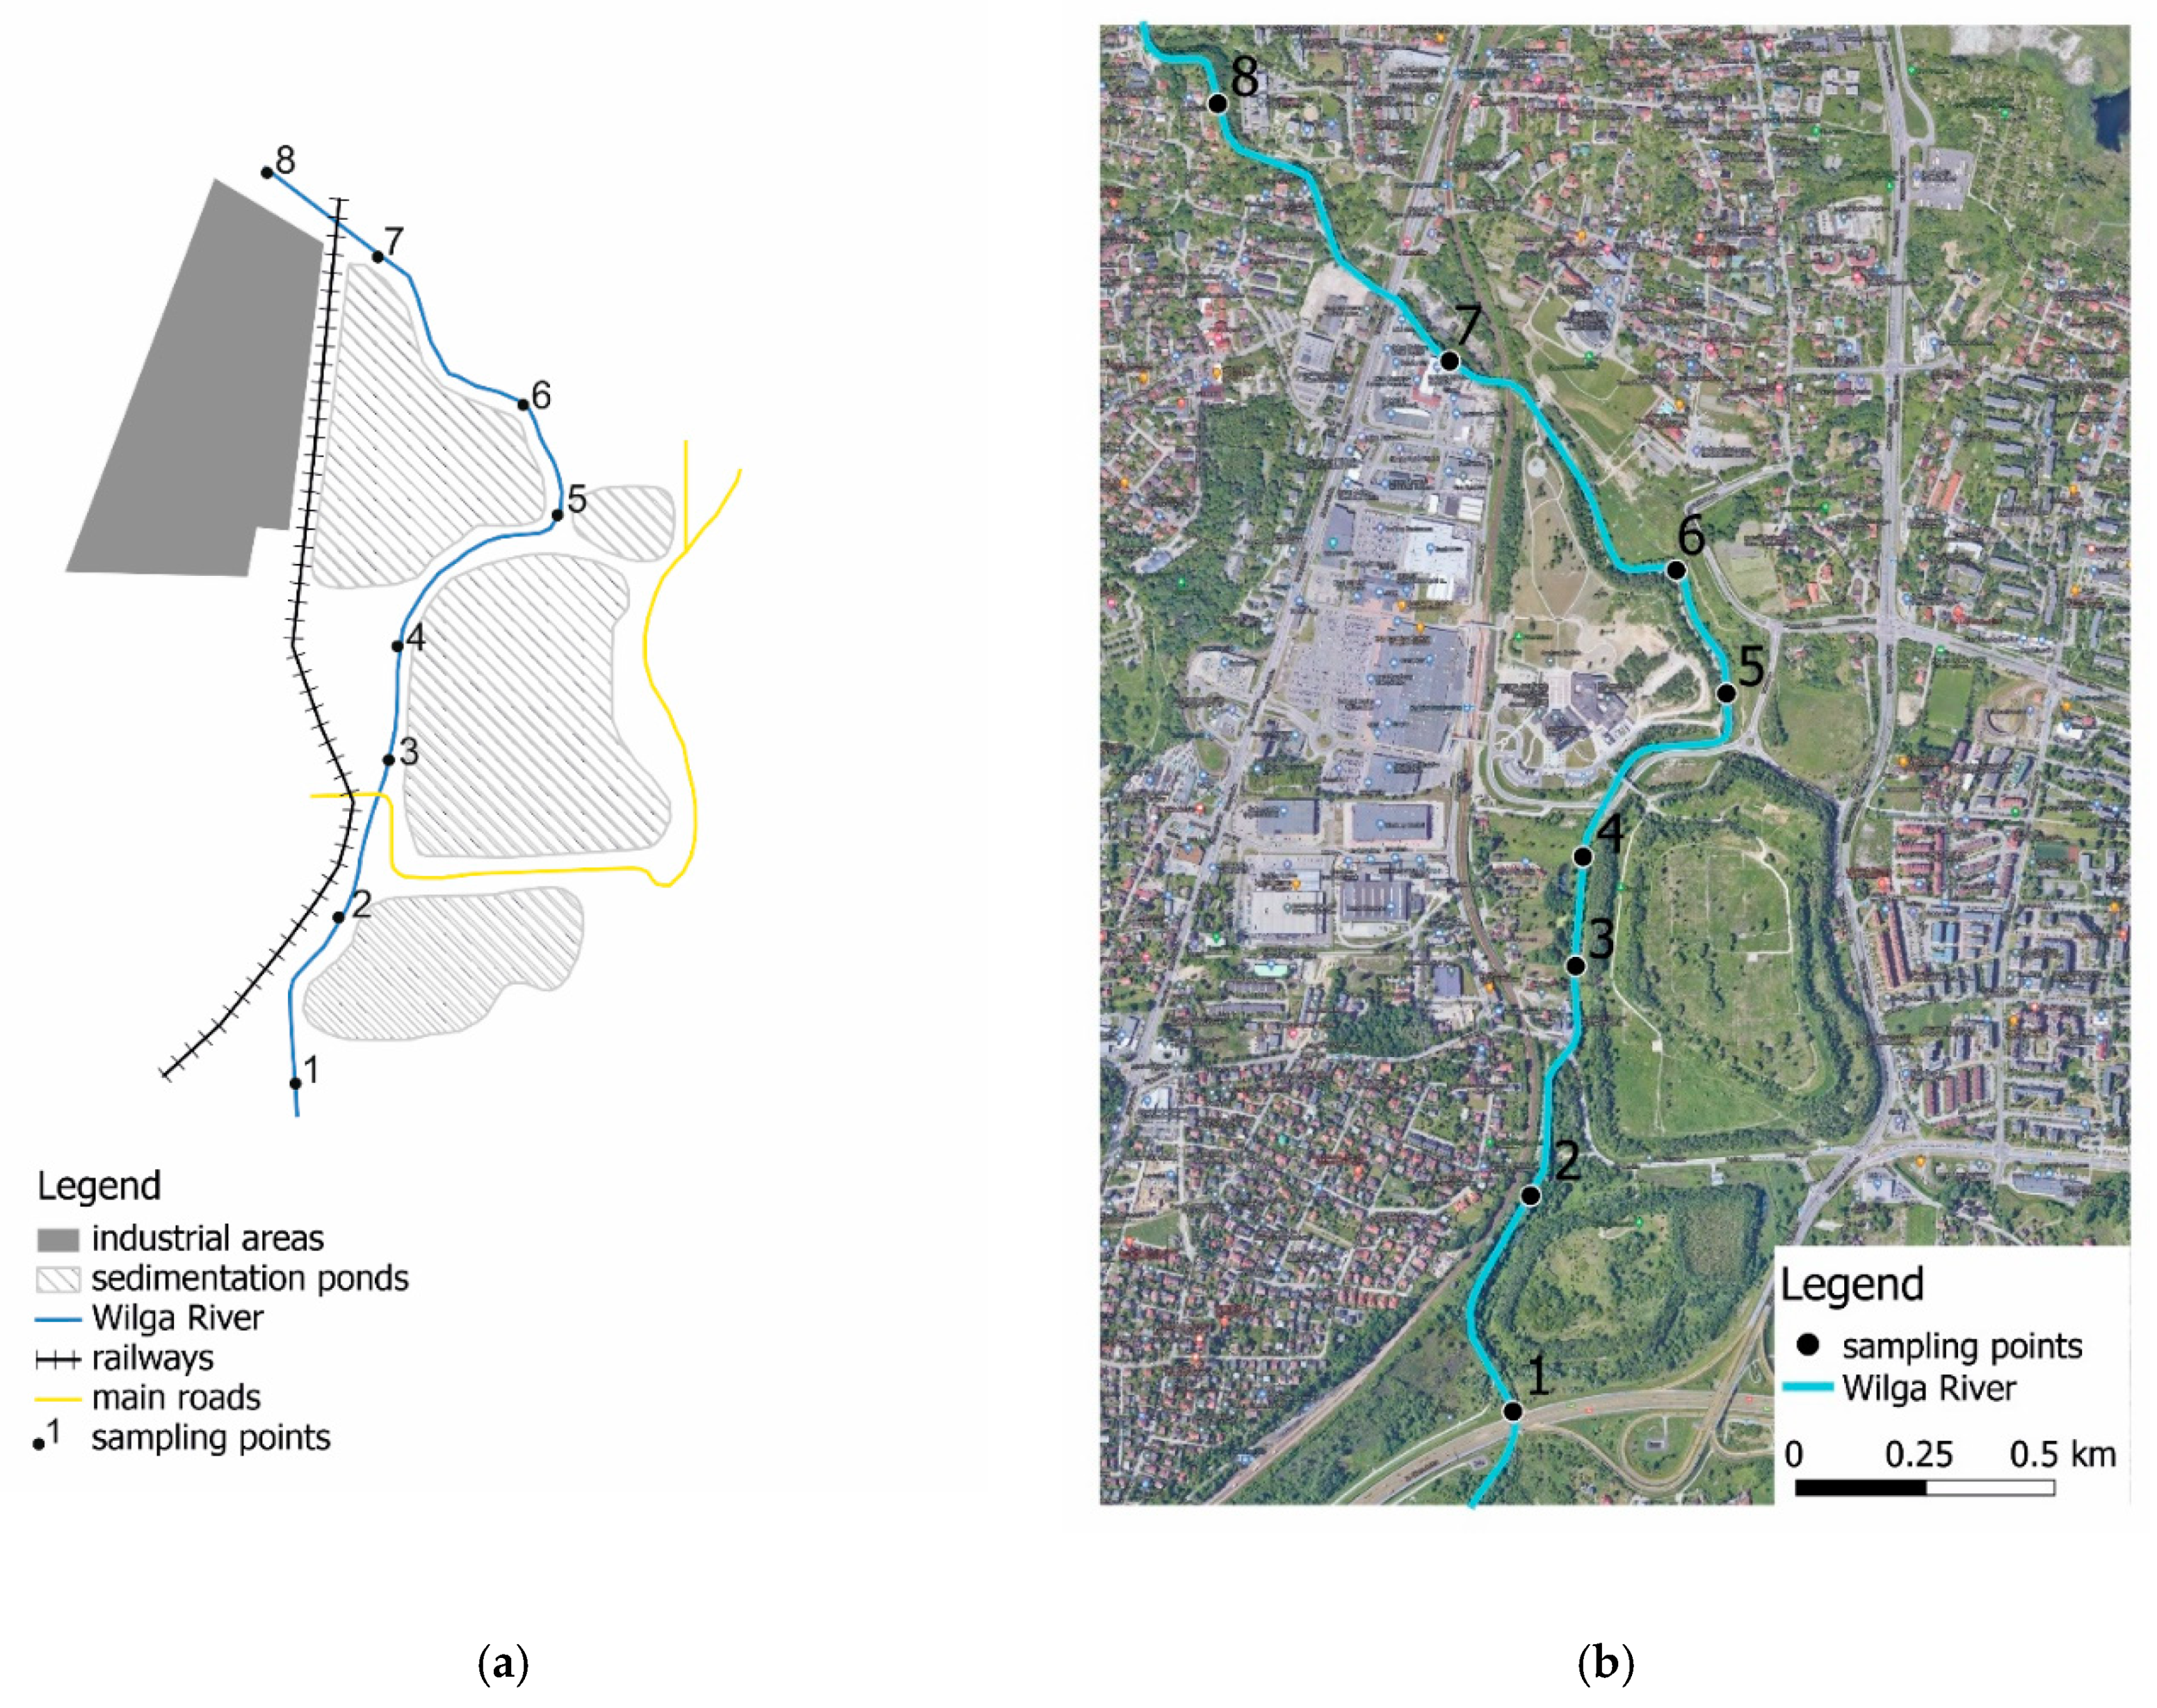
A monitoring study of the chemical state of the water in the Wilga river was conducted in 2018 and 2019 (see supplementary). Eight measurement points were determined on a 3-km section of the river (Figure 2) The points were stabilized (the place of sampling in the field was marked by inserting a bar with the number of the point) and their GPS locations were saved (Table 1). Water samples were collected in the summer (July), autumn (October), winter (January), and spring (March) to determine the impact of seasons on the chemistry of the surface water in the contamination area. The samples were collected with a 2-m pole, placed in 100 mL polyethylene bottles, and transported to the laboratory where they were stored at 4 °C within 48 h.
Before laboratory analyses water samples was filtered using quantitative hard, cellulose filters (type: 390; grammage: 84 g m−2). The following characteristics of the samples were determined: pH; electrical conductivity (EC) at a temperature of 21 °C using a multifunction device, CX-741; the concentrations of cations (Ca2+, Mg2+, K+, NH4+, Na+) and anions (NO3−, SO42−, Cl−) using Dionex ion Chromatography 5000 (Thermo Fisher Scientific, Waltham, MA, USA); concentrations of Al, Zn, Cd, Pb, Cr, and Ni using an ICP OES ICAP 6000 Series, and inorganic carbon (IC) on TOC Shimadzu. Measurement points 1 and 8 were comparative points that allowed observation of the chemical state of the water before entering the section along the settling tank and the state after flowing out of the range of influence by the settling tank (Figure 2).
3. Results
The mean pH values of the samples ranged from 7.4 (sampling point 8) to 7.6 (sampling point 2) (Table 2, Figure 3a). pH values were significantly higher in the spring and winter than in the summer and autumn (Table 3). The pH value at each point was the lowest in the summer. There was no significant difference in pH between measuring points 1 and 8.
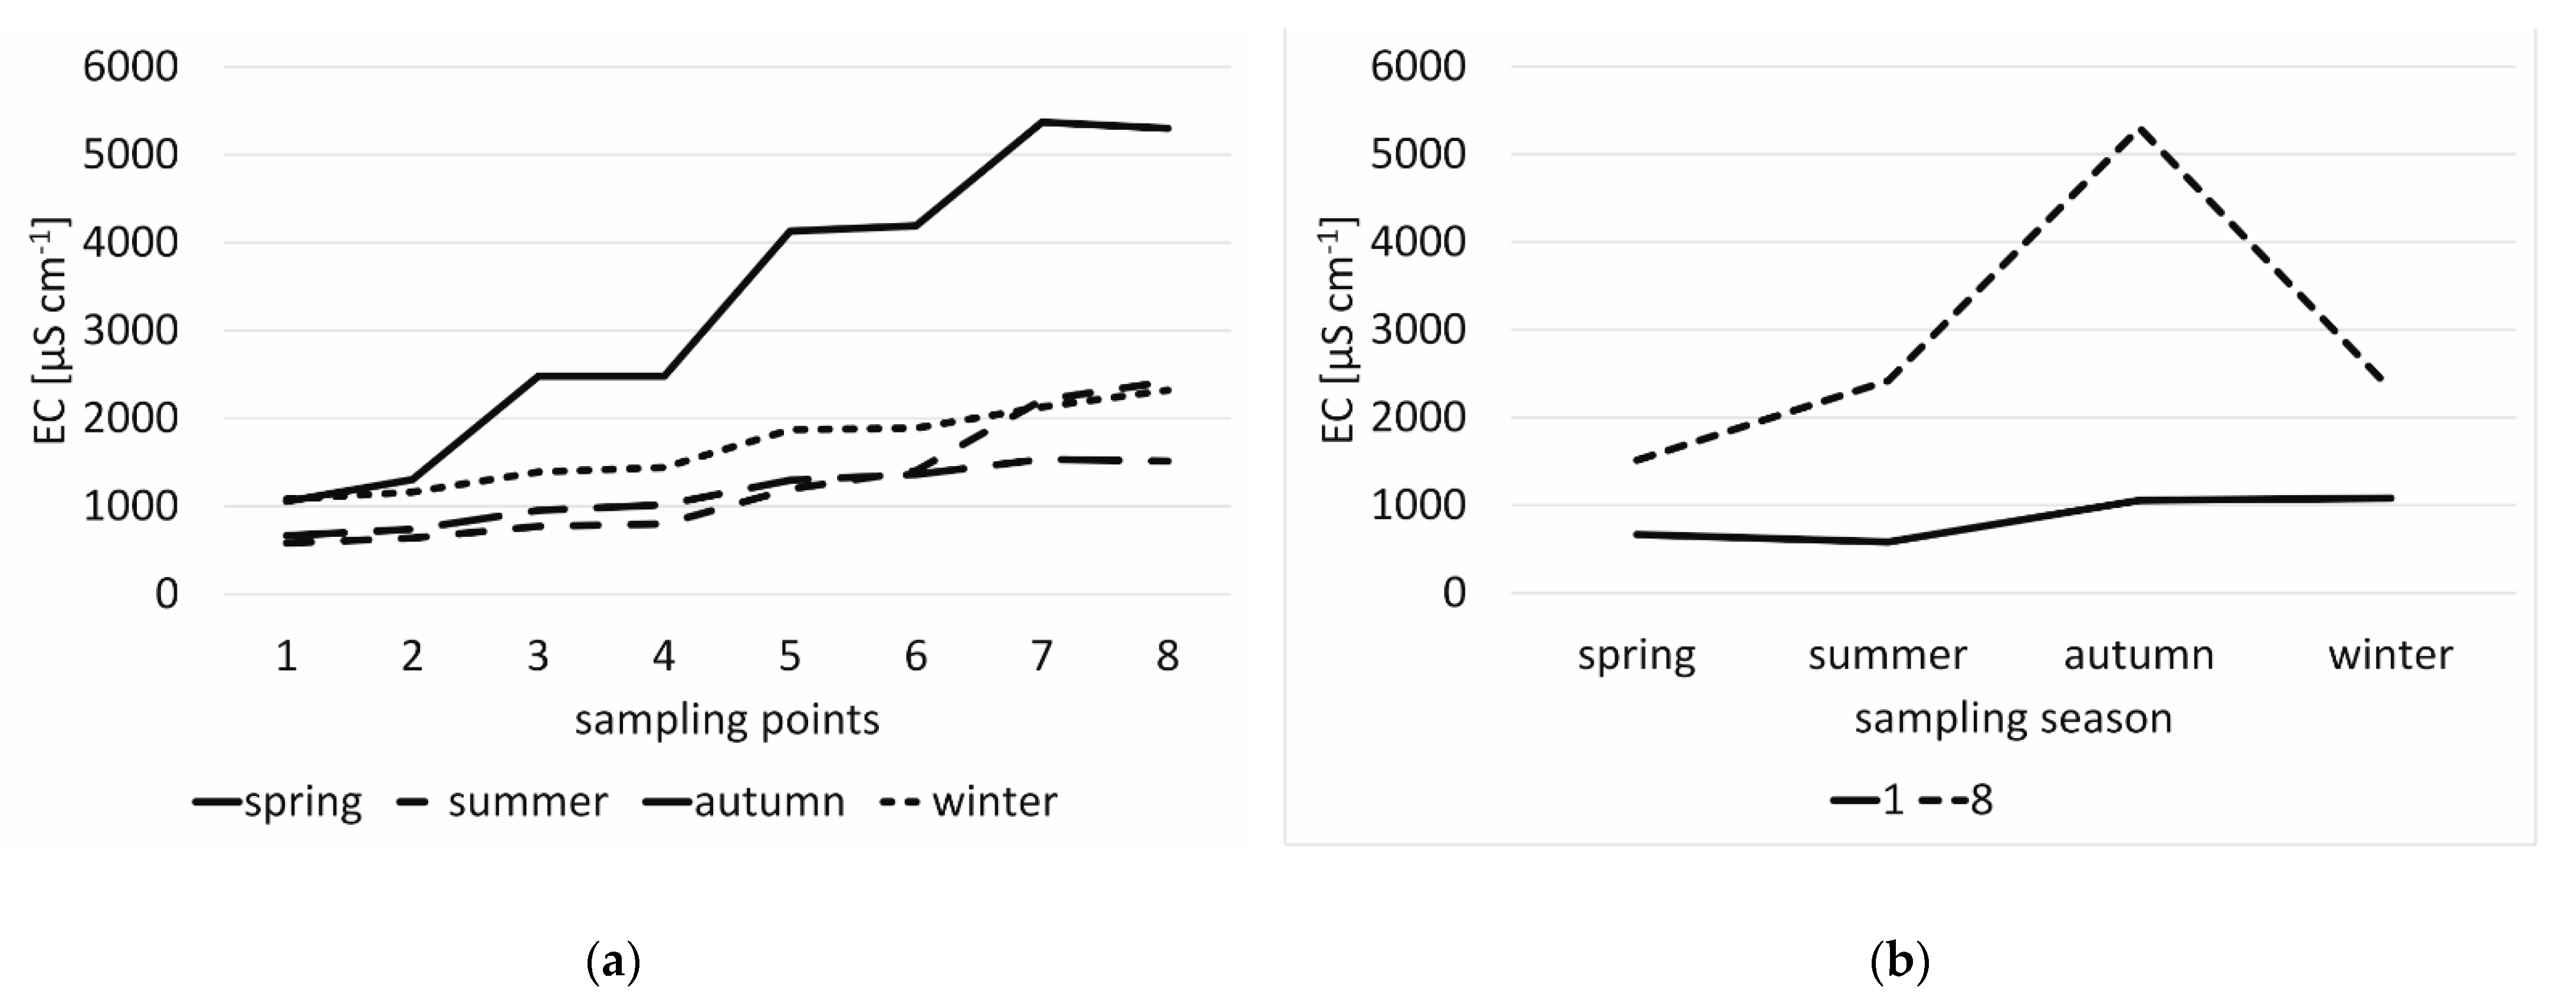
Mean EC values in the researched section ranged from 845 to 2888 µS L−1 (Table 2, Figure 3b). The highest value of EC (5370 µS cm−1) was in the water from sampling point 7 in the autumn (Figure 4). It was observed that each season, the EC increased at subsequent measuring points, from the lowest value at sampling point 1 to the highest at sampling point 8 (along the river, flowing through the sedimentation pond—EC in each season is the lowest in 1 sampling point, and the highest in 8 sampling point; Figure 4a).
The EC value at each point was the highest in the autumn (Figure 4b). According to the Regulations of the Ministry of Environment in Poland (RME) [20], the permissible EC value qualifying water as having good quality is ≤ 677 µS cm−1. However, a high EC value (i.e., EC > 1500 µS·cm−1, indicating salinity) was found in every season at sampling points 7 and 8. This level was more than twice the acceptable limit (Table 2).
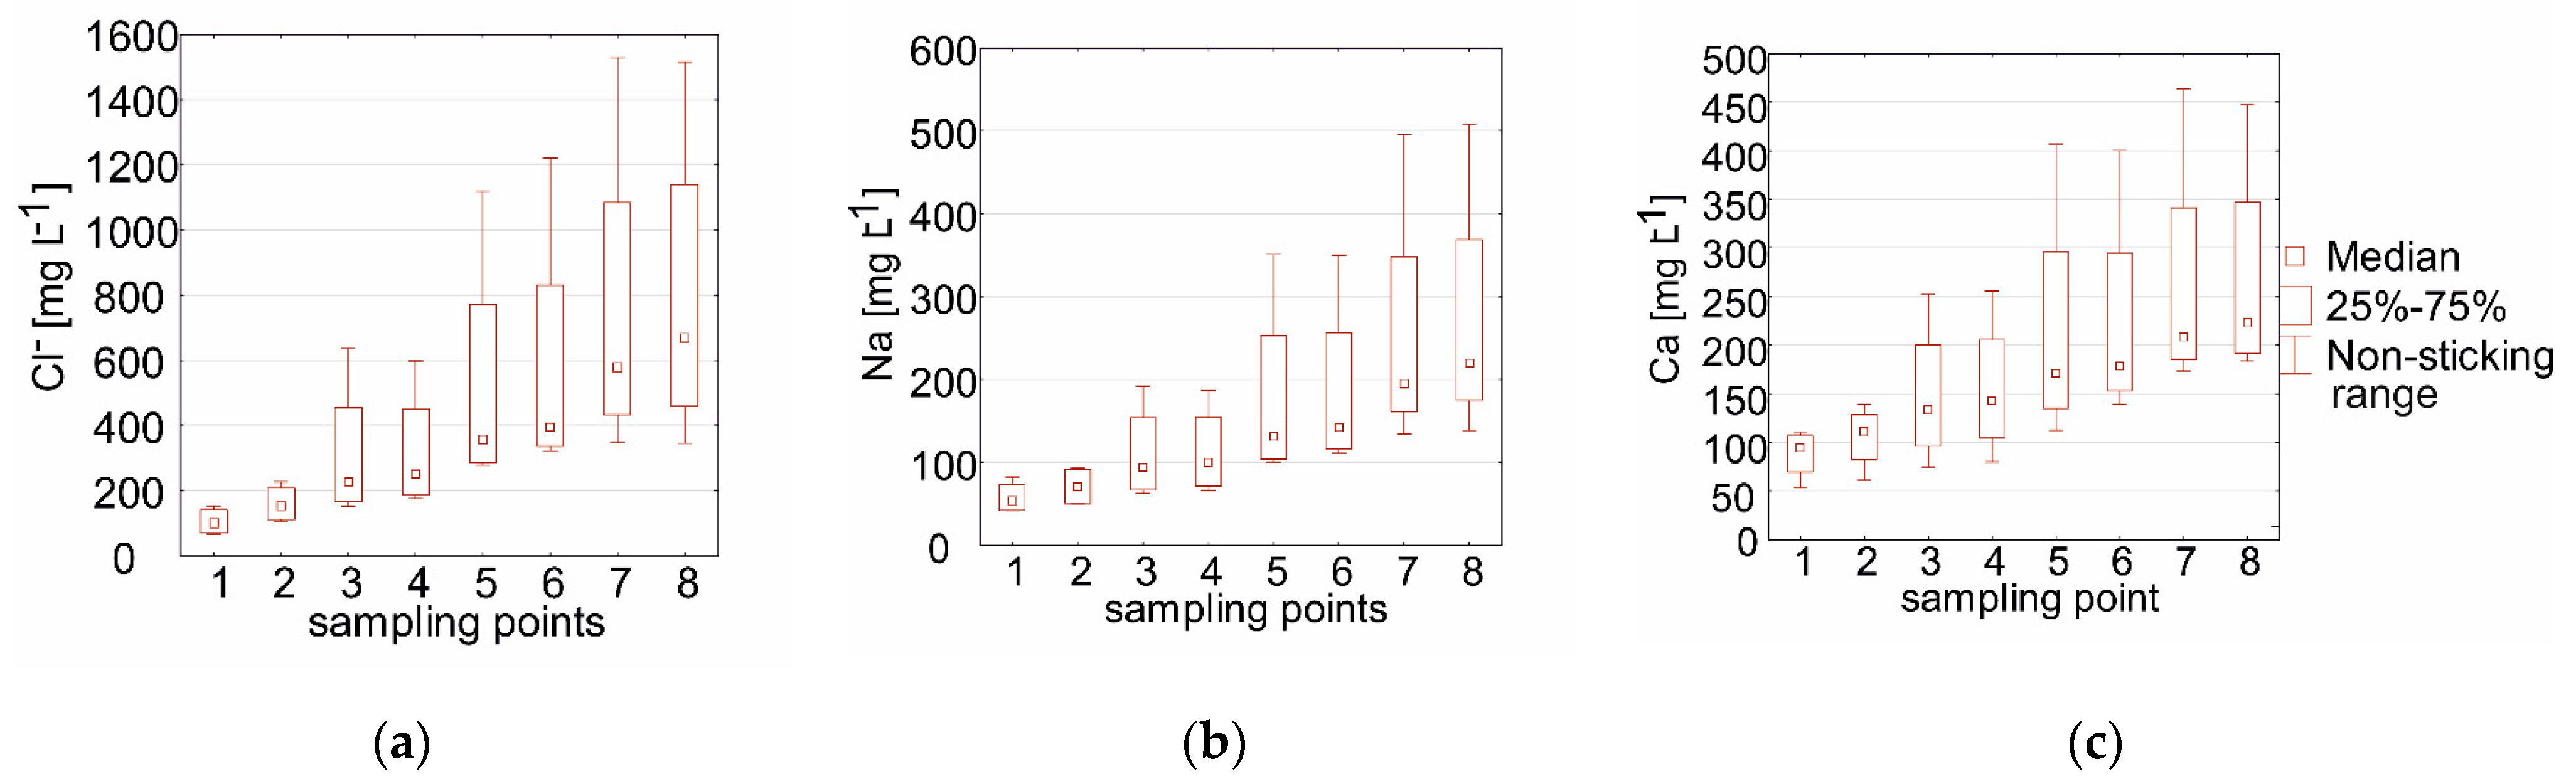
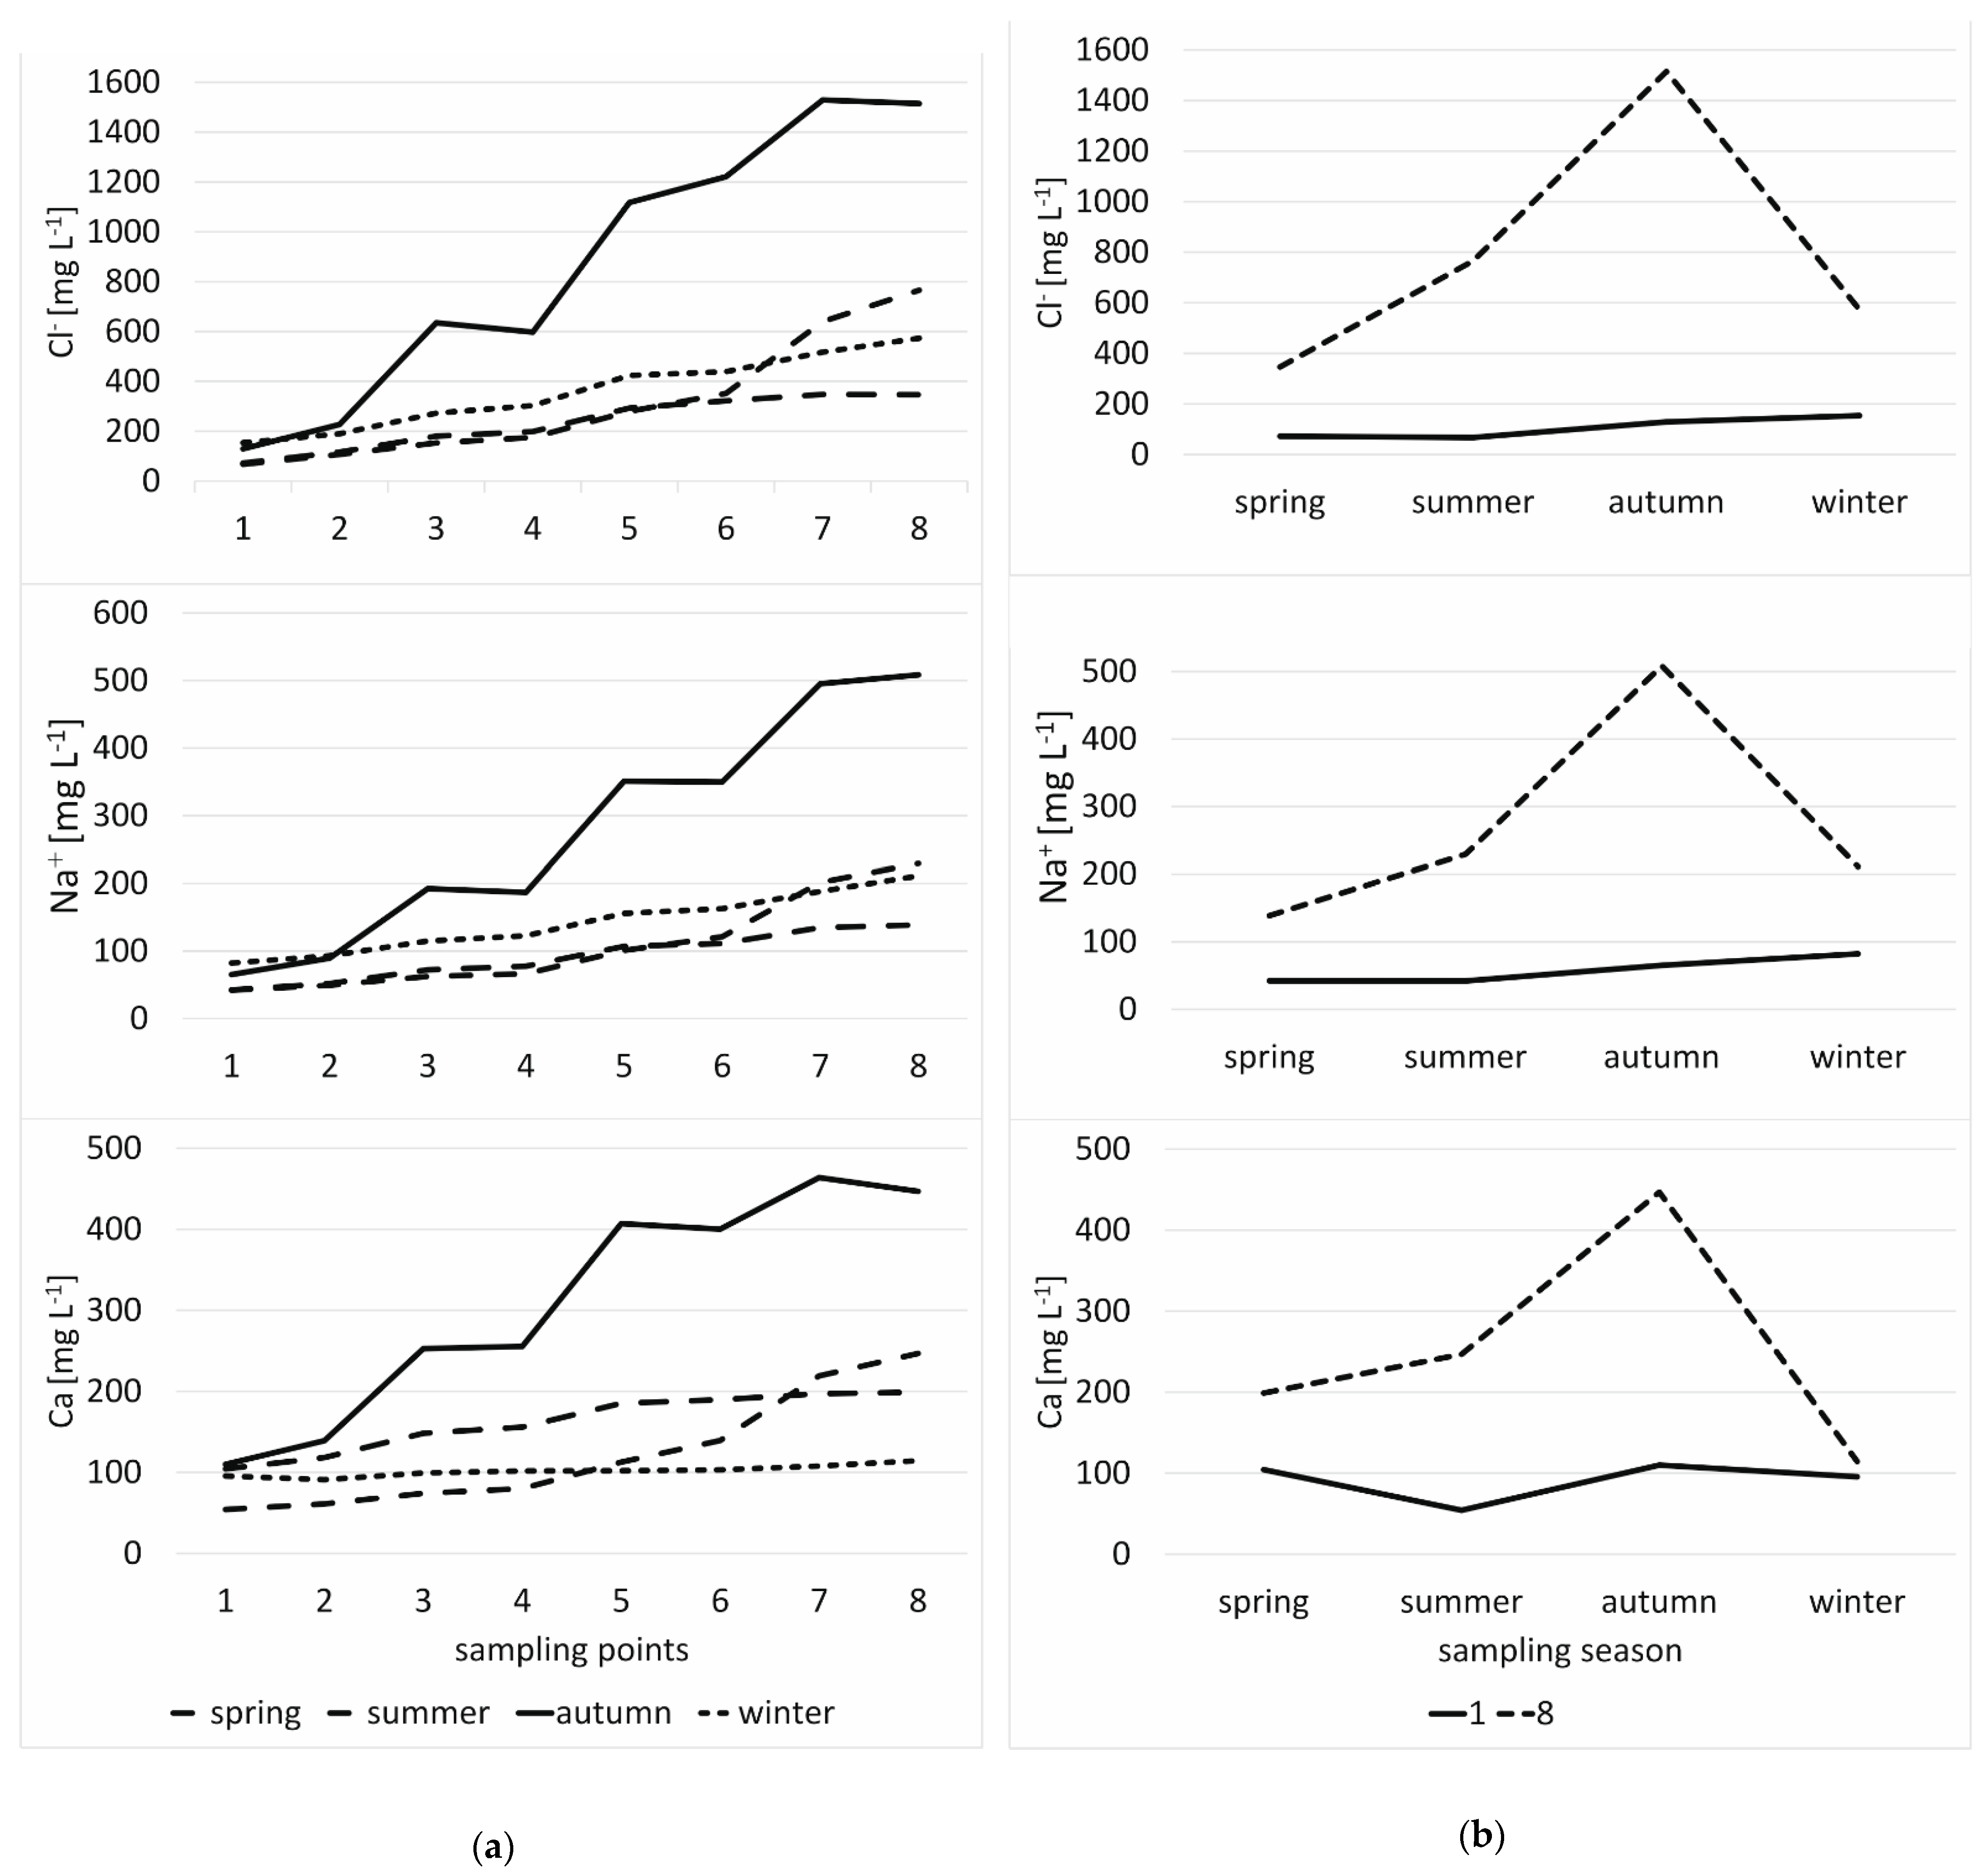
The values for sodium (Na+), chlorine (Cl−), and calcium (Ca) followed a trend similar to that of EC. They increased at subsequent measuring points as the river passed the sedimentation ponds (Figure 5a–c and Figure 6a and Table 2). Moreover, the values for all of them (Na+, Cl−, and Ca) were always significantly higher in autumn than in the other seasons (Figure 6b, Table 3). The value for Cl− was 44.8 mg L−1 at points 5, 6, 7, and 8, which was 12 to 18 times the level allowed by the RME. The value for Ca was 89.5 mg L−1 at those points, as much as three times the limit (Table 2).
The mean content of SO42− ions ranged from 95.96 mg L−1 to 116,44 mg L−1 (Table 2). Significantly higher SO42− content was found in the autumn and winter than in the spring and summer (Table 3). According to RME (2016), the permissible sulfate content of 79.8 mg L−1 was exceeded at each research point (Table 2).
The mean Mg content ranged from 10.39 to 11.78 mg L−1 (Table 2). The highest Mg content was found in the autumn and the lowest in the summer. According to RME regulations (2016), these values indicated the water was of good quality (Table 2).
The values for inorganic carbon (IC) ranged from 36.96 mg L−1 at sampling point 1 to 40.71 mg L−1 at sampling point 8 (Table 2). There were 2 homogeneous groups, where the IC content was significantly higher in winter and autumn than spring and summer (Table 3).
The content of trace elements, Cd, Ni, Cr, and Pb, were below the detection level of the device.
From among the trace elements researched, the standards took into account only aluminum, the concentration of which was exceeded at two testing points (6 and 8; Table 2).
The total mineralization of the Wilga River was from 600 mg L−1 to 1700 mg L−1 (Table 4). Mineralization at that level means medium-mineralized waters. It was observed that total mineralization increased significantly as the water passed the sampling points (Table 4). Chloride ions comprised the biggest share of the mineralization, and it dominated in the water sampled at most of the research points (Table 4). The contents of calcium and sodium ions were similarly high. Sulfate and hydrocarbon ions also had a significant share (above 20% mval) in the mineralization. The high level was observed at the initial sampling points (points 1–2-SO42− points 1–4-HCO3−). All ions of high importance in mineralization (Cl−, Ca+, Na+, HCO3−, SO42−) were associated with products and waste from the production of caustic soda by the Solvay method.
4. Discussion
The water chemistry properties (EC, Na+, Cl−, and Ca) changed noticeably as the Wilga River flowed through the area of the sedimentation ponds. Increased values of these indicators resulted from the specific geochemical composition of the landfill—sedimentation ponds formed as a by-product of the production of sodium carbonate (Na2CO3) using the Solvay method. The products obtained by the Solvay method include calcium carbonate and sodium chloride, with ammonia as an auxiliary material. The waste generated by the method includes: NaCl, CaCl2, Ca(OH)2, CaCO3, CaSO4, and SiO2. These sedimentation ponds constitute a serious ecological problem, causing strong salinity in the surrounding groundwater and contaminating natural water reservoirs and soil [18]. Moreover, as Womble [17] reported, the precipitation and deposition of waste from the Solvay method may be fundamental to the biogeochemistry of aquatic ecosystems, as they are linked to cycles of other components such as carbon and phosphorus. According to Polish standards (Regulation of the Ministry of Environment of 21 July 2016) [20], the water quality of the Wilga River was assessed to be poor on the basis that it exceeded EC, Cl−, Ca, SO42− and Al values at two of eight sampling points. Moreover, comprehensive studies for water status monitoring (biological, physicochemical, morphological elements and chemical status of rivers) have been carried out in Poland by the Chief Inspectorate for Environmental Protection [21]. The studies carried out in 2017 showed that the waters of the Wilga River examined just at the estuary of the Vistula (50.04341, 19.93393; a dozen km from the pollution emitter) still showed high EC values (2834 µS cm−1), SO42− (120.77 mg L−1), Cl− (922.5 mg L−1), and Zn (0.050 mg L−1) concentration [21]. The European Water Quality Standards Regulation (Directive 2008/105/EC) sets environmental quality standards in the field of water policy [22]. The US government sets standards for priority substances of trace metals and their compounds, benzene, PAHs and pesticides (Federal Regulation for Water Quality Standards, 40 CFR 131) [23]. These standards were set because of the significant risk these substances may pose in the aquatic environment. However, these standards do not take into account the researched elements. Therefore this water quality assessment was based on the Polish standards. The highest levels of precipitation in 2017 (according to https://en.tutiempo.net/climate/poland.html [24] were recorded in July (142.76 mm) and August (73.15 mm), and the lowest were recorded in the February–April period (average 13 mm) and November (7.1 mm). In the June–August period, no measurements were taken, but it can be seen that in the autumn season (measurement done at October) following the rainy summer (July–August), there is a much higher value of products stored in the sedimentation pond (EC, HCO3−, Cl, Na, Ca, SO42−) in the water of Wilga River, which may be the result of direct surface runoff from the sedimentation pond to river.
In the United States, Onondaga Lake (located in Central New York, immediately northwest of and adjacent to Syracuse, New York) is one of the most polluted lakes, a condition that was probably caused by the high industrialization of the region—waste is still entering it that resulted from the Solvay process (the production of caustic soda) beds located along Nine Mile Creek) [12,15,25]. Onondaga lake (researched in 1990s) was extremely saline (450-500 mgL−1 Cl−; the value was especially high after the development of the salt industry). It was also rich in calcium carbonate and trace elements [26]. In addition to the problem of the high salinity of Lake Onondaga, there was also an unnaturally high level of CaCO3 connected with soda ash production (0.35 kg of Ca2+ waste was discharged for each 1 kg of Na2CO3 produced) [17]. Eliminating the salt pollution that continues to come from the waste beds would reduce the chloride concentrations of the lake to less than 250 milligrams per liter. Without this loading, the total salt content of Onondaga Lake could approach 0.05%, which is close to the levels of other freshwater lakes in the area [25]. The Solvay method was also used in Austria, in the Solvay quarry in Karbach on the eastern side of Lake Traunsee [16].
Most factories using this technology are located on the coasts of seas and oceans, thanks to which the pre-treated brine can be discharged directly into the sea, and there is no need to create sedimentation ponds. This is how, for example, Sunshield Chemicals Solvay in India operates [27]. However, there are very few publications that clearly show the water contamination or salinity resulting from the Solvay process. However, the salinity of the water is a common phenomenon. It also occurs in African countries [15] and in the east (e.g., in Saudi Arabia and Bangladesh) [28,29], and its causes include drought and geological conditions. Kitheka [15] noted significant seasonal variations of salinity in the Athi River basin in Kenya. He showed that salinity levels progressively increased during the dry season (January–March and July–October), but declined rapidly during the rainy seasons (April–June and November–December) [15]. In the Wilga River, it was observed that Cl−, Na+, and Ca concentrations were the highest in autumn. This might then be followed by the flushing of salt from the sedimentation ponds and its subsequent conveyance into the river. The pH value was also observed in the summer and autumn seasons, when the precipitation was higher than in other seasons. A correlation analysis was performed, for which pH was used, along with the obtained weather data (as precipitation) at the times when water samples were collected. The correlation analyses indicated connections between pH and precipitation (r = −0.6985, p < 0.005)—this means, the lower the precipitation (rainfall), the higher the pH. Less rainfall means low water level (however, this has not been tested in studies and is only a hypothesis, but the phenomenon was noticed by Kitheka [15]), and therefore a higher concentration of basic elements from waste deposited in sedimentation ponds in less water.
The high concentration of sodium carbonates and sodium sulfates in New South Wales appears in groundwater brines, and is usually found in tertiary or quaternary evaporite deposits or in brines [30]. Sodium carbonate (soda ash) and sodium sulfate also occur under natural conditions (e.g., Thermonatrite, Trona, Thenardite, Hanksite, Burkeite Green River, Wyoming, USA, Lake Magadi, Kenya; Nahcolite Searles Lake, California, USA, Goodenough Lake, Canada, Tanzania and Wadi el Natrun, Egypt) [30]).
5. Conclusions
Observation of chemical changes in the Wilga River is all the more important because the sedimentation ponds of the former Soda “Solvay” Plant are in Krakow, where the population density is particularly high (780,000 people) and the need to use recreational areas (green zones) is particularly important.
The pH of the Wilga River in the researched area was at an appropriate level according to the standard for human consumption (Regulation of the Minisry of Health of 7 December 2017 on the quality of water intended for human consumption). That is, it was in the range of 6.5–9.5 [30]. However, the EC value exceeded the standards for human consumptions (range according to 2.500 µS cm−1), so the water was classified as unsuitable for consumption on that basis.
The concentration of Cl−, Na+, and EC significantly increased along the flow of river (points 7 and 8 compared to point 1—control). The highest content of Cl−, Na+, Ca and the highest EC values occurred after passing the sedimentation ponds. With respect to seasonal variation, it was observed that the highest content of Cl−, Na+, and Ca occurred in the autumn. This may be due to significant atmospheric precipitation and runoff of sediment into the waters of the Wilga River.
The quality of the water in the Wilga River is classified as being below acceptable levels, mainly because of the very high values of EC, SO42−, Ca, and locally Al (in two out of eight research points). Other parameters that seem to be at a high content level, i.e., Na−, are not included in the Polish and international standards: RME [20], The European Environmental Water Quality Standards [22], and the US Federal Regulation for Water Quality Standards (40 CFR 131) [23]. We conclude that despite revitalization in the 1990s, the long-term effect of industrial water drainage remains dangerous in terms of the chemical and biological quality of water in the Wilga River. Many years after the cessation of soda production, sludge deposition, and the reclamation process, there are still long-term, adverse impacts on the environment and the pollution of the Wilga River. This is particularly evident in the increase of EC, Na+, Cl−, and Ca, the concentration of which increased along the river, indicating the important impact of the sedimentation ponds being in contact with the river waters on the chemistry of the researched waters. A huge load of sodium, calcium, and chlorine is discharged (leachates draining) into the river system because of a lack of good insulation.
The high salinity of the Wilga River could be dangerous in the long term, because the distance from the sedimentation ponds to the place where the Wilga flows into the Vistula—one of the main Polish rivers—is only 5 km. Moreover, it is very important to arouse interest in such problems and build an understanding of the long-lasting process of restitution of sedimentation ponds and adjacent areas, including the river ecosystem.
Supplementary Materials
The following are available online at https://0-www-mdpi-com.brum.beds.ac.uk/2071-1050/13/2/993/s1, Table S1: Collected data in Wilga River in 2018/2019.
Author Contributions
Conceptualization, M.P. and J.L.-C.; methodology, M.P. and J.L.-C.; formal analysis, M.P. and J.L.-C.; investigation, J.L.-C. and M.P.; resources, M.P.; data curation, J.L.-C.; writing—original draft preparation, J.L.-C.; writing—review and editing, M.P. and J.L.-C.; visualization, J.L.-C.; supervision, M.P.; project administration, J.L.-C. and M.P.; funding acquisition, J.L.-C. and M.P. All authors have read and agreed to the published version of the manuscript.
Funding
This research was partially financed by Statutory Funds of the Ministry of Science and Higher Education of Poland, the Department of Forest Ecology and Silviculture (SUB/040012/D019).
Institutional Review Board Statement
Not applicable.
Informed Consent Statement
Not applicable.
Data Availability Statement
The data presented in this study are available in the supplementary material.
Acknowledgments
This research is a part of the developed research project for the dissertation of Justyna Likus-Cieślik. Special thanks to Paweł Nowak, diploma Student of the Department of Forest Ecology and Silviculture for collecting water samples.
Conflicts of Interest
The authors declare no conflict of interest.
References
- Mohan, D.; Chander, S. Removal and recovery of metal ions from acid mine drainage using lignite—A low cost sorbent. J. Hazard. Mater. 2006, 137, 1545–1553. [Google Scholar] [CrossRef]
- Valente, T.; Grande, J.; De La Torre, M.; Santisteban, M.; Cerón, J. Mineralogy and environmental relevance of AMD-precipitates from the Tharsis mines, Iberian Pyrite Belt (SW, Spain). Appl. Geochem. 2013, 39, 11–25. [Google Scholar] [CrossRef]
- Likus-Cieślik, J.; Smoliński, A.; Pietrzykowski, M.; Bak, A. Sulphur contamination impact on seasonal and surface water chemistry on a reforested area of a former sulphur mine. Land Degrad. Dev. 2019, 30, 212–225. [Google Scholar] [CrossRef]
- Katzur, J.; Haubold-Rosar, M. Amelioration and reforestation of sulfurous mine soils in Lusatia (Eastern Germany). Water Air Soil Pollut. 1996, 91, 17–32. [Google Scholar] [CrossRef]
- Likus-Cieślik, J.; Pietrzykowski, M.; Chodak, M. Chemistry of Sulfur-Contaminated Soil Substrate from a Former Frasch Extraction Method Sulfur Mine Leachate with Various Forms of Litter in a Controlled Experiment. Water Air Soil Pollut. 2018, 229, 1–14. [Google Scholar] [CrossRef] [PubMed] [Green Version]
- Doumas, P.; Munoz, M.; Banni, M.; Becerra, S.; Bruneel, O.; Casiot, C.; Cleyet-Marel, J.-C.; Gardon, J.; Noack, Y.; Sappin-Didier, V. Polymetallic pollution from abandoned mines in Mediterranean regions: A multidisciplinary approach to environmental risks. Reg. Environ. Chang. 2018, 18, 677–692. [Google Scholar] [CrossRef]
- Blodau, C. A review of acidity generation and consumption in acidic coal mine lakes and their watersheds. Sci. Total. Environ. 2006, 369, 307–332. [Google Scholar] [CrossRef] [PubMed]
- Cánovas, C.R.; Olias, M.; Vazquez-Suñé, E.; Ayora, C.; Nieto, J.M. Influence of releases from a fresh water reservoir on the hydrochemistry of the Tinto River (SW Spain). Sci. Total. Environ. 2012, 416, 418–428. [Google Scholar] [CrossRef]
- Dold, B. Evolution of Acid Mine Drainage Formation in Sulphidic Mine Tailings. Minerals 2014, 4, 621–641. [Google Scholar] [CrossRef] [Green Version]
- Jarvie, H.P.; Oguchi, T.; Neal, C. Exploring the linkages between river water chemistry and watershed characteristics using GIS-based catchment and locality analyses. Reg. Environ. Chang. 2002, 3, 36–50. [Google Scholar] [CrossRef]
- Gliniak, M.; Pawul, M.; Sobczyk, W. Wpływ transportu i składowisk poprzemysłowych byłych Krakowskich Zakładów Sodowych “Solvay” na stan i jakość wody rzeki Wilga w Krakowie. Logistyka 2014, 4, 4295–4302. (In Polish) [Google Scholar]
- Rodzkin, A.; Volk, T.A. Using shrub willow for biological reclamation of areas with raised soil salinity. In Proceedings of the 12th Eco-Conference® on Environmental Protection of Urban and Suburban Settlements, Novi Sad, Serbia, 27–29 September 2017. [Google Scholar]
- Sprague, L.A. Drought effects on water quality in the South Platte River Basin, Colorado. JAWRA J. Am. Water Resour. Assoc. 2005, 41, 11–24. [Google Scholar] [CrossRef] [Green Version]
- Jones, E.; Van Vliet, M.T.H. Drought impacts on river salinity in the southern US: Implications for water scarcity. Sci. Total. Environ. 2018, 644, 844–853. [Google Scholar] [CrossRef] [PubMed]
- Kitheka, J.U. Salinity and salt fluxes in a polluted tropical river: The case study of the Athi river in Kenya. J. Hydrol. Reg. Stud. 2019, 24, 100614. [Google Scholar] [CrossRef]
- Steinhauser, G. Cleaner production in the Solvay Process: General strategies and recent developments. J. Clean. Prod. 2008, 16, 833–841. [Google Scholar] [CrossRef]
- Womble, R.N.; Driscoll, C.T.; Effler, S.W. Calcium carbonate deposition in Ca2+ polluted Onondaga Lake, New York, USA. Water Res. 1996, 30, 2139–2147. [Google Scholar] [CrossRef]
- Sroczyński, W. Perspektywy zagospodarowania tzw. “Białych Mórz” na terenach po byłych Krakowskich Zakładach Sodowych “Solvay”. Pr. Kom. Kraj. Kult. 2008, 10, 423–430. (In Polish) [Google Scholar]
- Baścik, M. Wody Powierzchniowe (Surface Water). In Opracowanie Ekofizjograficzne Miasta Krakowa (An Ecophysio-Graphic Study of the City of Krakow); Degórska, B., Ed.; Urząd Miasta Krakowa: Krakow, Poland, 2010; pp. 40–47. [Google Scholar]
- RME, Regulation of the Ministry of Maritime Economy and Inland Navigation of 11 October 2019—Regulation Establishing Way of Classifying the State of Uniform Parts of Surface Waters and Environmental Quality Standards for Priority Substances, (Rozporządzenie Ministra Gospodarki Morskiej i Żeglugi Śródlądowej z dnia 11 Października 2019 r. w Sprawie Klasyfikacji stanu Ekologicznego, Potencjału Ekologicznego i Dtanu Chemicznego oraz Sposobu Klasyfikacji Stanu Jednolitych Części wód Powierzchniowych, a Także Środowiskowych norm Jakości dla Substancji Priorytetowych (Dz. U. poz. 2149)). Available online: https://isap.sejm.gov.pl/isap.nsf/DocDetails.xsp?id=WDU20190002149 (accessed on 1 December 2020). (In Polish)
- Chief Inspectorate for Environmental Protection. Assessment of the State of Water Bodies of Rivers and Dam Reservoirs in 2017–2018. Available online: https://www.gios.gov.pl/pl/stan-srodowiska/monitoring-wod (accessed on 1 December 2020). (In Polish)
- EQS Environmental Quality Standards Applicable to Surface Water. Directive 2008/105/EC Setting Environmental Quality Standards in the Field of Water Policy. Available online: https://eur-lex.europa.eu/legal-content/EN/TXT/?uri=LEGISSUM%3Al28180 (accessed on 15 June 2020).
- EPA Federal Regulation for Water Quality Standards (40 CFR 131). Available online: https://www.epa.gov/wqs-tech/federal-water-quality-standards-requirements (accessed on 15 June 2020).
- TuTiempo.net. Available online: https://en.tutiempo.net/climate/poland.html (accessed on 1 December 2020).
- OP On Lake Partners. Cleaning Up Onondaga Lake. Available online: http://www.onlakepartners.org (accessed on 15 June 2020).
- Rowell, H.C. Paleolimnology of Onondaga Lake: The History of Anthropogenic Impacts on Water Quality. Lake Reserv. Manag. 1996, 12, 35–45. [Google Scholar] [CrossRef]
- Edser, C. Solvay accelerates its development in India with the acquisition of Sunshield Chemicals. Focus Surfactants 2012, 2012, 2–3. [Google Scholar] [CrossRef]
- Subyani, A. Hydrochemical identification and salinity problem of ground-water in Wadi Yalamlam basin, Western Saudi Arabia. J. Arid. Environ. 2005, 60, 53–66. [Google Scholar] [CrossRef]
- Rakib, M.; Sasaki, J.; Matsuda, H.; Quraishi, S.B.; Mahmud, J.; Doza, B.-; Ullah, A.K.M.A.; Fatema, K.J.; Newaz, A.; Bhuiyan, M.A. Groundwater salinization and associated co-contamination risk increase severe drinking water vulnerabilities in the southwestern coast of Bangladesh. Chemosphere 2020, 246, 125646. [Google Scholar] [CrossRef] [PubMed]
- NDPI Sodium Compounds. NSW Department of Primary Industries. Available online: https://www.resourcesandgeoscience.nsw.gov.au/__data/assets/pdf_file/0006/238209/Sodium.pdf (accessed on 15 June 2020).
Figure 1.
The location of the Wilga River on a map of Poland (a), and in the Lesser Poland Voivodeship (b).
Figure 1.
The location of the Wilga River on a map of Poland (a), and in the Lesser Poland Voivodeship (b).

Figure 2.
Fragment of the Wilga River on the plan of sedimentation ponds (a), and on the Krakow city plan (b) with locations of sampling points.
Figure 2.
Fragment of the Wilga River on the plan of sedimentation ponds (a), and on the Krakow city plan (b) with locations of sampling points.

Figure 3.
Values and range of variation in sampling points for pH (a) and electrical conductivity (EC) (b).
Figure 3.
Values and range of variation in sampling points for pH (a) and electrical conductivity (EC) (b).

Figure 4.
Values for electrical conductivity (EC) at sampling points (1—before entering the sedimentation ponds area and 8—after flowing through the premises of the former soda factories) (a) and the EC values by season (b).
Figure 4.
Values for electrical conductivity (EC) at sampling points (1—before entering the sedimentation ponds area and 8—after flowing through the premises of the former soda factories) (a) and the EC values by season (b).

Figure 5.
Chloride (a), sodium (b) and calcium (c) values and range of variation at sampling points.
Figure 5.
Chloride (a), sodium (b) and calcium (c) values and range of variation at sampling points.

Figure 6.
Na, Cl, Ca values at sampling points (a), and by season (b).


Table 1.
Locations of sampling points.
| Sampling Point No | Coordinates | Short Description of Localization |
|---|---|---|
| 1 | 50.001281 N, 19.935144 E | Before entering the sedimentation ponds area |
| 2 | 50.004980 N, 19.935918 E | Between the sedimentation ponds |
| 3 | 50.009018 N, 19.936852 E | |
| 4 | 50.010905 N, 19.937221 E | |
| 5 | 50.013738 N, 19.941125 E | |
| 6 | 50.015905 N, 19.939702 E | |
| 7 | 50.019201 N, 19.933157 E | |
| 8 | 50.024140 N, 19.927871 E | After flowing through the premises of former soda factories |
Table 2.
The mean pH, EC, and concentrations of elements in the Wilga River by sampling point.
| Sampling Point | 1 | 2 | 3 | 4 | 5 | 6 | 7 | 8 | RME Standards (MAC-EQS) 1 | ||
|---|---|---|---|---|---|---|---|---|---|---|---|
| Very Good Quality Class | Good Quality Class | ||||||||||
| pH | Mean | 7.5 | 7.6 | 7.5 | 7.5 | 7.5 | 7.5 | 7.5 | 7.4 | 7.4–8.0 | 6.5–8.0 |
| SD | 0.29 | 0.24 | 0.25 | 0.27 | 0.35 | 0.34 | 0.25 | 0.42 | |||
| EC [µS cm−1] | Mean | 845↑ | 960 | 1399 | 1434 | 2123 | 2211 | 2811 | 2888 | 542 | 677 |
| SD | 259 | 322 | 766 | 746 | 1371 | 1340 | 1732 | 1658 | |||
| Na+ [mg L−1] | Mean | 57.98 | 70.91 | 110.50 | 113.32 | 178.63 | 186.23 | 254.95 | 271.90 | n.d. | n.d. |
| SD | 19.45 | 23.50 | 59.12 | 54.59 | 117.52 | 111.25 | 162.76 | 162.45 | |||
| K+ [mg L−1] | Mean | 6.00 | 5.96 | 6.24 | 6.27 | 7.02 | 7.23 | 8.04 | 7.75 | n.d. | n.d. |
| SD | 2.54 | 2.17 | 2.60 | 2.60 | 3.45 | 3.31 | 3.91 | 3.14 | |||
| Cl− [mg L−1] | Mean | 105.62 | 160.01 | 310.09 | 318.67 | 528.36 | 583.44 | 758.55 | 799.98 | 29.9 | 44.8 |
| SD | 42.73 | 58.16 | 222.50 | 194.14 | 397.98 | 428.17 | 527.48 | 506.34 | |||
| NH4+ [mg L−1] | Mean | 0.06 | 0.05 | 0.07 | 0.05 | 0.12 | 0.12 | 0.30 | 0.15 | 0.377 | 1.205 |
| SD | 0.02 | 0.03 | 0.07 | 0.03 | 0.098 | 0.13 | 0.44 | 0.12 | |||
| NO3− [mg L−1] | Mean | 10.54 | 11.08 | 12.51 | 12.80 | 13.62 | 13.32 | 11.64 | 7.33 | 8.86 | 22 |
| SD | 4.74 | 4.74 | 6.75 | 5.05 | 4.04 | 5.29 | 5.14 | 4.92 | |||
| SO42− [mg L−1] | Mean | 95.96 | 92.61 | 96.86 | 96.13 | 100.17 | 105.20 | 113.70 | 116.44 | 49.5 | 79.8 |
| SD | 24.74 | 23.43 | 26.76 | 27.17 | 31.13 | 33.72 | 24.66 | 25.35 | |||
| Ca [mg L−1] | Mean | 88.3 | 105.5 | 148.5 | 155.3 | 215.6 | 224.1 | 263.4 | 269.0 | 80.1 | 89.5 |
| SD | 25.2 | 33.0 | 76.0 | 73.9 | 131.1 | 119.2 | 134.9 | 121.6 | |||
| Mg [mg L−1] | Mean | 10.39 | 10.44 | 10.43 | 10.60 | 10.77 | 11.09 | 11.32 | 11.78 | 6.6 | 12 |
| SD | 2.60 | 2.66 | 2.83 | 3.11 | 3.39 | 2.99 | 2.32 | 2.35 | |||
| IC [mg L−1] | Mean | 36.96 | 36.51 | 38.53 | 38.45 | 37.41 | 37.56 | 38.69 | 40.71 | n.d. | n.d. |
| SD | 7.73 | 8.40 | 13.01 | 13.37 | 13.18 | 12.74 | 12.11 | 10.59 | |||
| Zn [mg L−1] | Mean | 0.03 | 0.03 | 0.04 | 0.03 | 0.04 | 0.03 | 0.04 | 0.03 | n.d. | n.d. |
| SD | 0.04 | 0.03 | 0.05 | 0.041 | 0.05 | 0.04 | 0.05 | 0.04 | |||
| Al. [mg L−1] | Mean | 0.037 | 0.021 | 0.033 | 0.024 | 0.029 | 0.041 | 0.038 | 0.05 | 0.04 | 0.04 |
| SD | 0.022 | 0.015 | 0.015 | 0.004 | 0.0 | 0.02 | 0.01 | 0.02 | |||
Explanation: 1 under this standard, water quality is bad; n.d.-no data avaliable; bdl—below detection level; SD—standard deviation; green—very good quality class; blue—good quality class; red—values exceeding standards.
Table 3.
Values and variability of the most important selected water parameters in the sampling seasons.
Table 3.
Values and variability of the most important selected water parameters in the sampling seasons.
| Season | pH | EC [µS cm−1] | Cl− [mg L−1] | HCO3− [mg L−1] | SO42− [mg L−1] | Na [mg L−1] | Ca [mg L−1] | IC [mg L−1] | ||||||||
|---|---|---|---|---|---|---|---|---|---|---|---|---|---|---|---|---|
| spring | 7.7 | a | 1134.63 | a | 234.51 | a | 140.94 | a | 89.01 | a | 91.9575 | a | 162.24 | a | 27.73 | a |
| summer | 7.2 | b | 1252.13 | a | 317.34 | a | 152.37 | a | 74.40 | a | 109.16 | a | 123.43 | a | 29.97 | a |
| autumn | 7.4 | c | 3288.63 | b | 871.40 | b | 250.33 | b | 250.33 | b | 279.75 | b | 309.41 | b | 49.25 | b |
| winter | 7.8 | a | 1660.00 | a | 359.11 | a | 231.08 | b | 231.08 | b | 141.35 | a | 139.78 | a | 45.46 | b |
Explanation: a, b, c—significant differences (according to NIR post hoc test);
Table 4.
Changes in the content (share of total mineralization) of the most important ions, and mineralization of the water in the Wilga River as it flowed past the sedimentation ponds from the former soda plants.
Table 4.
Changes in the content (share of total mineralization) of the most important ions, and mineralization of the water in the Wilga River as it flowed past the sedimentation ponds from the former soda plants.
| Sampling Point | Cl− [%mval] | HCO3− [%mval] | SO42− [%mval] | Na+ [%mval] | Ca2+ [%mval] | Total Mineralisation [mg L−1] | |||||||
|---|---|---|---|---|---|---|---|---|---|---|---|---|---|
| Mean | 1 | 35.57 | a | 37.78 | a | 24.92 | a | 25.74 | a | 43.65 | a | 601 | a |
| SD | 5.85 | 5.08 | 4.48 | 6.20 | 6.38 | 131 | |||||||
| Mean | 2 | 46.26 | b | 31.71 | a | 20.43 | ab | 27.70 | ab | 45.82 | a | 680 | a |
| SD | 4.12 | 3.71 | 3.04 | 5.41 | 5.56 | 175 | |||||||
| Mean | 3 | 58.66 | c | 24.16 | b | 15.78 | bc | 31.43 | abc | 47.33 | a | 931 | ab |
| SD | 8.30 | 4.59 | 3.71 | 5.33 | 6.15 | 461 | |||||||
| Mean | 4 | 60.61 | c | 23.08 | b | 14.99 | cd | 31.50 | abc | 48.19 | a | 948 | ab |
| SD | 6.11 | 3.52 | 2.94 | 4.90 | 5.78 | 427 | |||||||
| Mean | 5 | 70.53 | d | 16.86 | c | 11.64 | cde | 35.42 | bcd | 48.61 | a | 1283 | ab |
| SD | 6.88 | 4.18 | 3.00 | 4.99 | 4.83 | 754 | |||||||
| Mean | 6 | 72.33 | d | 15.61 | c | 11.20 | cde | 35.51 | bcd | 48.89 | a | 1360 | ab |
| SD | 6.38 | 3.91 | 2.95 | 4.87 | 4.18 | 767 | |||||||
| Mean | 7 | 76.05 | d | 13.24 | c | 10.13 | de | 38.94 | cd | 47.12 | a | 1659 | b |
| SD | 7.29 | 4.33 | 3.47 | 5.33 | 3.90 | 917 | |||||||
| Mean | 8 | 76.73 | d | 13.23 | c | 9.72 | e | 39.93 | d | 46.51 | a | 1735 | b |
| SD | 6.99 | 4.14 | 3.16 | 5.68 | 4.46 | 871 | |||||||
Explanation: a, b, c, d—significant differences (according to NIR post-hoc test); min.—minimum value; max.—maximum value; SD—standard deviation.
Publisher’s Note: MDPI stays neutral with regard to jurisdictional claims in published maps and institutional affiliations. |
© 2021 by the authors. Licensee MDPI, Basel, Switzerland. This article is an open access article distributed under the terms and conditions of the Creative Commons Attribution (CC BY) license (http://creativecommons.org/licenses/by/4.0/).
Share and Cite
MDPI and ACS Style
Likus-Cieślik, J.; Pietrzykowski, M. The Influence of Sedimentation Ponds of the Former Soda “Solvay” Plant in Krakow on the Chemistry of the Wilga River. Sustainability 2021, 13, 993. https://0-doi-org.brum.beds.ac.uk/10.3390/su13020993
AMA Style
Likus-Cieślik J, Pietrzykowski M. The Influence of Sedimentation Ponds of the Former Soda “Solvay” Plant in Krakow on the Chemistry of the Wilga River. Sustainability. 2021; 13(2):993. https://0-doi-org.brum.beds.ac.uk/10.3390/su13020993
Chicago/Turabian StyleLikus-Cieślik, Justyna, and Marcin Pietrzykowski. 2021. "The Influence of Sedimentation Ponds of the Former Soda “Solvay” Plant in Krakow on the Chemistry of the Wilga River" Sustainability 13, no. 2: 993. https://0-doi-org.brum.beds.ac.uk/10.3390/su13020993
Note that from the first issue of 2016, this journal uses article numbers instead of page numbers. See further details here.