
Planning Suitable Transport Networks for E-Scooters to Foster Micromobility Spreading
by
 , , , and
Martina Fazio
1,* ,
,
Nadia Giuffrida
2,
Michela Le Pira
3,
Giuseppe Inturri
4 and
Matteo Ignaccolo
3 1
Department of Physics and Astronomy, University of Catania, 95123 Catania, Italy
2
School of Architecture, Planning and Environmental Policy, University College Dublin, University College Richview Campus, Belfield, D04 V1W8 Dublin, Ireland
3
Department of Civil Engineering and Architecture, University of Catania, 95123 Catania, Italy
4
Department of Electric Electronic and Computer Engineering, University of Catania, 95123 Catania, Italy
*
Author to whom correspondence should be addressed.
Sustainability 2021, 13(20), 11422; https://0-doi-org.brum.beds.ac.uk/10.3390/su132011422
Submission received: 31 July 2021
/
Revised: 9 October 2021
/
Accepted: 11 October 2021
/
Published: 15 October 2021
(This article belongs to the Special Issue Service Quality in Public Transport Systems and Personal Mobility Vehicles)
Abstract
:Micromobility has a high potential to change mobility habits towards the use of sustainable transport modes. The shared mobility paradigm encourages the development of new mobility services, such as bike and e-scooter sharing, potentially reducing the need of car ownership, enlarging the accessibility of public transport and enriching the transport options needed to exploit Mobility as a Service solutions. While bike-sharing services have been used in urban areas for many years, shared e-scooter services (and private e-scooters) have been spreading only in the last few years. Due to the novelty of this mode, few attempts have been made for proper micromobility network planning. This paper proposes a multicriteria GIS-based analysis aimed at planning priority networks for e-scooters, focusing on safety, transport and land use characteristics. The case study is Catania, a medium-sized city in southern Italy, which suffers from a lack of adequate infrastructures for such sustainable modes of transport. By applying the methodology, it is possible to prioritise the road network elements that better fit the needs of e-scooters, thus paving the way for suitable infrastructures and network planning.
1. Introduction
Micromobility is a widely used term for low speed modes of transport based on the use of electric-powered personal micro vehicles, such as e-scooters. E-bikes can be included in this definition as they have been in the USA, even if in some countries, such as Italy, micromobility usually refers to small electric devices, thus excluding e-bikes. The use of these vehicles, mostly for short trips, is fostered via new shared mobility services, such as bike sharing or e-scooter sharing [1,2]. Since the use of the latter has been spreading recently all around the world, there are still many open issues in terms of suitable infrastructure, demand analysis and safety evaluations. The wide spatio–temporal availability of these services, made possible by mobile applications that easily match real time demand and supply, favors the use of micromobility in combination with other modes of transport, such as fixed and demand-responsive transit. Thus fostering a shift from a car dependent mobility model towards a Mobility as a Service (MaaS) approach, implying multimodal and seamless door-to-door trips [3,4,5,6]. Integrating micromobility with public transport could also enlarge its catchment area, increase its accessibility, and reduce congestion phenomena and pollution, thus making cities more liveable [7].
The outbreak of the COVID-19 pandemic has certainly further increased the potential for micromobility; in the first phase after the lockdown, due to social distancing restrictions, people had to compete to access to transit services, which had considerably reduced their capacity, especially in terms of available seats. In this respect, micromobility can be considered an option to discourage an immoderate use of cars and a valid alternative for those who do not own a private vehicle; in this way, this new type of mobility can contribute both to sustainability and to social inclusion [8,9].
Despite its great potential, the use and regulation of micromobility varies a lot between different parts of the world with a multitude of different operators performing the service in the same cities [10]. E-scooters have been a reality in the cities of the United States for several years [1]. In Europe, they have recently become part of everyday life and are increasingly being used for systematic trips and for tourism purposes. In Italy, the debate around the use of e-scooters as a new transport mode had been very lively, until their official regularisation in early 2020 (https://www.themayor.eu/en/problem-solved-italy-equates-e-scooters-to-bicycles (accessed on 12 October 2021)). The standard provides the same traffic rules for e-scooters as for bicycles, in order to avoid the use of the vehicles on the sidewalk in proximity to pedestrians.
Given the very recent introduction of these new services in cities, there are still few data relating to this phenomenon to analyse. Besides this, policy makers should be able to govern the transition towards micromobility and MaaS, adapting cities and encouraging sustainable intermodal trips.
A recent study showed the need to plan and redesign urban spaces to accommodate this emerging mode of transport [11]. However, at present there are no studies aimed at planning and designing networks for micromobility. This paper presents a methodology for a preliminary evaluation of the suitability for use by e-scooters of portions of existing transport networks in urban areas. This topic has been under studied in the current literature, which is mainly focused on cycling infrastructures (e.g., Hull and O’Holleran [12]). However, the differences between bicycles and e-scooters point to the need for defining ad-hoc criteria to assign priority and assess safe e-scooter infrastructures [13]. In this respect, the report by Ernst & Young on micromobility, “Micromobility: Moving cities into a sustainable future” [14], formulates seven recommendations for policy makers to foster micromobility. In particular, it suggests supporting safety efforts and investing in alternative mobility infrastructures. Similarly, the POLIS report, “Macro Managing Micro Mobility” [15], suggests focusing on infrastructures as one of the key strategic issues. Spatial analyses are useful for this purpose. They allow one to take into consideration multiple heterogenous criteria regarding land use characteristics, and the potential demand and supply and to combine them to derive emergent networks. This approach has been used by Giuffrida et al. [16] for bicycle network design and by Fazio et al. [17] for bike station locations and design. In this paper, we use a similar approach to design networks that are compatible for e-scooters and road traffic.
The remainder of the paper is organised as follows. Section 2 presents an overview of the relevant literature and the research framework. Section 3 introduces the methodology and the steps of the analysis, which is applied to the case study of the Italian city of Catania in Section 4. Section 5 concludes the paper and proposes future research steps.
2. Literature Review
The rapid spread of e-scooters has led to an open debate on their impact on users’ travel habits, safety perception and use of public spaces. Furthermore, in most of the cases, the lack of ad-hoc legislation and infrastructure raises many concerns among citizens and public administrations [18,19,20]. There are many studies that have addressed this topic, focusing on different issues; some of these studies have focused on users’ perception of using e-scooters. Tuncer et al. [2] carried out five weeks of fieldwork observations in Paris (France) to analyse users’ experiences. They found out that users perceive e-scooters as a hybrid mode of transport capable of combining the characteristics of other modes of transport (i.e., vehicles, bikes and pedestrian mobility). James et al. [21] examined the pedestrian safety perception towards e-scooters. Through a survey, they inferred that pedestrians feel less safe around e-scooters than with bikes. In addition, they addressed the parking issue, finding that there are a percentage of users who improperly park e-scooters on sidewalks, obstructing the passage of pedestrians. Zhang et al. [20] focused on infrastructure preferences of e-scooter users. They performed a stated preference survey and estimated a recursive logit route choice model using GPS tracks collected on the Virginia Tech campus. Results underline the willingness of e-scooter users to travel in bikeways and multi-use paths. Gössling [19] compared ten cities in order to identify the major concerns related to the introduction of e-scooter services. The analysis demonstrated that, if not properly regulated, e-scooter services could create obstacles in terms of safety (i.e., speed limit), cluttering, inappropriate rider behaviour and vandalism. Campisi et al. [22] estimated an ordered logit model in order to identify users’ characteristics that can influence the propensity of renting micromobility devices. The study was applied in Palermo (Italy) and the main results show that young people and students seem to be more prone to use this mode, while there is no gender difference. Another study, also conducted in Palermo, focused on the analysis of the performance level of e-scooters providing useful suggestions for authorities for the evaluation of strategies to foster personal mobility vehicles (PMVs) transport systems [23].
Other researchers analysed to what extent e-scooters fit into users’ travel habits using spatial approaches. Jiao and Bai [24] conducted a spatial analysis with the aim of investigating the correlation between e-scooter travel patterns and land use. Results show that high-density areas, in terms of residents and points of interests, are those crossed by the highest number of e-scooter trips. This is one of the reasons why transport operators decided to invest in cities with high densities, neglecting the important role that micromobility may have as a last-mile solution in less dense areas with poor connections to mass rapid transit [25]. Bai and Jiao [26] made a comparison between Austin and Minneapolis (U.S.) by evaluating the spatio–temporal characteristics of the use of e-scooters. They found that in both cities the e-scooter usage was concentrated in downtown areas and university campuses. On the contrary, the temporal characteristics are differently distributed in the two cities. The work of McKenzie [27] also analysed the spatio–temporal usage of e-scooters by focusing on the differences between dockless e-scooters and dock-based bicycle services in Washington (U.S.). The results suggest that people prefer the bike-sharing service for commuting trips rather than e-scooters. The latter seem to be used mostly for leisure, recreation and tourism activities. As the authors claim, the reason for this difference can be the different periods that these services have been in operation. In this respect, users would entrust commuting trips to a service that has proven to be reliable for a longer time. Caspi et al. [28] proposed a spatial approach to examine e-scooter sharing trip patterns taking into consideration land use, built environment and demographic aspects. They used a dataset from an open data platform that provides the characteristics of e-scooter trips (e.g., departure and arrival times). Their results show that people use e-scooter services mainly in the centre of the city and in areas with bicycle infrastructures. Moran et al. [10] examined the geographical position of e-scooter service areas with the aim of determining the spatial variance of e-scooter positioning. The results show that operators restrict e-scooters to high-density neighbourhoods. The authors also underline the necessity of ensuring e-scooter services to outlying and poor neighbourhoods to struggle against social exclusion. In this respect, the study of Qian et al. [29], that developed a spatial-based methodology to quantify bike-sharing services for areas characterised by the presence of disadvantaged populations using the concept of “communities of concern” (CoCs), is notable.
Some recent studies dealt with other important issues regarding e-scooters. Yang et al. [30] presented a safety analysis identifying the pattern of crashes linked to the use of e-scooters. They collected accident data from 2017 to 2019, and, through a descriptive and cross tabulation analysis, they highlighted that children and elderly people are subjected to the greatest risk and that the severity of accidents worsens during the night. Sandoval et al. [31] propose a methodology to find the optimal location of e-scooter parking facilities based on what could be reasonably intended as destinations of e-scooter trips. Data are provided from shared urban mobility devices and are analysed through unsupervised machine learning algorithms to estimate the areas with a high number of trip destinations. He and Shin [32] elaborated a methodology based on three different e-scooter trips’ datasets to predict the future e-scooter flows through a neural network algorithm. Masoud et al. [33] elaborated a mathematical model able to allocate e-scooters according to the minimisation of distance from chargers’ locations. They simulated different scenarios in which the number of e-scooters and chargers vary with coordinates that are randomly generated.
To sum up, the literature related to micromobility and, in particular, e-scooter’s usage is growing rapidly and is addressing many important issues.
However, no study has so far has focused on methods to plan suitable infrastructures and networks for e-scooters that jointly consider transport and land use characteristics and safety concerns. This paper presents a simple procedure based on a multicriteria spatial approach for planning suitable networks for e-scooters. A similar approach has already been used in the case of cycling infrastructure planning [16,17,34,35] and pedestrian facilities audits [36,37]. Usually, micromobility vehicles include both bicycles and e-scooters; however, this study wants to underline their differences and bring out their peculiarities with the aim of drawing a methodology to prioritise suitable links for e-scooter paths and networks.
3. Material and Methods
This section presents the methodology steps used for the analysis of the suitability of a transport network for e-scooters trips. A flowchart of the methodology proposed is shown in Figure 1. After defining the study area and the related road network, different criteria are selected in order to characterise each link of the network. The criteria are in turn used to calculate a priority index (PI) and a safety index (SI) for each link of the network. The priority index takes into account land use and transport characteristics that make e-scooters suitable to satisfy a potential mobility demand. If the PI is higher than a given threshold, then the SI is used to understand which type of right-of-way is needed (segregated or mixed-use path). The analysis is performed by using the QGIS software [38], an open-source GIS desktop application for the visualisation, analysis and manipulation of spatial data in a geographic environment. Each step is explained with more details in the following subsections.
3.1. Study Area and Transport Network Definition
The selection of a study area in the case of e-scooter trips should consider urban areas since this type of vehicle is most suitable to be used in urban environments. In this study, once the study area has been selected, the transport network was imported by OpenStreetMap (OSM) using the QGIS plugin QuickOSM. This plugin allows one to download geographic data and to filter them according to the type of features to be visualised (points, lines, polygons).
3.2. Criteria Selection
In order to characterise the priority level and safety for each link of the road network for e-scooter trips, for the proposed analysis the following seven criteria have been chosen, all referring to the link or to its proximity: (1) number of points of interest (POIs) (CPOI); (2) closeness to public transport stops and stations (CPT); (3) number of residents (CR); (4) number of employees (CE); (5) number of accidents occurred (CA); (6) traffic flows attested by GPS points (CGPS); and (7) maximum road speed allowed (CS). The methodology to assess each criterion is detailed in the following sections. The first four criteria refer to the priority of each arc: the higher the number measuring the compliance to the criterion, the greater the priority. The last three are used to evaluate the safety of each link: the higher the number, the lower the safety.
3.2.1. Number of Points of Interest (POIs)
Recent studies show that the usage of e-scooters is mainly linked to educational, leisure, recreation or tourism activities [24,26,27]. Based on these findings, the proximity of a link to these types of POIs is a criterion that allows one to identify the streets that could be most likely used by e-scooter riders. In this study, we selected the following POIs: leisure facilities, tourism attractions, parking lots, schools and university venues. POIs were imported into the GIS using the QuickOSM plugin, by selecting all the point features within the study area with the following keys: “amenity” and “tourism”.
Only POIs within a 200 m buffer around each link of the road network have been considered to characterise it, through an intersection procedure. Literature studies that dealt with bike mobility [39,40] show that users are willing to travel to a cycle station covering a maximum distance of 400 m [17]. For this study, a smaller buffer has been adopted since e-scooters are usually conceived to cover the first and/or last mile of any multimodal trip, or short door-to-door trip. For this reason, it is reasonable to think that trips should end very close to the final destination; moreover, this assumption lies on the safety side, since it reduces the number of opportunities to be reached by e-scooters, so it can be considered as a small underestimation of the final priority index.
3.2.2. Closeness to Public Transport Stations
Recent studies reveal that users tend to use e-scooters for short trips [24,27]. In this respect, a good connection with public transport could support integration with e-scooters, especially for the first and/or last mile of a multimodal trip. For this reason, we decided to include the proximity to public transport stops/stations as a criterion. They have been included via the GIS through the QuickOSM plugin by selecting all the point features within the study area with the following keys: “public_transport” and “railway”; only stations within a buffer of 200 m around each link of the road network have been considered to characterise it, through an intersection procedure.
3.2.3. Number of Residents and Employees
Based on research findings, e-scooter trips are mainly concentrated in the most populated areas [10,24,28]. In light of these results, criteria that take into account the number of residents and employees are consistent to test the priority areas for e-scooters. In particular, to make the analysis more reliable, it is advisable to use the residential density and employee density (i.e., the ratio between the number of residents/employees and the related area). This information can be retrieved from statistical surveys (e.g., made available by national authorities).
3.2.4. Location of Accidents
Ensuring an adequate safety level of roads is fundamental for e-scooter riders [10,30]. Considering the number of accidents that have occurred at given points is a measure of the unsafety of trips in the study area and helps to understand the main hotspots where intervention is needed in order to reduce roads risks. In the case of no data regarding accidents involving e-scooters, road accidents involving other vehicles could be used as a proxy of safety.
3.2.5. GPS Tracks
GPS tracks can be considered an indicator of how much a link is used. In this study, GPS tracks were retrieved through JOSM (Java OpenStreetMap Editor) software, an extensible editor for OpenStreetMap (OSM) written in Java. JOSM allows users to upload their stand-alone localisation, as well as editing existing nodes (points), ways (lines) and the related information. There are two types of GPS tracks that can be downloaded as GPX files:
- GPS lanes, which contain the name assigned by users and an additional field in which users can include further information;
- GPS points, which contain an identifier and a sequential number that allows one to identify the temporal sequence of the information collected, spatial coordination in WGS84 and timestamp.
For this study, only GPS points were used as a proxy of the traffic density on roads. Through a travel mode detection analysis performed in a previous study [35], each point has been associated with an instantaneous speed based on GPS coordinates, the timestamp and the sequential identification number. For the specific purpose of this study, only GPS tracks characterised by speeds above 15 km/h were considered since they can be associated to motorised vehicles [35,41].
3.2.6. Road Maximum Speed
Road speed is an attribute that strongly influences the safety perception of e-scooter users [19]. Information on maximum road speed has been retrieved by the OSM road network, which provides the “maxspeed” attribute for each road category.
3.3. PI and SI Calculation
PI and SI have been calculated by summing the normalised criteria according to the following equations:
where:
- is the normalised number of POIs for the link j;
- is the normalised number of public transport stations for the link j;
- is the normalised number of residents for the link j;
- is the normalised number of employees for the link j;
- is the normalised number of accidents for the link j;
- is the normalised number of GPS tracks for the link j;
- is the normalised max speed value associated to the link j.
The values have been normalised using Equation (3):
where:
- is the normalised value of the criterion i for the link j;
- is the original value of the criterion i for the link j;
- is the minimum value of the criterion i over all the j links;
- is the maximum value of the criterion i over all the j links.
The next section will present the application of the proposed methodology to a specific case study.
4. Case Study
4.1. Italian Framework
In Italy, the term micromobility (“micromobilità”) is used to indicate new types of transport modes that mainly use electric-powered personal mobility vehicles, such as hoverboards, segways, e-scooters, monowheels and e-bikes. They can be rented or shared vehicles or privately owned [1,2,22], even though the latter option is not allowed in some cities [42].
In 2019, a national decree (the so-called “Decreto Toninelli”) gave municipalities the possibility to test micromobility in their cities via pilots, and results had to be communicated to the Ministry of Transport and Infrastructure. This is because an ad-hoc regulation regarding this type of mobility was not present, and they were allowed to circulate only in 30 km/h zones, cycling paths and pedestrian areas. A new decree established that, starting from 1 January 2020, e-scooters are to be considered the same as bicycles and, therefore, currently, they can circulate on the roads with the same rules. However, the debate is currently very lively since there are many open issues related to safety, risk of theft and use of urban spaces, just to cite a few examples. Besides, many shared e-scooter operators have started to appear in different cities. The underlying motivations for a transport operator to choose a city are fundamental to understand the potential spreading of shared e-scooter services.
In this rapidly evolving context, cities should be able to control and plan the future of their mobility via the correct management of such vehicles and related services and one of the first steps is to guarantee an adequate network of infrastructures for such vehicles.
However, the Italian legislation shows some gaps that point to the need to correctly plan infrastructures for such a new form of mobility. In this respect, bicycles and e-scooters are two different vehicles, e.g., related to the size (and space occupancy), dynamics, riding style, wheels and vehicle response to the irregularities of the road or pavement. This could make one infrastructure suitable for cycling mobility and not suitable for e-scooters. Besides, it is important to customise solutions according to the specific context of implementation. The methodology has therefore been applied to one Italian case study to show its potential to help plan safe and priority networks for micromobility.
4.2. The Case of Catania
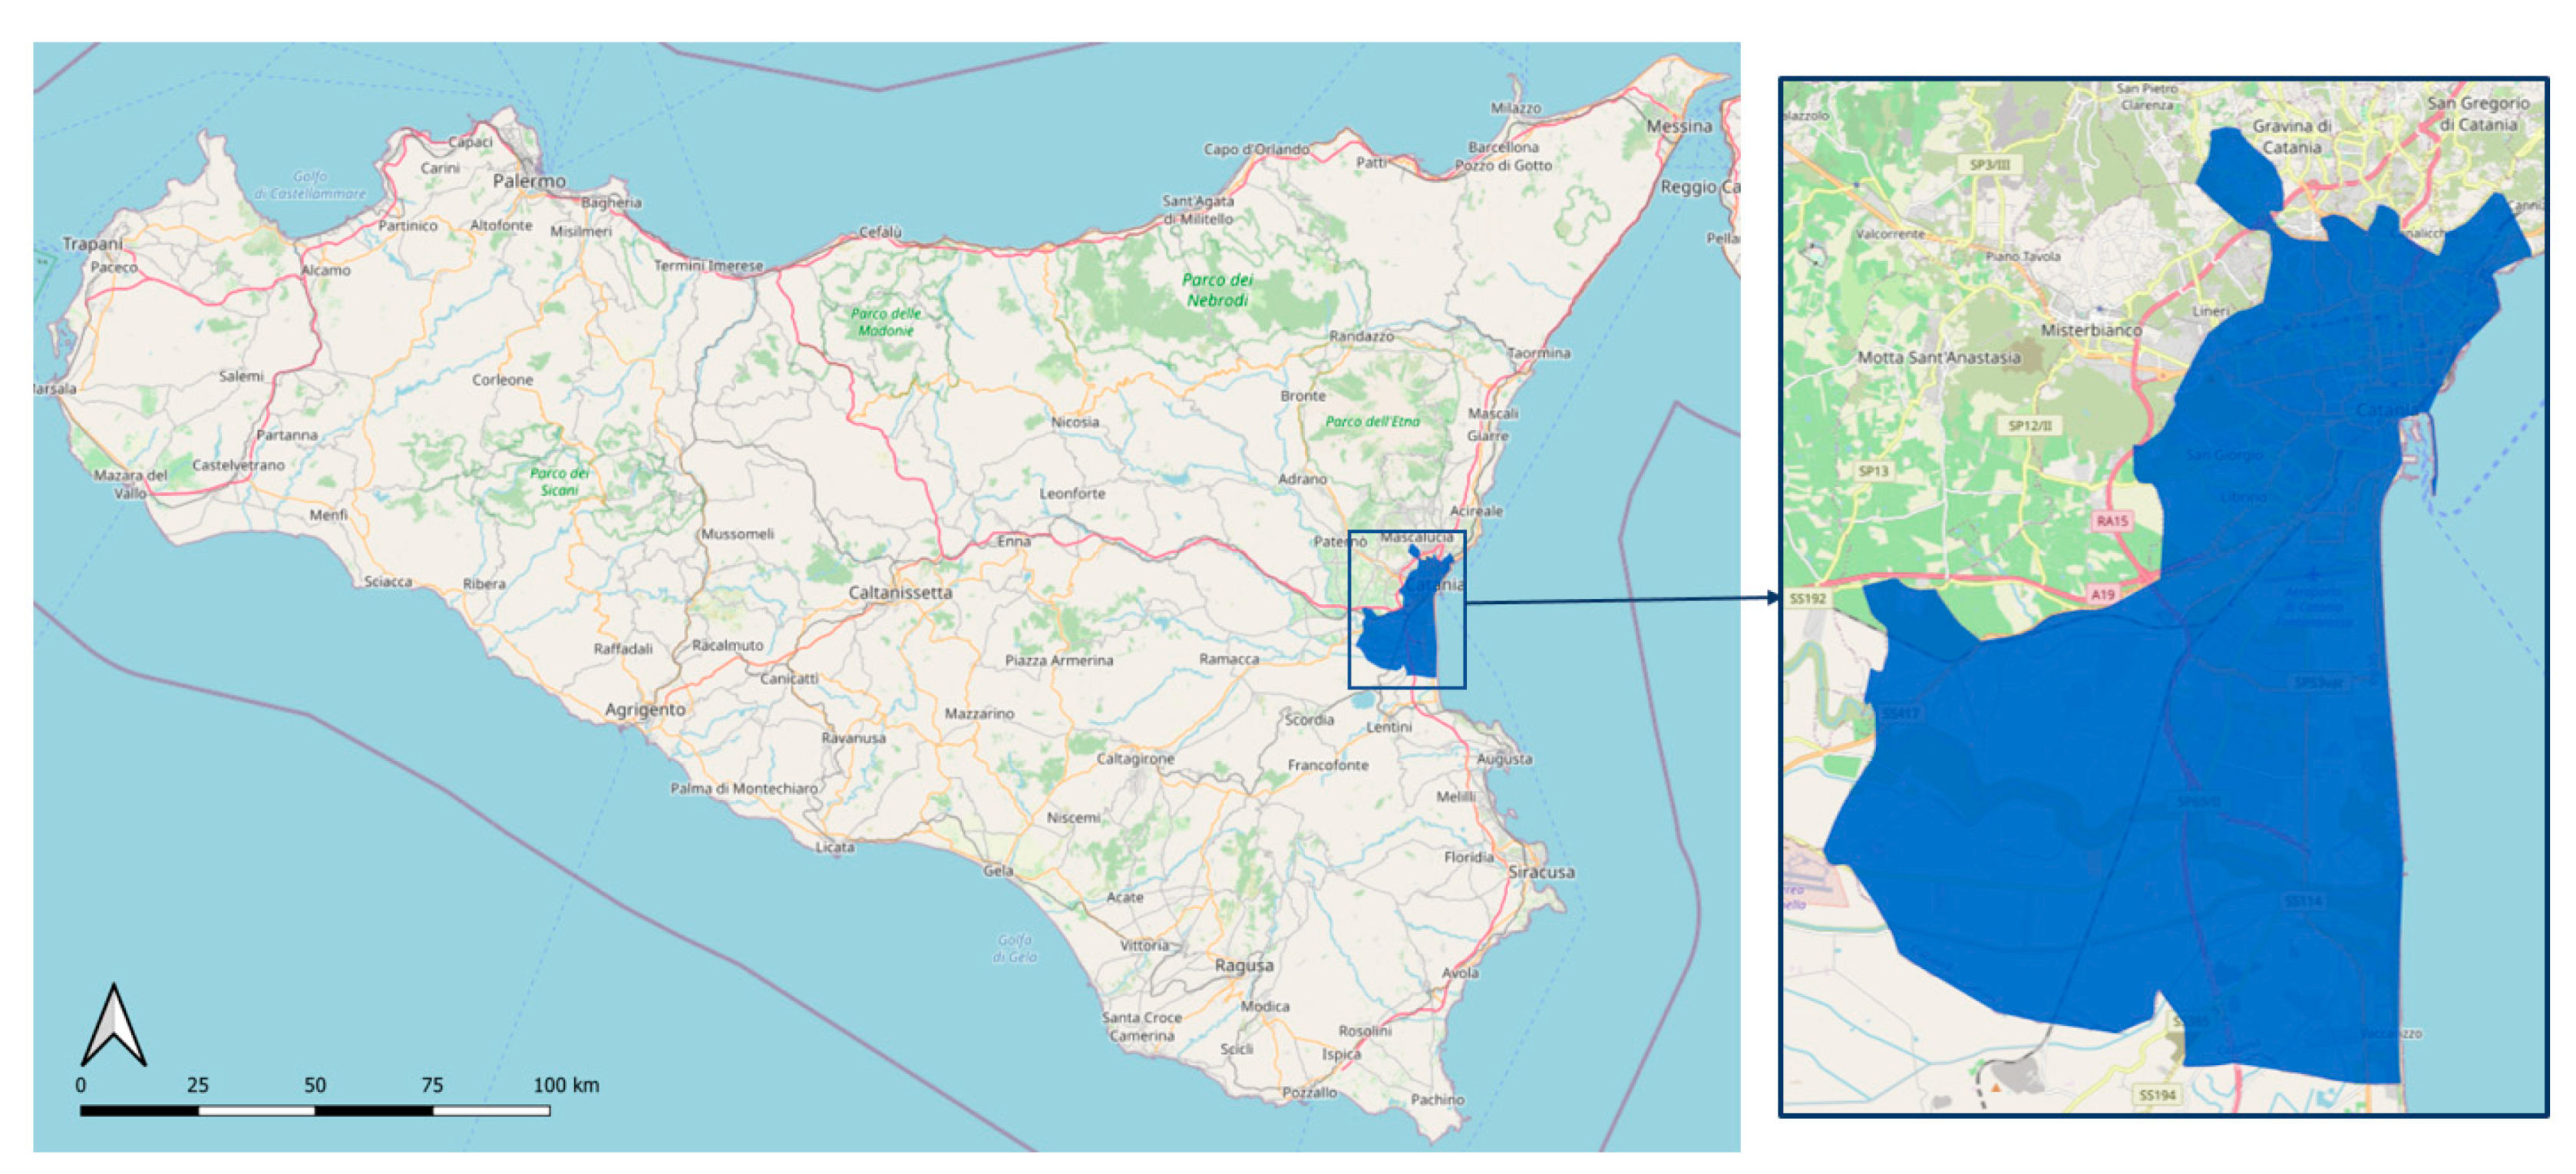
The case study is the medium-sized city of Catania (about 300,000 inhabitants and 180 km2 of area) located on the island of Sicily in Southern Italy (Figure 2). Catania is one of the Italian cities with the highest motorisation rates (73 circulating cars per 100 inhabitants) and the lowest use of public transport (39 trips per inhabitant per year, compared to 468 for the city of Milan, for example) [43]. It has two local public transport services operated via buses (43 lines) and metro (1 line). Concerning new shared mobility services, in the last years the local public transport company in charge of the bus service (AMTS Catania) has provided the city with station-based car and bike sharing services. E-scooters have been present in the city since before the pandemic, with touristic rental services; however, since 2020, also thanks to national government incentives for micromobility, the number of such vehicles has been visibly increasing, even if neither official statistics nor demand data are available. Currently only private e-scooters are circulating in the city, but a shared e-scooter service with 1000 vehicles is expected to be activated soon thanks to a bid for operators made by the Municipality of Catania (https://www.comune.catania.it/il-comune/uffici/mobility-manager/servizio-monopattino-sharing/ (accessed on 12 October 2021, in Italian)).
In terms of transport planning, Catania has a short-term urban traffic plan that was published in 2012 and is currently developing the process for a long-term sustainable urban mobility plan. In the currently available traffic plan, a network for cycling mobility has been identified and some infrastructures have already been built. However, we are still far from the provision of a wide and safe network of infrastructures for slow mobility, while the number of cyclists and, more recently, of e-scooter riders, is rapidly increasing. They share the same space as motorised vehicles, implying a lack of safety due to the differential of speed. Given the rapid spread of micromobility via private vehicles and the expected introduction of a new shared mobility service, it is important to plan suitable networks for e-scooters, able to guarantee multimodality and, in particular, its integration with public transport.
4.3. Results
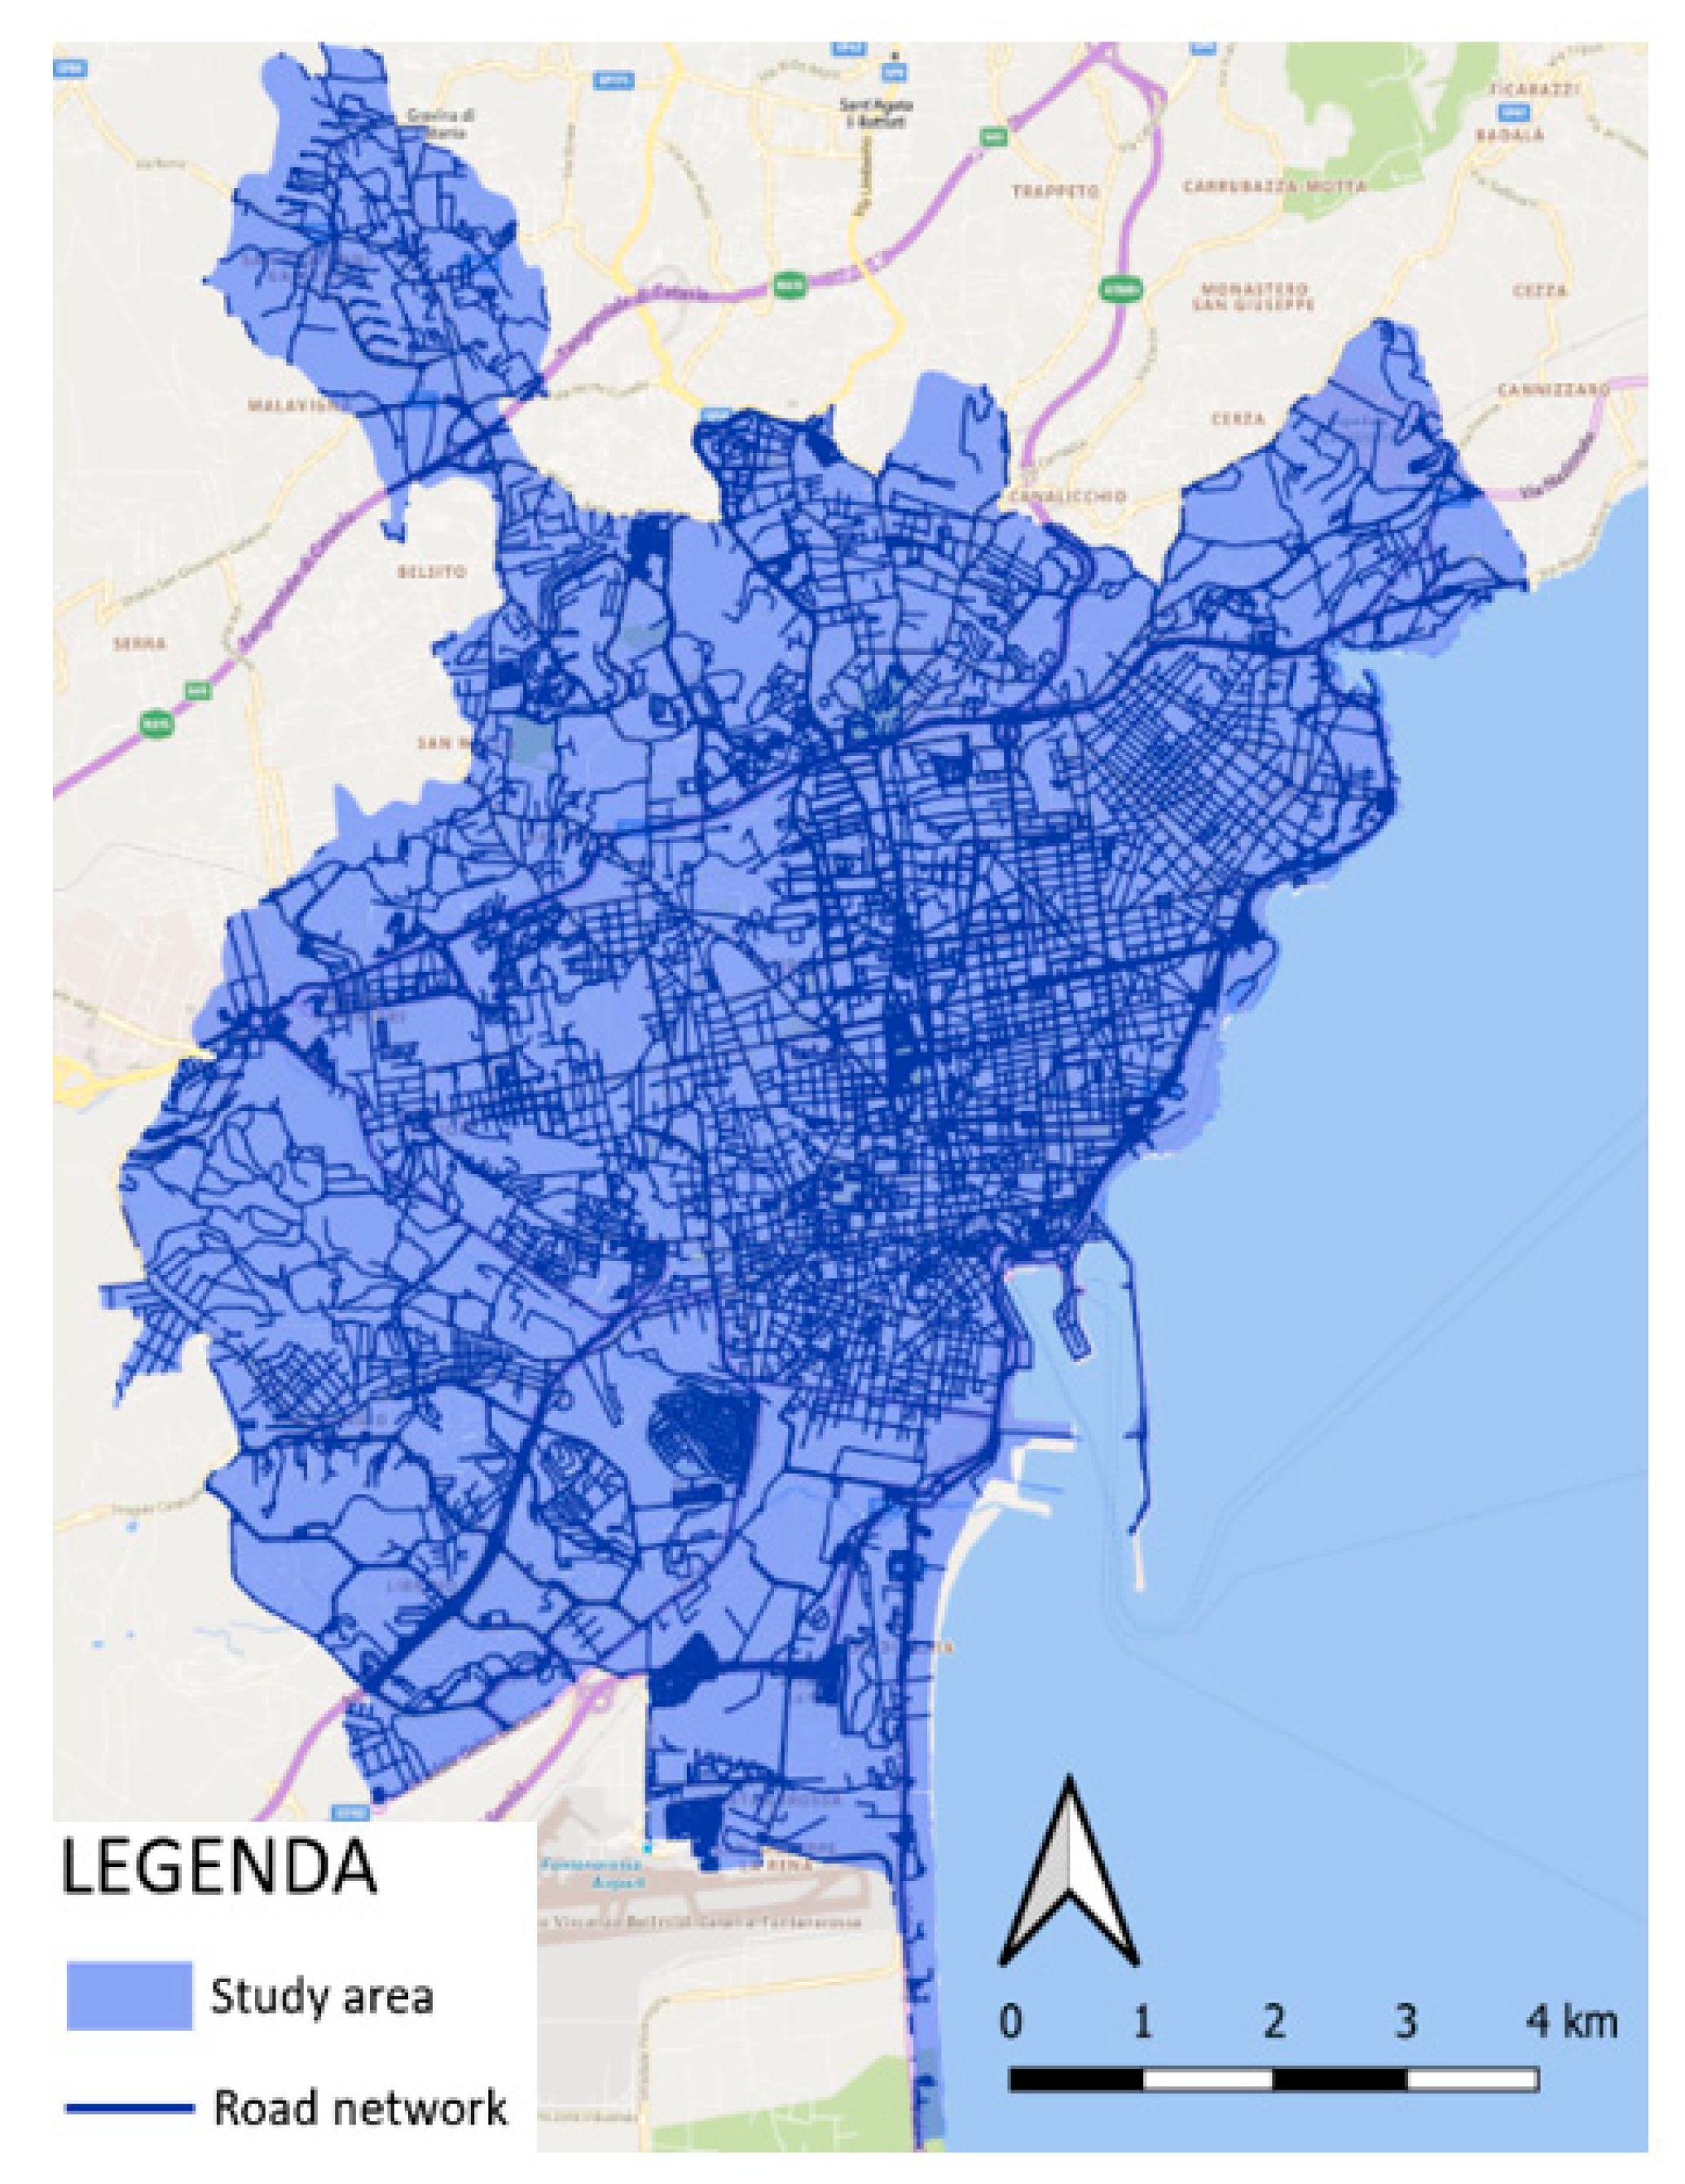
Following the flowchart in Figure 1, the first step is to identify the study area (Figure 3). For this study only the urban area has been considered since the southern area is mainly an industrial area. The road network has been retrieved from OSM data, as explained in Section 3.1.
4.3.1. Input Data
The input data used for the proposed methodology were collected by different sources. The localisation of POIs (507 points) and public transport (903 points) were acquired by OSM, while data about the number of residents and employees were downloaded from the Italian National Institute of Statistics (ISTAT) [44].
Accident data have been retrieved through OpenData of the municipality of Catania website [45]. Since no data regarding e-scooter accidents are available, the selected dataset refers to any road accidents occurring in the year 2017 and it includes the following information: ID, date, location (i.e., address) and number and type of users involved. Accidents were geolocated in QGIS thanks to the MMQGIS plugin.
GPS tracks were downloaded through the JOSM application. The number of GPS points that were acquired was 903, which only considered the ones related to a detected speed equal or higher than 15 km/h. Some links already included maximum speed as a feature in the OSM transport network. The database had some missing values, and, in this case, the maximum speed values have been attributed according to the classification provided by OSM and based on the current national Italian road regulation.
4.3.2. Results: Criteria Evaluation
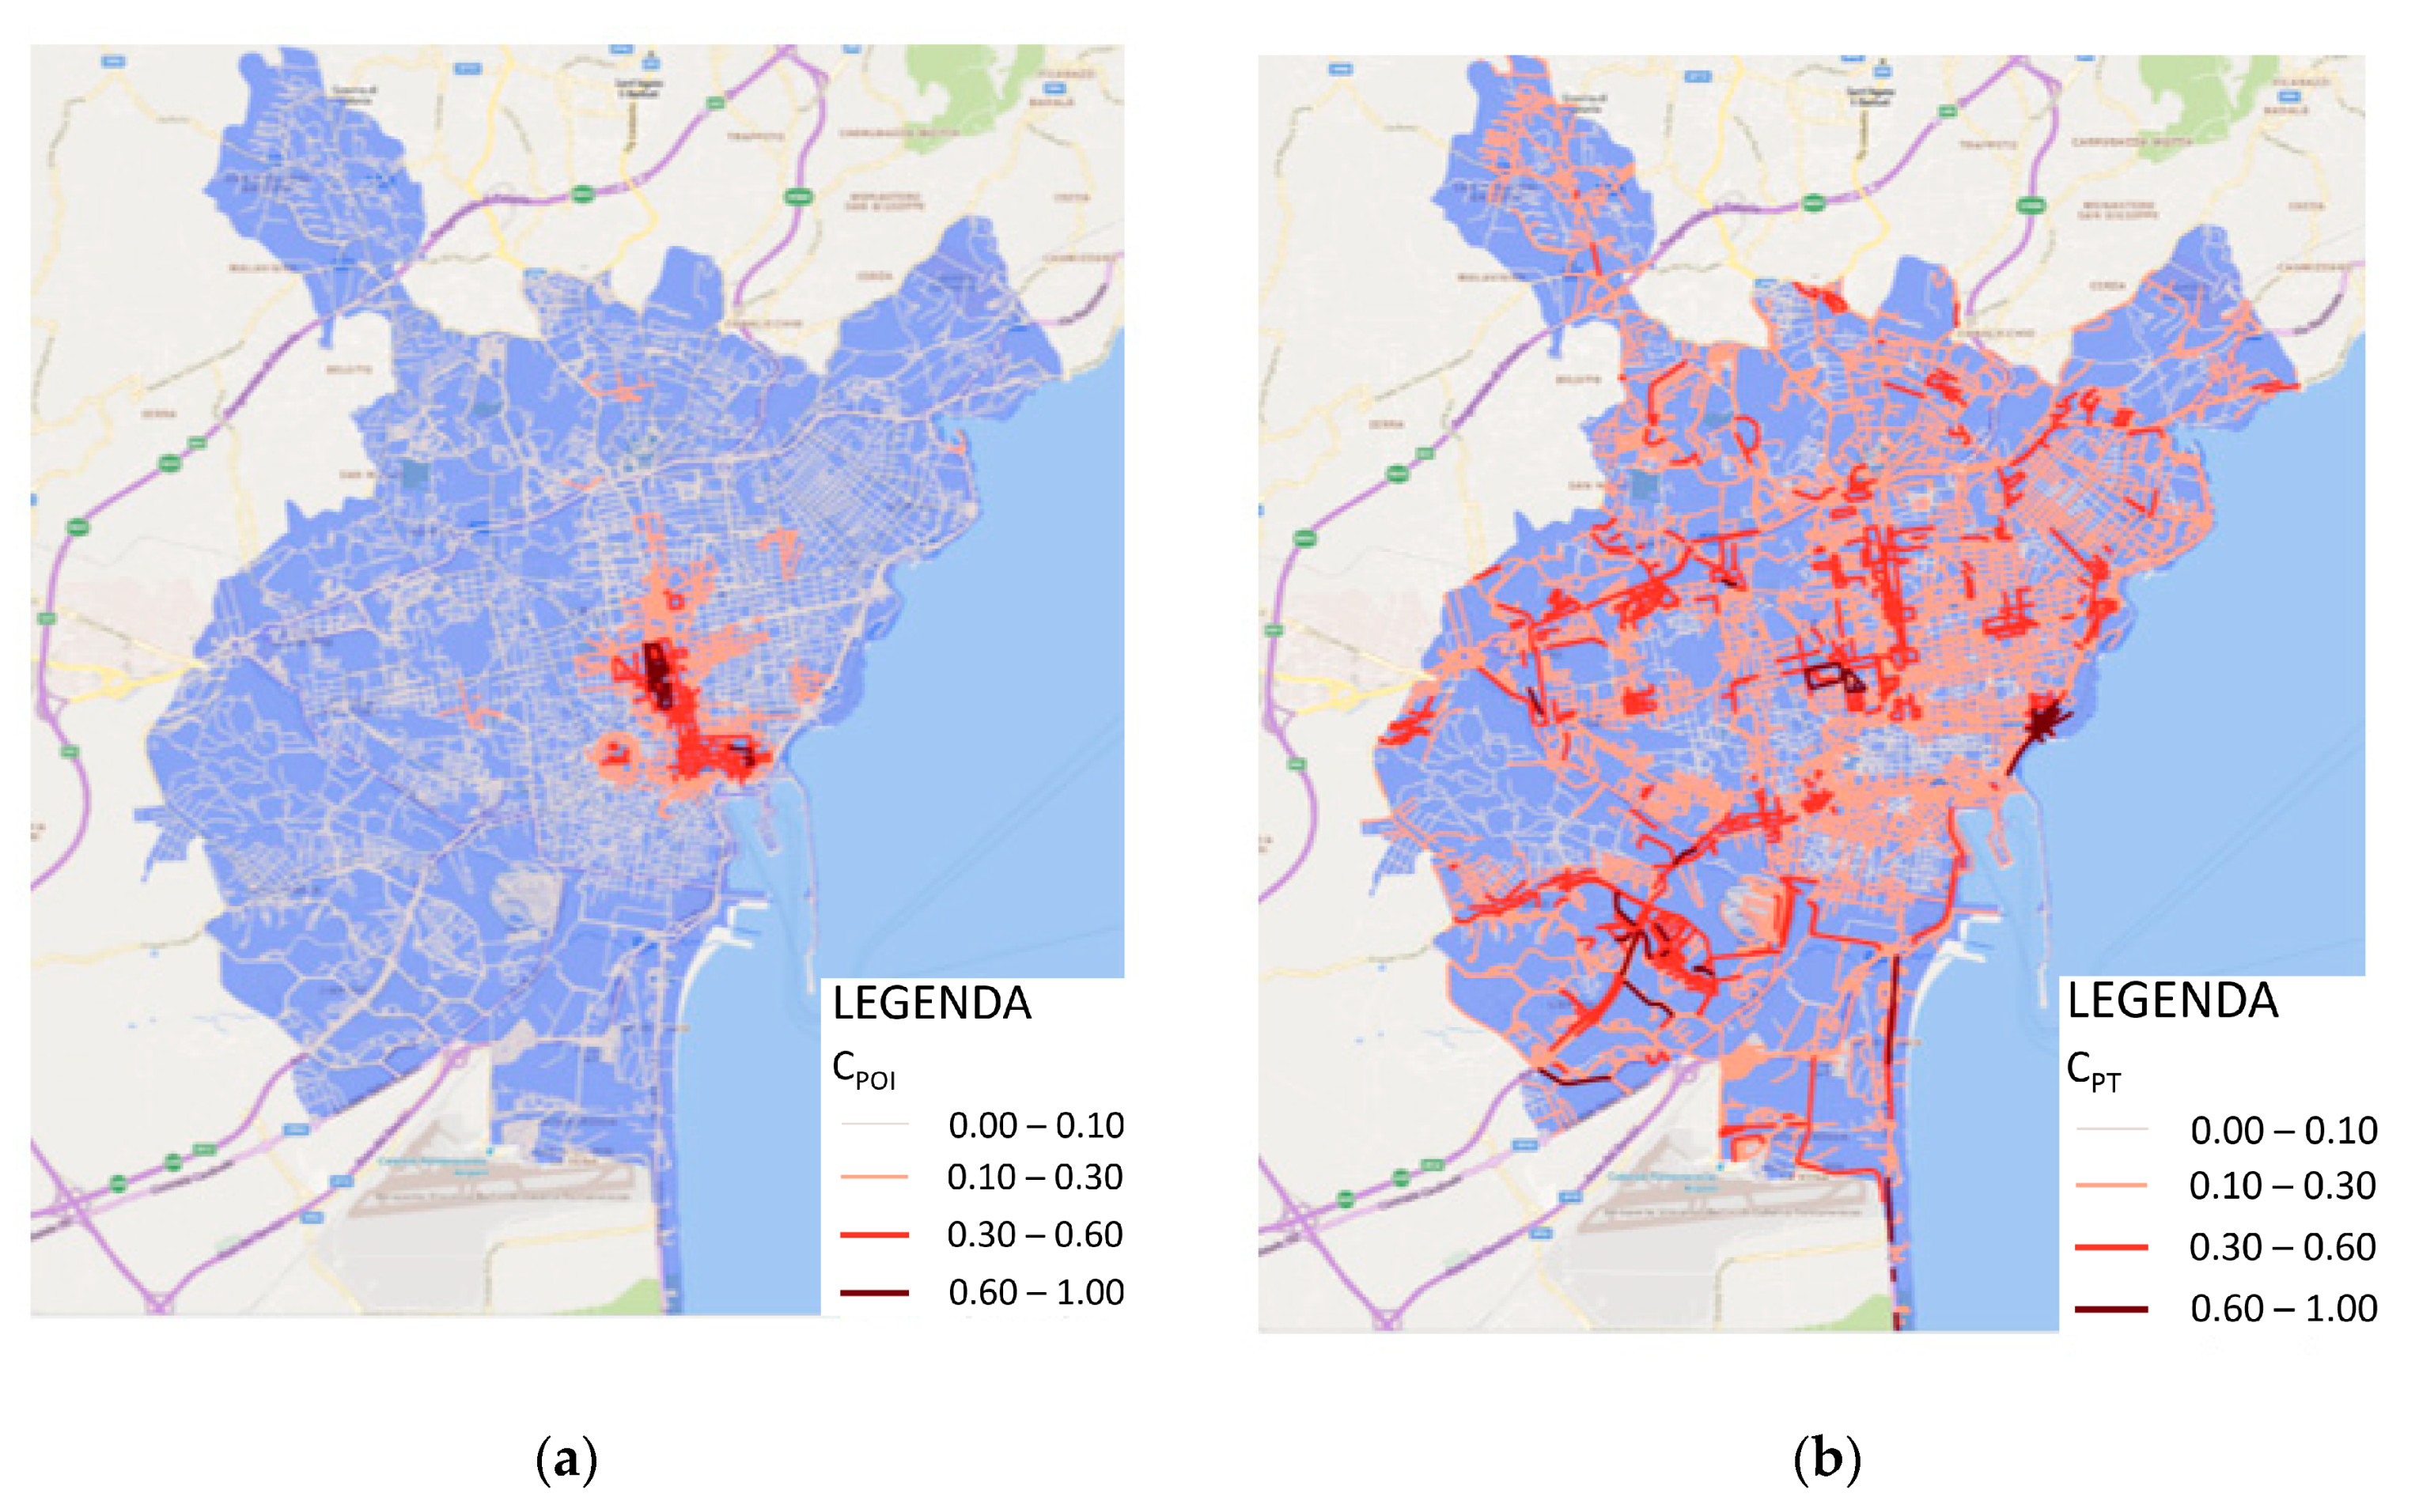
The following maps present the results for each criterion. Figure 4 shows the two criteria related to points of interest (a) and public transport (b). As can be seen from the maps, while the points of interest are concentrated in the central area of the city, public transport stops are distributed homogeneously, along some main north–south and east–west routes.
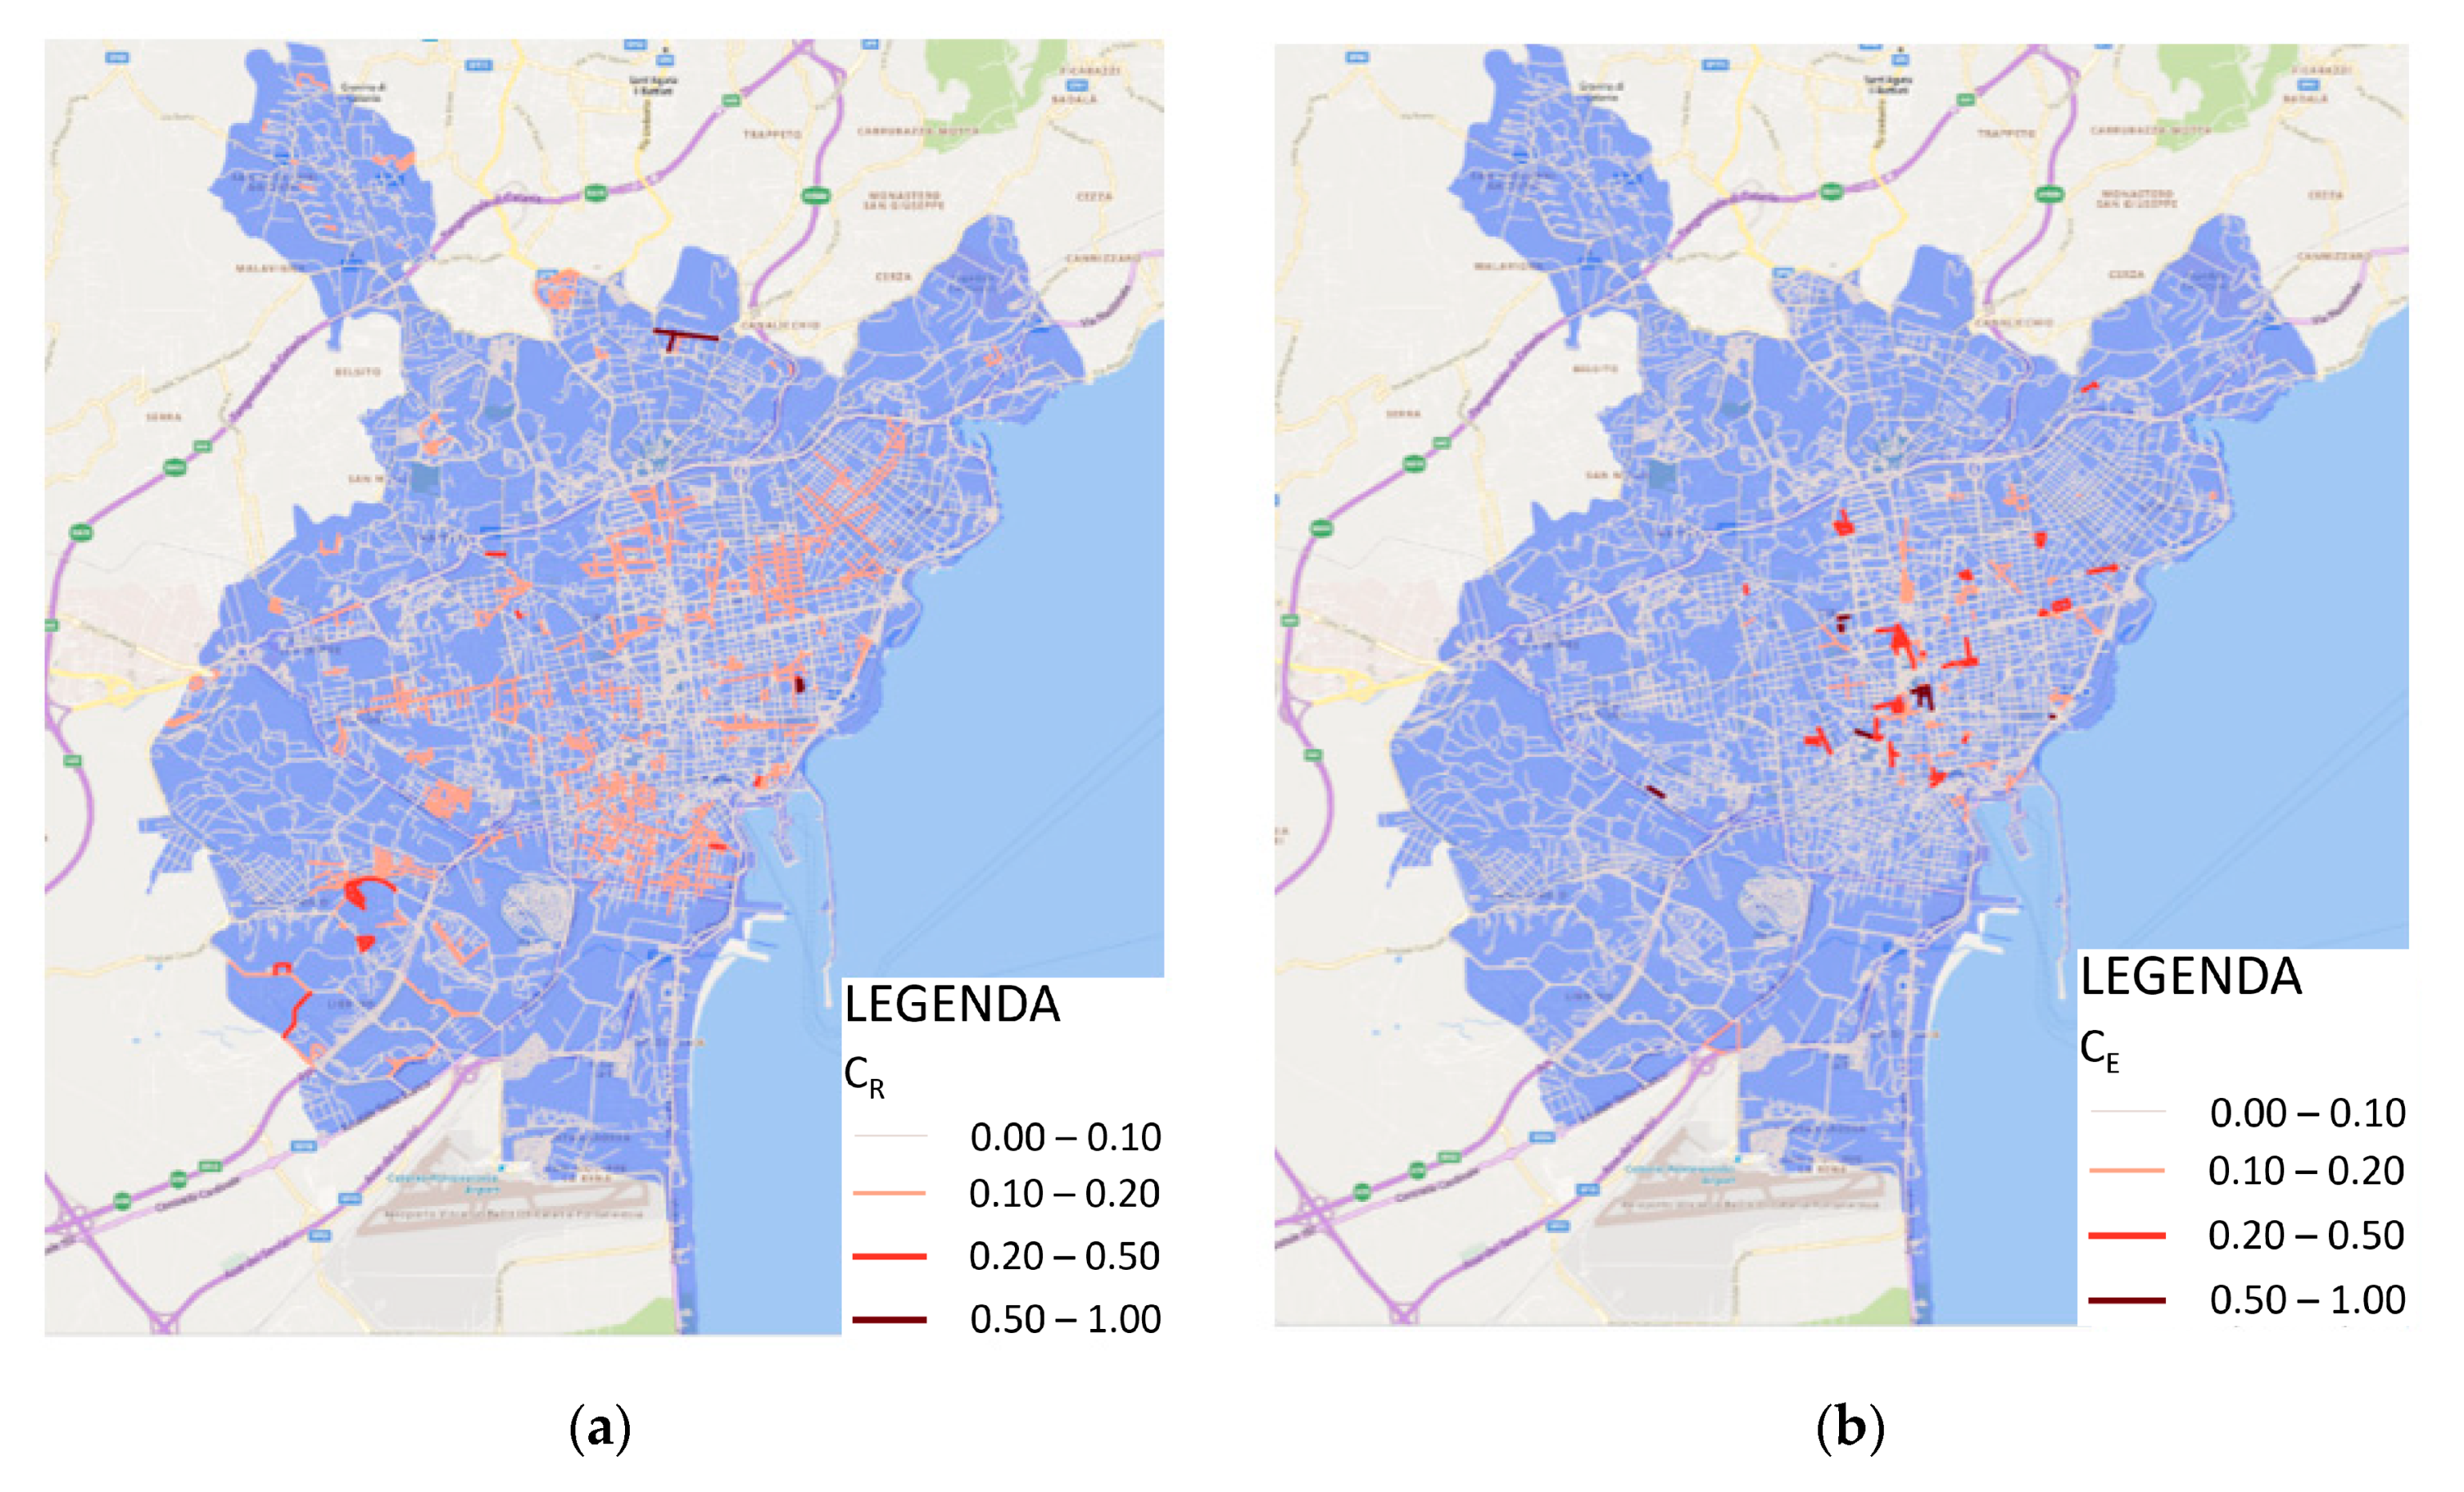
Figure 5 shows the results for the resident and employee criteria. Residential areas are localised more in the outskirts of the city, while places of work have a more homogeneous distribution within the study area.
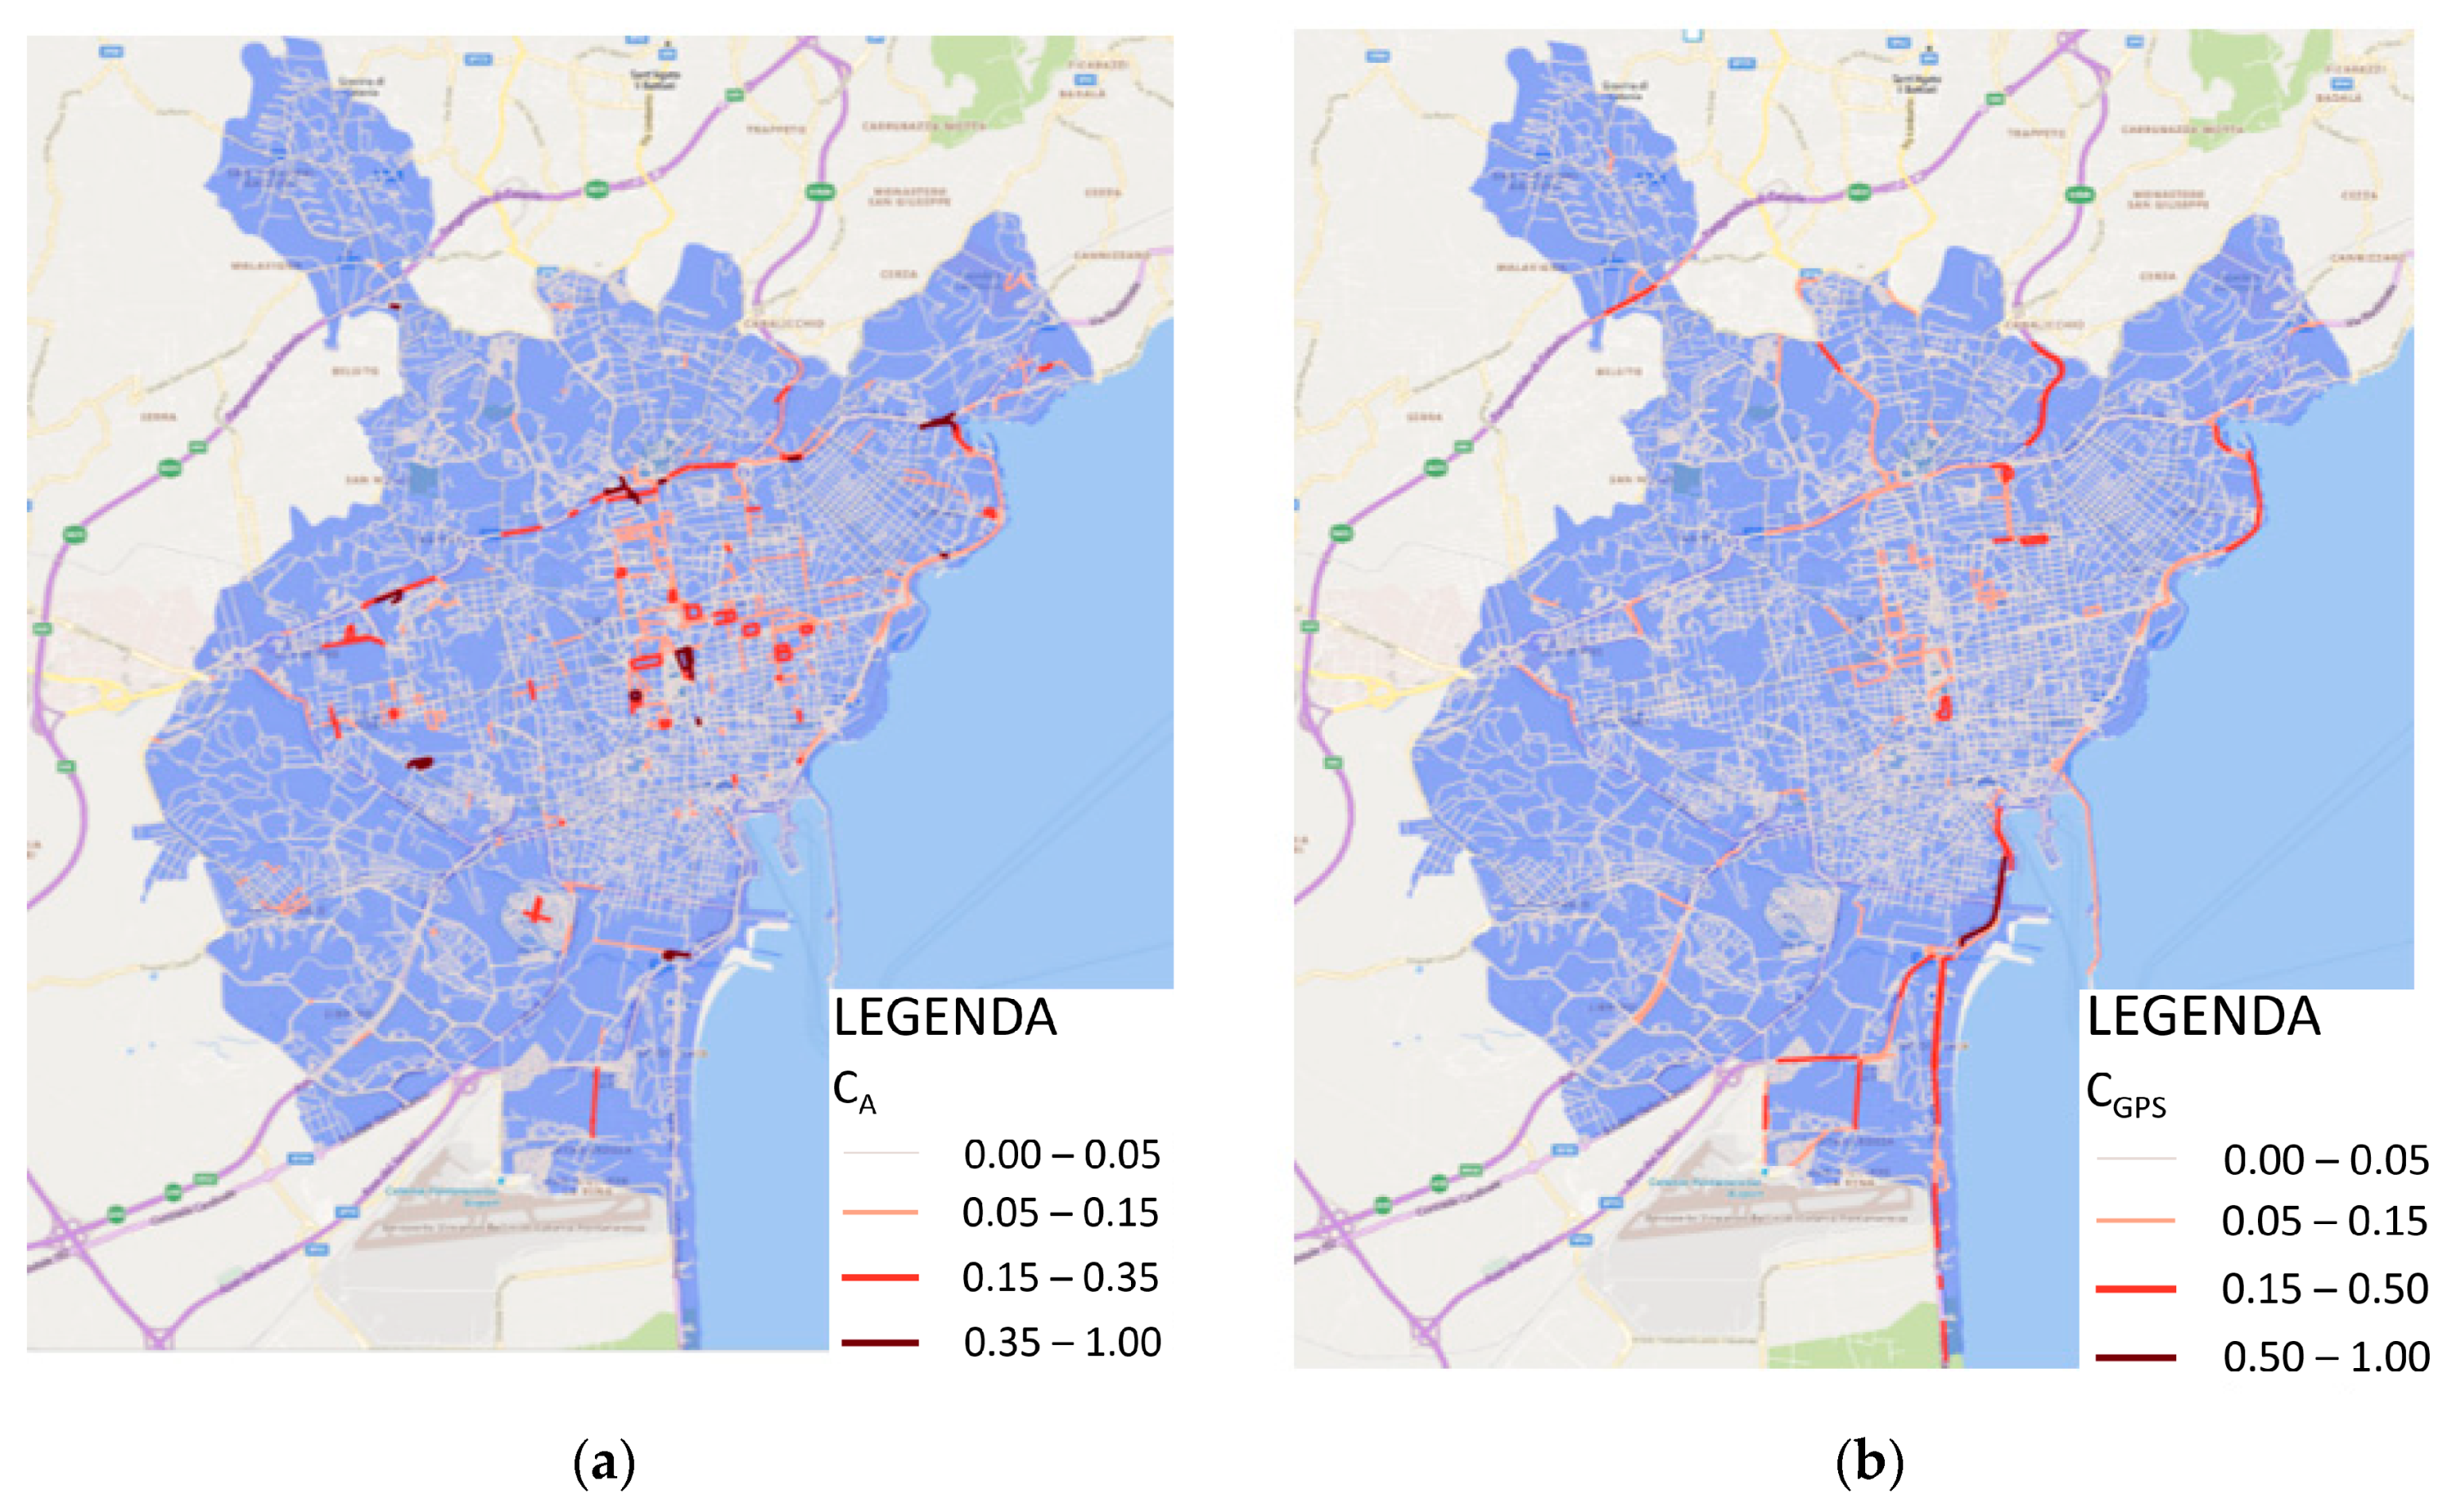
Results related to the accidents and GPS tracks criteria are reported in Figure 6. Most of the accidents in 2017 took place in the central area, although hotspots can be identified in some arterial roads in the east and west of the city. Most of the motorised traffic volume, retrieved thanks to GPS tracks (Figure 6b), is concentrated in the city centre and in the main primary roads of the network in the east, south and north of the city.
Figure 7 reports the values for the maximum speed indicator, highlighting the main arterial roads used to access the city and penetrate the urban centre.
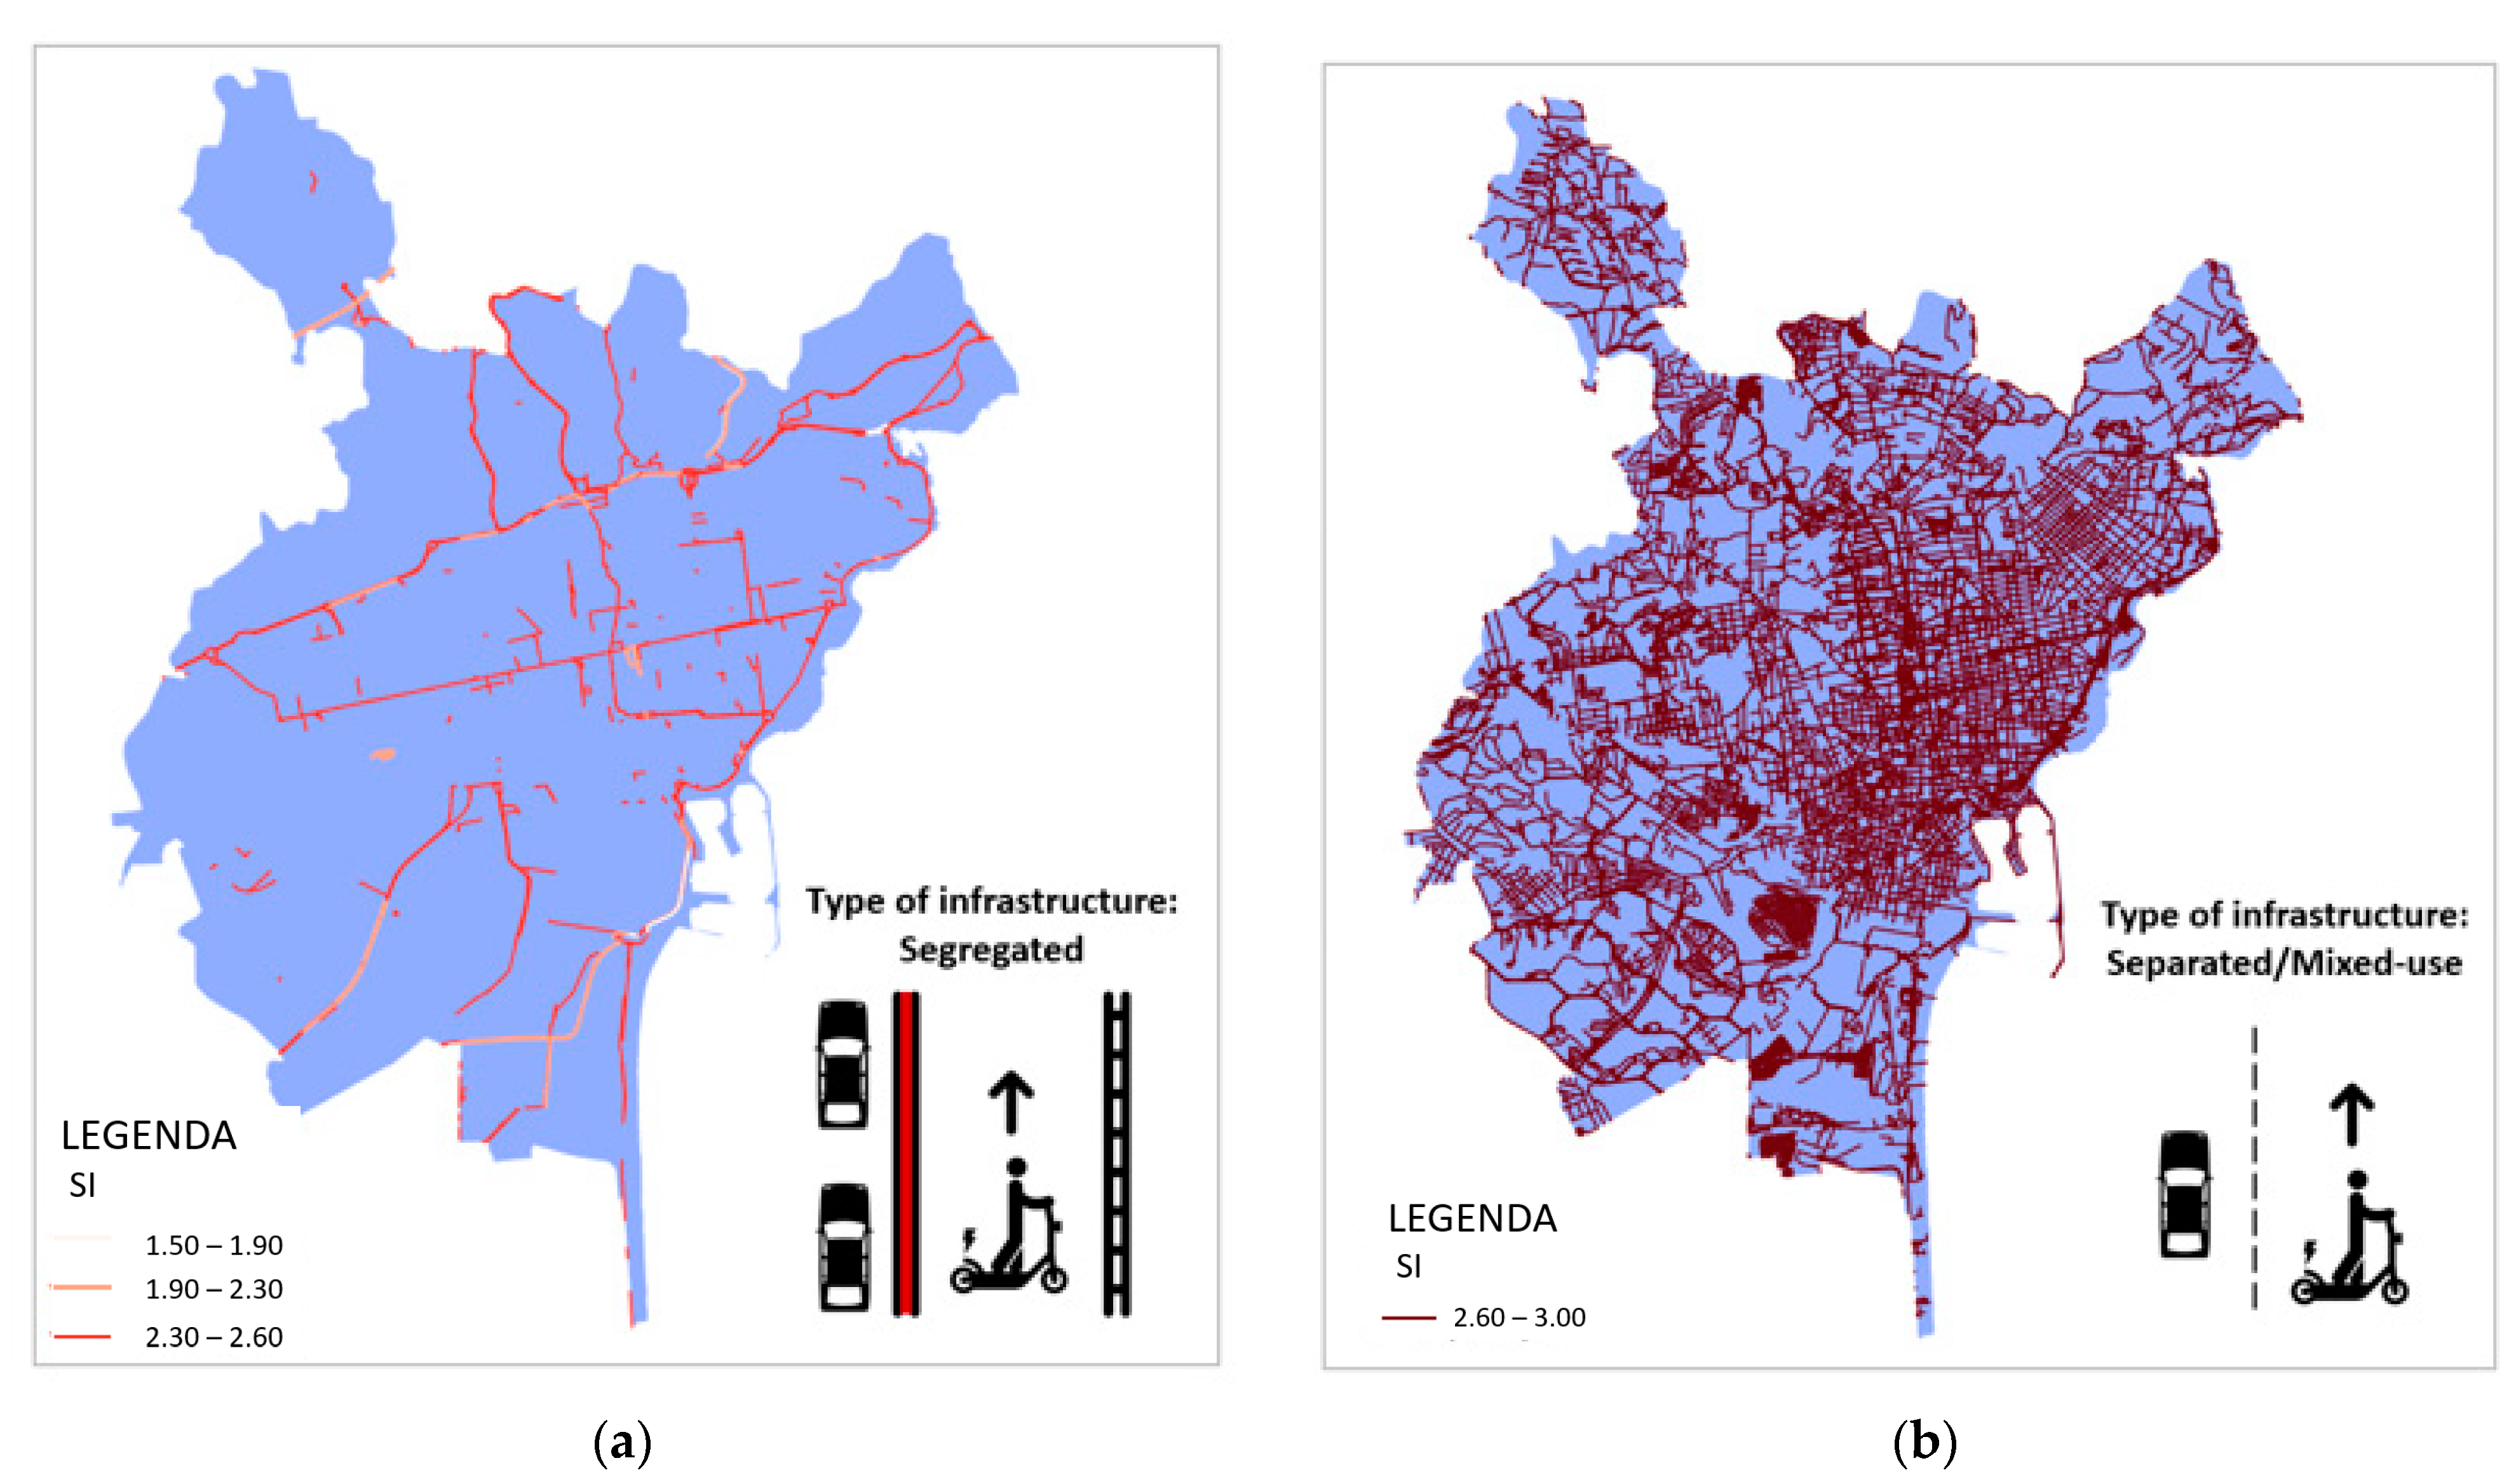
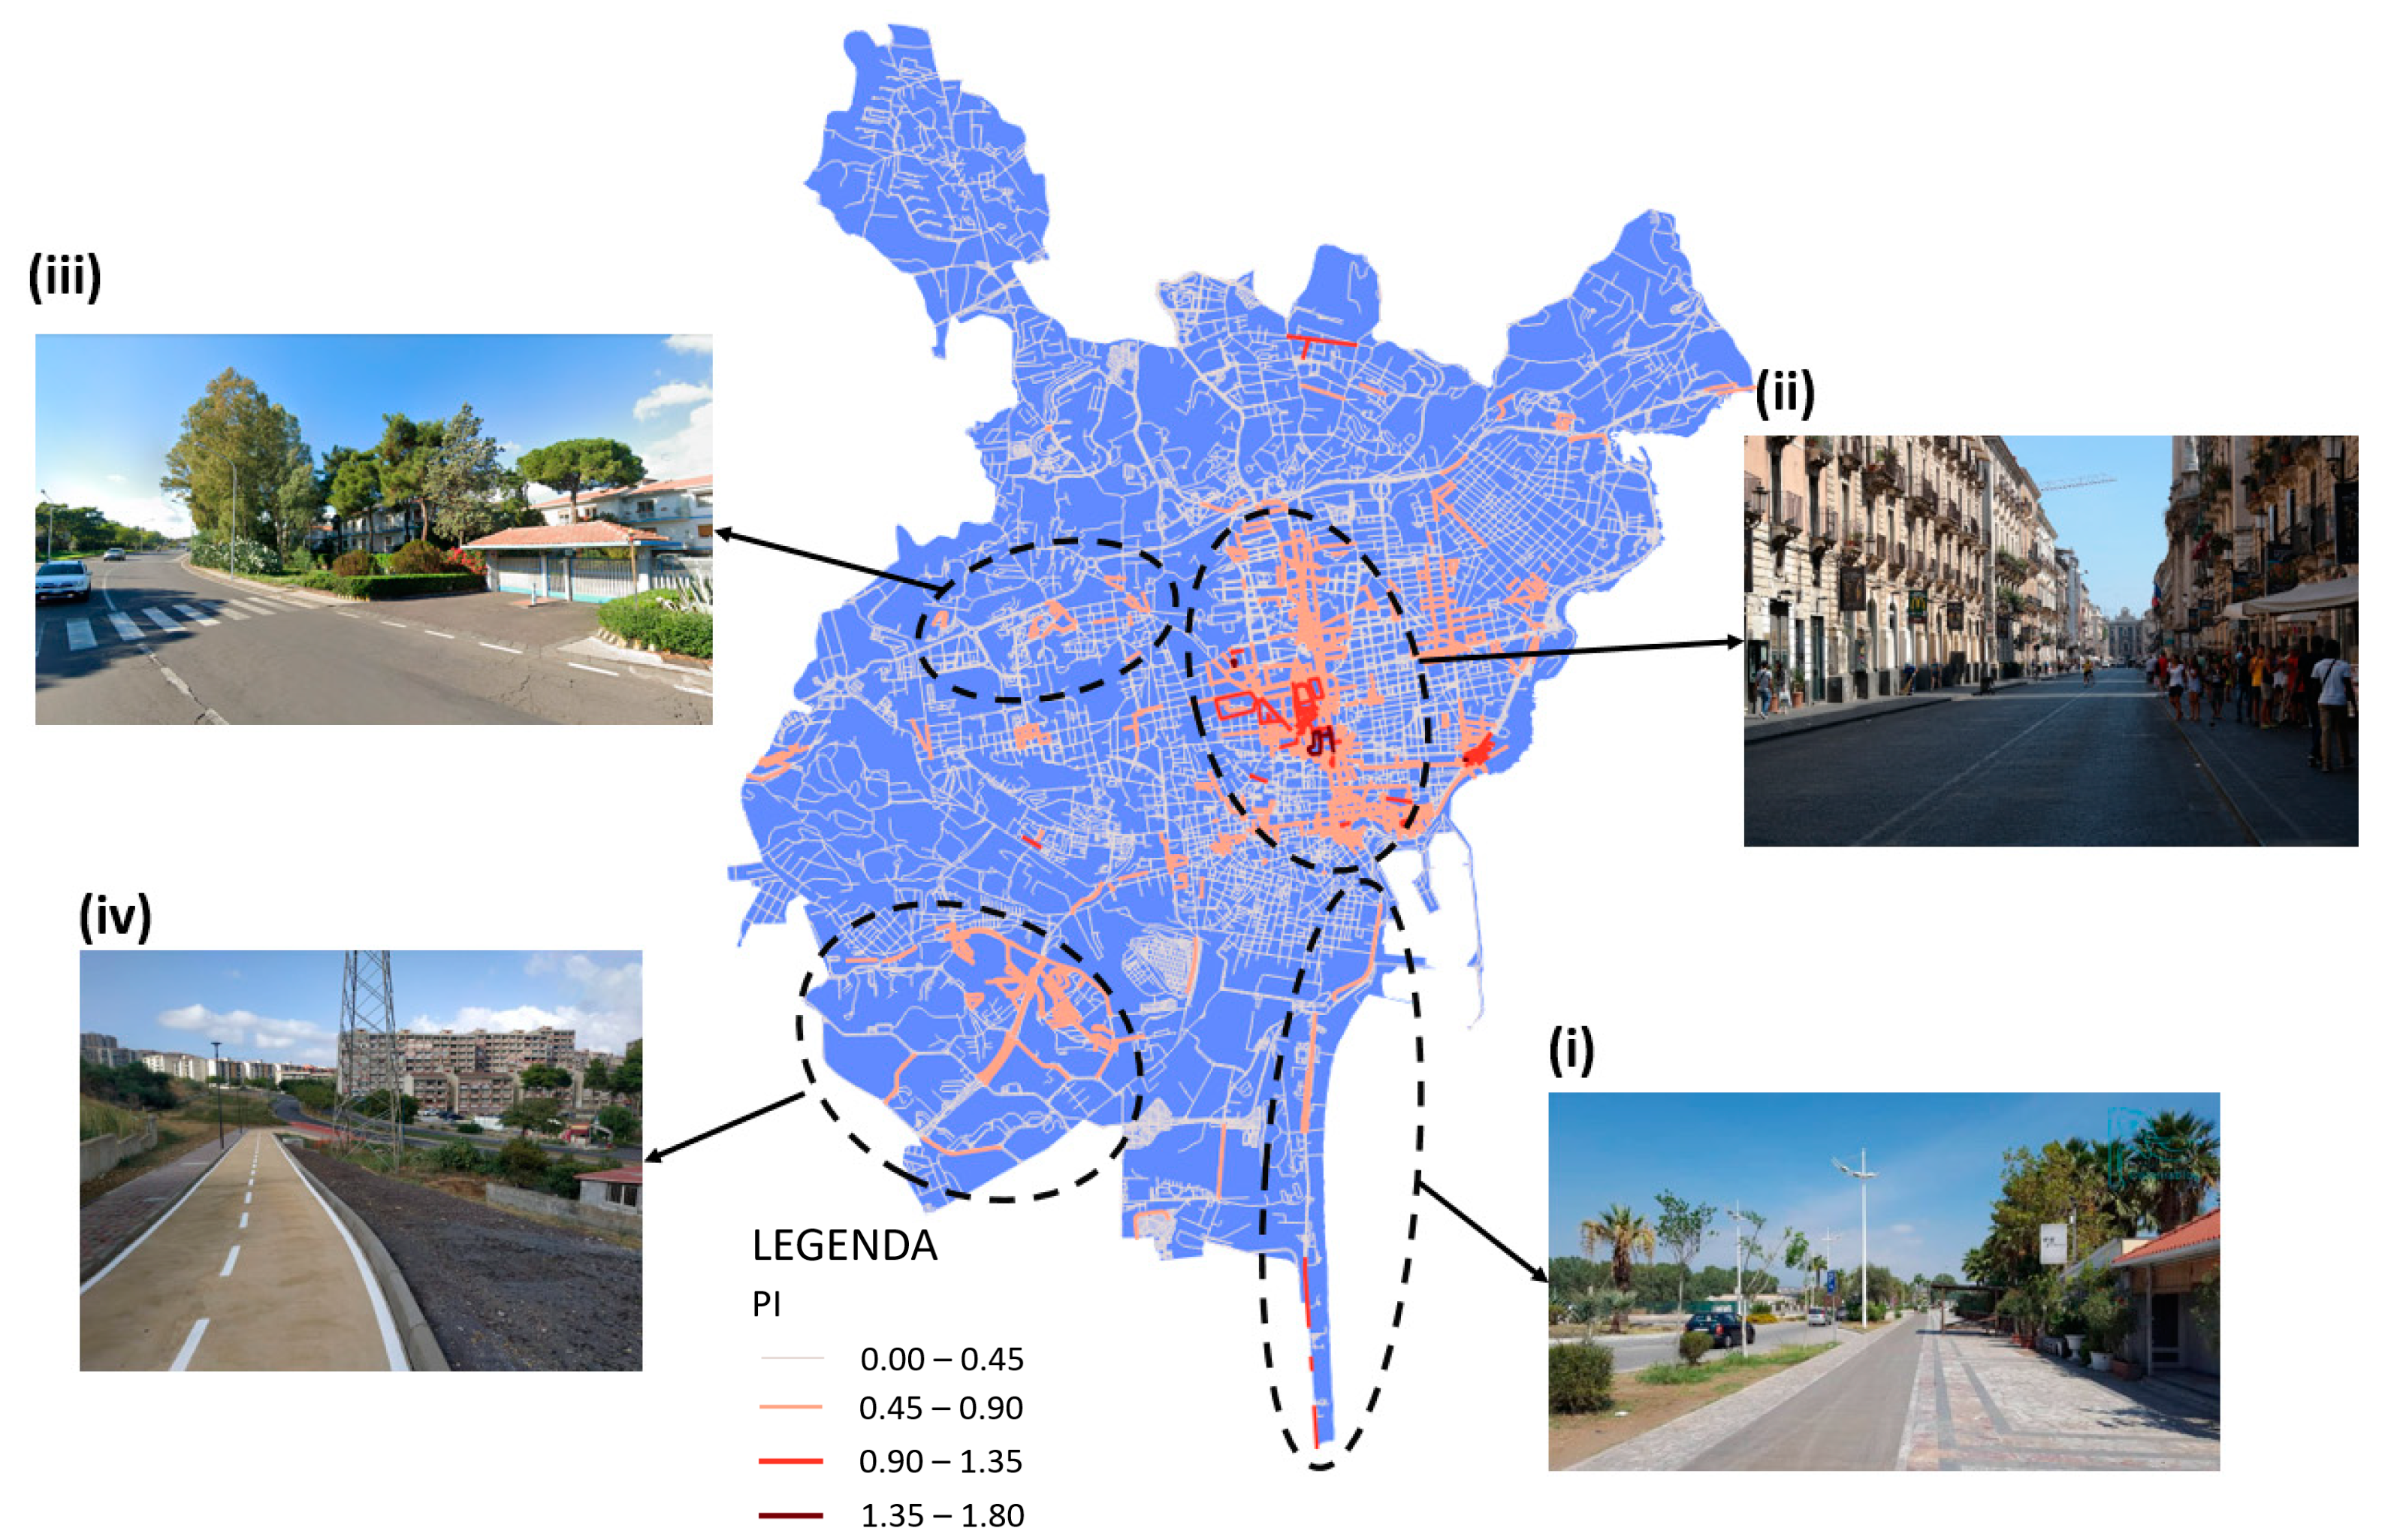
Based on Equations (1) and (2), PI and SI indexes have been calculated for each arc. Figure 8 shows a fairly homogeneous distribution of SI over the links in the study area. There are few links where SI is less than 2.60 (Figure 8a), while some links of the network have an SI greater than 2.60 (Figure 8b). In the cases where the levels are low, one should guarantee an adequate protection of e-scooter riders with infrastructure segregated from car traffic; while in the case where SI is high, decision makers could opt for a separated or mixed-use solution. From a priority level point of view, Figure 9 shows that higher values are found in the streets with greater commercial activity, where sometimes there are also reserved/mixed-use cycle lanes. Furthermore, higher values are also present in peripheral residential locations close to transit stops: this suggests the possibility of using the e-scooter for the first and/or last mile in a public transport multimodal trip, if adequate infrastructures are provided.
For a first analysis, the PI has been calculated by setting all the weights equal to 1. Some interesting results emerge: (i) In the southern part of the study area, the high value of PI of some links is justified by the closeness to the international airport (Fontanarossa airport) with a high number of employees, even if there is not a direct road connection. However, these links are also part of the coastal road of the main sandy beach facilities of the city. This finding points to the need of a last-mile connection for these sites. However, a more careful analysis is needed to understand if e-scooters can be driven safely there, and a proper infrastructure should be provided due to the unsafety of the path for vulnerable users; (ii) One of the main streets of the city centre (Via Etnea) has a high value of PI. It is characterised by the presence of many POIs and has a good connection with the public transport network. This could be considered as a priority path for e-scooters to make short trips or in combination with public transport; (iii) The northwest (Cibali/Nesima districts) area presents a cluster of links with high PI values. This is a residential area well served by the metro but which lacks an adequate connection for the first and/or last mile from/to the metro station. In this area, it is therefore possible to envisage the construction of a micro network for e-scooters, constituted by both mixed-use and separate paths (when necessary) for last-mile transit trips; (iv) Finally, the southern district of Librino presents good values for the score. This is mainly due to the high number of residents and public transport nodes within the district, but appropriate infrastructures should be built to guarantee e-scooter rider protection.
In conclusion, results of the analysis in the specific case study of Catania show that a network for e-scooters should primarily connect the priority links, and thus it could start from the city centre (also using the existing cycle paths) and could be extended into the peripheral areas following this approach. However, as visible from the maps, there are some cases where subnetworks could be created to connect entire neighbourhoods with public transport nodes, as with the case of Cibali/Nesima and Librino, or a single (safe) path can be guaranteed as with the case of the connection with the railway station Fontanarossa.
Assigning weights to the diverse components of the PI can help administrations to take different decisions based on the objectives they intend to pursue for their cities. In the following, just for a methodological exercise, we present two potential weight assignment strategies: one in favour of recreational/leisure trips () and one in favour of intermodal trips (). The variable is computed by giving a weight of 0.5 to in Equation (4):
With this weight assignment, the e-scooter has less potential for multimodal trips, while priority is given to recreational purposes (Figure 10). This combination of weights leads to a different priority map where the districts’ clusters visible in Figure 8 are not highlighted.
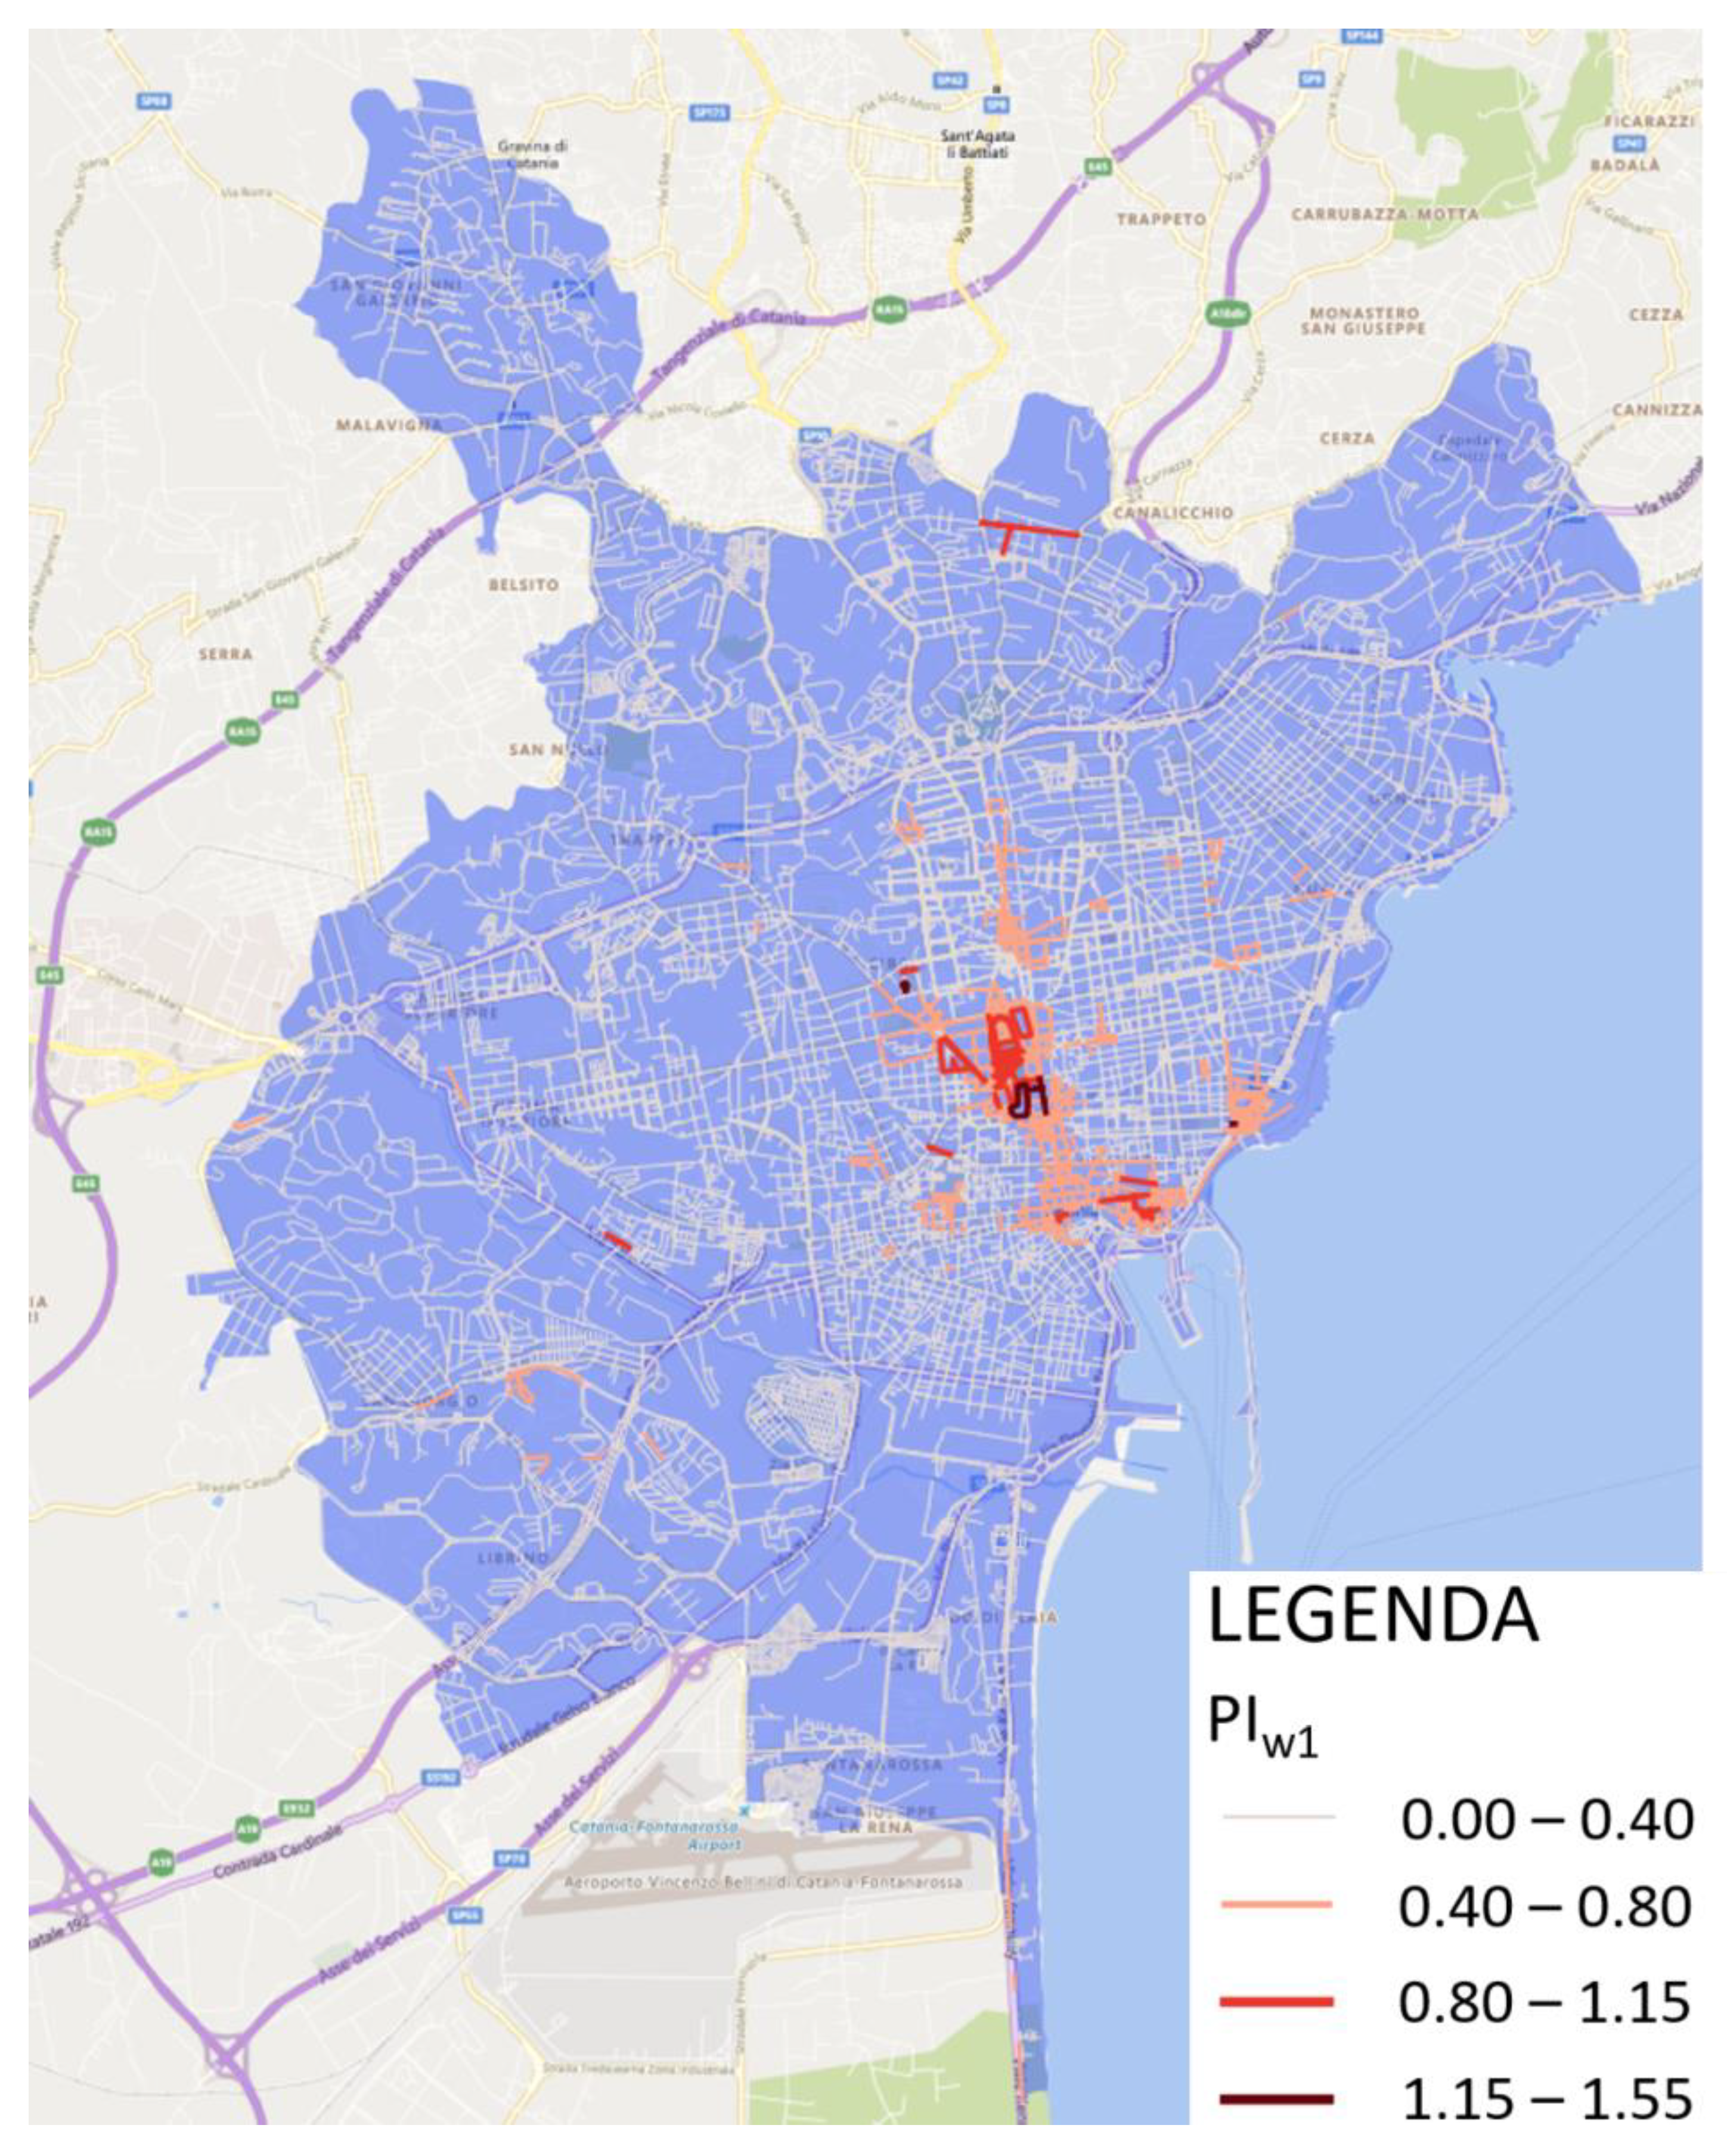
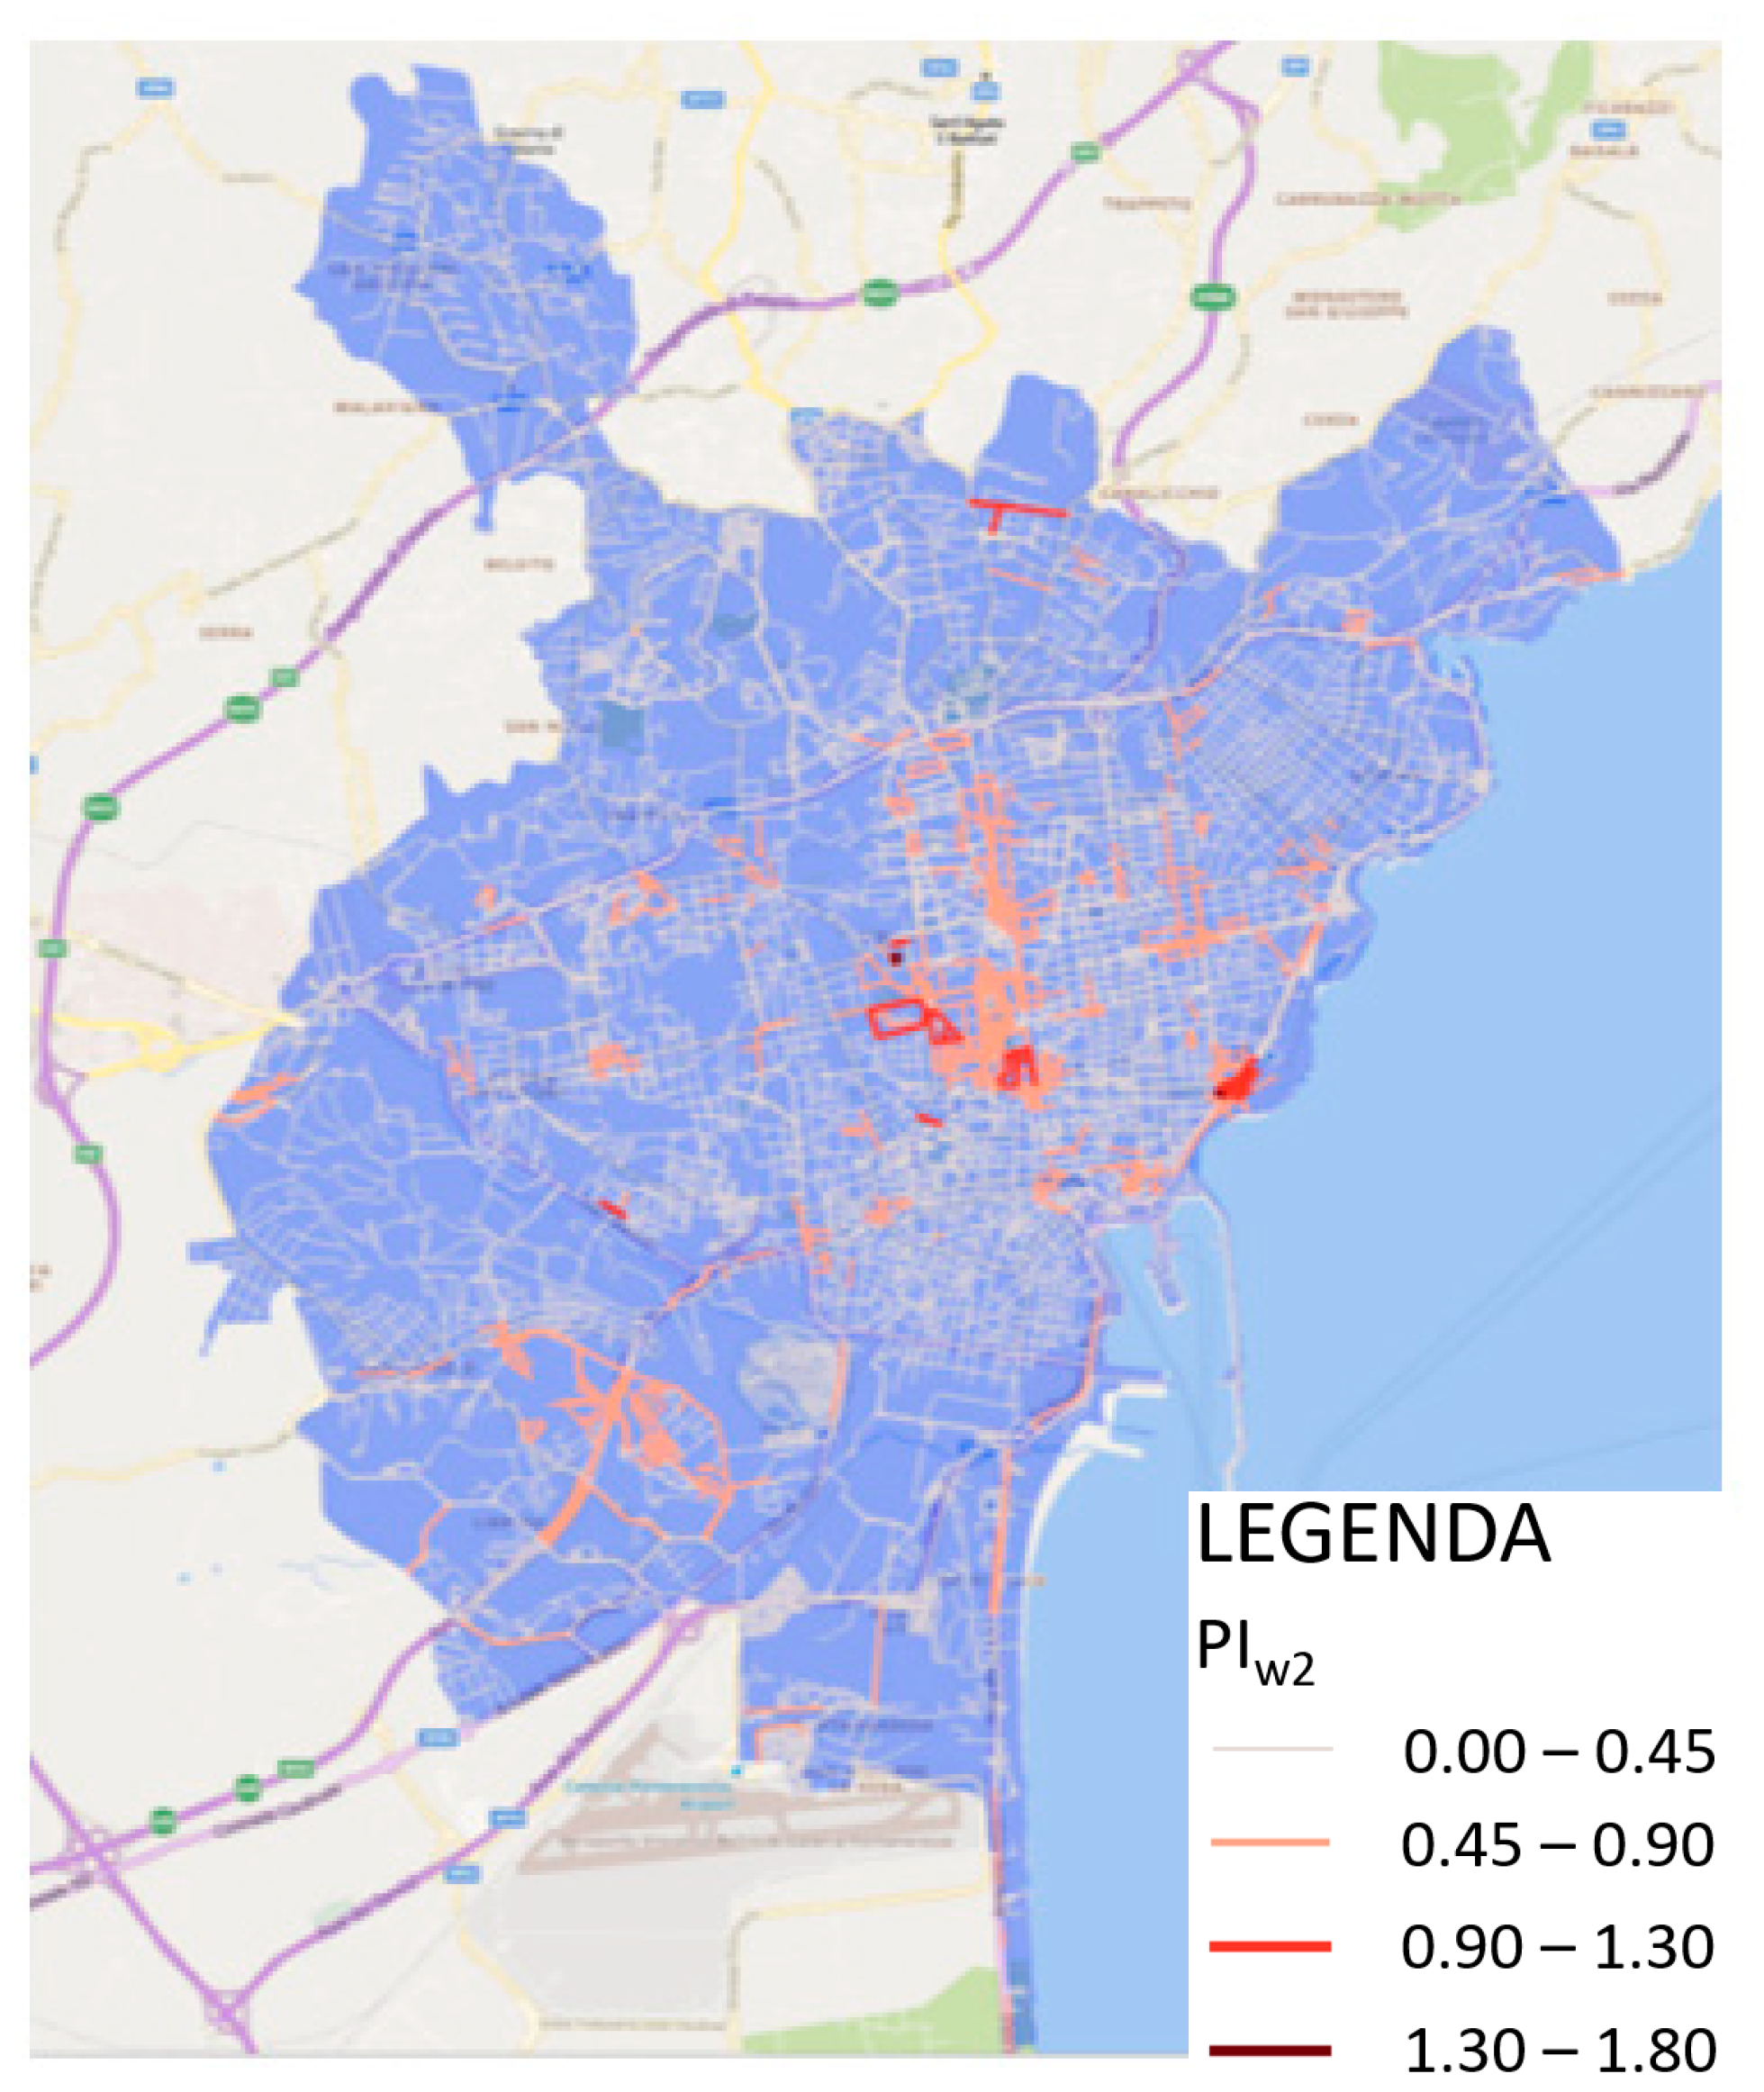
is computed by giving a weight of 0.5 to in Equation (5); this implies that the city centre loses the higher values of PI previously visible in Figure 8, as shown in Figure 11. This weighting strategy favours the potential of e-scooter for multimodal trips, e.g., home-based work trips, by prioritising the creation of micro networks scattered in the city that are connected with public transport.
5. Conclusions
Micromobility is a recent phenomenon facing fast development and that has the potential to become a transport mode that is able to reduce the imbalance between private and public transport. Proper planning for their introduction into the transport system of a city, taking into account the issues related to the interaction with other road users (in particular motorised ones), is crucial in order to foster the integration with other public transport systems towards Mobility as a Service and prepare cities to face future mobility scenarios. The proposed study is framed in this context since it develops a methodology for the planning of a network in order to guarantee safe and efficient trips using e-scooters. The methodology is based on a spatial, multicriteria approach to identify the priority links for a safe network for e-scooters. A set of criteria has been considered for the characterisation of the network that were in turn used for the calculation of a priority index for each link, allowing the ranking of the different links of the road network according to a priority for e-scooter trips and a safety index, providing suggestions on the need to segregate e-scooters from motorised traffic and, thus, the need of a novel infrastructure. The city of Catania in Italy was used as a testbed for the methodology based on open data retrieved from different sources. Results of the application of the two indexes show that the priority links are generally those associated with a greater number of points of interest and where there are currently some cycle paths; in addition, some clusters include micro networks in outlying neighborhoods, proving the suitability of e-scooters for the first and/or last mile of multimodal trips. According to the weights assigned to the criteria, one could foster the creation of a network connecting POIs mainly in the central areas for recreational purposes and short trips, or the creation of micro networks to foster multimodal trips in connection with public transport [46]. This suggests the possibility to promote e-scooters for more sustainable mobility implying a lower use of private cars.
These results are in line with the findings of other research studies, and demonstrate how the use of e-scooters today are mainly linked to the presence of POIs and residential areas [10,24,26,27]. A study on micro mobility conducted in another case study in Sicily showed that users with the highest willingness to use e-scooters are mainly students who do not own cars [22]. However, it is important to foster a modal shift for those who use cars.
This work comes with some limitations and open directions for future research. The main limitation is linked to the weight of the criteria and the nature of the data used. The proposed approach should be used for a preliminary first assessment of a potential network for e-scooters in cities, but more detailed analyses are needed to define it. However, since it is based on open data that can be easily found for other contexts, it is highly replicable and scalable.
Future research should investigate further differentiations in the design of networks and facilities compared to that of traditional cycle networks; in particular, attention should be paid to a more detailed analysis of the infrastructure characteristics (e.g., slope, pavement, width or specific factors such as delays due to queuing and waiting at junctions) and the estimation of the actual demand, which currently remains one of the hottest research topics, mainly due to the novelty of this transport mode.
Author Contributions
Conceptualisation, M.F., N.G., M.L.P., G.I. and M.I.; methodology, M.F., N.G. and M.L.P.; software, M.F. and N.G.; formal analysis, M.F. and N.G.; writing—original draft preparation, M.F., N.G. and M.L.P.; writing—review and editing, M.F., N.G., M.L.P., G.I. and M.I.; visualisation, M.F. and N.G.; supervision, G.I. and M.I.; funding acquisition, M.L.P., G.I. and M.I. All authors have read and agreed to the published version of the manuscript.
Funding
The work has been partially supported by the project “WEAKI-TRANSIT: WEAK-demand areas Innovative TRANsport Shared services for Italian Towns” (unique project code: E44I17000050001) under the programme “PRIN 2017” and by the project of M. Le Pira “AIM Linea di Attività 3—Mobilità sostenibile: Trasporti” (unique project code CUP E66C18001390007) under the programme “PON Ricerca e Innovazione 2014–2020—Fondo Sociale Europeo, Azione 1.2 “Attrazione e mobilità internazionale dei ricercatori” and the project “ADDRESS” under the University of Catania programme “PIACERI Linea 2”.
Institutional Review Board Statement
Not applicable.
Informed Consent Statement
Not applicable.
Data Availability Statement
Data will be made available upon reasonable request.
Conflicts of Interest
The authors declare no conflict of interest.
References
- Shaheen, S.; Cohen, A.; Chan, N.; Bansal, A. Sharing strategies: Carsharing, shared micromobility (bikesharing and scooter sharing), transportation network companies, microtransit, and other innovative mobility modes. In Transportation, Land Use, and Environmental Planning; Elsevier: Amsterdam, The Netherlands, 2020; ISBN 9780128151679. [Google Scholar]
- Tuncer, S.; Brown, B. E-Scooters on the Ground: Lessons for Redesigning Urban Micro-Mobility. In Proceedings of the 2020 CHI Conference on Human Factors in Computing Systems, Honolulu, HI, USA, 21 April 2020; pp. 1–14. [Google Scholar]
- Jittrapirom, P.; Caiati, V.; Feneri, A.-M.; Ebrahimigharehbaghi, S.; Alonso-González, M.J.; Narayan, J. Mobility as a Service: A Critical Review of Definitions, Assessments of Schemes, and Key Challenges. Urban Plan. 2017, 2, 13–25. [Google Scholar] [CrossRef] [Green Version]
- Giuffrida, N.; Le Pira, M.; Inturri, G.; Ignaccolo, M.; Calabrò, G.; Cuius, B.; D’Angelo, R.; Pluchino, A. On-Demand Flexible Transit in Fast-Growing Cities: The Case of Dubai. Sustainability 2020, 12, 4455. [Google Scholar] [CrossRef]
- Inturri, G.; Le Pira, M.; Giuffrida, N.; Ignaccolo, M.; Pluchino, A.; Rapisarda, A.; D’Angelo, R. Multi-agent simulation for planning and designing new shared mobility services. Res. Transp. Econ. 2019, 73, 34–44. [Google Scholar] [CrossRef]
- Cisterna, C.; Giorgione, G.; Viti, F. Explorative analysis of potential MaaS customers: An agent-based scenario. Procedia Comput. Sci. 2021, 184, 629–634. [Google Scholar] [CrossRef]
- Oeschger, G.; Carroll, P.; Caulfield, B. Micromobility and public transport integration: The current state of knowledge. Transp. Res. Part D Transp. Environ. 2020, 89, 102628. [Google Scholar] [CrossRef]
- Giuffrida, N.; Ignaccolo, M.; Inturri, G.; Rofè, Y.; Calabrò, G. Investigating the Correlation between Transportation Social Need and Accessibility: The Case of Catania. Transp. Res. Procedia 2017, 27, 816–823. [Google Scholar] [CrossRef]
- Giuffrida, N.; Inturri, G.; Caprì, S.; Spica, S.; Ignaccolo, M. The impact of a bus rapid transit line on spatial accessibility and transport equity: The case of Catania. In Proceedings of the Transport Infrastructure and Systems, Rome, Italy, 10–12 April 2017; pp. 753–758. [Google Scholar]
- Moran, M.E.; Laa, B.; Emberger, G. Six scooter operators, six maps: Spatial coverage and regulation of micromobility in Vienna, Austria. Case Stud. Transp. Policy 2020, 8, 658–671. [Google Scholar] [CrossRef]
- Boglietti, S.; Barabino, B.; Maternini, G. Survey on e-Powered Micro Personal Mobility Vehicles: Exploring Current Issues towards Future Developments. Sustainability 2021, 13, 3692. [Google Scholar] [CrossRef]
- Hull, A.; O’Holleran, C. Bicycle infrastructure: Can good design encourage cycling? Urban Plan. Transp. Res. 2014, 2, 369–406. [Google Scholar] [CrossRef] [Green Version]
- Ignaccolo, M.; Inturri, G.; Cocuzza, E.; Giuffrida, N.; Le Pira, M.; Torrisi, V. Developing Micromobility in Urban Areas: Network Planning Criteria for E-Scooters and Electric Micromobility De-vices. In Proceedings of the Study presented at Living and Walking in Cities—New scenarios for safe mobility in urban areas, XXV International Conference LWC 2021, Brescia, Italy, 9–10 September 2021. [Google Scholar]
- Ernst & Young Micromobility: Moving Cities into A Sustainable Future. 2020. Available online: https://www.voiscooters.com/wp-content/uploads/2020/03/200316_EY_Micromobility_Moving_cities_into_a_sustainable_future_1.pdf (accessed on 12 October 2021).
- POLIS Macro Managing Micro Mobility. 2019. Available online: https://www.polisnetwork.eu/wp-content/uploads/2019/11/Polis-Paper-Macromanaging-MicroMobility.pdf (accessed on 12 October 2021).
- Giuffrida, N.; Inturri, G.; Ignaccolo, M.; Fazio, M. A Gis-Based Multi Criteria Approach for the Design of a Cycling Network in the City of Catania. In Proceedings of the ICTTE 2018—International Conference on Traffic and Transport Engineering, Belgrade, Serbia, 27–28 September 2018. [Google Scholar]
- Fazio, M.; Giuffrida, N.; Le Pira, M.; Inturri, G.; Ignaccolo, M. Bike oriented development: Selecting locations for cycle stations through a spatial approach. Res. Transp. Bus. Manag. 2020, 40, 100576. [Google Scholar] [CrossRef]
- Mayhew, L.J.; Bergin, C. Impact of e-scooter injuries on Emergency Department imaging. J. Med Imaging Radiat. Oncol. 2019, 63, 461–466. [Google Scholar] [CrossRef] [Green Version]
- Gössling, S. Integrating e-scooters in urban transportation: Problems, policies, and the prospect of system change. Transp. Res. Part D Transp. Environ. 2020, 79, 102230. [Google Scholar] [CrossRef]
- Zhang, W.; Buehler, R.; Broaddus, A.; Sweeney, T. What type of infrastructures do e-scooter riders prefer? A route choice model. Transp. Res. Part D Transp. Environ. 2021, 94, 102761. [Google Scholar] [CrossRef]
- James, O.; Swiderski, J.I.; Hicks, J.; Teoman, D.; Buehler, R. Pedestrians and E-Scooters: An Initial Look at E-Scooter Parking and Perceptions by Riders and Non-Riders. Sustainability 2019, 11, 5591. [Google Scholar] [CrossRef] [Green Version]
- Campisi, T.; Akgün, N.; Tesoriere, G. An Ordered Logit Model for Predicting the Willingness of Renting Micro Mobility in Urban Shared Streets: A Case Study in Palermo, Italy. In Lecture Notes in Computer Science (Including Subseries Lecture Notes in Artificial Intelligence and Lecture Notes in Bioinformatics); Springer: Berlin/Heidelberg, Germany, 2020. [Google Scholar]
- Campisi, T.; Basbas, S.; Skoufas, A.; Tesoriere, G.; Ticali, D. Socio-Eco-Friendly Performance of E-Scooters in Palermo: Preliminary Statistical Results. In Ground Improvement Techniques and Geosynthetics; Springer: Berlin/Heidelberg, Germany, 2021; pp. 643–653. [Google Scholar]
- Jiao, J.; Bai, S. Understanding the Shared E-scooter Travels in Austin, TX. ISPRS Int. J. Geo-Inf. 2020, 9, 135. [Google Scholar] [CrossRef] [Green Version]
- Calabrò, G.; Inturri, G.; Le Pira, M.; Pluchino, A.; Ignaccolo, M. Bridging the gap between weak-demand areas and public transport using an ant-colony simulation-based optimization. Transp. Res. Procedia 2020, 45, 234–241. [Google Scholar] [CrossRef]
- Bai, S.; Jiao, J. Dockless E-scooter usage patterns and urban built Environments: A comparison study of Austin, TX, and Minneapolis, MN. Travel Behav. Soc. 2020, 20, 264–272. [Google Scholar] [CrossRef]
- McKenzie, G. Spatiotemporal comparative analysis of scooter-share and bike-share usage patterns in Washington, DC. J. Transp. Geogr. 2019, 78, 19–28. [Google Scholar] [CrossRef]
- Caspi, O.; Smart, M.J.; Noland, R.B. Spatial associations of dockless shared e-scooter usage. Transp. Res. Part D Transp. Environ. 2020, 86, 102396. [Google Scholar] [CrossRef] [PubMed]
- Qian, X.; Jaller, M.; Niemeier, D. Enhancing equitable service level: Which can address better, dockless or dock-based Bikeshare systems? J. Transp. Geogr. 2020, 86, 102784. [Google Scholar] [CrossRef]
- Yang, H.; Ma, Q.; Wang, Z.; Cai, Q.; Xie, K.; Yang, D. Safety of micro-mobility: Analysis of E-Scooter crashes by mining news reports. Accid. Anal. Prev. 2020, 143, 105608. [Google Scholar] [CrossRef] [PubMed]
- Sandoval, R.; Van Geffen, C.; Wilbur, M.; Hall, B.; Dubey, A.; Barbour, W.; Work, D.B. Data driven methods for effective micromobility parking. Transp. Res. Interdiscip. Perspect. 2021, 10, 100368. [Google Scholar] [CrossRef]
- He, S.; Shin, K.G. Dynamic Flow Distribution Prediction for Urban Dockless E-Scooter Sharing Reconfiguration. In Proceedings of the Web Conference 2020, Taipei, Taiwan, 20–25 April 2020. [Google Scholar]
- Masoud, M.; Elhenawy, M.; Almannaa, M.H.; Liu, S.Q.; Glaser, S.; Rakotonirainy, A. Heuristic Approaches to Solve E-Scooter Assignment Problem. IEEE Access 2019, 7, 175093–175105. [Google Scholar] [CrossRef]
- Veillette, M.-P.; Grise, E.; El-Geneidy, A. Park ‘n’ Roll: Identifying and Prioritizing Locations for New Bicycle Parking in Québec City, Canada. Transp. Res. Rec. J. Transp. Res. Board 2018, 2672, 73–82. [Google Scholar] [CrossRef] [Green Version]
- Fazio, M.; Giuffrida, N.; Inturri, G.; Ignaccolo, M. Combining GPS-Tracks and Accident Data to Improve Safety of Cycling Paths, SAE Technical Paper 2020-24-0020. 2020. Available online: https://www.sae.org/publications/technical-papers/content/2020-24-0020/ (accessed on 12 October 2021).
- D’Orso, G.; Migliore, M. A GIS-based method for evaluating the walkability of a pedestrian environment and prioritised investments. J. Transp. Geogr. 2020, 82, 102555. [Google Scholar] [CrossRef]
- Ignaccolo, M.; Inturri, G.; Cocuzza, E.; Giuffrida, N.; Torrisi, V. Framework for the evaluation of the quality of pedestrian routes for the sustainability of port–city shared areas. In Coastal Cities and Their Sustainable Future III; WIT Press: Southampton, UK, 2019. [Google Scholar]
- QGIS Development Team, GIS Geographic Information System. Open Source Geospatial Foundation Project. Available online: http://qgis.osgeo.org (accessed on 12 October 2021).
- Cohen, A. Equity in Motion. Department of Urban Planning at the University of California, Los Angele. Available online: http://www.lewis.ucla.edu/wpcontent/uploads/sites/2/2016/09/2015-2016_Cohen_Equity-in-Motion_Edit_August2016.Pdf (accessed on 12 October 2021).
- Schoner, J.; Levinson, D.M. Which Station? Access Trips and Bike Share Route Choice. Retrieved from the University of Minnesota Digital Conservancy. Available online: https://hdl.handle.net/11299/179838 (accessed on 12 October 2021).
- Shafique, M.A.; Hato, E. Travel Mode Detection with Varying Smartphone Data Collection Frequencies. Sensors 2016, 16, 716. [Google Scholar] [CrossRef] [Green Version]
- Ma, Q.; Yang, H.; Mayhue, A.; Sun, Y.; Huang, Z.; Ma, Y. E-Scooter safety: The riding risk analysis based on mobile sensing data. Accid. Anal. Prev. 2021, 151, 105954. [Google Scholar] [CrossRef]
- Legambiente Ecosistema Urbano. Rapporto Sulle Performance Ambientali Delle Città 2020. Available online: https://statistica.regione.emilia-romagna.it/agenda/prova-evento-futuo (accessed on 12 October 2021).
- ISTAT. Available online: https://www.istat.it/ (accessed on 12 October 2021).
- OPENdata Catania. Available online: http://opendata.comune.catania.gov.it/ (accessed on 12 October 2021).
- Borghetti, F.; Colombo, C.G.; Longo, M.; Mazzoncini, R.; Cesarini, L.; Contestabile, L.; Somaschini, C. 15-Min Station: A Case Study in North Italy City to Evaluate the Livability of an Area. Sustainability 2021, 13, 10246. [Google Scholar] [CrossRef]
Figure 1.
Flowchart for the proposed methodology (own elaboration).

Figure 2.
Territorial framework of the case study (own elaboration).

Figure 3.
Study area and road network (own elaboration).

Figure 4.
Maps of CPOI (a) and CPT (b) (own elaboration).

Figure 5.
Maps of CR (a) and CE (b) (own elaboration).

Figure 6.
Maps of CA (a) and CGPS (b) (own elaboration).

Figure 7.
Map of CS (own elaboration).

Figure 8.
Maps showing links with SI lower than 2 (a) and higher than 2 (b) and the relative suggested types of infrastructure (own elaboration).
Figure 8.
Maps showing links with SI lower than 2 (a) and higher than 2 (b) and the relative suggested types of infrastructure (own elaboration).

Figure 9.
Map of PI and area with higher PI level highlighted (own elaboration).

Figure 10.
Maps of PI for the weighting strategy, focusing on recreational trips (own elaboration).

Figure 11.
Maps of PI for the weighting strategy, focusing on intermodal trips (own elaboration).

Publisher’s Note: MDPI stays neutral with regard to jurisdictional claims in published maps and institutional affiliations. |
© 2021 by the authors. Licensee MDPI, Basel, Switzerland. This article is an open access article distributed under the terms and conditions of the Creative Commons Attribution (CC BY) license (https://creativecommons.org/licenses/by/4.0/).
Share and Cite
MDPI and ACS Style
Fazio, M.; Giuffrida, N.; Le Pira, M.; Inturri, G.; Ignaccolo, M. Planning Suitable Transport Networks for E-Scooters to Foster Micromobility Spreading. Sustainability 2021, 13, 11422. https://0-doi-org.brum.beds.ac.uk/10.3390/su132011422
AMA Style
Fazio M, Giuffrida N, Le Pira M, Inturri G, Ignaccolo M. Planning Suitable Transport Networks for E-Scooters to Foster Micromobility Spreading. Sustainability. 2021; 13(20):11422. https://0-doi-org.brum.beds.ac.uk/10.3390/su132011422
Chicago/Turabian StyleFazio, Martina, Nadia Giuffrida, Michela Le Pira, Giuseppe Inturri, and Matteo Ignaccolo. 2021. "Planning Suitable Transport Networks for E-Scooters to Foster Micromobility Spreading" Sustainability 13, no. 20: 11422. https://0-doi-org.brum.beds.ac.uk/10.3390/su132011422
Note that from the first issue of 2016, this journal uses article numbers instead of page numbers. See further details here.