
Effects of Air Pollution on Assaults: Findings from South Korea


1
Korea Adaptation Center for Climate Change, Korea Environment Institute, Sejong 30121, Korea
2
Department of Urban Design and Planning, Hongik University, Seoul 04066, Korea
*
Author to whom correspondence should be addressed.
Sustainability 2021, 13(20), 11545; https://0-doi-org.brum.beds.ac.uk/10.3390/su132011545
Submission received: 19 August 2021
/
Revised: 9 October 2021
/
Accepted: 13 October 2021
/
Published: 19 October 2021
(This article belongs to the Special Issue Sustainability on Crime Analysis and Public Safety)
Abstract
:This study investigates the effects of concentration of air pollution on assault rates for 204 police districts of South Korea from 2001 to 2018. A series of panel spatial Durbin models for the concentration of ozone, fine dust, and nitrogen dioxide—three key air pollutants of the country—identify the significant impacts of air pollution on assault rates that vary from each other. Ozone is expected to induce more assaults both locally and regionally. Fine dust decreases assault rates of an area and also in neighboring areas. Nitrogen dioxide yields positive effects on the surrounding areas’ assault rates but not in area of pollution itself. Findings of this study suggest the need to incorporate active measures on air pollution and violent crime at both city and inter-city levels. They also propose the active sharing of information on air pollution and crime between cities and regions as a collaborative response.
1. Introduction
Since the advent of fossil fuel-based combustion engines in the 18th century, cities around the world have enriched themselves through the mass production of goods. However, small particles generated from the engines’ operation have polluted the earth’s near-surface atmosphere, putting the natural ecosystem and the human species at great risk. The Muse Valley fog of Belgium in 1930, the photochemical smog of Los Angeles in the 1940s, and the Great Smog of London in 1952 are some of the most remembered air pollution incidents that caused countless casualties and damages.
Chronic exposure to air pollution is widely known to adversely affect people’s health [1,2]. Ozone induces chest pain, coughing, and nausea. It also exacerbates bronchitis, heart disease, emphysema, and asthma [3,4]. Fine dust, or particulate matter, penetrates inhaled alveoli and causes serious cardiovascular and respiratory diseases [5,6,7]. High concentrations of nitrogen dioxide lead to chronic bronchitis, pneumonia, pulmonary hemorrhage, and even pulmonary edema. In 2016, the World Health Organization (WHO) estimated 4.2 million premature deaths occurred from air pollution worldwide [8].
Another effect of air pollution is on people’s aggressive behavior and misjudgment, mainly through psychological and biological changes, leading to violent crime outbreaks [9,10,11]. Many psychology studies report that air pollution impedes cognitive function. Abilities for language learning, memory, and self-control are negatively affected; and depression and anxiety symptoms may appear [12,13,14]. Losing self-control and the reduction of individual work capacity [15] and productivity [16] are found. Effects on depression, mental health, and even suicides are also identified [17,18,19,20,21]. Furthermore, a number of biological studies argue that air pollution may cause a reduction in hormones that make humans happy, and cause inflammation in the central nervous system [22,23,24,25]. They suggest that ozone significantly reduces serotonin, also known as the “happiness hormone”, so also increases aggression [26,27], and that exposure to air pollution may cause oxidative stress and neuroinflammation along with changes in cerebrovascular damage, neurodegenerative pathology, and neuronal cells as the central nervous system is damaged [23,24,25,28]. Air pollution may also affect the oxygen transported in the blood and trigger physical discomfort and cognitive impartment [29].
Recent studies identify significant links between exposure to air pollution and crime. Burkhardt et al. [9] unveil the relationship between increased air pollution levels and violent crime rates in the United States and note the overlooked social costs. Herrnstadt and Muehlegger [30], based on an extensive analysis of data on more than 2 million crimes, air pollution, and climate conditions reported over 12 years in Chicago, United States, suggest that higher carbon monoxide levels result in increased daily crime rates. Lu et al. [31], using a panel analysis of nine years of six major air pollutants and crime data in 9360 cities in the United States, argue that criminal activities are positively associated with high air pollution concentrations. Chen and Li [11], from the NOx Budget trading program operated by the United States Environmental Protection Agency, report that lowering air pollution levels significantly reduces criminal activities. Bondy et al. [32], using air quality data and criminal records of London, United Kingdom, also unveils the positive relationship between the two.
In spite of these efforts, it is clear that the current literature looks into a limited part of the world and that further investigation is required. For better development of policies and strategies for managing air pollution and violent crime in diverse contexts, their intricate relationship should be further explored by adopting methods that take a wider range of causes into consideration.
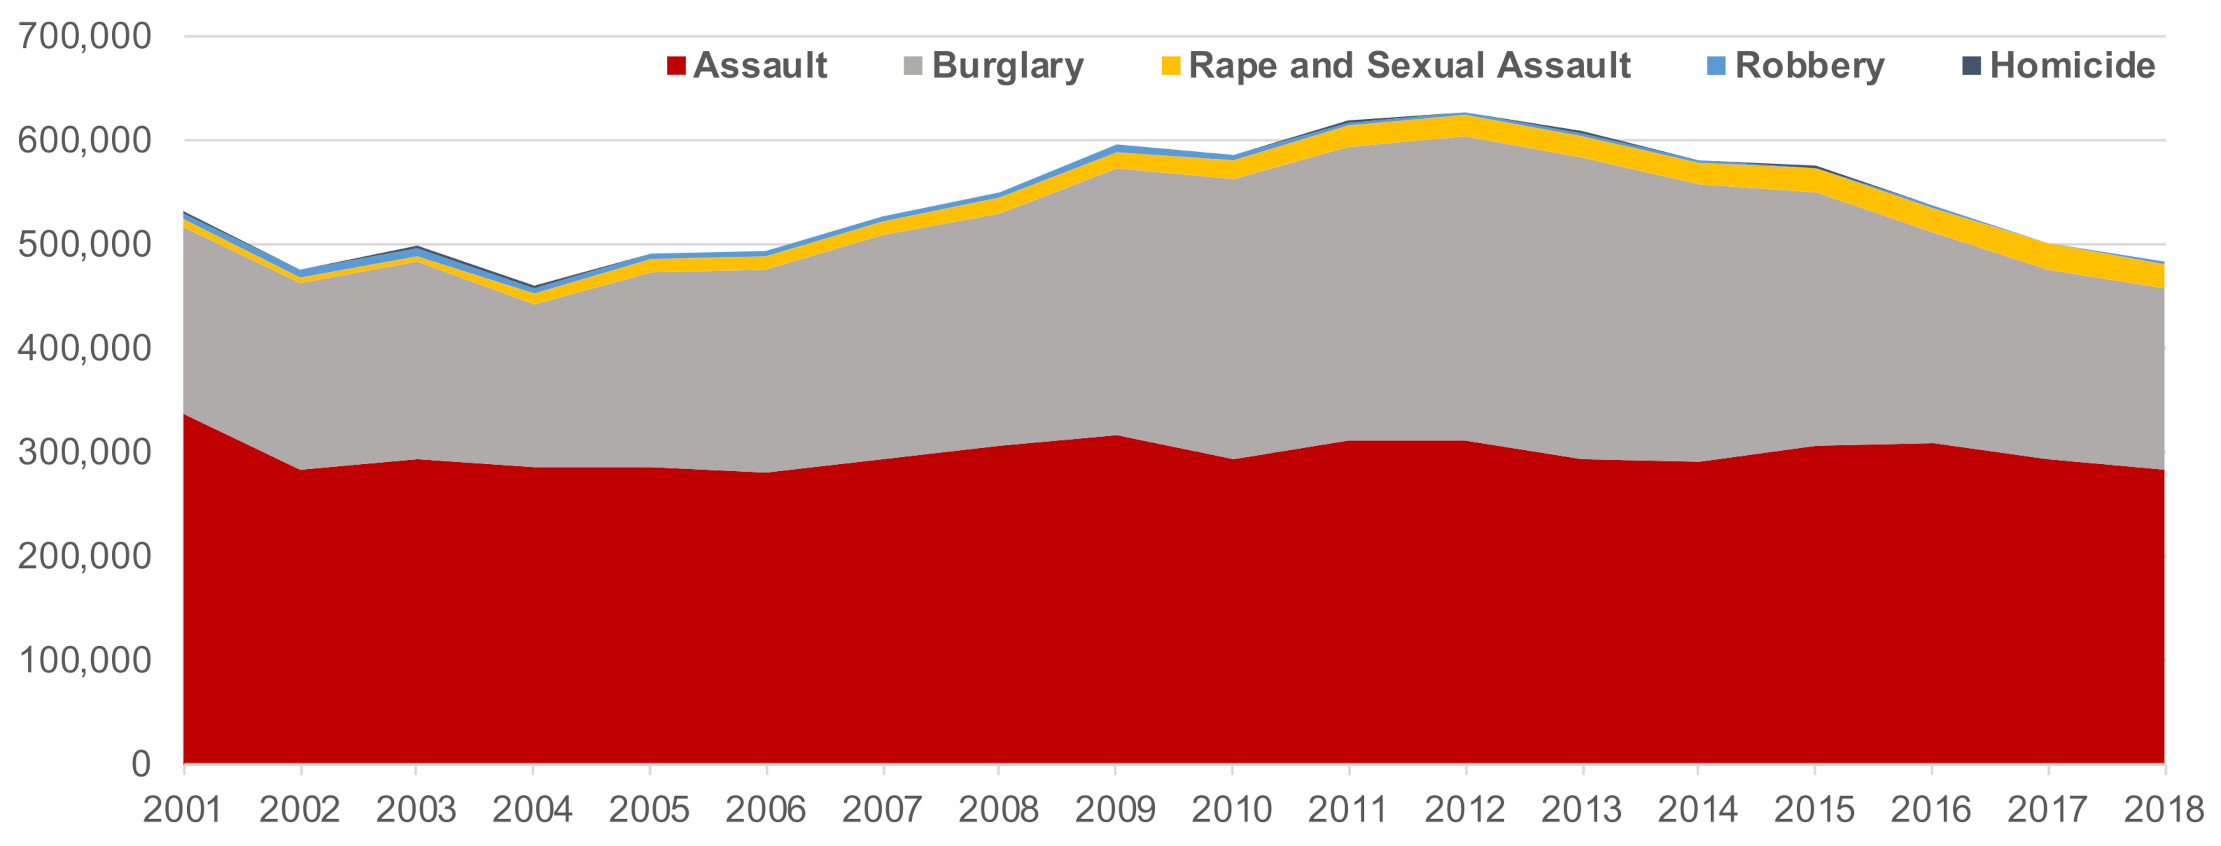
This study looks into South Korea where high concentrations of air pollution, which frequently exceed WHO’s recommended standards, persist [33,34]. It is also where the number of assaults, among the five official violent crime types in South Korea, does not present a clear declining trend unlike the other four, which are burglary, rape and sexual assault, robbery, and homicide, as Figure 1 illustrates, despite years of crime prevention efforts implemented at the national and local level [35]. More specifically, we use panel spatial Durbin models to empirically analyze the effects of concentrations of ozone, fine dust, and nitrogen dioxide on assault rates. Findings of this study may help identify the relationship between air pollution and crime for the first time in South Korea. It may also inform local and regional policy makers to secure environmental sustainability and safety.
2. Materials
The dependent variable of our investigation is the assault rate. Assault in local terms includes aggression, injury, confinement, threat and blackmailing, kidnapping, and malicious mischief. We calculate the annual number of assaults per 100,000 residents using panel data for 204 police districts across the country for eighteen years from 2001 to 2018 based on data availability. The data is obtained through a special request from the Korean National Policy Agency (https://www.police.go.kr/ accessed on 4 March 2021).
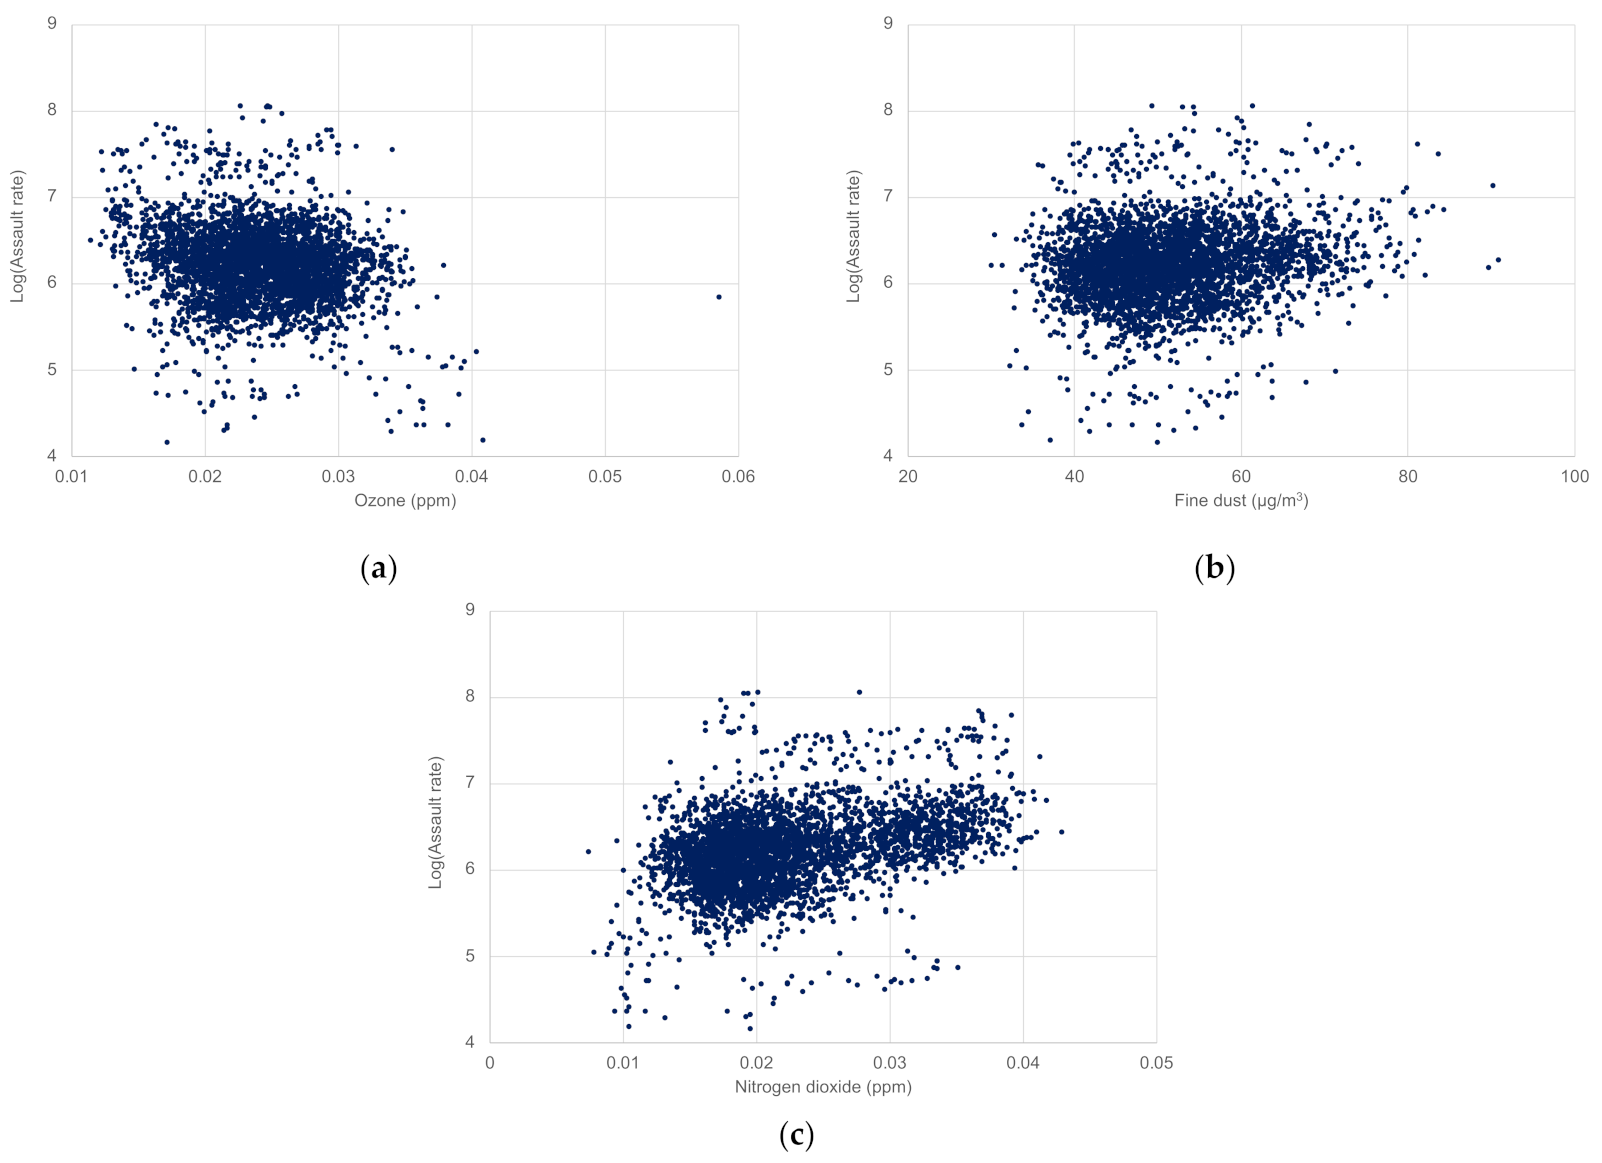
Our key independent variables are concentrations of ozone (O3), fine dust (PM10), and nitrogen dioxide (NO2). They are the three most representative air pollutants of South Korea and increasingly fail to satisfy the country’s environmental standards in many cities. We use data offered by AirKorea (https://www.airkorea.or.kr/ accessed on 4 March 2021), a public website run by the Korean Ministry of Environment and the Korea Environment Corporation. The website plays an active role in providing access to data on concentrations of various air pollutants acquired from hundreds of monitoring stations established across the country. We calculate the annual mean concentrations of ozone, fine dust, and nitrogen dioxide from 2001 to 2018 for each of the 204 police districts. For ten districts without any monitoring stations, interpolations using geographic information systems are applied to generate reliable estimates. Figure 2 delivers the relationships between each of the independent variables and the log-transformed dependent variable for the 18 years. An initial observation implies some correlations between the variables but suggests further analysis is required.
We also adopt a number of control variables that may yield non-negligible impacts on crime so as to avoid any confounding relationships between the dependent and independent variables. First, we look at climate characteristics by drawing from related literature [36,37,38,39], which include mean, minimum, and maximum temperatures, precipitation, and wind speeds. Relevant data is acquired from the Korea National Climate Data Center (https://data.kma.go.kr/ accessed on 4 March 2021). Interpolated values are computed for the ten police districts without specific data. Second, following previous research attempts [40,41,42,43,44], we include population characteristics such as population density and shares of children, elderly, and foreign populations. Lastly, to incorporate socioeconomic conditions of each district, data for property tax revenue, and unemployment rates, as some studies suggest [45,46], are adopted. The density of commercial facilities, which represent retail vibrancy as suggested by local literature [47], is also included. Population and socioeconomic data are downloaded from by the Korean Statistical Information Service (https://kosis.kr accessed on 4 March 2021).
Table 1 presents a descriptive summary of variables used in this study. Assault rate, population density, and property tax variables are logged to minimize skewness and increase normality. The log-transformed assault rates range between 4.15 and 8.05 with a mean of 6.21. Concentrations of ozone, fine dust, and nitrogen dioxide average at 0.024 ppm, 51.61 µg/m3, and 0.023 ppm, respectively. The mean values of average, minimum, and maximum temperatures are 12.57 °C, −14.31 °C, and 35.41 °C, respectively. Those for precipitation and wind speeds are 1307 mm and 1.85 m/s, respectively. As for population characteristics, the logged population densities average at 6.35 persons per square meter and range from 2.97 to 10.27. The mean ratios of child, elderly, and foreign populations are 7.36, 15.54, and 1.55 percent, respectively. Regarding socioeconomic characteristics, the logged property taxes average at 67.1 million Korean Won; unemployment rates range between 1.3 and 5.7 percent with a mean of 3.13; and the average density of commercial facilities is 12.03 per 100 residents.
3. Methods
We first identify the spatial autocorrelation of assault rates for each year and select a spatial econometric model based on likelihood ratio (LR) and Wald tests. The Hausman test [48] is applied to each model to decide whether the model with fixed effect or the model with random effect is employed.
It is widely shared that spatial data is subject to spatial dependence and heterogeneity. Such effects, when identified as significant, violate basic assumptions of the ordinary least square (OLS) estimation of regression models and may generate unreliable results [49]. Accordingly, we verify spatial autocorrelation of assault rates for each of the eighteen-year periods by computing Moran’s I statistic [50]. Results, as shown in Table 2, verify that the rates yield positive spatial autocorrelation that is statistically significant at the 0.1 percent level for all the eighteen years. They suggest the need for adopting spatial panel econometric models for analysis to take into account the spatial effects.
Spatial econometric models are classified based on the different spatial dependencies considered. Spatial error models (SEMs) incorporate the spatial autocorrelation of the error term. Spatial lag models (SLMs), or spatial autoregression models, capture the spatial autocorrelation of the dependent variable. Spatial Durbin models (SDMs) introduce spatial spillover effects by recognizing the spatial lag terms of the dependent variables and the spatial lag term of the error of independent variables [51].
LR and Wald tests provide guidance to selecting the appropriate model [52,53]. As presented in Table 3, both the LR and Wald test results reject the hypothesis that the SDM can be simplified to an SEM or SLM at the 0.1 percent significance level, suggesting the applicability of SDM to this analysis. We use the panel SDM henceforth to effectively respond to the nature of the variables.
The panel SDM can be expressed as follows:
where is the dependent variable at year ; is the spatial lag coefficient of ; is the matrix of independent variables; is the coefficient of the independent variables; is the spatial lag coefficient of the independent variables; represents the spatial weight matrix; and represents random errors.
Unlike other spatial econometric models, panel SDMs capture direct and indirect effects [49,54,55]. The direct effect implies that the assault rate of an area is affected by the variations in the explanatory variables of the area. It also includes the potential effect of feedback loops where the impacts pass through neighboring areas back to the original area [51]. The indirect effect exhibits spillover effects caused by the explanatory variables of surrounding areas. The total effect is the sum of the direct and indirect effects. These effects provide a better interpretation of the results as the coefficients of SDMs may not directly reflect the marginal effects of each explanatory variable on the dependent variable [49,54]. SDMs successfully examine the influence of the independent variables on the dependent variable in local and surrounding areas and test spatial, temporal, and spatiotemporal dependences of the dependent variable [56]. For these reasons, many studies on air pollution or crime rates actively adopt SDMs to incorporate and identify spillover effects in their analyses [49,57,58,59].
We establish three panel SDMs each for the concentration of ozone, fine dust, and nitrogen dioxide, since they commonly yield relatively high levels of correlation among them (ozone and fine dust: −0.672; ozone and nitrogen dioxide: −0.675; and fine dust and nitrogen dioxide: 0.524) all of which are significant at the 0.01 level. Among the control variables, we do not include average temperature, population density, and child population ratio in all three models, and additionally unemployment rate in the nitrogen dioxide model, for their high levels of correlation, significant at the 0.01 level, with other variables.
4. Results
4.1. Ozone Impacts on Assault Rates
The Hausman test statistics for the ozone model is 47.21 (p < 0.001). We reject the random effect model and select the fixed effect model. Table 4 presents estimation results for ozone based on the panel SDM. Results suggest that the coefficient of concentration of ozone is 7.706 (p < 0.05), indicating that it positively affects assault rates at the local level. Among the control variables, minimum temperature, precipitation, wind speed, property tax, unemployment rate, and density of commercial facilities increase the rates, while the elderly population ratio decreases them. When spillover effects are considered, results differ slightly. The table shows that the concentration of ozone yields no significant impact but that minimum temperature, precipitation, elderly population ratio, and unemployment rate negatively affect the rates. The spatial rho value, which represents spatial interdependency, explains that a 1 percent increase in the surrounding areas’ assault rates is associated with a 0.247 percent increase in local rates.
Table 5 demonstrates direct and indirect effects also generated from the panel SDM. Results are generally in line with what Table 4 provides. The direct effects are in general similar to the coefficients, and the indirect effects to those that consider spillover effects. The direct and indirect effects of the concentration of ozone are both significantly positive. This suggests that not only the ozone concentration of an area but also of its surrounding areas simultaneously increase the area’s assault rates, similar to what previous studies have found. Among the climate variables, minimum temperature’s negative indirect effect overcomes its positive direct effect, resulting in a negative total effect. Precipitation yields significantly positive direct and negative indirect effects at the same time, but the two effects seem to offset each other when combined. Wind speed exhibits only a significantly positive direct effect. Among the population variables, the direct and indirect effects of the elderly population ratio are both significantly negative. As for the socioeconomic variables, property tax, and unemployment rate present significantly positive direct effects but not significant indirect effects. The direct and indirect effects of the density of commercial facilities are both significantly positive.
4.2. Fine Dust Impacts on Assault Rates
The Hausman test statistics of the fine dust model is 46.20 (p < 0.001) and suggest the fixed effect model for analysis. As the panel SDM in Table 6 illustrates, the coefficient of concentration of fine dust, −0.003 (p < 0.1), presents a significantly negative impact on assault rates. Among the control variables, minimum temperature, precipitation, wind speed, property tax, unemployment rate, and density of commercial facilities increase the rates, while the elderly population ratio decreases them. When spillover effects are taken into consideration, the coefficient of concentration of fine dust is 0.006 (p < 0.01), exhibiting a significantly negative impact. Minimum temperature, precipitation, elderly population ratio, property tax, and unemployment rate negatively affect the rates. The spatial rho value presents that a 1 percent increase in the surrounding areas’ assault rates is associated with a 0.247 percent increase in local rates.
Direct and indirect effects, as Table 7 presents, are again in line with what the panel SDM estimates in Table 6. The direct effects are almost identical to the coefficients, and the indirect effects are generally similar to the coefficients that incorporate spillover effects. The direct effect of concentration of fine dust is significantly negative but its indirect effect is significantly positive, presenting a significantly positive overall effect. This can be interpreted that an area’s concentration of fine dust may negatively affect assault rates, but its surrounding areas’ concentrations may positively affect the area’s rates, resulting in an overall increase. Minimum temperature and unemployment rate commonly yield significantly positive direct and negative indirect effects at the same time. Precipitation and property tax present significantly positive direct effects. Wind speed and density of commercial facilities show significant positive direct and indirect effects, while the elderly population ratio exhibits significantly negative effects directly and indirectly.
4.3. Nitrogen Dioxide Impacts on Assault Rates
The Hausman test statistics of the nitrogen dioxide model is 38.07 (p < 0.01) and suggests selecting the fixed effect model as opposed to the random effect model. As Table 8 shows, the panel SDM suggests that the concentration of nitrogen dioxide does not yield any significant impacts on local assault rates. Among the control variables, minimum temperature, precipitation, wind speed, property tax, and density of commercial facilities show positive effects; and elderly population negative exhibit effects, similar to what the two other models provide. When spillover effects are considered, results differ in general. The coefficient of concentration of nitrogen dioxide is 7.441 (p < 0.05), presenting a significantly positive impact on the rates. This can be interpreted that an area’s assault rates are less affected by local concentration of nitrogen dioxide but more by those of the surroundings. Among other variables, minimum temperature, elderly population ratio, and property tax yield significantly negative impacts. The spatial rho is 0.247, suggesting that the surrounding areas’ violent crime rates are associated with a 0.247 percent increase in local rates.
Table 9 provides the direct and indirect effects of the nitrogen dioxide panel SDM. Again, the direct effects for each variable are similar to the coefficients from Table 8, and the indirect effects to those that consider spillover effects. Only the indirect effect is statistically significant for the concentration of nitrogen dioxide, suggesting that the spatial spillover effect of nitrogen dioxide of adjacent areas exhibit positive impacts on increasing assault rates. Among the climate variables, minimum temperature presents a significantly positive direct effect and a negative effect at the same time, resulting in an overall negative effect. Maximum temperature yields a significantly positive indirect effect, and precipitation a direct effect. Wind speed demonstrates significantly positive direct and indirect effects. Among the population variables, the elderly population presents negative direct and indirect effects. Among socioeconomic variables, property tax and the density of commercial facilities show significantly positive direct effects.
4.4. Disscussion
The results suggest several issues for discussion. First, we are able to identify the significant impacts of air pollution on assault rates, but the impacts differ by air pollutant type. An increase in the concentration of ozone would not only escalate the rates of an area but also increase in surrounding areas and in the end return to the area as feedback. Expanded ozone discharged into the atmosphere, largely caused by vehicle emissions and rising temperatures observed globally [60,61], is expected to induce more assaults both locally and regionally. On the other hand, an increase in the concentration of fine dust is expected to decrease assault cases of an area, while at the same time increasing in neighboring areas. The decreasing effect may relate to previous empirical findings that fine dust discourages outdoor activities [33,62,63], thus decreasing any likelihood of crime occurrence. The increasing impact may reflect the spillover effects that have been less perceived so far. In the case of nitrogen dioxide, only positive effects on the surrounding areas’ assault rates are identified, raising concerns about its spillover effect, while not yielding any significant local impacts.
Some noteworthy impacts can also be identified from the control variables. Among the climate characteristics, rising minimum temperatures introduce higher assault rates at the local level. This is largely in line with empirical findings from existing studies that prove temperature impacts on crime [38,64,65]. Precipitation and wind speeds are found to increase assault rates at the local level in most cases. Regarding population characteristics, an evident finding is the negative impact of the elderly population on assault rates, yielding both local and spillover effects for all three air pollutant types. Although this may sound counterintuitive as some research identifies the elderly population as being more vulnerable to violent crime [66,67,68], it may represent that assault more frequently targets relatively younger population groups in our study context. Unlike researchers who identify relationships between foreign population and violent crime [44,69,70], we find no significant evidence in this analysis. Among socioeconomic characteristics, property tax and unemployment in general rate increase assault rates at the local level. It can be interpreted that more affluent areas, as represented by larger property tax revenues, and economically stagnant areas, as described by higher unemployment rates, at the same time may provoke assaults. This may illustrate the positive impact of economic inequality on crime also experienced in other contexts [46,71,72,73]. Commercial facilities are found to present positive impacts on assault rates at the local level. A higher concentration of retail, which often draws a larger number of people, may attract violent crime.
5. Conclusions and Policy Implications
Using a series of panel SDMs that build on data between 2001 and 2018 from South Korea, we find that air pollution yields significant impacts on assault rates. More specifically, concentrations of ozone, fine dust, and nitrogen dioxide, three of the most representative air pollutants in South Korea, exhibit either positive or negative impacts. They also present local and spillover effects at the same time.
There are several shortcomings in this study. First, our analysis carried out at the police district level, which is in general similar to the city level, may not detect specific locations of assaults that may be influenced by directly adjacent settings like building configurations, land use, and accessibility. Second, using yearly data may not accommodate seasonal or monthly fluctuations which may also influence crime. Third, as some climate data were missing, interpolations had to be made for statistical analysis.
However, several policy implications for creating safer and sustainable environments can be drawn. First, the identified impacts alarm cities with higher air pollution levels to adopt measures that are more preemptive and comprehensive to combat crime. The close connection between air pollution and assault should be reflected in local environmental and crime policies and be widely shared by policymakers. Second, the spatial spillover effects, identified for all three air pollutants, call for the need to adopt regional approaches that build on close inter-city collaboration. Coordinated policy responses against air pollution and assault should be promoted. Information on local air pollution levels and crime occurrences could be instantly shared between neighboring cities. Third, more active measures are required for ozone. The concentration of ozone is continuously rising nationwide and presents the most critical impacts on assault among the three air pollutants. It is also receiving less societal and policy concerns than fine dust, for which a wide range of strategies are being already established and implemented.
Future studies may benefit from the findings of this study and carry out more in-depth analyses. Air pollution impacts on other violent crime types can be investigated, and seasonal or monthly influences can be identified. Similar approaches in diverse contexts may generate practical findings that would benefit local policymakers devoted to making safer and more sustainable dwelling environments for people.
Author Contributions
Conceptualization, J.E.; methodology, J.E. and H.K.; software, J.E.; validation, J.E. and H.K.; formal analysis, J.E. and H.K.; investigation, J.E.; resources, J.E. and H.K.; data curation, H.K.; writing—original draft preparation, J.E.; writing—review and editing, H.K.; visualization, J.E.; supervision, H.K.; project administration, H.K.; funding acquisition, H.K. All authors have read and agreed to the published version of the manuscript.
Funding
This work was supported by the Korea Agency for Infrastructure Technology Advancement (KAIA) grant funded by the Ministry of Land, Infrastructure and Transport (Grant 21TBIP-C162412-01) and by the Ministry of Education of the Republic of Korea and the National Research Foundation of Korea (NRF-2018S1A3A2075332).
Institutional Review Board Statement
Not applicable.
Informed Consent Statement
Not applicable.
Data Availability Statement
Not applicable.
Acknowledgments
The authors thank the reviewers for their wonderful comments that help improve the original manuscript.
Conflicts of Interest
The authors declare no conflict of interest. The funders had no role in the design of the study; in the collection, analyses, or interpretation of data; in the writing of the manuscript, or in the decision to publish the results.
References
- Rush, B.; McDermid, R.C.; Celi, L.A.; Walley, K.R.; Russell, J.A.; Boyd, J.H. Association between chronic exposure to air pollution and mortality in the acute respiratory distress syndrome. Environ. Pollut. 2017, 224, 352–356. [Google Scholar] [CrossRef] [PubMed] [Green Version]
- World Health Organization. Regional Office for Europe. Health Effects of Particulate Matter: Policy Implications for Countries in Eastern Europe, Caucasus and Central Asia. 2013. Available online: https://apps.who.int/iris/handle/10665/344854 (accessed on 4 March 2021).
- Anenberg, S.C.; West, J.; Fiore, A.M.; Jaffe, D.A.; Prather, M.J.; Bergmann, D.; Cuvelier, K.; Dentener, F.J.; Duncan, B.N.; Gauss, M.; et al. Intercontinental Impacts of Ozone Pollution on Human Mortality. Environ. Sci. Technol. 2009, 43, 6482–6487. [Google Scholar] [CrossRef] [PubMed] [Green Version]
- Ebi, K.L.; McGregor, G. Climate Change, Tropospheric Ozone and Particulate Matter, and Health Impacts. Environ. Health Perspect. 2008, 116, 1449–1455. [Google Scholar] [CrossRef] [PubMed]
- Sicard, P.; Khaniabadi, Y.O.; Perez, S.; Gualtieri, M.; De Marco, A. Effect of O3, PM10 and PM2.5 on cardiovascular and respiratory diseases in cities of France, Iran and Italy. Environ. Sci. Pollut. Res. 2019, 26, 32645–32665. [Google Scholar] [CrossRef]
- Karottki, D.G.; Spilak, M.; Frederiksen, M.; Andersen, Z.J.; Madsen, A.M.; Ketzel, M.; Massling, A.; Gunnarsen, L.; Møller, P.; Loft, S. Indoor and Outdoor Exposure to Ultrafine, Fine and Microbiologically Derived Particulate Matter Related to Cardiovascular and Respiratory Effects in a Panel of Elderly Urban Citizens. Int. J. Environ. Res. Public Health 2015, 12, 1667–1686. [Google Scholar] [CrossRef]
- Hwang, S.-H.; Lee, J.Y.; Yi, S.-M.; Kim, H. Associations of particulate matter and its components with emergency room visits for cardiovascular and respiratory diseases. PLoS ONE 2017, 12, e0183224. [Google Scholar] [CrossRef] [Green Version]
- World Health Organization. Ambient Air Pollution: A Global Assessment of Exposure and Burden of Disease. 2016. Available online: https://apps.who.int/iris/handle/10665/250141 (accessed on 10 March 2021).
- Burkhardt, J.; Bayham, J.; Wilson, A.; Carter, E.; Berman, J.D.; O’Dell, K.; Ford, B.; Fischer, E.V.; Pierce, J. The effect of pollution on crime: Evidence from data on particulate matter and ozone. J. Environ. Econ. Manag. 2019, 98, 102267. [Google Scholar] [CrossRef]
- Herrnstadt, E.; Heyes, A.; Muehlegger, E.; Saberian, S. Air Pollution as a Cause of Violent Crime: Evidence from Los Angeles and Chicago. 2016. Available online: http://www.erichmuehlegger.com/Working%20Papers/crime_and_Pollution_fv.pdf (accessed on 11 December 2020).
- Chen, S.; Li, T. The effect of air pollution on criminal activities: Evidence from the NO Budget Trading Program. Reg. Sci. Urban Econ. 2020, 83, 103528. [Google Scholar] [CrossRef]
- Cory-Slechta, D.; Allen, J.; Conrad, K.; Marvin, E.; Sobolewski, M. Developmental exposure to low level ambient ultrafine particle air pollution and cognitive dysfunction. NeuroToxicology 2018, 69, 217–231. [Google Scholar] [CrossRef]
- Evans, G.W.; Colome, S.D.; Shearer, D.F. Psychological reactions to air pollution. Environ. Res. 1988, 45, 1–15. [Google Scholar] [CrossRef]
- Tzivian, L.; Winkler, A.; Dlugaj, M.; Schikowski, T.; Vossoughi, M.; Fuks, K.; Weinmayr, G.; Hoffmann, B. Effect of long-term outdoor air pollution and noise on cognitive and psychological functions in adults. Int. J. Hyg. Environ. Health 2015, 218, 1–11. [Google Scholar] [CrossRef]
- Fehr, R.; Yam, K.C.; He, W.; Chiang, J.T.-J.; Wei, W. Polluted work: A self-control perspective on air pollution appraisals, organizational citizenship, and counterproductive work behavior. Organ. Behav. Hum. Decis. Process. 2017, 143, 98–110. [Google Scholar] [CrossRef]
- Zivin, J.G.; Neidell, M. The Impact of Pollution on Worker Productivity. Am. Econ. Rev. 2012, 102, 3652–3673. [Google Scholar] [CrossRef] [Green Version]
- Szyszkowicz, M. Air Pollution and Emergency Department Visits for Depression in Edmonton, Canada. Int. J. Occup. Med. Environ. Health 2007, 20, 241–245. [Google Scholar] [CrossRef]
- Bakian, A.V.; Huber, R.S.; Coon, H.; Gray, D.; Wilson, P.; McMahon, W.M.; Renshaw, P.F. Acute Air Pollution Exposure and Risk of Suicide Completion. Am. J. Epidemiol. 2015, 181, 295–303. [Google Scholar] [CrossRef] [Green Version]
- Gładka, A.; Rymaszewska, J.; Zatoński, T. Impact of air pollution on depression and suicide. Int. J. Occup. Med. Environ. Health 2018, 31, 711–721. [Google Scholar] [CrossRef]
- Lee, H.; Myung, W.; Kim, S.E.; Kim, D.K.; Kim, H. Ambient air pollution and completed suicide in 26 South Korean cities: Effect modification by demographic and socioeconomic factors. Sci. Total Environ. 2018, 639, 944–951. [Google Scholar] [CrossRef]
- Kim, Y.; Ng, C.F.S.; Chung, Y.; Kim, H.; Honda, Y.; Guo, Y.L.; Lim, Y.-H.; Chen, B.-Y.; Page, L.A.; Hashizume, M. Air Pollution and Suicide in 10 Cities in Northeast Asia: A Time-Stratified Case-Crossover Analysis. Environ. Health Perspect. 2018, 126, 037002. [Google Scholar] [CrossRef] [Green Version]
- Casas, L.; Cox, B.; Bauwelinck, M.; Nemery, B.; Deboosere, P.; Nawrot, T. Does air pollution trigger suicide? A case-crossover analysis of suicide deaths over the life span. Eur. J. Epidemiol. 2017, 32, 973–981. [Google Scholar] [CrossRef]
- Calderón-Garcidueñas, L.; Azzarelli, B.; Acuna, H.; Garcia, R.; Gambling, T.M.; Osnaya, N.; Monroy, S.; Tizapantzi, M.D.R.; Carson, J.L.; Villarreal-Calderon, A.; et al. Air Pollution and Brain Damage. Toxicol. Pathol. 2002, 30, 373–389. [Google Scholar] [CrossRef]
- Fonken, L.K.; Xu, X.; Weil, Z.; Chen, G.; Sun, Q.; Rajagopalan, S.; Nelson, R.J. Air pollution impairs cognition, provokes depressive-like behaviors and alters hippocampal cytokine expression and morphology. Mol. Psychiatry 2011, 16, 987–995. [Google Scholar] [CrossRef] [Green Version]
- Russ, T.; Reis, S.; van Tongeren, M. Air pollution and brain health. Curr. Opin. Psychiatry 2019, 32, 97–104. [Google Scholar] [CrossRef] [Green Version]
- Cases, O.; Seif, I.; Grimsby, J.; Gaspar, P.; Chen, K.; Pournin, S.; Müller, U.; Aguet, M.; Babinet, C.; Shih, J.C.; et al. Aggressive Behavior and Altered Amounts of Brain Serotonin and Norepinephrine in Mice Lacking MAOA. Sciences 1995, 268, 1763–1766. [Google Scholar] [CrossRef] [Green Version]
- Murphy, S.R.; Schelegle, E.S.; Miller, L.A.; Hyde, D.M.; Van Winkle, L.S. Ozone Exposure Alters Serotonin and Serotonin Receptor Expression in the Developing Lung. Toxicol. Sci. 2013, 134, 168–179. [Google Scholar] [CrossRef] [Green Version]
- Block, M.L.; Calderón-Garcidueñas, L. Air pollution: Mechanisms of neuroinflammation and CNS disease. Trends Neurosci. 2009, 32, 506–516. [Google Scholar] [CrossRef] [Green Version]
- Parkinson, R.B.; Hopkins, R.O.; Cleavinger, H.B.; Weaver, L.K.; Victoroff, J.; Foley, J.F.; Bigler, E.D. White matter hyperintensities and neuropsychological outcome following carbon monoxide poisoning. Neurology 2002, 58, 1525–1532. [Google Scholar] [CrossRef]
- Herrnstadt, E.; Muehlegger, E. Air Pollution and Criminal Activity: Evidence from Chicago Microdata. 2015. Available online: https://www.nber.org/papers/w21787 (accessed on 15 November 2020).
- Lu, J.G.; Lee, J.J.; Gino, F.; Galinsky, A.D. Polluted Morality: Air Pollution Predicts Criminal Activity and Unethical Behavior. Psychol. Sci. 2018, 29, 340–355. [Google Scholar] [CrossRef] [Green Version]
- Bondy, M.; Roth, S.; Sager, L. Crime Is in the Air: The Contemporaneous Relationship between Air Pollution and Crime. J. Assoc. Environ. Resour. Econ. 2020, 7, 555–585. [Google Scholar] [CrossRef] [Green Version]
- Kim, H. Seasonal Impacts of Particulate Matter Levels on Bike Sharing in Seoul, South Korea. Int. J. Environ. Res. Public Health 2020, 17, 3999. [Google Scholar] [CrossRef] [PubMed]
- Kim, H. Land Use Impacts on Particulate Matter Levels in Seoul, South Korea: Comparing High and Low Seasons. Land 2020, 9, 142. [Google Scholar] [CrossRef]
- Lee, D.W.; Lee, D.S. Analysis of Influential Factors of Violent Crimes and Building a Spatial Cluster in South Korea. Appl. Spat. Anal. Policy 2019, 13, 759–776. [Google Scholar] [CrossRef]
- Butke, P.; Sheridan, S.C. An Analysis of the Relationship between Weather and Aggressive Crime in Cleveland, Ohio. Weather. Clim. Soc. 2010, 2, 127–139. [Google Scholar] [CrossRef]
- Horrocks, J.; Menclova, A.K. The effects of weather on crime. N. Zeal. Econ. Pap. 2011, 45, 231–254. [Google Scholar] [CrossRef]
- Jung, Y.; Chun, Y.; Griffith, D.A. Temperature and assault in an urban environment: An empirical study in the city of Seoul, South Korea. Appl. Geogr. 2020, 124, 102340. [Google Scholar] [CrossRef]
- Gamble, J.L.; Hess, J.J. Temperature and Violent Crime in Dallas, Texas: Relationships and Implications of Climate Change. West. J. Emerg. Med. 2012, 13, 239–246. [Google Scholar] [CrossRef]
- Harries, K. Property Crimes and Violence in United States: An Analysis of the Influence of Population Density. Int. J. Crim. Justice Sci. 2006, 1, 24–34. [Google Scholar] [CrossRef]
- Christens, B.; Speer, P.W. Predicting Violent Crime Using Urban and Suburban Densities. Behav. Soc. Issues 2005, 14, 113–128. [Google Scholar] [CrossRef]
- Reid, L.W.; Weiss, H.E.; Adelman, R.M.; Jaret, C. The immigration–crime relationship: Evidence across US metropolitan areas. Soc. Sci. Res. 2005, 34, 757–780. [Google Scholar] [CrossRef]
- Fox, J.A.; Piquero, A.R. Deadly Demographics: Population Characteristics and Forecasting Homicide Trends. Crime Delinquency 2003, 49, 339–359. [Google Scholar] [CrossRef]
- Kubrin, C.E.; Ishizawa, H.; Macdonald, J.; Sampson, R.J. Why Some Immigrant Neighborhoods Are Safer than Others. Ann. Am. Acad. Political Soc. Sci. 2012, 641, 148–173. [Google Scholar] [CrossRef]
- Edmark, K. Unemployment and Crime: Is There a Connection? Scand. J. Econ. 2005, 107, 353–373. [Google Scholar] [CrossRef]
- Fajnzylber, P.; Lederman, D.; Loayza, N. What causes violent crime? Eur. Econ. Rev. 2002, 46, 1323–1357. [Google Scholar] [CrossRef] [Green Version]
- Lee, S.-C. Characteristics of Crime Locations Using Spatial Econometrics Model. Korean Police Stud. Rev. 2018, 17, 119–144. [Google Scholar] [CrossRef]
- Hausman, J.A. Specification Tests in Econometrics. Econometrica 1978, 46, 1251. [Google Scholar] [CrossRef] [Green Version]
- You, W.; Lv, Z. Spillover effects of economic globalization on CO2 emissions: A spatial panel approach. Energy Econ. 2018, 73, 248–257. [Google Scholar] [CrossRef]
- Moran, P.A.P. The Interpretation of Statistical Maps. J. R. Stat. Soc. Ser. B Methodol. 1948, 10, 243–251. [Google Scholar] [CrossRef]
- Elhorst, J.P. Applied Spatial Econometrics: Raising the Bar. Spat. Econ. Anal. 2010, 5, 9–28. [Google Scholar] [CrossRef]
- Liu, H.; Song, Y. Financial development and carbon emissions in China since the recent world financial crisis: Evidence from a spatial-temporal analysis and a spatial Durbin model. Sci. Total Environ. 2020, 715, 136771. [Google Scholar] [CrossRef]
- Wang, Z.; Sun, Y.; Yuan, Z.; Wang, B. Does energy efficiency have a spatial spill-over effect in China? Evidence from provincial-level data. J. Clean. Prod. 2019, 241, 118258. [Google Scholar] [CrossRef]
- LeSage, J.P.; Pace, R.K. Spatial Econometric Models. In Handbook of Applied Spatial Analysis: Software Tools, Methods and Applications; Fischer, M.M., Getis, A., Eds.; Springer: Berlin/Heidelberg, Germany, 2010; pp. 355–376. [Google Scholar]
- Guliyev, H. Determining the spatial effects of COVID-19 using the spatial panel data model. Spat. Stat. 2020, 38, 100443. [Google Scholar] [CrossRef] [PubMed]
- Elhorst, J.P. Spatial Econometrics: From Cross-Sectional Data to Spatial Panels; Springer: Berlin/Heidelberg, Germany, 2014. [Google Scholar]
- Feng, Y.; Wang, X.; Du, W.; Liu, J. Effects of Air Pollution Control on Urban Development Quality in Chinese Cities Based on Spatial Durbin Model. Int. J. Environ. Res. Public Health 2018, 15, 2822. [Google Scholar] [CrossRef] [PubMed] [Green Version]
- Feng, Y.; Wang, X. Effects of urban sprawl on haze pollution in China based on dynamic spatial Durbin model during 2003–2016. J. Clean. Prod. 2020, 242, 118368. [Google Scholar] [CrossRef]
- Zhang, Q.; Yang, J.; Sun, Z.; Wu, F. Analyzing the impact factors of energy-related CO 2 emissions in China: What can spatial panel regressions tell us? J. Clean. Prod. 2017, 161, 1085–1093. [Google Scholar] [CrossRef]
- Na, K.; Moon, K.-C.; Kim, Y.P. Source contribution to aromatic VOC concentration and ozone formation potential in the atmosphere of Seoul. Atmos. Environ. 2005, 39, 5517–5524. [Google Scholar] [CrossRef]
- Sicard, P.; Paoletti, E.; Agathokleous, E.; Araminienė, V.; Proietti, C.; Coulibaly, F.; De Marco, A. Ozone weekend effect in cities: Deep insights for urban air pollution control. Environ. Res. 2020, 191, 110193. [Google Scholar] [CrossRef]
- Chung, J.; Kim, S.-N.; Kim, H. The Impact of PM10 Levels on Pedestrian Volume: Findings from Streets in Seoul, South Korea. Int. J. Environ. Res. Public Health 2019, 16, 4833. [Google Scholar] [CrossRef] [Green Version]
- Choi, Y.; Yoon, H.; Kim, D. Where do people spend their leisure time on dusty days? Application of spatiotemporal behavioral responses to particulate matter pollution. Ann. Reg. Sci. 2019, 63, 317–339. [Google Scholar] [CrossRef]
- Tiihonen, J.; Halonen, P.; Tiihonen, L.; Kautiainen, H.; Storvik, M.; Callaway, J. The Association of Ambient Temperature and Violent Crime. Sci. Rep. 2017, 7, 1–7. [Google Scholar] [CrossRef] [Green Version]
- Field, S. The effect of temperature on crime. Br. J. Criminol. 1992, 32, 340–351. [Google Scholar] [CrossRef]
- Dussich, J.P.J. Overview of Elderly Victimization; Office of Justice Programs: Washington, DC, USA, 1979.
- Köber, G.; Oberwittler, D.; Wickes, R. Old age and fear of crime: Cross-national evidence for a decreased impact of neighbourhood disadvantage in older age. Ageing Soc. 2020, 1–30. [Google Scholar] [CrossRef]
- Hanslmaier, M.; Peter, A.; Kaiser, B. Vulnerability and fear of crime among elderly citizens: What roles do neighborhood and health play? Neth. J. Hous. Environ. Res. 2018, 33, 575–590. [Google Scholar] [CrossRef]
- Ousey, G.C.; Kubrin, C.E. Exploring the Connection between Immigration and Violent Crime Rates in U.S. Cities, 1980–2000. Soc. Probl. 2009, 56, 447–473. [Google Scholar] [CrossRef]
- Martinez, R.; Stowell, J.I.; Lee, M.T. Immigration and Crime in an Era of Transformation: A Longitudinal Analysis of Homicides in San Diego Neighborhoods, 1980–2000. Criminology 2010, 48, 797–829. [Google Scholar] [CrossRef]
- Choe, J. Income inequality and crime in the United States. Econ. Lett. 2008, 101, 31–33. [Google Scholar] [CrossRef]
- Kovandzic, T.V.; Vieraitis, L.M.; Yeisley, M.R. The structural covariates of urban homicide: Reassessing the impact of income inequality and poverty in the post-Reagan era. Criminology 1998, 36, 569–600. [Google Scholar] [CrossRef]
- Costantini, M.; Meco, I.; Paradiso, A. Do inequality, unemployment and deterrence affect crime over the long run? Reg. Stud. 2017, 52, 558–571. [Google Scholar] [CrossRef] [Green Version]
Figure 1.
Reported numbers of the five types of violent crime (assault, burglary, rape and sexual assault, robbery, and homicide) in South Korea from 2001 to 2018 (Data source: National Police Agency of South Korea).
Figure 1.
Reported numbers of the five types of violent crime (assault, burglary, rape and sexual assault, robbery, and homicide) in South Korea from 2001 to 2018 (Data source: National Police Agency of South Korea).

Figure 2.
Correlations between log-transformed assault rate and concentrations of (a) ozone, (b) fine dust, and (c) nitrogen dioxide (Data sources: National Police Agency of South Korea and AirKorea).
Figure 2.
Correlations between log-transformed assault rate and concentrations of (a) ozone, (b) fine dust, and (c) nitrogen dioxide (Data sources: National Police Agency of South Korea and AirKorea).


Table 1.
Summary statistics.
| Variable (Unit) | Observations | Mean | Standard Deviation | Minimum | Maximum |
|---|---|---|---|---|---|
| Dependent | |||||
| Assault rate (logged) (cases per 100,000 persons) | 3672 | 6.21 | 0.46 | 4.15 | 8.05 |
| Concentration of air pollution | |||||
| Ozone (ppm) | 3672 | 0.024 | 0.005 | 0.012 | 0.059 |
| Fine dust (µg/m3) | 3672 | 51.61 | 8.73 | 30.12 | 90.95 |
| Nitrogen dioxide (ppm) | 3672 | 0.023 | 0.007 | 0.008 | 0.043 |
| Climate characteristics | |||||
| Average temperature (°C) | 3672 | 12.57 | 1.33 | 8.14 | 16.34 |
| Minimum temperature (°C) | 3672 | −14.31 | 4.25 | −29.14 | −2.57 |
| Maximum temperature (°C) | 3672 | 35.41 | 1.32 | 31.50 | 40.26 |
| Precipitation (100 mm) | 3672 | 13.07 | 3.38 | 1.02 | 31.90 |
| Wind speed (m/s) | 3672 | 1.85 | 0.52 | 0.89 | 4.27 |
| Population characteristics | |||||
| Population density (logged) (persons/km2) | 3672 | 6.35 | 2.16 | 2.97 | 10.27 |
| Child population ratio (%) | 3672 | 7.36 | 2.15 | 2.78 | 17.14 |
| Elderly population ratio (%) | 3672 | 15.54 | 7.57 | 2.53 | 38.64 |
| Foreign population ratio (%) | 3672 | 1.55 | 1.49 | 0.06 | 10.60 |
| Socioeconomic characteristics | |||||
| Property tax (logged) (10 million Korean Won) | 3672 | 6.71 | 1.69 | 2.01 | 11.14 |
| Unemployment rate (%) | 3672 | 3.13 | 0.90 | 1.30 | 5.70 |
| Density of commercial facilities (locations per 1000 persons) | 3672 | 12.03 | 16.44 | 6.63 | 158.74 |
Note: Bold texts are used to differentiate variable types from the actual variables.
Table 2.
Moran’s I calculations of violent crime rates for each year.
| Year | Moran’s I | p-Value |
|---|---|---|
| 2001 | 0.292 *** | <0.001 |
| 2002 | 0.325 *** | <0.001 |
| 2003 | 0.285 *** | <0.001 |
| 2004 | 0.278 *** | <0.001 |
| 2005 | 0.273 *** | <0.001 |
| 2006 | 0.232 *** | <0.001 |
| 2007 | 0.283 *** | <0.001 |
| 2008 | 0.262 *** | <0.001 |
| 2009 | 0.306 *** | <0.001 |
| 2010 | 0.253 *** | <0.001 |
| 2011 | 0.284 *** | <0.001 |
| 2012 | 0.263 *** | <0.001 |
| 2013 | 0.252 *** | <0.001 |
| 2014 | 0.243 *** | <0.001 |
| 2015 | 0.199 *** | <0.001 |
| 2016 | 0.186 *** | <0.001 |
| 2017 | 0.188 *** | <0.001 |
| 2018 | 0.168 *** | <0.001 |
*** p < 0.01.
Table 3.
Results of LR and Wald tests.
| Air Pollutant | LR Test | Wald Test | ||
|---|---|---|---|---|
| Chi-Square | p | Chi-Square | p | |
| Ozone | 78.49 | <0.001 | 81.41 | <0.001 |
| Fine dust | 46.75 | <0.001 | 53.79 | <0.001 |
| Nitrogen dioxide | 32.12 | <0.001 | 36.67 | <0.001 |
Table 4.
Estimation results for ozone.
| Variables | Coefficient | p |
|---|---|---|
| Concentration of Ozone | 7.706 ** | 0.013 |
| Minimum temperature | 0.026 *** | 0.000 |
| Maximum temperature | 0.006 | 0.490 |
| Precipitation | 0.010 ** | 0.004 |
| Wind speed | 0.155 *** | 0.000 |
| Elderly population ratio | −0.006 *** | 0.001 |
| Foreign population ratio | 0.005 | 0.249 |
| Property tax (logged) | 0.051 *** | 0.000 |
| Unemployment rate | 0.100 *** | 0.000 |
| Density of commercial facilities | 0.013 *** | 0.000 |
| * (Concentration of Ozone) | 7.038 | 0.110 |
| * (Minimum temperature) | −0.037 *** | 0.000 |
| * (Maximum temperature) | 0.009 | 0.200 |
| * (Precipitation) | −0.009 ** | 0.046 |
| * (Wind speed) | −0.004 | 0.911 |
| * (Elderly population ratio) | −0.009 ** | 0.007 |
| * (Foreign population ratio) | −0.006 | 0.498 |
| * (Property tax (logged)) | −0.026 | 0.125 |
| * (Unemployment rate) | −0.051 ** | 0.016 |
| * (Density of commercial facilities) | −0.001 | 0.463 |
| Spatial rho | 0.247 *** | 0.000 |
| R2 | 0.389 |
** p < 0.05, *** p < 0.01.
Table 5.
Direct, indirect, and total effects (ozone).
| Variables | Direct Effect | Indirect Effect | Total Effects |
|---|---|---|---|
| Concentration of ozone | 8.104 ** | 11.590 ** | 19.700 *** |
| Minimum temperature | 0.024 *** | −0.039 *** | −0.015 *** |
| Maximum temperature | 0.007 | 0.013 | 0.020 * |
| Precipitation | 0.010 ** | −0.008 * | 0.002 |
| Wind speed | 0.158 *** | 0.042 | 0.200 *** |
| Elderly population ratio | −0.007 *** | −0.013 *** | −0.020 *** |
| Foreign population ratio | 0.005 | −0.006 | −0.001 |
| Property tax (logged) | 0.050 *** | −0.016 | 0.034 |
| Unemployment rate | 0.098 *** | −0.034 | 0.064 *** |
| Density of commercial facilities | 0.013 *** | 0.003 * | 0.015 *** |
* p < 0.1, ** p < 0.05, *** p < 0.01.
Table 6.
Estimation results for fine dust.
| Variables | Coefficient | p |
|---|---|---|
| Concentration of fine dust | −0.003 * | 0.076 |
| Minimum temperature | 0.028 *** | 0.000 |
| Maximum temperature | 0.002 | 0.769 |
| Precipitation | 0.010 *** | 0.007 |
| Wind speed | 0.159 *** | 0.000 |
| Elderly population ratio | −0.006 *** | 0.001 |
| Foreign population ratio | 0.005 | 0.243 |
| Property tax (logged) | 0.049 *** | 0.000 |
| Unemployment rate | 0.090 *** | 0.000 |
| Density of commercial facilities | 0.013 *** | 0.000 |
| * (Concentration of fine dust) | 0.006 *** | 0.008 |
| * (Minimum temperature) | −0.033 *** | 0.000 |
| * (Maximum temperature) | 0.01 | 0.147 |
| * (Precipitation) | −0.007 * | 0.099 |
| * (Wind speed) | 0.006 | 0.854 |
| * (Elderly population ratio) | −0.009 *** | 0.005 |
| * (Foreign population ratio) | −0.013 | 0.180 |
| * (Property tax (logged)) | −0.039 ** | 0.019 |
| * (Unemployment rate) | −0.069 *** | 0.001 |
| * (Density of commercial facilities) | −0.001 | 0.517 |
| Spatial rho | 0.247 *** | 0.000 |
| R2 | 0.403 |
* p < 0.1, ** p < 0.05, *** p < 0.01.
Table 7.
Direct, indirect, and total effects (fine dust).
| Variables | Direct Effect | Indirect Effect | Total Effect |
|---|---|---|---|
| Concentration of fine dust | −0.003 * | 0.007 *** | 0.004 * |
| Minimum temperature | 0.027 *** | −0.033 *** | −0.006 |
| Maximum temperature | 0.003 | 0.013 * | 0.017 |
| Precipitation | 0.009 *** | −0.006 | 0.003 |
| Wind speed | 0.162 *** | 0.056 * | 0.219 *** |
| Elderly population ratio | −0.007 *** | −0.014 *** | −0.020 *** |
| Foreign population ratio | 0.005 | −0.014 | −0.009 |
| Property tax (logged) | 0.047 *** | −0.033 | 0.014 |
| Unemployment rate | 0.088 *** | −0.060 *** | 0.028 |
| Density of commercial facilities | 0.013 *** | 0.003 * | 0.015 *** |
* p < 0.1, *** p < 0.01.
Table 8.
Estimation results for nitrogen dioxide.
| Variables | Coefficient | p |
|---|---|---|
| Concentration of nitrogen dioxide | −3.904 | 0.149 |
| Minimum temperature | 0.028 *** | 0.000 |
| Maximum temperature | 0.006 | 0.502 |
| Precipitation | 0.006 * | 0.085 |
| Wind speed | 0.157 *** | 0.000 |
| Elderly population ratio | −0.005 *** | 0.003 |
| Foreign population ratio | 0.003 | 0.528 |
| Property tax (logged) | 0.055 *** | 0.000 |
| Density of commercial facilities | 0.013 *** | 0.000 |
| * (Concentration of nitrogen dioxide) | 7.441 ** | 0.026 |
| * (Minimum temperature) | −0.034 *** | 0.000 |
| * (Maximum temperature) | 0.008 | 0.272 |
| * (Precipitation) | −0.004 | 0.339 |
| * (Wind speed) | 0.022 | 0.524 |
| * (Elderly population ratio) | −0.011 *** | 0.002 |
| * (Foreign population ratio) | −0.015 | 0.132 |
| * (Property tax (logged)) | −0.039 ** | 0.024 |
| * (Density of commercial facilities) | −0.002 | 0.301 |
| Spatial rho | 0.247 *** | 0.001 |
| R2 | 0.404 |
* p < 0.1, ** p < 0.05, *** p < 0.01.
Table 9.
Direct, indirect, and total effects (nitrogen dioxide).
| Variables | Direct Effect | Indirect Effect | Total Effect |
|---|---|---|---|
| Concentration of nitrogen dioxide | −3.652 | 8.266 ** | 4.614 * |
| Minimum temperature | 0.027 *** | −0.034 *** | −0.008 ** |
| Maximum temperature | 0.007 | 0.012 * | 0.018 * |
| Precipitation | 0.006 * | −0.003 | 0.003 |
| Wind speed | 0.161 *** | 0.075 ** | 0.236 *** |
| Elderly population ratio | −0.006 *** | −0.015 *** | −0.021 *** |
| Foreign population ratio | 0.002 | −0.018 | −0.016 |
| Property tax (logged) | 0.053 *** | −0.032 | 0.022 |
| Density of commercial facilities | 0.013 *** | 0.002 | 0.015 *** |
* p < 0.1, ** p < 0.05, *** p < 0.01.
Publisher’s Note: MDPI stays neutral with regard to jurisdictional claims in published maps and institutional affiliations. |
© 2021 by the authors. Licensee MDPI, Basel, Switzerland. This article is an open access article distributed under the terms and conditions of the Creative Commons Attribution (CC BY) license (https://creativecommons.org/licenses/by/4.0/).
Share and Cite
MDPI and ACS Style
Eum, J.; Kim, H. Effects of Air Pollution on Assaults: Findings from South Korea. Sustainability 2021, 13, 11545. https://0-doi-org.brum.beds.ac.uk/10.3390/su132011545
AMA Style
Eum J, Kim H. Effects of Air Pollution on Assaults: Findings from South Korea. Sustainability. 2021; 13(20):11545. https://0-doi-org.brum.beds.ac.uk/10.3390/su132011545
Chicago/Turabian StyleEum, Jeongin, and Hyungkyoo Kim. 2021. "Effects of Air Pollution on Assaults: Findings from South Korea" Sustainability 13, no. 20: 11545. https://0-doi-org.brum.beds.ac.uk/10.3390/su132011545
Note that from the first issue of 2016, this journal uses article numbers instead of page numbers. See further details here.