Article

Analysis of Energy Consumption in Commercial and Residential Buildings in New York City before and during the COVID-19 Pandemic

Department of Chemical Engineering, Manhattan College, Riverdale, NY 10471, USA
*
Author to whom correspondence should be addressed.
Sustainability 2021, 13(21), 11586; https://0-doi-org.brum.beds.ac.uk/10.3390/su132111586
Submission received: 9 September 2021 / Revised: 8 October 2021 / Accepted: 13 October 2021 / Published: 20 October 2021

Abstract

:
This study compares the energy burden of New York City office buildings versus personal residences before and during the stay-at-home period of the COVID-19 pandemic. The scope is comprised of employees that, prior to the stay-at-home order, underwent a daily commute to and from a representative midtown Manhattan office building. Energy consumed by these employees with respect to the office building they work in, their transportation there, and their personal residence was determined using publicly available data. Energy usage and cost per person per day were compared in both remote and in-person work settings. The results of this study demonstrated that remote working conditions consume 39.7% less energy and required less personal expense compared to in-person working conditions. Additionally, the results found that a building occupancy of 65% is where the energy burden shifts from residential to commercial sectors. This study can be a starting point of discussion for businesses regarding staffing of commercial buildings and energy efficiency. Future work on this topic would benefit from having a more robust data set compared to the publicly available data used in this study.

1. Introduction

New York City (NYC) has the largest concentration of office buildings in a downtown area nationally, and consequently the most total office space [1]. While 4.2 million NYC residents are employed in NYC, the city receives an influx of an additional 500,000 commuters using various transportation modes to get to and from work [2]. Of all the NYC boroughs, Manhattan employs the most workers at 2.6 million people, of which 899,000 reside in Manhattan itself [3]. A study of the residence location trends for Manhattan over the years of 2002–2009 found that 1 in 8 Manhattan workers commutes more than 90 min [3]. A typical workday includes commuting by car, subway/path, commuter rail, bus, or other transportation methods (i.e., walking, biking, etc.), with the frequency of mode varying by location.
Office space makes up 27% of commercial buildings’ square footage, and midtown Manhattan is the largest Central Business District in the world, which makes it an ideal candidate for the study of energy burden [4,5].
Energy consumption and efficiency of commercial buildings is well documented and an important point of discussion as society aims to be more energy efficient. There are many sources that evaluate energy consumption and efficiency. For example, close to 40% of commercial buildings in the United States (U.S.) are benchmarked on the Energy Star Portfolio Manager platform [6], which allows for a building’s energy performance to be evaluated and examined for inefficiencies. Additionally, Commercial Building Energy Consumption Surveys (CBECS) and self-reported data sets, compiled through energy disclosure programs in NYC, provide another source of building data.
The COVID-19 pandemic has had a significant impact on the way commercial buildings operate. Businesses and office buildings have had to make numerous adjustments to keep workplaces open and running while adhering to state guidelines [7]. For example, office buildings are required to uphold social distancing by spreading workers out and marking two-meter distance perimeters around workstations; gatherings and meetings should be limited and be kept virtual if it is not necessary to be in-person; and all workers and employees are required to wear masks and face coverings. Before these rules and precautions were implemented, commercial buildings did not allow employees to come into work. At the beginning of March 2020, there were 1.4 million office employees working in Manhattan. That number quickly declined to 41,000 workers in May 2020 during the stay-at-home period because offices only allowed essential workers to continue in-person work to slow the spread of the virus [8]. The quick transition between in-person and remote working is expected to demonstrate a significant shift in energy consumption.
The relative occupancy of commercial offices compared to residential properties is important because both exhibit different energy consumption profiles. Under normal circumstances, employees occupy the office building during working hours, while under stay-at-home orders, employees increase their individual residence’s energy consumption. Large commercial buildings are responsible for 40% of the U.S.’s greenhouse gas emissions, and a significant energy consumer of office buildings is PPLs [9,10]. On the other hand, the primary energy consumer of residential buildings under normal circumstances is HVAC systems [11], and working remotely shifts the PPL burden from the office building to the employee. Furthermore, employees’ working remotely negates the need for transportation to and from the workplace. Thus, the workspace energy profile changes.
It is imperative to understand the effects of energy consumption because of its environmental, economic, and efficiency consequences. The National Bureau of Economic Research reports that 35.2% of workers who were commuting to their office Pre-COVID-19 worked remotely in May 2020 [12]. Outside of essential workers, remote jobs may prove to be more favorable in certain cases, thus demonstrating the value of a study such as this one.
This study analyzes the energy consumption of employees in a representative Midtown Manhattan office building as employees shift from working in the office building to their residences because of the COVID-19 stay-at-home order in NYC. The hypothesis for this study is that the energy consumption in commercial buildings will decrease during the stay-at-home period, while residential energy consumption will increase. Additionally, the economic impact due to increased residential energy demand on these remote employees was examined. The final aim was to determine the significance of the occupancy and operation of offices with respect to energy usage.

2. Materials and Methods

2.1. Terminology

“Pre-COVID-19” refers to the period before the pandemic spread of the illness caused by the novel coronavirus (i.e., SARS-CoV-2) resulting in the stay-at-home orders or lockdown period in NYC in March 2020. “Post-COVID-19” refers to the period during which stay-at-home orders were in effect in NYC. More specifically, when the paper refers to “Post-COVID-19”, it is referring to the period of time employees were working from home. “Remote” working refers to the scenario of employees working from their households and not traveling into the office building. “In-person” working refers to the scenario of an employee traveling from their personal residence to the office building, working there for their work hours, and then traveling back to their personal residences in the evening. “In-Commuters” refers to the employees who do not reside in the five boroughs of NYC and live in Long Island, Inner New Jersey, Outer New Jersey, Mid-Hudson Valley, Lower Hudson Valley, or Southwest Connecticut areas (See Figure 1 and Figure 2).
With respect to abbreviations, “EUI” represents Energy Use Intensity, which is a measurement of a building’s energy consumption as a function of size [13]. Typically, low values of EUI represent good energy performance. The term “PPLs” refers to Plug and Process Loads, which are energy loads that are not related to general lighting, heating, ventilation, cooling, and water heating, and that typically do not provide comfort to the participants [14]. Finally, the term “HVAC” stands for Heating, Ventilation, and Air Conditioning, and it represents the energy required for indoor comfort with respect to heating and cooling [15].

2.2. Data Sources

The primary data sources were the U.S. EIA (U.S. Energy Information Administration), NYC Open Data, and the U.S. Census Bureau [16,17,18]. All sources that were used for data collection were free to use and publicly available.

2.3. Study Scope

The representative office building was modeled by averaging the parameters of office buildings in Midtown Manhattan, as described in the Methodology section. The counties considered to be residences for the employees commuting to this representative building included Bronx, Kings, New York, Richmond, Queens, Suffolk, Nassau, Bergen, Essex, Hudson, Middlesex, Morris, Passaic, Somerset, Union, Hunterdon, Mercer, Monmouth, Ocean, Sussex, Warren, Fairfield, Litchfield, New Haven, Putnam, Rockland, Westchester, Dutchess, Orange, Sullivan, and Ulster. The commuting methods considered for the employees were as follows: Car, Subway/Path, Commuter Rail, Bus, walking, and biking.
Figure 1. Map of counties included in the defined In-Commuting Region [19].
Sustainability 13 11586 g001
Figure 2. Map of the boroughs of New York City [19].
Sustainability 13 11586 g002
Residential buildings were characterized from 2019 U.S. Census data for each borough and divided into single family houses and apartments [20]. Households defined as attached single units, detached single units, and double units were considered single family homes. Apartment buildings were residences with 5 or more units. The average floor area of apartments was taken by selecting “tenants” for the dwelling type. Similarly, the floor area of single-family homes were entries with values filtered as “single family” as the dwelling type.

2.4. Methodology

During the study, there was minimal readily available data for energy consumption Post-COVID-19. Therefore, only energy data from April and May 2020 was used to determine the change in energy usage in both the commercial and residential sectors.
In determining the energy usage for the commercial side of the study, a representative commercial Midtown Manhattan office building was modeled using data from 2018 as well as 2014/2015 data for energy breakdowns. The mean number of floors, floor area, and site EUI of an array of buildings within the Midtown area were calculated to create a model office building to study. To determine if the data from 2018 could be used in conjunction with data from 2014/2015, student t-tests were performed (p = 0.05), which indicated no significant difference between the two data sets (data not shown). Only buildings that met the requirements listed below were considered applicable for determining the parameters for the office building in this study (n = 169).
  • Midtown Manhattan zip code [21].
  • Primary building function as office building.
  • Only one building per entered record.
  • Had usable and complete energy data.
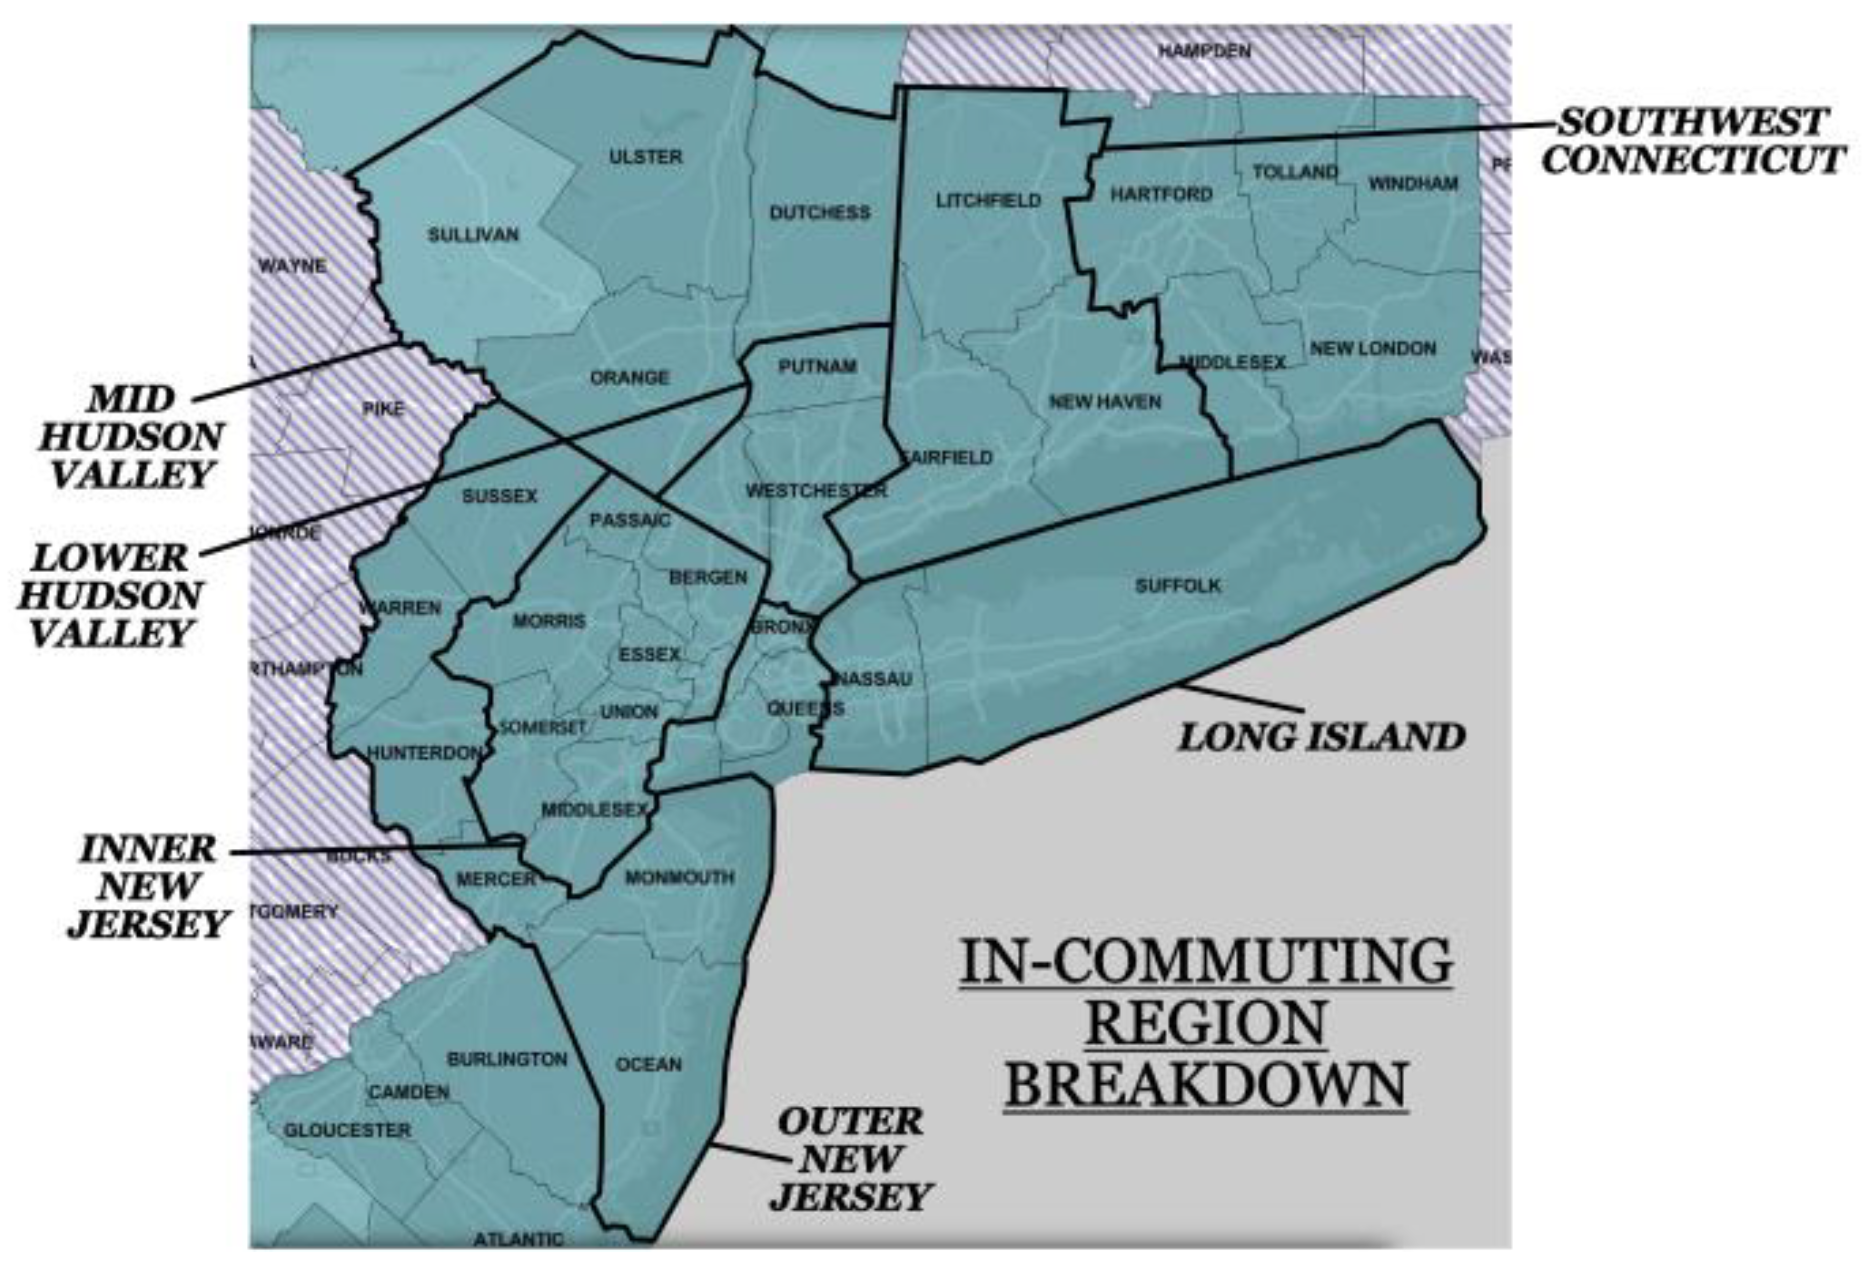
Table 1 indicates the metrics of the representative office building where commuters will be traveling to and serves as the basis for this study.
A typical midtown Manhattan office building has people traveling to the building through multiple modes of transport and from several regions surrounding and including the midtown area. Commercial buildings used for office space are classified as Business Groups by NYC regulators, and therefore, the number of workers occupying the workspace is assumed to be regulated and constant [23]. The areas listed below were chosen for determining residential and transportation energy usage and cost.
  • Manhattan
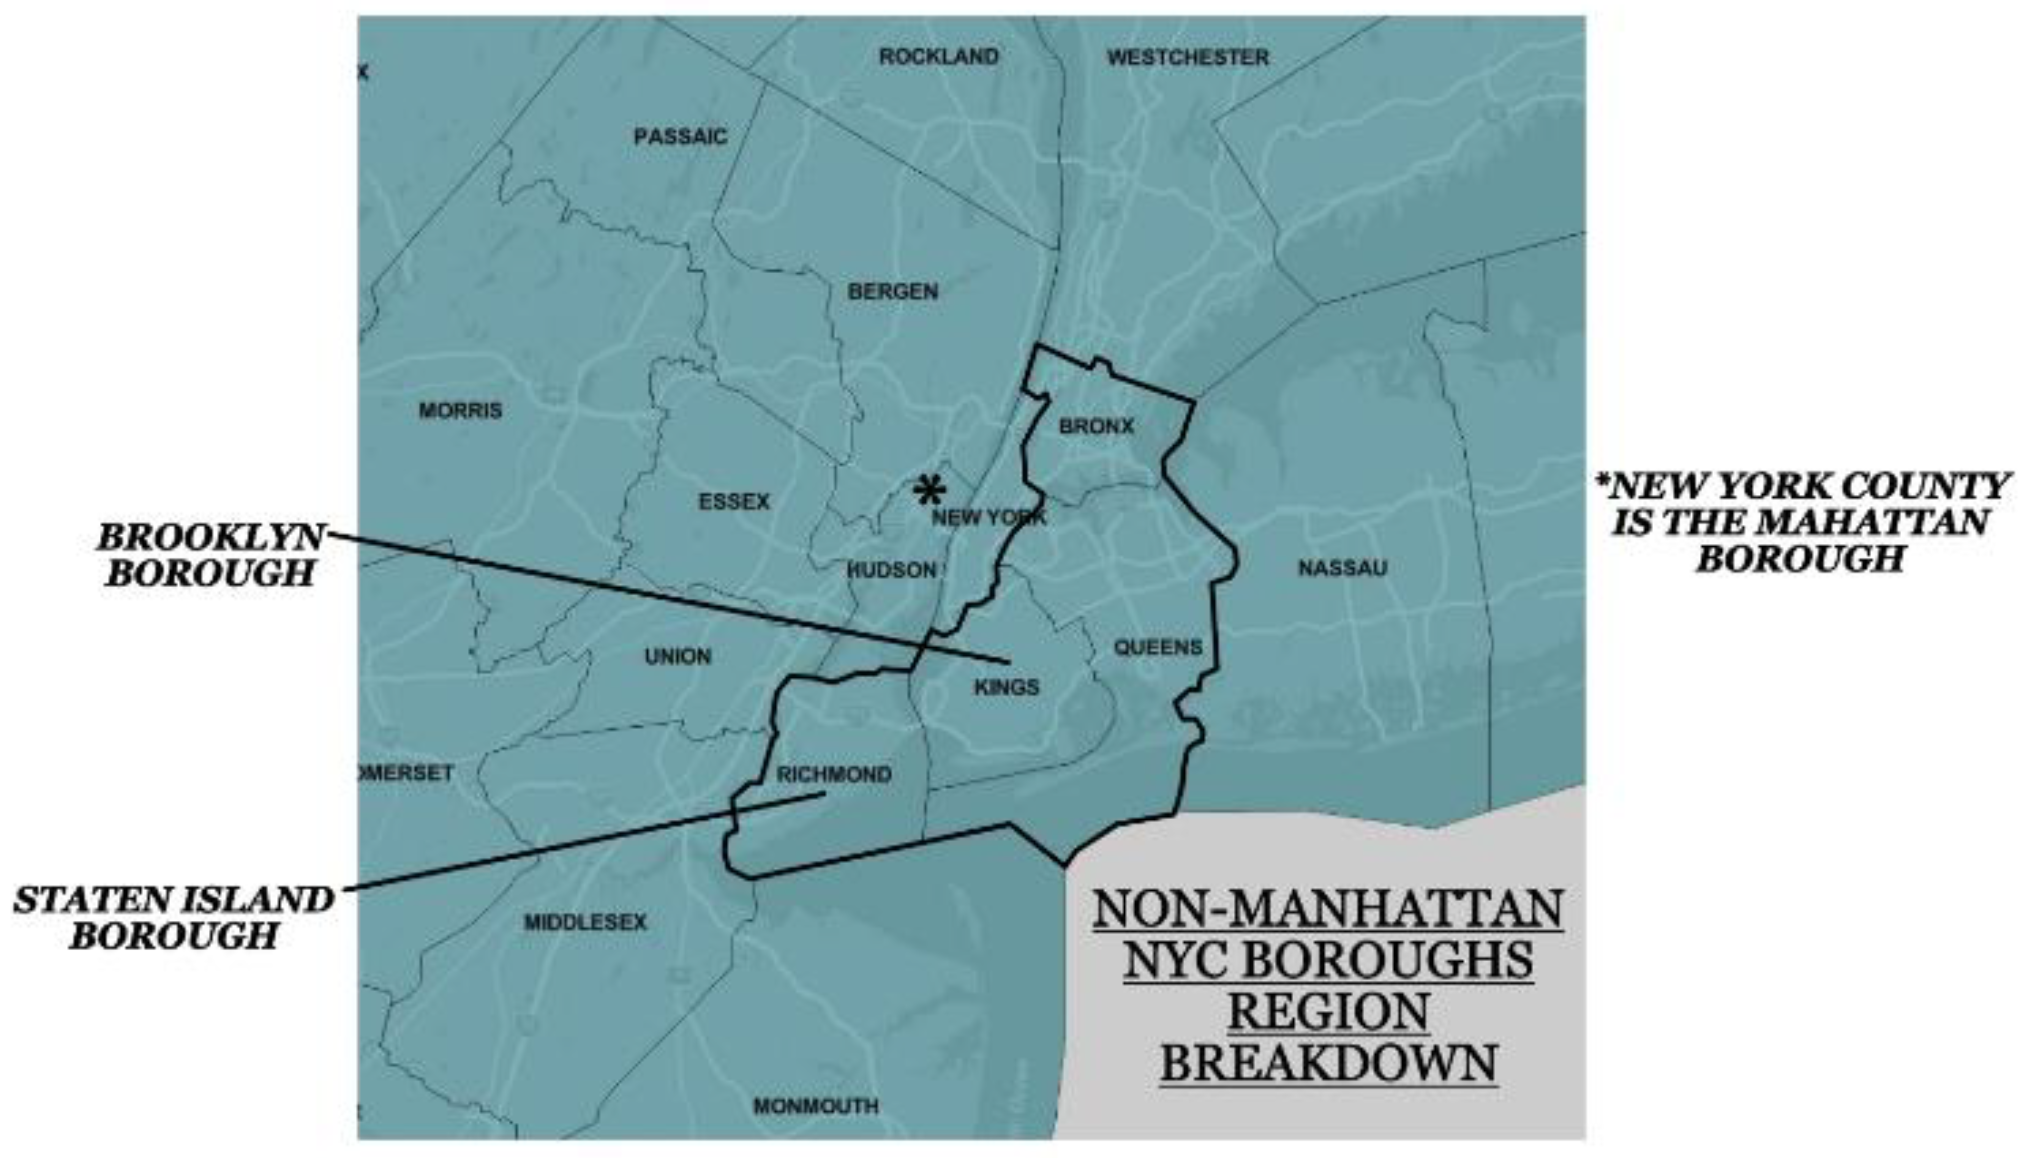
  • Non-Manhattan New York City boroughs (Bronx, Brooklyn, Staten Island, and Queens)
  • In-commuters
Energy usage data and cost data were used to determine average residential and transportation energy consumption and cost from the three regions above. The residential averages considered different living styles (such as apartments and stand-alone houses) as well as the different energy costs for each region. For transportation, commuter frequencies were used to determine the mode of transport to the average midtown Manhattan office building, and Google maps was used to determine the most likely route for each mode and location as well as tolls and fares that an employee would pay while traveling to the office building [24]. Data from these regions were converged using a weighted sum based on the frequency of each region’s commute to create the representative in-commuter’s residence.
The breakdown of residential location for In-commuters is shown in Table 2. The region with the highest numbers of In-commuters is Inner NJ, which comprises 46% of all In-commuters; the region with the lowest number is Mid-Hudson Valley, which only comprises 3% of all In-commuters. This accounts for the average distance from the region to the representative office building and the approximate energy usage per km for the region. Using the relative frequencies of each location, a weighted average for a daily commute was determined and used to represent the population of In-commuters. The same method was used to calculate energy consumption of the daily commute of Manhattan and Non-Manhattan NYC commuters.
The approximate energy usage per km was calculated for In-commuter regions in Table 3. The Transportation Energy Data Book was used to identify the relative usage of transportation modes: car, subway/path, commuter rail, bus, and other non-energy consuming transportation methods [25]. These percentages were used in conjunction with the energy consumption of each mode per km to calculate a weighted average that represents the cost of an In-commuter’s passenger km. The same method was used to calculate the average passenger km energy expenditure for Manhattan and Non-Manhattan NYC commuters.
Residential data to determine energy consumption of households within NYC was taken from publicly available data [29,30]. Entries were filtered to include only those with reported values for the approximate floor area of each household. Therefore, the average floor area for a household in each borough was limited by the number of entries that had reported values. The average floor area was determined separately between single family homes and apartments. A weighted average was taken of both dwelling types per borough to determine an average household floor area value for each NYC borough. In addition to the energy consumed by households, commercial buildings, and transportation, the change in cost of each category was observed between a remote working scenario and a regular commuting-to-work scenario.

2.5. Energy Usage Breakdown

Table 4 indicates the energy sources and the corresponding usage for the representative office building both Pre and Post COVID-19. Pre-COVID-19, the energy consumption breakdown demonstrated the following statistics: electricity at 60%, natural gas at 30%, and other energy sources (solar, wind, geothermal, hydroelectric, etc.) at 10% [11]. Even though the energy consumption ratio increased for electricity and natural gas, the total amount of energy for each of these categories decreased as employees moved to their residences for work.
The percent change in commercial energy consumption for the electricity and natural gas categories was calculated by comparing the energy usage in the months of April and May over the years 2015 to 2019. The percent change in electricity usage was calculated by averaging the retail sales of electricity (units of million kWh) in the months of April and May from 2015 to 2019 [31]; this is the Pre-COVID-19 value of the retail sales of electricity. The mean of the retail sales of electricity for April and May in 2020 was calculated; this is the Post-COVID-19 value of the retail sales of electricity.
The percent change in natural gas consumption was calculated by averaging the natural gas deliveries (units of million cubic feet) to commercial buildings for April and May from 2015 to 2019 (Pre-COVID-19 value), averaging the natural gas deliveries to commercial buildings for April and May in 2020 (Post-COVID-19 value) [32]. Because other energy sources include a variety of methods of energy production, it is difficult to determine the percent change because specific data could not be found at the time of the study. Instead, the percent change for the “other” energy was determined by averaging the percent change in electricity and natural gas.
Table 5 demonstrates the energy-type breakdown for residences Pre-COVID-19 (2015–2019) and Post-COVID-19 (April and May 2020) [31,32]. Table 5 indicates an increase in energy consumption for electricity, natural gas, and other energy sources from Pre-COVID-19 to Post-COVID-19 for Manhattan, Non-Manhattan NYC Boroughs, and In-Commuters. As people started to work remotely, there was an increase in energy consumption in residences and a decrease in commercial building energy consumption.
In NY, NJ and CT, the increase in electricity consumption for each household is below 10%. With respect to natural gas, NY showed an increase of 13.34%, NJ showed an increase of 29.99%, and CT showed an increase of 14.59%.

3. Results

The energy consumption of the representative office building and residences during a single day was compared for the Pre-COVID-19 versus the Post-COVID-19 conditions for the 1927 workers in Figure 3.
Pre-COVID-19, 1927 employees commuted into the representative Midtown Manhattan office building from Manhattan, Non-Manhattan NYC boroughs, and In-commuting regions. When commuting to the building, the energy required for travel to and from all regions consumes 210 GJ/Day. In-commuters are the largest contributors to this value at 130 GJ/Day, followed by Non-Manhattan Borough Commuters at 73 GJ/Day, and lastly, Manhattan residents expended 7 GJ/Day. Despite In-commuters constituting the smallest demographic (26%), they contribute the greatest transportation energy consumption because of the relative distance from the representative building. The Pre-COVID-19 case modeled all employees working in the representative building, whilst the Post-COVID-19 case modeled the transportation energy to equal zero because the employees were no longer commuting into the office building.
Figure 3 shows that the Site EUI of the commercial building decreased from 78 GJ/Day Pre-COVID-19 to 69 GJ/Day Post-COVID-19 (6.86% decrease). Because of the shift in workplace, residential buildings acquired the energy burden and observed an increase in energy consumption from 196 GJ/Day to 223 GJ/Day Post-COVID-19 (13.8% increase). The residential energy consumption was calculated using a weighted sum of the workers’ respective home regions. The combined office, residential, and transportation total Pre-COVID-19 was 484 GJ/Day compared to the Post-COVID-19 total of 292 GJ/Day (39.7% decrease).
Because of the significant energy consumption due to transportation, we next aimed to compare the increased cost of energy an employee would bear from working remotely at home to the cost they would have to pay for transportation to travel to their office building. Figure 4 shows these two factors for the population in this study.
The cost of transportation was considered through an employee’s point of view because they are the ones that directly pay fares for public transportation, or tolls (prices accurate as of December 2020) and gas if commuting with a personal vehicle. Gas prices were averaged by state over a three-year period (2018–2020) and proved not to make a significant difference among non-NY commuters under the assumption that the average vehicle in the U.S. has a gas mileage of 24.9 miles per gallon [33,34,35]. Pre-COVID-19, Manhattan residents traveling to a Midtown building for work would have an average cost of 3.20 USD/Person-Day. Non-Manhattan NYC commuters would have an average cost of 8.73 USD/Person-Day, while In-commuters would pay 17.40 USD/Person-Day to travel to the representative building. Post-COVID-19, the cost of transportation was assumed to be 0 USD/Person-Day because commuters are not paying for fares, tolls, or fuel to travel to work. Personal trips for nonwork commutes were not considered when determining Post-COVID-19 transportation costs to the employee. The household energy cost for employees increased due to the increase in energy consumption (as presented in Figure 3). An average cost for natural gas and electricity for NY, NJ, and CT were determined over the period of 2015–June 2020 (the time at which this study was being conducted). An average of the natural gas and electricity cost for each state was calculated to be used in determining the cost of the “other” energy sources portion of energy consumption. These averages were applied to each county to determine the increase in cost from the increase in energy consumption. Figure 4 shows that transportation savings are far greater compared to increased household energy consumption costs.
Social distancing requirements enforced as the pandemic progressed would inherently result in a lower occupancy inside of an office building. Thus, we aimed to examine the effect of building occupancy on the energy burdens between employees and the office building. Figure 5 shows energy consumption by the employees and the office building as a function of occupancy.
The energy consumption of the representative office building at 100% occupancy is taken as the site EUI calculated using the 2018 NYC Open Data (i.e., Pre-COVID-19 conditions) [18]. Energy consumption due to transportation is categorized with the energy consumption of the representative commercial office building because this consumption only occurs when the employees are traveling into the office. The residential energy consumption used the frequencies for each area presented in the tables above to determine which workers were operating on Pre-COVID-19 vs. Post-COVID-19 energy consumption levels. The occupancy of residences worked inversely to the occupancy of the office building; i.e., at an office occupancy of 100%, residential occupancy is at 0%.
Figure 5 shows that at an office occupancy of approximately 65%, the energy burden shifts to the office building from residential buildings. At that occupancy, the energy consumption of the summation of commercial and transport energy consumption becomes greater than that of residential energy consumption.

4. Discussion

Total energy consumption associated with commuting and working in the representative NYC office building versus staying at home in an employee’s residence was compared to determine which conditions (Pre-COVID-19 or Post-COVID-19) are more energetically favorable. The results show that 39.7% less energy is consumed when all employees in our model are working remotely. Additionally, the analysis unveiled the large energy burden of daily transportation to the workplace.
There have been similar studies presented in recent months that have examined the effects of the pandemic on energy consumption. Karti and Adubyan compare the reduction of electricity demand in several cities in the U.S., New York City being one of them [36]. The authors report a 17% reduction in electricity usage in New York City when comparing both pre- and post-COVID-demands. Other examples include a study by Mehlig et al., which reports a 15.6% reduction of electricity in the UK [37], and one by Xu et al., which reports a reduction of approximately 6.5% in the city of Tokyo, Japan, and approximately 8% in Kansai [38]. The discrepancy from our findings may stem from the scope of our models (i.e., geographical area, population used, and timeframe examined), as well as how the transportation component was not separated into petroleum-based and electricity-based modes. Another study examining a smaller-scale system was performed by Chihib et al. and examined the change in energy consumption amongst the buildings at the University of Almeria [39]. The university was able to reduce electricity consumption as a whole after the campus was closed, but the authors of that study identify areas with minimal reduction (i.e., areas required for research) and areas with a large reduction (i.e., buildings typically populated such as the library). Taken together, the present study shares the conclusion of an energy reduction Post-COVID-19.
There has also been recent work examining the costs associated with the shift of energy use from commercial to residential buildings. Kawka and Cetin examined a data set from 225 housing units primarily located in the state of Texas, where energy use data was directly captured using a home energy monitoring system [40]. Their analysis revealed that the largest percent increase in non-HVAC loads were apparent between the hours of 10am and 4pm, reflecting the increased demand due to workers staying in their personal residence. Furthermore, the group also discovered that households earning 50,000 USD or less and those earning 150,000 to 299,999 USD exhibited the largest energy demands (66.9% and 50.5% increase respectively). Another study by Abdeen and colleagues report a 9.71% increase in residential utility bills for a set of 498 homes in the province of Ontario, Canada [41]. Energy data was also directly measured in these homes. Although our work also revealed an increase in personal expense because of the new energy demand in residences, it is difficult to compare data because of different energy costs between regions, as well as a different methodology of acquiring the data (direct measurement versus publicly available data).
Our work also had the aim of comparing the increased economic burden due to higher utility bills with the savings workers would gain because travel to the midtown building would no longer be necessary as a result of the stay-at-home orders. Although several recent studies examined the effect of the pandemic on urban commutes, most have focused on the macroscopic level rather than single-users [42,43]. However, one study reports an increase in fares after lockdown due to poor transportation infrastructure, thus increasing the cost of living for those relying on these methods [44]. From our perspective, if transportation (e.g., automobile, buses, trains and ferries) were to be taken out of consideration for energy consumption, our results show that significant energy savings may be gained. Therefore, it would be energetically favorable if all employees are within walking or biking distance of the building. Proposals of having integrated neighborhoods have been suggested in the past [45,46]. While holding the entire employee population proximal to the office could be impractical realistically, it may be beneficial for employers to offer remote or in-person flexibility based on their geographic proximity where possible.
Our final aim was to examine the appropriate occupancy level of a commercial office building where both workers and employers share the energy burden. The results presented in Figure 5 demonstrate that there is a point where the energy burden shifts from one group to the other. The value that we report of 64.9% has implications not only with respect to energy, but with social distancing and work-life balance issues as well. To address the former, a partially occupied building would encourage workers to space farther apart, thus lowering the probability of disease spread from direct contact and decreased HVAC/filtration load. To address the latter, a scenario where a subset of employees reports to the office whilst another works from home may be employed. Offices may potentially implement rotational schedules where these groups would switch to preserve the in-person occupancy level and yet offer the opportunity for some employees to work from home during a prescribed period of time. Despite this suggestion, urban sustainability must be viewed not only from an energy savings perspective, but also from an economic and social viewpoint as well [47]. Though our work focuses primarily on energy, other recent work describes the intermingling of these sustainability goals [48,49,50].
While not all jobs can be performed remotely, offices where some or most work can be done remotely could introduce a hybrid model of in-person and remote working modes to decrease the office and transportation energy consumption. Additionally, employees would save time that would be spent sitting in traffic, money spent on fares or tolls, and carbon emissions from both personal vehicles and public transport. The cost for an employee commuting to and from the office building coupled with the ability for several companies and sectors to work remotely poses the question: Would it be more beneficial for companies to move from leasing large office spaces to renting on a need basis through fully serviced rental offices? This would allow employees to save on daily transportation costs by only traveling into an office when necessary while the business is able to save on the cost of leasing from a large office building. This is an option that should be seriously considered with the capabilities of high-speed internet and improvements in remote working options. Furthermore, having companies running using a hybrid system would reduce traffic, relieve some pressure on the public transport system and reduce energy consumption through transportation. Future studies can be conducted into the feasibility of such a work environment and to determine if such a model is possible for businesses with thousands of employees.
If society is more efficient by working at home rather than in the office, this would help in advancing the way commercial offices operate. This research is beneficial for businesses and employees because it demonstrates the possibility of identifying working conditions to decrease the energy demand and costs associated with running a business, as well as reducing the amount of energy and personal expense due to transportation for employees.

5. Conclusions

The COVID-19 pandemic has impacted many communities worldwide, affecting individuals, families, communities, corporations, and governments. This study has attempted to gain some valuable information from this situation. Given the scale of NYC, this study can be valuable to businesses in other large cities that have a broad commuter population and individuals navigating a changing work environment.
The main takeaways from this study include (1) the monumental impact a workplace commute has on both energy consumption and employee expense and (2) the building occupancy level of where energy burden shifts between the residential and commercial. This study proposes that a shift to remote working conditions or hybrid operations could be beneficial to businesses and employees alike.
The goal of this study is to encourage businesses, individuals, and policy makers to consider energy consumption and efficiency when determining the best ways for businesses and employees to operate on a day-to-day basis. Additionally, it is the hope of the authors that this study inspires further and more detailed research into office building energy consumption and how to best operate to ensure low costs, high energy efficiency, and most importantly how that can improve quality of life for all involved.

Author Contributions

Conceptualization, J.P.A.; methodology, B.M.D., M.H., L.W., M.M., J.P.A.; formal analysis, B.M.D., M.H., L.W., M.M.; resources, B.M.D., M.H., L.W., M.M.; writing—original draft preparation, B.M.D., M.H., L.W., M.M.; writing—review and editing, B.M.D., J.P.A.; visualization, B.M.D.; supervision, J.P.A.; project administration, J.P.A. All authors have read and agreed to the published version of the manuscript.

Funding

This research received no external funding.

Data Availability Statement

Publicly available datasets were analyzed in this study. This data can be found at the following links: https://data.cityofnewyork.us/Environment/Energy-and-Water-Data-Disclosure-for-Local-Law-84-/vdzd-yy49 (accessed on 18 October 2021). https://www.census.gov/en.html (accessed on 18 October 2021). https://data.cityofnewyork.us/Environment/Energy-and-Water-Data-Disclosure-for-Local-Law-84-/vdzd-yy49 (accessed on 18 October 2021).

Conflicts of Interest

The authors declare no conflict of interest.

References

  1. Lang, R.; Sanchez, T.; Oner, A. Beyond Edge City: Office Geography in the New Metropolis. Urban Geogr. 2009, 30, 726–755. [Google Scholar] [CrossRef]
  2. NYC Planning the Ins and Outs of NYC Commuting an Examination of Recent Trends and Characteristics of Commuter Exchanges between NYC and the Surrounding Metro Region 2019. Available online: https://www1.nyc.gov/assets/planning/download/pdf/planning-level/housing-economy/nyc-ins-and-out-of-commuting.pdf (accessed on 16 October 2021).
  3. Moss, M.L.; Qing, C.Y.; Kaufman, S. Commuting to Manhattan: A Study of Residence Location Trends for Manhattan Workers from 2002 to 2009. 2012. Available online: http://wagner.nyu.edu/files/faculty/publications/ManhattanCommuting.pdf (accessed on 16 October 2021).
  4. DeSimone, T. Statewide Commercial Baseline Study Presentation 2020. Available online: https://www.nyiso.com/documents/20142/13106846/Commercial%20Baseline%20NYISO%20Presentation.pdf/f375d880-27c3-f501-db61-dd9e42c32e44 (accessed on 16 October 2021).
  5. Nelson, A. Office Benefits from Pickup in Jobs and GDP—Leasing and Rents Rise Again; Colliers International: Toronto, ON, Canada, 2018; p. 13. [Google Scholar]
  6. Arjunan, P.; Poolla, K.; Miller, C. EnergyStar++: Towards More Accurate and Explanatory Building Energy Benchmarking. Appl. Energy 2020, 276, 115413. [Google Scholar] [CrossRef]
  7. New York State Department of Health Interim Guidance for Office-Based Work during the Covid-19 Public Health Emergency 2020. Available online: https://www.governor.ny.gov/sites/default/files/atoms/files/offices-interim-guidance.pdf (accessed on 17 October 2021).
  8. Connect Commercial Real Estate Manhattan Office Occupancy Plummets, But Not Energy Consumption. Available online: https://www.connect.media/manhattan-office-occupancy-plummets-but-not-energy-consumption/ (accessed on 13 August 2020).
  9. Kontokosta, C.E. Modeling the Energy Retrofit Decision in Commercial Office Buildings. Energy Build. 2016, 131, 1–20. [Google Scholar] [CrossRef]
  10. Sheppy, M.; Lobato, C.; Pless, S.; Polese, L.G.; Torcellini, P. Assessing and Reducing Plug and Process Loads in Office Buildings; National Renewable Energy Lab.(NREL): Golden, CO, USA, 2013. Available online: Nrel.gov/docs/fy12osti/51708.pdf (accessed on 18 October 2021).
  11. Urban Green Council. New York City’s Energy and Water Use 2014 and 2015 Report; Urban Green Council: New York, NY, USA, 2017; p. 72. [Google Scholar]
  12. Brynjolfsson, E.; Horton, J.; Ozimek, A.; Rock, D.; Sharma, G.; TuYe, H.-Y. COVID-19 and Remote Work: An Early Look at US Data; National Bureau of Economic Research: Cambridge, MA, USA, 2020; p. w27344. [Google Scholar]
  13. What Is Energy Use Intensity (EUI). Available online: https://www.energystar.gov/buildings/benchmark/understand_metrics/what_eui (accessed on 6 October 2021).
  14. Lobato, C.; Sheppy, M.; Brackney, L.; Pless, S.; Torcellini, P. Selecting a Control Strategy for Plug and Process Loads, NREL Technical Report (NREL/TP-5500-51708); National Renewable Energy Lab. (NREL): Golden, CO, USA, 2012. Available online: https://www.nrel.gov/docs/fy13osti/54175.pdf (accessed on 18 October 2021).
  15. Heating, Ventilation, and Air Conditioning (HVAC). Available online: https://rpsc.energy.gov/tech-solutions/hvac (accessed on 18 October 2021).
  16. U.S. Energy Information Administration (EIA). Available online: https://www.eia.gov/index.php (accessed on 18 October 2021).
  17. Bureau, U.C. Census.Gov. Available online: https://www.census.gov/en.html (accessed on 18 October 2021).
  18. Mayor’s Office of Sustainability (MOS) Energy and Water Data Disclosure for Local Law 84 2019 (Data for Calendar Year 2018) | NYC Open Data. Available online: https://data.cityofnewyork.us/Environment/Energy-and-Water-Data-Disclosure-for-Local-Law-84-/vdzd-yy49 (accessed on 18 October 2021).
  19. U.S. Census Bureau QuickFacts: United States. Available online: https://www.census.gov/quickfacts/fact/map/US/POP060210 (accessed on 18 October 2021).
  20. Bureau, U.C. Data Profiles. Available online: https://www.census.gov/acs/www/data/data-tables-and-tools/data-profiles/ (accessed on 18 October 2021).
  21. USNaviguide LLC Midtown, New York City-Manhattan, New York Zip Code Boundary Map (NY). Available online: https://www.zipmap.net/New_York/New_York_County/Z_Midtown.htm (accessed on 18 October 2021).
  22. Department of City Planning NYC Planning: Pluto 20v4. Available online: https://www1.nyc.gov/site/planning/data-maps/open-data.page#pluto (accessed on 18 October 2021).
  23. NYC Chapter 3: Use and Occupancy Classification. Available online: https://www1.nyc.gov/assets/buildings/apps/pdf_viewer/viewer.html?file=2014CC_BC_Chapter_3_Use_and_Occupancy_Classification.pdf&section=conscode_2014 (accessed on 18 October 2021).
  24. Googe Maps Google Maps: Midtown Manhattan. Available online: https://www.google.ca/maps/place/Midtown+Manhattan,+New+York,+NY,+USA/@40.7541908,-74.0076988,12.52z/data=!4m5!3m4!1s0x89c25901a4127ca9:0xbecdcc9081d6cfdb!8m2!3d40.7549309!4d-73.9840195 (accessed on 18 October 2021).
  25. Davis, S.C.; Boundy, R.G. Transportation Energy Data Book, 37th ed.; 37.1 of ORNL-5198; Oak Ridge National Laboratory: Oak Ridge, TN, USA, 2019. Available online: https://tedb.ornl.gov/wp-content/uploads/2019/03/TEDB_37-2.pdf (accessed on 18 October 2021).
  26. O’Toole, R. Transit: The Urban Parasite. Available online: https://www.cato.org/publications/policy-analysis/transit-urban-parasite (accessed on 13 August 2020).
  27. Davis, S.C.; Boundy, R.G. Transportation Energy Data Book, 38th ed.; Oak Ridge National Laboratory: Oak Ridge, TN, USA, 2020.
  28. Minn, M. Contested Power: American Long-Distance Passenger Rail and the Ambiguities of Energy Intensity Analysis. Sustainability 2019, 11, 1200. [Google Scholar] [CrossRef] [Green Version]
  29. eia Household Energy Use in New York. Available online: https://www.eia.gov/consumption/residential/reports/2009/state_briefs/pdf/NY.pdf (accessed on 16 August 2020).
  30. eia Household Enegy Use in New Jersey: A Closer Look at Residential Energy Consumption. Available online: https://www.eia.gov/consumption/residential/reports/2009/state_briefs/pdf/nj.pdf (accessed on 18 October 2021).
  31. eia Electricity Data Browser—Retail Sales of Electricity. Available online: https://www.eia.gov/electricity/data/browser/#/topic/5?agg=0,1&geo=vvvvvvvvvvvvo&endsec=vg&linechart=ELEC.SALES.TX-ALL.M~ELEC.SALES.TX-RES.M~ELEC.SALES.TX-COM.M~ELEC.SALES.TX-IND.M~ELEC.SALES.NY-ALL.M~ELEC.SALES.NY-RES.M~ELEC.SALES.NY-COM.M~ELEC.SALES.NY-IND.M~ELEC.SALES.NY-TRA.M~ELEC.SALES.NY-OTH.M&columnchart=ELEC.SALES.TX-ALL.M~ELEC.SALES.TX-RES.M~ELEC.SALES.TX-COM.M~ELEC.SALES.TX-IND.M&map=ELEC.SALES.US-ALL.M&freq=M&start=200101&end=202005&ctype=linechart&ltype=pin&rtype=s&maptype=0&rse=0&pin= (accessed on 18 October 2021).
  32. eia Natural Gas Deliveries to Commercial Consumers (Including Vehicle Fuel through 1996) in New York (Million Cubic Feet). Available online: https://www.eia.gov/dnav/ng/hist/n3020ny2m.htm (accessed on 18 October 2021).
  33. Petroleum and Other Liquids. Available online: https://www.eia.gov/dnav/pet/hist/LeafHandler.ashx?n=pet&s=emm_epmr_pte_y35ny_dpg&f=m (accessed on 7 October 2021).
  34. New Jersey Turnpike Authority. Available online: https://www.njta.com/travel-resources/fuel-prices (accessed on 7 October 2021).
  35. Highlights of the Automotive Trends Report. Available online: https://www.epa.gov/automotive-trends/highlights-automotive-trends-report#Highlight2 (accessed on 7 October 2021).
  36. Krarti, M.; Aldubyan, M. Review analysis of COVID-19 impace on electricity demand for residential buildings. Renew. Sustain. Energy Rev. 2021, 143, 110888. [Google Scholar] [CrossRef]
  37. Mehlig, D.; ApSimon, H.; Staffell, I. The impact of the IK’s COVID-19 lockdowns on energy demand and emissions. Environ. Res. Lett. 2021, 16, 54037. [Google Scholar] [CrossRef]
  38. Xu, A.T.; Gao, B.W.; Li, Y. Impact of the COVID-19 pandemic on the reduction of electricity demand and the integration of renewable energy into the power grid. J. Renew. Sustain. Energy 2021, 13, 26304. [Google Scholar]
  39. Chihib, M.; Salmeron-Manzano, E.; Chourak, M.; Perea-Moreno, A.; Manzano-Agugliaro, F. Impact of the COVID-19 Pandemic on the Energy Use at the University of Almeria (Spain). Sustainability 2021, 13, 5843. [Google Scholar] [CrossRef]
  40. Kawka, E.; Cetin, K. Impacts of COVID-19 on residential building energy use and performance. Build. Environ. 2021, 205, 108200. [Google Scholar] [CrossRef] [PubMed]
  41. Abdeen, A.; Kharvari, F.; O’Brien, W.; Gunay, B. The impact of the COVID-19 on households’ hourly electricity consumption in Canada. Energy Build. 2021, 250, 111280. [Google Scholar] [CrossRef]
  42. Basu, R.; Ferreira, J. Sustainable mobility in auto-dominated Metro Boston: Challenges and opportunities post-COVID-19. Transp. Policy 2021, 103, 197. [Google Scholar] [CrossRef]
  43. Aloi, A.; Alonso, B.; Benavente, J.; Cordera, R.; Echaniz, E.; Gonzalez, F.; Ladisa, C.; Lezama-Romanelli, R.; Lopez-Parra, A.; Mazzei, V.; et al. Effects of the COVID-19 Lockdown on Urban Mobility: Empirical Evidence from the City of Santander (Spain). Sustainability 2021, 12, 3870. [Google Scholar] [CrossRef]
  44. Mogaji, E. Impact of COVID-19 on transportation in Lagos, Nigeria. Transp. Res. Interdiscip. Perspect. 2020, 6, 100154. [Google Scholar] [CrossRef] [PubMed]
  45. O’Sullivan, F.; Bliss, L. The 15-Minute City—No Cars Required—Is Urban Planning’s New Utopia. Bloomberg 2021. Available online: https://www.bloomberg.com/news/features/2020-11-12/paris-s-15-minute-city-could-be-coming-to-an-urban-area-near-you (accessed on 7 October 2021).
  46. State Government of Victoria. 20-Minute Neighbourhoods 2016. Available online: https://www.planmelbourne.vic.gov.au/current-projects/20-minute-neighbourhoods (accessed on 7 October 2021).
  47. Committee on Pathways to Urban Sustainability: Challenges and Opportunities. Pathways to Urban Sustainability, Challenges and Opportunities for the United States. Available online: https://www.nap.edu/read/23551/chapter/2 (accessed on 7 October 2021).
  48. Nundy, S.; Aritra, G.; Mesloub, A.; Albaqawy, G.A.; Alnaim, M.M. Impact of COVID-19 pandemic on socio-economic, energy-environment and transport sector globally and sustainable development goal (SDG). J. Clean. Prod. 2021, 312, 127705. [Google Scholar] [CrossRef]
  49. Moglia, M.; Hopkins, J.; Bardoel, A. Telework, Hybrid Work and the United Nation’s Sustainable Development Goals: Towards Policy Coherence. Sustainability 2021, 13, 9222. [Google Scholar] [CrossRef]
  50. Jiang, P.; Fan, Y.V.; Klemes, J.J. Impacts of COVID-19 on energy demand and consumption: Challenges lessons and emerging opportunities. Appl. Energy 2021, 285, 116441. [Google Scholar] [CrossRef] [PubMed]
Figure 3. Commercial, Transportation, and Residential Energy Consumption Pre- and Post-COVID-19.
Sustainability 13 11586 g003
Figure 4. A comparison of the difference in employee transportation cost savings vs. the increased cost of increased household energy consumption.
Sustainability 13 11586 g004
Figure 5. A representation of the effects of office building occupancy in who shares the energy consumption burden.
Sustainability 13 11586 g005
Table 1. Representative Building Metrics.
Metric [18]Value
Floor Area (m2) [22]27,875
Number of Floors (Floors)22
Occupancy (%)93
Number of employees at above occupancy (People)1927
Site Energy Usage Index (GJ)28,359
Table 2. Transportation Breakdown.
RegionAreaFrequency (%) [2]Approximate Distance from
Midtown
Building (km)
Approximate Energy
Consumption of Daily Commute (GJ/Passenger) *
Relative
Energy
Consumption of Commute (GJ/Day)
Total
Relative
Energy
Consumption of Commute (GJ/Day)
In-
Commuters
Outer New Jersey5.7290.90.2960.01780.259
Inner New Jersey46.465.50.2130.0982
Long Island21.21300.4250.0892
Lower Hudson Valley17.951.50.1680.0302
Mid-Hudson Valley3.3199.60.3250.00974
Southwest Connecticut5.4285.80.2790.0140
Non-
Manhattan New York City
Boroughs
Bronx18.517.90.05190.009590.08434
Brooklyn40.540.20.1170.0473
Staten Island6.0044.10.1280.00813
Queens35.019.20.05560.0193
ManhattanManhattan100.04.350.01260.01260.0126
* Accounts for trip to and from representative office building.
Table 3. Mode of Transport and Energy Consumption.
RegionMode of TransportFrequency of Transportation Mode for In-Commuters (%) [25]Energy Consumption of Transportation Mode
(GJ/Passenger-km)
In-
Commuters
Car68.00.00193 [25]
Subway/Path14.00.00153 [26]
Commuter Rail6.000.00111 [27]
Bus8.000.000467 [28]
Other (Walking, biking etc.)4.000.00
New York City
Boroughs
Car24.00.00193
Subway/Path47.000.00153
Commuter Rail<1.000.00111
Bus10.000.00269
Other (Walking, biking etc.)19.000.00
Table 4. Commercial Energy Type Breakdown for Site EUI.
Type of
Energy
Energy Consumption (GJ)Percent Change (%)
Pre-COVID-19Post-COVID-19
Electricity17,01515,257−10.3
Natural Gas85087571−11
Other28362533−10.7
Total28,35925,362-
Table 5. Residential Building Energy Consumption Breakdown.
Pre-COVID-19 Residential Energy Consumption Breakdown
AreaNatural Gas (GJ/Person-Day)Electricity (GJ/Person-Day)Other
(GJ/Person-Day)
Total (GJ/Person-Day)
Manhattan0.05770.02040.02080.0989
NYC Non-Manhattan Boroughs0.04000.01410.01450.0686
Long Island (NY)0.01390.004940.005020.0239
Inner New Jersey0.06200.02430.01020.0965
Outer New Jersey0.005970.002330.0009800.00928
Southwest Connecticut0.001300.001060.001730.00408
Lower Hudson Valley (NY)0.01470.005180.005280.0251
Mid-Hudson Valley (NY)0.002160.0007660.0007800.00371
In-Commuters0.1000.03860.02390.163
Post-COVID-19 Energy Consumption Breakdown
AreaNatural Gas
(GJ/Person-Day)
Electricity (GJ/Person-Day)Other
(GJ/Person-Day)
Total (GJ/Person-Day)
Manhattan0.06550.02120.02260.109
NYC Non-Manhattan Boroughs0.04530.01470.01560.0755
Long Island (NY)0.01580.005110.005440.0264
Inner New Jersey0.08060.02550.01210.118
Outer New Jersey0.007750.002460.001170.0114
Southwest Connecticut0.001480.001110.001900.00448
Lower Hudson Valley (NY)0.01660.005360.005720.0276
Mid-Hudson Valley (NY)0.002450.0007920.0008450.00409
In-Commuters0.1240.04030.02720.192
Publisher’s Note: MDPI stays neutral with regard to jurisdictional claims in published maps and institutional affiliations.

