
Model for Optimizing the Ratios of the Company Suppliers in Slovak Automotive Industry


Department of Industrial and Digital Engineering, Institute of Industrial Engineering, Management and Environmental Engineering, Technical University of Košice, Park Komenského 9, 040 01 Košice, Slovakia
*
Author to whom correspondence should be addressed.
Sustainability 2021, 13(21), 11597; https://0-doi-org.brum.beds.ac.uk/10.3390/su132111597
Submission received: 30 June 2021
/
Revised: 13 October 2021
/
Accepted: 14 October 2021
/
Published: 20 October 2021
(This article belongs to the Special Issue Cooperative Challenges for Sustainable Development of Enterprises in the Era of the Fourth Industrial Revolution)
Abstract
:The Slovak automotive industry consists of various companies and suppliers, with different positions in the supply chain for automotive manufacturers. The accuracy of component deliveries and their quality affect the ultimate competitiveness of the entire automotive industry. The creation of strategic partnerships and stable supplier–customer relationships is currently a necessity. The aim of the article is to design the model for optimizing the ratio of the company suppliers in the Slovak automotive industry. The basis for designing the model was the results of our own research focused on the quality and timeliness of component deliveries from various suppliers. Supply chain members work with multiple subcontractors, using multiple subcontractors to supply the same components. We analyzed the overall quality of delivered components at a certain stage of the supply chain. The quality of the supplied components was the sum of all items from all suppliers. The aim of the proposed model is to determine the optimal percentage of individual suppliers of a particular part so as to minimize the overall risk associated with the supply and inventory of a particular part for the customer. Research methodology was focused on identification of the key performance indicators and key risk indicators of components deliveries by different suppliers. Those indicators provide a basis for the effective results of further research. We designed and used an algorithm for preparing and evaluating the model for optimizing the ratio of the company suppliers in the Slovak automotive industry. This research used modeling methods, simulations, and optimization models. The proposed model was verified in the specific conditions of the automotive supply chain. Deliveries from two subcontractors were simulated. Based on the results of the simulations, the optimal supply ratio of the two subcontractors was determined for a specific component of a member of the supply chain at a higher level. The results of the research can be useful for different suppliers in the Slovak automotive industry. By partially modifying the model and adapting it for different conditions in other industries, the model of optimizing the distribution of supply from individual suppliers can be used for other supply chains.
1. Introduction
The automotive industry is facing major changes as a result of the rise of new technologies, changes in customer expectations, and the growing need to focus on environmental, social, and governance policies. The automotive industry is experiencing radical upheaval. This transformation is being driven by four main trends: electromobility, shared mobility services, autonomous driving, and connected vehicles. The growing demand for electric cars and innovative mobility solutions shows how important the issue of sustainability has now become.
Slovakia can be described as an automotive power. It is referred to as a car assembly workshop. There are four large car factories in Slovakia: Volkswagen Group in Bratislava, PSA in Trnava, Kia Motors in Žilina, and Jaguar-Land Rover in Nitra. The automotive industry is key from the point of view of the Slovak economy. It accounts for almost 50% (49.5%) of the total industry and 46.6% of exports from Slovakia. In Slovakia, 177,000 people are employed directly by the automotive industry, and up to 276,000 people are indirectly employed by the automotive industry. It is the world leader in the number of cars produced: 202 cars per 1000 inhabitants.
Therefore, every fluctuation in the demand of cars in the world has a great impact on the Slovak economy and the inhabitants of Slovakia. By 2020, everything was fine. In Europe, car sales have been growing regularly since 2013. In Slovakia, this trend was even more pronounced. Over the last six years, car sales have grown by more than 40%. In 2019, for the first time, the limit of 100,000 cars sold per year was broken. These numbers meant only positive information for the Slovak economy. Its GDP has been growing every year, and unemployment has been steadily declining.
The COVID-19 pandemic has caused changes in the car market. Car production around the world has stopped completely. The closed borders also caused problems with the logistics of already-manufactured cars. In addition, based on the decisions of the crisis staff, all stores were closed in 2020, and thus also were dealerships so that customers did not have new cars or places to buy them. The shutdown of car production has affected 1.1 million people in Europe alone. (Employees at subcontractors are not included.) The production outage in the EU alone is over 2.4 million cars. According to the latest data in Slovakia, a decrease of 30% is expected compared to the previous year. Most cars are currently produced on a limited number of shifts.
It is also very difficult for carmakers to restart production plans, which change almost daily. The automotive industry is also weakened economically by insufficient stocks, which are not enough for even a few weeks; complex supply chains; market tensions; and declining sales.
Some car manufacturers producing in Slovakia plan to switch to the production of electric cars. This represents a new production for them, and in the past, engineers from abroad, especially from the parent companies, helped them significantly with the launch of the new production. In the current situation, as travel is restricted, Slovak automobiles and their suppliers will have to cope with these restrictions and find a way to solve them.
COVID-19 has clearly highlighted the importance of flexible and reliable supply chains. After the pandemic, the automotive industry will return to a new norm, which will mean a change in business models and an increase in automation and digitization. However, these are not the only challenges that car OEMs will face in the future. The role of logistics in sustainability is important. There are already many opportunities to support the car industry in raising environmental awareness. All members of supply chains need to be supported in implementing current trends, such as sustainability and digitization.
Vehicle manufacturers are still looking for ways to get as close as possible to carbon-neutral production and comply with strict emissions regulations. These trends are not only affected by the conditions set by the European Union (EU) but also by consumer preferences. Awareness of environmental protection and the need for a greener lifestyle leads to the need to use greener vehicles. Reducing the carbon footprint is thus not only a matter of complying with EU regulations but can also give manufacturers a competitive advantage. Car manufacturers are thus very well-motivated to optimize consumption during production as much as possible. Representatives of the automotive industry are demanding that the government support investments aimed at the development and production of alternative propulsion vehicles or intelligent transport systems.
The introduction of this article deals with the automotive industry, especially the actual situation in the Slovak automotive industry. Literature review of the issue is focused on distribution network and supply chain management. The automotive supply chain is connected with various problems and risks. One of them is timeliness and the quality of deliveries from individual suppliers of a specific component, which is also a subject of research in this article. The methodology section presents the research object, which is the supply chain in the Slovak automotive industry. The main problem is explained: the appropriate ratio of deliveries from suppliers of the specific component that is the subject of the solution. The methodology of compiling the proposed model of supplier supply management in the form of an algorithm is described. The algorithm is the process of creating and testing a new model. The output of this study will be the results of analyses that will create the building blocks of a model for optimizing the distribution of supplies in the company’s distribution network. This will create a reference model for optimizing the distribution-to-supplier ratio. Verification of the proposed model will be performed in the selected company after a thorough analysis of selected key performance indicators of the distribution network. Based on the results obtained through simulation modeling, it will be possible for the company to determine the optimal distribution ratios of suppliers of supplementary components in the network. The chosen methodology will enable the identification of key areas of use for risk models in the distribution network and the elimination of supplier risks. The output of this study is a model for optimizing the distribution of supplies in the company’s distribution network. Thus, a reference model was created to optimize the supply ratio of a supplier of the same component to one customer, depending on the specified conditions, which take into account the estimated risks. Verification of the proposed model will be performed in a selected company operating in the Slovak supply chain. The results of simulation modeling are discussed in the discussion. The simulations made it possible to determine the optimal distribution ratios of suppliers of additional components for a particular company. Finally, the key areas of use of the model in the distribution network for the elimination of selected risks are identified.
The output of this study is a model for optimizing the distribution of supplies in the company’s distribution network. Thus, a reference model was created to optimize the delivery ratio of a supplier of the same component to one customer, depending on the specified conditions, which take into account the estimated risks. Verification of the proposed model will be performed in a selected company operating in the Slovak supply chain. The results of simulation modeling are discussed in the discussion. The simulations made it possible to determine the optimal distribution ratios of the suppliers of additional components for a particular company. Finally, the key areas of use of the model in the distribution network for the elimination of selected risks are identified. This is the methodology of eliminating the risks of the supplier, and also the design of the distribution network model. After that, an algorithm of the sequence of steps of the mathematical model is created, which becomes the basis for the creation of a mathematical basis of the simulation environment in the selected software @Risk by the Monte Carlo simulation method.
2. Literature Review
The current situation, according to [1], requires the coordination of a global network of companies whose activities are becoming the primary source of competitive advantage. The processes of globalization, price wars, new forms of differentiation, value chain control, and the productivity paradigm influenced the creation of a new form of management called the “distribution network” [2]. This new approach to supply chain management requires a different way of managing, very demanding for the company itself.
As reported by [3], a distribution network is defined as a relationship created between a company and its partners to control the flow and quality of inputs, resp. outputs from suppliers to consumers. The basic goal according to [4] is to maximize the value created independently of the form in which it was expressed. This value process can be achieved by integrating, optimizing, and synchronizing all relevant management elements. As stated in [5], the quality of products and services and customer satisfaction are considered to be the most important goals.
As stated in [6], the process of managing the supply chain consists of three parts focused on (1) procurement, (2) production, and (3) distribution of products, resp. services. Supply chain management creates the interconnection of all stakeholders in one network in the form of five nodes [7]. According to [8], the first connection is material flow, which should have the smoothest possible character without significant oscillations. The classical school considers this flow, in terms of results, to be the most important, while attention is also paid to the analysis of the effects on the flow of finances or information. The second connection in the system is realized in the form of information flow [9]. From the point of view of the “modern school”, this flow is the most important in the processes of cost reduction and continuous improvement. The third connection, financial flow [6], is focused on financial resources, the flow of which can be significantly complex in a comprehensive system. The fourth connection in the field of supply, production, and distribution is realized through decision-making processes [10]. A comprehensive system of processes is being considered to increase the efficiency and effectiveness of the material and information flow. A comprehensive decision-making process enables the formulation of dynamic alternative solutions oriented to changes in demand to create an equilibrium state of the distribution network. The fifth connection, called strategic partnership [11], arose as a result of the need to create a suitable competitive position supported by the integration of selected companies. Asymmetry in the supply chain can be influenced by the coordination of material and information flow, conflicts, or the perception of risk in the absence of certainty [12].
Strategic partnerships are created only for interest groups willing to cooperate in the long term, and, therefore, the network can be formed by partnerships of various sizes [13]. The process of mutual collaboration is based on the “win to win” relationship, which minimizes risks and increases the transparency of processes and satisfaction on both sides [14]. Despite these advantages, there are many relationships between interest groups that are only transactional. According to [15], cooperative planning allows the timely determination of projected demand and the identification of bottlenecks in the chain. Based on the relationships that are created, the three most common types of connections can exist between suppliers, customers, and manufacturers. Duality, vertical integration, or optimization can occur. Analytical optimization is the most complex but, at the same time, the most effective approach. It involves many suppliers and/or customers and delivers the most satisfactory results.
Every company that is part of the automotive industry has its suppliers carefully selected based on several requirements. The highest emphasis is placed on quality and, due to the use of Just in Time supply, also on the timeliness of deliveries [16,17]. Together with the price of components, these indicators are among the most important factors in the selection of suppliers. However, it often happens that due to cheap labor and low prices of components, these suppliers are also selected from remote countries, which increases the length of shipping time and shortens the ordering point. In this context, compared to suppliers from neighboring countries, there are additional risks associated with the transport and handling of products. This is why it is important to consider whether the company is willing to accept these risks. Usually, there are more suppliers in the company, and for each component, the distribution of orders is anchored in the contract, while the share of deliveries is indicated in suppliers by the percentage. In practice, this means that the supply of one production component can be involved (e.g., three suppliers in a ratio of 40:20:40). The distribution of these ratios is mainly influenced by the price, quality, transport and storage requirements, etc. Occasionally, there are situations where companies have only one supplier of a specific production component, as they are not willing to contract with other suppliers for various reasons.
It is generally assumed [18] that risk can be analyzed at two levels, namely (1) strategic, and (2) operational. The strategic level enables the analysis of phenomena in the future, while the operational level creates the conditions for the analysis of operational risks occurring during the performance of tasks. In terms of the sustainable development of companies, it is desirable to encourage business activity to predict the potential behavior of systems in uncertain environmental conditions, which is associated with the strategic orientation of environmental analysis. Prediction encourages the proactive behavior of systems by using the support of model and simulation tools. These, using appropriate variables, make it possible to modify the development of the environment and provide the organization with a set of options for solving the analyzed problem concerning the set risk limits.
As reported in [19,20], the authors have used linear programming techniques in their work to manage demand uncertainty. Parametric linear programming and stochastic modeling have become the subject of interest in the field of supply chain analysis [21,22]. The combination of algorithms, simulations, and supporting AHP tools has made it possible to identify more rational solutions in the field of risk modeling of distribution networks [23,24]. Strategic planning has found its application in strategic decision-making processes [25].
According to [26], the authors used multidimensional comparisons of models using replication and exclusion approaches to determine the period of “start-up” strategies. Assessment of failure types, analysis of boundaries and standard deviations, and analysis of value at risk are areas addressed by other authors [27]. As stated in [28], the authors in distribution network models focused on the control of graphical outputs and percentage changes in performance indicators. Correlation sampling was the technique that was used. In agreement with [29], the study focused on the visual control of graphical outputs, the possibilities of using methods for parameter visualization, and setting up regression models to simulate outputs. The regression analysis has become, in the process of modeling the risks of the distribution network, the subject of interest of authors such as [30]. In line with [31], the authors used basic starting criteria to test the risk model. According to [32], the author analyzed the percentage changes in performance indicators (e.g., inventory level, product freshness requirement, etc.) of suppliers of individual companies. As reported by [33], the authors used covariance analysis (ANCOVA) for the corresponding variable gain, as well as the ANOVA method for analyzing the effects of relevant variables using the Scheffes method for multidimensional cell comparison. ANCOVA was used due to a significant correlation of profit with demand. Graphical representation of statistical indicators using ANOVA analysis became the subject of interest in the works of Powers & Closs in 1987 [34].
3. Materials and Methods
The methodological part of the article is divided into three parts. In the first chapter, we describe the object of research. It is a supply chain of the Slovak automotive industry. The second subchapter identifies the main problems of the supply chain of the Slovak automotive industry. The problem we are solving is clearly defined. The result is a proposed model for the distribution of the ratio of supplies from several suppliers. The third subchapter describes the algorithm that was observed in the design and verification of a new model, which is to optimize the distribution of supplies from individual suppliers of a particular component in the automotive industry in Slovakia.
3.1. Supply Chain of the Slovak Automotive Industry
The supply chain of the Slovak automotive industry creates the automotive distribution network, which consist of different suppliers. They can be classified using gross, supplied components, the regions in which they operate, the supplied components, the stage and position in the supply chain, the industry in which they operate, the customers for whom they manufacture, and other attributes.
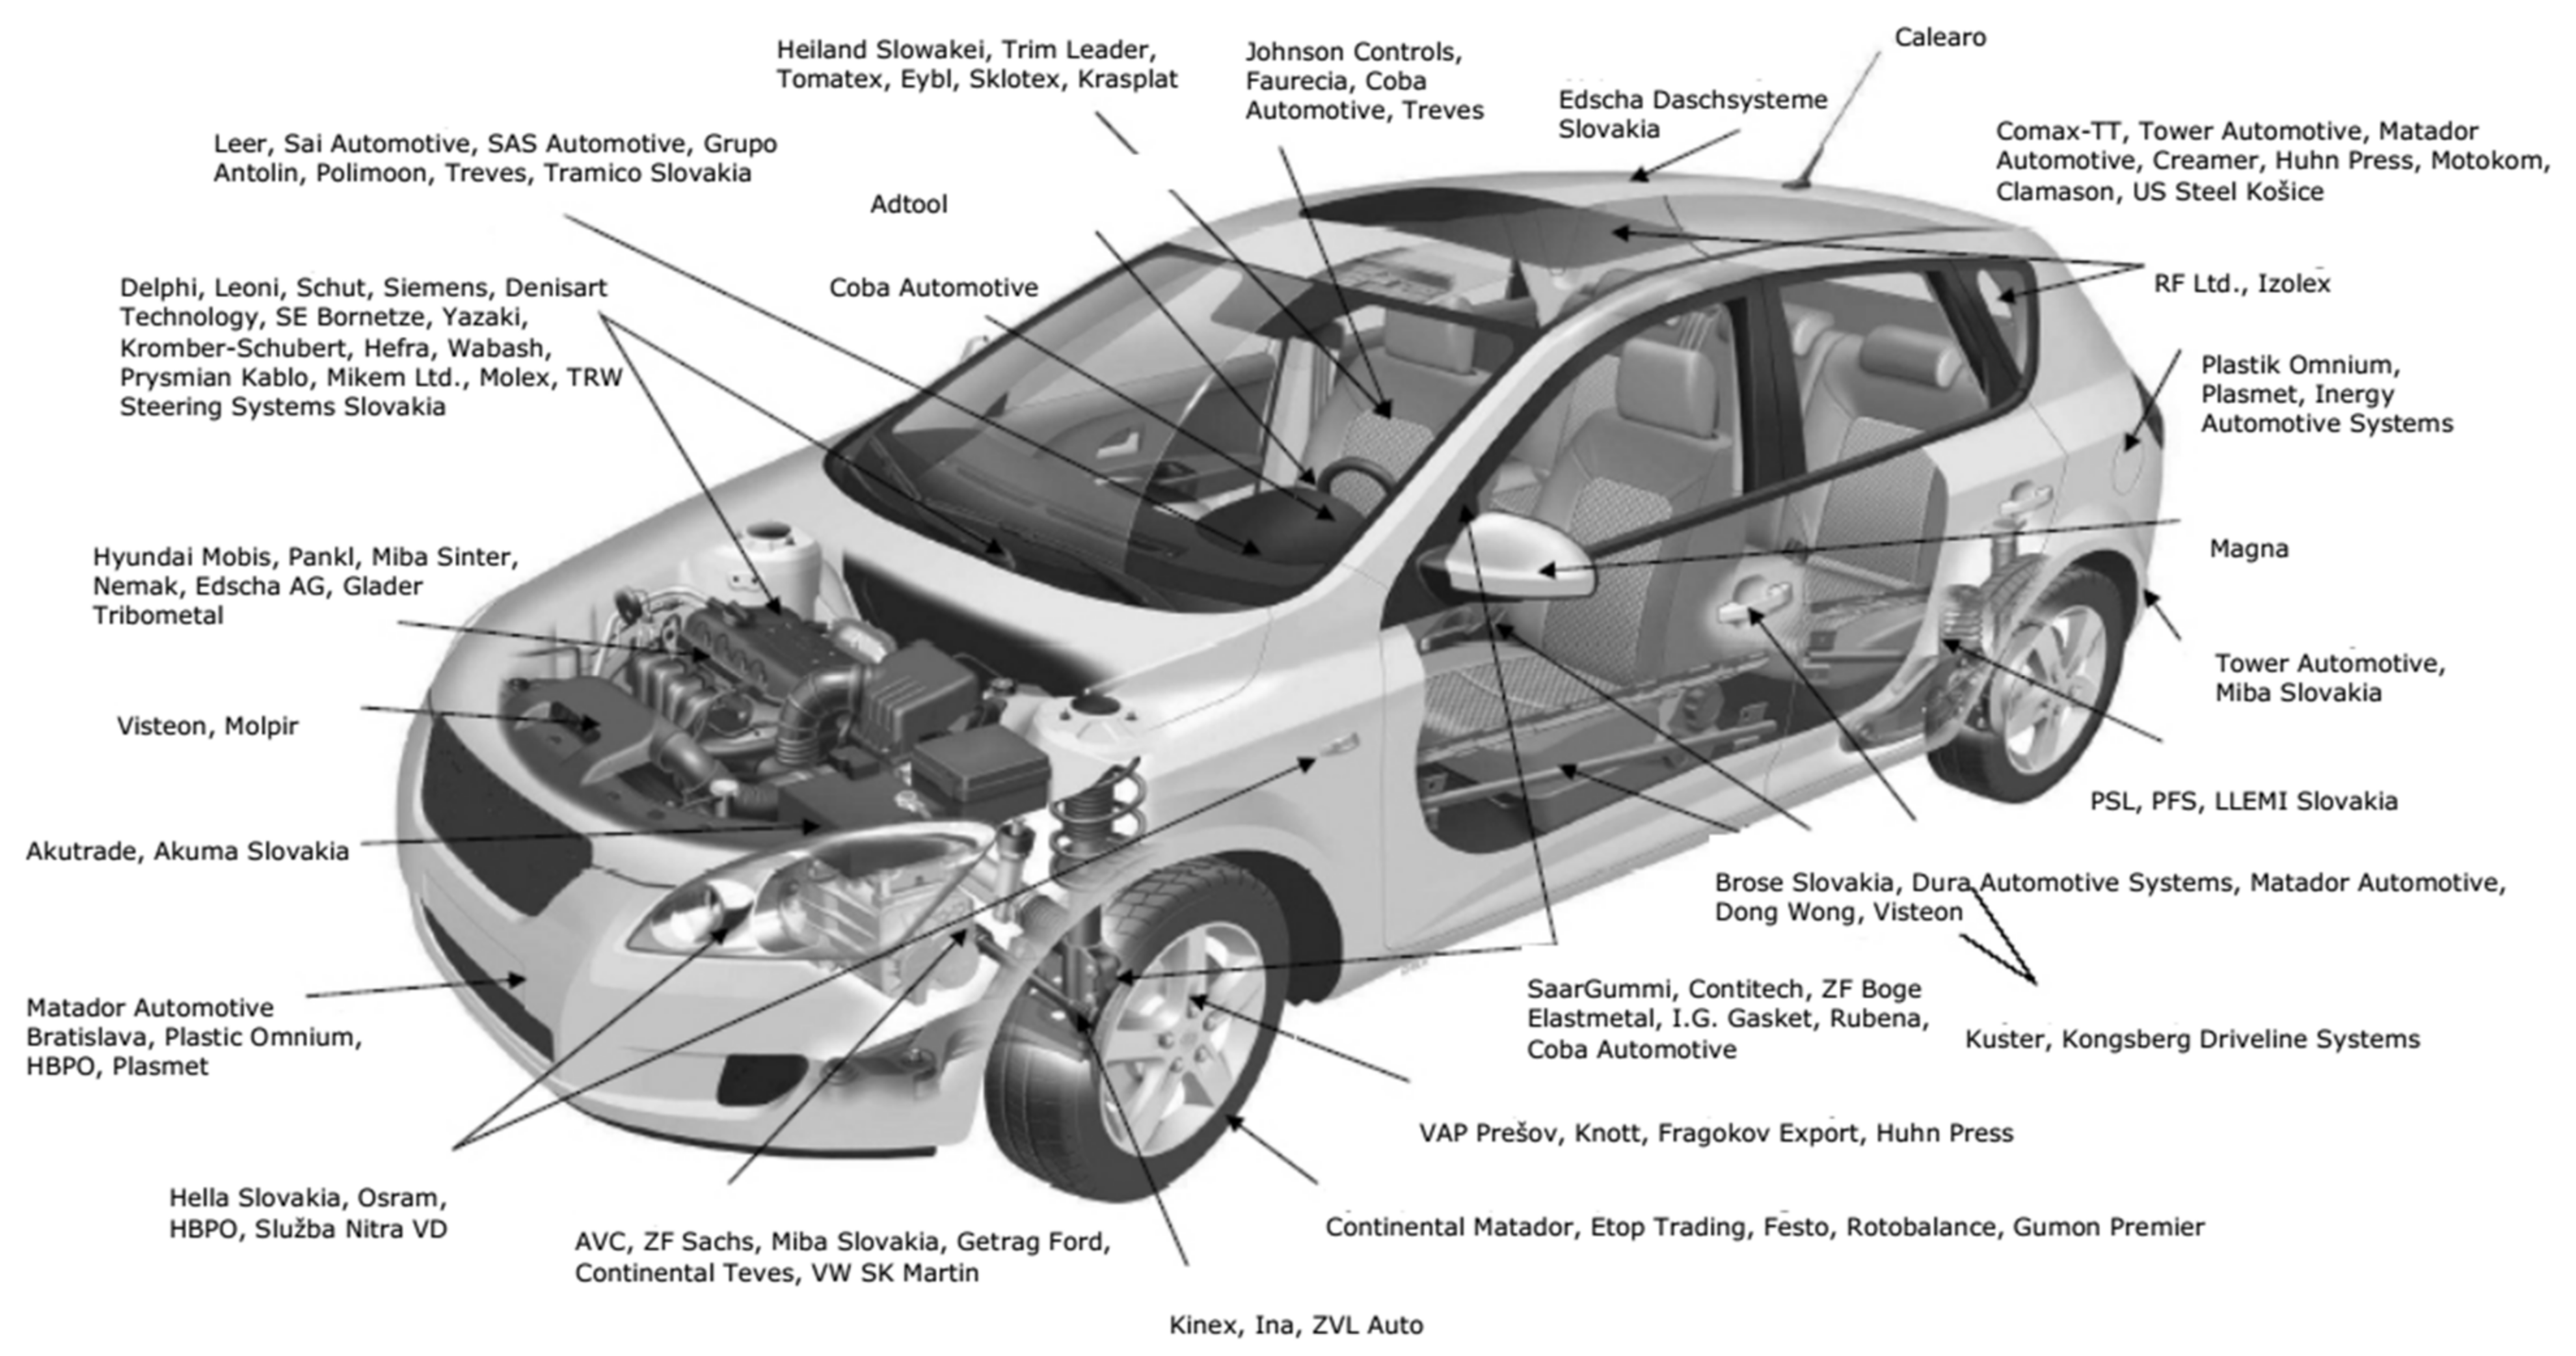
In the Slovak automotive network, there are more than 274 suppliers for the automotive industry, of which up to 202 are based in the western part of the country (Figure 1).
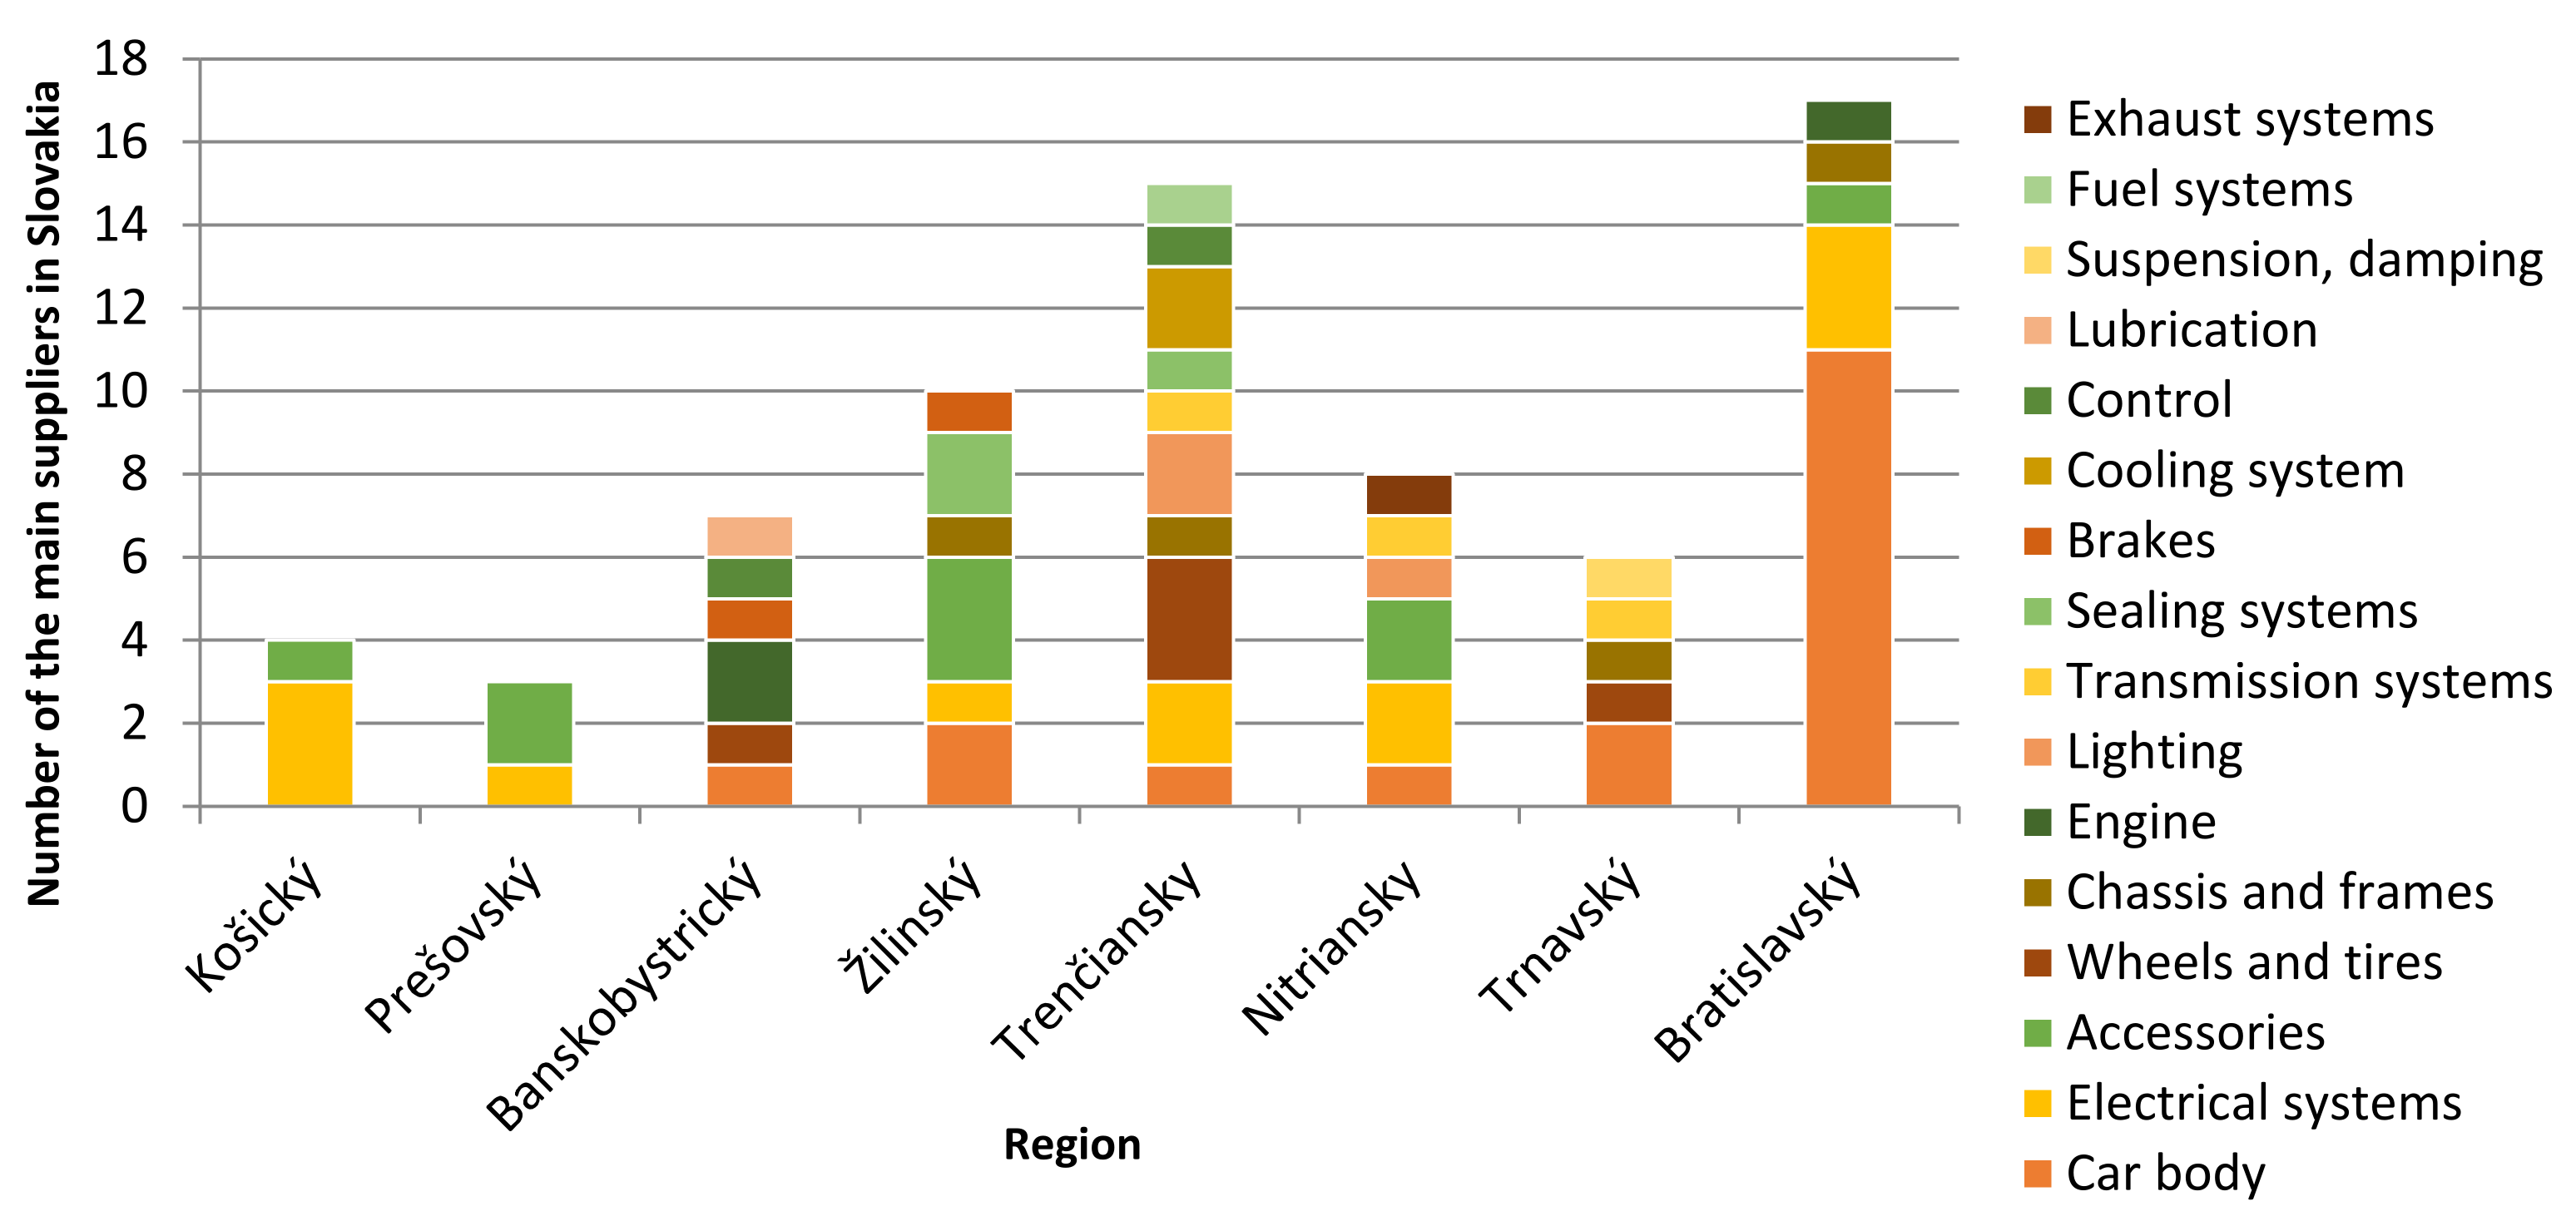
The distribution of suppliers to the automotive industry according to their regions of operation and the components they produce is shown in Figure 2. Most suppliers operate in the Bratislava, Trenčín, and Žilina regions. The representation of companies is mainly influenced by the location of the final car plants, which are Volkswagen, PSA, Kia, and Land Rover.
In terms of the structure of supplied components (also Figure 2), the main groups of suppliers are mainly focused on the body (25.71%), especially in Bratislava region; the electrical systems (17.14%); and the production of accessories (12.86%).
Based on the analysis of the automotive distribution network using sources such as (OICA, 2020), (FinStat, 2020), and (VOSA, 2020), the structure of Slovak automotive suppliers can be divided into four basic supplier groups (See Figure 3 [33,34,35].)
Automotive suppliers are divided into four levels of the supply chain. Group 1 consists of the main suppliers who supply directly to the final car manufacturers. The second group includes suppliers who are at a lower stage in the supply chain and supply major suppliers. The third group is represented by suppliers who supply components, groups of components, and they are suppliers of the second level of suppliers. The fourth group consists of suppliers who supply suppliers in the third group.
The division of automotive suppliers points to the diversity and interconnectedness of individual members of the supply chain and the entire automotive distribution network. Mutual relations and the resulting risks in case of non-fulfillment, delay in delivery, or delivery of low-quality components affect the final output of car manufacturers and the overall competitiveness of the Slovak automotive industry. In order to improve the quality and fluidity of the supply chain, it is necessary to establish an optimal strategic partnership between suppliers at various stages of the supply chain of the automotive industry in Slovakia.
3.2. Identification of the Problem in the Supply Chain of the Slovak Automotive Industry
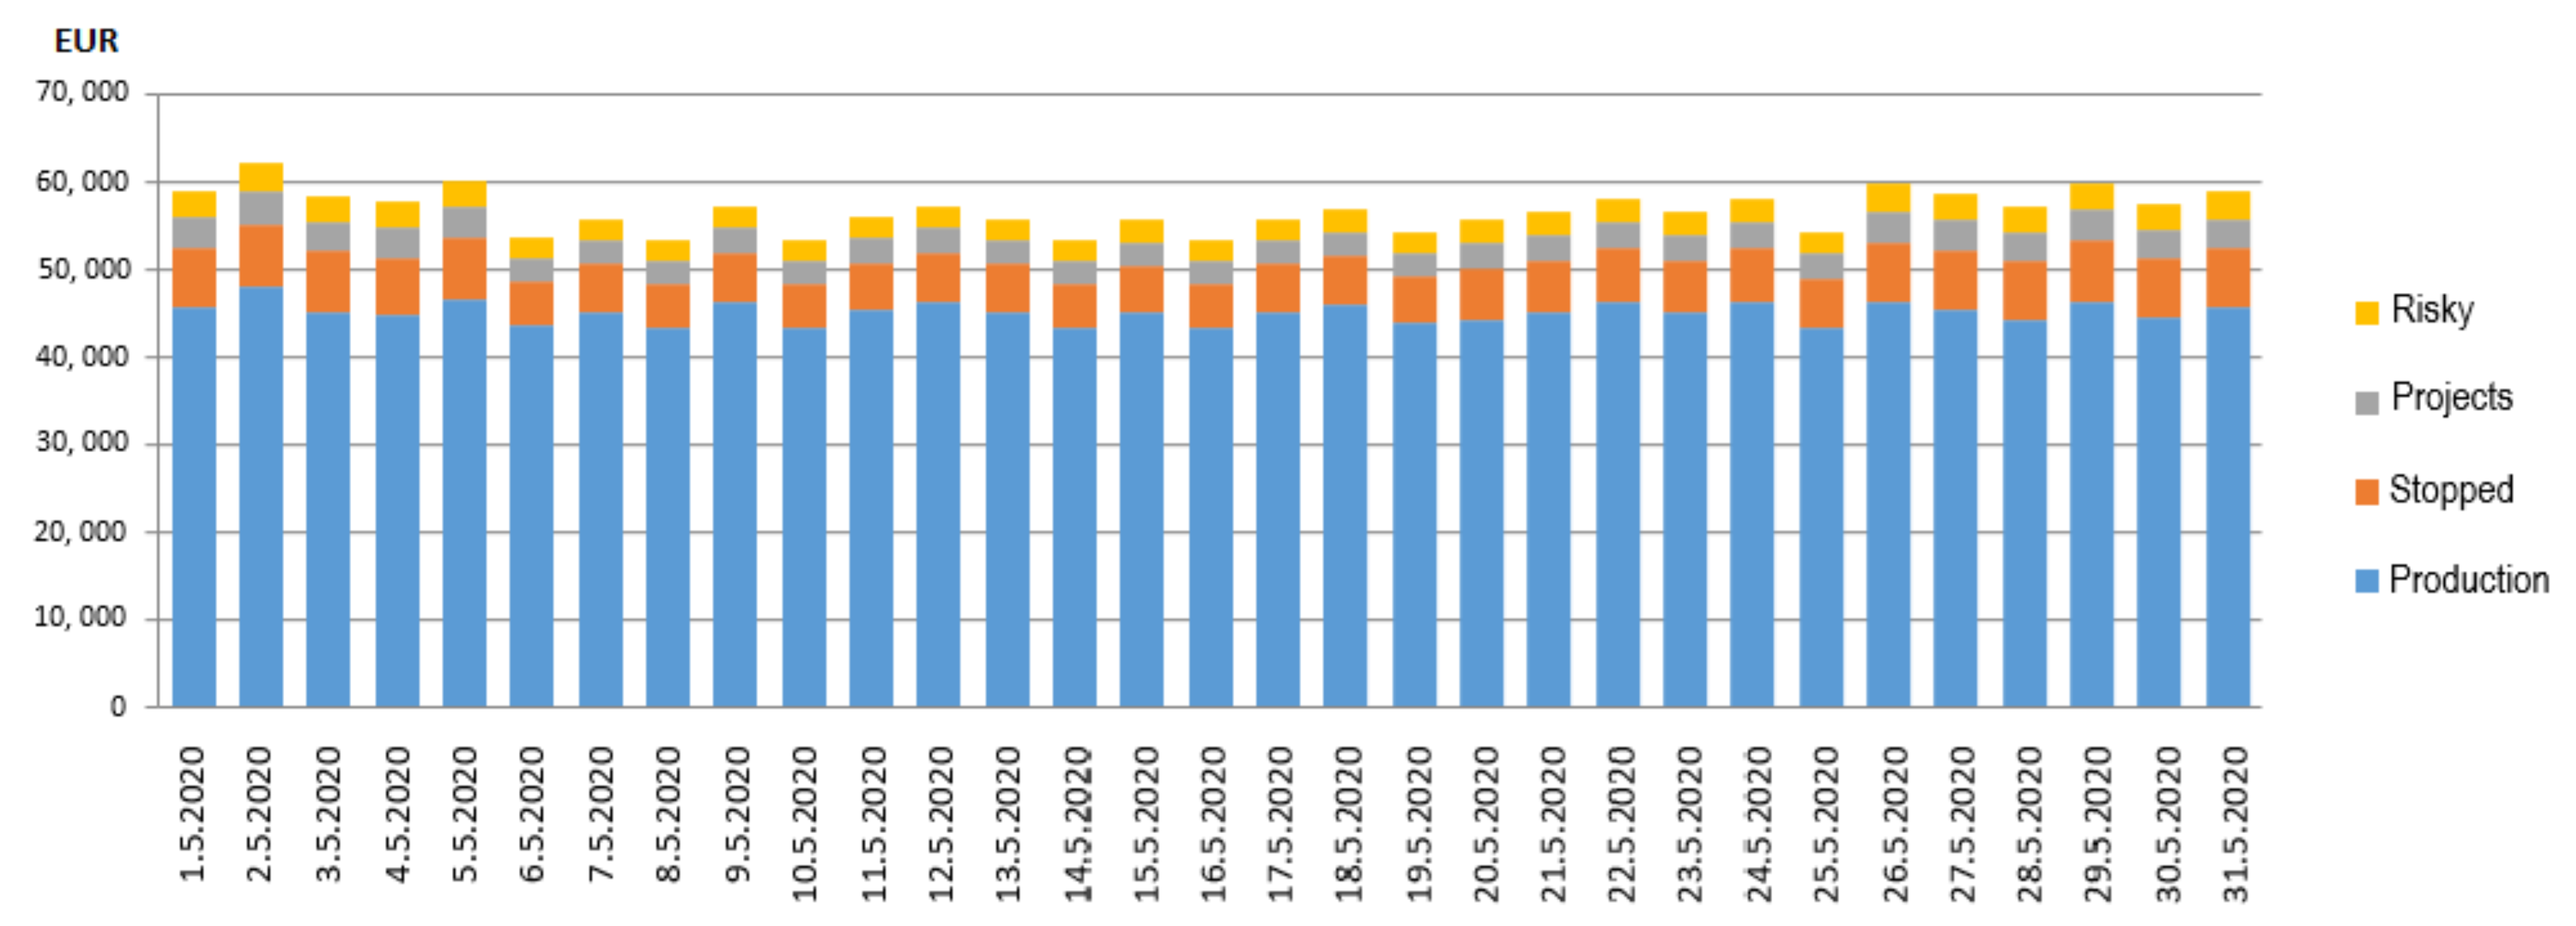
A problem in the supply chain at a particular supplier was identified based on an analysis of the state and changes in the stock of a particular component. The structure of stocks was analyzed in terms of their risk to the customer (Figure 4).
Inventories are divided into four groups depending on their risk to the company itself, which is their customer. Manufacturing components are materials that are directly involved in the manufacturing process. Suspended (stopped) components are materials whose quality characteristics must be approved by trained personnel from the quality department. Risky components are components that are no longer used in the production process, but their storage is contractually anchored in case of additional need. In cases of the development of new products, resp. selection of new suppliers, the share of stocks is oriented towards the so-called project components.
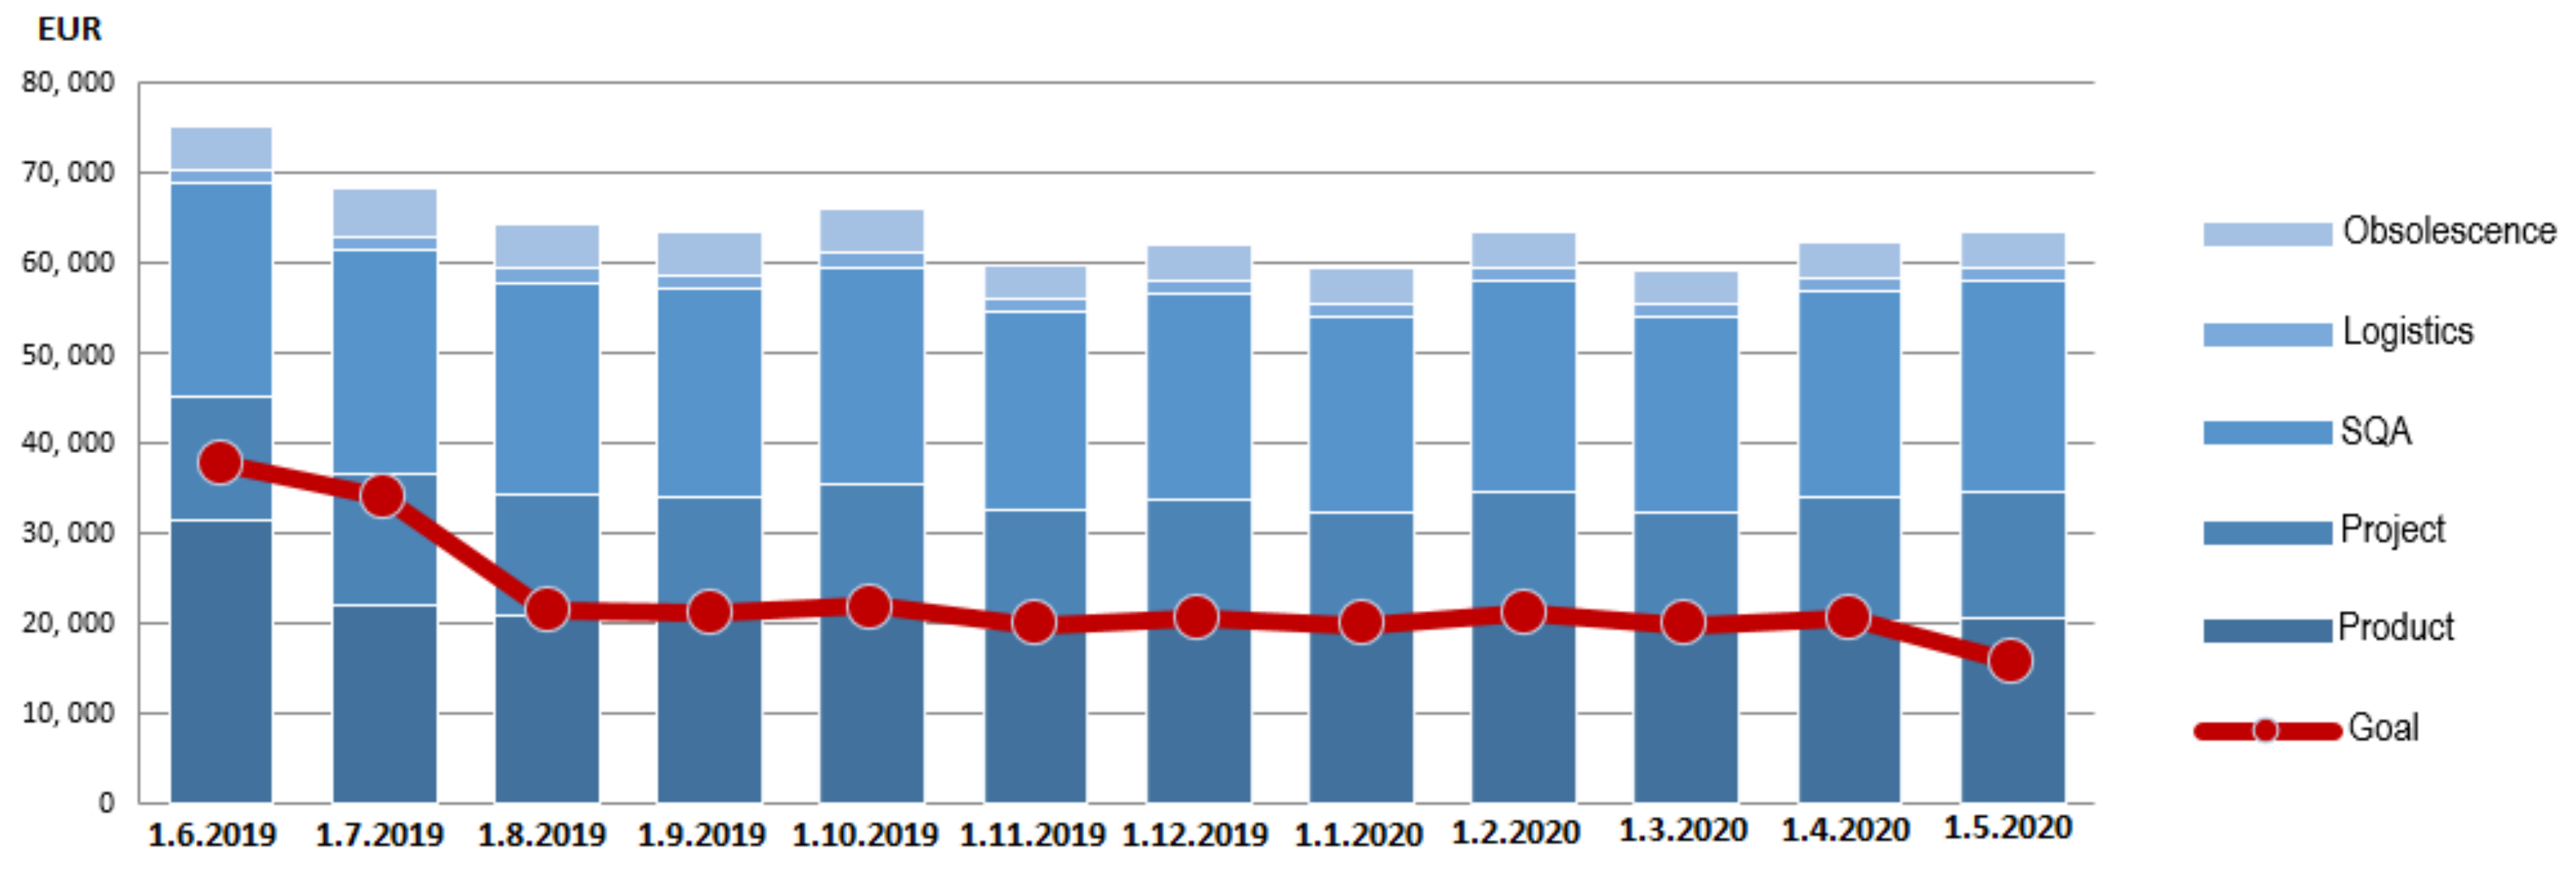
The problem regarding the supply chain in the company is the so-called “sorting”, caused by non-compliance of the delivered component with the quality requirements. In the context of the production process, production deficiencies arise in the form of products whose characteristics do not comply with quality requirements. Each component that does not meet the quality standards represents losses for the company. The individual types of losses that occur in the company are presented in the chart (Figure 5).
Losses were identified in five areas. The totals exceed the planned loss from poor quality, which is marked as a target in the chart: the target value of the loss from poor quality. The biggest loss is generated by the products themselves, which is largely due to the poor quality of component supplies. From the analysis of losses caused by poor quality, our research plan, which focuses on optimizing the supply of components of one type, has turned out.
The big problem of the company is the shortcomings in the area of satisfying customer needs in terms of fulfilling deliveries. System errors only indicate the reaction time when changes (expenditure, receipt) are registered in the information system, while the goods have already been physically issued, resp. received at the customer’s warehouse.
The question of the selection of suppliers and the ratio of their deliveries is a very important decision in the company’s system. It affects not only the activities of the company itself and its outputs but also customer relations and the very competitiveness of the company. At present, the customer determines not only who will supply the company’s components but also to what extent. Therefore, it is also very important from the point of view of the company to rationally justify why the ratio between deliveries from suppliers should be adjusted and what improvements can be achieved from the given adjustment. The model of optimizing the supply risk from individual suppliers will allow for the optimization of the company’s risk, reduce losses, justify the choice of suppliers and the ratio of deliveries to customers, and allow for the prediction of future market developments and simulation of different supply variants.
3.3. Methodology for Optimalization of the Supplier’s Delivery
Every company that is part of the automotive industry has its suppliers carefully selected based on several requirements. The highest emphasis is placed on quality and, due to the use of Just in Time supply, also on the timeliness of deliveries [36,37]. Together with the price of components, these indicators are among the most important factors in the selection of suppliers. However, it often happens that due to cheap labor and low price of components, these suppliers are also selected from remote countries, which increases the length of shipping time and shortens the ordering point. In this context, compared to suppliers from neighboring countries, there are additional risks associated with the transport and handling of products. This is why it is important to consider whether the company is willing to accept these risks [38,39]. Usually, there are more suppliers in the company, and for each component, the distribution of orders is anchored in the contract, while the share of deliveries is indicated in suppliers by the percentage. In practice, this means that the supply of one production component can be involved (e.g., three suppliers in a ratio of 40:20:40). The distribution of these ratios is mainly influenced by the price, quality, transport and storage requirements, etc. Occasionally, there are situations where companies have only one supplier of a specific production component, as they are not willing to contract with other suppliers for various reasons.
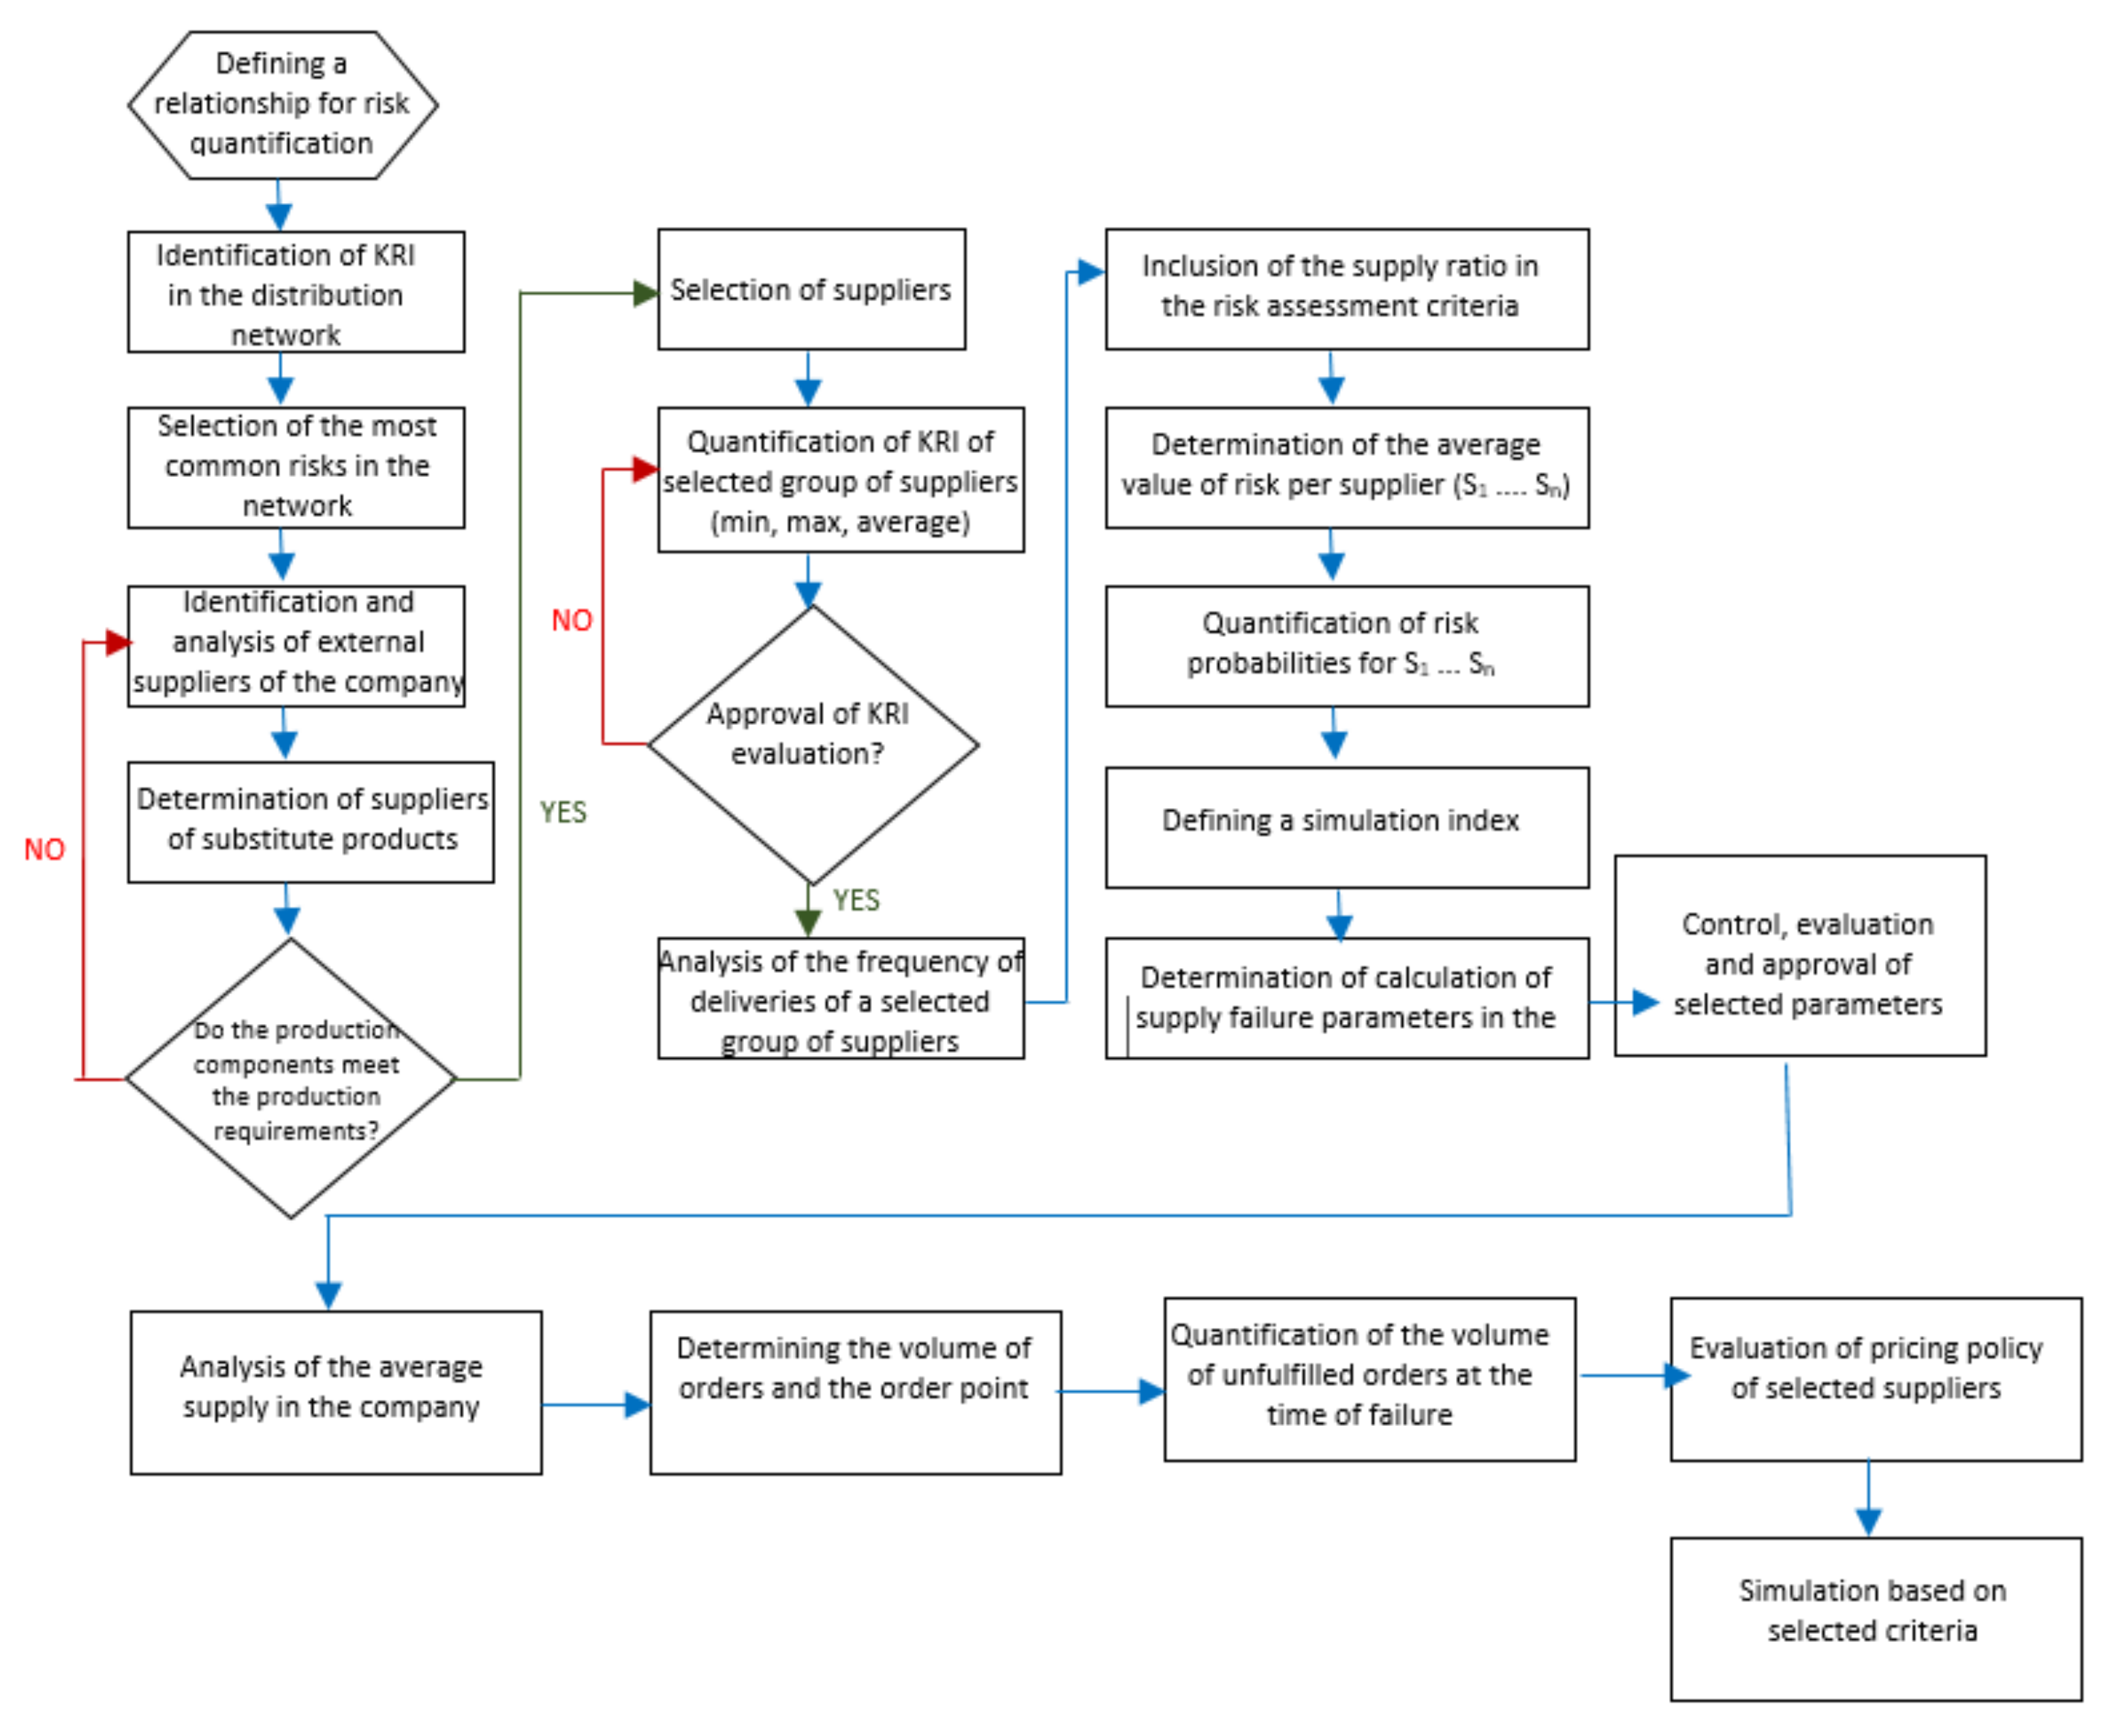
The aim of the model we have proposed is to point out the benefits of sharing suppliers in the network. An algorithm for model design was built for an efficient procedure in model design and verification. The algorithm is compiled in the form of steps, which are carried out sequentially, shown in Figure 6, as follows.
The design of the model is sequenced into individual steps, which follow each other. The design of the model began by identifying the problem and identifying the most common risks that accompany the component delivery process. The next steps of the algorithm are associated with the selection of suppliers and the identification of key risk indicators that assess the riskiness of suppliers. Subsequently, the individual risks for specific suppliers are quantified, and other parameters necessary for simulating the deliveries of a specific component from selected suppliers are determined. Finally, the simulations are performed according to the specified requirements, and a decision is made on the optimal ratio of deliveries from individual suppliers.
4. Results
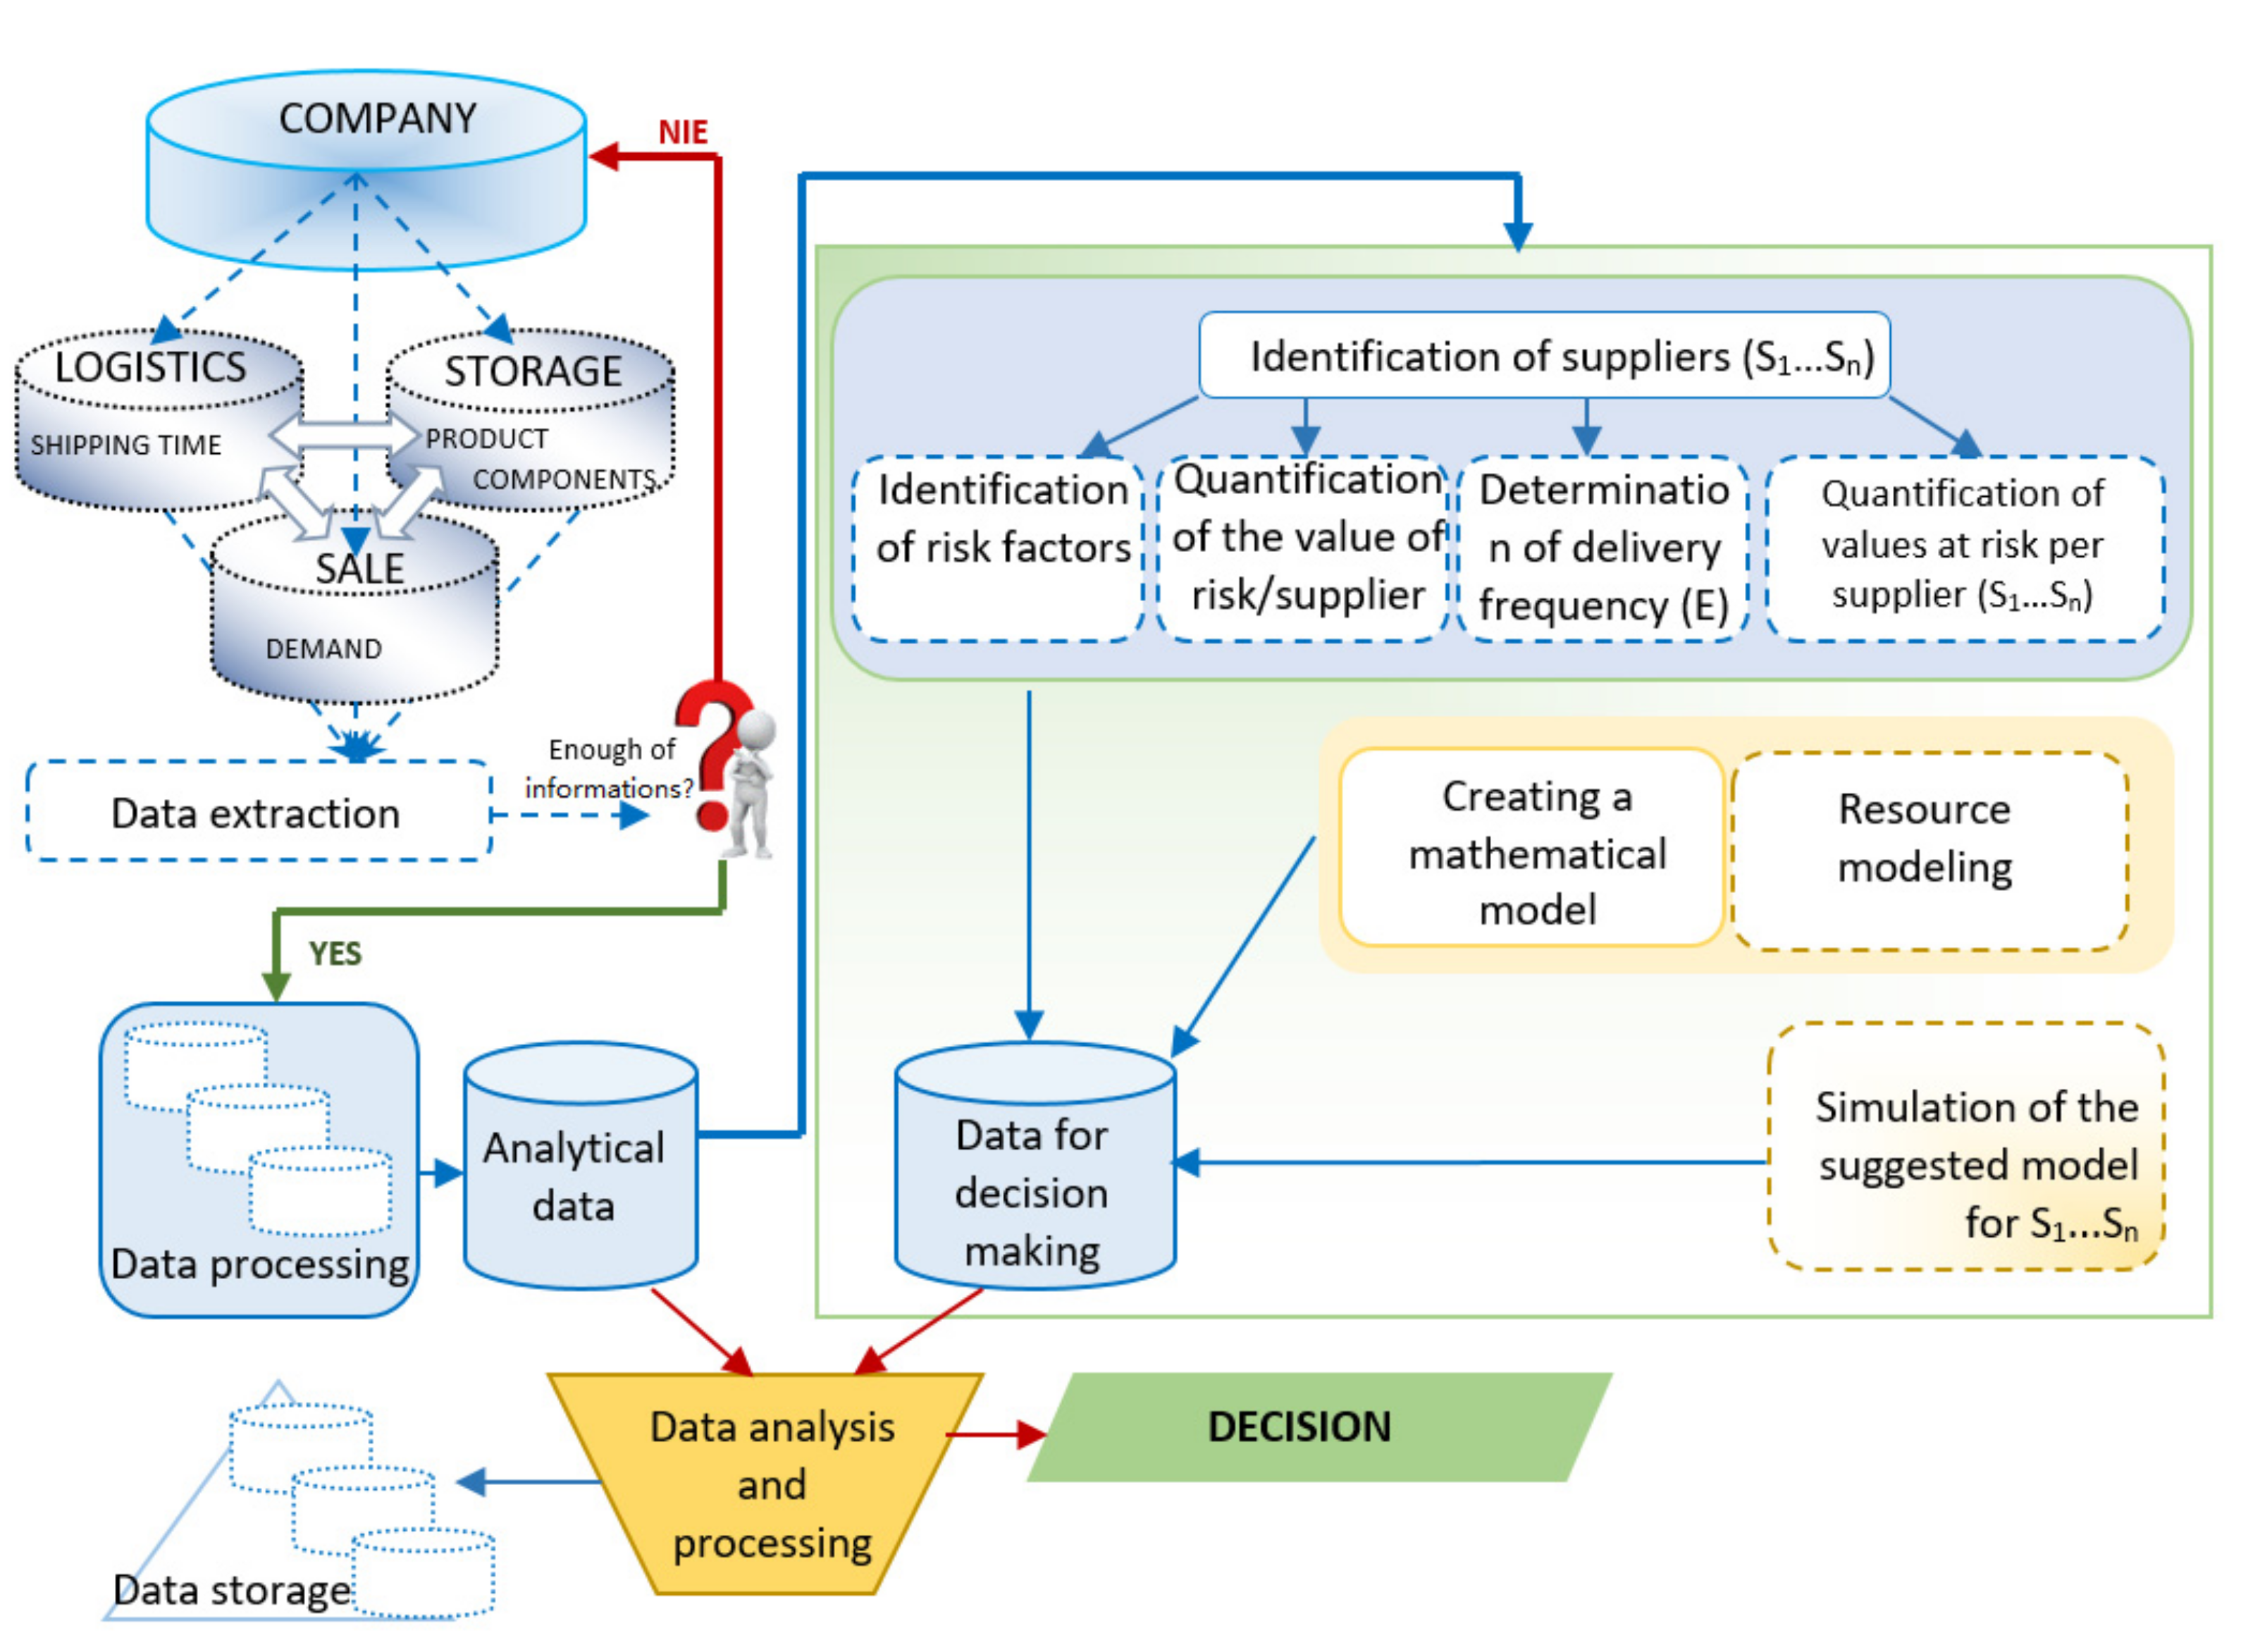
Based on the analysis of the current state of the Slovak automotive industry and its distribution network, a problem was identified, which became the subject of this research. The design of the management model of the supply chain (Figure 7) was focused on the analysis of the possibilities of optimizing the ratio of the supplies between the company’s suppliers, especially in the Slovak automotive industry. The model is evaluated as an innovative project, aimed towards optimizing the supply chain to balance the level of risk between suppliers by using the adjustment of the supply ratio.
The model for optimizing the ratio of a company’s suppliers in the Slovak automotive industry can be divided into different areas. The first area of the model is focused on the identification and collection of data about the company, its logistics system; its storage system; and product sales, which are linked to product quality. After obtaining the necessary data, the data are analyzed and evaluated, and a decision is and on the next step. If no final decision is made on the basis of the analysis of the available data, data are obtained for the subsequent decision-making process. The decision-making process is connected with the selection of suppliers of a specific component and the determination of the ratio of deliveries from individual suppliers. This decision-making process is the very essence of the whole model. As part of the decision-making process, individual suppliers of a particular component are identified. Suppliers are referred to as Supplier 1, Supplier 2, and so on. Risk factors are identified for each supplier, which are then quantified. All the necessary parameters for creating a mathematical model of deliveries of individual suppliers is determined. Subsequently, the supply is simulated. The results of individual simulations are evaluated from several predefined perspectives. This provides data for the final decision on the distribution of supplies between the suppliers of a particular component. The model can be created for different combinations of suppliers with different risk parameters. Repeated simulations and their subsequent comparison make it possible to optimize the final decision on deliveries.
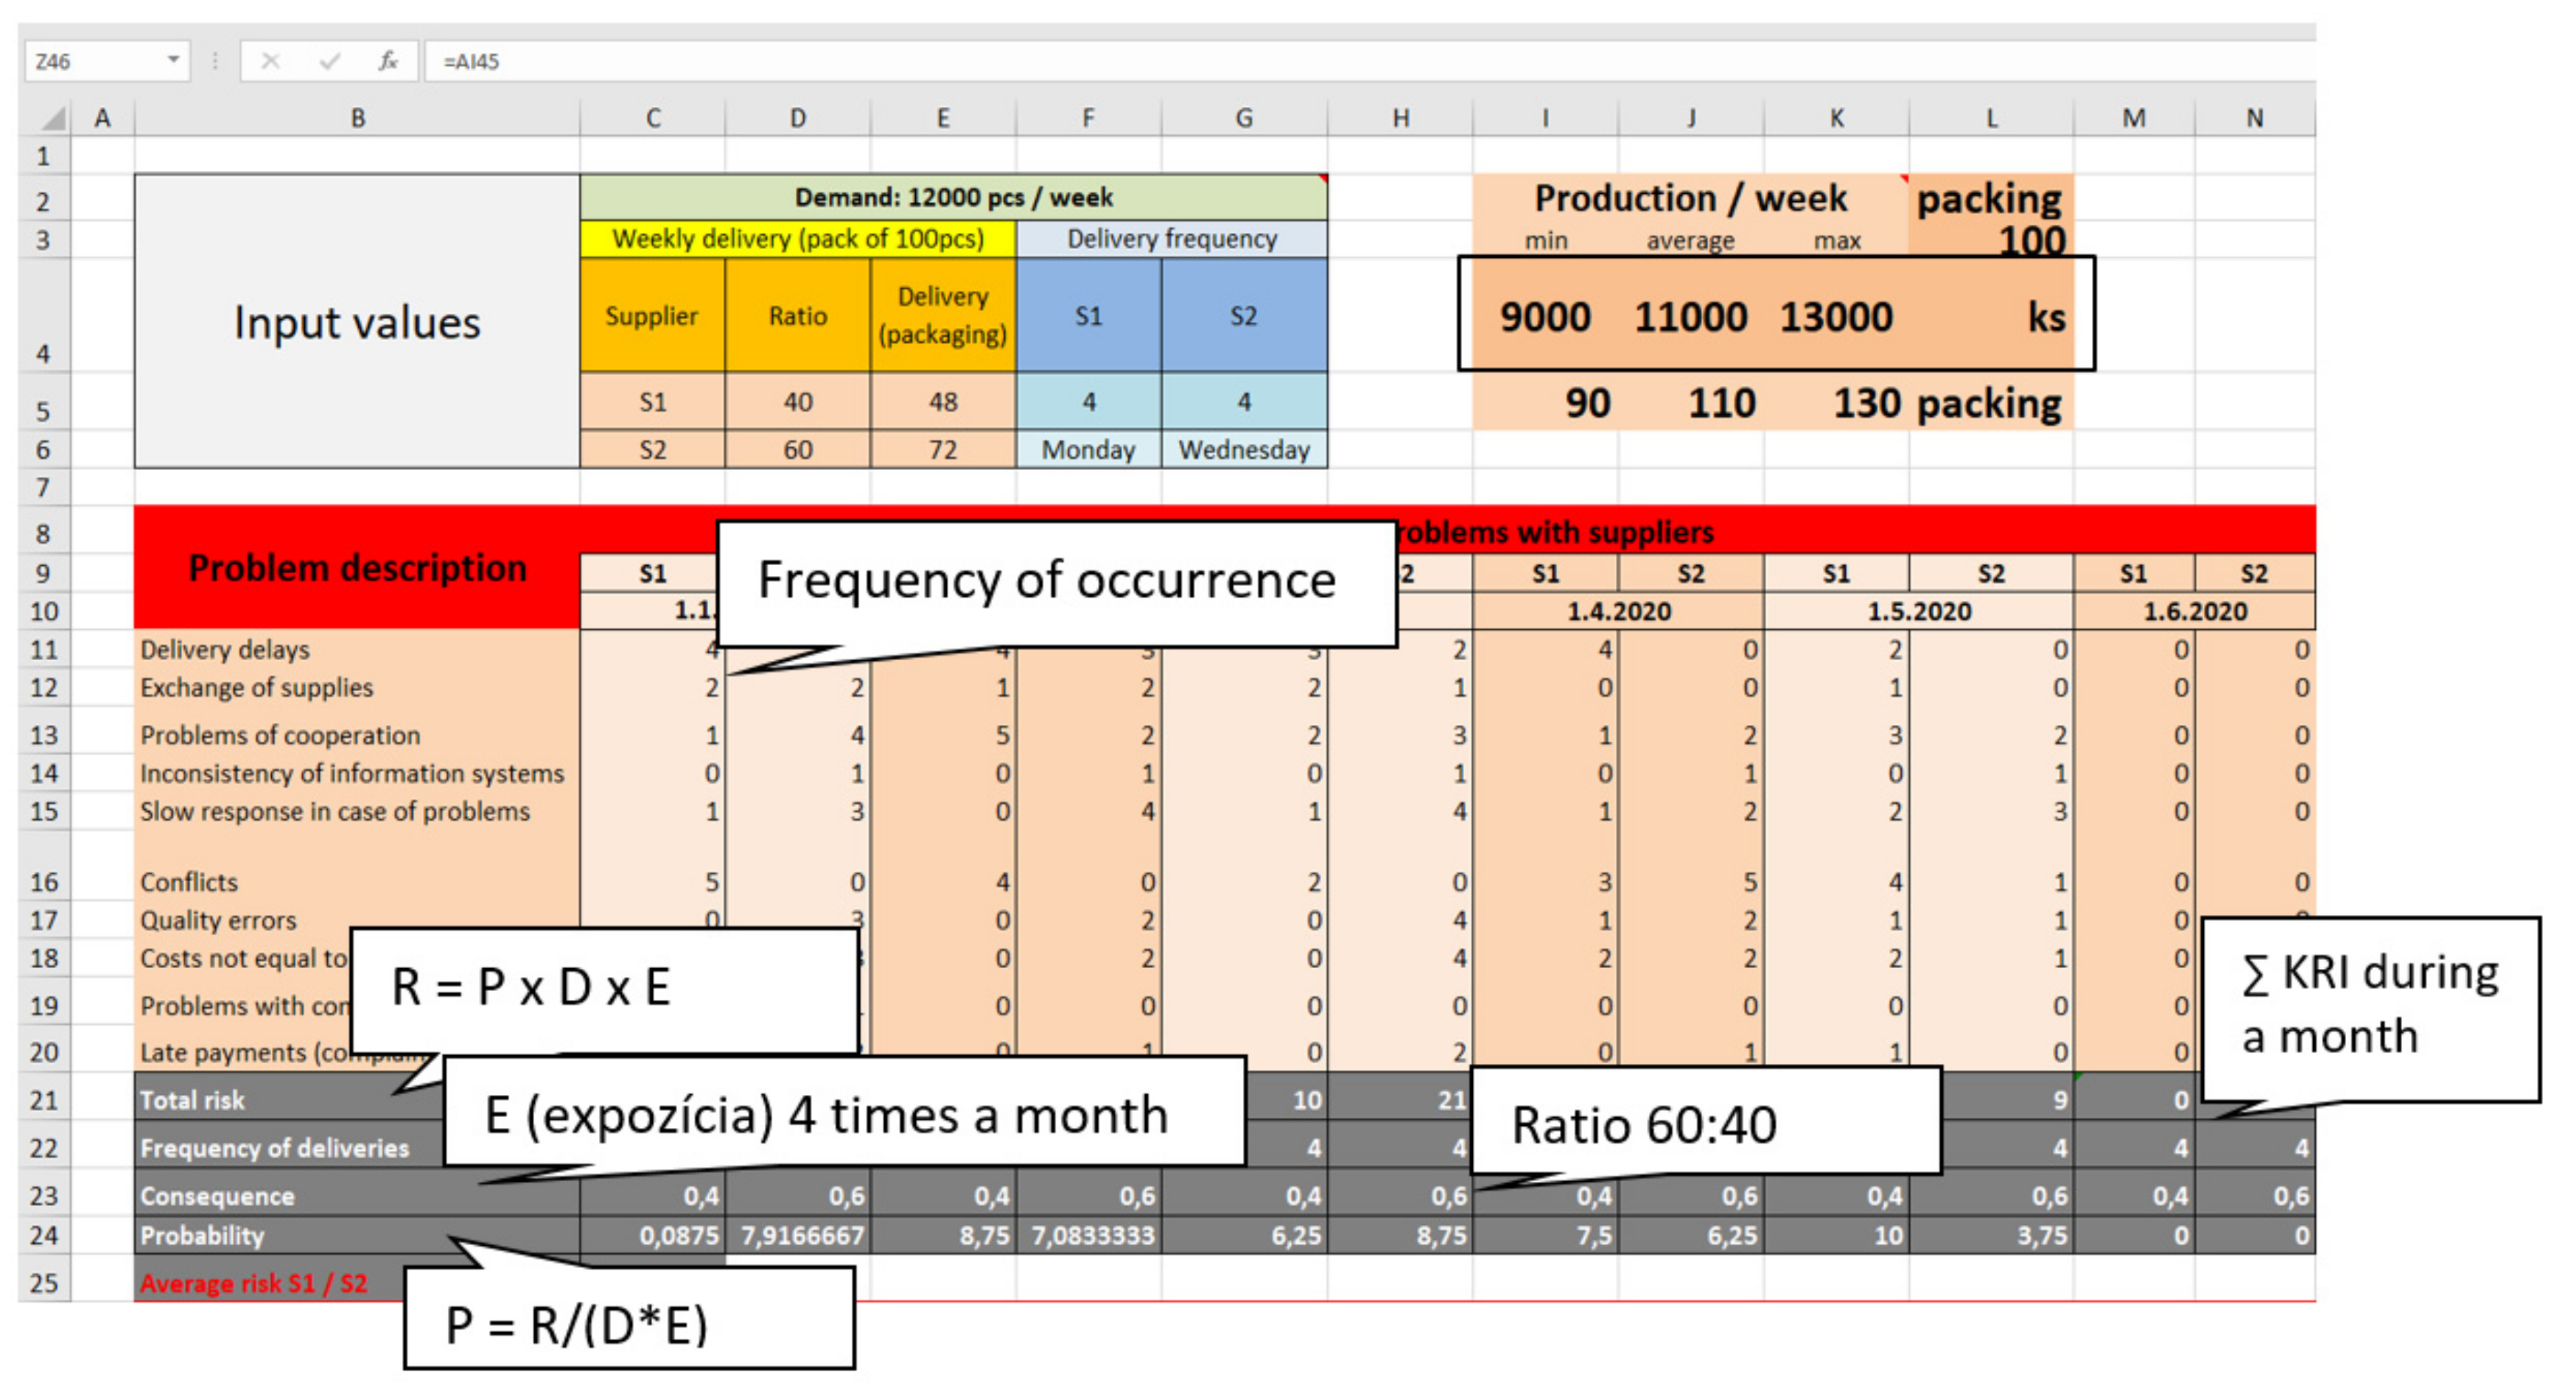
The model of optimization of the distribution of suppliers was evaluated using the mathematical functions of MS Excel, while its form took the following form (Figure 8). The sequence of steps in creating the model followed the suggested algorithm for creating the model.
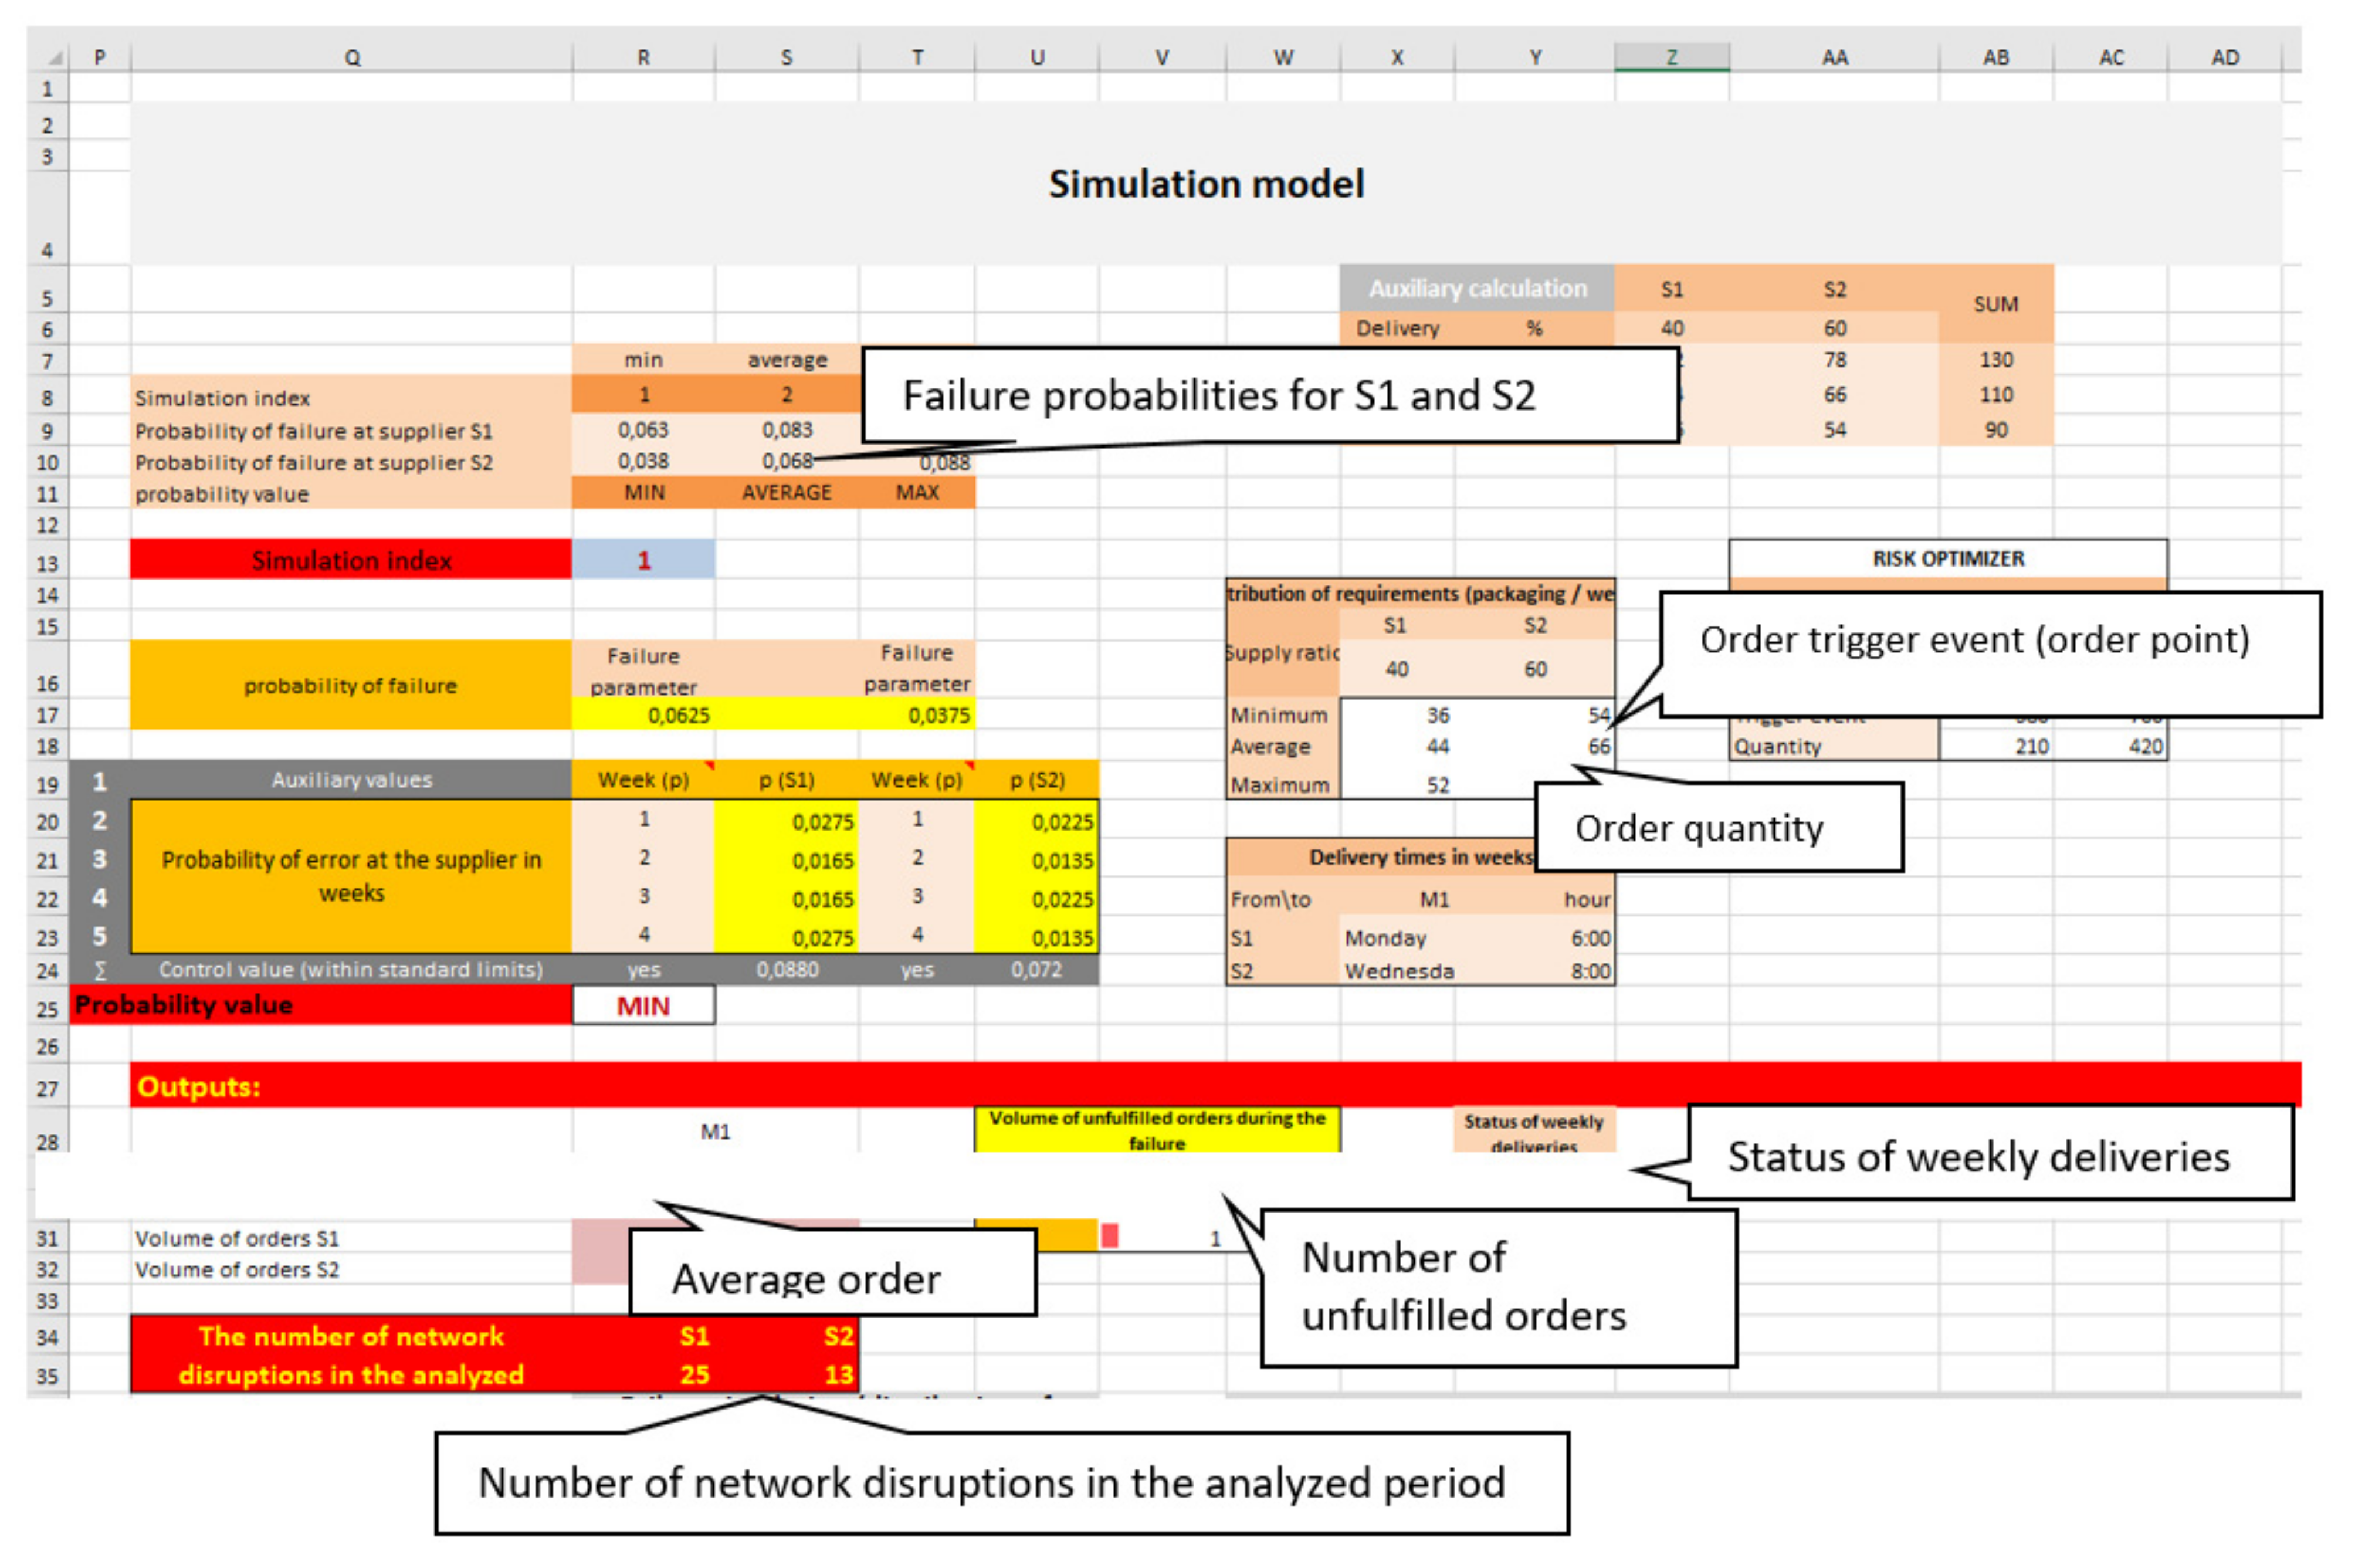
When evaluating the distribution of deliveries from suppliers, two suppliers with a delivery ratio of 60:40 were assessed. The average weekly consumption of components for 10 production lines operating in three-shift operation is 1200 packages, while one package contains 100 pieces of components. For simulations, parameters were set for suppliers S1 and S2 (Supplier 1, Supplier 2). Based on the determining factors, the frequency of occurrence of individual problems in the chain during the five-month analyzed period was analyzed (January–May 2020). The simulation index indicates which simulation is currently in progress (Figure 9).
The above analysis shows that the probability of a shortage of stocks is very low for supplier S2. However, if such an unexpected situation arises, the level of the shortage could be very critical for the company compared to the S1 supplier. This model is a reference model for managing the ratio of supplies from suppliers, and it is up to the company and customers to decide how to use the results to their advantage.
5. Discussion
In the process of verifying the proposed model, @Risk from Palisade Corporation became the recommended software, as it has a very useful tool called RiskOptimiser, which is very important for verifying the optimal distribution ratio of suppliers in the supply chain.
The simulation verified the proposed ratio of distribution of component deliveries between two suppliers. Suppliers are designated as Supplier 1 and Supplier 2. The suitability of the distribution of the supply ratio between suppliers in the ratio supplier S1/supplier S2—40:60 is verified. A longer time period of 180 weeks was set for the simulation of inventory deliveries in order to analyze the development of deliveries over a longer period of time and to show the influence of several risk factors affecting the deliveries of both suppliers. The simulation of deliveries over a longer period made it possible to (a) identify the potential risk of stock shortages at defined supply distribution values and (b) analyze the potential share of stock shortages. Lack of stocks would be related to a supply failure in the distribution network. Maximizing the volume of deliveries with a minimum number of deficiencies is considered a positive phenomenon. The minimization of the volume of deliveries while maximizing the number of deficiencies is considered a negative phenomenon.
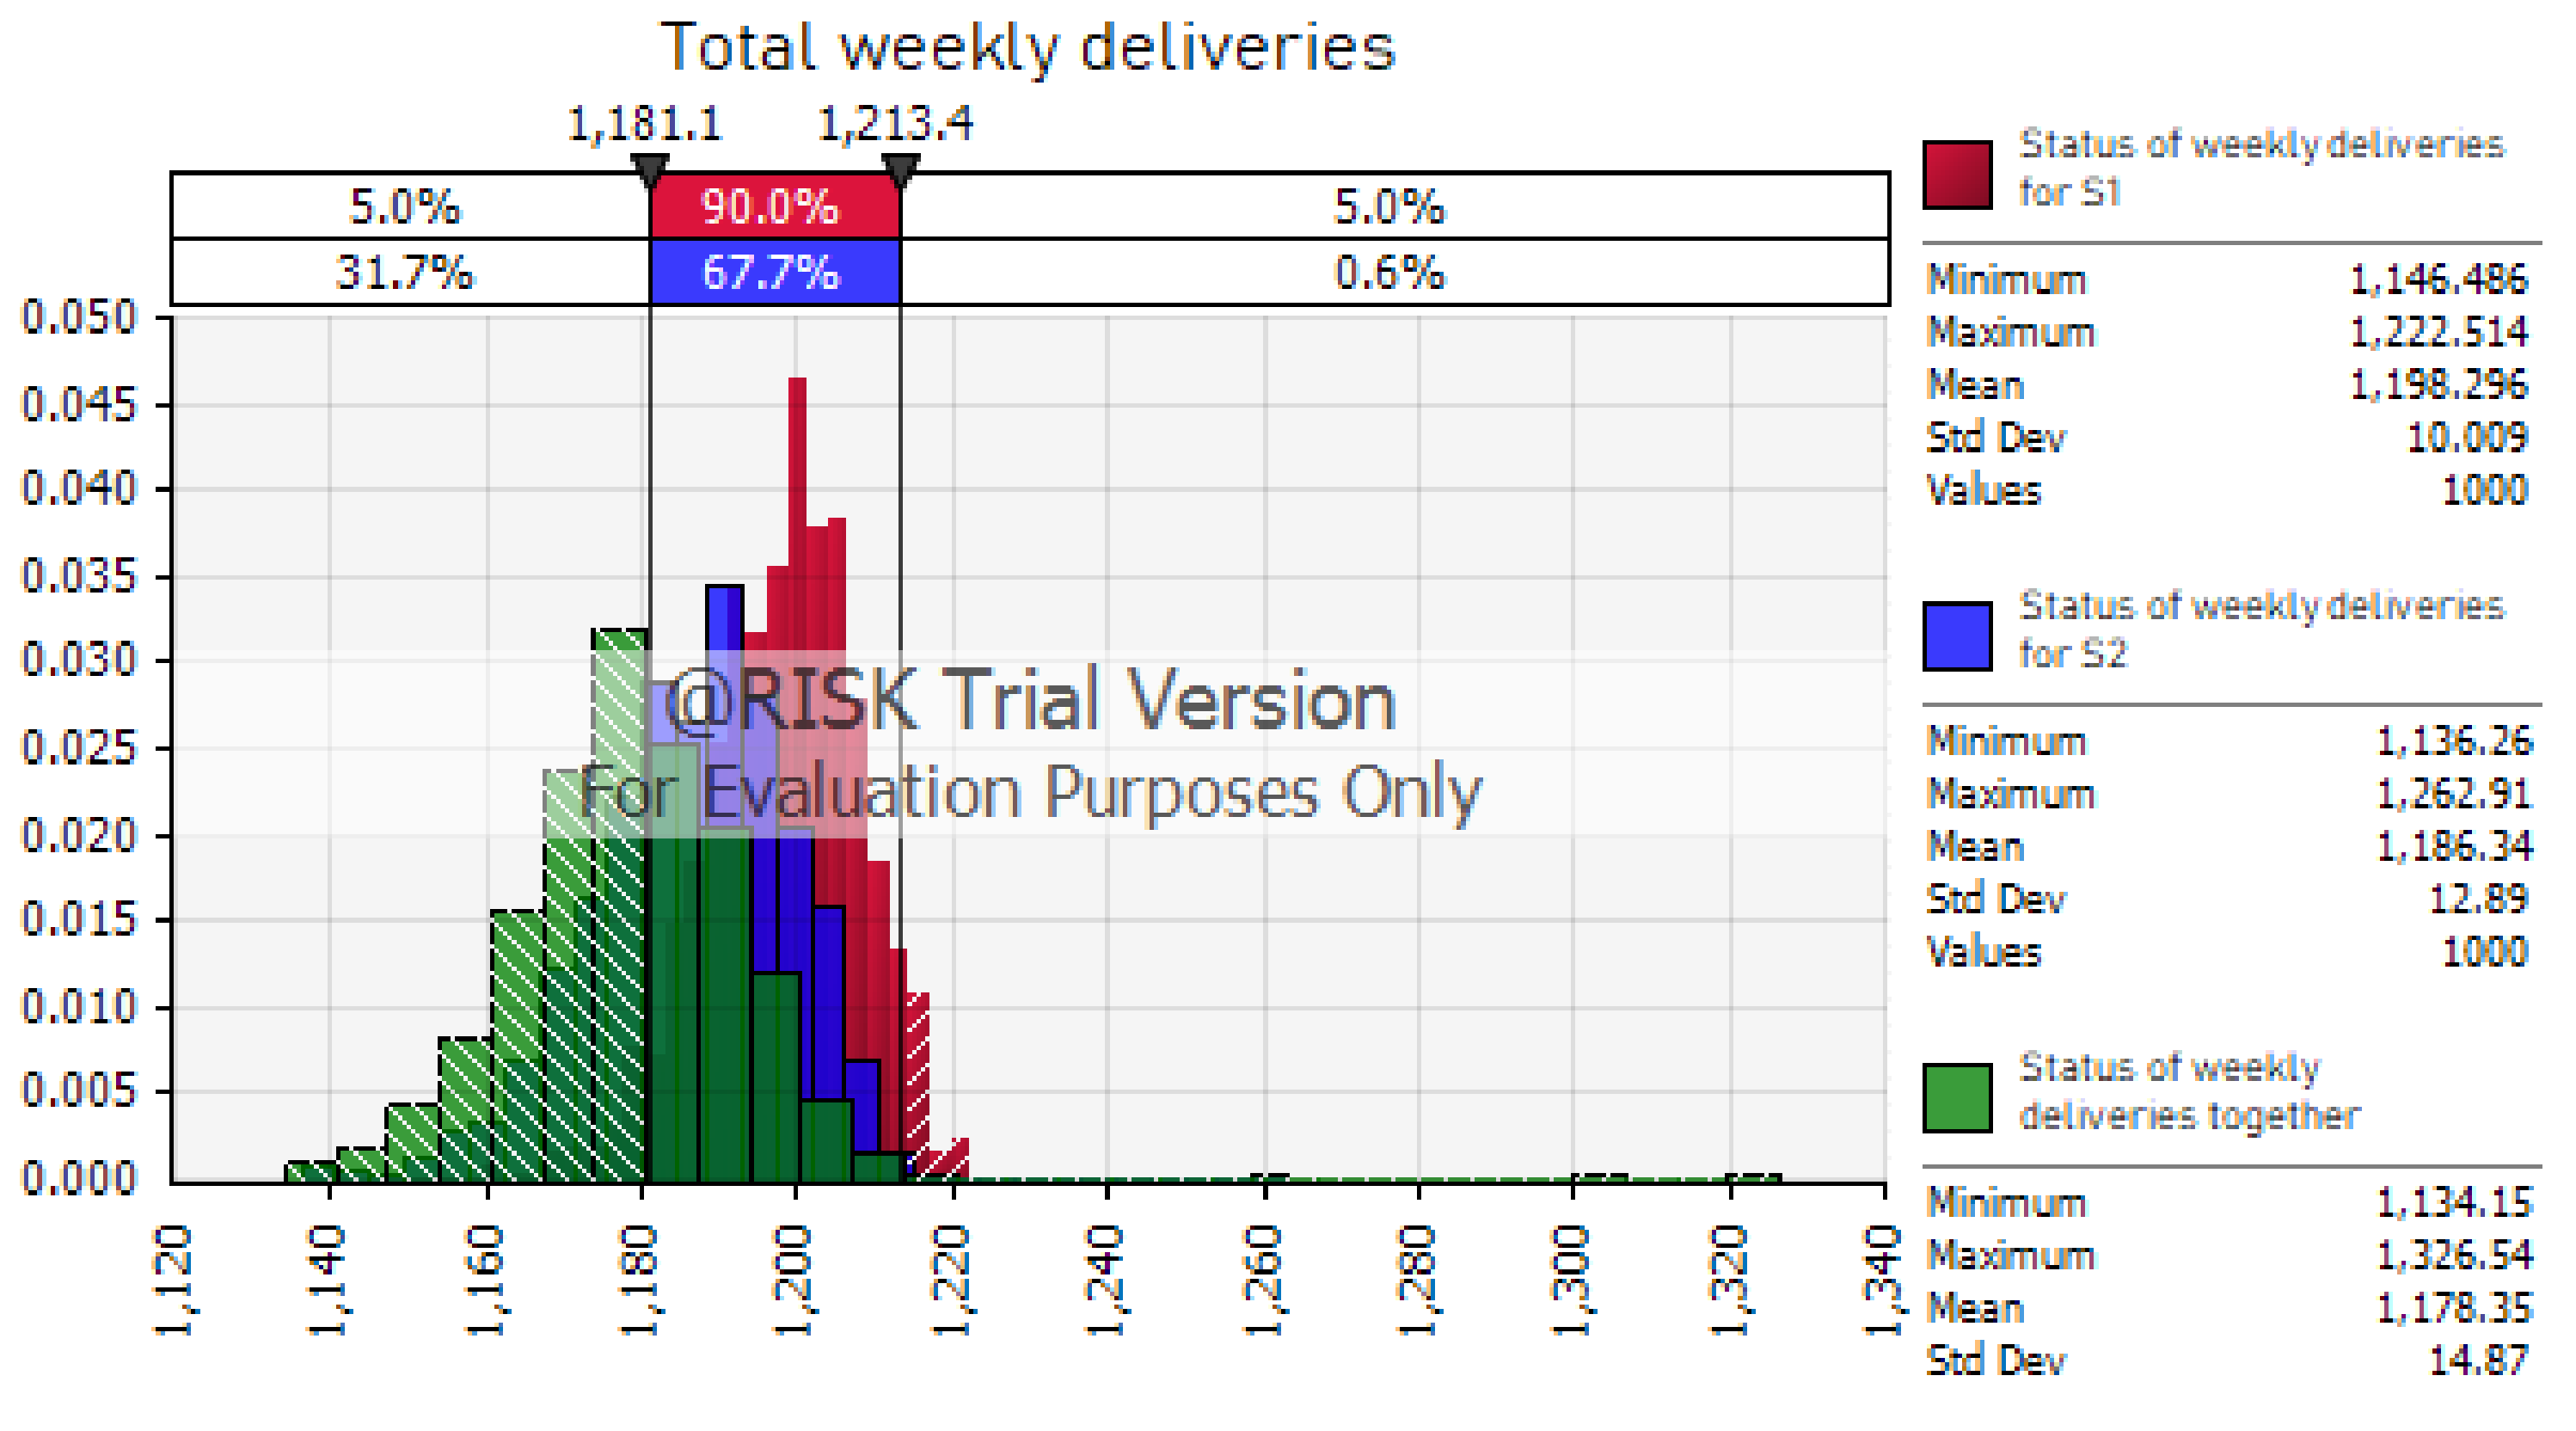
The simulation of component deliveries was performed separately for Supplier 1 and Supplier 2. Three simulations were performed for each supplier. The summary result of the simulation for both suppliers is shown in Figure 10.
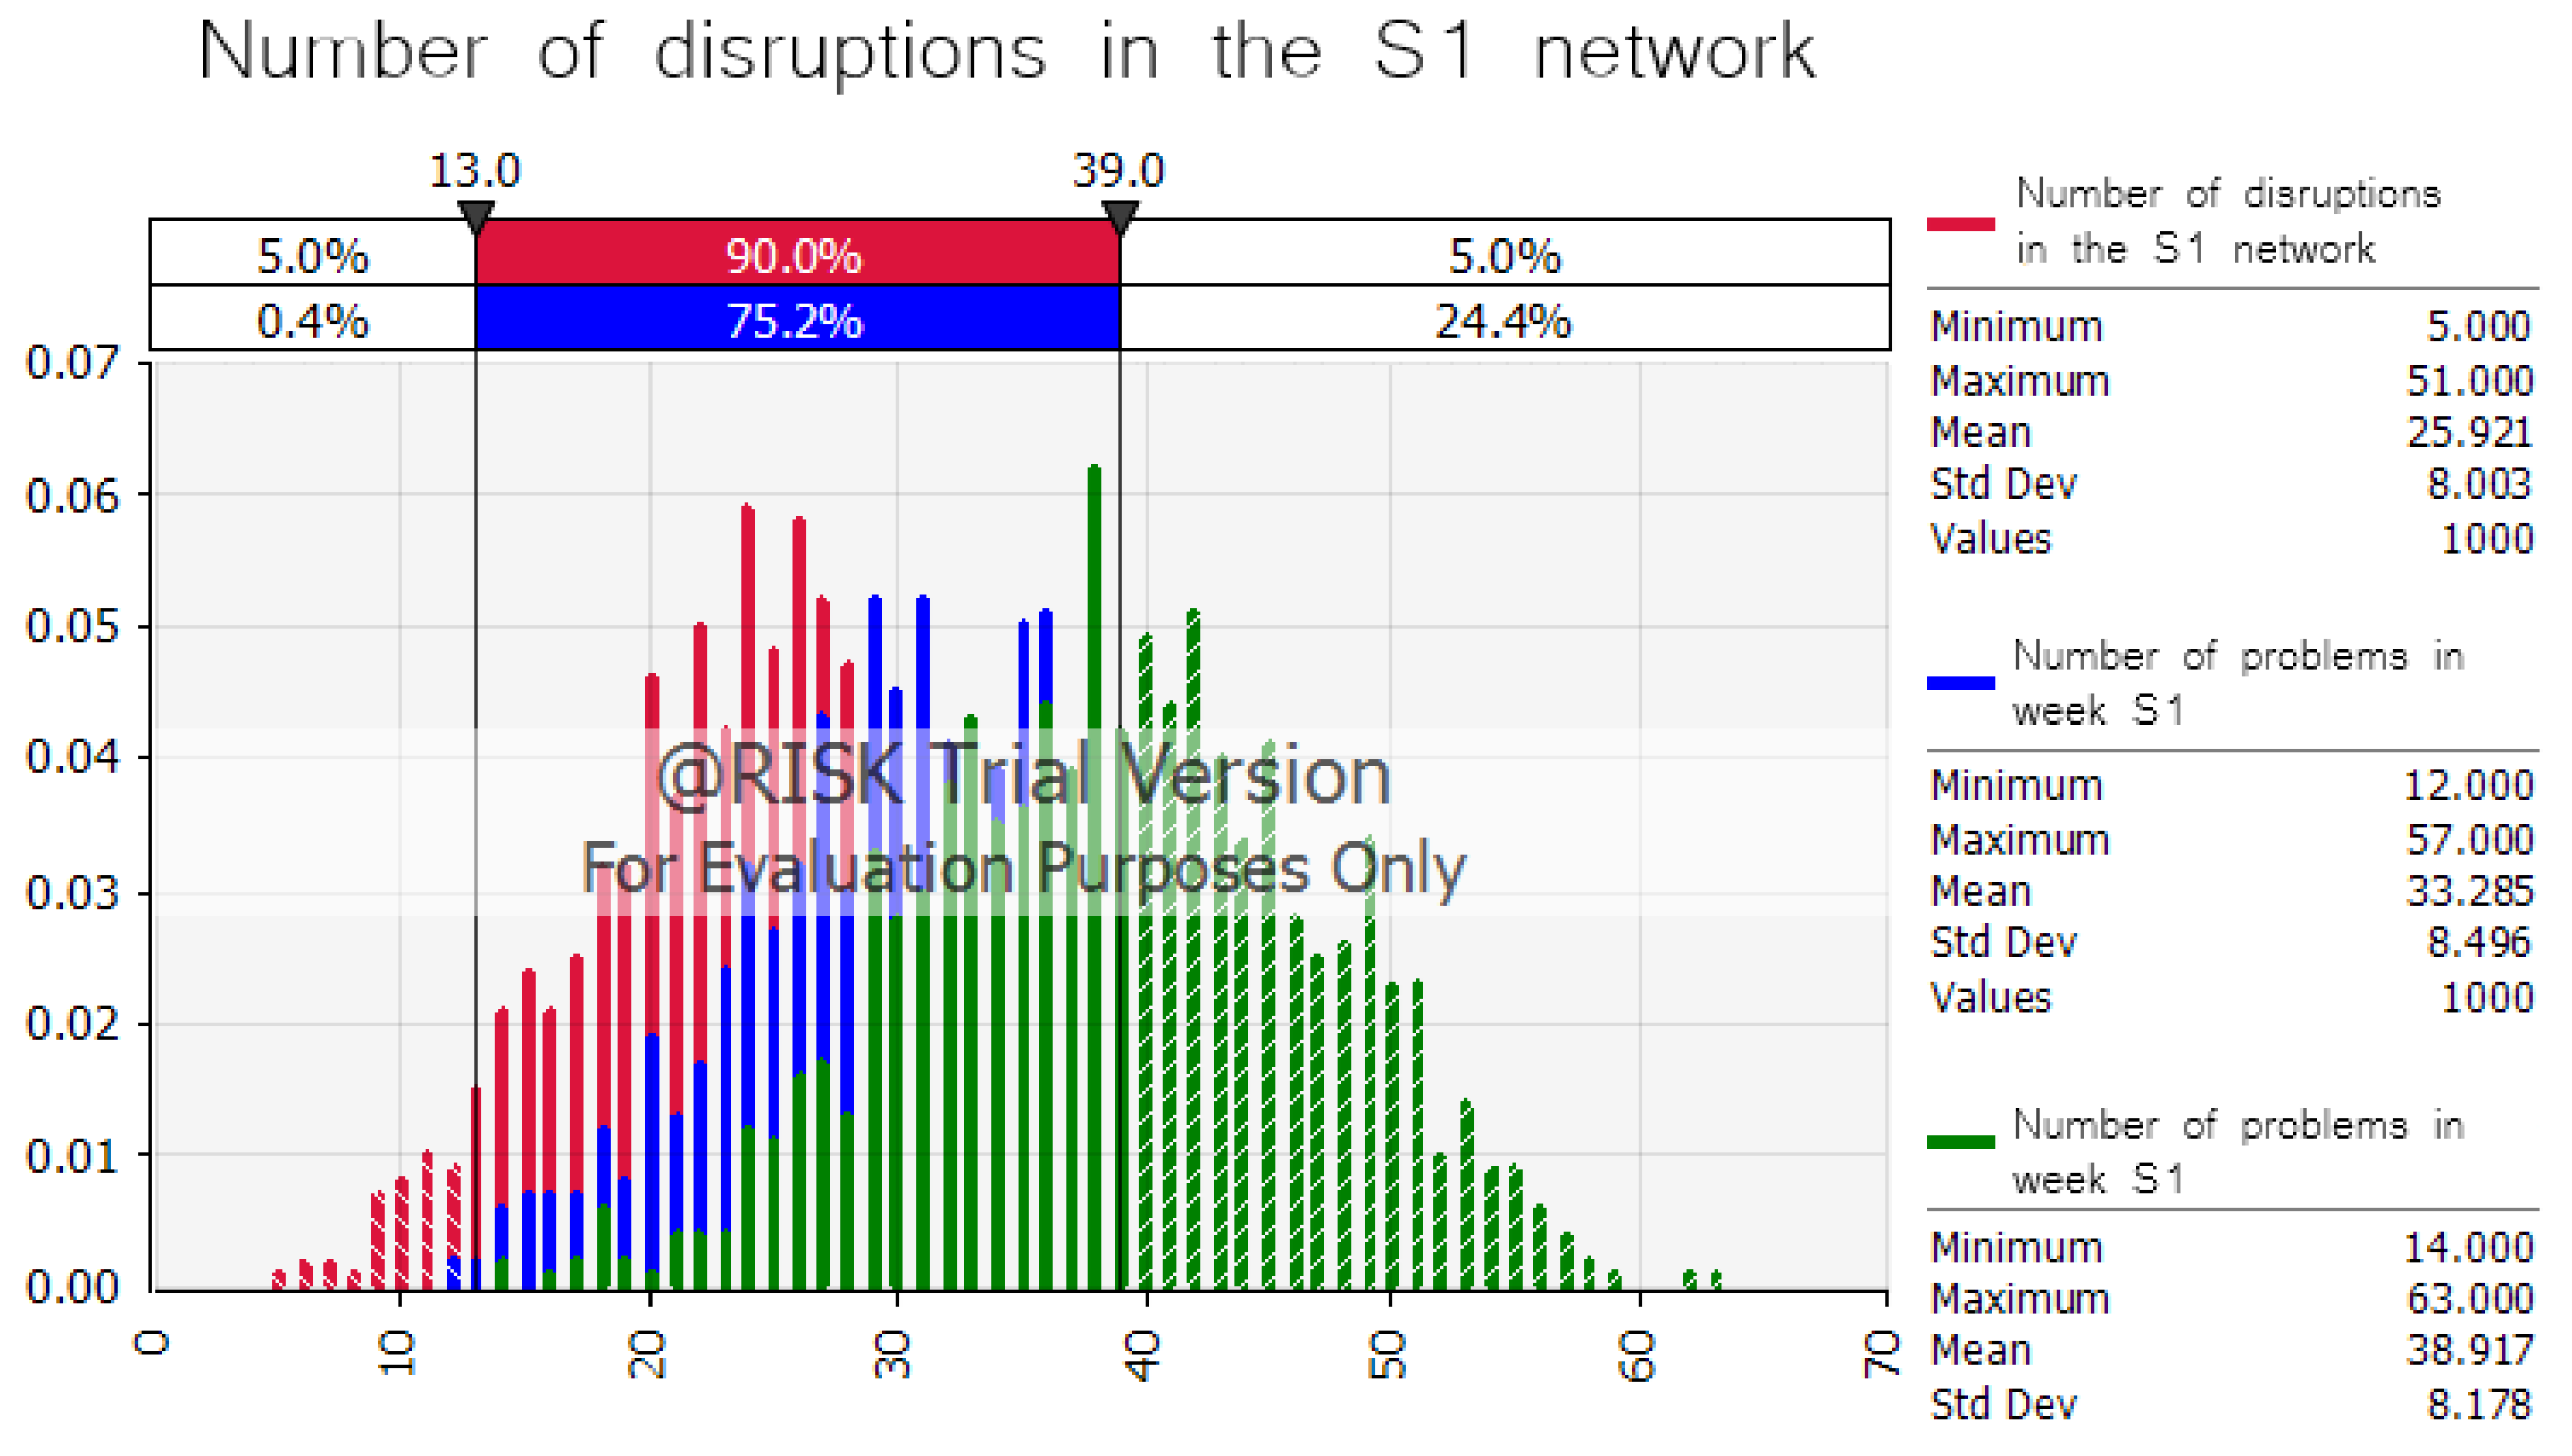
Based on the results of the simulation, it can be stated that the proposed ratio of component deliveries by suppliers in the ratio of 40:60 is suitably set. Deliveries of components should be stable and low-risk. Further simulations were performed for a more detailed analysis of the course and risk of deliveries. In the next step, possible supply disruptions in the distribution channel were analyzed. The number of supply disruptions in the analyzed period is taken into account in the model-proposed key risk indicators (KRI). Simulations of component supply disruptions were performed separately for each supplier. Figure 11 shows simulations of supply disruptions for Supplier 1.
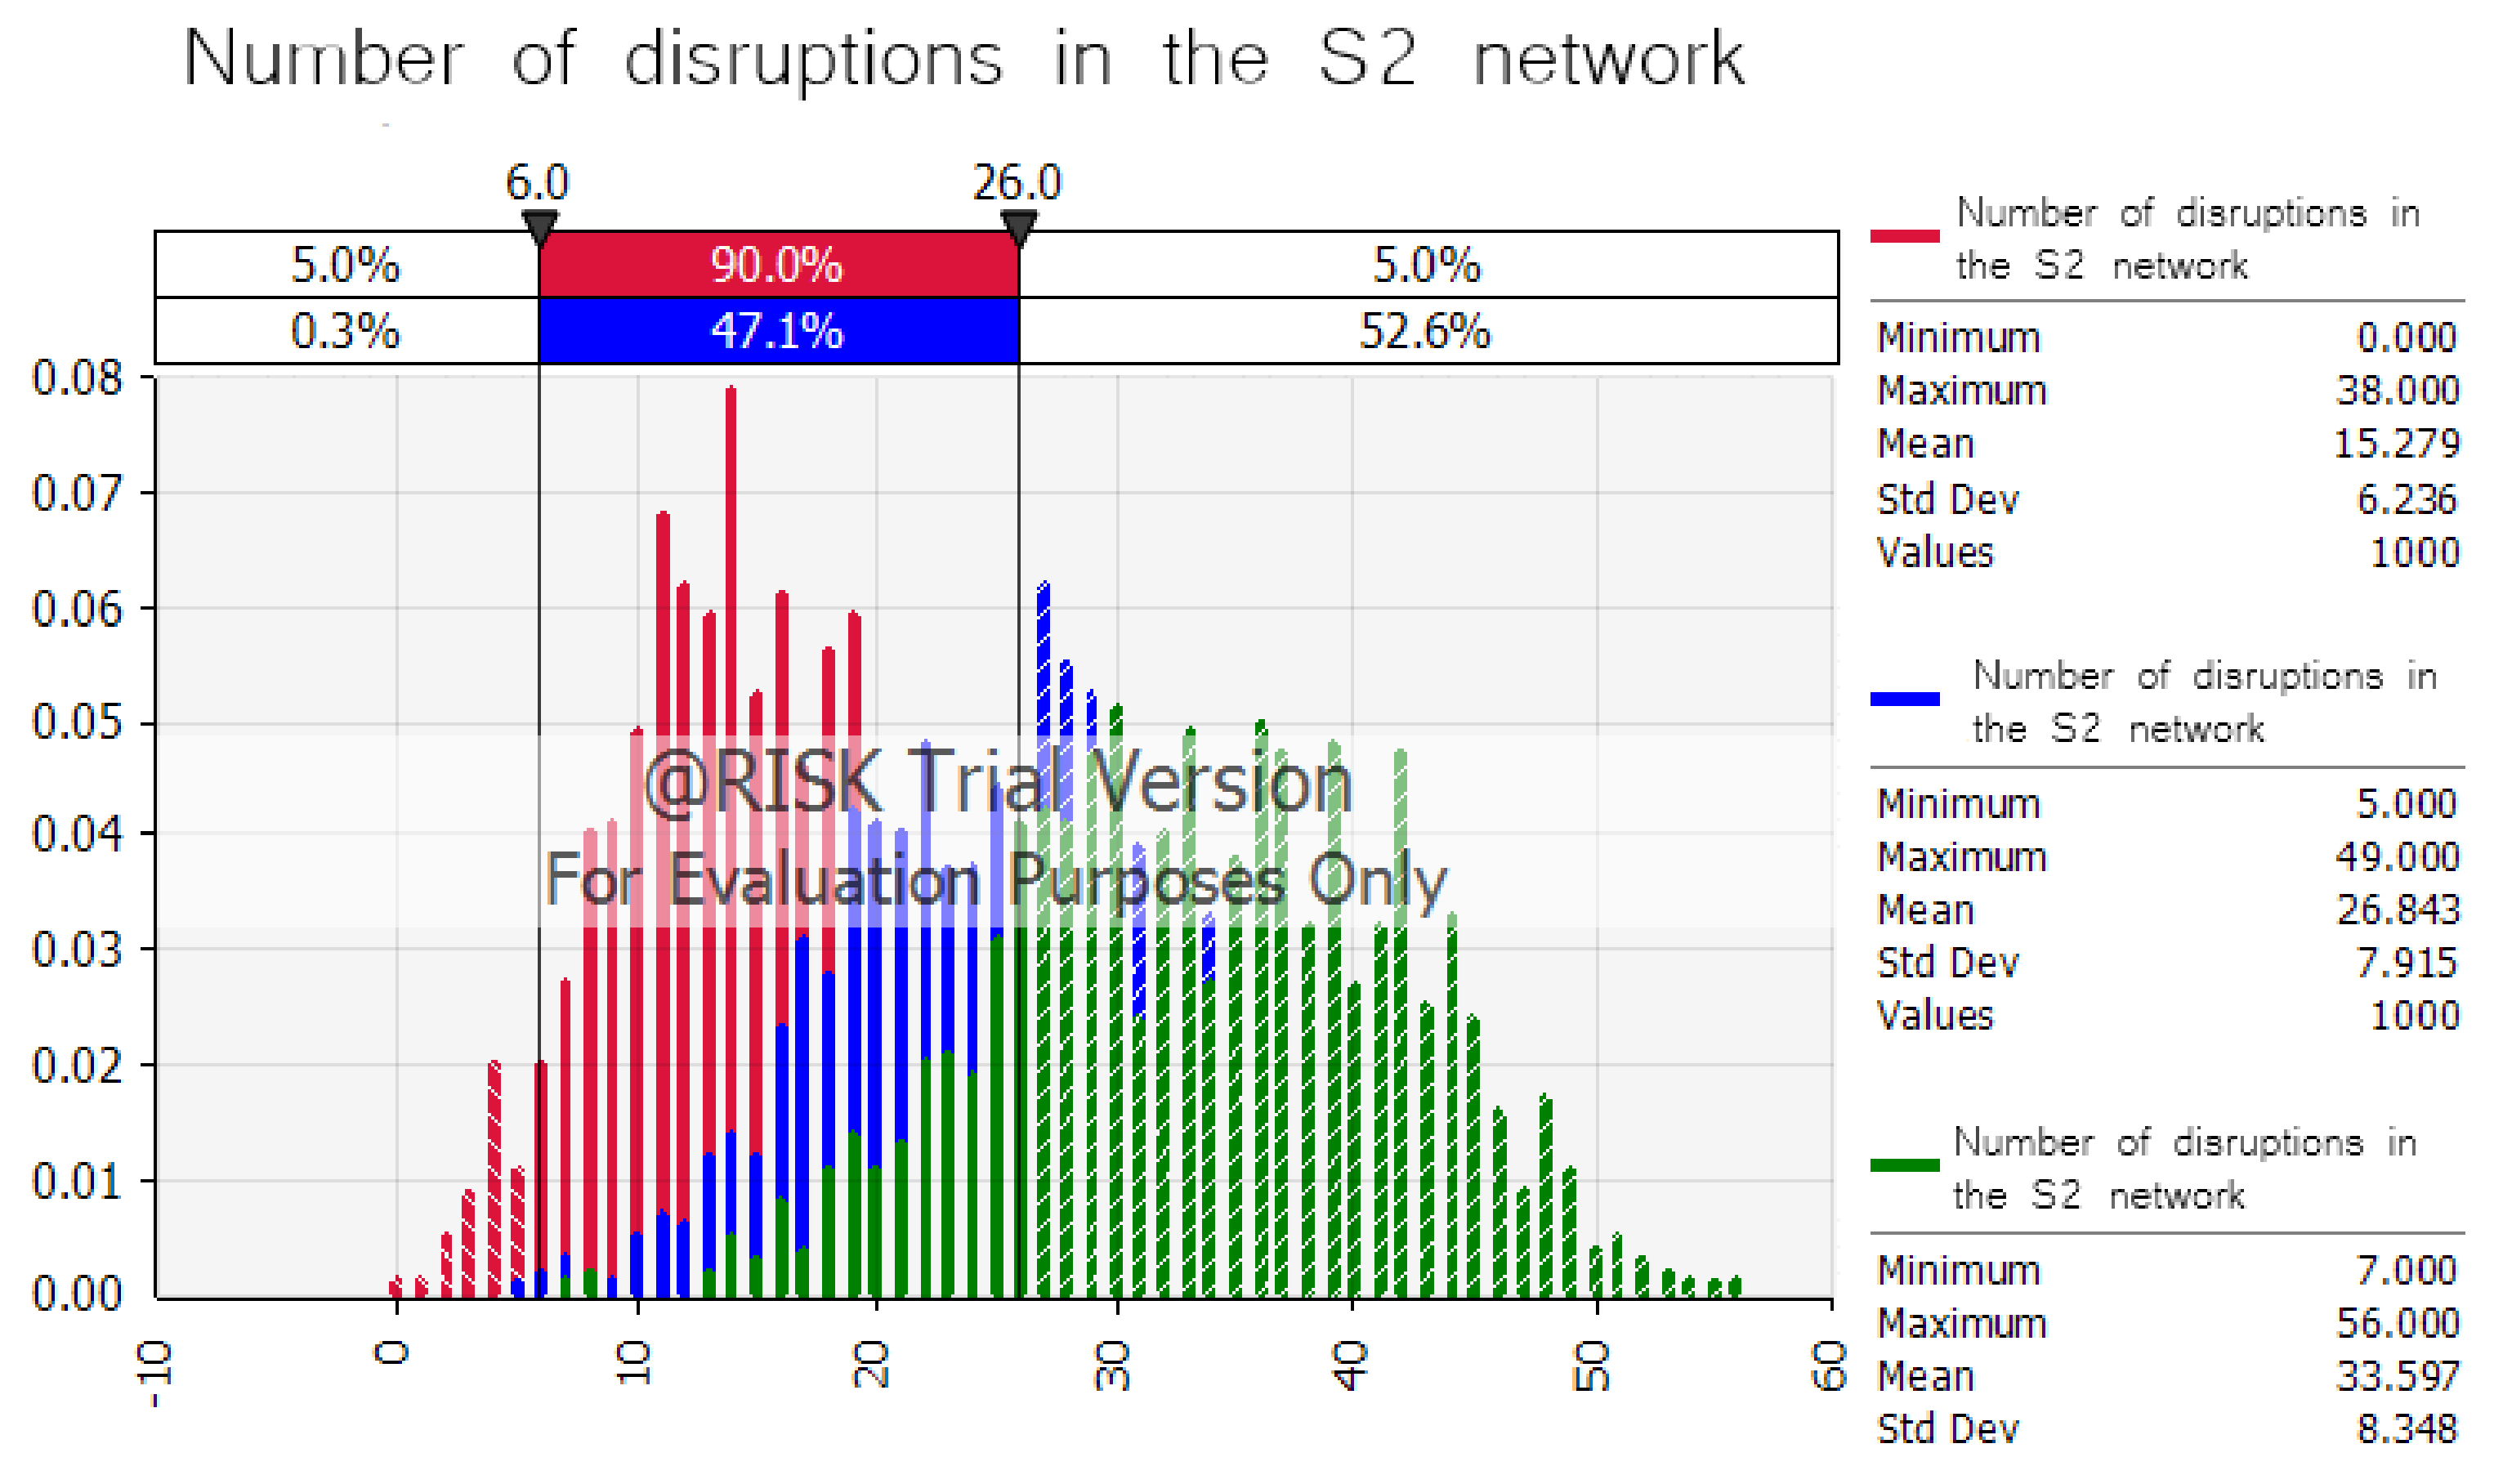
Figure 12 shows simulation for Supplier 2 was performed in the same way.
Based on the results, it can be stated that the supplies of Supplier 2 are less risky. Therefore, it is appropriate that its supplies be included in a higher proportion than the supplies of Supplier 1. The number of delivery disruptions is lower for supplier S2 than for supplier S1, which can be considered a positive phenomenon in the determined distribution of supplies. Empirical research used in the elaboration of this article enabled the processing of significant, high-value information for the benefit of further development of the problem. Depending on the tools used, the issues addressed, and the identified risks of the distribution network, research bottlenecks requiring significant attention were analyzed, with the support of relevant sources of information. The above analysis provided highly valuable material for the process of development and orientation of future research.
Following the research bottlenecks, the objectives of this study were partially modified so that as much as possible could be contributed to the development of the research area. Determining the components with the highest level of risk, in conjunction with the analysis of the error rate of cars of specific brands in a limited period, provides not only important information for business process management but also for customer purchasing policy. The created reference model for optimizing the ratio of the distribution of supplies from suppliers can be considered a unified systematic approach to the evaluation of supplier efficiency with the support of simulations. The created model can be modified using mathematical functions according to the needs of manufacturing companies. The results of this study are of an informational–cognitive and scientific nature, focusing on the technical–analytical and application area.
6. Conclusions
The current distribution network in the Slovak automotive industry creates pressure on the quality and accuracy of component deliveries at all stages of the supply chain. Analyzed facts in the field of the structure of the Slovak distribution network of the automotive industry, together with shortcomings and opportunities in the selected area, enabled the creation of data for the analysis of risk factors. The present requires an efficient and flexible response to changes in the supply conditions of components. If more than one supplier can supply the same component, it is advisable to optimize the supply. A model was designed to optimize the component supply ratio for the customer. The design of the model was supported by the algorithmization of the process of steps to create a mathematical model. The conceptual form of the component supply ratio optimization model is the basis for its verification based on delivery simulations. When optimizing, factory quality, time, and riskiness of deliveries of individual suppliers are considered. In our model, individual factories are reflected in the KPIs. By changing the KPI values, different delivery conditions are created, which we can model. Subsequently, we simulate and evaluate the course of component deliveries according to the selected ratio of deliveries of various suppliers in terms of the distribution of the probability of delivery from suppliers and in terms of delivery disruptions of suppliers.
The issue of supply chains is quite often represented in the literature [40,41,42,43]. Sustainable supply chain management, according to [44,45,46], meets the economic, social, and environmental triple bottom line. Studies have summarized key categories, initiatives, and practices of sustainable supply chain management. Christopher and Peck, 2004 [47] warned that one important component of supply chain management is to assess the risk posed by both external and internal factors to the stability and efficiency of the supply chain. According to [48,49], supply chain sustainability risk means a potential sustainability-related condition or event that can provoke harmful stakeholder reactions within the supply chain.
We believe that the presented contribution to the development and stabilization of the Slovak automotive industry will strengthen the competitiveness of the Slovak economy. Modeling and simulations of supply chain conditions appear in professional studies. Nevertheless, we could not find the problem of optimizing the supply of the same component. Therefore, we saw space for our own research, the results of which can be used for specific companies in the automotive industry in Slovakia but also abroad.
Author Contributions
Conceptualization: J.K. and L.L.; methodology: J.K. and P.T.; software: L.L.; validation: J.K., P.T., and L.L.; formal analysis: J.K.; investigation: L.L.; writing—original draft preparation: J.K., P.T., and L.L.; writing—review and editing: J.K. All authors have read and agreed to the published version of the manuscript.
Funding
This research received no external funding.
Institutional Review Board Statement
Not applicable.
Informed Consent Statement
Not applicable.
Data Availability Statement
Data sharing is not applicable to this article.
Acknowledgments
This paper was developed within the projects implementation: KEGA 009TUKE-4/2020 “Transfer of Digitization into Education in the Study Program Business Management and Economics”, KEGA 001TUKE-4/2020 “Modernizing Industrial Engineering Education to Develop Existing Training Program Skills in a Specialized Laboratory”, and VEGA 1/0340/21 “The impact of a pandemic and the subsequent economic crisis on the development of digitization of enterprises and society in Slovakia”. This work was supported by the Slovak Research and Development Agency under Contract no. APVV-19-0418 “Intelligent solutions to enhance business innovation capability in the process of transforming them into smart businesses”. and APVV-17-0258 “Digital engineering elements application in innovation and optimization of production flows”.
Conflicts of Interest
The authors declare no conflict of interest.
References
- Porter, M.E. Technology and Competitive Advantage. J. Bus. Strategy 1985, 5, 60–78. [Google Scholar] [CrossRef]
- Sabri, E.H.; Beamon, B.M. A multi-objective approach to simultaneous strategic and operational planning in supply chain design. Omega 2000, 28, 581–598. [Google Scholar] [CrossRef]
- Rungtusanatham, M.; Salvador, F.; Forza, C.; Choi, T.Y. Supply-chain linkages and operational performance: A resource-based-view perspective. Int. J. Oper. Prod. Manag. 2003, 23, 1084–1099. [Google Scholar] [CrossRef]
- Chopra, S.; Meindl, P. Supply Chain Management. Strategy, Planning & Operation. In Das Summa Summarum des Management; Boersch, C., Elschen, R., Eds.; Springer: Berlin/Heidelberg, Germany, 2007; pp. 265–275. [Google Scholar]
- Simatupang, T.M.; Sridharan, R. The Collaborative Supply Chain. Int. J. Logist. Manag. 2002, 13, 15–30. [Google Scholar] [CrossRef]
- Lambert, D.M. The Eight Essential Supply Chain Management Processes. In Supply Chain Management Review; Northwestern University: Evanston, IL, USA, 2004; Volume 8, pp. 18–26. [Google Scholar]
- Harland, C.M. Supply Chain Management: Relationships, Chains and Networks. Br. J. Manag. 1996, 7, S63–S80. [Google Scholar] [CrossRef]
- Scott, C.; Westbrook, R. New Strategic Tools for Supply Chain Management. Int. J. Phys. Distrib. Logist. Manag. 1991, 21, 23–33. [Google Scholar] [CrossRef]
- Lee, H.L.; Billington, C. Managing Supply Chain Inventory: Pitfalls and Opportunities. MIT Sloan Manag. Rev. 1992, 33, 65–73. [Google Scholar]
- Svensson, T. Globalisation, Marketisation and Power: The Swedish Case of Institutional Change. Scand. Political-Stud. 2002, 25, 197–229. [Google Scholar] [CrossRef]
- Towill, D.R.; Disney, S. Managing Bullwhip-induced risks in supply chains. Int. J. Risk Assess. Manag. 2008, 10, 238. [Google Scholar] [CrossRef]
- Röder, A.; Tibken, B. A methodology for modeling inter-company supply chains and for evaluating a method of integrated product and process documentation. Eur. J. Oper. Res. 2006, 169, 1010–1029. [Google Scholar] [CrossRef]
- Cooper, D.; Schindler, P. Business Research Methods, 12th ed.; McGraw-Hill/Irwin: England, UK, 2013. [Google Scholar]
- Farmer, S.M.; Maslyn, J.M.; Fedor, D.B.; Goodman, J.S. Putting upward influence strategies in context. J. Organ. Behav. 1997, 18, 17–42. [Google Scholar] [CrossRef]
- Christy, D.P.; Grout, J.R. Safeguarding supply chain relationships. Int. J. Prod. Econ. 1994, 36, 233–242. [Google Scholar] [CrossRef]
- Spirkova, D.; Teplicka, K.; Hurna, S.; Janiss, R. Evaluation of Energy Savings and Economic Benefits of SOLTAG Roof-top Extensions under the Conditions of a Model Area in the Slovak Republic. Sustainability 2021, 13, 45. [Google Scholar] [CrossRef]
- Turisová, R.; Pačaiová, H.; Kotianová, Z.; Nagyová, A.; Hovanec, M.; Korba, P. Evaluation of eMaintenance Applica-tion Based on the New Version of the EFQM Model. Sustainability 2021, 13, 3682. [Google Scholar] [CrossRef]
- Bogataj, D.; Bogataj, M. Measuring the supply chain risk and vulnerability in frequency space. Int. J. Prod. Econ. 2007, 108, 291–301. [Google Scholar] [CrossRef]
- Sodhi, M.S. Managing Demand Risk in Tactical Supply Chain Planning for a Global Consumer Electronics Company. Prod. Oper. Manag. 2009, 14, 69–79. [Google Scholar] [CrossRef]
- Lai, G.; Debo, L.G.; Sycara, K. Sharing inventory risk in supply chain: The implication of financial constraint. Omega Int. J. Manag. Sci. 2009, 37, 811–825. [Google Scholar] [CrossRef]
- Goh, M.; Lim, J.Y.; Meng, F. A stochastic model for risk management in global supply chain networks. Eur. J. Oper. Res. 2007, 182, 164–173. [Google Scholar] [CrossRef]
- Gaudenzi, B.; Borghesi, A. Managing risks in the supply chain using the AHP method. Int. J. Logist. Manag. 2006, 17, 114–136. [Google Scholar] [CrossRef]
- Leopoulos, V.I.; Kirytopoulos, K.A. Risk management: A competitive advantage in the purchasing function. Prod. Plan. Control. 2004, 15, 678–687. [Google Scholar] [CrossRef]
- Dani, S.; Deep, A. Fragile food supply chains: Reacting to risks. Int. J. Logist. Res. Appl. A Lead. J. Supply Chain Manag. 2010, 13, 395–410. [Google Scholar] [CrossRef]
- Zhang, C.; Zhang, C. Design and simulation of demand information sharing in a supply chain. Simul. Model. Pract. Theory 2007, 15, 32–46. [Google Scholar] [CrossRef]
- Canbolat, Y.B.; Gupta, G.; Matera, S.; Chelst, K. Analyzing risk in sourcing design and manufacture of components and subsystems to emerging markets. Int. J. Prod. Res. 2008, 46, 5145–5164. [Google Scholar] [CrossRef]
- Appelqvist, P.; Gubi, E. Postponed variety creation: Case study in consumer electronics retail. Int. J. Retail. Distrib. Manag. 2005, 33, 734–748. [Google Scholar] [CrossRef]
- Shang, J.S.; Li, S. Operational design of a supply chain system using the Taguchi method, response surface methodology, simulation, and optimization. Int. J. Prod. Res. 2004, 42, 3823–3849. [Google Scholar] [CrossRef]
- Holland, W.; Sodhi, M.S. Quantifying the effect of batch size and order errors on the bullwhip effect using simulation. Int. J. Logist. Res. Appl. 2004, 7, 251–261. [Google Scholar] [CrossRef]
- Bienstock, C.C.; Mentzer, J.T. An Experimental Investigation of the Outsourcing Decision for Motor Carrier Transportation. Transp. J. 1999, 39, 42–59. [Google Scholar]
- van der Vorst, J.G.; Beulens, A.J.; de Wit, W.V.; van Beek, P. Supply chain management in food chains: Improving performance by reducing uncertainty. Int. Trans. Oper. Res. 1998, 5, 487–499. [Google Scholar] [CrossRef]
- Gomes, R.; Mentzer, J.T. The influence of just-in-time systems on distribution channel performance in the presence of environmental uncertainty. Transp. J. 1991, 30, 36–48. [Google Scholar]
- Powers, T.L.; Closs, D.O. An examination of the effects of trade incentives of logistical performance in a consumer products distribution channel. J. Bus. Logist. 1987, 8, 1–28. [Google Scholar]
- Seidl, M.; Šimák, L. Manažment rizík v dodávateľských reťazcoch supply chain risk. Logistyka Transp. 2008, 7, 75–84. [Google Scholar]
- OICA; The International Organization of Motor Vehicle Manufacturers. (OICA): Production Statistics; International Organization of Motor Vehicle Manufacturers: Paris, France, 2020; Available online: https://www.oica.net/category/production-statistics/2020-statistics/ (accessed on 10 October 2021).
- VOSA. Vehicle & Operator Services Agency: Driver and Vehicle Standards Agency; Open Government Licence v3.0 (OGL): Bristol, UK, 2020. Available online: https://www.gov.uk/government/organisations/driver-and-vehicle-standards-agency (accessed on 10 October 2021).
- Horvathova, J.; Mokrisova, M.; Suhanyiova, A. Analysis of Cost of Equity Models in Calculating Economic Value Added of Slovak Businesses. In Proceedings of the International Multidisciplinary Scientific Conferences on Social Sciences and Arts (SGEM 2014), Albena, Bulgaria, 2–7 September 2014; pp. 35–42. [Google Scholar]
- Teplická, K.; Straka, M. Sustainability of Extraction of Raw Material by a Combination of Mobile and Stationary Mining Machines and Optimization of Machine Life Cycle. Sustainability 2020, 12, 10454. [Google Scholar] [CrossRef]
- Sukitsch, M.; Engert, S.; Baumgartner, R.J. The implementation of corporate sustainability in the European automo-tive industry: An analysis of sustainability reports. Sustainability 2015, 7, 11504–11531. [Google Scholar] [CrossRef] [Green Version]
- Günther, H.-O.; Kannegiesser, M.; Autenrieb, N. The role of electric vehicles for supply chain sustainability in the automotive industry. J. Clean. Prod. 2015, 90, 220–233. [Google Scholar] [CrossRef]
- Koplin, J.; Seuring, S.; Mesterharm, M. Incorporating sustainability into supply management in the automotive industry—The case of the Volkswagen AG. J. Clean. Prod. 2007, 15, 1053–1062. [Google Scholar] [CrossRef]
- Alikhani, R.; Torabi, S.A.; Altay, N. Strategic supplier selection under sustainability and risk criteria. Int. J. Prod. Econ. 2019, 208, 69–82. [Google Scholar] [CrossRef] [Green Version]
- Mayyas, A.; Qattawi, A.; Omar, M.; Shan, D. Design for sustainability in automotive industry: A comprehensive review. Renew. Sustain. Energy Rev. 2012, 16, 1845–1862. [Google Scholar] [CrossRef]
- Beske, P.; Seuring, S. Putting sustainability into supply chain management. Supply Chain Manag. Int. J. 2014, 19, 322–331. [Google Scholar] [CrossRef]
- O’Rourke, D. The science of sustainable supply chains. Science 2014, 344, 1124–1127. [Google Scholar] [CrossRef] [Green Version]
- Tseng, M.-L.; Islam, M.S.; Karia, N.; Fauzi, F.A.; Afrin, S. A literature review on green supply chain management: Trends and future challenges. Resour. Conserv. Recycl. 2019, 141, 145–162. [Google Scholar] [CrossRef]
- Christopher, M.; Peck, H. Building the Resilient Supply Chain. Int. J. Logist. Manag. 2004, 15, 1–14. [Google Scholar] [CrossRef] [Green Version]
- Hofmann, H.; Busse, C.; Bode, C.; Henke, M. Sustainability-related supplychain risks: Conceptualization and manage-ment. Bus. Strateg. Environ. 2014, 23, 160–172. [Google Scholar] [CrossRef]
- Xu, M.; Cui, Y.; Hu, M.; Xu, X.; Zhang, Z.; Liang, S.; Qu, S. Supply chain sustainability risk and assessment. J. Clean. Prod. 2019, 225, 857–867. [Google Scholar] [CrossRef]
Figure 1.
The main suppliers of Slovak automotive companies. Source: own research.

Figure 2.
The main group of suppliers in terms of regional base and component structure. Source: own research.
Figure 2.
The main group of suppliers in terms of regional base and component structure. Source: own research.

Figure 3.
Four basic supplier groups. Source: own research based on [35].
Figure 3.
Four basic supplier groups. Source: own research based on [35].

Figure 4.
Characteristics and share of stocks. Source: own research.

Figure 5.
Losses from poor quality. Source: own research.

Figure 6.
Algorithm for creating the designed model. Source: own research.

Figure 7.
Designed model for optimizing the ratio of a company’s suppliers in the Slovak automotive industry. Source: own research.
Figure 7.
Designed model for optimizing the ratio of a company’s suppliers in the Slovak automotive industry. Source: own research.

Figure 8.
Description and occurrence of problems in the model. Source: own research.

Figure 9.
Parameters of the simulation model. Source: own research.

Figure 10.
Simulation of the distribution of the probability of deliveries from suppliers. Source: own research.
Figure 10.
Simulation of the distribution of the probability of deliveries from suppliers. Source: own research.

Figure 11.
Simulation of delivery disruptions for Supplier 1. Source: own research.

Figure 12.
Simulation of delivery disruptions for Supplier 2. Source: own research.

Publisher’s Note: MDPI stays neutral with regard to jurisdictional claims in published maps and institutional affiliations. |
© 2021 by the authors. Licensee MDPI, Basel, Switzerland. This article is an open access article distributed under the terms and conditions of the Creative Commons Attribution (CC BY) license (https://creativecommons.org/licenses/by/4.0/).
Share and Cite
MDPI and ACS Style
Kádárová, J.; Trebuňa, P.; Lachvajderová, L. Model for Optimizing the Ratios of the Company Suppliers in Slovak Automotive Industry. Sustainability 2021, 13, 11597. https://0-doi-org.brum.beds.ac.uk/10.3390/su132111597
AMA Style
Kádárová J, Trebuňa P, Lachvajderová L. Model for Optimizing the Ratios of the Company Suppliers in Slovak Automotive Industry. Sustainability. 2021; 13(21):11597. https://0-doi-org.brum.beds.ac.uk/10.3390/su132111597
Chicago/Turabian StyleKádárová, Jaroslava, Peter Trebuňa, and Laura Lachvajderová. 2021. "Model for Optimizing the Ratios of the Company Suppliers in Slovak Automotive Industry" Sustainability 13, no. 21: 11597. https://0-doi-org.brum.beds.ac.uk/10.3390/su132111597
Note that from the first issue of 2016, this journal uses article numbers instead of page numbers. See further details here.