Article

Investigations on the Use of Dried Food Residues as a Potential Dietary Ingredient for Cats

1
Institute of Animal Nutrition, Department of Veterinary Medicine, Freie Universität Berlin, 14195 Berlin, Germany
2
Small Animal Clinic, Faculty of Veterinary Medicine, Justus-Liebig-University Giessen, 35392 Giessen, Germany
3
Department of Agriculture, School of Agricultural Science, Hellenic Mediterranean University, 71410 Heraklion, Greece
4
Department of Geography, Harokopio University, 17671 Athens, Greece
5
Department of Nutrition and Dietetics, Harokopio University, 17671 Athens, Greece
*
Author to whom correspondence should be addressed.
Sustainability 2021, 13(21), 11603; https://0-doi-org.brum.beds.ac.uk/10.3390/su132111603
Submission received: 14 September 2021 / Revised: 14 October 2021 / Accepted: 14 October 2021 / Published: 20 October 2021
(This article belongs to the Special Issue RETASTE: Rethink Food Waste)

Abstract

:
The potential use of food residues for pet food could significantly contribute to food waste reduction. In the present study, the effects of the inclusion of dried food residues (DFR) (0, 5, 10 and 15%) in a complete diet were evaluated in seven healthy adult cats. At the end of each three-week feeding period, feces were collected. The analysis of the fecal microbiota by 16S rDNA sequencing demonstrated a marked increase of the bacterial alpha-diversity with increasing dietary inclusion levels of DFR. In addition, an increase in the relative abundance of Coriobacteriales, Collinsella and Lachnoclostridum, as well as of propionate and n-valerate in the feces of the cats, was detected. The dietary inclusion of DFR decreased the apparent crude protein digestibility and tended to decrease the apparent crude fat digestibility. Overall, the DFR seemed to be highly fermentable in the intestine of cats, which markedly affected the diversity of the fecal microbiota. As this effect might be critical for a balanced gut microbiota, but also along with the observed depressing effects of DFR on the apparent crude protein and crude fat digestibility, lower inclusion levels are recommended if used as a potential ingredient for cat food in the future.

1. Introduction

Human food residues were reused as a dietary component for farm animals for a long time [1]. However, regardless of their nutritional value and the contribution to food waste reduction by the recycling, concerns on the hygienic safety of food residues lastly caused legal restrictions. In the European Union, for instance, catering waste is currently prohibited as a feed component for livestock [2], but also for pet animals [3].
Nevertheless, there is a global need to reduce the food waste production [4]. The European Union is currently funding the project “Food for Feed (F4F)” (LIFE15 ENV/GR/000257), which evaluates the recycling of hotel catering into animal nutrition. The project is aware of the legal restrictions on the use of food residues, but aims to promote more research in this field, which could potentially also contribute to policy changes in the future. As a part of this project, we recently investigated the impact of the inclusion of dried food residues (DFR) in a complete diet for dogs [5]. The results demonstrated a clear and dose-dependent effect on the fecal microbiota of the animals and indicated that especially fiber-rich ingredients of the DFR were microbially fermented. In addition, a decrease in the apparent crude protein and crude fat digestibility was observed with increasing amounts of DFR in the diets [5].
Whether comparable effects of the dietary inclusion of food residues might also occur in cats, however, cannot be directly concluded from the related study in dogs. Dogs are considered to be more omnivorous, whereas cats are strictly carnivorous [6]. The cat’s ability to digest starch is lower than that of dogs, whereas the protein requirement is higher [7]. These dietary variations between dogs and cats might also affect the composition of the intestinal microbiota in general, and it can be assumed that potential differences in the gut microbiota might also result in divergent responses to dietary interventions.
It was therefore the aim of the present study to evaluate the effects of increasing concentrations of DFR in a complete diet for cats, mainly focusing on the impact on the composition and metabolic activity of the fecal microbiota, but also on the apparent nutrient digestibility.

2. Materials and Methods

The study received approval by the Landesamt für Gesundheit und Soziales (LAGeSo) in Berlin, Germany (approval number G 0233/18).

2.1. Diets

A complete basic diet was composed based on raw ground beef, rice flour, rapeseed oil, cellulose and mineral and vitamin supplements (Table 1). Titanium dioxide was included as an inert marker to determine the apparent nutrient digestibility. In order to improve the feed acceptance, a supplement based on chicken liver (Fresshilfe, anibio, SPECHT BIO-PHARMA, Reinbek, Germany) was added to the daily amount of feed of each cat (1/2 teaspoon/cat/day).
Dried food residues were included in the basic diet at 0, 5, 10 and 15%. The food residues were collected in hotel kitchen in Heraklion, Greece, as part of the project “Food for Feed (F4F)”. The food residues were ground and solar dried, resulting in a final particle size of less than 5 mm. A compositional analysis of the collected hotel catering was performed based on the ASTM D5231-92 standard [8]. More details can be found elsewhere [5]. A microbial analysis of the DFR regarding hygiene safety was performed by the Laboratory of Microbiology of the Harokopio University in Athens by taking into consideration the Scientific Opinion of the Panel on Biological Hazards [9], the European Feed Manufacturers’ Guide [10] and the Commission Regulation (EC) No 2073/2005 [11]. The presence of microorganisms was determined using plate count techniques on selective substrates. The DFR have been found to be free of Salmonella spp., Listeria monocytogenes, Escherichia coli/Total Coliforms, Staphylococcus aureus, Clostridium perfringens and yeasts. The number of total mesophilic bacteria was <102 colony forming units (CFU)/g DFR.
The analyzed dry matter and nutrient concentrations of the experimental diets and DFR are presented in Table 2. The analyses were performed as described previously [5,12].

2.2. Animals and Study Design

Seven healthy adult cats (European Shorthair; 4 neutered males, 1 intact male, 2 intact females; 72.9 ± 42.0 months old) received the experimental diets in ascending order of the DFR inclusion level. The daily amount of feed was calculated according to the NRC [7] and was weekly adjusted to maintain the body weight of the cats. The feed intake of the animals was recorded daily, and the body weight weekly throughout the study.
Each feeding period consisted of 3 weeks. On the last four days of the feeding periods, the cats were individually housed for urine and feces collection. Fasting blood was collected at the end of each feeding period.

2.3. Calculation of the Apparent Nutrient Digestibility

The fecal crude protein, crude fat and titanium dioxide concentrations were analyzed as described elsewhere [5,12]. The apparent nutrient digestibility was calculated using the following formula:
Apparent nutrient digestibility (%) = 100 − [(% titanium dioxide in the diet/% titanium dioxide in the feces) × (% nutrient in the feces/% nutrient in the diet) × 100].

2.4. Fecal Microbiota and Microbial Metabolites

The microbiota in the feces of the cats was analyzed by 16S rDNA sequencing, using the llumina NextSeq500 sequencer (LGC, Berlin, Germany). DNA extraction from the feces was performed with a commercial kit (QIAamp Fast DNA stool mini kit, QIAGEN GmbH, Hilden, Germany). The instructions of the manufacturer were followed, with the exception of a lysis step at 90 °C. For amplicon sequencing, the V3–V4 region of the 16S rDNA gene was targeted, and the 16S rDNA sequences were finally analyzed with the QIIME2 pipeline [13] and the SILVA SSU database [14]. More details on the method used are provided by Paßlack et al. [15]. The full data set of the sequencing is available at the NCBI BioProject database under ID PRJNA755187.
The concentrations of microbial metabolites in the feces of the cats were measured as described in detail by Paßlack et al. [16,17]. In short, short-chain fatty acid (SCFA) concentrations were analyzed by gas chromatography (Model 19095 N-123, Agilent Technologies, CA, USA), lactate with high-performance liquid chromatography (HPLC Agilent 1100, Agilent Technologies, CA, USA), and ammonium colorimetrically (Tecan Sunrise™ microplate reader, Tecan Austria GmbH, Grödig, Austria) by the Berthelot reaction.

2.5. Plasma and Urine Analysis

After collection, the blood was stored at room temperature for 1 h before centrifugation (10 min, 4 °C, 1811× g; Heraeus Megafuge 1.0R, Thermo Scientific, Karlsruhe, Germany). The plasma was frozen at −20 °C until the further analyses. The indoxyl sulfate concentrations were measured in the plasma using the method of Chen et al. [18] and high-performance liquid chromatography (HPLC Agilent 1100, Agilent Technologies, CA, USA). The phenol and indole concentrations in the plasma were also measured with the HPLC Agilent 1100 (Agilent Technologies, CA, USA), more details are provided by Paßlack et al. [15]. The urinary phenol and indole concentrations were determined by gas chromatography (GC 6890 N, Agilent Technologies), as specified by Eisenhauer et al. [19]. The urine pH was measured with a pH meter (Seven Multi pH meter, Mettler-Toledo GmbH, Schwerzenbach, Switzerland), directly after the urine collection at 6.30 h and 12.30 h. The urinary anions and cations were analyzed as described by Passlack and Zentek [12].

2.6. Statistical Data Analysis

The statistical data analysis was performed with IBM SPSS Statistics 27 (SPSS Inc, Chicago, IL, USA; 2020). Data are presented as mean ± standard deviation. Polynomial contrasts were calculated for group comparisons (General Linear Model repeated measures, within-subject factor: DFR, number of levels: four), with α = 0.05 being statistically significant.
For the sequencing data, values < 0.5% in all groups are only presented in the Tables in the case of a significant group difference.
In addition, a principal component analysis was performed to visualize the sequencing data. For this, the web tool ClustVis was used [20].

3. Results

3.1. Animal Health, Body Weight, Fecal Dry Matter, Feed Intake

The cats were healthy throughout the study, and the dietary inclusion of DFR did not affect their body weight or fecal dry matter concentrations (Table 3). As one cat refused the diet after the first feeding period, it was replaced by another cat with a comparable age. Another cat refused the diet in the second, but not in the other feeding periods. The feed intake of the cats that completed the study was not influenced by the inclusion of DFR in the diets (Table 3).

3.2. Apparent Nutrient Digestibility

The apparent crude protein and crude fat digestibility was high in general (Table 3). However, with increasing dietary concentrations of DFR, the apparent crude protein digestibility decreased from 93.9 ± 2.06 to 90.0 ± 1.91% (linear contrast: P = 0.007). In addition, a trend for a lower apparent crude fat digestibility with increasing dietary DFR inclusion levels was observed (linear contrast: P = 0.062).

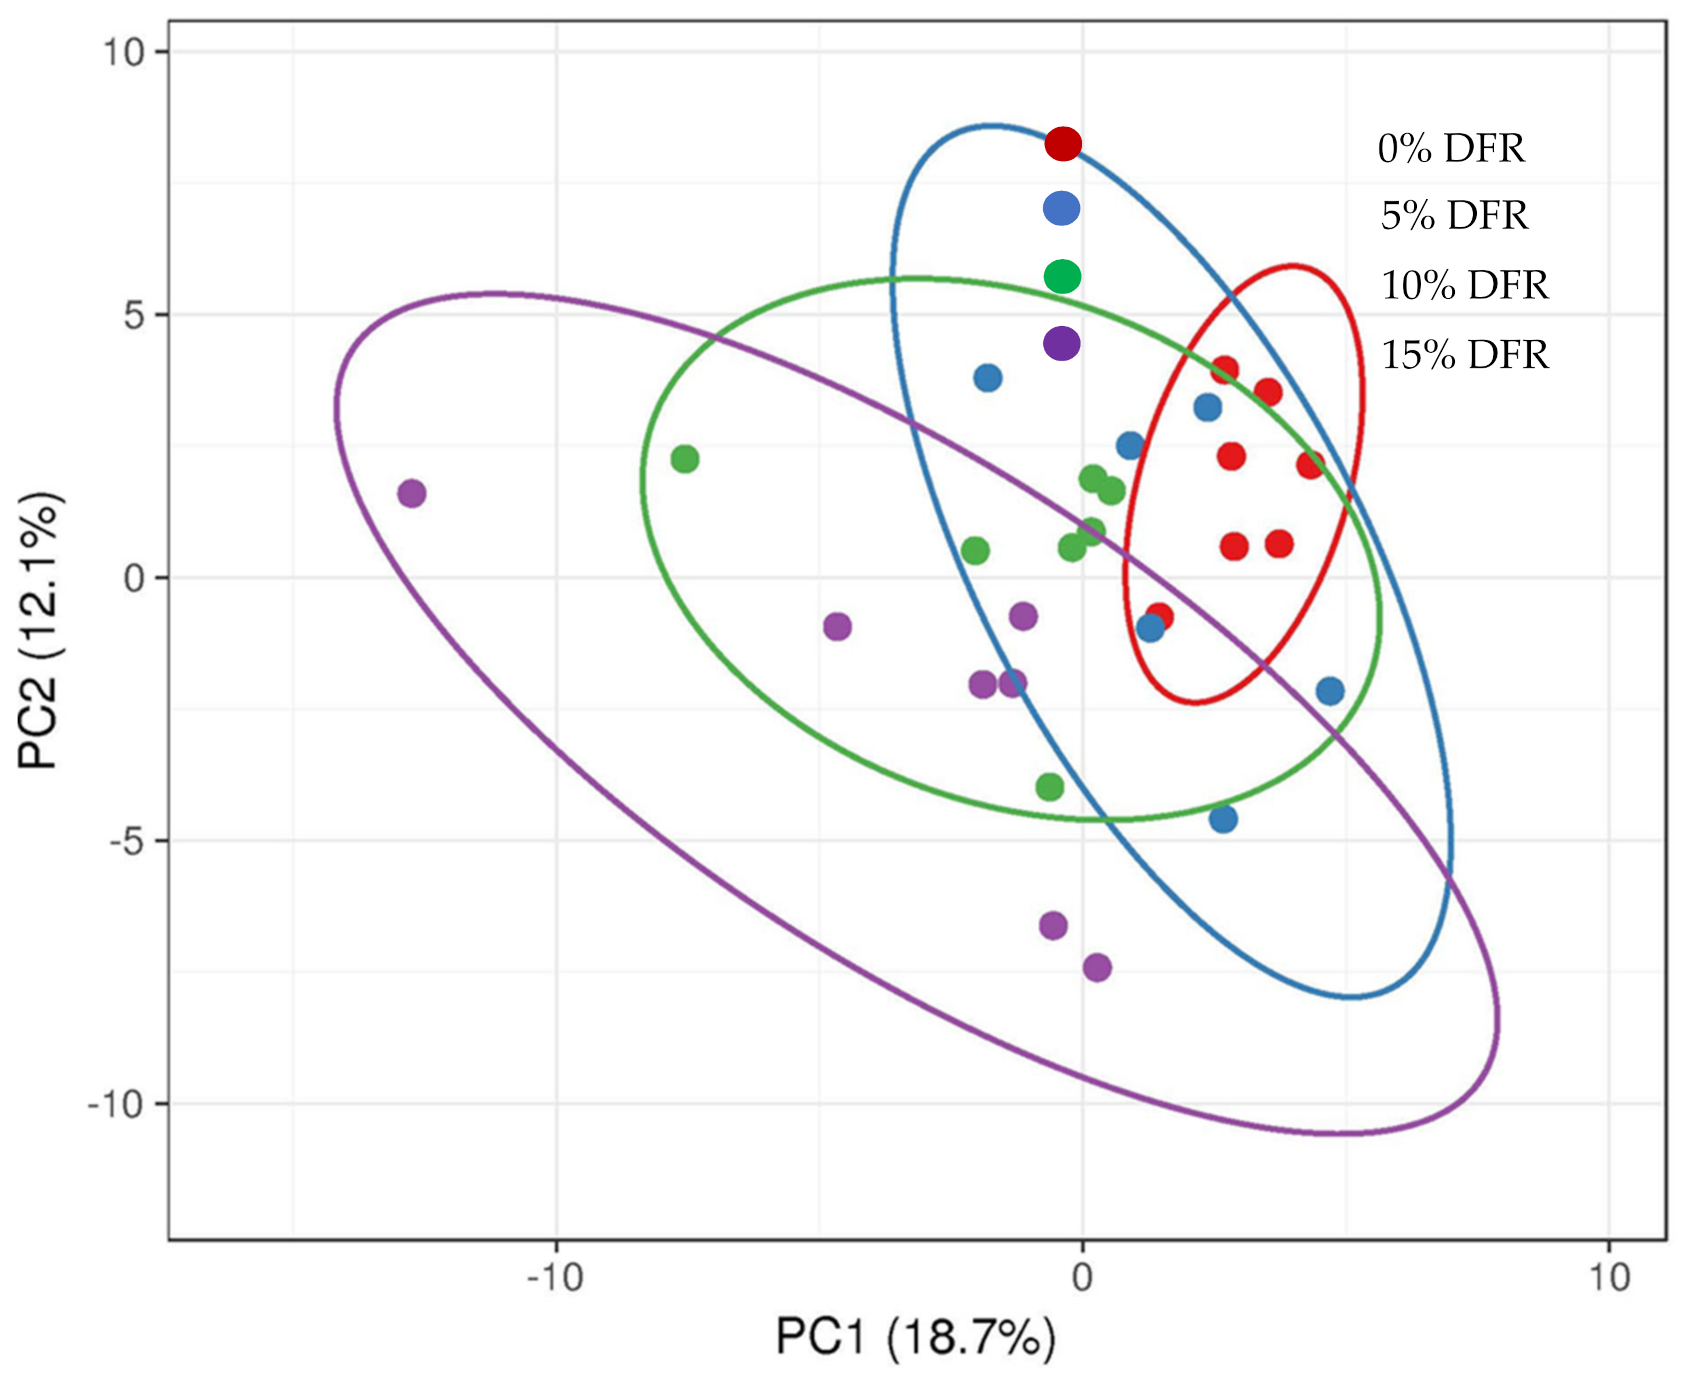
3.3. Fecal Microbiota

A marked increase in the microbiota´s diversity in the feces of the cats was noted with increasing amounts of DFR in the diets (linear contrasts, P < 0.05) (Table 4). This effect was also demonstrated by the principal component analysis, where the cats receiving no DFR showed a tighter cluster formation of the fecal microbiota compared to the other groups, especially to the group receiving 15% dietary DFR (Figure 1).
While only quadratic effects of the dietary DFR inclusion were detected on the phylum level (Table 5), a linear increase in the relative abundance of the order Coriobacteriales (Table 6) and the genera Collinsella, Lachnoclostridium, Libanicoccus and Romboutsia (Table 7) was observed with increasing dietary concentrations of DFR (linear contrasts, P < 0.05).

3.4. Fecal Microbial Metabolites

The ammonium and lactate concentrations in the feces of the cats were not affected by the dietary inclusion of DFR; however, the concentrations of propionic and n-valeric acid markedly increased with increasing amounts of DFR in the diets (linear contrasts, P < 0.05) (Table 8). When calculated as % of total SCFA, propionic acid increased and n-butyric acid decreased with increasing dietary inclusion levels of DFR (linear contrasts, P < 0.05).

3.5. Urine pH and Composition, Phenols and Indoles in the Urine and Plasma

The urine pH of the cats decreased with increasing dietary concentrations of DFR (Table 9). No significant effects of the diets on the urinary anion and cation concentrations were observed, however, there was a trend (P = 0.092) for increasing phosphate concentrations in the urine with increasing dietary inclusion levels of DFR (Supplementary Table S1). The p-cresol concentrations markedly increased in the urine, when the DFR were included in the diets (linear contrast, P = 0.008), whereas a slight, but significant decrease of urinary 7-methylphenol was noted (linear contrast, P = 0.007) (Table 9).
The analysis of phenols and indoles in the plasma of the cats could only detect a quadratic effect of the DFR on the indoxyl sulfate concentrations, with the lowest concentrations, when the DFR were included in the diet at 5% (P = 0.037) (Table 10).

4. Discussion

In the present study, DFR, derived from hotel catering, were evaluated as a dietary ingredient for cats. The results demonstrated that the diversity of the fecal microbiota markedly increased with higher amounts of DFR in the diet. Along with an increase in the relative abundance of some bacterial orders and genera, as well as of propionate and n-valerate in the feces, an intensive microbial fermentation of the DFR in the intestine of the cats can be assumed.
The richness of the fecal microbiota markedly increased when treatments without and with 15% DFR were compared. In general, a decreased microbial diversity has been observed in cats with chronic enteropathy [21], chronic kidney disease [22] or diabetes mellitus [23], indicating potential negative effects on the intestinal microbiota of different diseases (or vice versa). Based on these results, it can be speculated that a decreased diversity of the gut microbiota might be critical in cats. On the other hand, a marked increase in the bacterial diversity as observed in the present study by the dietary inclusion of DFR could also be considered as a potentially undesired effect. As a stable and balanced intestinal microbiota is important for gut health in cats [24], major shifts in the bacterial community in the intestine could be harmful. Nevertheless, it should also be mentioned that the cats of the present study were healthy throughout the experimental period, and no negative impact of increasing dietary DFR inclusion levels could be detected on the fecal consistency as an indicator of intestinal function.
In particular, the relative abundance of Coriobacteriales, Collinsella and Lachnoclostridium was increased by the dietary inclusion of DFR. These bacterial groups can mainly metabolize different types of carbohydrates [25,26,27]. The results of the present study correspond with the data obtained when feeding DFR from the same batch to dogs, where carbohydrate fermenting bacteria were also promoted by the dietary inclusion of DFR [5]. It should be mentioned, however, that the composition of the DFR used in the present study cannot be postulated for food residues in general. Instead, the ingredients of food residues might vary depending on the collection procedure. Variations in the nutritional composition of food residues might also lead to varying responses of the intestinal microbiota. Nevertheless, the present results provide valuable insights into the use of DFR as an ingredient for a complete diet for cats. Given the marked effects on the fecal microbiota at higher dietary inclusion levels, which could also be detrimental for a balanced gut microbiota, lower amounts of DFR in a diet might be preferable if used as a potential ingredient in the future.
The apparent crude protein digestibility decreased with the increasing amounts of DFR in the diets. In addition, a trend for a decreased apparent crude fat digestibility was observed. The results confirm the data obtained in dogs when feeding DFR of the same composition [5]. The underlying mechanism of these depressing effects on the nutrient digestion, however, cannot be clarified at this stage. High dietary fiber concentrations, as well as different fiber fractions, can negatively affect the apparent nutrient digestibility in cats [28,29]. Although the dietary fiber fractions were not specified in the present study, the crude fiber concentrations were comparable between the experimental diets and were relatively low in general. It can therefore be assumed that fiber-rich ingredients of the DFR might not have been the main reason for the observed depressing effects on the apparent crude protein and crude fat digestibility. However, as was hypothesized also in our previous work [5], the heat treatment of the DFR could have potentially affected the nutrient digestibility. This might relate to the heating in the hotel kitchen, as about 25% of the food residues were cooked meals and snacks, and the solar drying of the collected leftovers. It should also be considered that the food residues used for the present study were not sterilized, but for the potential future use as a component for pet food, this might be a prerequisite to ensure the hygienic quality of this material. Steam-sterilizing temperatures might additionally affect the nutrient digestibility of DFR included in diets, which should be further investigated in future studies.
Interestingly, the urine pH of the cats decreased with increasing dietary inclusion levels of DFR. The dietary nutrient composition, which significantly affects the urine pH [30], was comparable for all treatments, and no significant effect of the diets on the anion and cation concentrations in the urine of the animals could be observed. However, there was a trend for increasing urinary phosphate concentrations at higher amounts of DFR in the diets, which could have affected the urine pH of the cats. In addition, it can be speculated that the increasing p-cresol concentrations in the urine might also have contributed to the decrease in the urine pH. P-cresol is a metabolite of bacterial protein fermentation and considered to be potentially harmful, e.g., for the integrity of the intestinal epithelial barrier or by a suppression of the immune function [31]. As the apparent protein digestibility decreased with increasing dietary DFR in the present study, it can be hypothesized that the undigested protein was partly microbially fermented, resulting in an increased p-cresol concentration in the urine of the cats. It should, however, be noted that neither the fecal ammonium concentrations, as another important metabolite of microbial protein fermentation [32], nor the plasma p-cresol concentrations were increased by the DFR in the diets, which is why an extensive bacterial protein degradation in the intestine of the cats might be excluded. Nevertheless, the results indicate that not only carbohydrates, but also protein was microbially fermented when DFR were included in the diet.
As a limitation of the present study, the diets were fed in ascending order of their amount of DFR, and not as a cross-over design. This study design was used to early detect potential adverse reactions to the DFR, i.e., at the lowest inclusion level. Although we considered sufficiently long feeding periods to detect diet-related effects on the intestinal microbiota and apparent nutrient digestibility, a potential influence of the preceding on the subsequent feeding period cannot be fully excluded and should therefore be considered for data interpretation.
The diets of the present study were based on raw ground beef and only mixed with a small amount of rice flour and additional mineral and vitamin supplements. Despite the raw and not heat-treated meat, the diet composition can be considered to be comparable to a standard canned diet for cats. In contrast, dry extruded diets for cats often contain higher amount of cereals or other starch-rich ingredients, which usually also results in a lower protein and fat content. As the diet format can affect the composition of the fecal microbiota in cats [33], the results of the present study might not be fully transferable to pet food in general. However, they can provide an important basis for the potential commercial use of DFR as a dietary ingredient for cats.
Overall, the present study demonstrates that food residues could not only be used as a dietary component for dogs, as recently evaluated [5], but also for cats. Considering the demonstrated limitations of dietary DFR, particularly the effects on the apparent nutrient digestibility and the intestinal microbiota of cats, but also of dogs [5], lower inclusion levels (≤5%) are recommended. Given the large amounts of pet food produced per year, e.g., 29.33 million tons in the year 2020 [34], even a small inclusion level of DFR in a diet for cats and dogs could significantly help to reduce the environmental footprint of the pet food industry in the future.

Supplementary Materials

The following are available online at https://0-www-mdpi-com.brum.beds.ac.uk/article/10.3390/su132111603/s1, Table S1: Concentrations of anions and cations in the urine of cats (n = 7) fed a diet with varying amounts of dried food residues (DFR).

Author Contributions

Conceptualization, N.P., F.G., T.M., A.P., N.M., I.S., K.L. and J.Z.; Methodology, N.P., F.G., T.M., S.F., A.K., W.V. and J.Z.; Formal Analysis, N.P., S.F., A.K., W.V. and J.Z.; Investigation, N.P. and J.Z.; Resources, T.M., K.L. and J.Z.; Data Curation, N.P. and W.V.; Writing—Original Draft Preparation, N.P.; Writing—Review and Editing, N.P., F.G., T.M., A.P., N.M., I.S., K.L., S.F., A.K., W.V. and J.Z.; Visualization, N.P. and W.V.; Supervision, N.P., T.M., K.L., A.K. and J.Z.; Project Administration, N.P., F.G., T.M., K.L. and J.Z.; Funding Acquisition, N.P., F.G., T.M., K.L. and J.Z. All authors have read and agreed to the published version of the manuscript.

Funding

This research was co-funded by the EU LIFE+ project “Food for Feed: An Innovative Process for Transforming Hotels’ Food Wastes into Animal Feed”, with acronym LIFE-F4F (LIFE15 ENV/GR/000257) and the Green Fund of the Hellenic Ministry for the Environment and Energy.

Institutional Review Board Statement

The study received approval by the Landesamt für Gesundheit und Soziales (LAGe-So) in Berlin, Germany (approval number G 0233/18).

Informed Consent Statement

Not applicable.

Data Availability Statement

As mentioned in the manuscript, the sequencing data are available at the NCBI BioProject database (ID PRJNA755187). Further raw data of this study are available on request from the corresponding author.

Conflicts of Interest

The authors declare no conflict of interest.

References

  1. Westendorf, M.L. Food waste as animal feed: An introduction. In Food Waste to Animal Feed; Westendorf, M.L., Ed.; Iowa State University Press: Ames, IA, USA, 2000; pp. 91–111. [Google Scholar]
  2. Regulation (EC) No 1069/2009 of the European Parliament and of the Council of 21 October 2009 Laying down Health Rules as Regards Animal by-Products and Derived Products Not Intended for Human Consumption and Repealing Regulation (EC) No 1774/2002 (Animal by-Products Regulation). 2009. Available online: https://eur-lex.europa.eu/legal-content/EN/TXT/PDF/?uri=CELEX:32009R1069&from=EN (accessed on 2 August 2021).
  3. Commission Regulation (EU) No 142/2011 of 25 February 2011 Implementing Regulation (EC) No 1069/2009 of the European Parliament and of the Council Laying down Health Rules as Regards Animal by-Products and Derived Products Not Intended for Human Consumption and Implementing Council Directive 97/78/EC as Regards Certain Samples and Items Exempt from Veterinary Checks at the Border under that Directive 2011. Available online: https://eur-lex.europa.eu/legal-content/EN/TXT/PDF/?uri=CELEX:32011R0142&from=EN (accessed on 2 August 2021).
  4. FAO. Global Food Losses and Food Waste–Extent, Causes and Prevention; FAO: Rome, Italy, 2011; Available online: https://www.fao.org/3/mb060e/mb060e00.pdf (accessed on 2 August 2021).
  5. Paßlack, N.; Galliou, F.; Manios, T.; Lasaridi, K.; Tsiplakou, E.; Vahjen, W.; Zentek, J. Impact of the dietary inclusion of dried food residues on the apparent nutrient digestibility and the intestinal microbiota of dogs. Arch. Anim. Nutr. 2021, 1–17. [Google Scholar] [CrossRef]
  6. Bosch, G.; Hagen-Plantinga, E.A.; Hendriks, W.H. Dietary nutrient profiles of wild wolves: Insights for optimal dog nutrition? Br. J. Nutr. 2015, 113, S40–S54. [Google Scholar] [CrossRef] [PubMed] [Green Version]
  7. National Research Council (NRC). Nutrient Requirements of Dogs and Cats; The National Academic Press: Washington, DC, USA, 2006. [Google Scholar]
  8. American Society for Testing and Materials (ASTM). Standard Test Method for Determination of the Composition of Unprocessed Municipal Solid Waste, ASTM D5231 (Waste Management Standards)-D5231-92(2008); ASTM International: West Conshohocken, PA, USA, 2008; Available online: https://www.astm.org/Standards/D5231.htm (accessed on 25 September 2017).
  9. Scientific Opinion of the Panel on Biological Hazards on a request from the Health and Consumer Protection, Directorate General, European Commission on Microbiological Risk Assessment in feeding stuffs for food-producing animals. EFSA J. 2008, 720, 1–84.
  10. European Feed Manufacturers’ Guide (EFMC). Community Guide to Good Practice for the Industrial EU Compound Feed and Premixtures Manufacturing Sector for Food Producing Animals. Version 1.2. November 2014. Available online: https://www.fefac.eu/wp-content/uploads/2020/07/efmc_1_2_e_final.pdf (accessed on 15 June 2021).
  11. Commission Regulation (EC) No 2073/2005 of 15 November 2005 on Microbiological Criteria for Foodstuffs. 2005. Available online: https://eur-lex.europa.eu/legal-content/EN/TXT/PDF/?uri=CELEX:32005R2073&from=EN (accessed on 15 June 2021).
  12. Passlack, N.; Zentek, J. Urinary Calcium and Oxalate Excretion in Healthy Adult Cats Are Not Affected by Increasing Dietary Levels of Bone Meal in a Canned Diet. PLoS ONE 2013, 8, e70530. [Google Scholar] [CrossRef] [PubMed] [Green Version]
  13. Bolyen, E.; Rideout, J.R.; Dillon, M.R.; Bokulich, N.A.; Abnet, C.C.; Al-Ghalith, G.A.; Alexander, H.; Alm, E.J.; Arumugam, M.; Asnicar, F.; et al. Reproducible, interactive, scalable and extensible microbiome data science using QIIME 2. Nat. Biotechnol. 2019, 37, 852–857. [Google Scholar] [CrossRef]
  14. Yilmaz, P.; Parfrey, L.W.; Yarza, P.; Gerken, J.; Pruesse, E.; Quast, C.; Schweer, T.; Peplies, J.; Ludwig, W.; Glöckner, F.O. The SILVA and “All-species Living Tree Project (LTP)” taxonomic frameworks. Nucleic Acids Res. 2014, 42, D643–D648. [Google Scholar] [CrossRef] [Green Version]
  15. Paßlack, N.; Kohn, B.; Vahjen, W.; Zentek, J. Effects of dietary cellobiose on the intestinal microbiota and excretion of nitrogen metabolites in healthy adult dogs. J. Anim. Physiol. Anim. Nutr. 2021. [Google Scholar] [CrossRef]
  16. Paßlack, N.; Vahjen, W.; Zentek, J. Dietary inulin affects the intestinal microbiota in sows and their suckling piglets. BMC Vet. Res. 2015, 11, 51. [Google Scholar] [CrossRef] [Green Version]
  17. Paßlack, N.; Zentek, J.; Larsen, J.A.; Westropp, J.L.; Fascetti, A.J. Impact of hyperlipidaemia on intermediary metabolism, faecal microbial metabolites and urinary characteristics of lipoprotein lipase deficient vs. normal cats. J. Anim. Physiol. Anim. Nutr. 2018, 102, e139–e146. [Google Scholar] [CrossRef] [Green Version]
  18. Chen, C.N.; Chou, C.C.; Tsai, P.S.J.; Lee, Y.J. Plasma indoxyl sulfate concentration predicts progression of chronic kidney disease in dogs and cats. Vet. J. 2018, 232, 33–39. [Google Scholar] [CrossRef]
  19. Eisenhauer, L.; Vahjen, W.; Dadi, T.; Kohn, B.; Zentek, J. Effects of brewer’s spent grain and carrot pomace on digestibility, fecal microbiota, and fecal and urinary metabolites in dogs fed low or high protein diets. J. Anim. Sci. 2019, 97, 4124–4133. [Google Scholar] [CrossRef]
  20. Metsalu, T.; Vilo, J. Clustvis: A web tool for visualizing clustering of multivariate data using Principal Component Analysis and heatmap. Nucleic Acids Res. 2015, 43, W566–W570. [Google Scholar] [CrossRef]
  21. Marsilio, S.; Pilla, R.; Sarawichitr, B.; Chow, B.; Hill, S.L.; Ackermann, M.R.; Scot Estep, J.; Lidbury, J.A.; Steiner, J.M.; Suchodolski, J.S. Characterization of the fecal microbiome in cats with inflammatory bowel disease or alimentary small cell lymphoma. Sci. Rep. 2019, 9, 19208. [Google Scholar] [CrossRef] [Green Version]
  22. Summers, S.C.; Quimby, J.M.; Isaiah, A.; Suchodolski, J.S.; Lunghofer, P.J.; Gustafson, D.L. The fecal microbiome and serum concentrations of indoxyl sulfate and p-cresol sulfate in cats with chronic kidney disease. J. Vet. Intern. Med. 2019, 33, 662–669. [Google Scholar] [CrossRef]
  23. Kieler, I.N.; Osto, M.; Hugentobler, L.; Puetz, L.; Gilbert, M.T.P.; Hansen, T.; Pedersen, O.; Reusch, C.E.; Zini, E.; Lutz, T.A.; et al. Diabetic cats have decreased gut microbial diversity and a lack of butyrate producing bacteria. Sci. Rep. 2019, 9, 4822. [Google Scholar] [CrossRef]
  24. Deng, P.; Swanson, K.S. Gut microbiota of humans, dogs and cats: Current knowledge and future opportunities and challenges. Br. J. Nutr. 2015, 113, S6–S17. [Google Scholar] [CrossRef]
  25. Carlson, J.L.; Erickson, J.M.; Hess, J.M.; Gould, T.J.; Slavin, J.L. Prebiotic Dietary Fiber and Gut Health: Comparing the in Vitro Fermentations of Beta-Glucan, Inulin and Xylooligosaccharide. Nutrients 2017, 9, 1361. [Google Scholar] [CrossRef] [Green Version]
  26. Gupta, R.S.; Nanda, A.; Khadka, B. Novel molecular, structural and evolutionary characteristics of the phosphoketolases from bifidobacteria and Coriobacteriales. PLoS ONE 2017, 12, e0172176. [Google Scholar] [CrossRef]
  27. Saha, S.; Jeon, B.-H.; Kurade, M.B.; Govindwar, S.P.; Chatterjee, P.K.; Oh, S.-E.; Roh, H.-S.; Lee, S.S. Interspecies microbial nexus facilitated methanation of polysaccharidic wastes. Bioresour. Technol. 2019, 289, 121638. [Google Scholar] [CrossRef]
  28. Fekete, S.G.; Hullár, I.; Andrásofszky, E.; Kelemen, F. Effect of different fibre types on the digestibility of nutrients in cats. J. Anim. Physiol. Anim. Nutr. (Berl.) 2004, 88, 138–142. [Google Scholar] [CrossRef]
  29. Fischer, M.M.; Kessler, A.M.; de Sá, L.R.M.; Vasconcellos, R.S.; Roberti Filho, F.O.; Nogueira, S.P.; Oliveira, M.C.C.; Carciofi, A.C. Fiber fermentability effects on energy and macronutrient digestibility, fecal traits, postprandial metabolite responses, and colon histology of overweight cats. J. Anim. Sci. 2012, 90, 2233–2245. [Google Scholar] [CrossRef] [PubMed]
  30. Kienzle, E.; Schuhknecht, A. Struvite stone dietetics: 1. Effect of different feed rations on the urine pH value of cats. Dtsch. Tierarztl. Wochenschr. 1993, 100, 198–203. [Google Scholar]
  31. Glorieux, G.; Gryp, T.; Perna, A. Gut-Derived Metabolites and Their Role in Immune Dysfunction in Chronic Kidney Disease. Toxins 2020, 12, 245. [Google Scholar] [CrossRef] [Green Version]
  32. Diether, N.E.; Willing, B.P. Microbial Fermentation of Dietary Protein: An Important Factor in Diet⁻Microbe⁻Host Interaction. Microorganisms 2019, 7, 19. [Google Scholar] [CrossRef] [Green Version]
  33. Bermingham, E.N.; Kittelmann, S.; Henderson, G.; Young, W.; Roy, N.C.; Thomas, D.G. Five-week dietary exposure to dry diets alters the faecal bacterial populations in the domestic cat (Felis catus). Br. J. Nutr. 2011, 106, S49–S52. [Google Scholar] [CrossRef] [Green Version]
  34. Alltech’s 10th-Annual Global Feed Survey. 2021. Available online: https://one.alltech.com/wp-content/uploads/2021/01/2021_alltech_global_feed_survey-1.pdf (accessed on 9 August 2021).
Figure 1. Principal component analysis of the fecal microbiota of cats (n = 7) fed a diet without or with 5, 10 and 15% dried food residues (DFR). The prediction ellipses show a 95% probability for new observations to fall inside these ellipses.
Sustainability 13 11603 g001
Table 1. Composition of the experimental diets with or without dried food residues (DFR).
Ingredient (%)0% DFR5% DFR10% DFR15% DFR
Ground beef81.078.976.575.1
Rice flour12.410.528.515.59
Rapeseed oil3.182.562.091.68
Cellulose0.800.560.390.17
Vitamin and Mineral premix0.440.450.460.48
Potassium hydrogen carbonate0.200.140.08-
Sodium chloride0.300.170.08-
Blood meal0.510.600.700.80
Magnesium supplement0.020.020.01-
B Vitamin Supplement0.070.080.100.08
Dicalcium phosphate0.120.090.08-
Calcium carbonate0.580.560.500.50
Cod liver oil0.180.190.200.20
DFR 1-4.9610.115.2
Titanium dioxide0.200.200.200.20
1 Composition of the DFR, per wet weight of the non-dried food residues [5]: fresh fruits (44.4%), cooked meals and snacks (25.4%), fresh vegetables and salads (13.9%), bread and bakery (5.71%), meat and fish (4.90%), dairy products (excluding milk) and eggs (0.79%), impurities (0.74%; manually removed before the further processing of the food residues), sauces, herbs and spices (0.34%), desserts (0.22%), confectionary and snacks (0.09%), processed fruits (0.03%), and others (3.48%).
Table 2. Analyzed dry matter and nutrient concentrations of the experimental diets.
0% DFR 15% DFR10% DFR15% DFR
g/100 g
Dry matter42.043.244.645.3
g/100 g dry matter
Crude ash5.075.025.235.15
Crude protein41.841.841.542.3
Crude fat24.825.025.526.4
Crude fiber1.221.361.081.57
Calcium0.670.660.610.65
Phosphorus0.520.530.540.53
Potassium0.930.880.920.92
Magnesium0.120.120.120.13
Sodium0.450.430.480.49
Titanium dioxide0.430.450.440.44
mg/100 g dry matter
Copper1.021.151.211.18
Zinc20.620.518.619.3
Iron13.314.214.315.3
Manganese1.751.771.631.71
1 Analysis of the dried food residues (DFR): dry matter 91.2 g/100 g; per 100 g dry matter: crude ash 5.97 g, crude protein 25.9 g, crude fat 24.7 g, crude fiber 3.46 g, calcium 0.61 g, phosphorus 0.42 g, potassium 0.87 g, magnesium 0.09 g, sodium 0.82 g [5].
Table 3. Feed intake, body weight, fecal dry matter, and apparent crude protein and crude fat digestibility of cats (n = 7) fed a diet with varying amounts of dried food residues (DFR).
0% DFR5% DFR10% DFR15% DFRPolynomial Contrasts
(P Value)
Lin.Quadr.
Feed intake (g dry matter/kg body weight/day)10.1 ± 1.5110.1 ± 1.279.60 ± 1.169.33 ± 1.250.1690.661
Body weight (kg)5.36 ± 1.145.79 ± 1.195.99 ± 1.085.95 ± 1.170.1350.092
Fecal dry matter (%)44.4 ± 11.541.0 ± 11.943.6 ± 6.8041.3 ± 6.100.9740.335
Apparent crude protein digestibility (%)93.9 ± 2.0692.8 ± 1.9091.4 ± 1.5790.0 ± 1.910.0070.870
Apparent crude fat digestibility (%)97.3 ± 2.2397.4 ± 0.5696.5 ± 1.9096.0 ± 1.310.0620.196
Lin.: Linear; Quadr.: Quadratic.
Table 4. Alpha diversity indices of the fecal microbiota of cats (n = 7) fed a diet with varying amounts of dried food residues (DFR).
0% DFR
(n = 7)
5% DFR
(n = 6)
10% DFR
(n = 7)
15% DFR
(n = 7)
Polynomial Contrasts
(P Value)
LinearQuadratic
Richness33.0 ± 6.3836.5 ± 4.0446.9 ± 5.5851.4 ± 5.770.0010.075
Shannon1.46 ± 0.451.91 ± 0.212.17 ± 0.162.37 ± 0.140.0110.297
Evenness0.42 ± 0.120.53 ± 0.050.56 ± 0.030.60 ± 0.040.0430.194
Simpson0.33 ± 0.140.24 ± 0.050.18 ± 0.040.15 ± 0.040.0430.310
Table 5. Relative abundance (%) of dominant bacterial phyla in the feces of cats (n = 7) fed a diet with varying amounts of dried food residues (DFR).
0% DFRn 15% DFRn10% DFRn15% DFRnPolynomial contrasts
(P value)
LinearQuadratic
Actinobacteria42.3 ± 33.7(7)42.7 ± 31.8(6)52.8 ± 14.6(7)37.4 ± 8.19(7)0.6740.008
Bacteroidetes8.42 ± 16.3(5)8.42 ± 17.3(6)2.76 ± 2.03(7)9.07 ± 5.04(7)0.7860.379
Firmicutes51.5 ± 32.0(7)48.6 ± 28.8(6)44.3 ± 15.5(7)53.2 ± 7.36(7)0.6860.031
Fusobacteria0.08 ± 0.04(3)0.54 ± 0.45(3) (0)0.34 ± 0.57(4)**
1 Number of positive samples; * Polynomial contrasts could not be calculated.
Table 6. Relative abundance (%) of dominant bacterial orders in the feces of cats (n = 7) fed a diet with varying amounts of dried food residues (DFR).
0% DFRn 15% DFRn10% DFRn15% DFRnPolynomial Contrasts (P Value)
Lin.Quadr.
Bacteroidales8.41 ± 16.3(5)8.41 ± 17.3(6)2.76 ± 2.03(7)9.07 ± 5.04(7)0.7860.380
Bifidobacteriales32.0 ± 31.4(5)27.6 ± 25.0(5)21.9 ± 17.4(7)2.37 ± 3.29(7)0.2310.064
Clostridiales43.8 ± 27.7(7)44.9 ± 30.4(6)39.5 ± 16.5(7)42.1 ± 10.3(7)0.4040.688
Coriobacteriales19.4 ± 19.8(7)19.6 ± 11.5(6)30.9 ± 7.77(7)35.0 ± 7.92(7)<0.0010.113
Erysipelotrichales3.22 ± 2.38(7)1.72 ± 1.17(6)2.93 ± 1.66(7)5.54 ± 3.59(7)0.0510.013
Fusobacteriales0.08 ± 0.04(3)0.54 ± 0.45(3) (0)0.34 ± 0.57(4)**
Lactobacillales6.87 ± 13.1(4)1.04(1)0.03(2)0.55 ± 1.02(4)**
Selenomonadales0.56 ± 0.72(5)1.80 ± 2.50(6)2.23 ± 1.55(6)5.25 ± 6.54(7)0.4930.809
Unknown Firmicutes0.73(2) (0) (0)0.05(2)**
1 Number of positive samples; * Polynomial contrasts could not be calculated; Lin.: Linear; Quadr.: Quadratic.
Table 7. Relative abundance (%) of dominant bacterial genera in the feces of cats (n = 7) fed a diet with varying amounts of dried food residues (DFR).
0% DFRn 15% DFRn10% DFRn15% DFRnPolynomial Contrasts (P Value)
Lin.Quadr.
Alloprevotella0.74 ± 0.89(4)1.47 ± 2.51(5)0.15 ± 0.08(6)3.31 ± 4.79(5)0.5380.467
Bacteroides0.47 ± 0.46(5)0.58 ± 0.55(6)0.40 ± 0.21(7)0.73 ± 0.58(7)0.8300.748
Bifidobacterium32.0 ± 31.3(5)27.5 ± 24.9(5)21.8 ± 17.4(7)2.35 ± 3.27(7)0.2300.064
Blautia24.8 ± 20.4(7)20.8 ± 15.2(6)17.0 ± 7.61(7)16.4 ± 2.27(7)0.3610.615
Clostridium sensu stricto 16.89 ± 11.6(7)4.54 ± 6.81(6)1.73 ± 2.44(3)0.05 ± 0.03(3)0.2980.386
Collinsella11.0 ± 10.8(7)13.8 ± 8.62(6)23.9 ± 5.82(7)28.7 ± 8.70(7)0.0030.799
Faecalibacterium (0)0.64(1)0.17 ± 0.16(6)0.12 ± 0.14(6)**
Fusobacterium0.08 ± 0.04(3)0.50 ± 0.42(3) 0.34 ± 0.57(4)**
Holdemanella1.18 ± 1.70(4)0.79 ± 1.04(5)1.00 ± 0.90(7)1.84 ± 1.39(6)0.1750.348
Lachnoclostridium1.68 ± 1.17(7)4.46 ± 3.38(6)3.68 ± 1.54(7)4.95 ± 1.87(7)0.0270.234
Lachnospira (0)0.67(2)1.19 ± 1.16(3)0.34 ± 0.28(3)**
Lachnospiraceae NK4A136 group0.12 ± 0.07(5)0.56 ± 0.75(4)0.22 ± 0.17(7)0.17 ± 0.09(7)0.1490.401
Lactobacillus (0)1.03(1)0.02(1)0.01(2)**
Libanicoccus0.12 ± 0.08(5)0.16 ± 0.14(5)0.46 ± 0.19(7)0.50 ± 0.15(7)0.0030.945
Marvinbryantia0.64 ± 0.14(4)1.37 ± 0.70(3)0.58 ± 0.33(5)0.39 ± 0.21(7)0.1310.035
Megamonas0.11 ± 0.14(4)1.11 ± 1.61(4)0.22 ± 0.30(5)0.30 ± 0.39(5)0.8810.520
Megasphaera0.26 ± 0.33(4)1.67 ± 2.52(3)1.60 ± 1.10(6)6.39 ± 6.88(5)**
Olsenella14.1 ± 27.3(4)10.7 ± 14.0(3)6.77 ± 4.59(6)4.62 ± 5.49(7)0.9140.480
Paeniclostridium0.71 ± 0.54(6)0.27 ± 0.13(3) (0) (0)**
Peptoclostridium3.54 ± 1.85(7)4.76 ± 4.27(6)3.65 ± 2.94(7)5.01 ± 2.65(7)0.5880.812
Prevotella 912.1 ± 19.3(3)6.50 ± 14.6(6)2.08 ± 1.75(7)5.68 ± 3.82(7)0.6530.331
Romboutsia0.21 ± 0.12(4)0.53 ± 0.72(4)0.22 ± 0.16(5)0.41 ± 0.23(4)0.0270.396
Sellimonas0.50 ± 0.42(6)0.77 ± 0.69(4)0.69 ± 0.54(7)0.42 ± 0.43(6)0.8340.540
Solobacterium2.28 ± 2.46(7)0.98 ± 0.77(5)1.68 ± 1.73(7)3.57 ± 2.67(7)0.3840.164
Streptococcus6.62 ± 12.6(4) (0)0.04(1)1.06(2)**
Subdoligranulum0.07(2)2.50 ± 3.78(3)4.01 ± 7.57(7)3.77 ± 6.54(7)**
Unknown Clostridiales Family XIII0.52 ± 0.39(6)0.35 ± 0.24(6)0.48 ± 0.59(7)0.98 ± 1.17(7)0.9050.540
Unknown Lachnospiraceae3.74 ± 2.26(7)4.98 ± 3.04(6)6.00 ± 2.06(7)7.03 ± 1.76(7)0.0690.865
1 Number of positive samples; * Polynomial contrasts could not be calculated; Lin.: Linear; Quadr.: Quadratic.
Table 8. Concentrations of bacterial metabolites in the feces of cats (n = 7) fed a diet with varying amounts of dried food residues (DFR).
0% DFR5% DFR10% DFR15% DFRPolynomial Contrasts
(P Value)
LinearQuadratic
µmol/g
Ammonium25.0 ± 6.1721.4 ± 4.4320.7 ± 6.9623.4 ± 7.660.1470.491
L-lactate0.04 ± 0.070.15 ± 0.270.00 ± 0.000.00 ± 0.000.1300.338
D-lactate0.08 ± 0.110.30 ± 0.490.02 ± 0.030.05 ± 0.090.2010.340
Acetic acid69.4 ± 42.161.2 ± 15.267.4 ± 31.293.8 ± 49.00.1880.253
Propionic acid27.9 ± 15.529.8 ± 6.4033.3 ± 11.845.8 ± 19.80.0250.485
i-butyric acid3.62 ± 1.143.22 ± 0.743.87 ± 0.964.72 ± 1.950.0990.245
n-butyric acid15.6 ± 7.7813.5 ± 5.9714.7 ± 3.8615.2 ± 7.520.2250.808
i-valeric acid4.41 ± 1.313.57 ± 1.384.68 ± 1.215.19 ± 2.360.4160.273
n-valeric acid6.42 ± 3.135.68 ± 4.468.29 ± 2.739.19 ± 4.540.0160.709
Total SCFA127 ± 66.0117 ± 22.8127 ± 57.8174 ± 81.80.0890.215
% SCFA
Acetic acid51.0 ± 9.2852.1 ± 6.8649.6 ± 4.7252.9 ± 4.710.6730.592
Propionic acid21.4 ± 2.2025.6 ± 3.3225.3 ± 2.6226.7 ± 2.350.0030.158
i-butyric acid3.44 ± 1.452.82 ± 0.793.08 ± 0.532.83 ± 0.620.3250.463
n-butyric acid13.8 ± 4.7711.5 ± 3.8811.6 ± 1.749.05 ± 2.250.0320.883
i-valeric acid4.58 ± 2.693.16 ± 1.383.77 ± 1.013.13 ± 0.880.2430.571
n-valeric acid5.77 ± 2.864.86 ± 3.486.60 ± 1.815.44 ± 1.400.4010.685
Lin.: Linear; Quadr.: Quadratic; SCFA: Short-chain fatty acids.
Table 9. Phenol and indole concentrations 1 in the urine of cats (n = 7) fed a diet with varying amounts of dried food residues (DFR).
0% DFR5% DFR10% DFR15% DFRPolynomial Contrasts (P Value)
Lin.Quadr.
pH8.20 ± 0.227.94 ± 0.357.81 ± 0.307.67 ± 0.280.0020.586
µg/mL
Phenol0.14 ± 0.070.28 ± 0.160.17 ± 0.060.27 ± 0.180.3860.452
4-ethylphenol0.01 ± 0.010.01 ± 0.020.01 ± 0.020.05 ± 0.060.2240.162
3-methylphenol0.10 ± 0.020.08 ± 0.030.10 ± 0.030.12 ± 0.100.4470.884
7-methylphenol0.08 ± 0.040.03 ± 0.030.02 ± 0.010.01 ± 0.020.0070.037
p-cresol0.53 ± 0.470.62 ± 0.241.20 ± 0.351.78 ± 0.700.0080.848
Indole0.21 ± 0.480.08 ± 0.070.15 ± 0.100.19 ± 0.080.7680.381
Indoxyl sulfate2.43 ± 0.631.63 ± 1.172.02 ± 0.882.26 ± 1.170.3150.069
1 2-methylphenol, 2,3-dimethylphenol: most values were below the detection limit; Lin: Linear; Quadr.: Quadratic.
Table 10. Phenol and indole concentrations 1 in the plasma of cats (n = 7) fed a diet with varying amounts of dried food residues (DFR).
0% DFR5% DFR10% DFR15% DFRPolynomial Contrasts
(P Value)
Lin.Quadr.
µg/mL
p-cresol0.52 ± 0.510.67 ± 0.920.57 ± 0.390.75 ± 0.450.3730.945
Phenol0.59 ± 0.170.53 ± 0.010.53 ± 0.010.56 ± 0.020.5700.292
mg/mL
Indoxyl sulfate3.01 ± 1.041.56 ± 1.312.82 ± 1.663.03 ± 1.070.0330.037
1 indole, 3-methylindole: all values were below the detection limit.
Publisher’s Note: MDPI stays neutral with regard to jurisdictional claims in published maps and institutional affiliations.

