Article

Achieving the Food Security Strategy by Quantifying Food Loss and Waste. A Case Study of the Chinese Economy

by
Daniel Durán-Sandoval
1,
Gemma Durán-Romero
2,* and
Ana M. López
1
1
Instituto L.R. Klein, UUniversidad Autónoma de Madrid, 28049 Madrid, Spain
2
Departamento de Estructura Económica y Economía del Desarrollo, Universidad Autónoma de Madrid, 28049 Madrid, Spain
*
Author to whom correspondence should be addressed.
Sustainability 2021, 13(21), 12259; https://0-doi-org.brum.beds.ac.uk/10.3390/su132112259
Submission received: 30 September 2021 / Revised: 1 November 2021 / Accepted: 3 November 2021 / Published: 6 November 2021

Abstract

:
Undernourished and food insecurity are recognized as two highly relevant topics. Approximately 820 million people in the world are undernourished and 2 billion people have moderate or severe food insecurity (FAO). In addition, globally roughly one-third of food is not consumed and is wasted. This article aims to provide an updated estimate of food loss and waste (FLW) in China as, in the period 2016–2018, there were still 122 million people in this country experiencing undernourishment. In this research, we use a top-down mass balance approach, discuss how it affects the achievement of SDG 2, Zero Hunger, that it is linked also to target 12.3 that “seeks to halve global food waste at retail and consumer levels, as well as to reduce food loss during production and supply” (United Nations). We point out some challenges that private and public policies still need to overcome to reduce FLW. The results of this research may contribute a more accurate baseline for the design of public policies and strategies related to FLW and the corresponding SDGs.

1. Introduction

In recent times the issue of food losses and waste of food (FLW) has received increased academic and political attention. Although the definition of FLW is not clear, the truth is that globally roughly one-third of food is not consumed and is wasted, equivalent to 1.3. billion tonnes per year [1]. The reasons for FLW differ between countries. In developed countries, most FLW occurs at the retail, foodservice and, home stages of the food supply chain for a variety of reasons [2,3]. For instance, food not used in time, burning, spoilage, personal preferences or, leftover waste [4,5]. While in developing countries FLW is mainly due to the absence of infrastructure, lack of knowledge and, investment in storage technologies [1,6].
To end hunger, achieve food security, improve nutrition and food waste is the aim of Sustainable Development Goal 2 (SDG2), one of the 17 SDGs adopted by United Nations Members States in 2015. This goal is reinforced by target 12.3 focus on Zero Hunger and food waste. Specifically, it indicates to “end hunger, achieve food security and improved nutrition and promote sustainable agriculture” and “to halve global food waste at retail and consumer levels, as well as to reduce food loss during production and supply” [7]. However, despite these key objectives, about 820 million people in the world are undernourished and 2 billion people have moderate or severe food insecurity [8]. One of the most striking cases is that of China, which has 22% of the world’s population and whose economy was ranked in 2018 as the second largest in the world with a GDP of 13.6 trillion US dollars [9]. Furthermore, GDP per capita growth between 1980–2018 was 8.5% annual average, with an income increase from 347 US dollars in 1980 to 7753 US dollars in 2018 [9]. Such economic growth brings an improvement in living standards, including an increase in food consumption. For instance, the domestic supply quantity of the two most consumed food groups in China, namely, vegetables and cereals, has increased from 204 to 572 kg per capita per year between 1980 to 2017, which represents an increase of 280% [10].
Along with this, China has progressed in reducing undernourishment. From 2000–2002 to 2016–2018, China has reduced the number of undernourished people from 209 to 122 million people, equivalent to a reduction of 41% [10]. For instance, the rate of stunting and underweight in children under five years felt by half from 2002 to 2013 [11]. However, the number of people that experience undernourishment is still considerable and the amount of FLW is quite alarming and is increasing dramatically [12,13].
In recent years the Chinese government is concerned to address FLW as a tool to improve food security and reduce environmental problems [12]. Further improving per unit area yield will be hard in the context of limited cultivated land resources, water scarcity, land competition due to industrialization, urbanization, infrastructure development and, ongoing soil erosion and desertification [14]. In addition, the U.S.A-China trade war is having economic effects around the world, particularly in agricultural markets, such as soybeans, pork, fruit, and nuts, due to the endurance of the tariffs [15]. This situation may affect China’s food security, especially considering that it imports about 87% of its consumption of soybean, which is equivalent to 60% of the world’s transactions for this food [15]. In addition, it is important to consider that the Covid-19 pandemic has been the main concern and challenge for humanity and will probably continue to be so for a long time [16]. The pandemic has accelerated some trends that were already emerging for consumer goods companies. Consumers are becoming more mature and demanding, business models have diversified, and competition is increasingly fierce. Despite all the post-pandemic uncertainty, Zipser and Poh [17] point out that the Chinese economy will continue to be the engine driving global consumption growth. According to Laborde et al. [18], the pandemic has affected all the four pillars of food security, especially access to food. Hence, working toward the reduction of FLW, especially in the post-consumer segment, will be critical to future food security [19].
Some studies, such as references [12,13,20,21] have investigated the main general drivers of FLW, as well as the patterns and scale of FLW in China. However, they are limited in some groups of products and stages of the food supply chain (FSC). On the other hand, the scale of the problem needs to deepen since it threatens food security which remains a priority, and to uncover new rationales due to the impact of China’s large population on the global food market, that only has 7% of the world’s arable land, and its use of resources and greenhouse gas emission [22]. Furthermore, no studies have analyzed the potential of FLW to contribute to the SDGs in China or other countries. Reducing food loss is not a direct guarantee for achieving sustainable development goals, but it can be seen as an indirect indicator of progress in performance. Positive results in reducing food loss and waste cannot be guaranteed. Moreover, the final impacts will vary depending on where losses and waste are reduced (supply chains). This is precisely why policymakers must be clear about the objectives to be achieved [8].
The above studies contribute to the study of FLW but they have some limitations. In this context, this article attempts to address these constraints by expanding the range of products and foods investigated, including all stages of the FSC, and updating the data to estimate FLW. It analyses the impact of FLW on the SDGs and points out some challenges that public policies still need to face to reduce FLW and its negative impacts.
The structure of the article is divided as follows. First, a theoretical background where the concept of FLW and food security, its relationship with the SDG 2 Zero Hunger, and the patterns and scale of FLW in China are discussed. Second, a method is introduced to estimate FLW for different products at each stage of the FSC, as an improvement on other estimation methods that are limited to some product groups and FSC stages. Thirdly, the empirical results are shown based on the available data. Finally, a section that discusses some challenges that public policies must consider to contribute to enhancing food security through the reduction of FLW.

2. Theoretical Background and Literature Review

2.1. Food Loss and Waste

The FAO definition of FLW refers to the decline in mass or quality attributes of food intended for human consumption that are produced throughout the FSC, from initial production down to final domestic consumption [23]. However, there are many different definitions of FLW and they are often controversial [24]. According to Chaboud and Daviron [25] differences in the definition of FLW occur in terms of scope (intended or not for human consumption), timing (pre-harvest, ready for harvest, post-harvest), criteria (use, edibility or nutrition), perspective (environmental, social, food security), and type (qualitative or quantitative).
Also, there were some nuances between the term food loss and food waste. The first term refers to the decrease in the mass of edible food that takes place from production to processing stages in the FSC [26,27]. The second term refers to good quality food suitable for human consumption but not consumed because it is discarded at the end of the FSC, in distribution, retail, and consumption [27,28].
To operationalize the previous definition of FLW other concepts were considered such as food loss and waste rate (FLWR), allocation factors, and conversion factors. The FLWR is defined as the ratio of food loss and waste to the total amount of food production. The allocation factors determine the proportion of food that is destined for human consumption. The conversion factors determine the proportion of food that is edible.

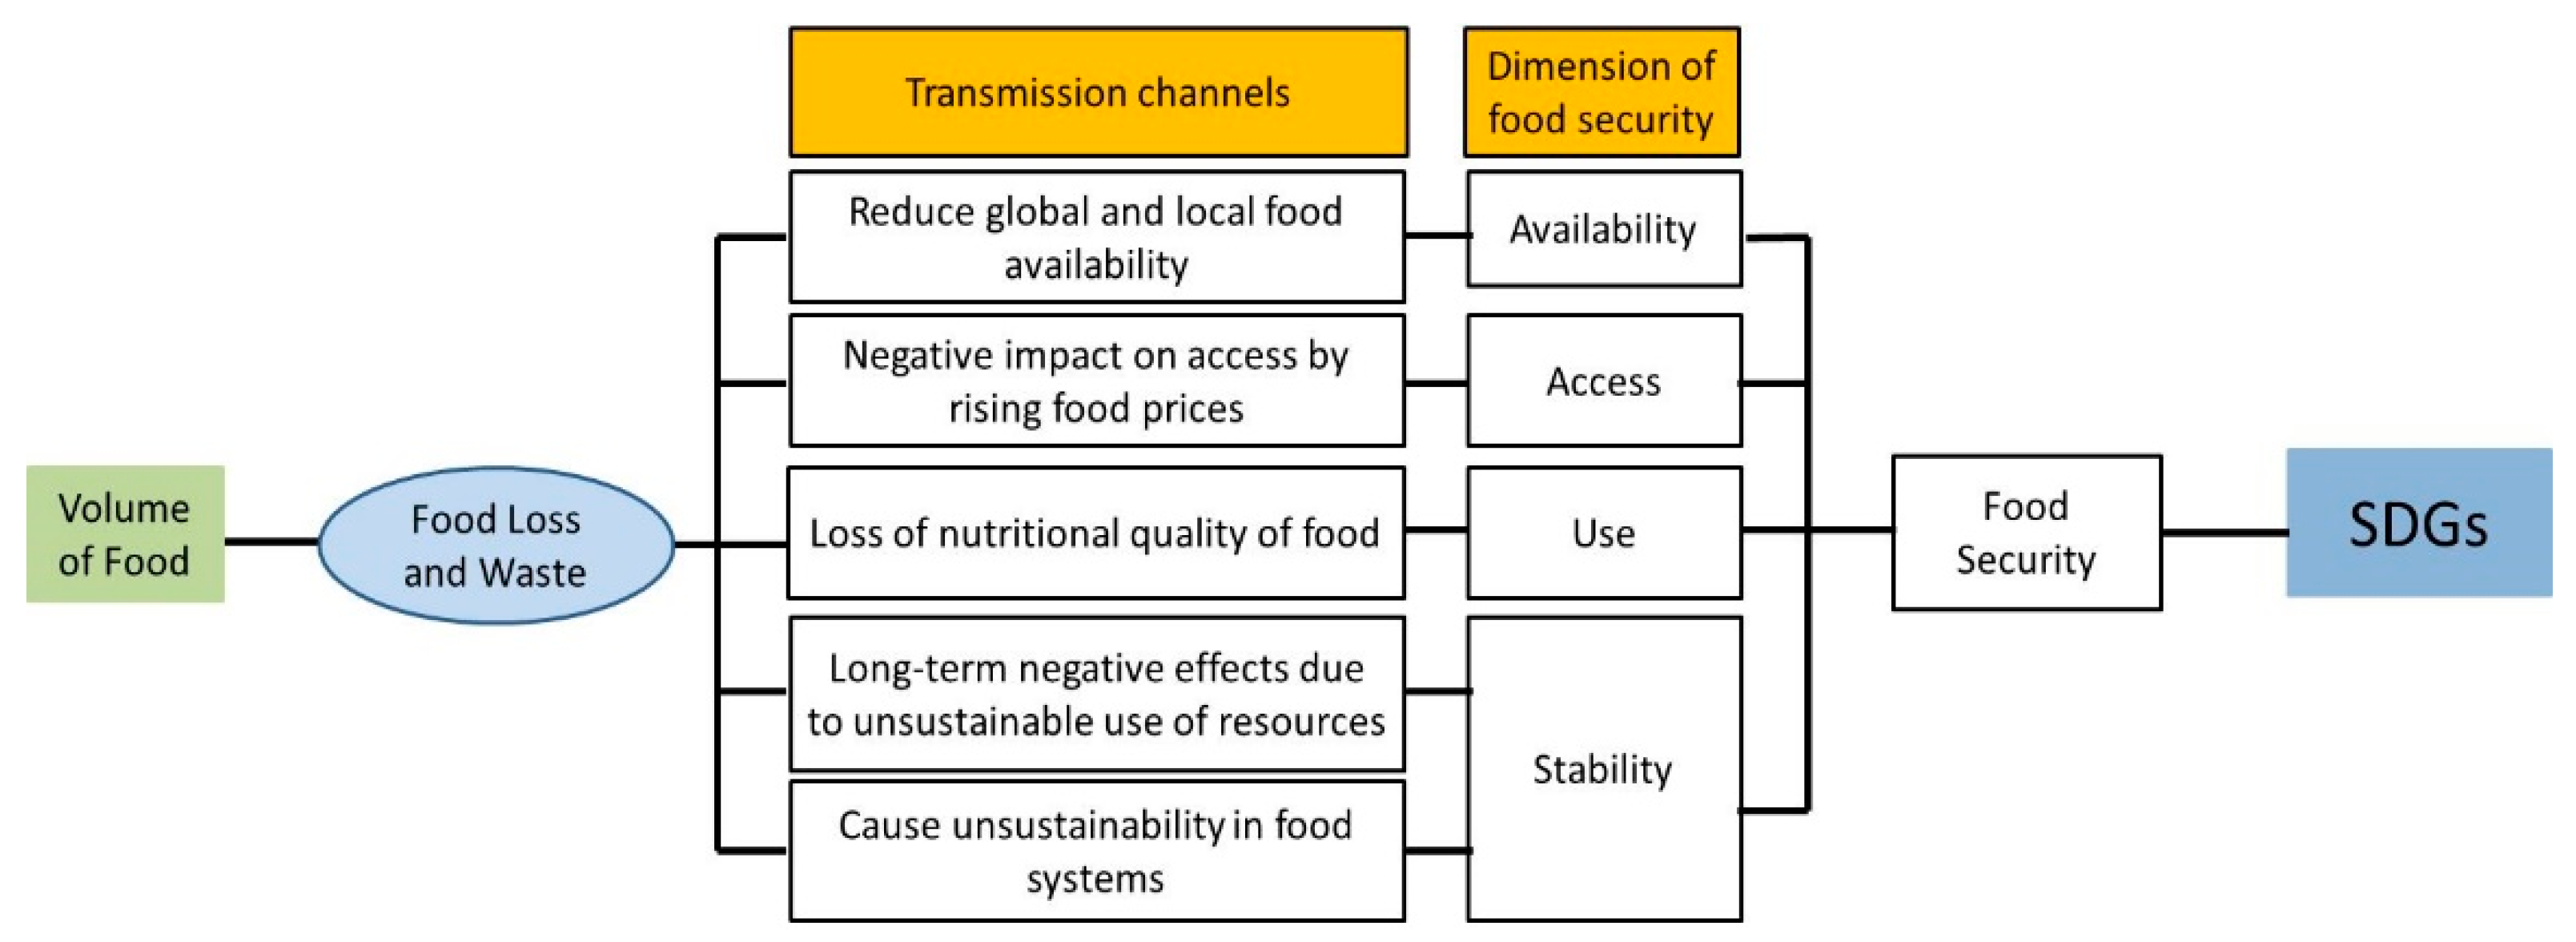
2.2. Food Security and SDG2 Zero Hunger

Firstly, it is important to define the concept of food security. The World Food Summit in 1996 defined food security as “The situation when all people, at all times, have physical, social and economic access to sufficient, safe and nutritious food that meets their dietary needs and food preferences for an active and healthy life” [29]. This widely accepted definition reinforces the multidimensional nature of food security considering its four dimensions, availability, access, use, and stability [30].
Today, FSC has become more globalized, specialized, and complex due to advances in technology and transportation, and the reduction of trade barriers [31]. In globalized food systems, there are a large number of actors that are horizontally and vertically connected. This evolution from traditional agriculture to globalized agriculture has increased the distance between the places where food is produced and consumed [32]. This situation can lead to an increase in the probability of FLW due to a long time between post-harvest and consumption and the large number of transactions involved between the different FSC actors. However, it can also lead to improvements in food security due to the possibility of connecting food producers with populations that suffer from food insecurity. In this sense, the Chinese case is particularly relevant because since 2019 China has been the world′s largest agricultural importer [33].
The commitment to achieve food security was assumed by SDG 2 Zero Hunger, which is specified in eight targets. The first two targets address the problems of micro and macro-nutrient deficiencies. However, they do not face the problems of excessive consumption or consumption of food that are high in salt, fat, and sugar and their subsequent health consequences. SDG targets 2.3 and 2.4 are related to food production, specifically productivity and incomes of small food producers and sustainable food production. The last 4 targets address implementation issues that contribute to the achievement of the first 4 targets, namely genetic diversity, infrastructure and technology, and agricultural trades and markets (Figure 1).
To achieve food security and SDG 2, all FSC is critical, that is, from sustainable food production to responsible consumption. Monitoring FLW can directly contribute to the achievement of the SDGs in different ways. First, control of FLW increases food availability [34], which could improve food security. Second, sustainable food systems with less FLWs could lower the cost of food. According to FAO [1] given the large magnitude of FLW, investments to reduce them could be a way to reduce the cost of food. For example, Lemaire and Limbourg [34] state that reduction of FLW or the donation of food before becoming FLW can lead to a reduction in the cost of food if the cost of that action is lower than the cost of disposal of FLW. Reducing FLW and the cost of food production increase the availability of food in the food market reducing food prices, resulting in improved access to food for vulnerable people [35].
In addition, reducing FLW at the FSC consumption stage could lead to an increase in the consumer’s food budget, improving consumer access to food. In fact, at the household level, Schanes, Doberning and Gözet [36] point out that saving money is the predominant intention behind reducing FLW, before environmental concerns. However, these links between FLW and food prices are not yet well investigated, especially at the quantitative level [35]. Third, the control of FLW implies an increase in the availability of food of high nutritional quality, reducing hunger problems not only with an increase in the availability of food but also by providing food with better nutritional qualities [35]. Fourth, sustainable food systems with fewer FLWs can reduce investment risk for businesses. Thus, it can reduce the volatility of food prices, increasing the stability of the food supply. Markets are currently characterized by low transparency and high volatility in food prices, leading to the exclusion of vulnerable people from food systems [23].
Furthermore, FLW has negative effects on the environment through the waste of water and land, CO2, N2O, and CH4 emissions that cause climate change and damage to biodiversity [37,38]. The deterioration of the environment in turn has negative effects on agriculture, generating a vicious circle [15]. For example, climate change affects the vulnerability of food insecurity due to its biophysical effects on crops, livestock, and the productivity of the agricultural system [39]. In addition, intensive land use causes acidification and degradation of the soil, which reduces the yield of agricultural production.

2.3. Patterns and Scale of Food Loss and Waste in China

Ma et al., [20] pointed out three main general factors to explain FLW in China. First, economic growth and increased income and purchasing power. China’s economy was ranked in 2018 as the second-largest economy in the world. Existing data indicate that per capita food waste in households increases with an increase in GDP per capita [40]. Economic growth implies an increase in the disposable income of households, which makes disposable income-producing that the share of income spent on food is low compared to the available budget of households. Therefore, it could lead to careless behaviours of people related to FLW. Second, the development of agriculture in recent decades. China’s agricultural sector developed significantly in recent decades. For example, in the period from 1980 to 2017, cereal production increased from 232 to 620 million tonnes [10]. Besides, in 2017 China ranked first in the world in meat production, 88 million tonnes, almost double that of the second-largest producer, the United States [10].
Additionally, an industrialization process is underway in Chinese food production, from small domestic animal production to large, industrialized production. According to Wang et al., [41], before 1980, less than 5% of food animals were produced in concentrated animal feeding operations, but in 2010 more than 50% of the animals were raised under these conditions. An increase in food production will eventually increase FLW if the factors that cause FLW are held constant. For example, if a country increases grain production, but storage technology is inefficient and remains constant, FLW will also increase. Third, public policies related to agriculture and food waste. The Chinese government considers cereal production a national priority due to its large population. To meet this objective, the government has promoted a set of public policies to encourage grain production. For instance, the government heavily subsidizes cereal production, provides specialized seeds (elite cultivars) and agricultural machinery to farmers, and provides incentives for surplus agricultural production [20]. Most of these public policies are carried out based on the consumption of inputs. Examples of these public policies are the Comprehensive Subsidy on Agricultural Inputs established in 2006 and the Subsidy for the Purchase of Agricultural Machinery. The previous public policy compensates grain producers for increases in the price of inputs. To this end, the Chinese government budgeted 12 billion yuan in 2006, while this budget increased to 71.6 billion yuan in 2010 [42]. This last public policy aims to help farmers to buy agricultural machinery, subsidizing between 20–30% of the sale price. For this purpose, the Chinese government provided 2 billion yuan in 2007, increasing the budget to 15.5 billion yuan in 2010 [42]. Initially, most public policies related to agricultural production focused on increasing production rather than controlling FLW in the process or promoting sustainable consumption. Therefore, the increase in production caused a concurrent increase in the absolute volume of FLW.
Besides the previous general causes of FLW, there are also specific causes at each particular stage of FSC. In China, 51% of starchy root and 28% of vegetable FLW were produced at the agricultural production stage. The reason is mainly due to diseases, insects, weeds, rodents, severe climatic conditions during planting, and inefficient seeding [43]. Likewise, at this stage, around 38% of fish and seafood, dairy products, and eggs are discarded. During the agricultural production stage, the main causes of FLW from livestock products are death and diseases, such as the death of an animal during breeding for bovine, pork, and poultry meat, discards during the fishing of fish, and the decrease in milk production due to dairy cow diseases such as mastitis [43].
In China, 35% of cereal FLW was produced at the post-harvest and storage stage. The main reason is the fragmented and small-scale structure of the farms [43]. According to Ma et al. [20] in China, 70% of storage is done on small farms. Government grain storage facilities are more efficient and have lower FLW rates than small farms [12]. The main reason for this difference is that small farmers store grain for their self-consumption or even a sales opportunity without the proper facilities or technology. In this sense, SAG and NDRC [44] estimated that on average 49%, 30%, and 21% of Chinese grain waste during storage was caused by rodents, fungi, and insects, respectively.
The economic growth of the last four decades has improved the standards of living of the Chinese population, and now people can buy more food and with better nutritional qualities. Consumption of animal products has also increased, creating more unavoidable waste, for example, animal bones and organs [20]. Increasing population prosperity and the associated changes in consumption trends have increased FLW at the FSC consumption stage. At the same time, according to Liu et al. [12], the traditional Chinese culture of “cherishing food” is fading, which has further contributed to the rise in FLW. Furthermore, some researchers, such as [14,22], state that FLW in restaurants is higher than in canteens and homes. Although several factors could explain this phenomenon, Chinese consumption psychology and other cultural factors have a significant impact [45]. At home and in canteens Chinese people worry more about FLW because of the price of the food they pay. However, in restaurants, consumers often invite their guests, friends, or family and order large quantities of food as an act of “save face” or “mianzi”, resulting in a high level of FLW [14]. For example, at dinners, the host prepares as much food as possible for guests and they should eat as much as possible. According to the Chinese culture of hospitality or “mianzi”, the host will be ashamed if a guest does not have enough to eat [22]. In the consumption stage, a higher level of education leads to a decrease in FLW but also leads to a higher amount of food consumption [46].
Several studies have been developed on the patterns and scale of FLW in China. For example, Liu et al. [12] estimated that in China the maximum total amount of FLW in grains, vegetables, and fruit was 248 million tonnes in 2010. Liu [43] concluded that storage is the largest contributor to post-harvest FLW, specifically on 8.6%, 3.7%, and 15% for grain, meats, and perishable food, respectively. Song et al. [46] stated that an average person wastes 16 kg of food at home annually (consumption is approximately 415 kg). Porter et al. [47] pointed out that in China FLW was 411 million tonnes in 2011. Sun et al. [13] estimated that, at the consumption stage, FLW of cereals and vegetables were 29 and 20.63 million tonnes in 2010, while those of pork and poultry were 1.9 and 0.78 million tonnes. Qi, Lai and Roe [48] reported an annual per capita household food waste of 14.9 kg in 2009. Finally, Li et al. [49] estimated that the average generation of food waste in the rural household is 8.74 g per capita per meal (g/pc/meal).

3. Methodology and Data

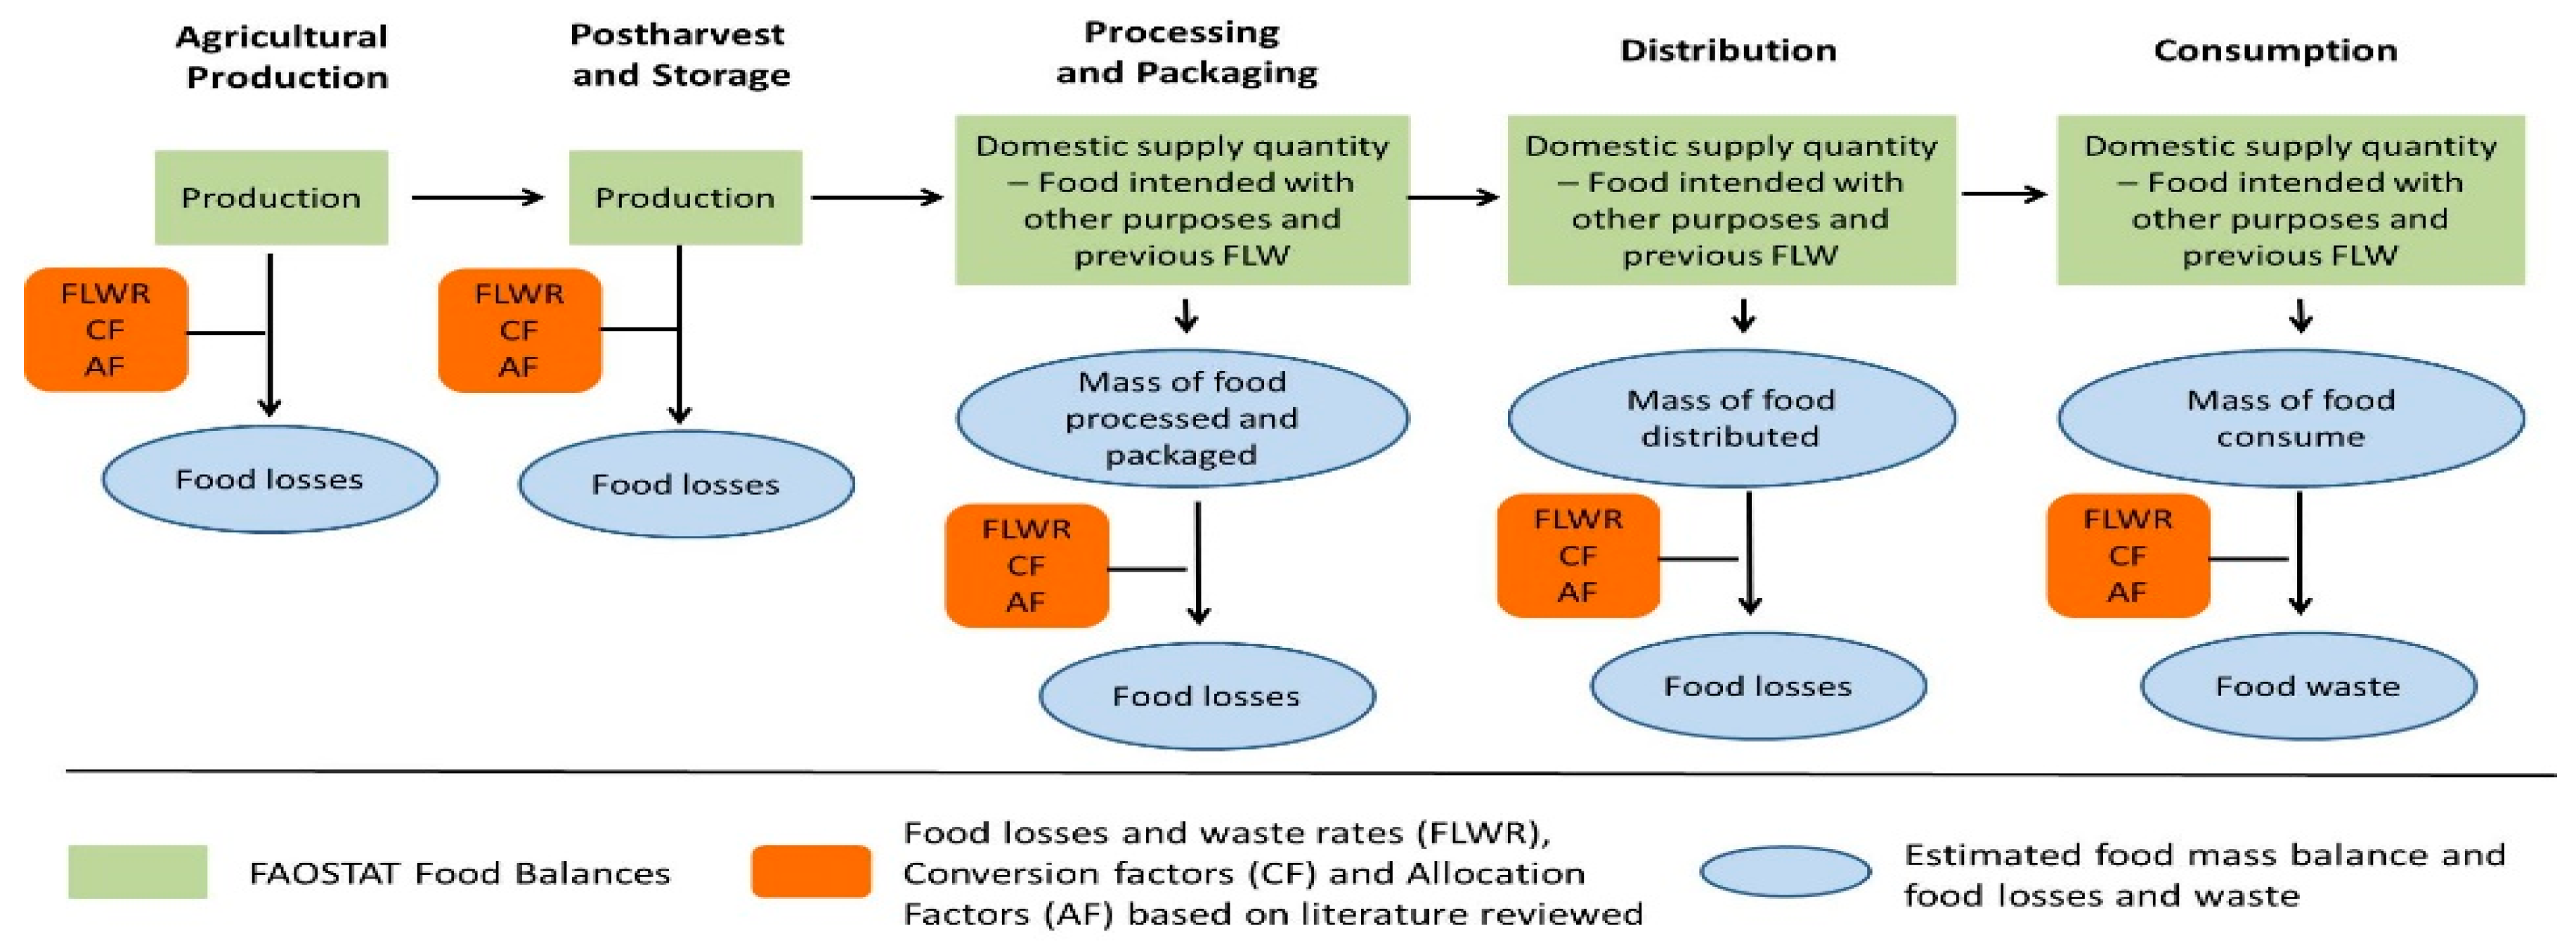
3.1. Method and Calculation of Food Loss and Waste

Regarding the studies mentioned above, it provides important information on the scale and patterns of FLW. However, they are limited in some groups of products and stages of the FSC. For this reason, this article attempts to address these limitations by expanding the range of investigated products and foods, including all FSC stages, and updating the data to estimate FLW. It analyses the impact of FLW on the SDGs and points out some challenges that public policies still have to face to reduce FLW and its negative impacts.
The methodology used in this research is the mass balance method, which was designed by FAO [1] and Gustavsson et al. [50]. This approach consists of inferring the amount of FLW through the difference between inputs and outputs of food, their variations in stocks, and their weight changes during the process [51]. According to Tostivint et al. [52] the mass balance method has the advantage that it can be used to calculate the FLW of solid and liquid food, at each FSC stage and national level or a particular company (Figure 2).
Furthermore, the data required for the use of this method are often readily available and easily accessible, for example, in national statistics [52]. These advantages make this method suitable for the scope of this research because the estimation in this study covers all FSC stages, at a national level in China, and for a wide range of food products. Allocation factors for cereals, oil crops, and legumes were considered because these food groups can be used for other purposes, for instance, to feed animals or produce biofuel. For the rest of the food groups, it was assumed that all production is intended for human consumption. Conversion factors determine the proportion of food that is edible. Conversion factors were assumed for cereals, fish and seafood, fruits, starchy roots, and vegetables because some of these foods are not edible, for example, banana skin. For the rest of the food groups, it was assumed that the entire product is edible.
The following general Equation (1) represents the estimation of FLW.
F L W = i = 1 n Q A i j α i j β i j γ i j
where,
i = Food group, which are cereals, fish and seafood, fruit, meat, milk, eggs, oil crops, pulses, starchy roots, and vegetables;
j = Stage of the FSC, which are agricultural production, postharvest and storage, processing and packaging, distribution, and consumption;
Q A i j = Quantity of food available in the food group i in stage j of the FSC; α i j = Food loss and waste rate (FLWR) in stage j of the FSC, which is defined as the ratio of food loss and waste to the total amount of food production;
β i j = Allocation factor in stage j of the FSC, which defines the proportion of the food that is destined for human consumption;
γ i j = Conversion factor in stage j of the FSC, which defines the proportion of food that is edible.
The amount of edible food mass decreases in FSC in several ways, each with specific causes [12]. Food loss occurs in the agricultural production, post-harvest, processing and packaging, and distribution stages, while food waste occurs in the consumption stage [28].
Therefore, the FLW was calculated by multiplying the amount of food available at each stage of the food chain by FLWR and the allocation and conversion factors.
The per capita FLW is calculated according to the following equation.
F L W P C = F L W P n  
where,
F L W P C = per capita food loss and waste
P n = population.

3.2. Data

The geographical area of this study is China. Data on food production and yield come from FAOSTAT for the year 2017. Population data from the World Bank were used for per capita results. FLWR, conversion, and allocation factors were taken from FAO [1] and Gustavsson et al. [50].
The method and data used in this article have limitations that should be addressed in future research, to obtain a more complete and robust FLW accounting. The following list points out those limitations:
  • The mass balance method generates more aggregated information, for instance at the national level, but at the same time, this information is less accurate than the information generated by other methods, such as the direct weighing method.
  • To conduct this research, FAOSTAT data for a wide range of food groups and FSC stages were used. It is important to note that FAO does not conduct itself research itself in China. The FAO Food Balances data for China include official, semi-official, and estimated or calculated data. In this sense, the FAOSTAT data for all these food groups do not have the same level of accuracy and reliability. In addition, in many countries, FLW is a sensitive political issue for governments, policymakers, national and international organizations and, citizens. Therefore, this situation can create an incentive for the authorities to misinform the actual data on FLW.
  • The FLWR, the conversion factors, and the allocation factors used to estimate the FLW were taken from FAO [1] and Gustavsson et al. [50] who compiled information from scientific journals, on the internet, in statistical databases, national authorities, international organizations, and NGOs from 1997 to 2011. For more details on the data sources and the methods used to estimate FLWR, the conversion, and allocation factors by FAO [1] and Gustavsson [50] see annex 1 to annex 3 of [50]. Furthermore, in this FLWR investigation, the above conversion and allocation factors were compared with data collected by Xue et al. [40] from 1943 to 2015. The studies mentioned above compiled the factors from different studies at the regional level for Industrialized Asia. Therefore, they are not specifically for China and are out of date. This introduces bias in the estimation. However, these disadvantages can be overcome by contrasting the results with studies based on primary food waste data [51,52]. Despite the disadvantages caused by using factors for industrialized Asia as a proxy variable for China, it is still significant to conduct research using these factors and the mass balance method. The reason for the above argument is that the results obtained using the mass balance method provide a broader picture of the structure of FLW in a country [51,52]. This larger picture helps focus future research resources on the nation’s FLW hotspot. Therefore, future research could focus on collecting primary data on food waste in China, to improve the accuracy of the FLWR, conversion, and allocation factor.

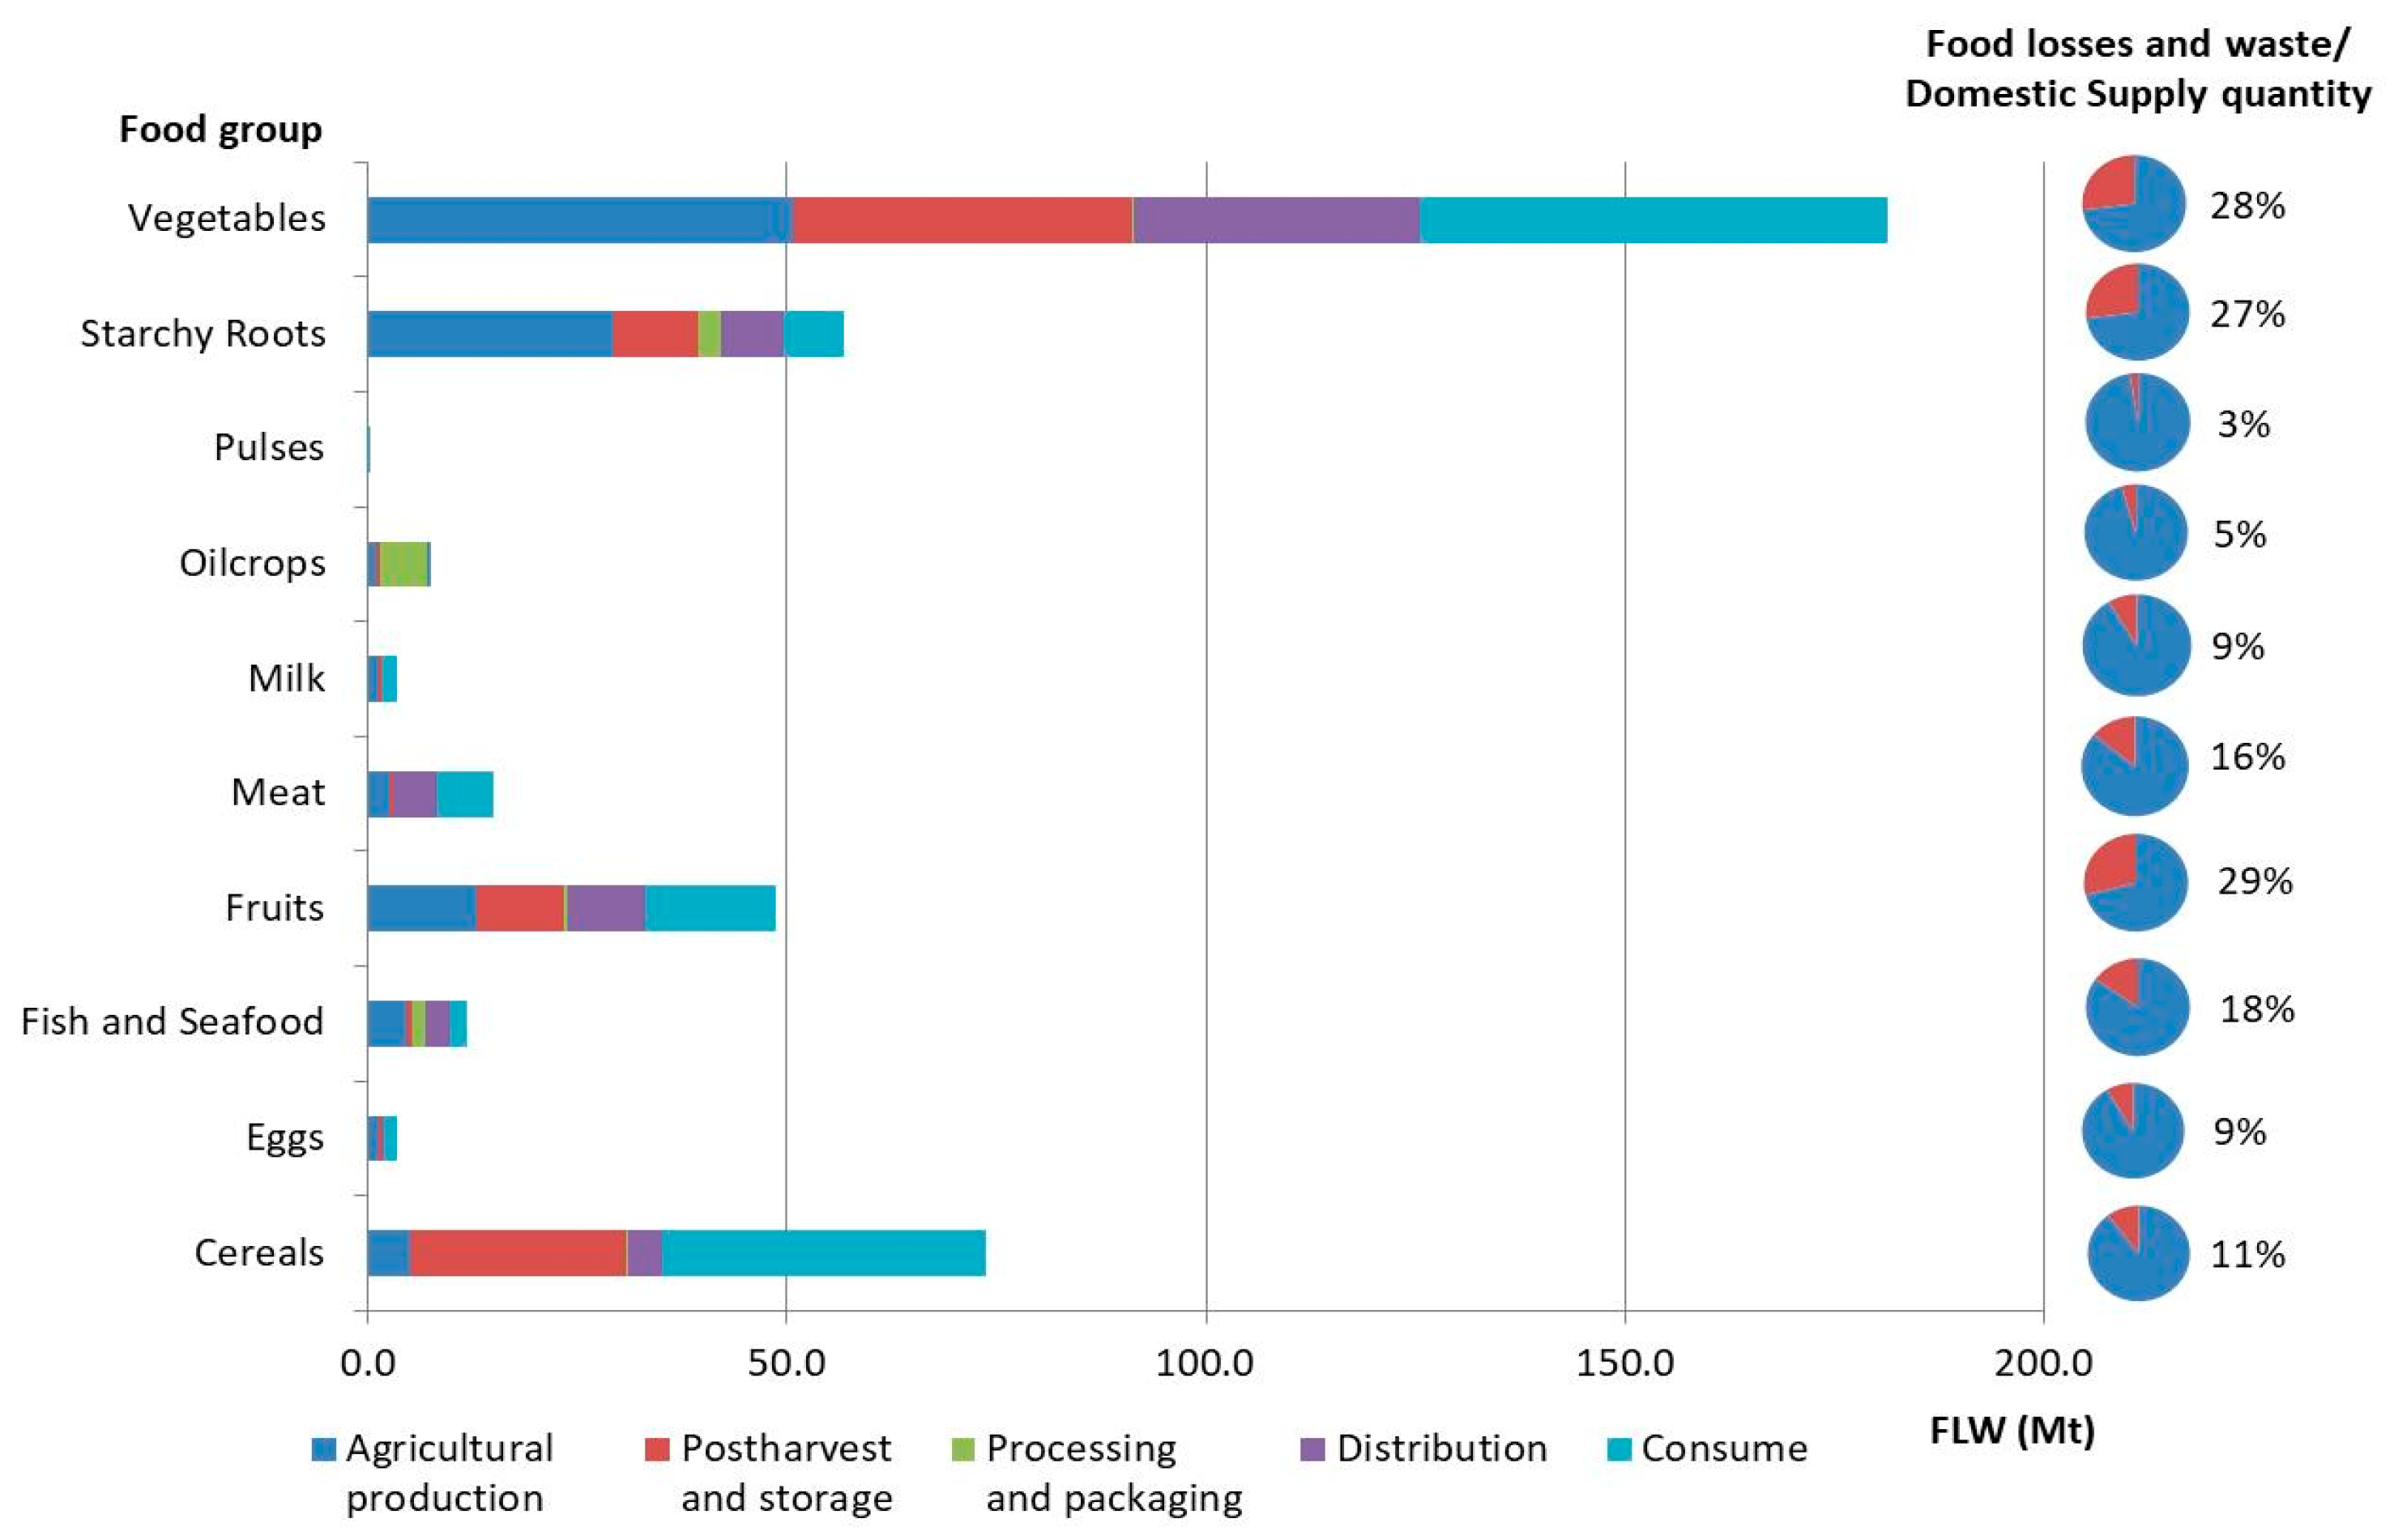
4. Empirical Results and Discussion

In China, the total national food supply was 2064 million tonnes in 2017. Vegetables and cereals accounted for the largest shares, 62% (1284 million tonnes) of the total. The products with the lowest proportion of national supply were dairy products, fish and seafood, and meat, representing in total only 10% (197 million tonnes) (Table 1). The per capita domestic supply was 1421 kg of food.
The results show that in China the total FLW was 401.7 million tonnes of food and, Chinese FLW per capita was equivalent to 277 kg in 2017. This amount is even higher if the conversion factors are not considered, 526 million tonnes. The largest discard was concentrated in vegetables, 181 million tonnes, equivalent to 45% of the total FLW. It was followed by cereals, starchy roots, and fruits, which together accounted for 45% of the discarded food, equivalent to 179 million tonnes. With much lower volumes compared to the previous groups were the other food groups, accounting for 1% to 4% of the food discarded.
The estimates in this article are consistent with the results achieved by Porter et al., [47]. According to these authors, in 2011, the total global FLW was 1629 million tonnes and Chinese FLW accounted for 25% of them (411 million tonnes and 284 kg per capita).
The high volume that Chinese FLW represents compared to total global FLW is due to the large amount of the domestic supply quantity that China has, 25% of the total amount of domestic supply in the world in 2017, but at the same time, in the same year, China had 20% of the world population [10].
The comparison of the estimation between countries and regions shows that the Chinese FLW was almost the same as the estimates for North America and Europe. FAO [1] estimated that in North America the FLW is 280 kg per year per capita, while various estimates based on primary and secondary data suggested that in Europe the FLW per capita is in a range of 158 to 298 kg per year [47,50,53,54,55,56,57,58,59,60].
Developing countries accounted for 75% of global FLW, equivalent to 1218 million tonnes, and industrialized Asia, i.e., China, South Korea, and Japan together, generated 443 million tonnes [47]. Therefore, a significant part of the FLW of industrialized and developing Asian countries was originated by China. On the other hand, FLW in China is higher than in sub-Saharan Africa and South and South-East Asia. In these countries, the estimated FLW varies in a range between 120 and 170 kg per year according to FAO [1]. The discrepancies between the reported estimates are due to the differences in the scope of the studies, the limits of the system, the objectives and methods, the definitions adopted, and inherent accounting problems [61] or the different years of estimation. The reason that Chinese FLW are higher than those of sub-Saharan Africa and South and South-East Asia, mainly because in each country and region FLW is driven by a different food group. For example, in China, Japan, and South Korea total FLW is driven primarily by FLW from fruits and vegetables; in South and Southeast Asia, total FLW is driven by milk and eggs FLW; and, in sub-Saharan Africa, total FLW is driven by roots and tubers FLW [62].
It is important to highlight that FLWR, as a percentage of total domestic supply, in China was lower (19%) than the world average, 33% [1]. Comparing further by region, in many cases, China showed a lower FLWR than other regions. For example, Gustavsson et al. [50] pointed out that in Europe, North America, Oceania, and industrialized Asia, all of these developed regions have an FLWR of about 35% across the entire FSC. Even many developing countries in North Africa, West and Central Asia, and Latin America have a higher FLW rate than China, between 25% and 30%. Liu et al. [12] note that the lower FLWR in China, compared to other countries, is due to two reasons: (1) the traditional culture of sharing food and (2) the social effects of the “three bad years” of 1959–1961 where 10 million people died directly as a result of starvation. However, this may raise open questions for future research such as: why does China has a lower FLWR than other countries if many countries in the world have also experienced famines.
Looking at a disaggregated level by food group and FSC stage, Chinese FLW in cereals in the post-harvest and storage stage was slightly lower than those observed in South Africa, 17.7 kg per capita in 2017 and 19.8 kg per capita in 2010 respectively [63]. One of the reasons is the higher investment in storage in China compared to South Africa. Meanwhile, in the agricultural production stage Chinese vegetable FLW per capita, equivalent to 34.9 kg per capita in 2017, was higher than Italy’s vegetable FLW, equivalent to 8.1 kg per capita in 2010 at the same stage [64]. This supports the argument that the volume of discarded fruits and vegetables varies significantly between developing and developed countries [40]. This large difference can be explained by the use in developed countries of more advanced and modern technologies [40]. For starchy roots, at the agricultural production stage, Europe produced 26.9 million tonnes and Sub-Saharan Africa 26.4 million tonnes [50]. These volumes are comparable with the Chinese FLW, equivalent to 29 million tonnes, in the same food group. It is important to note that the previous comparisons are weak due to differences in the estimation methodology, data, and year of the data. Therefore, researchers and policymakers need to consider them carefully.
The analysis of FLW at various stages of the FSC showed that 32% (129 million tonnes) of FLW was produced at the consumption stage. This result supports the hypothesis that FLW in the consumption stage increase in countries with an increment in economic growth, increased income, and purchasing power [40]. One of the benefits of the per capita economic growth is that increases the access and consumption of food [40]. However, this increase in the consumption of food should be sustainable according to SDG 12. It is closely followed by the agricultural production stage with 109 million tonnes, equivalent to 27%. The previous result backs up the argument exposed in Section 2.3. that an increase in food production eventually may increase FLW in the agricultural production stage if the other factors, such as technology and production process remain constant. Therefore, as it is stated by SDG 12, the production process should be sustainable to stop the environmental degradation that is endangering the very systems on which our future development depends [7]. The post-harvest and storage and distribution stages represented 22% and 16% respectively. The processing and packaging stage showed a much smaller volume of FLW compared to the other stages, with only 11 million tonnes, 3% of the total FLW (Figure 3).
The results showed that FLW in vegetables occurred mainly at the ends of the FSC, 51 (28%) and 56 (31%) million tonnes in the agricultural production and consumption stages, respectively. However, in this food group, the post-harvest and storage and distribution stages also showed considerable FLW, 41 (22%) and 34 (19%) million tonnes respectively. Cereals showed a different situation since FLW was produced mainly in the consumption, post-harvest, and storage stages, 64 (87%) million tonnes in total. The food group with the third-largest amount of FLW, starchy roots, the agricultural production stage accounted for the majority of FLW, 29 (51%) million tonnes. The reasons for FLW in the previous food groups in the agricultural production, post-harvest, and storage stages are mainly due to diseases, insects, weeds, rodents, severe climatic conditions during planting, and inefficient seeding [43]. Therefore, public policies that try to address these FLW should be focused primarily on improving infrastructure, e.g., greenhouses, to face climate conditions and weeds, and storage technology to fight against pests, and preserve food in better conditions. It is not possible to make volume or percentage comparisons between these calculations and previous studies due to the use of different methodologies and units of measurement. However, Liu et al. [12] suggested that in cereals the highest volume of FLW is produced in the post-harvest, storage, and consumption stages, coinciding with the results shown here. When comparing the FLW with the total domestic supply of each food group, it was observed that 29%, 28%, and 27% of all fruits, vegetables, and starchy roots available in China were discarded. Fish and seafood, meat and cereals presented lower percentages, but not less important, 18%, 17%, and 14% respectively.

5. Policy Implications

From the point of view of the public policy implementation strategy, it is important, first of all, to measure the problem that we are trying to define, as has been done in this research. In this way, we know the magnitude of the problem to identify its possible causes and thus propose solutions. The top-down mass balance method helps to identify the hotspot for FLW in a country, helping to focus future research and policy resources. The information provided by other FLW direct weighing methods is more accurate and reliable than the results provided by the mass balance method [51,52]. However, they cannot provide a broader picture of the structure of FLW in a country. In this sense, both types of methods complement each other by providing important information for the design of public policies.
A review of public policies related to FLW implemented by the Chinese government before 2015 shows that the main focus was on the agricultural production and post-harvest and storage stages of the FSC. Furthermore, grains were the main target product of these public policies. For example, “The Outline of the Programme for Middle and Long-Term National Grain Security” (2008–2020) implemented by the State Council and “The Administrative Rules on Storage and the Warehousing in Grain and Oil Industry” implemented by the National Development and Reform Committee. Gradually, the Chinese government has included more FSC stages and more products in its public policies.
Despite the number of public policies implemented by the Chinese government in the last fifteen years, there are still several challenges to advance in the design of initiatives that seek to reduce FLW. First, China’s FLW management systems are still highly fragmented [20], that is. there are many actors with different objectives and tools to address FLW reduction. In this sense, some public policies are executed by the Ministry of Housing and Urban-Rural Development, others by the Ministry of Environment, others by the Ministry of Commerce, etc. All of these ministries lead an FLW policy, but most of the time based primarily on the ministry’s functions. For example, increasing agricultural production and food security are priorities of the Central Government and the Ministry of Agriculture, which provides objectives and subsidies to regional and local governments. However, regional and local governments often focus on industrial development and job creation, thus paying little attention to food security and environmental damage [20].
Second, most public policies and regulations are designed to reduce waste in general, and not many of them specifically address the problem of FLW. In addition, some public policies only consider FLW reduction as a method to increase grain production [43]. Therefore, they do not consider the full impact of FLW on food security and environmental protection. Third, there is still a lack of initiatives that address the problem of FLW at all stages of the FSC. Most of the initiatives are geared towards grains in the agricultural production and storage stages. Some others are intended for certain types of meat and vegetables [43]. However, it remains a challenge to include the entire FSC and a broader range of food types in which FLW could be produced. Finally, there is a lack of consistent and reliable statistical information on FLW, particularly studies based on primary data, to better inform relevant public policies on FLW reduction and mitigation of environmental impact [40].
Despite these challenges, since 2013 FLW has become a major political and social problem for both the government and the people of China [12]. This increased concern about FLW, together with the SDGs, has led to the design of more integrated FLW public policies across all government agencies, both at the central, regional, and local levels. An example of this is the integration of FLW policies into larger plans with more agencies involved, e.g., The Chinese National Plan for the Implementation of the Sustainable Development Goals 2030 (2015–2030), China’s Thirteenth Five-Year Plan for the Development of the People’s Republic of China (2016–2020) or the National Plan for Sustainable Agricultural Development (2015–2030).
According to Irani et al. [65], an important condition for managing food security through food losses and waste is knowing at which stage of FSC and in what quantity FLW is produced. In this sense, the results of this article are a step forward that allows policymakers to focus resources to reduce FLW. In addition, identifying the FLW hotspots helps researchers to discover what causes FLW and policymakers to propose possible solutions [40]. In light of the results of this article, future research and policy may focus on FLW from vegetables, cereals, specifically in postharvest and storage and FSC consume stages and, finally, FLW in starchy root in the agricultural production stage. They are all FLW hotspot findings in this research.
Furthermore, a better understanding of the causes of FLW can lead to the implementation of solutions that contribute to improving food security [66]. For instance, if FLW is caused by a lack of refrigeration systems, the strategic business solution might be to improve technology and digitization processes that allow for better control. However, if the FLW is due to a lack of demand due to low standards of food size and colour, a possible solution that contributes to improving food security could be food donation or the reduction of food prices.
During the last decade, FLW has gradually become a major political and social problem in the world and China. Controlling FLW can directly contribute to the achievement of SDG 2 by increasing the availability of food, reducing the cost of food, increasing the availability of higher quality food, and the stability of the food supply. This increased concern about FLW, along with the SDGs, has led to the design of more integrated FLW public policies in Chinese government agencies. However, challenges remain, such as coordinated public policies that address all the negative impacts of FLW, or the lack of reliable statistical information. The economic, social, and environmental impact of FLW is enormous. As the country with the largest population in the world, China faces limited resources, for example, water, and food security remains a problem. Since FLW reduction represents a potential way to improve food security and achieve long-awaited sustainable development.
However, it remains a challenge for future researchers and policymakers to improve statistical data on food loss and waste, especially primary data, to obtain more accurate food loss and waste rates and conversion and allocation factors. In addition, there is a need to link the amount of food loss and waste and the SDGs indicators to better understand how they affect food security and sustainable development.

6. Conclusions

The analytical review of the literature allowed us to reveal the drivers of FLW, as well as the patterns and scale of FLW in China, but we observed some gaps in the research: the analysis was limited to a few groups of products and also focused only in some stages of the food supply chain (FSC).
The objective of this paper was to provide the following contributions to the literature. First, we update the estimations of food loss and waste in China considering a broader range of food products than previous studies and at all FSC stages. Second, we study how FLW affects the achievement of SDG 2, and discuss some challenges that public policies still need to face to reduce FLW. For this aim, a top-down mass balance approach is proposed to estimate food loss and waste in China by combining different sources of information, with a breakdown into the main food groups at different stages of the FSC.
In summary, some of the most relevant data indicate that, in China, food loss and waste amounted to 402 million tonnes of food in 2017. The largest amount was concentrated in vegetables, 181 million tonnes, equivalent to 45% of the total FLW. Cereals, starchy roots, and fruits had similar volumes (179 million tonnes) and represent 45% of the discarded food. The FLW per capita was 277 kg. FLW in vegetables occurred mainly at the ends of the FSC, 51 (28%) and 56 (31%) million tonnes in the agricultural production and consumption stages, respectively. FLW in cereals are produced mainly in consumption, post-harvest, and storage stages, in a total of 64 (87%) million tonnes. The third-largest group of FLW are starchy roots, within this group 51% of food is discarded in the agricultural production stage. When comparing the FLW to the amount of food in the domestic supply, around 28% of all fruits, vegetables, and starchy roots available to the population were discarded.
Control of FLW can contribute directly and indirectly in different ways to achieving SDG 2. First, control of FLW increases the availability of food. Second, sustainable food systems with less FLW reduce the cost of food and improve access to food for vulnerable people. Third, the control of FLW increases the availability of high-quality food. Fourth, sustainable food systems with less FLW can increase the stability of the food supply. Furthermore, FLW has negative effects on the environment through the waste of water and land, CO2, N2O, and CH4 emissions that cause climate change, and damage to biodiversity.

Author Contributions

D.D.-S. and G.D.-R. designed and drafted the manuscript; G.D.-R. and A.M.L. revised the manuscript and discussed the results. All authors have read and agreed to the published version of the manuscript.

Funding

The authors are thankful to Institute K. L. Klein-UAM for financial support.

Institutional Review Board Statement

Not applicable.

Informed Consent Statement

Not applicable.

Data Availability Statement

All data is available from the references cited.

Acknowledgments

The authors welcome comments and suggestions for improvement from 4 peer reviews.

Conflicts of Interest

The authors declare no conflict of interest.

References

  1. FAO. Global Food Losses and Food Waste—Extent, Causes and Prevention; Food and Agriculture Organization of the United Nations: Rome, Italy, 2011. [Google Scholar]
  2. Godfray, H.; Beddington, J.; Crute, I.; Haddad, L.; Lawrence, D.; Muir, J.; Pretty, J.; Robinson, S.; Thomas, S.; Toulmin, C. Food security: The challenge of feeding 9 billion people. Science 2010, 327, 812. [Google Scholar] [CrossRef] [Green Version]
  3. Thyberg, K.L.; Tonjes, D.J. Drivers of food wastage and their implications for sustainable policy. Resour. Conserv. Recycl. 2016, 106, 110–123. [Google Scholar] [CrossRef]
  4. Jellil, A.; Woolley, E.; Rahimifard, S. Towards integrating production and consumption to reduce consumer food waste in developed countries. Int. J. Sustain. Eng. 2018, 11, 294–306. [Google Scholar] [CrossRef] [Green Version]
  5. Cicatiello, C.; Franco, S.; Pancino, B.; Blasi, E. The Value of Food Waste: An Exploratory Study on Retailing. J. Retail. Consum. Serv. 2016, 30, 96–104. [Google Scholar] [CrossRef]
  6. Krzywoszynska, A. Spotlight On…Waste: Uncovering the global food scandal. Geography 2011, 96, 101–104. [Google Scholar] [CrossRef]
  7. United Nations. 2015. Available online: https://www.un.org/sustainabledevelopment/hunger/ (accessed on 4 April 2020).
  8. FAO. The state of food security and nutrition in the world. In Safeguarding against Economic Slowdowns and Downturns; Food and Agriculture Organization of the United Nations: Rome, Italy, 2019. [Google Scholar]
  9. World Bank. 2020. Available online: https://data.worldbank.org/ (accessed on 4 April 2020).
  10. FAOSTAT. Food and Agriculture Organization of the United Nations Data. 2020. Available online: www.fao.org/faostat/en/#home (accessed on 4 April 2020).
  11. Yang, B.; Huang, X.; Liu, Q.; Tang, S.; Story, M.; Chen, Y.; Zhou, M. Child nutrition trends over the past two decades and challenges for achieving nutrition SDGs and national targets in China. Int. J. Environ. Res. Public Health 2020, 17, 1129. [Google Scholar] [CrossRef] [Green Version]
  12. Liu, J.; Lundqvist, J.; Weinberg, J.; Gustafsson, J. Food losses and waste in China and their implication for water and land. Environ. Sci. Technol. 2013, 47, 10137–10144. [Google Scholar] [CrossRef] [PubMed]
  13. Sun, S.; Lu, Y.; Gao, H.; Jiang, T.; Du, X.; Shen, T.; Wu, P.; Wang, Y. Impacts of food wastage on water resources and environment in China. J. Clean. Prod. 2018, 185, 732–739. [Google Scholar] [CrossRef]
  14. Gao, L.; Cheng, S.; Cao, X.; Zhang, D.; Liu, X.; Qin, Q.; Liu, Y. An overview of the resources and environmental issues from waste food in urban catering across China. J. Resour. Ecol. 2013, 4, 337–343. [Google Scholar] [CrossRef]
  15. IFPRI. 2019 Global Food Policy Report; International Food Policy Research Institute: Washington, DC, USA, 2019. [Google Scholar] [CrossRef]
  16. Burlea-Schiopoiu, A.; Florin, R.; Mihail, C.; Craciun, L.; Cosmin, L.; Stelian, L. The impact of COVID-19 pandemic on food waste behaviour of young people. J. Clean. Prod. 2021, 294, 126333. [Google Scholar] [CrossRef] [PubMed]
  17. Zipser, D.; Poh, F. Understanding Chinese Consumers: Growth Engine of the World; China Consumer Report 2021; McKinsey & Company: Shanghai, China, 2020. [Google Scholar]
  18. Laborde, D.; Martin, W.; Swinnen, J.; Vos, R. COVID-19 risks to global food security. Science 2020, 369, 500–502. [Google Scholar] [CrossRef] [PubMed]
  19. Garnett, T. Cooking up a Storm: Food, Greenhouse Gas Emissions and Our Changing Climate; Food Climate Research Network, Center for Environmental Strategy: Surrey, UK, 2008. [Google Scholar]
  20. Ma, L.; Qin, W.; Garnett, T.; Zhang, F. Review on drivers, trends and emerging issues of the food wastage in China. Front. Agr. Sci. Eng. 2015, 2, 159–167. [Google Scholar] [CrossRef]
  21. Spang, E.S.; Moreno, L.C.; Pace, S.A.; Achmon, Y.; Donis-Gonzalez, I.; Gosliner, W.A.; Jablonski-Sheffield, M.P.; Momin, M.A.; Quested, T.E.; Winans, K.S.; et al. Food loss and waste: Measurement, drivers and solutions. Annu. Rev. Environ. Resour. 2019, 44, 117–156. [Google Scholar] [CrossRef]
  22. Wang, L.; Liu, G.; Liu, X.; Liu, Y.; Gao, J.; Zhou, B.; Gao, S.; Chen, S. The weight of unfinished plate: A survey based characterization of restaurant food in Chinese cities. Waste Manag. 2017, 66, 3–12. [Google Scholar] [CrossRef]
  23. FAO. Reflexiones Sobre el Sistema Alimentario y Perspectivas Para Alcanzar su Sostenibilidad en América Latina y el Caribe; Food and Agriculture Organization of the United Nations: Rome, Italy, 2017. [Google Scholar]
  24. Scherhaufer, S.; Moates, G.; Hartikainen, H.; Waldron, K.; Obersteiner, G. Environmental impacts of food waste in Europe. Waste Manag. 2018, 77, 98–113. [Google Scholar] [CrossRef]
  25. Chaboud, G.; Daviron, B. Food losses and waste: Navigating the inconsistencies. Glob. Food Secur. 2017, 12, 1–7. [Google Scholar] [CrossRef]
  26. Vilariño, M.V.; Franco, C.; Quarrington, C. Food loss and waste reduction as an integral part of a circular economy. Front. Environ. Sci. 2017, 17, 1–5. [Google Scholar] [CrossRef] [Green Version]
  27. Huang, C.H.; Liu, S.M.; Hsu, N.Y. Understanding Global Food Surplus and Food Waste to Tackle Economic and Environmental Sustainability. Sustainability 2020, 12, 2892. [Google Scholar] [CrossRef] [Green Version]
  28. Parfitt, J.; Barthel, M.; Macnaughton, S. Food waste within food supply chains: Quantification and potential for change to 2050. Phil. Trans. R. Soc. B 2010, 365, 3065–3081. [Google Scholar] [CrossRef] [PubMed] [Green Version]
  29. World Food Summit. Rome Declaration on World Food Security, FAO. 1996. Available online: www.fao.org/wfs/index_en.htm (accessed on 20 October 2021).
  30. FAO. Food Security, Policy Brief, June, Issue 2. 2006. Available online: www.fao.org/fileadmin/templates/faoitaly/documents/pdf/pdf_Food_Security_Cocept_Note.pdf (accessed on 20 October 2021).
  31. Veldhuizen, L.; Giller, K.; Oosteveer, P.; Brouwer, I.; Janssen, S.; Zanten, H.; Slingerland, M. The Missing Middle: Connected action on agriculture and nutrition across global, national and local levels to achieve Sustainable Development Goal 2. Glob. Food Secur. 2020, 24, 100336. [Google Scholar] [CrossRef]
  32. Princen, T.; Maniates, M.; Conca, K. Confronting Consumption; The MIT Press: Cambridge, UK, 2002; ISBN 0-262-16208-3. [Google Scholar]
  33. USDA (United States Department of Agriculture). China: Evolving Demand in the World’s Largest Agricultural Import Market; 2020; International Agricultural Trade Report. Available online: https://www.fas.usda.gov/data/china-evolving-demand-world-s-largest-agricultural-import-market (accessed on 20 October 2021).
  34. Lemaire, A.; Limbourg, S. How can food loss and waste management achieve sustainable development goals? J. Clean. Prod. 2019, 234, 1221–1234. [Google Scholar] [CrossRef]
  35. HLPE. Food losses and waste in the context of sustainable food systems. In A Report by the High Level Panel of Experts on Food Security and Nutrition of the Committee on World Food Security; HLPE: Rome, Italy, 2014. [Google Scholar]
  36. Schanes, K.; Doberning, K.; Gözet, B. Food waste matters. A systematic review of household food waste practices and their policy implications. J. Clean. Prod. 2018, 182, 978–991. [Google Scholar] [CrossRef]
  37. Candy, S.; Turner, G.; Larsen, K.; Wingrove, K.; Steenkamp, J.; Friel, S.; Lawrence, M. Modelling the food availability and environmental impacts of a shift towards consumption of healthy dietary patterns in Australia. Sustainability 2019, 11, 7124. [Google Scholar] [CrossRef] [Green Version]
  38. Marston, L.T.; Read, Q.D.; Brown, S.P.; Muth, M.K. Reducing Water Scarcity by Reducing Food Loss and Waste. Front. Sustain. Food Syst. 2021, 5, 651476. [Google Scholar] [CrossRef]
  39. HLPE. Food security and climate change. In A Report by the High-Level Panel of Experts on Food Security and Nutrition of the Committee on World Food Security; HLPE: Rome, Italy, 2012. [Google Scholar]
  40. Xue, L.; Liu, G.; Parfitt, J.; Liu, X.; Van Herpen, E.; Stenmarck, Å.; O’Connor, C.; Ostergren, K.; Cheng, S. Missing food, missing data? A critical review of global food losses and food waste data. Environ. Sci. Technol. 2017, 51, 6618–6633. [Google Scholar] [CrossRef] [PubMed]
  41. Wang, F.; Dou, Z.; Ma, L.; Ma, W.; Sims, J.; Zhang, F. Nitrogen mas flow in China’s animal production system and environmental implications. J. Environ. Qual. 2010, 39, 1537–1544. [Google Scholar] [CrossRef] [PubMed] [Green Version]
  42. WTO. Trade Policy Review–China. Document WT/TPR/S/264; World Trade Organization: Geneva, Switzerland, 2012. [Google Scholar]
  43. Liu, G. Food losses and food waste in China: A first estimate. In OECD Food, Agriculture and Fisheries Papers, No. 66; OECD Publishing: Paris, France, 2014. [Google Scholar]
  44. SAG; NDRC. Special Programme for Construction of Scientific Grain Storage in Rural Households in the 12th Five Years (2011–2015) Plan; State Administration of Grain (SAG), China and National Development and Reform Committee (NDRC): Beijing, China, 2011. [Google Scholar]
  45. Shi, Z.; Furukawa, I.; Chun-Ji, J.; Li, Z. Chinese face: MIANZI and LIAN, and their influence on Chinese consumer behavior. In Proceedings of the 2nd International Symposium on Information Engineering and Electronic Commerce, Ternopil, Ukraine, 23–25 July 2010; pp. 1–5. [Google Scholar]
  46. Song, G.; Li, M.; Musoke, H.; Zhang, S. Food consumption and waste and the embedded carbon, water and ecological footprints of households in China. Sci. Total Environ. 2015, 529, 191–197. [Google Scholar] [CrossRef]
  47. Porter, S.; Reay, D.; Higgins, P.; Bomberg, E. A half-century of production-phase greenhouse gas emissions from food loss and waste in the global food supply chain. Sci. Total Environ. 2016, 571, 721–729. [Google Scholar] [CrossRef] [Green Version]
  48. Qi, D.; Lai, W.; Roe, B.E. Food waste declined more in rural Chinese households with livestock. Food Policy 2020, 98, 101893. [Google Scholar] [CrossRef]
  49. Li, Y.; Wang, L.; Liu, G.; Cheng, S. Rural household food waste characteristics and driving factors in China. Resour. Conserv. Recycl. 2021, 164, 105209. [Google Scholar] [CrossRef]
  50. Gustavsson, J.; Cederberg, C.; Sonesson, U.; Emanuelsson, A. The Methodology of the FAO Study: “Global Food Losses and Food Waste—Extent, Causes and Prevention”—FAO, 2011; The Swedish Institute for Food and Biotechnology: Gothenburg, Sweden, 2013. [Google Scholar]
  51. Hanson, C.; Lipinski, B.; Robertson, K.; Días, D.; Gavilan, I.; Gréverath, P.; Ritter, S.; Fonseca, J.; Van Otterdijk, R.; Timmermans, T.; et al. Food Loss and Waste Accounting and Reporting Standard, 160; World Resources Institute: Washington, DC, USA, 2016. [Google Scholar]
  52. Tostivint, C.; Östergren, K.; Quested, T.; Soethoudt, J.M.; Stenmarck, A.; Svanes, E.; O’Connor, C. Food Waste Quantification Manual to Monitor Food Waste Amounts and Progression; FUSIONS Report; Deloitte Sustainability: Paris, France, 2016. [Google Scholar]
  53. Alexander, P.; Brown, C.; Arneth, A.; Finnigan, J.; Moran, D.; Rounsevell, M. Losses, inefficiencies and waste in the global food system. Agric. Syst. 2017, 153, 190–200. [Google Scholar] [CrossRef] [PubMed]
  54. Bräutigam, K.; Jorissen, J.; Priefer, C. The extent of food waste generation across EU-27: Different calculation methods and the reliability of their results. Waste Manag. Res. 2014, 32, 683–694. [Google Scholar] [CrossRef] [PubMed]
  55. EUROSTAT. Food Waste Statistics. 2017. Available online: www.ec.europa.eu/food/sites/food/files/safety/docs/fw_eu-platform_20170925_sub-fwm_pres-03.pdf (accessed on 4 April 2020).
  56. FUSIONS. EU FUSIONS. 2020. Available online: www.eu-fusions.org (accessed on 4 April 2020).
  57. Kemna, R.; van Holsteijn, F.; Lee, P.; Sims, E. Complementary Research on Household Refrigeration—Optimal Food Storage Conditions in Refrigeration Appliances; VHK in collaboration with Oakdene Hollins for the European Commission: Delf, Netherland, 2017. [Google Scholar]
  58. Monier, V.; Mudgal, S.; Escalon, V.; O’Connor, C.; Gibon, T.; Anderson, G.; Morton, G. Preparatory Study on Food Waste across EU 27; Report for the European Commission; Technical Report; European Commission: Brussels, Belgium, 2010; p. 54. ISBN 978-92-79-22138-5. [Google Scholar]
  59. Vanham, D.; Bouraoui, F.; Leip, A.; Grizzetti, B.; Bidoglio, G. Lost water and nitrogen resources due to EU consumer food waste. Environ. Res. Lett. 2015, 10, 084008. [Google Scholar] [CrossRef] [Green Version]
  60. Caldeira, C.; De Laurentiisa, V.; Corrado, S.; van Holsteijnb, F.; Sala, S. Quantification of food waste per product group along the food supply chain in the European Union: A mass flow analysis. Resour. Conserv. Recycl. 2019, 149, 479–488. [Google Scholar] [CrossRef] [PubMed]
  61. Corrado, S.; Sala, S. Food waste accounting along global and European food supply chains: State of the art and outlook. Waste Manag. 2018, 79, 120–131. [Google Scholar] [CrossRef] [PubMed]
  62. Hegnsholt, E.; Unnikrishnan, S.; Pollmann, M.; Áskelsdóttir, B.; Gerard, M. Tackling the 1.6-Billion-Ton Food Loss and Waste Crisis; The Boston Consulting Group, UNECE-FAO Conference: Geneva, Switzerland, 2018. [Google Scholar]
  63. Oelofse, S.; Nahman, A. Estimating the magnitude of food waste generated in South Africa. Waste Manag. Res. 2013, 31, 80–86. [Google Scholar] [CrossRef]
  64. Segrè, A.; Falasconi, L.; Politano, A.; Vittuari, M. Background Paper on the Economics of Food Loss and Waste; FAO: Rome, Italy, 2014. [Google Scholar]
  65. Irani, Z.; Sharif, A.; Lee, H.; Aktas, E.; Topaloglu, Z.; Wout, T.; Huda, S. Managing food security through food waste and loss: Small data to big data. Comput. Oper. Res. 2018, 98, 367–383. [Google Scholar] [CrossRef]
  66. Bhattacharya, A.; Nand, A.; Prajogo, D. Taxonomy of antecedents of food waste—A literature review. J. Clean. Prod. 2021, 291, 125910. [Google Scholar] [CrossRef]
Figure 1. Impacts of FLW on food security and SDG 2.
Sustainability 13 12259 g001
Figure 2. Accounting approach to estimate FLW.
Sustainability 13 12259 g002
Figure 3. Left (bar chart): FLW calculated for each food group and FSC stage in China for 2017. Right (pie chart): percentage of FLW as a fraction of the total domestic supply quantity in China in 2017.
Sustainability 13 12259 g003
Table 1. Calculation of domestic supply quantity and FLW for each food group and FSC stage, with conversion and allocation factors, in China in 2017.
Food GroupsDomestic Supply Quantity (Mt)Food Losses and Waste (Mt)
Agricultural ProductionPostharvest and StorageProcessing and PackagingDistributionConsumeTotal FLW by Product
Cereals643.25.125.70.33.938.773.7
Eggs36.91.30.40.00.21.63.5
Fish and Seafood66.94.70.61.63.02.011.9
Fruits168.613.010.40.29.415.548.6
Meat92.12.60.50.05.36.614.9
Milk37.91.20.40.00.21.73.5
Oil crops157.20.90.55.80.00.17.4
Pulses5.90.10.00.00.00.00.1
Starchy Roots213.829.210.22.77.57.256.8
Vegetables641.350.640.50.333.955.9181.3
Total FLW by FSC Stage2063.9108.889.211.063.3129.4401.7
Source: own elaboration.
Publisher’s Note: MDPI stays neutral with regard to jurisdictional claims in published maps and institutional affiliations.

