
Process Parameters Optimization of Wet Shot Peening for Paint Cleaning
by
 ,
,
Shuangshuang Wu
1,2, 
Xiujie Jia
1,2,*,
Sheng Xiong
1,2,
Fangyi Li
1,2,
Mingliang Ma
1,2,
Xing Wang
1,2 and
Chenghao Li
1,2 1
Key Laboratory of High Efficiency and Clean Mechanical Manufacture, Ministry of Education, School of Mechanical Engineering, Shandong University, Jinan 250061, China
2
National Demonstration Center for Experimental Mechanical Engineering Education, Shandong University, Jinan 250061, China
*
Author to whom correspondence should be addressed.
Sustainability 2021, 13(22), 12915; https://0-doi-org.brum.beds.ac.uk/10.3390/su132212915
Submission received: 12 October 2021
/
Revised: 15 November 2021
/
Accepted: 16 November 2021
/
Published: 22 November 2021
Abstract
:Wet shot peening (WSP) cleaning technology has the advantages of being green, having a high efficiency, and producing almost no pollution to the environment. Under the development trend of green environmental protection, WSP is more and more desired by the public. However, in the study of WSP cleaning paint, there is little research on process parameter optimization. Accordingly, this article uses an orthogonal experiment, taking the cleaning efficiency and the substrate removal mass as objectives, to optimize the parameters of pressure, stand-off distance, traverse rate, and cleaning times. The experimental results show that the cleaning efficiency is improved by increasing the pressure, stand-off distance, and traverse rate or decreasing the cleaning times within the scope of this experiment. The pressure and cleaning times are positively correlated with the substrate removal mass, whereas the traverse rate is negatively correlated. As the stand-off distance increases, the substrate removal mass initially increases and then decreases. The traverse rate has a significant influence on the cleaning efficiency and the substrate removal mass. The optimal process parameters based on the cleaning efficiency are 0.45 MPa pressure, 140 mm stand-off distance, 5 mm/s traverse rate, and one-time cleaning. Besides, the cleaning efficiency at such conditions is 64.23 %/min. Additionally, the substrate removal mass is optimized under 0.25 MPa pressure, 60 mm (or 140 mm) stand-off distance, 5 mm/s traverse rate, and one-time cleaning to give a substrate removal mass of approximately zero. The analysis of parameters provides a reference for selecting the parameters in the actual application of WSP cleaning.
1. Introduction
As a commonly used industrial rust inhibitor, paint is widely used in mechanical parts and is an indispensable dirt type that requires cleaning in remanufacturing cleaning [1]. Additionally, from the product’s use to the scrapping stage, compared with other types of dirt, paint and substrate combination takes the longest time. Due to the long-term contact with each other, molecular permeation was generated, which makes the combination more complicated and the cleaning more difficult. When using traditional dry sandblasting cleaning paint, its cleaning efficiency is high and can improve the material’s fatigue strength [2,3,4]. However, it is not suitable for cleaning internal cavity pollutants, and the surface roughness is relatively large after cleaning [5]. The major disadvantages are that it is prone to dust and noise pollution during the cleaning process, which is harmful to human health and the environment [6]. High-pressure water jets are energy-saving and are considered an environmental protection technology, having the advantage of high cleaning efficiency and wide application range [7,8]. However, the substrate rusts easily after cleaning, and the circumstance of high pressure is dangerous [9].
Wet shot peening (WSP) cleaning technology is based on dry sandblasting. It uses the advantages of high-pressure water jet and dry sandblasting to spray abrasives and water together onto the substrate’s surface [10]. According to the mixing sequence of abrasive and water, it can be divided into pre-mixing and post-mixing modes. The pre-mixing mode is adopted in this study, where abrasive and water are mixed first and then sprayed out through the nozzle. The WSP method uses compressed air as the power source like dry sandblasting [11] and uses the effects of grinding, friction, shearing of high-speed abrasives [12] and the wedge effect of water to remove surface paint dirt. To a certain extent, it can improve the fatigue strength of materials [13,14].
Papini [15] investigated the alkyd enamel of Bonderite 1000 iron phosphate surface through sandblasting, and found that the paint removal was related to shear stress, and there existed a critical normal component of the incident velocity. Zeng and Kim [16] considers that intergranular cracking caused by stress wave and crack propagation is the main mechanism of shot peening erosion. Dong [17] founded that when wet shot peening was used to clean the metal paint on the surface of 304 stainless steel substrate, the removal of paint has a great relationship with the cracks on the paint surface. Junkar [18] explores an explicit finite element analysis of a single abrasive particle impact on stainless steel 1.4301 (AISI 304) in abrasive water jet (AWJ) machining. Teimourian [19] investigates the mass loss of paint using water jets and finds that water jet kinetic energy and stand-off distance significantly affect mass loss. Deris [20] analyzes the influence of some factors on the surface roughness after AWJ and finds that traverse rate is the most influential factor. The result shows that the impact angle and particle velocity affect the surface roughness. Raykowski [21] takes maximizing the rate of deposit removal while minimizing substrate deformation as the overall objective to investigate the effect of particle size, speed, impact angle, and stand-off distance on the result.
At this stage, the research on WSP cleaning technology is mainly in the qualitative analysis of its mechanism [22], and relatively little research exists on optimizing the process parameters. Herein, orthogonal experiments are used to observe the cleaning of paint dirt by WSP. We analyze the process of WSP in removing paint by observing the sample morphology after cleaning. Through the analysis of cleaning efficiency and the substrate removal mass, we optimize the WSP process parameters, which provide a reference for selecting the process parameters in the actual application of WSP cleaning technology.
2. Experimental
2.1. Equipment
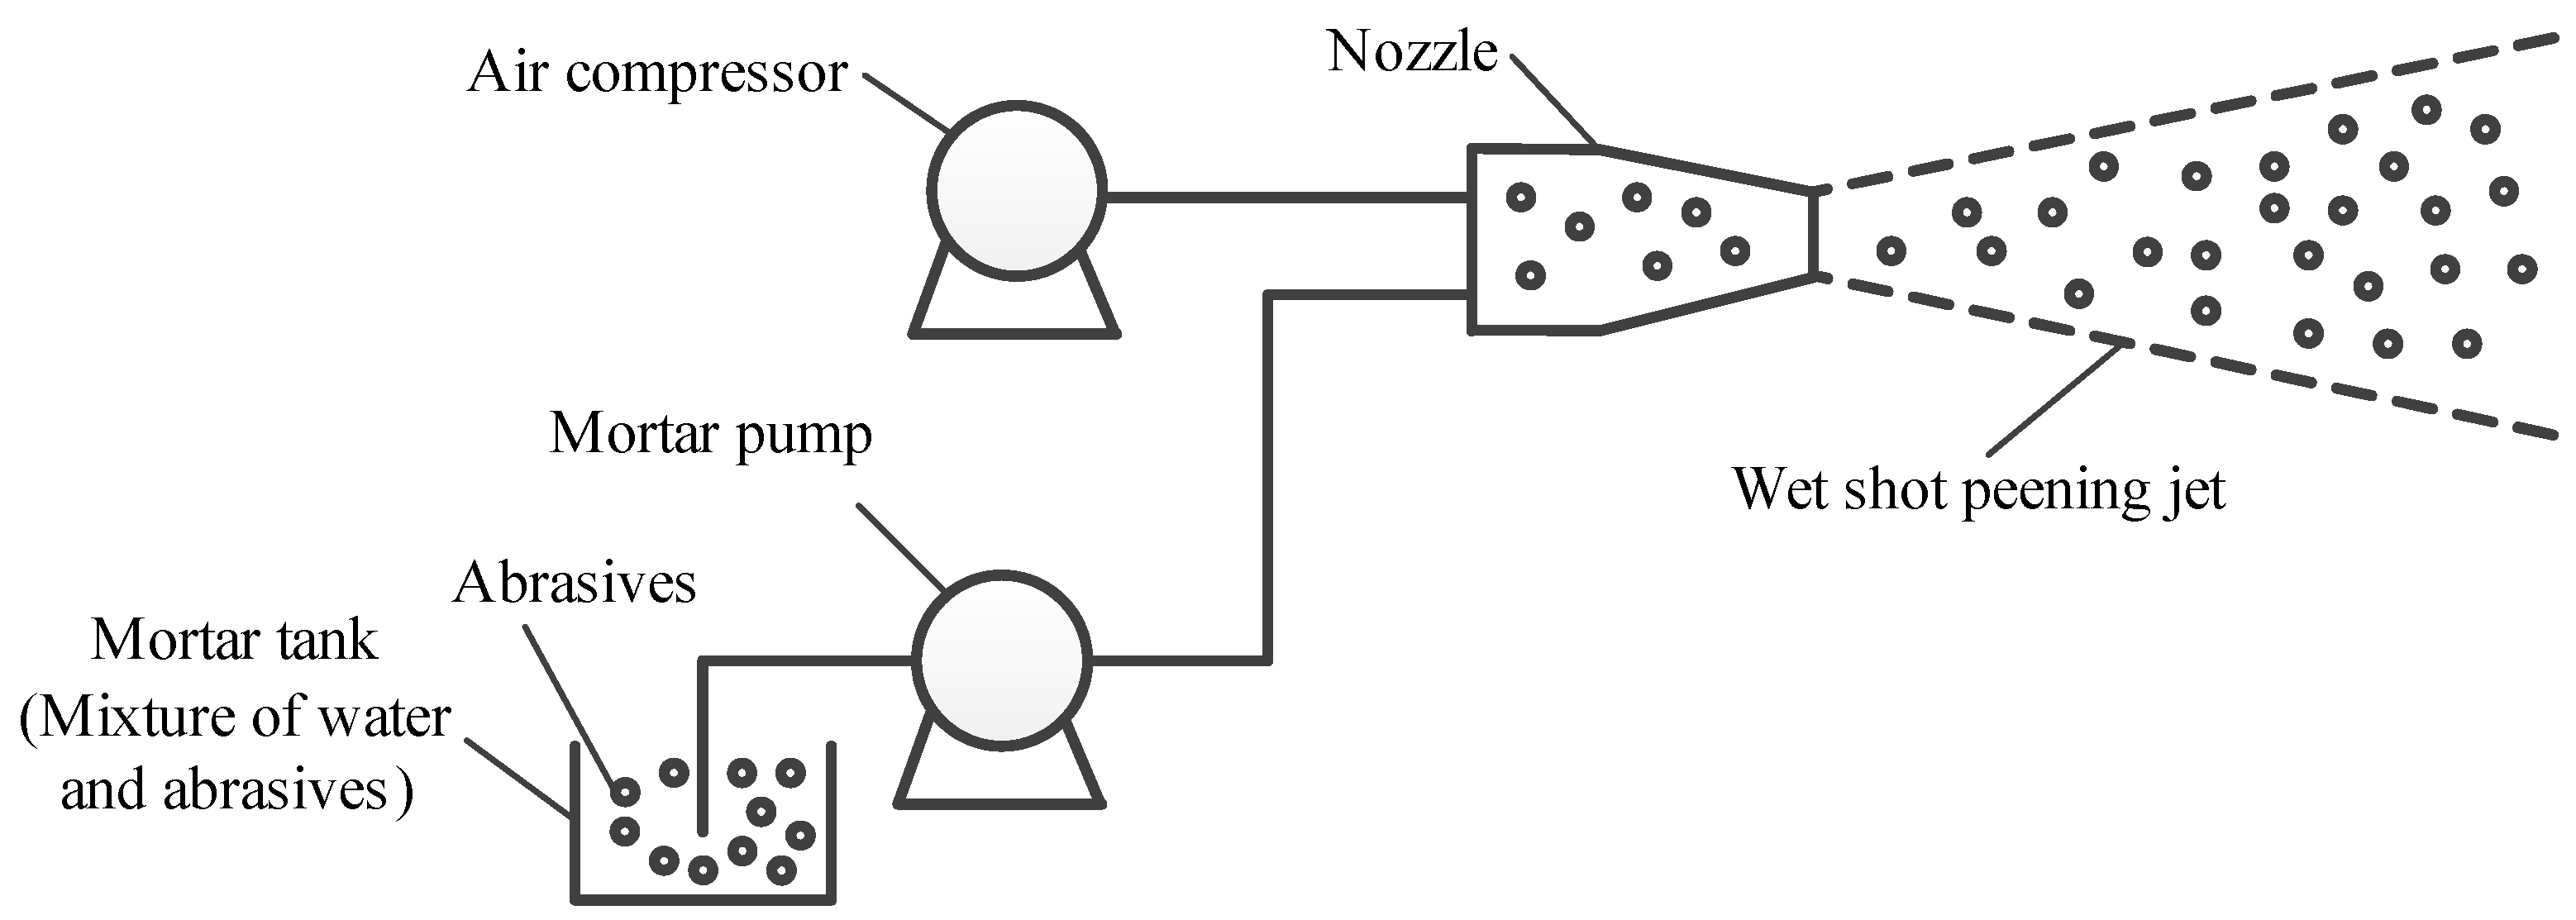
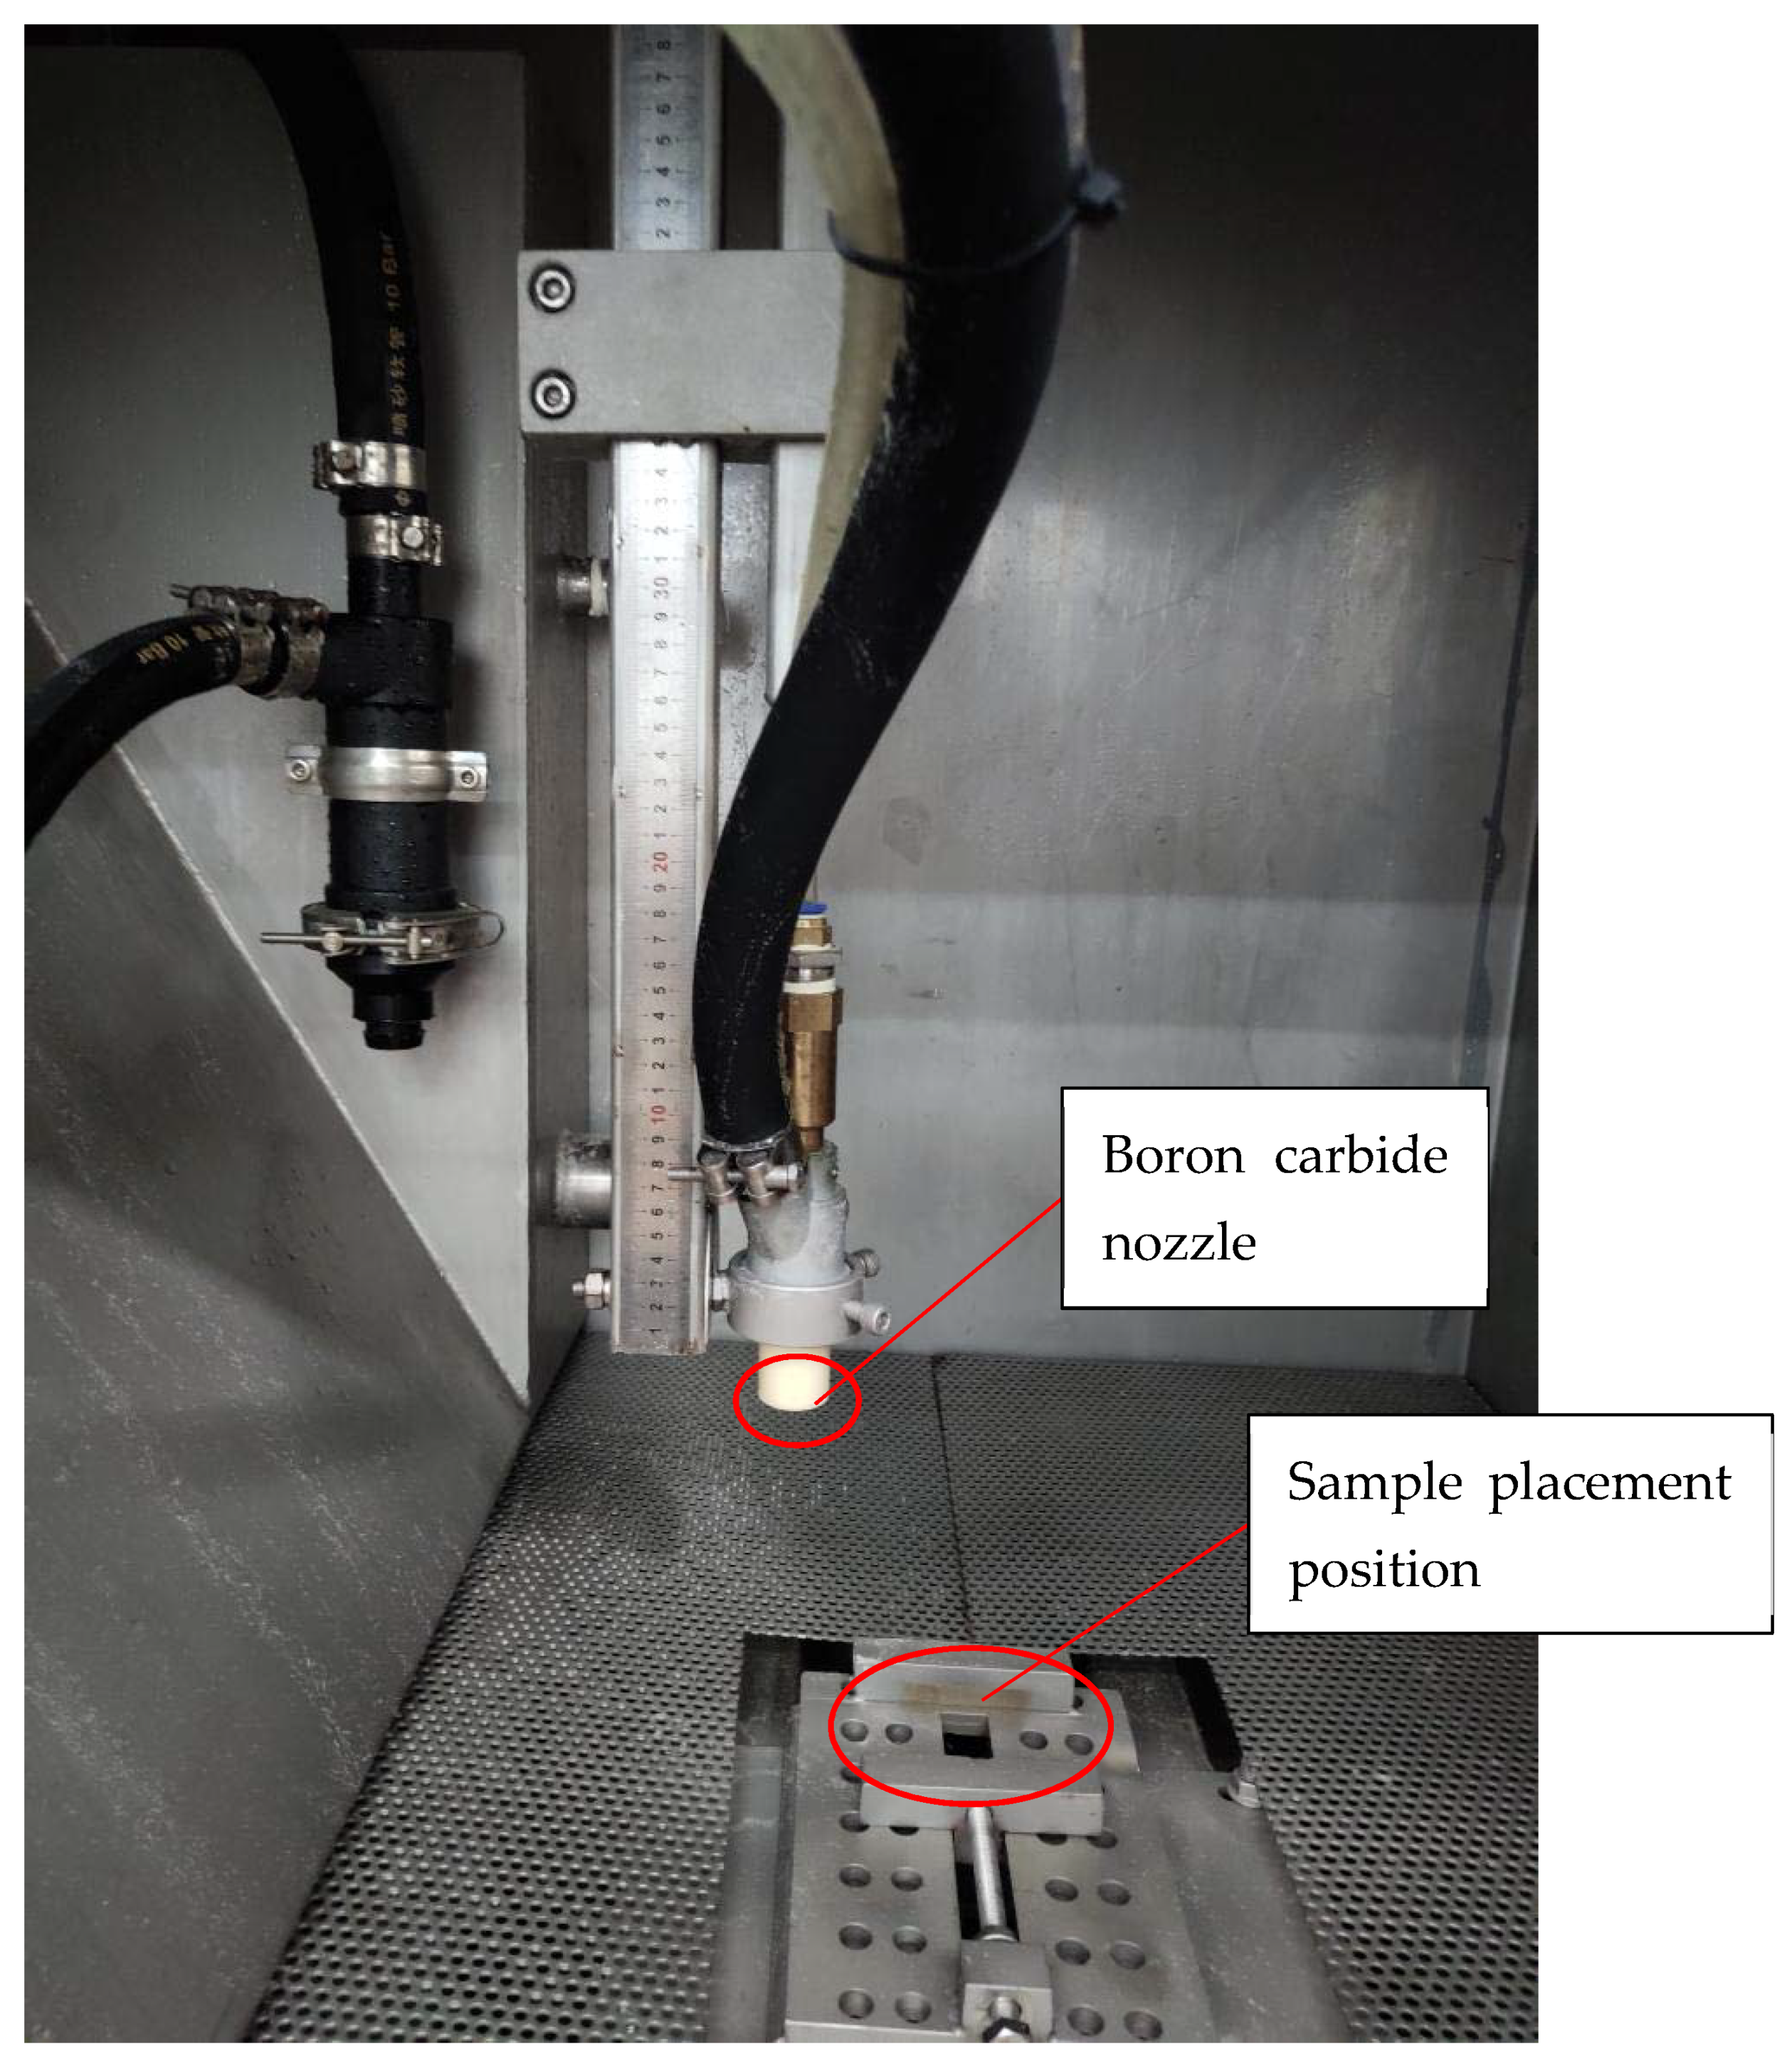
Figure 1 and Figure 2 show the cleaning equipment and the working principle of WSP. As shown in Figure 1, the abrasives and water are fully mixed in the mortar tank, and move forward under the push of the mortar pump. When it reaches the scope of action of the air compressor, the air compressor (maximum pressure is 0.65 MPa) generates a certain pressure, which pushes the mixture of abrasive and water to move to the nozzle and finally shoots out from the nozzle. In Figure 2, the nozzle can move horizontally and up and down to adapt to different cleaning distances and moving rate, etc. Placing the part to be cleaned at the sample placement position, and the nozzle moves to clean the paint on the surface of the substrate.
2.2. Substance and Coating Material
The research object of this paper is the paint on the surface of engine cylinder block, end cover, gearbox box, box cover, and other parts. Herein, HT250 gray cast iron, commonly used in such parts, was selected as the substrate material. The substrate is 60 × 60 × 10 mm in size. The mechanical properties and chemical composition of HT250 gray cast iron are listed in Table 1 and Table 2 [23].
In the actual painting work, in order to enhance the adhesion between the coating and the substrate, and remove the lubricating oil and other dirt on the substrate surface, the substrate surface will be pretreated to increase the substrate surface roughness before spraying. Dry sandblasting is commonly used as the pretreatment method, and its related parameters are listed in Table 3. When the working parameters are fixed during the pretreatment, the error of the surface roughness between the substrates is relatively small. There is basically no difference in adhesion between paint and substrate, which sample difference after pretreatment is ignored in this article. Additionally, an electronic balance with a precision of ±0.0001 g was used to weigh the mass (w1) of the pretreated substrate, and its average surface roughness (Ra) was measured using Wyko NT9300 optical profiler. In the substrate mass measurement, take the average value of the three measurement results as the substrate mass. In the substrate surface roughness test, five random regions of the substrate surface are randomly selected for testing, and the average value of five data is taken as the final surface roughness value of the substrate. The measurement data of mass and surface roughness in this paper are obtained by the above methods.
Acrylic paint is adopted, which is commonly used in industrial painting. Three layers of acrylic paint are sprayed on the substrate at an interval spraying time of 30 min for each layer. The total thickness of the paint layer is ~100 μm. The substrate after spraying is weighed and denoted as w2. After the surface paint of the painted sample was basically cured, it was placed in natural conditions for 30 days before the experiment. Which will make the sample more close to the actual working situation. Among them, Natural condition is the circumstance such as environmental humidity, temperature, wind namely and others will change with the different weather.
2.3. Experimental Design and Procedure
By understanding the mechanism of paint removal using WSP, paint removal is related to the impact energy received on the paint surface. The greater the impact energy, the higher the removal efficiency of dirt. The impact energy is determined by the instantaneous impact energy and the impact time. Therefore, the cleaning pressure and stand-off distance that affects the instantaneous impact energy, and the traverse rate and cleaning times that affects the impact time are selected to explore the WSP cleaning paint.
Orthogonal experiments were used to analyze the influence of various factors on the experimental results. The orthogonal experiment table with four factors and three levels is designed as shown in Table 4. The relevant process parameter settings of the WSP cleaning process are shown in Table 5. The following methods were adopted to obtain the relevant data of the cleaned sample: (1) Weigh the mass of the cleaned sample and record it as w3; (2) Measure the Ra of the cleaned substrate; (3) Take a photo of the sample at the same height and position using a high definition camera of SONYHDR-CX405.
2.4. Related Parameter Definition
(1) Removal area ratio (λ): Based on the size of the entire sample, the percentage of the exposed substrate area to the entire sample area after cleaning is the removal area ratio.
The following steps are taken to determine the removal area ratio:
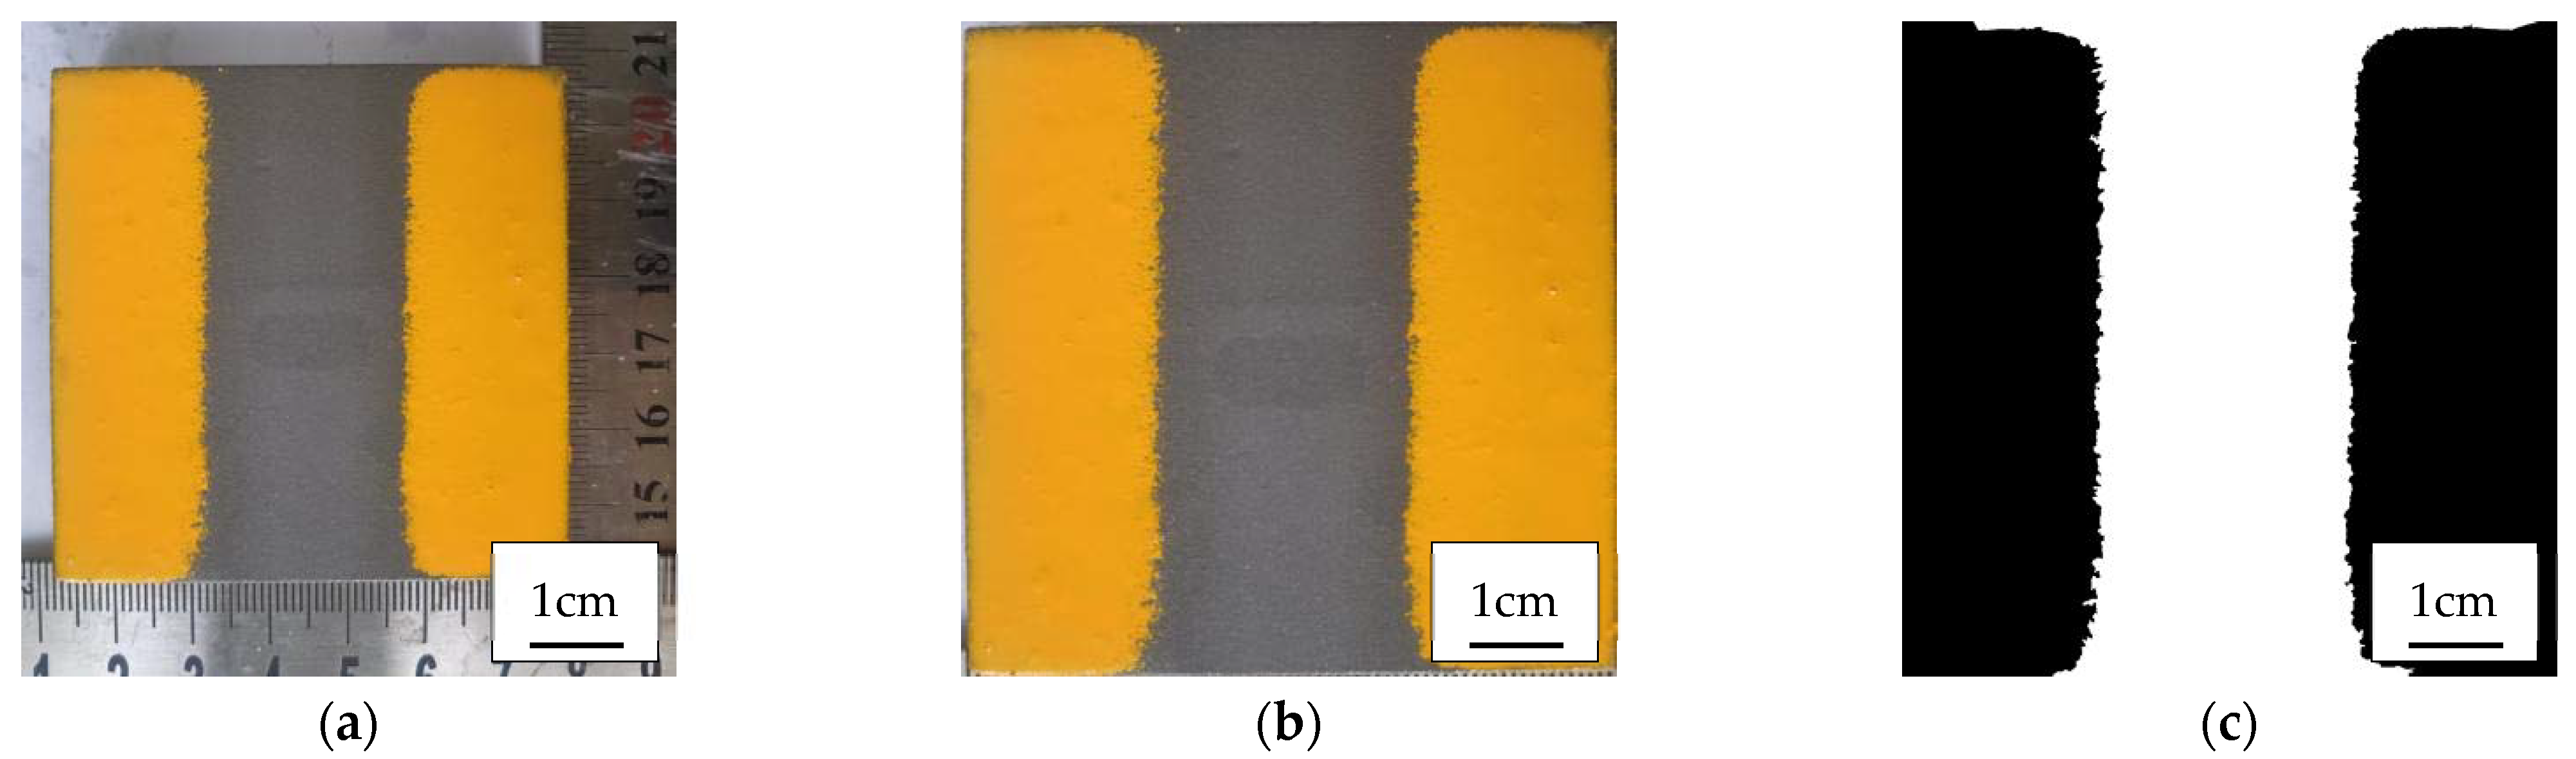
A. Take pictures of the cleaned samples at a unified height and position (Figure 3a);
B. Use the image processing software to cut the captured picture to a unified and suitable size (Figure 3b), making the substrate and the paint part form black and white parts with a large color difference (Figure 3c);
C. Use MATLAB software to identify the pixels in the picture and calculate the percentage of the removal area ratio.
(2) Cleaning efficiency (η): The cleaning efficiency is the removal area ratio per unit time; thus, η = λ/t, where t is the cleaning time.
(3) Removal mass ratio (R-mass, μ): The ratio of the total mass percentage removed by wet shot blasting to the mass of the entire paint layer. The mass of the substrate after pretreatment, spraying paint, and WSP cleaning is w1, w2, and w3, respectively. Thus, μ = (w2–w3)/(w2–w1).
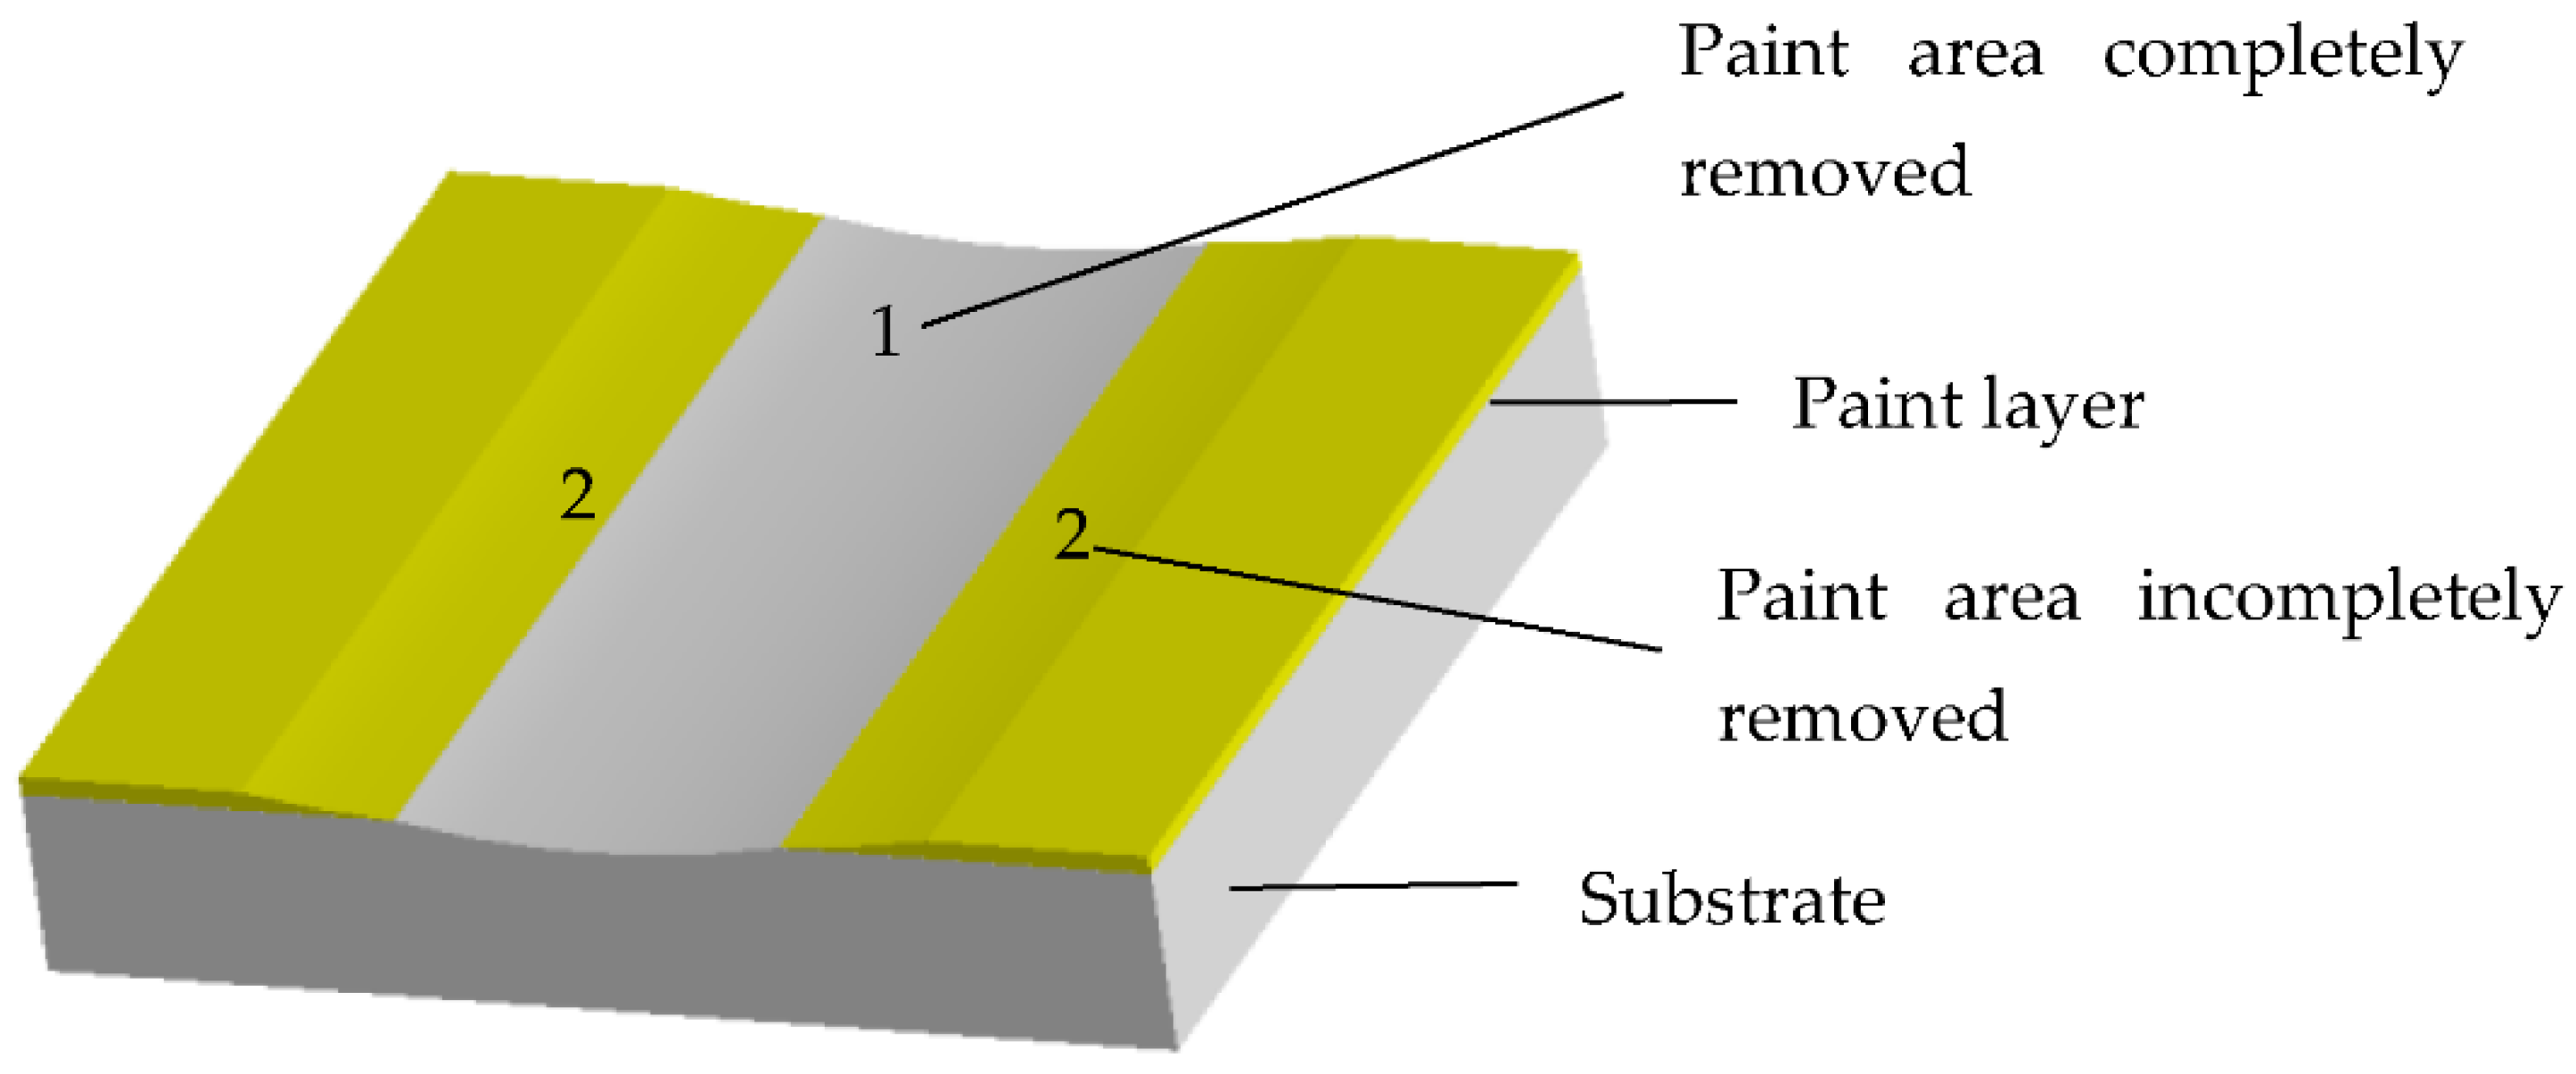
The total mass removed during the WSP cleaning process comprises the masses of the paint and substrate removed. The mass of the paint removed includes the paint removed completely and incompletely. Figure 4 shows that complete paint removal is a prerequisite for substrate removal. The incomplete removal of paint means that the impact energy of the jet periphery on the paint dirt is limited; thus, the uppermost layer of the paint is removed while the substrate is unexposed. The mass ratio of the paint removed completely is theoretically equal to the mass of the removal area. Therefore, the ratio of the removal mass always exceeds the ratio of the removal area.
3. Results and Discussion
3.1. Surface Topography Analysis
3.1.1. “Pseudo-Crack” Phenomenon
By analyzing the cleaned sample surface (Figure 3a), it is found that in the area where the paint is completely removed, the paint removal width on both sides is significantly wider than the middle part.
Under the condition that the WSP process parameters remain unchanged, the removal effect of WSP on paint depends on the adhesion between paint and substrate. The greater the adhesion, the more difficult the cleaning. As shown in Figure 5, the area marked by red rectangle 1 and 2 is the unit length, that is, the length of the short side of the rectangle can be ignored. The paint adhesion in internal area 1 is determined by the surrounding adhesion to the area. Suppose the adhesion in one direction is F, the adhesion of this area is 2F. Area 2 is located at the edge of the sample and only one side of the paint is affected by the surrounding adhesion, so the paint adhesion of area 2 is F, which is half as much as area 1. The principle can be understood approximately for the paint surface to produce crack, like the internal area 3 (2 unit length). Cracks appeared on the paint of area 3, making the paint unable to effectively stick together, thus reducing the adhesion of the paint on both sides of the crack, approximately reduced to half of the original. We can denote this phenomenon as a “pseudo-crack”. As a result of the “pseudo-crack” phenomenon, the energy required of removing the edge paint is slightly less than internal. Simultaneously, the water and abrasives of WSP cleaning are more likely to enter the paint interior, which both causing width of the removal of the paint at the edge higher than the internal part. Therefore, increasing paint surface crack is an effective way to improve cleaning efficiency.
3.1.2. Layer-by-Layer Paint Removal
The cleaned sample carried a painted surface that is incompletely removed, and the incompletely and completely removed areas constitute the contact area of the jet. When the instantaneous impact energy is small, the layer-by-layer paint removal phenomenon is more obvious. Under the experimental conditions of 0.25 MPa pressure, 100 mm stand-off distance, 5 mm/s traverse rate, and other wet peening parameters remain unchanged; as the cleaning times increase, the paint was continuously removed. An optical microscope with magnification of 400 times was used to observe the paint surface at the same position with different cleaning times. The change of paint surface morphology was shown in Figure 6. When the cleaning times of wet shot peening is once, the top layer of the paint is removed, and the paint surface becomes uneven (Figure 6b). As the cleaning times increase, the paint is incessantly removed, and finally, the substrate is completely exposed.
According to the GB/T 5210-2006 standard, the adhesion between the paint and the substrate using the pull method was tested. It was found that the damaged property of the paint was the damage between the paints rather than between the paint and the substrate; thus, the damage strength value measured by the method depends on the adhesion between the paints. Hence, the adhesion between paints is less than that between the paint and the substrate. Furthermore, it is confirmed that the paint removal is performed layer by layer. When the WSP energy is large, the impact force of the jet on the substrate surface can cause the paint to crack, which results in a layer-by-layer removal in a short time. Since this activity is completed instantaneously, it is intuitive to see that the paint is directly removed. In the actual work, the higher instantaneous impact energy of the jet increases the cleaning efficiency.
3.2. Analysis of Jet Velocity of Wet Shot Peening
The WSP jet completes the acceleration of the abrasive and water inside the nozzle. Under the action of air resistance, the jet’s energy ejected from the nozzle produces a certain loss. Ignoring the influence of other factors and considering that the energy loss is completely caused by air resistance (F), according to energy conservation amount, the process exists as follows [24,25]:
where C is the air drag coefficient, ρ is the air density, S is the windward area of the object, x is the stand-off distance, v0 is the velocity when the jet is ejected from the nozzle, and v is the jet’s center velocity when the stand-off distance is x. The air resistance is proportional to the air drag coefficient and the area facing the wind and is proportional to the square of the velocity. Consequently, the relationship between the velocity and stand-off distance is
The pressure determines the instantaneous velocity of the jet center when the jet is ejected from the nozzle. The greater the pressure, the higher the velocity; Figure 7 shows the relations diagram of the three factors. Taking the nozzle exit position as the starting point; i.e., zero on the abscissa. The figure only shows part of the whole. According to the trend of change, we can also see that with the increase of target distance, the velocity is infinitely close to 0.
3.3. Process Parameter Optimization Based on Cleaning Efficiency
Based on the orthogonal experiment, the experimental results are listed in Table 4.
The regression equation of the mathematical model is established for the cleaning efficiency (Y):
where A is the pressure, B is the stand-off distance, C is the traverse rate, and D is the cleaning times.
Based on the regression equation, the cleaning efficiency has positive relationship with factors A, B, and C, while has a negative relationship with D, respectively. The p-value indicates the significance of each factor to the result when other independent variables exist in the model. The p-value corresponding to each variable in the model is 0.177, 0.093, 0.006, and 0.025, respectively, which shows that the traverse rate and cleaning times have a more significant impact on the results. The standard regression error S in the model is 6.01504, which is within the acceptable range. R-Sp measures the ability of the regression equation to explain the variation of observed data, and is the ratio of the sum of squares of regression to the sum of squares of total deviations. The closer its value is to 1, the better the model fitting is. The R-Sp of this model is 92.25%, indicating that it has good fitting and is available.
The points in the residual normal distribution graph form a straight line (Figure 8a), and the average value of the residuals is zero (Figure 8c), indicating that the residuals are normally distributed. The randomness of the residuals is manifested in their random distribution around zero; there is no special point (Figure 8b), and all the residuals are arranged in the order of data collection (Figure 8d). Therefore, the model is appropriate.
Through the cleaning efficiency analysis, the level trend graph of each factor is drawn (Figure 9). The relationship between the parameters and the cleaning efficiency is consistent with the regression equation, verifying the model’s correctness. Therefore, to improve the cleaning efficiency, the pressure, stand-off distance, and traverse rate should be increased, and the cleaning times should be reduced. The degree of influence of each factor on the experimental index can be evaluated by the magnitude of the range (R). Evidently, RC is the largest, indicating that the traverse rate has the greatest influence on cleaning efficiency, followed by RD, and finally RA and RB with similar R values, suggesting that the pressure and stand-off distance within the experimental range slightly affect the cleaning efficiency. Therefore, the order of the degree of influence is traverse speed > cleaning times > stand-off distance > pressure.
According to the relationship diagram of the jet center velocity, cleaning pressure, and stand-off distance (Figure 7), the increase in cleaning pressure or the decrease of stand-off distance will increase the jet velocity, which will increase the instantaneous impact energy of the jet. The experimental results show that the impact energy of the pressure between 0.25 and 0.35 MPa is insufficient to achieve high-efficiency paint layer removal; thus, an increase in pressure has little effect on the cleaning efficiency. However, when the pressure exceeds 0.35 MPa, the efficiency is significantly improved; thus, a critical pressure value exists to maximize the utilization rate of pressure. Similarly, for the stand-off distance, it can be concluded that the impact energy within the stand-off distance can achieve effective cleaning of the paint. The cleaning efficiency change largely depends on the cleaning width increment. Due to the scattering phenomenon of the jet, increasing the stand-off distance will expand the jet’s contact range. When the impact energy is sufficient, the increase in the stand-off distance positively affects the cleaning efficiency.
Under the condition that the instantaneous impact energy of the jet is fixed, a decrease in the traverse speed and an increase in the cleaning times will increase the contact time between the jet and the paint, which will expand the paint removal area. The results show that the increase in the paint removal area is less than the increase in cleaning time, so that the paint removal area per unit time is reduced, which is manifested as a decrease in the cleaning efficiency.
Through the comprehensive analysis of the experimental results, the theoretically optimal parameter combination in this experiment is A3B3C3D1, i.e., 0.45 MPa pressure, 140 mm stand-off distance, 5 mm/s traverse rate, and one-time cleaning is performed. The experiment found the cleaning efficiency to be 64.23%/min under the above conditions, which is relatively high.
3.4. Process Parameter Optimization Based on Removal Mass of Substrate
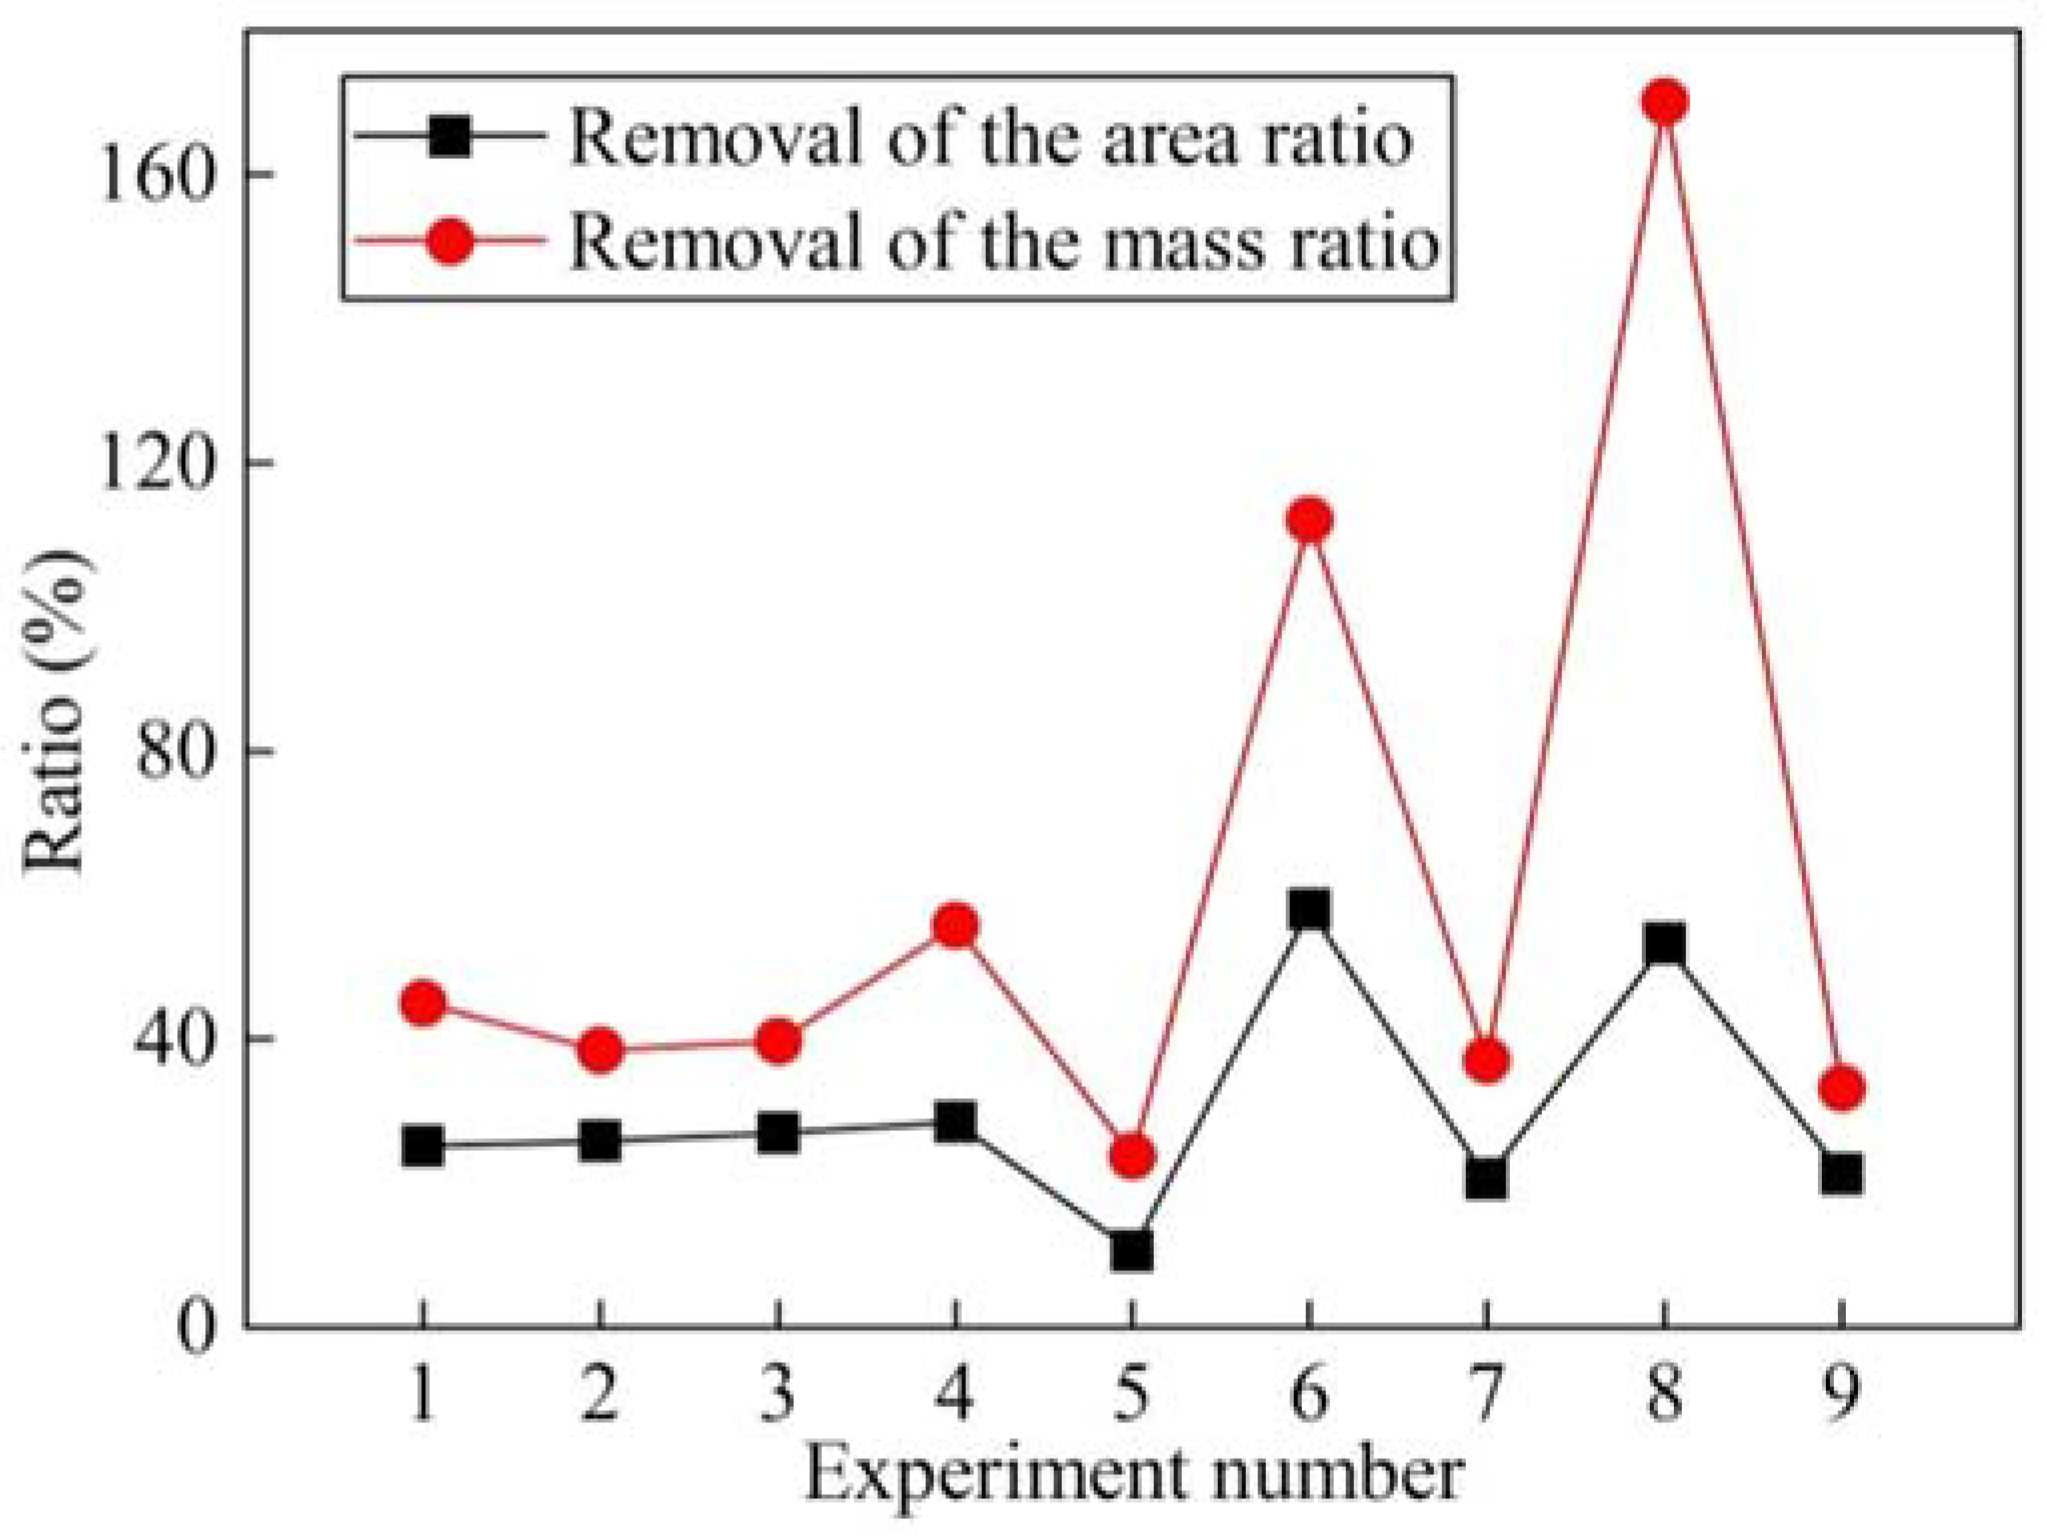
The comparison chart of removal mass and area ratio of the nine groups of experiments is shown in Figure 10. The overall change trend of the ratio of the removal mass and area is basically the same, corresponding to both. However, compared with other groups, the R-mass of the sixth and eighth groups of experiments are special. Compared to the data in Table 6, these two groups of removal mass accounted for 112.11% and 170.14%, respectively, which both exceed 100%. This situation indicates that there must be a removal of the substrate material under these two sets of experimental conditions. This situation should be avoided as much as possible in the actual WSP cleaning work.
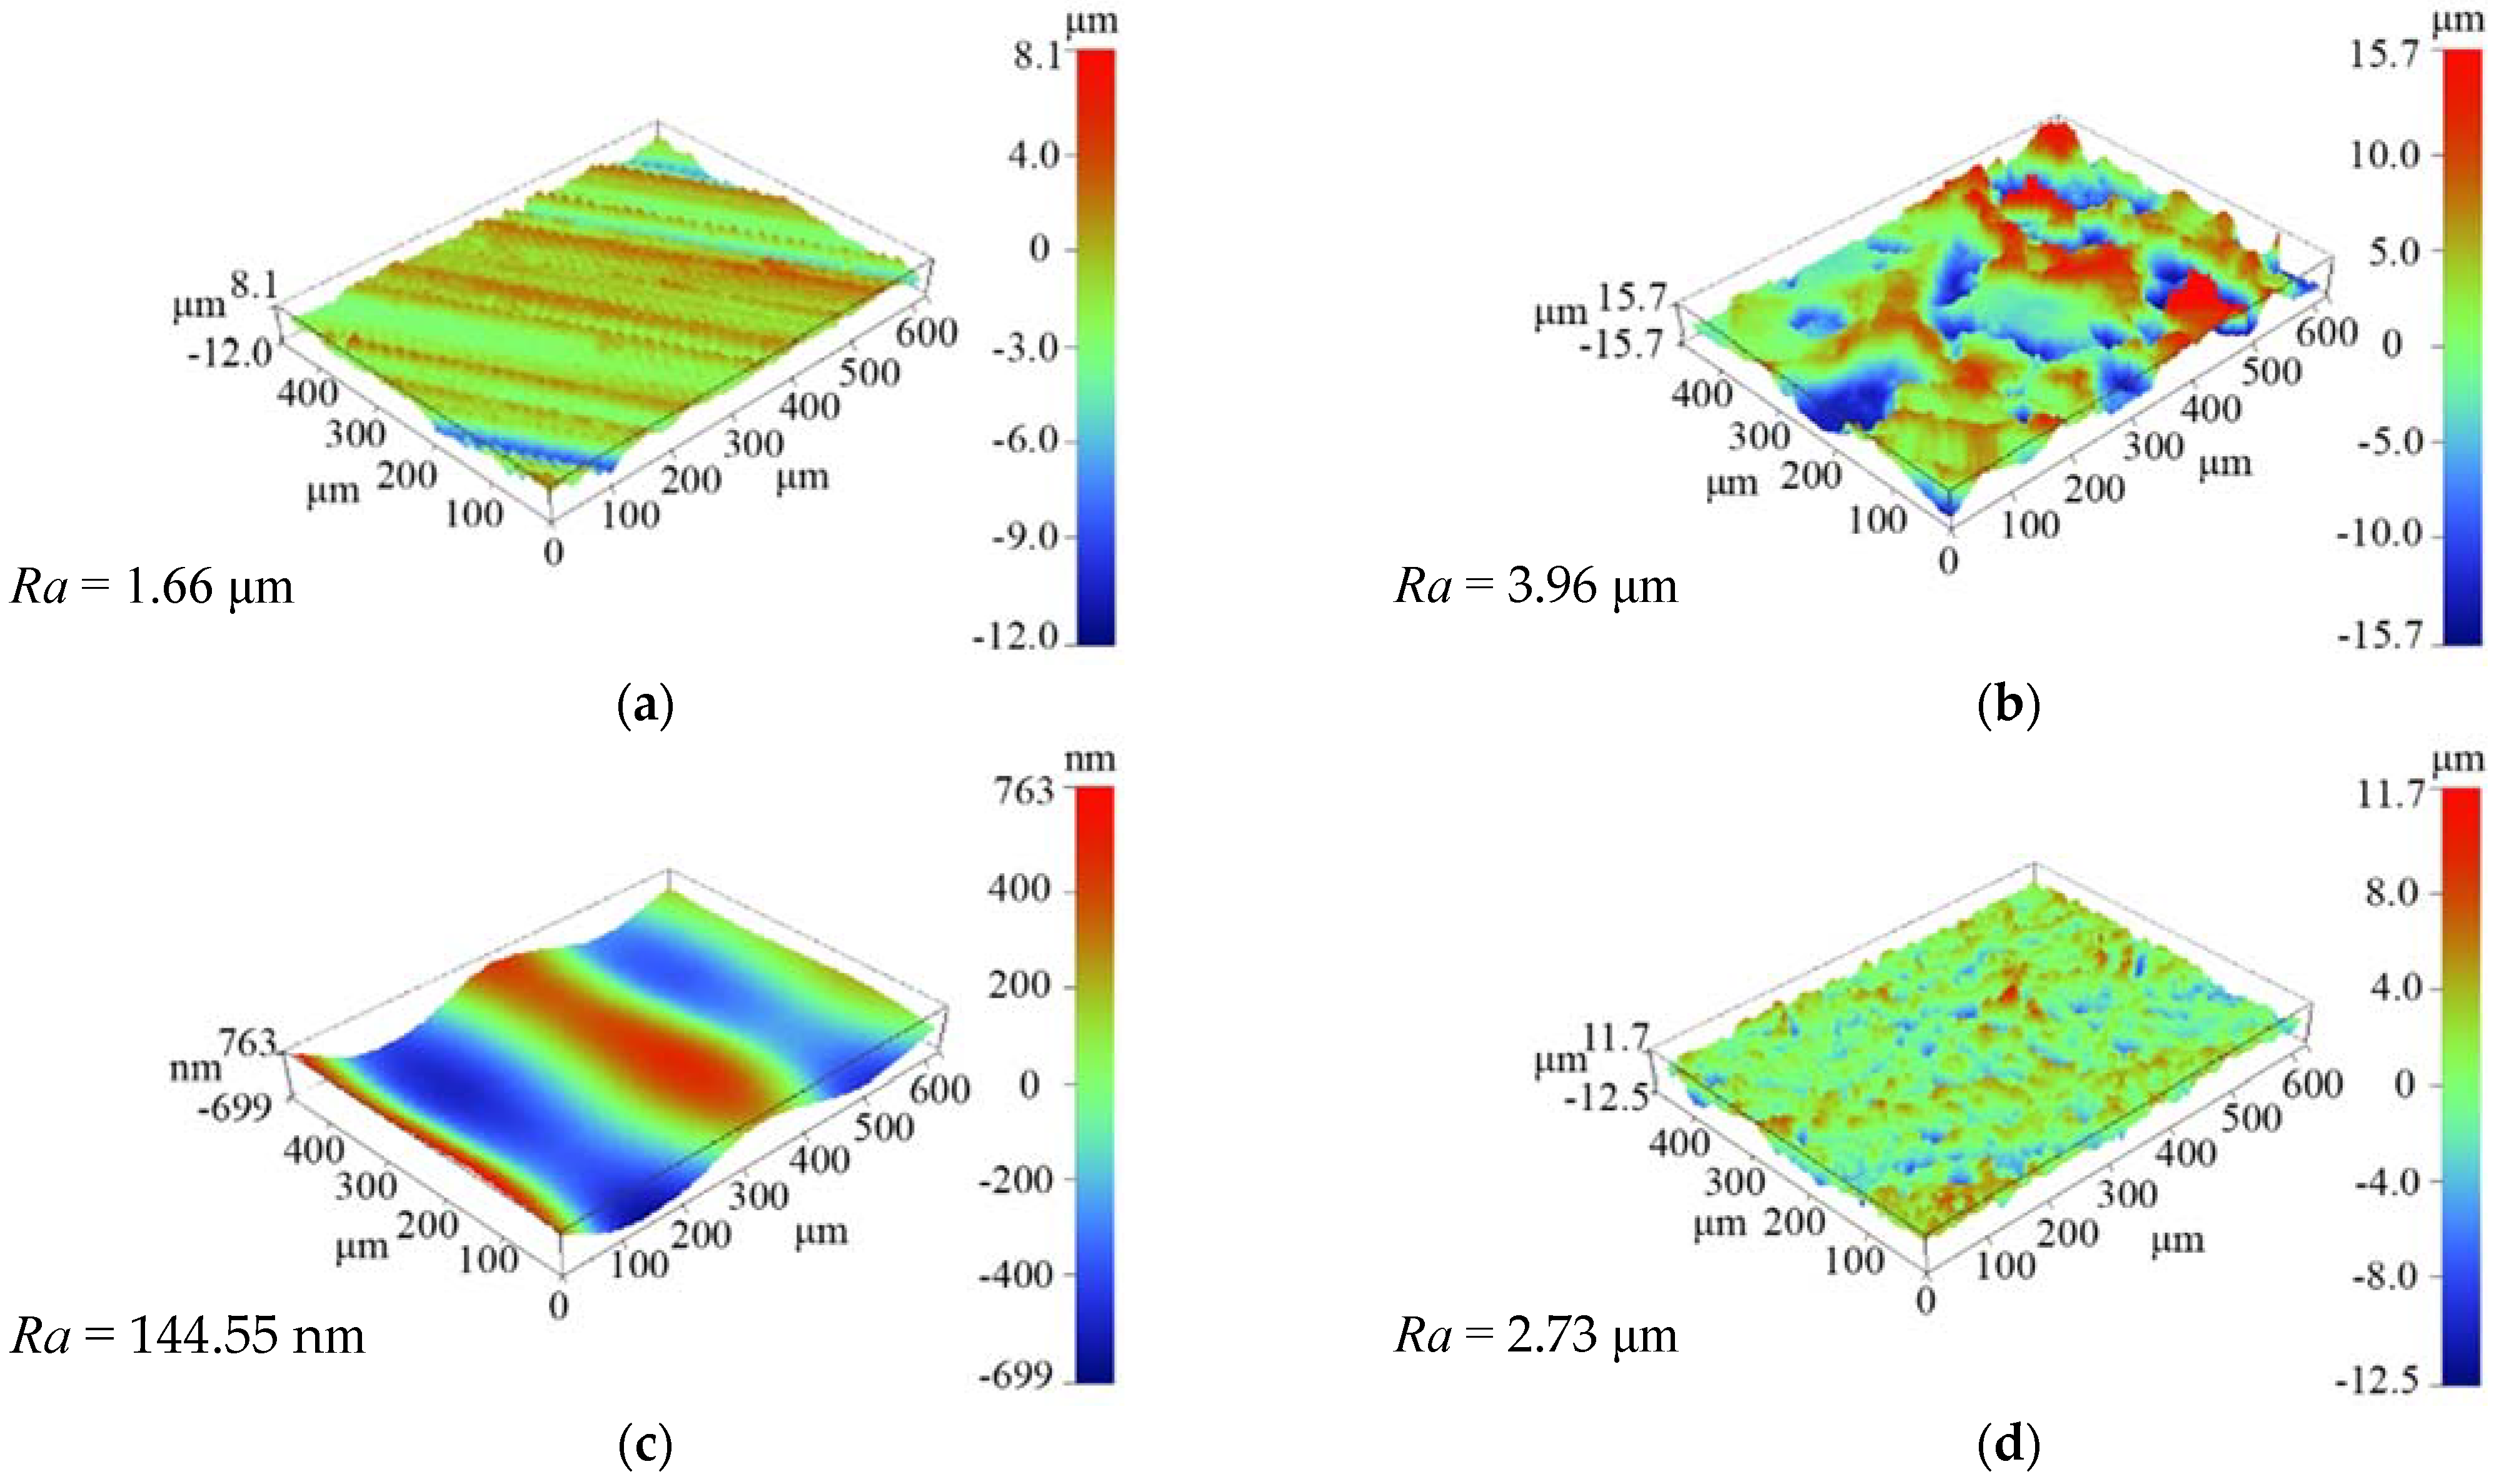
The difference between the two values is the sum of the mass ratio of the substrate removed and the paint incompletely removed. To minimize the impact of WSP cleaning on the substrate, the mass ratio of the substrate removed (R-sub) should be reduced. Using the change in Ra value of the substrate before and after WSP cleaning to judge the substrate removal mass. As shown in Figure 11, The Ra after pretreatment by dry sandblasting is higher than that after WSP. Which can be seen from the side that the influence of WSP cleaning on the substrate is less than that of dry sandblasting. The Ra after WSP cleaning is shown in the fourth column of Table 4. Taking the average value of the Ra of each sample after pretreatment as the Ra before the WSP cleaning (Figure 11b), and the average value is 3.82 μm. Comparing the Ra before and after WSP cleaning, the Ra of the fifth group after cleaning is greater than that before. By observing the samples after cleaning, it is found that under the experimental conditions, the paint area removed completely is less. The actual measurement value is the Ra value between the substrate and the surface of the paint removed incompletely, which will be significantly higher than the substrate surface roughness.
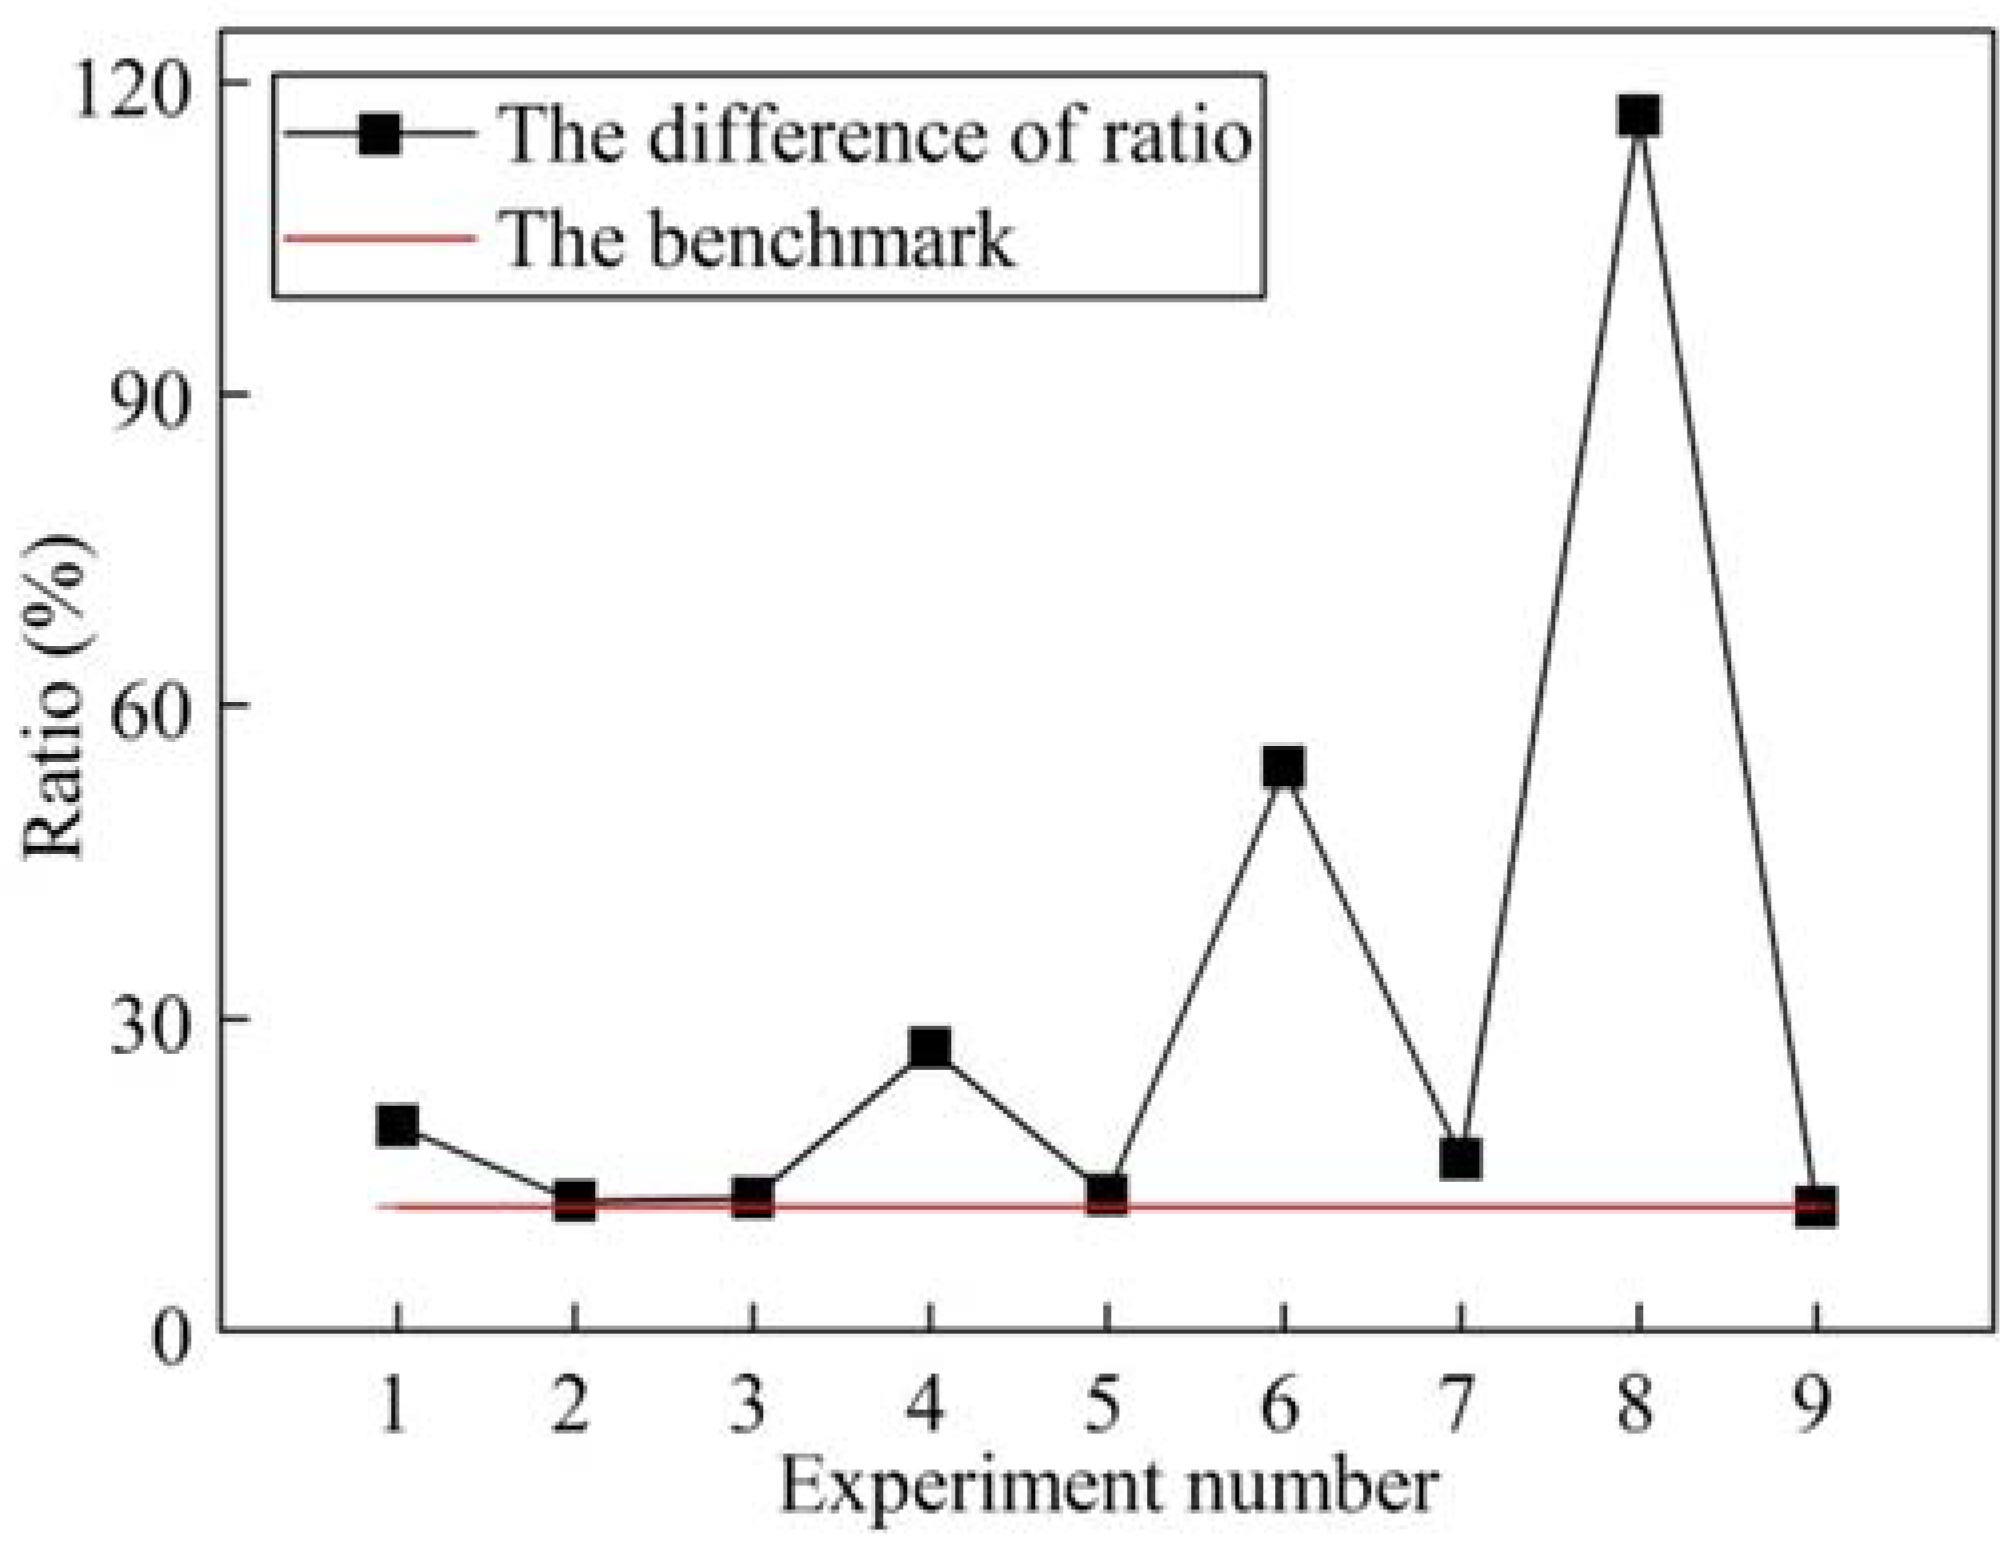
Through the comparative analysis of the substrate surface roughness after experiment and after pretreatment, when the difference between the two is very small, it is approximately considered that there is no substrate mass removal, which is an ideal assumption. In this case, the value of change in mass depends entirely on the mass of paint removed. The area of the paint completely removed under different parameters for different cleaning width, this part of the mass of the clean is to get rid of the great proportion. In the observation of the paint layer on the surface of the cleaned sample, it was found that the cleaning width of the unfinished area of the paint was little different or basically the same, so it was considered that the removal mass of the unfinished part of the paint was the same under different experiment conditions. Therefore, the sample with basically no change in surface roughness before and after cleaning was used as a reference, and the ratio of the mass of the paint incompletely removed under this condition was used as the benchmark. Judging the removal mass of the substrate under each experimental condition. According to the Ra analysis after cleaning, it is found that the data of the ninth group have the smallest change. Therefore, it is approximately thought that the substrate mass is not damaged under the experimental conditions, and the difference between the ratio of removal mass and area in the ninth group of experiments is regarded as the incomplete removal mass of the paint surface. Based on this value, the comparison chart is shown in Figure 12, and the difference between the two polylines is the R-sub under each experimental condition. Figure 13 shows the trend chart of factors related to the mass of substrate removal.
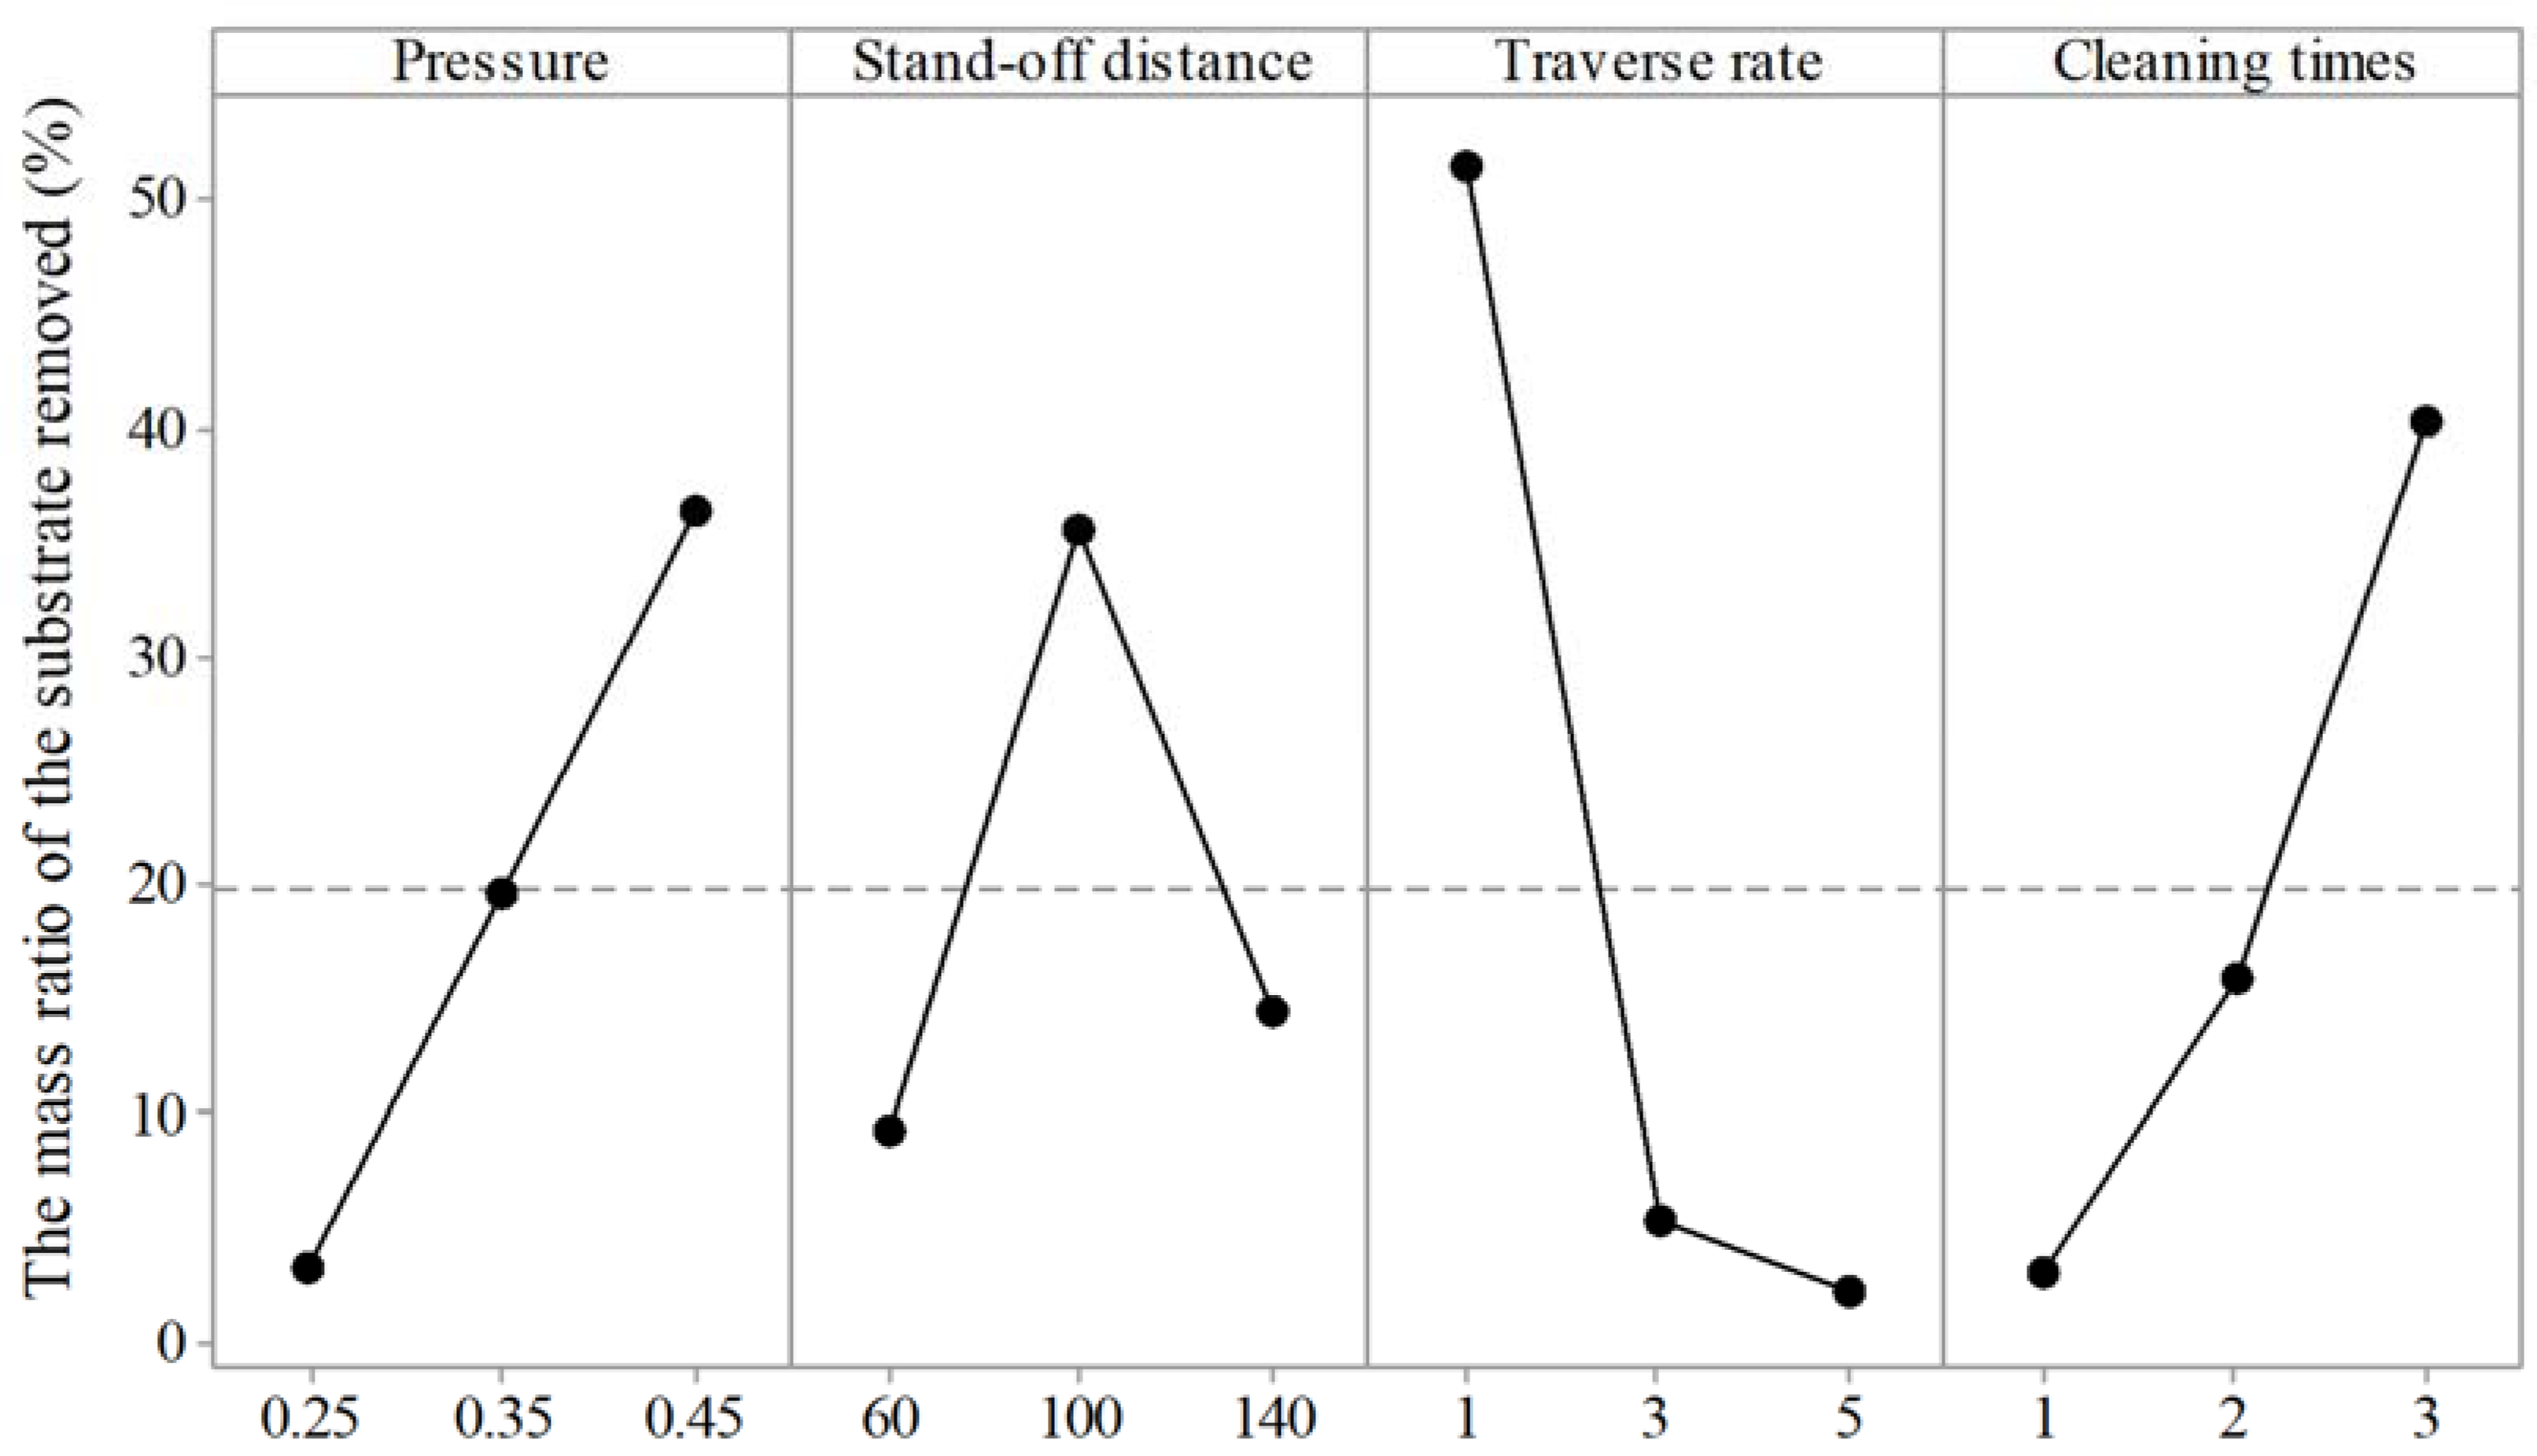
The analysis of Figure 12 shows that the eighth group of experiments has the largest R-sub, followed by the sixth, fourth, and first groups. The mass of the other groups of experiments basically remained unchanged. By analyzing the experimental parameters of these four groups, it is found that the three groups have a 1 mm/s traverse rate, which indicates that the prolonged traverse rate will remove a large amount of the substrate’s mass. Lower transverse rates should be avoided in WSP. To ensure the consistency of the substrate before and after cleaning, the traverse rate should be selected as 5 mm/s, which is consistent with the result of Figure 13. Figure 13 shows that the pressure and cleaning times are positively correlated with the R-sub, whereas the traverse rate is negatively correlated. As the stand-off distance increases, the R-sub initially increases and then decreases. The degree of influence from large to small is traverse rate > cleaning times > pressure > stand-off distance.
Like the removal of paint, the impact of WSP on the substrate also has a critical energy value. When the energy value is lower than the critical energy value, WSP mainly removes the paint and has less impact on the substrate. Conversely, the higher energy impacts the substrate, which decreases the substrate’s mass, but has little effect on the paint removal; thus, it does not increase the cleaning efficiency. The parameter range corresponding to the critical energy for removing the substrate can be roughly determined by comparing Figure 6 and Figure 11. The critical value of pressure is slightly less than 0.25 MPa, the traverse rate is ~5 mm/s, and one-time cleaning is performed. The changing trend of the R-sub shows that when the stand-off distance is within the range of 100–140 mm, the jet’s impact energy can realize the effective removal of paint. However, due to the difference in the performance of the substrate and the paint, the substrate is less affected. As the stand-off distance increases, the jet energy gradually decreases and eventually reaches a critical value, so the value exceeds 140 mm.
Through comprehensive analysis, the parameters that promote slight substrate change before and after WSP are 0.25 MPa pressure, 60 mm or 140 mm stand-off distance, 5 mm/s traverse rate, and one-time cleaning. Through the two experiments performed herein, it is found that the mass removal of the substrate is approximately equal to zero.
4. Conclusions
In this paper, HT250 cast iron and acrylic paint as the research object, through orthogonal experiment to explore the influence of WSP process parameters on cleaning effect, and observe the change of paint surface analysis of paint removal process. The main conclusions of this experiment are as follows:
- (1)
- According to the change of paint surface during the cleaning process, it is inferred that paint removal is achieved layer by layer, and it is pointed out that the pseudo-crack phenomenon is the main reason that the cleaning width of the two sides edge is higher than that of the middle part, so increasing paint surface crack is an effective way to improve cleaning efficiency.
- (2)
- Taking cleaning efficiency and the mass ratio of the substrate removed (R-sub) as the evaluation indexes of cleaning effect, it is found that increasing pressure, stand-off distance, traverse rate or reducing cleaning times can effectively improve the cleaning efficiency. The pressure and cleaning times were positively correlated with the R-sub, while the traverse rate was negatively correlated. With the increase of stand-off distance, the R-sub first increased and then decreased. According to the range, the traverse rate has the greatest influence on the cleaning efficiency and the R-sub, followed by the cleaning times, and the cleaning pressure and stand-off distance have little influence on it.
- (3)
- According to the change in the regular pattern of process parameters and the degree of influence on the evaluation index, the optimal process parameter with cleaning efficiency as the index is determined as A3B3C3D1, that is, 0.45 MPa pressure, 140 mm stand-off distance, 5 mm/s traverse rate, and one-time cleaning. The cleaning efficiency can reach 64.23%/min under this experiment. The optimization results of process parameters based on smaller R-sub are A1B1C3D1 and A1B3C3D1, that is to say, 0.25 MPa pressure, 60 mm or 140 mm stand-off distance, 5 mm/s traverse rate, and one-time cleaning. Under these parameters, the R-sub and the cleaning efficiency are almost zero. In the practical application of WSP, cleaning efficiency and the R-sub should be considered comprehensively. In other words, the adverse effect on the substrate of WSP cleaning is minimized while ensuring high cleaning efficiency. Therefore, combining the two index analyses, the transverse rate should be reduced from 5 mm/s to 3 mm/s, and the stand-off distance should be set as 140 mm. Under these conditions, the R-sub and cleaning efficiency were 5.37% and 38.65% /min, respectively.
In the actual working environment, different parts pay different attention to cleaning efficiency and the mass ratio of the substrate removed, so the selection of optimal process parameters is slightly different. This article aims to provide a method for selecting process parameters during WSP cleaning, so as to facilitate the practical application of users. The experiment sample used in this paper is flat, but there are curved surfaces and holes in the substrate in actual cleaning, so it is necessary to further study the process parameters, such as adjusting the cleaning angle to adapt to the non-flat structure or from a single abrasive to mixed abrasive.
Author Contributions
Conceptualization, S.W. and X.J.; methodology, S.W. and S.X.; software, S.W. and M.M.; validation, S.W. and X.W.; formal analysis, S.W.; investigation, S.W. and C.L.; resources, S.W. and S.X.; data curation, S.W.; writing—original draft preparation, S.W.; writing—review and editing; X.J.; visualization, S.W.; supervision, X.J. and F.L.; project administration, X.J. and F.L.; funding acquisition, X.J. All authors have read and agreed to the published version of the manuscript.
Funding
This research was funded by the National Natural Science Foundation of China (NSFC) through grant number 51875324.
Data Availability Statement
Not applicable.
Acknowledgments
The work was supported by the National Natural Science Foundation of China (No. 51875324). The authors are thankful for this support. The authors also wish to thank Jia and senior brothers for their help and guidance.
Conflicts of Interest
The authors declare no conflict of interest.
References
- Gong, Q.S.; Zhang, H.; Jiang, Z.G.; Ma, F. Methodology for steel plate remanufacturing cleaning with flexible cable impact contact and friction. In CIRP; Wang, L., Ed.; Elsevier Science BV: Amsterdam, The Netherlands, 2018; Volume 72, pp. 1374–1379. [Google Scholar]
- Gao, D.; Chen, J. ANFIS for high-pressure waterjet cleaning prediction. Surf. Coat. Technol. 2006, 201, 1629–1634. [Google Scholar]
- James, M.N.; Newby, M.; Hattingh, D.G.; Steuwer, A. Shot-Peening of Steam Turbine Blades: Residual Stresses and their Modification by Fatigue Cycling. Procedia Eng. Lukas 2010, 2, 441–451. [Google Scholar] [CrossRef] [Green Version]
- Bagherifard, S.; Molla, M.F.; Kajanek, D.; Donnini, R.; Hadzima, B.; Guagliano, M. Accelerated biodegradation and improved mechanical performance of pure iron through surface grain refinement. Acta Biomater. 2019, 98, 88–102. [Google Scholar] [CrossRef]
- Abbasi, S.; Nouri, M.; Rouhaghdam, A.S. A novel combined method for fabrication of stable corrosion resistance superhydrophobic surface on Al alloy. Corros. Sci. 2019, 159, 108144. [Google Scholar] [CrossRef]
- Kambham, K.; Sangameswaran, S.; Datar, S.R.; Kura, B. Copper slag: Optimization of productivity and consumption for cleaner production in dry abrasive blasting. J. Clean. Prod. 2005, 15, 465–473. [Google Scholar] [CrossRef]
- Lindahl, M.; Svensson, N.; Svensson, B.H.; Sundin, E. Industrial cleaning with Qlean Water—A case study of printed circuit boards. J. Clean. Prod. 2013, 47, 19–25. [Google Scholar] [CrossRef] [Green Version]
- Kikuchi, E.; Kikuchi, Y.; Hirao, M. Analysis of risk trade-off relationships between organic solvents and aqueous agents: Case study of metal cleaning processes. J. Clean. Prod. 2011, 19, 414–423. [Google Scholar] [CrossRef]
- Cho, K.T.; Song, K.; Oh, S.H.; Lee, Y.-K.; Lim, K.M.; Lee, W.B. Surface hardening of aluminum alloy by shot peening treatment with Zn based ball. Mater. Sci. Eng. A-Struct. 2012, 543, 44–49. [Google Scholar] [CrossRef]
- Yang, M.; Choi, J.; Lee, J.; Hur, N.; Kim, D. Wet blasting as a deburring process for aluminum. J. Mater. Process. Technol. 2014, 214, 524–530. [Google Scholar] [CrossRef]
- Haldar, B.; Ghara, T.; Ansari, R.; Das, S.; Saha, P. Abrasive jet system and its various applications in abrasive jet machining, erosion testing, shot-peening, and fast cleaning. Mater. Today Proc. 2018, 5, 13061–13068. [Google Scholar] [CrossRef]
- Kennedy, D.M.; Vahey, J.; Hanney, D. Micro shot blasting of machine tools for improving surface finish and reducing cutting forces in manufacturing. Mater. Des. 2005, 26, 203–208. [Google Scholar] [CrossRef] [Green Version]
- Bagherifard, S.; Hickey, D.J.; Fintová, S.; Pastorek, F.; Fernandez-Pariente, I.; Bandini, M.; Webster, T.J.; Guagliano, M. Effects of nanofeatures induced by severe shot peening (SSP) on mechanical, corrosion and cytocompatibility properties of magnesium alloy AZ31. Acta Biomater. 2018, 66, 93–108. [Google Scholar] [CrossRef] [Green Version]
- Chen, G.-Q.; Jiao, Y.; Tian, T.-Y.; Zhang, X.-H.; Li, Z.-Q.; Zhou, W.-L. Effect of wet shot peening on Ti-6Al-4V alloy treated by ceramic beads. Trans. Nonferrous Met. Soc. China 2014, 24, 690–696. [Google Scholar] [CrossRef]
- Papini, M.; Spelt, J.K. Organic coating removal by particle impact. Wear 1997, 213, 185–199. [Google Scholar] [CrossRef]
- Zeng, J.; Kim, T.J. An erosion model for abrasive waterjet milling of polycrystalline ceramics. Wear 1996, 199, 275–282. [Google Scholar] [CrossRef]
- Dong, Y.Z. Mechanism and Experiment Study of Paint Layer Cleaning Based on Abrasive Water Jet Technology. Master’s Thesis, Dalian University of Technology, Dalian, China, 2015. [Google Scholar]
- Junkar, M.; Jurisevic, B.; Fajdiga, M.; Grah, M. Finite element analysis of single-particle impact in abrasive water jet machining. Int. J. Impact Eng. 2004, 32, 1095–1112. [Google Scholar] [CrossRef]
- Teimourian, H.; Shabgard, M.R.; Momber, A.W. De-painting with high-speed water jets: Paint removal process and substrate surface roughness. Prog. Org. Coat. 2010, 69, 455–462. [Google Scholar] [CrossRef]
- Deris, A.M.; Zain, A.M.; Sallehuddin, R. Hybrid GR-SVM for prediction of surface roughness in abrasive water jet machining. Meccanica 2013, 48, 1937–1945. [Google Scholar] [CrossRef]
- Raykowski, A.; Hader, M.; Maragno, B.; Spelt, J.K. Blast cleaning of gas turbine components: Deposit removal and substrate deformation. Wear 2001, 249, 127–132. [Google Scholar] [CrossRef]
- Zouari, B.; Touratier, M. Simulation of organic coating removal by particle impact. Wear 2002, 253, 488–497. [Google Scholar] [CrossRef] [Green Version]
- Guo, Z.H.; Zhou, J.Z.; Meng, X.K. Nanosecond-Pulsed-Laser paint stripping of HT250 gray cast iron. Chin. J. Laser 2019, 46, 191–197. [Google Scholar]
- Liu, X.F. Droplets Distribution Characteristic Study on Complete Fluidic Sprinkler; Jiangsu University: Zhenjiang, China, 2016. [Google Scholar]
- Carrion, P.; Tarjuelo, J.M.; Montero, J. SIRIAS: A simulation model for sprinkler irrigation—I. Description of model. Irrig. Sci. 2001, 20, 73–84. [Google Scholar] [CrossRef]
Figure 1.
Working principle diagram of WSP.

Figure 2.
The cleaning equipment diagram of WSP.

Figure 3.
Process of image processing. (a) Original image, (b) after cropping, and (c) after black and white processing.
Figure 3.
Process of image processing. (a) Original image, (b) after cropping, and (c) after black and white processing.

Figure 4.
Ideal model of sample after cleaning.

Figure 5.
Paint sample model.

Figure 6.
Change process of sample surface. (a) No cleaning, (b) Cleaning one time, (c) Cleaning two times, (d) Cleaning three times.
Figure 6.
Change process of sample surface. (a) No cleaning, (b) Cleaning one time, (c) Cleaning two times, (d) Cleaning three times.

Figure 7.
Relationship between pressure, stand-off distance, and jet center velocity.

Figure 8.
Residual plots for cleaning efficiency. (a) Normal probability plot of residuals, (b) Residual versus fitted values, (c) Histogram of residuals, (d) Residual versus order of data.
Figure 8.
Residual plots for cleaning efficiency. (a) Normal probability plot of residuals, (b) Residual versus fitted values, (c) Histogram of residuals, (d) Residual versus order of data.

Figure 9.
Factor-level trend chart of cleaning efficiency.

Figure 10.
Comparison chart of removal mass and area ratio.

Figure 11.
Variation of sample surface roughness value. (a) Untreated, (b) After pretreatment by dry sandblasting, (c) After painting, (d) After wet shot peening cleaning.
Figure 11.
Variation of sample surface roughness value. (a) Untreated, (b) After pretreatment by dry sandblasting, (c) After painting, (d) After wet shot peening cleaning.

Figure 12.
Difference comparison between removal-mass-to-area-ratio and benchmark.

Figure 13.
Factor-level trend chart of removal mass.


Table 1.
Mechanical properties of the HT250 gray cast iron specimens.
| Property | Value |
|---|---|
| Density | 6.8–7.3 g/cm3 |
| Tensile strength | 250 MPa |
| Hardness | 209 HB (est bar diameter: 30 mm) |
| Melting point | 1145–1250 °C |
Table 2.
Chemical composition of HT250 gray cast iron specimens.
| Elements | Content Percentage |
|---|---|
| C | 3.16–3.30 |
| Si | 1.79–1.93 |
| Mn | 0.89–1.04 |
| S | 0.094–0.125 |
| P | 0.120–0.170 |
| Fe | Others |
Table 3.
Dry sandblasting pretreatment parameters.
| Parameter | Value |
|---|---|
| Pressure (MPa) | 0.50 |
| Stand-off distance (mm) | 200 |
| Exposure time (s) | 20 |
| Impact angle | 90° |
| Nozzle diameter (mm) | 8 |
| Nozzle type | Round nozzle |
| Traverse length (mm) | 60 |
| Abrasive type | 24# steel shot |
Table 4.
L9(34) orthogonal design table.
| No. | Factors | |||
|---|---|---|---|---|
| A | B | C | D | |
| Pressure/MPa | Stand-Off Distance/mm | Traverse Rate/mm∙s−1 | Cleaning Times | |
| 1 | 1 (0.25) | 1 (60) | 1 (1) | 1 (1) |
| 2 | 1 | 2 (100) | 2 (3) | 2 (2) |
| 3 | 1 | 3 (140) | 3 (5) | 3 (3) |
| 4 | 2 (0.35) | 1 | 2 | 3 |
| 5 | 2 | 2 | 3 | 1 |
| 6 | 2 | 3 | 1 | 2 |
| 7 | 3 (0.45) | 1 | 3 | 2 |
| 8 | 3 | 2 | 1 | 3 |
| 9 | 3 | 3 | 2 | 1 |
Table 5.
Process parameters for paint system removal experiments.
| Parameter | Value |
|---|---|
| Pressure (MPa) | 0.25–0.35–0.45 |
| Stand-off distance (mm) | 60–100–140 |
| Traverse rate (mm/s) | 1–3–5 |
| Cleaning times | 1–2–3 |
| Impact angle | 90° |
| Nozzle diameter (mm) | 8 |
| Nozzle type | Round nozzle |
| Traverse length (mm) | 60 |
| Mixing volume ratio of abrasive and water | 1:15 |
| Abrasive type | 60# white fused alumina |
Table 6.
Orthogonal experiment result.
| No. | Experiment Result | |||
|---|---|---|---|---|
| Cleaning Efficiency /%∙min−1 | Removal Area Ratio /% | Removal Mass Ratio /% | Surface Roughness (Ra) /μm | |
| 1 | 25.25 | 25.25 | 45.02 | 2.41 |
| 2 | 38.90 | 25.93 | 38.47 | 3.26 |
| 3 | 44.92 | 26.95 | 39.74 | 3.24 |
| 4 | 28.60 | 28.60 | 55.83 | 2.88 |
| 5 | 53.51 | 10.70 | 23.79 | 4.37 |
| 6 | 29.00 | 58.00 | 112.11 | 2.73 |
| 7 | 51.52 | 20.61 | 37.16 | 3.55 |
| 8 | 17.78 | 53.33 | 170.14 | 3.00 |
| 9 | 63.87 | 21.29 | 33.21 | 3.86 |
Publisher’s Note: MDPI stays neutral with regard to jurisdictional claims in published maps and institutional affiliations. |
© 2021 by the authors. Licensee MDPI, Basel, Switzerland. This article is an open access article distributed under the terms and conditions of the Creative Commons Attribution (CC BY) license (https://creativecommons.org/licenses/by/4.0/).
Share and Cite
MDPI and ACS Style
Wu, S.; Jia, X.; Xiong, S.; Li, F.; Ma, M.; Wang, X.; Li, C. Process Parameters Optimization of Wet Shot Peening for Paint Cleaning. Sustainability 2021, 13, 12915. https://0-doi-org.brum.beds.ac.uk/10.3390/su132212915
AMA Style
Wu S, Jia X, Xiong S, Li F, Ma M, Wang X, Li C. Process Parameters Optimization of Wet Shot Peening for Paint Cleaning. Sustainability. 2021; 13(22):12915. https://0-doi-org.brum.beds.ac.uk/10.3390/su132212915
Chicago/Turabian StyleWu, Shuangshuang, Xiujie Jia, Sheng Xiong, Fangyi Li, Mingliang Ma, Xing Wang, and Chenghao Li. 2021. "Process Parameters Optimization of Wet Shot Peening for Paint Cleaning" Sustainability 13, no. 22: 12915. https://0-doi-org.brum.beds.ac.uk/10.3390/su132212915
Note that from the first issue of 2016, this journal uses article numbers instead of page numbers. See further details here.