1. Introduction
Counting passengers in cars, trucks and buses all the time is a difficult and very important task in terms of passenger safety and monitoring the migration and traffic density. Passenger counting has multiple applications starting with high-occupancy vehicle lanes, faster and more precise intervention of rescue services, better understanding of traffic load or predictive maintenance based on abrasion [
1].
The general question in road tunnel safety is how many people are in there during major events such as floods, fire, explosion of hazardous materials and other incidents [
2,
3]. E-call service is not suitable or meant to be used to actively count passengers; thus, this is where existing tunnel systems or newly installed systems or devices come into play.
Main issues with counting passengers are rapidly moving vehicles are drastic changes in the lightning and visibility conditions (heavy rain, fog, smog, smoke, sunny and bright day) when external cameras are used. Another approach might be counting passengers with cameras installed inside the vehicle; however, this introduces privacy concerns, as well as an e-call system with its microphones installed inside the vehicle. Because of these privacy issues, we chose a noninvasive path and decided to use external cameras instead. It is also difficult to tell apart face masks and dummies for the camera; thus, we proposed the use of the thermal camera TPH3008-S. By using a thermal camera, we do not compromise passenger privacy very much. In addition to this, we also proposed the use of two IP cameras VIVOTEK IP7361.
Our methods consist of two stages. First, we propose passenger detection using the classical method with the use of the Viola–Jones algorithm invented in 2001 used in the Haar cascades, which are still used in many devices today. This method of detection in combination with thermal images has very serious drawbacks, for which it cannot be used either in road tunnels or on motorways. The main disadvantage is the fact that this thermal imager TPH3008-S cannot capture the energy of the passengers inside vehicle and thus the accuracy of detection with the vehicle windows closed is zero. The algorithm as such is excellent for real-time image data processing with relatively good accuracy. With this drawback, we decided to capture images with car windows opened. In our previous research, we wanted to verify the success of thermal camera detection and evaluation. In practice, such an approach with open windows is impossible, but the system designed in this way is planned to expand with a hyperspectral camera, and this approach serves as a basis for future work.
After detecting passengers with the help of a thermal camera, we try to detect passengers using industrial IP cameras. We had 2 pieces of VIVOTEK IP7361 IP cameras available for laboratory experiments. We tried to simulate the conditions in the road tunnels and when the vehicle is stopped on a ramp. For passenger detection, we used an existing pretrained neural network based on the YOLO version 3 algorithm, and we also trained the model on our own image data.
Later, we investigate limitations of passenger detection. Environmental and weather conditions such as sun, snow, fog, heavy rain, smog, gloss of materials and other physical properties that make the alternative detection of passengers play an important role. It seems appropriate to count the smartphones or other devices that each passenger has with them to achieve at least a 90% success rate. It is assumed that the success rate of passenger detection is around 50% with the use of cameras we have. In this work, we try to achieve a better result.
The next sections of this paper are organized as follows:
Section 1.1 presents a literature review of similar work. In
Section 2, we give detailed information about our experiments. In
Section 3, we explain details and results of our models based on Haar cascade and deep neural network.
Section 4 presents the limitations of noninvasive passenger detection. In
Section 5, we propose alternative methods for passenger detection, and the last chapters are discussion and the conclusions.
1.1. Literature Overview
Paper [
4] proposes a tiny convolutional model to count onboard passengers with the use of in-vehicle thermal imager. They created a data set with the total 1284 images with the number of passengers in limits between 0 and 5. Then, they augmented the data set with the use of rescale and rotation, and in the end, they achieved 25,680 images and used for training and testing neural models. In the end, the results of this invasive approach (camera was placed inside the vehicle) are comparable to the state of the art. Article [
5] compares and analyzes the performance of existing deep learning models and proposes vehicle occupancy detection algorithm.
Reference [
6] provides the background for detecting and counting passengers using on-car monocular vision. This system is based on the human perception model in terms of spatio-temporal reasoning, which means the slight movements of passenger silhouettes. They proposed an efficient pipeline method to leverage a convolutional neural network on inferring the number and position of passengers.
Project [
7] explains about detecting passengers and classifying each person as a child or adult based on an image from a camera placed inside car. The main, widely used technique of detection is the Haar Cascades for detection. The concept is based on Raspberry Pi with a night-vision camera with adjustable focusing. The main goal of this project is to prevent airbag deployment in a car near children, because it can kill children below 12 years due to the rapid action and a lot of force. Paper [
8] presents a new optimization problem for decision support in occupation detection in cars, especially when the front seat is occupied with a child in order to disarm airbags.
Experiment [
9] proposes a cost-effective system of detecting people based on Arduino platform and AMG8833 IR sensor with fast detection in 8 × 8 matrix. With some limitations, it is possible to differentiate seated and nonseated positions in the car. It was found that the sensor can detect front-position people and back-seated people blend into the ambience. However, with more sensor nodes and thoughtful placement, it is a possible and low-cost solution.
Review [
10] presents the possibilities of autonomous passenger detection for system e-call. There are many solutions for passenger detection from the inside of the vehicle—starting from seat-belt-based solutions, IR-based optical methods, TOF (time of flight) cameras, gas sensors or OWS (occupant weight sensors). Reference [
11] proposes an antenna sensor on the basis of electromagnetic coupling between a transmitter and a receiver patch antenna placed under the passenger.
The results of [
12] show that the detection and localization of passengers based on finding heads is achievable using a stereo camera. This paper also focuses on airbag safety such as [
7] and provides necessary information whether and how an airbag should be deployed in the case of an accident. By using monocular color camera, researchers in [
13] achieved excellent performance for passenger head detection.
Bus passenger detection is also very difficult task especially during rush hours. In paper [
14], the authors propose an optimized tiny YOLO network model, which can be applied in embedded systems and mobile terminals. This model can achieve good detection results and is robust enough to be applied to embedded devices. Paper [
15] proposes a vision-based system to track and count passengers. The main disadvantage is changing dimensions of the passenger body size when moving toward or away from the top-mounted camera. Older papers [
16] propose an algorithm for detecting the car first and then the windshield, and finally, the segments for the passengers and study [
17] provide the necessary foundations about HOV lane violations. Reference [
18] specifies the problems and solutions for the imaging aspect of automatic passenger detection. The authors in [
19] are also interested in passenger detection in public places.
High-occupancy vehicle lanes (HOV) are lanes reserved for vehicles with multiple passengers and are designed to encourage people to travel together. Reference [
20] proposes a system based on analysis of visual images and combines the results of different types of classifiers to achieve robust and real-time detection. Paper [
21] presents an AI-based vehicle passenger detection system to enforce HOV/HOT lane movement. The system automates and improves the identification of HOV violators and assigns faces and tolls to users. Paper [
22] presents a machine learning approach for semiautomatic or automatic front-seat vehicle occupancy detection with great accuracy. Reference [
23] uses the Fisher vector image representation to achieve occupancy detection. It is clear that the Fisher-vector-based image classification approach outperforms the state-of-the-art model and yields accuracy rates above 95%.
The majority of the solutions mentioned above are based on the concept of detecting passengers from the inside of the vehicle-like [
24,
25] but not from the outside and sending this information wirelessly to the nearest superior receiver [
26]. This is why we tried to create two small data sets of images taken from the outside and decided to train models to achieve similar results while being noninvasive. The new and modern approach also uses IoT [
27,
28] to meet the user, society and industry requirements. Some of the proposed methods in this section might be implemented into a mesh wireless sensor network and also communicate with other cars.
2. Materials and Methods
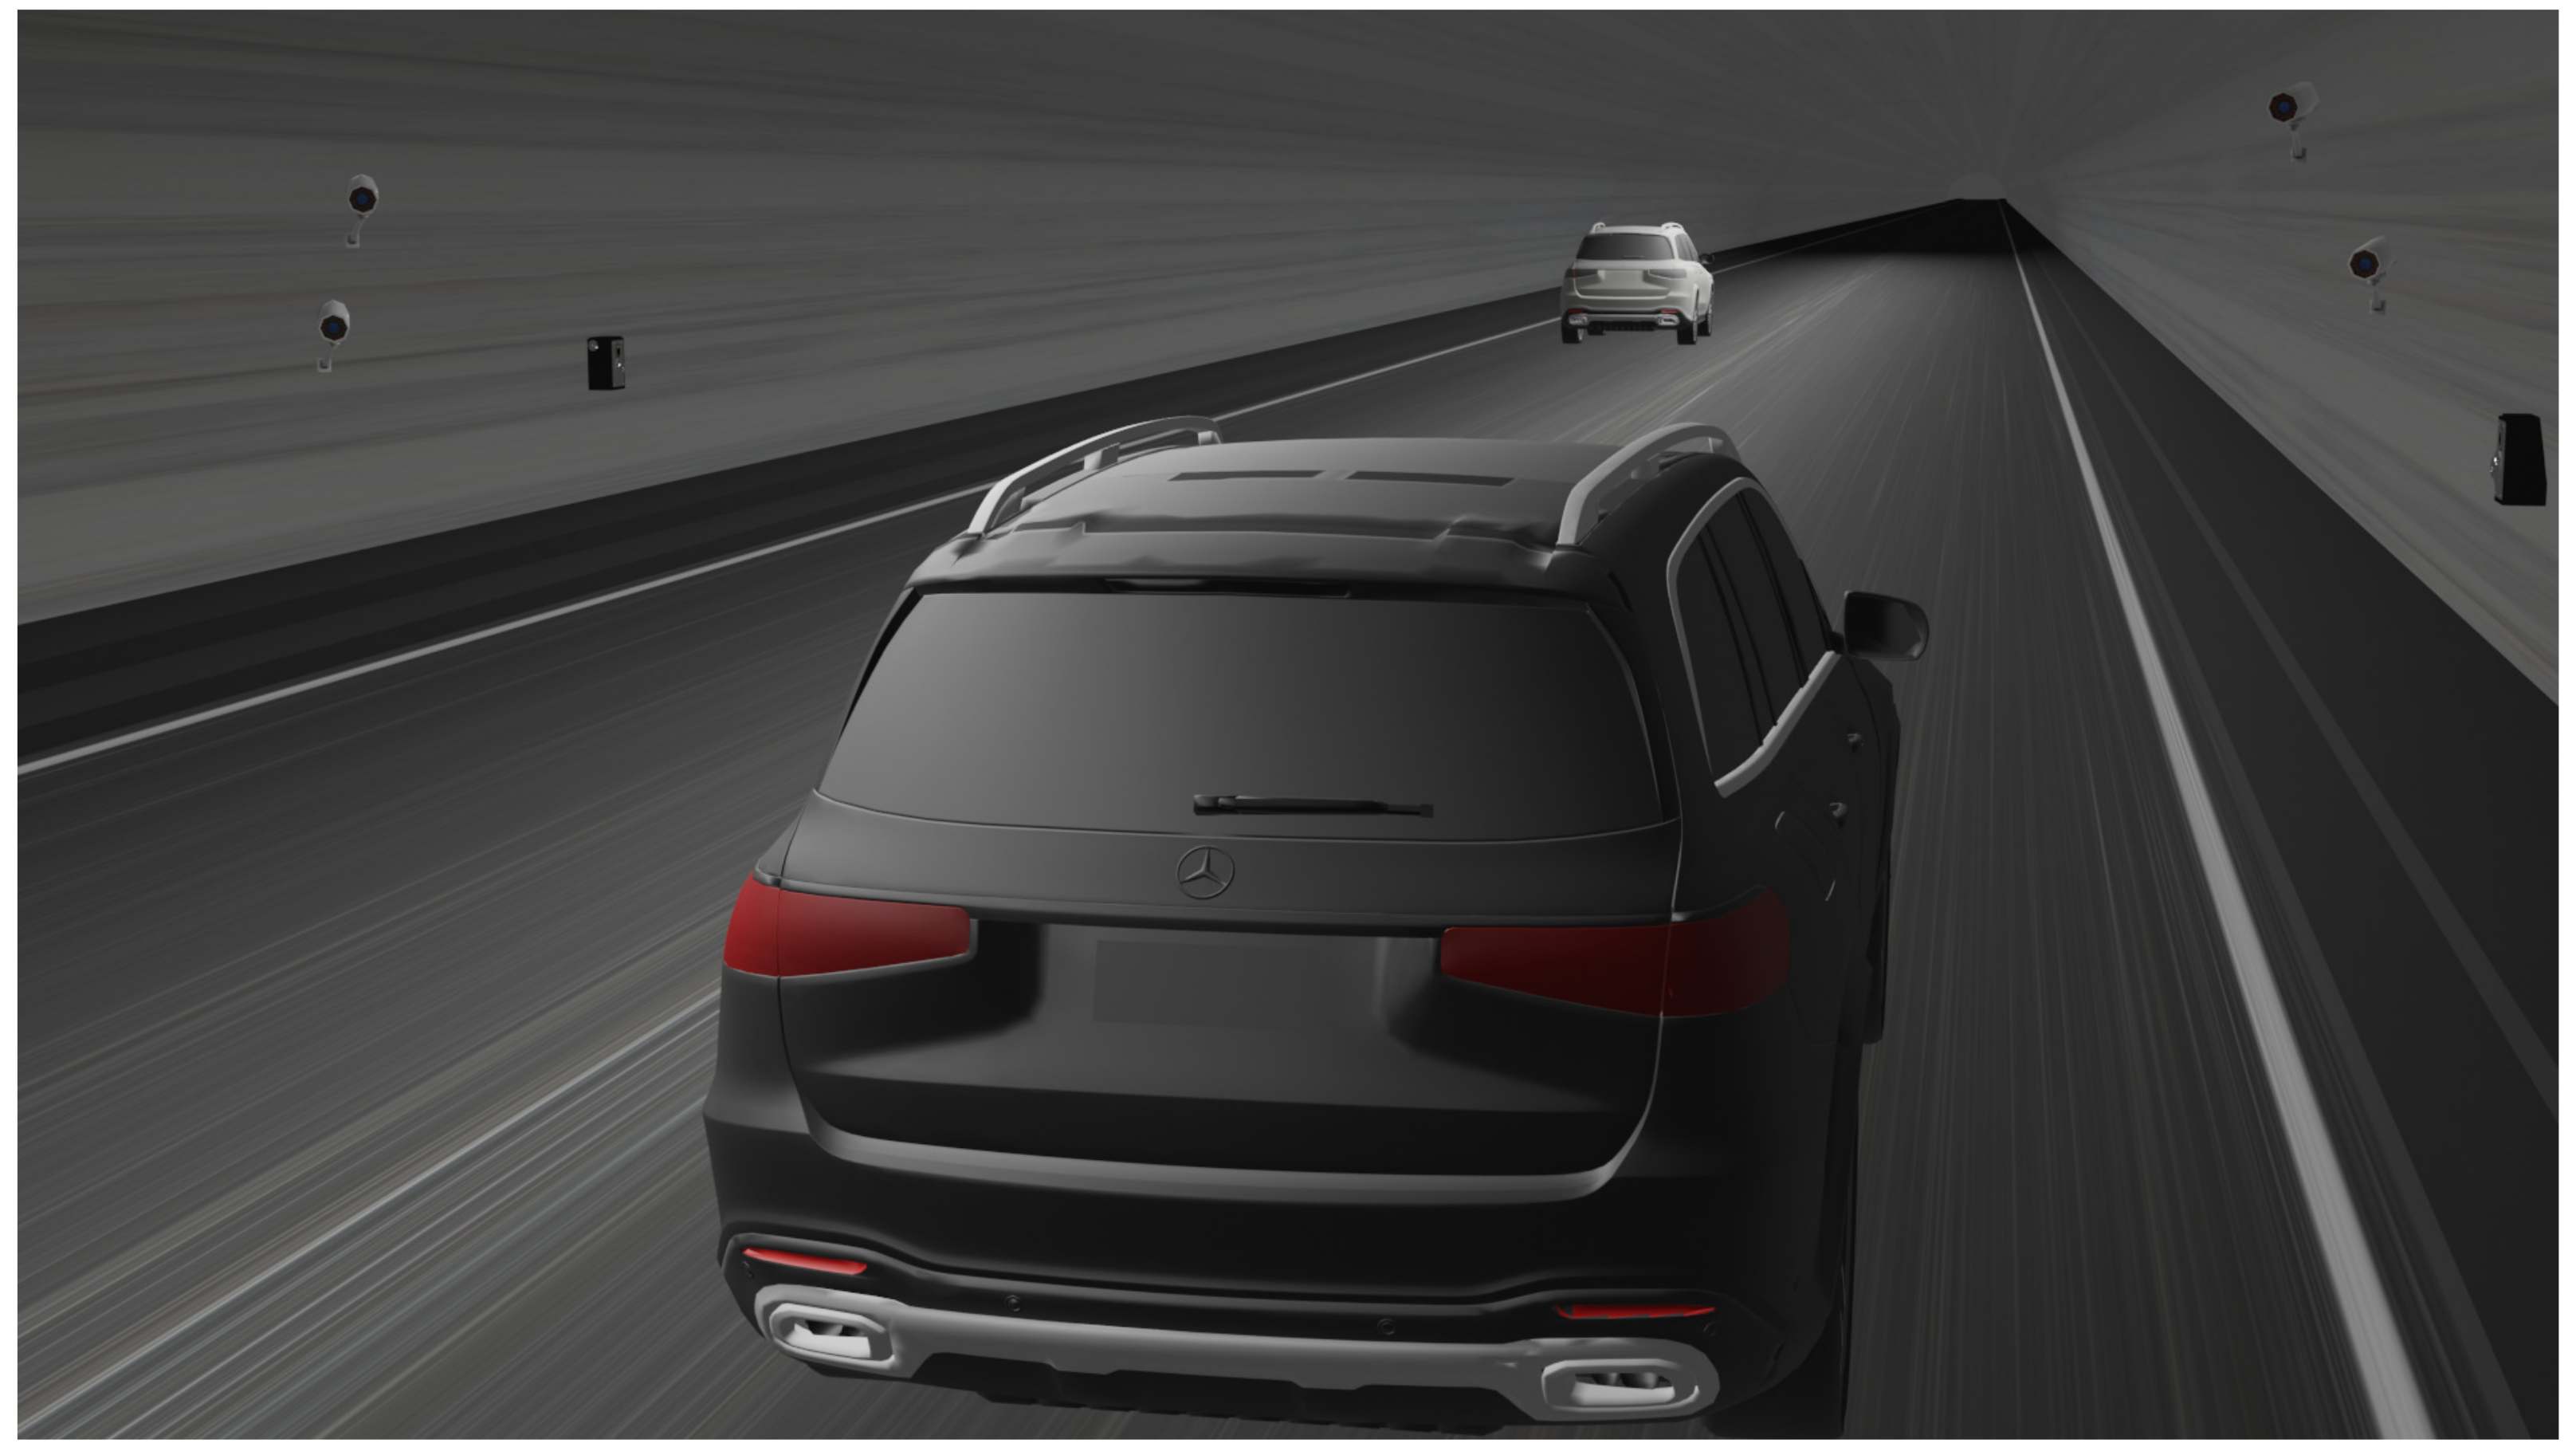
Proposed system is mainly designed to be used in road tunnels. Camera placement must be chosen carefully to mitigate effects of weather and lightning. Appropriate placement is inside tunnel about 30 m or more depending on tunnel shape and position behind entrance to reduce or fully remove effects of bright light from sun, rain or fog. Same goes for the exit; best place to attach cameras is still in the tunnel and not outside, where lightning conditions change rapidly. Two IP cameras are used to reduce blind spots, see
Figure 1. Placement of thermal cameras is chosen for passenger cars; in case of trucks or tall buses, it is required to place another cameras and sensors.
For our future work, an experiment might be demonstrated with multiple cameras in multiple heights to count for different types of vehicles—buses, trucks, minivans and passenger cars, supercars and motorcyclists are also very important but unlikely to get stuck in tunnel.
Acquired data sets are limited and not very accurate, as we originally planned. Because of restrictions in people meeting, we could not man all passenger seats to achieve manifold data set ranging from 0 to 5 passengers in cars. Our data set ranges from 0 to 3 passengers in a car with different lighting conditions, passenger position, car high beams and more. In future work, we have to collect more images to guarantee best data set possible with higher variety of passengers.
2.1. Data Set for Haar Cascades
During our image capture session with TPH3008-S, we obtained 47 negative pictures, 61 positive pictures and 13 videos, where we extracted 1263 cropped passenger silhouettes for out training based on Haar cascades with detailed description in [
29]. In this case, we decided to expand our data artificially. We apply random magnification, panning, rotation and brightness change to our data to increase the volume of data. Here, 2–3 new images were created from each original image. In total, we acquired 1263 positive images before expanding (3367 after) and 1415 negative images before expanding (3188 after).
For training, we used parameters such as number of stages 20, number of threads 16, minimum hit rate 0.995, and maximum false alarm rate 0.5. We trained this cascade on a processor AMD Ryzen 7 3700X. It took over 5 h of training on all 8 cores (16 threads).
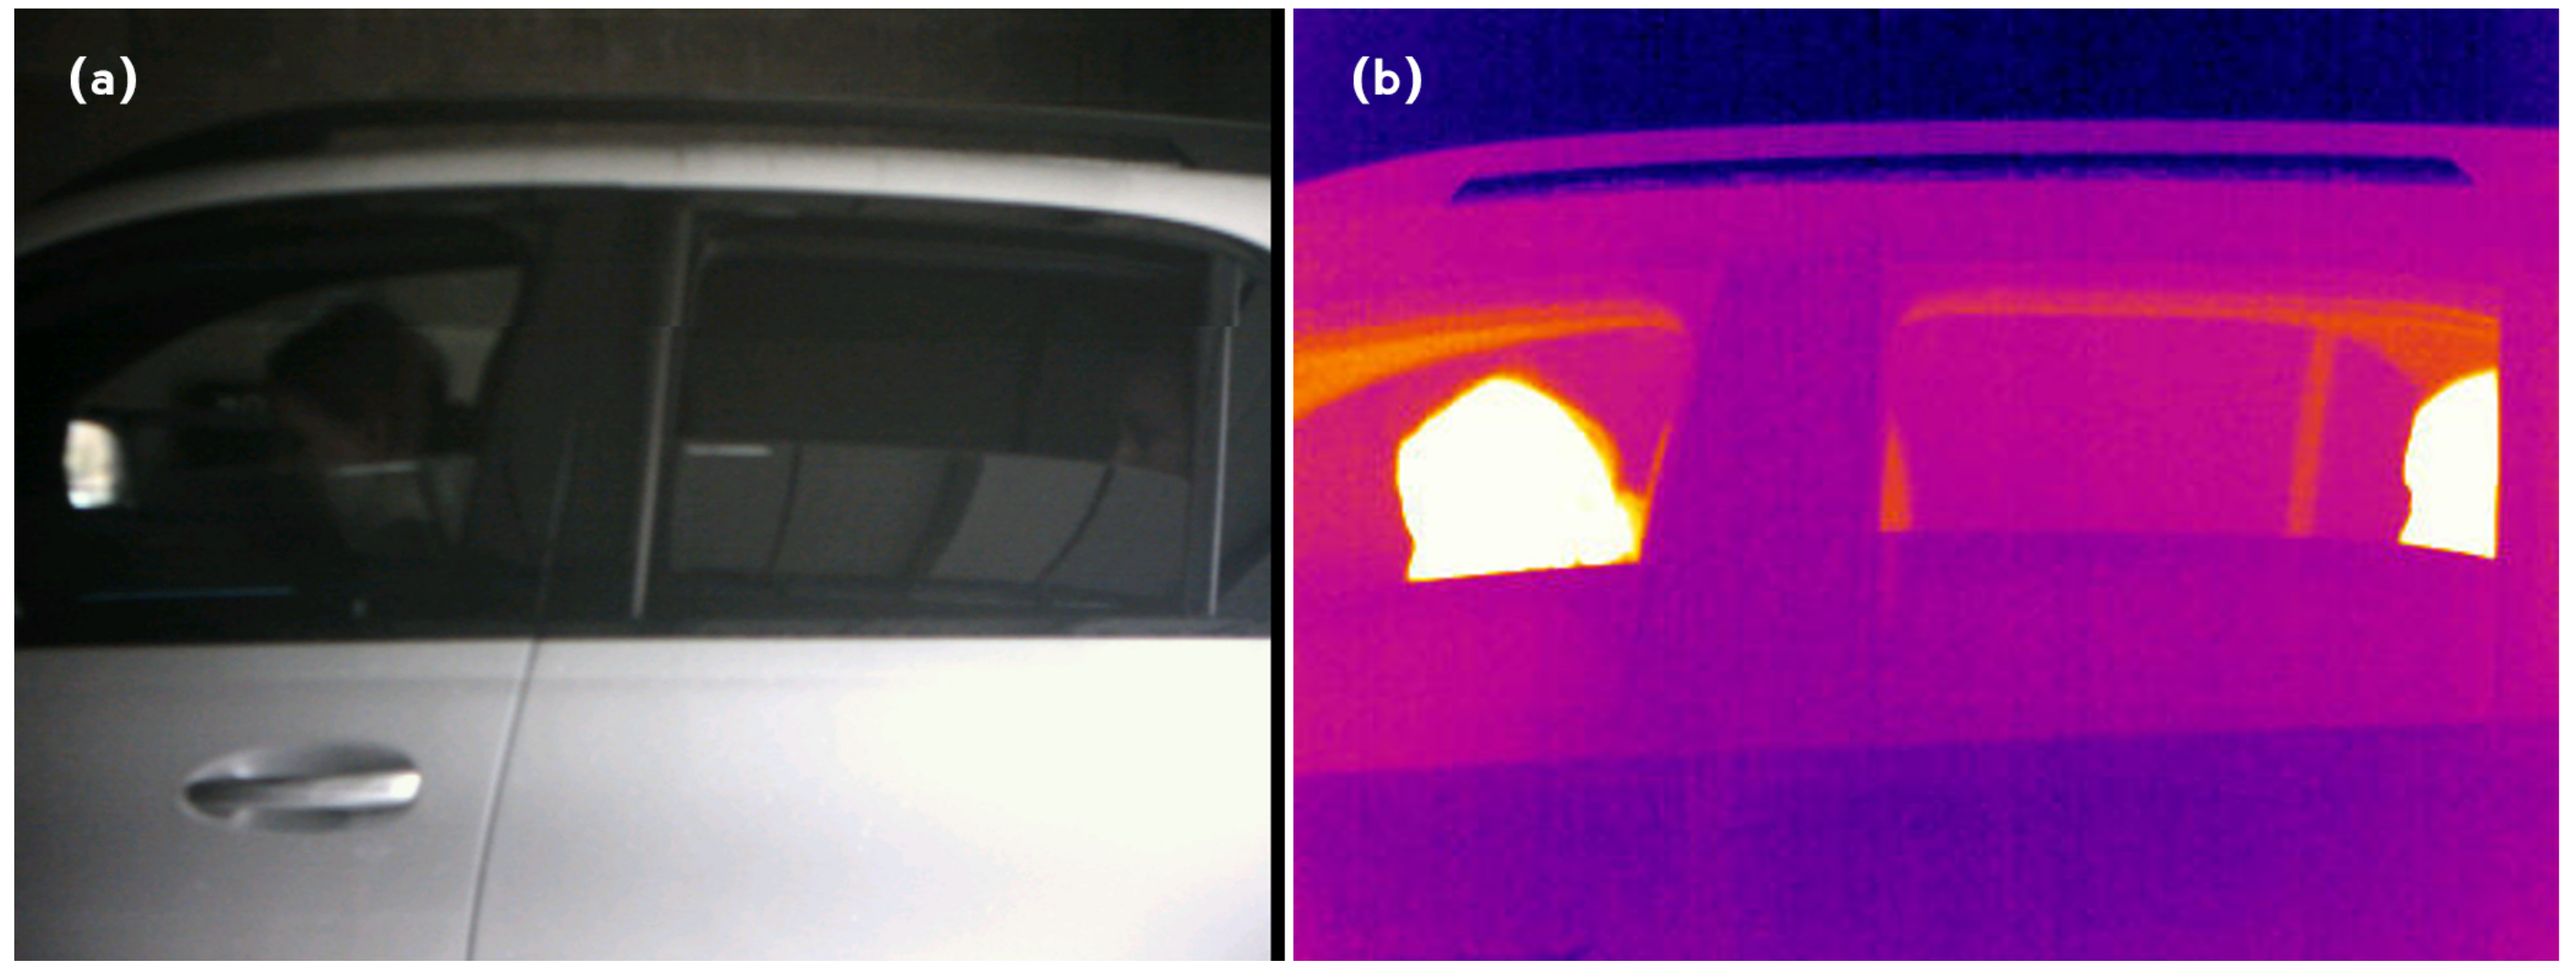
As we can see from the
Figure 2, the use of a thermal imager has one very fundamental problem: it cannot “see” through the glass (windows are half down, and we can observe only half of the head energy being properly detected). Scanning the occupants from the side view of the vehicle with the windows open is the only usable approach using this thermal imager. The front view is unusable, as the thermal imager cannot capture the energy radiated by the passenger.
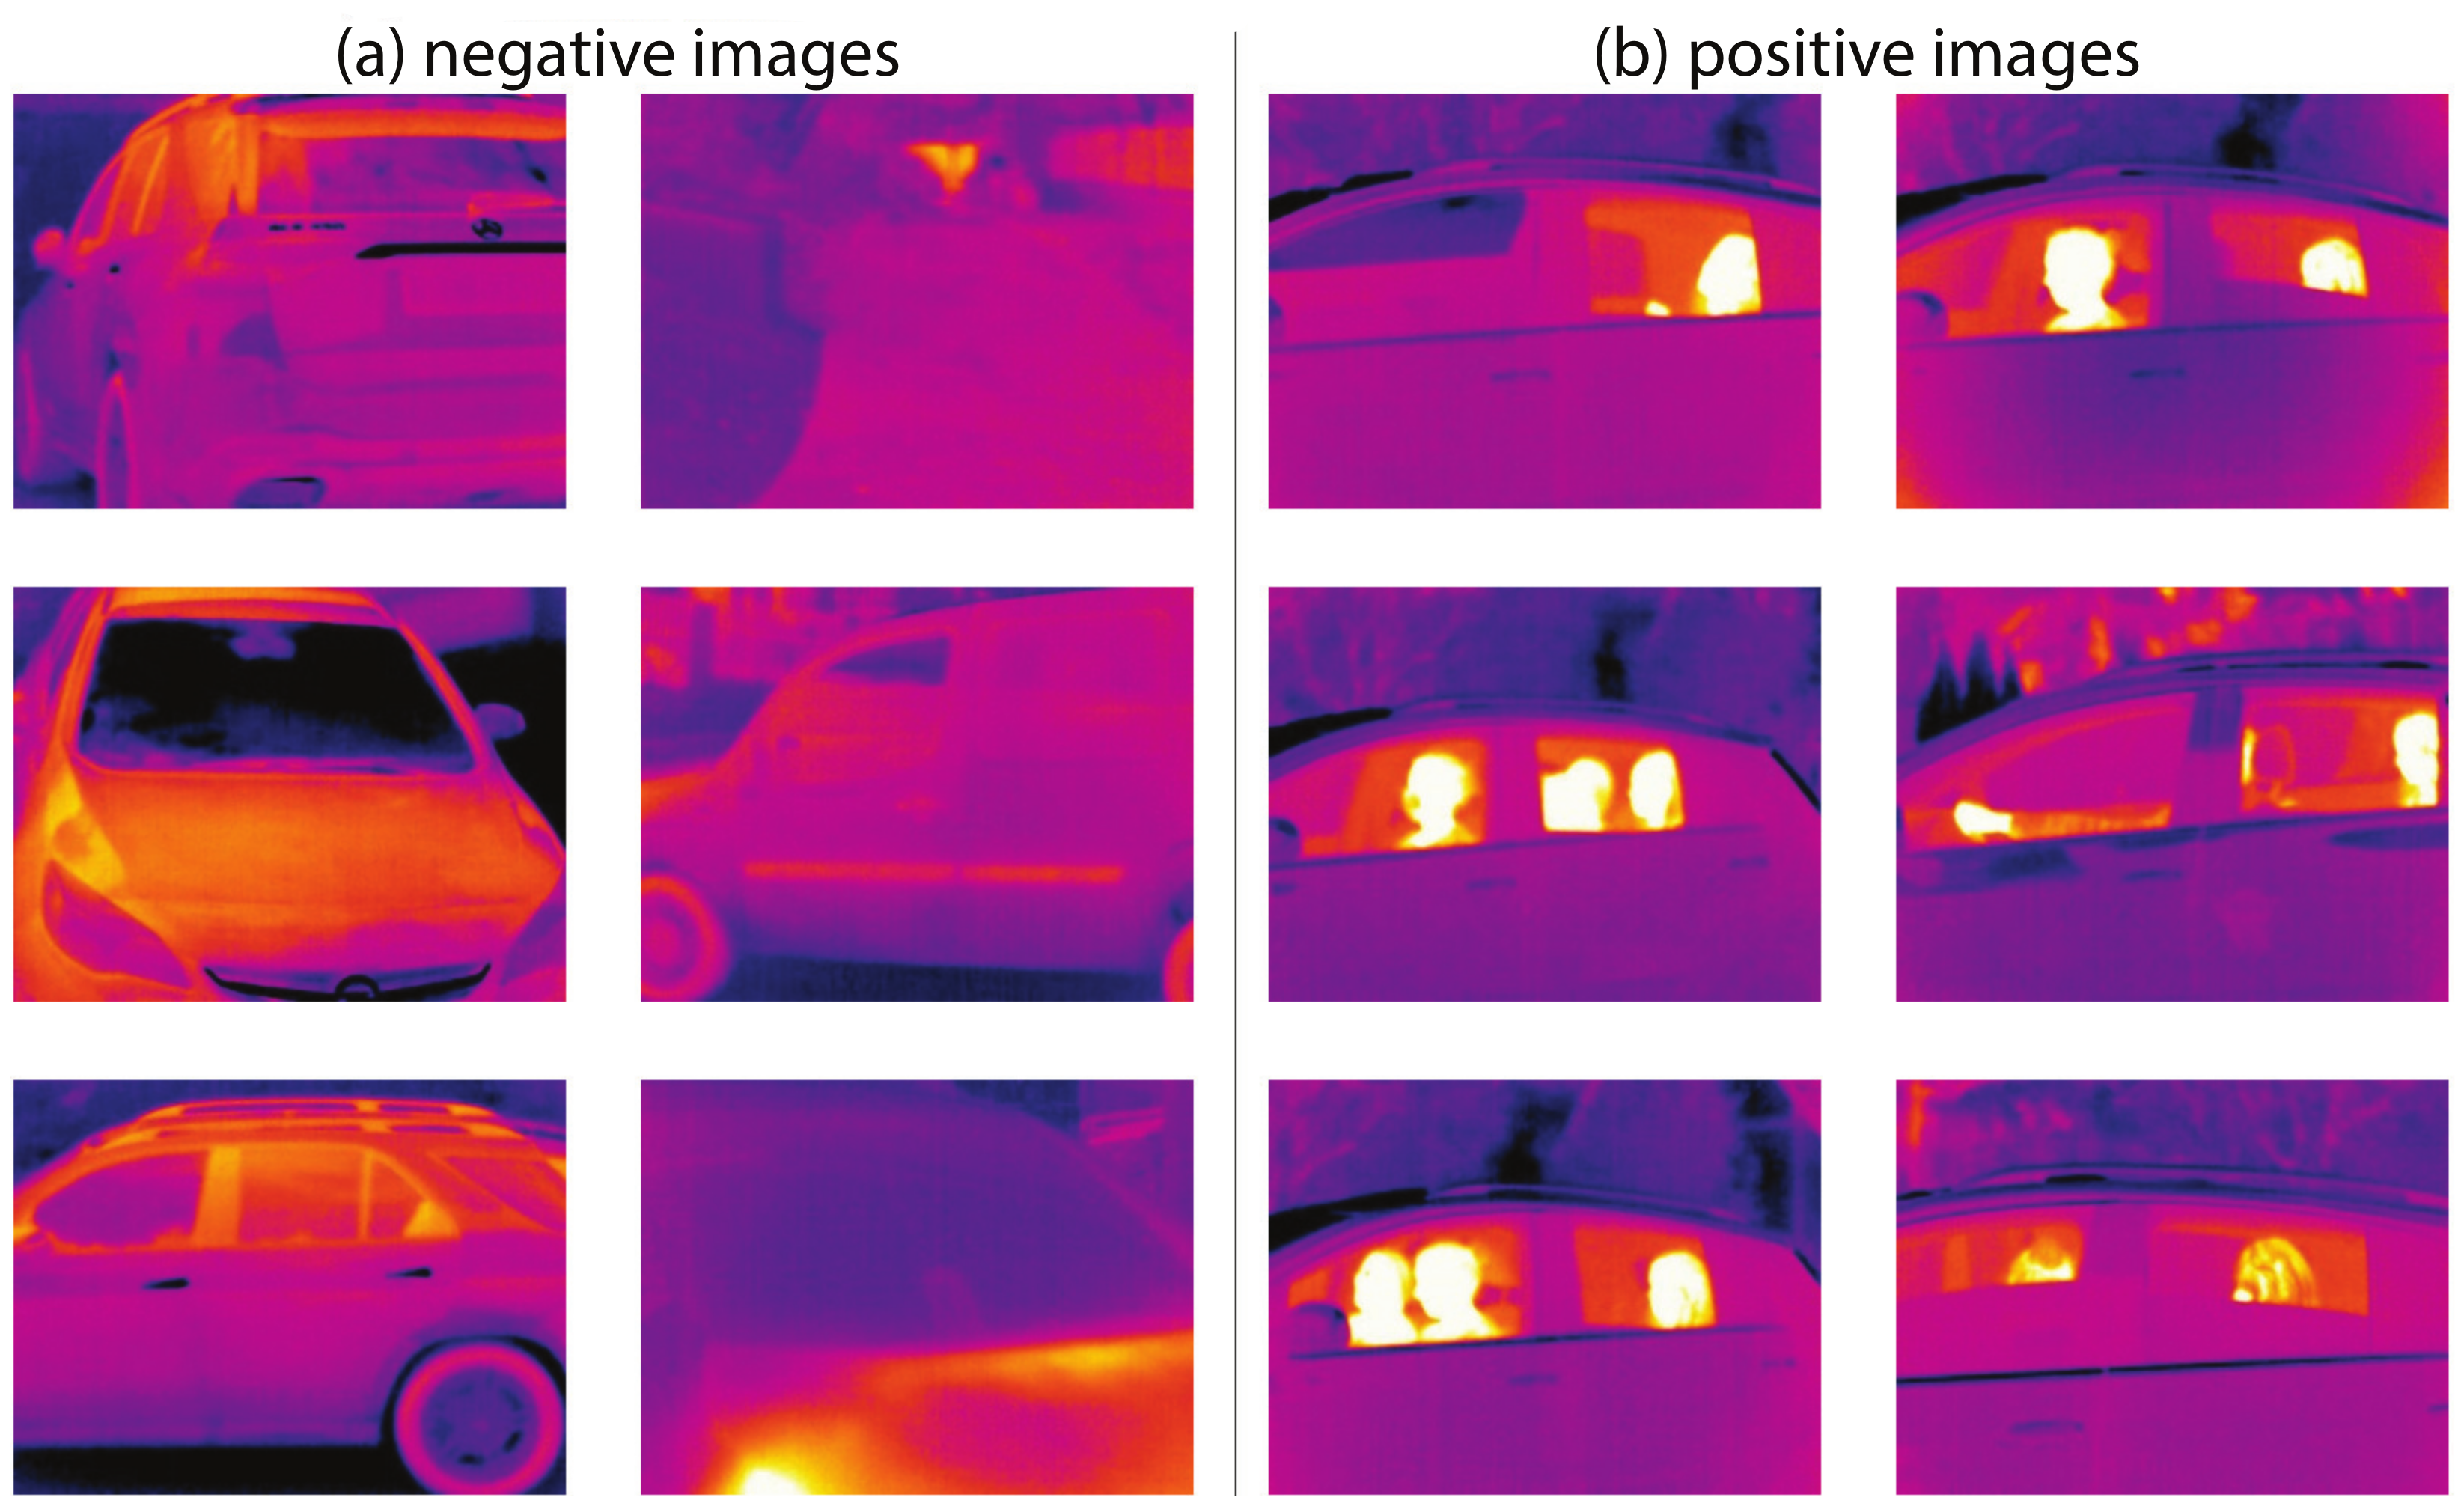
For training our Haar cascade, we used Cascade trainer GUI. It is an easy tool used for training and testing cascade classifiers from images or videos. Later, we used created cascade in OpenCV with Python in PyCharm environment to create program for testing our model and later for detecting number of passengers. Sample images used for training are shown in
Figure 3.
2.2. YOLOv3
The abbreviation YOLO is well known in the artificial intelligence community. It comes from the English phrase “you only look once”. It is considered to be one of the fastest algorithms for object detection. However, this is not accompanied by the highest accuracy, but it is a good compromise for applications requiring real-time data processing [
30].
Theoretical Framework
Here, we mainly explain the theoretical framework of the occupancy detection in this article using YOLOv3 convolutional network [
31,
32].
Abbreviation YOLO stands for “you only look once”. This is object detection algorithm based on features learned by a deep convolutional network. YOLO is considered fully convolutional network (FCN) with 75 convolutional layers with skip connections and upsampling layers. Prediction is performed using a convolutional layer based on 1 × 1 convolutions; for detecting small objects, final convolution is 255 × 1 × 1 with batch size ; for medium objects batch size is ; and for big objects batch size is . Output is a feature map, and the size of prediction map is exactly the size of feature map before. This prediction map is interpreted the way that each cell can predict a fixed number of bounding boxes.
YOLO has entries in the feature map, where B is number of bounding boxes each cell can predict, C represents class confidences for each bounding box. Each bounding box can have attributes that describe dimensions , center coordinates , objectness score and confidence C.
2.3. Making Predictions
Network output can be presented with following formulas:
where
,
,
,
are the
center coordinates, width and height of prediction;
,
,
is network output;
,
are top-left coordinates of the grid;
,
are anchors dimensions for the box; and
represents sigmoid function.
2.4. YOLO Loss Function
The loss function indicates performance of the model. YOLO loss function is defined as equation:
where
is objectness-confidence score of whether there is object or not;
is classification loss;
is width and height of anchor box;
is location of the center of the anchor box;
and
are masks for each cell that predicts an object in a cell it there is or is not;
are constants;
represents the weight of the coordinate error; and
represents scalar to weight loss in confidence in each bounding box.
represents part, where we compute losses for each of 13 × 13 cells and
represents part where we compute losses for each anchor box.
represents confidence score of the
j th bounding box in grid. In YOLOv3, there are used 3 boxes across 3 different scales.
2.5. Yolo Data Set
To train the model based on YOLOv3, we created a data set consisting of captured images in different camera positions and the state of the environment. In the LabelImg tool, we marked the people in the vehicle in about 600 pictures in total, and we split our data set and saved about 100 images for testing.
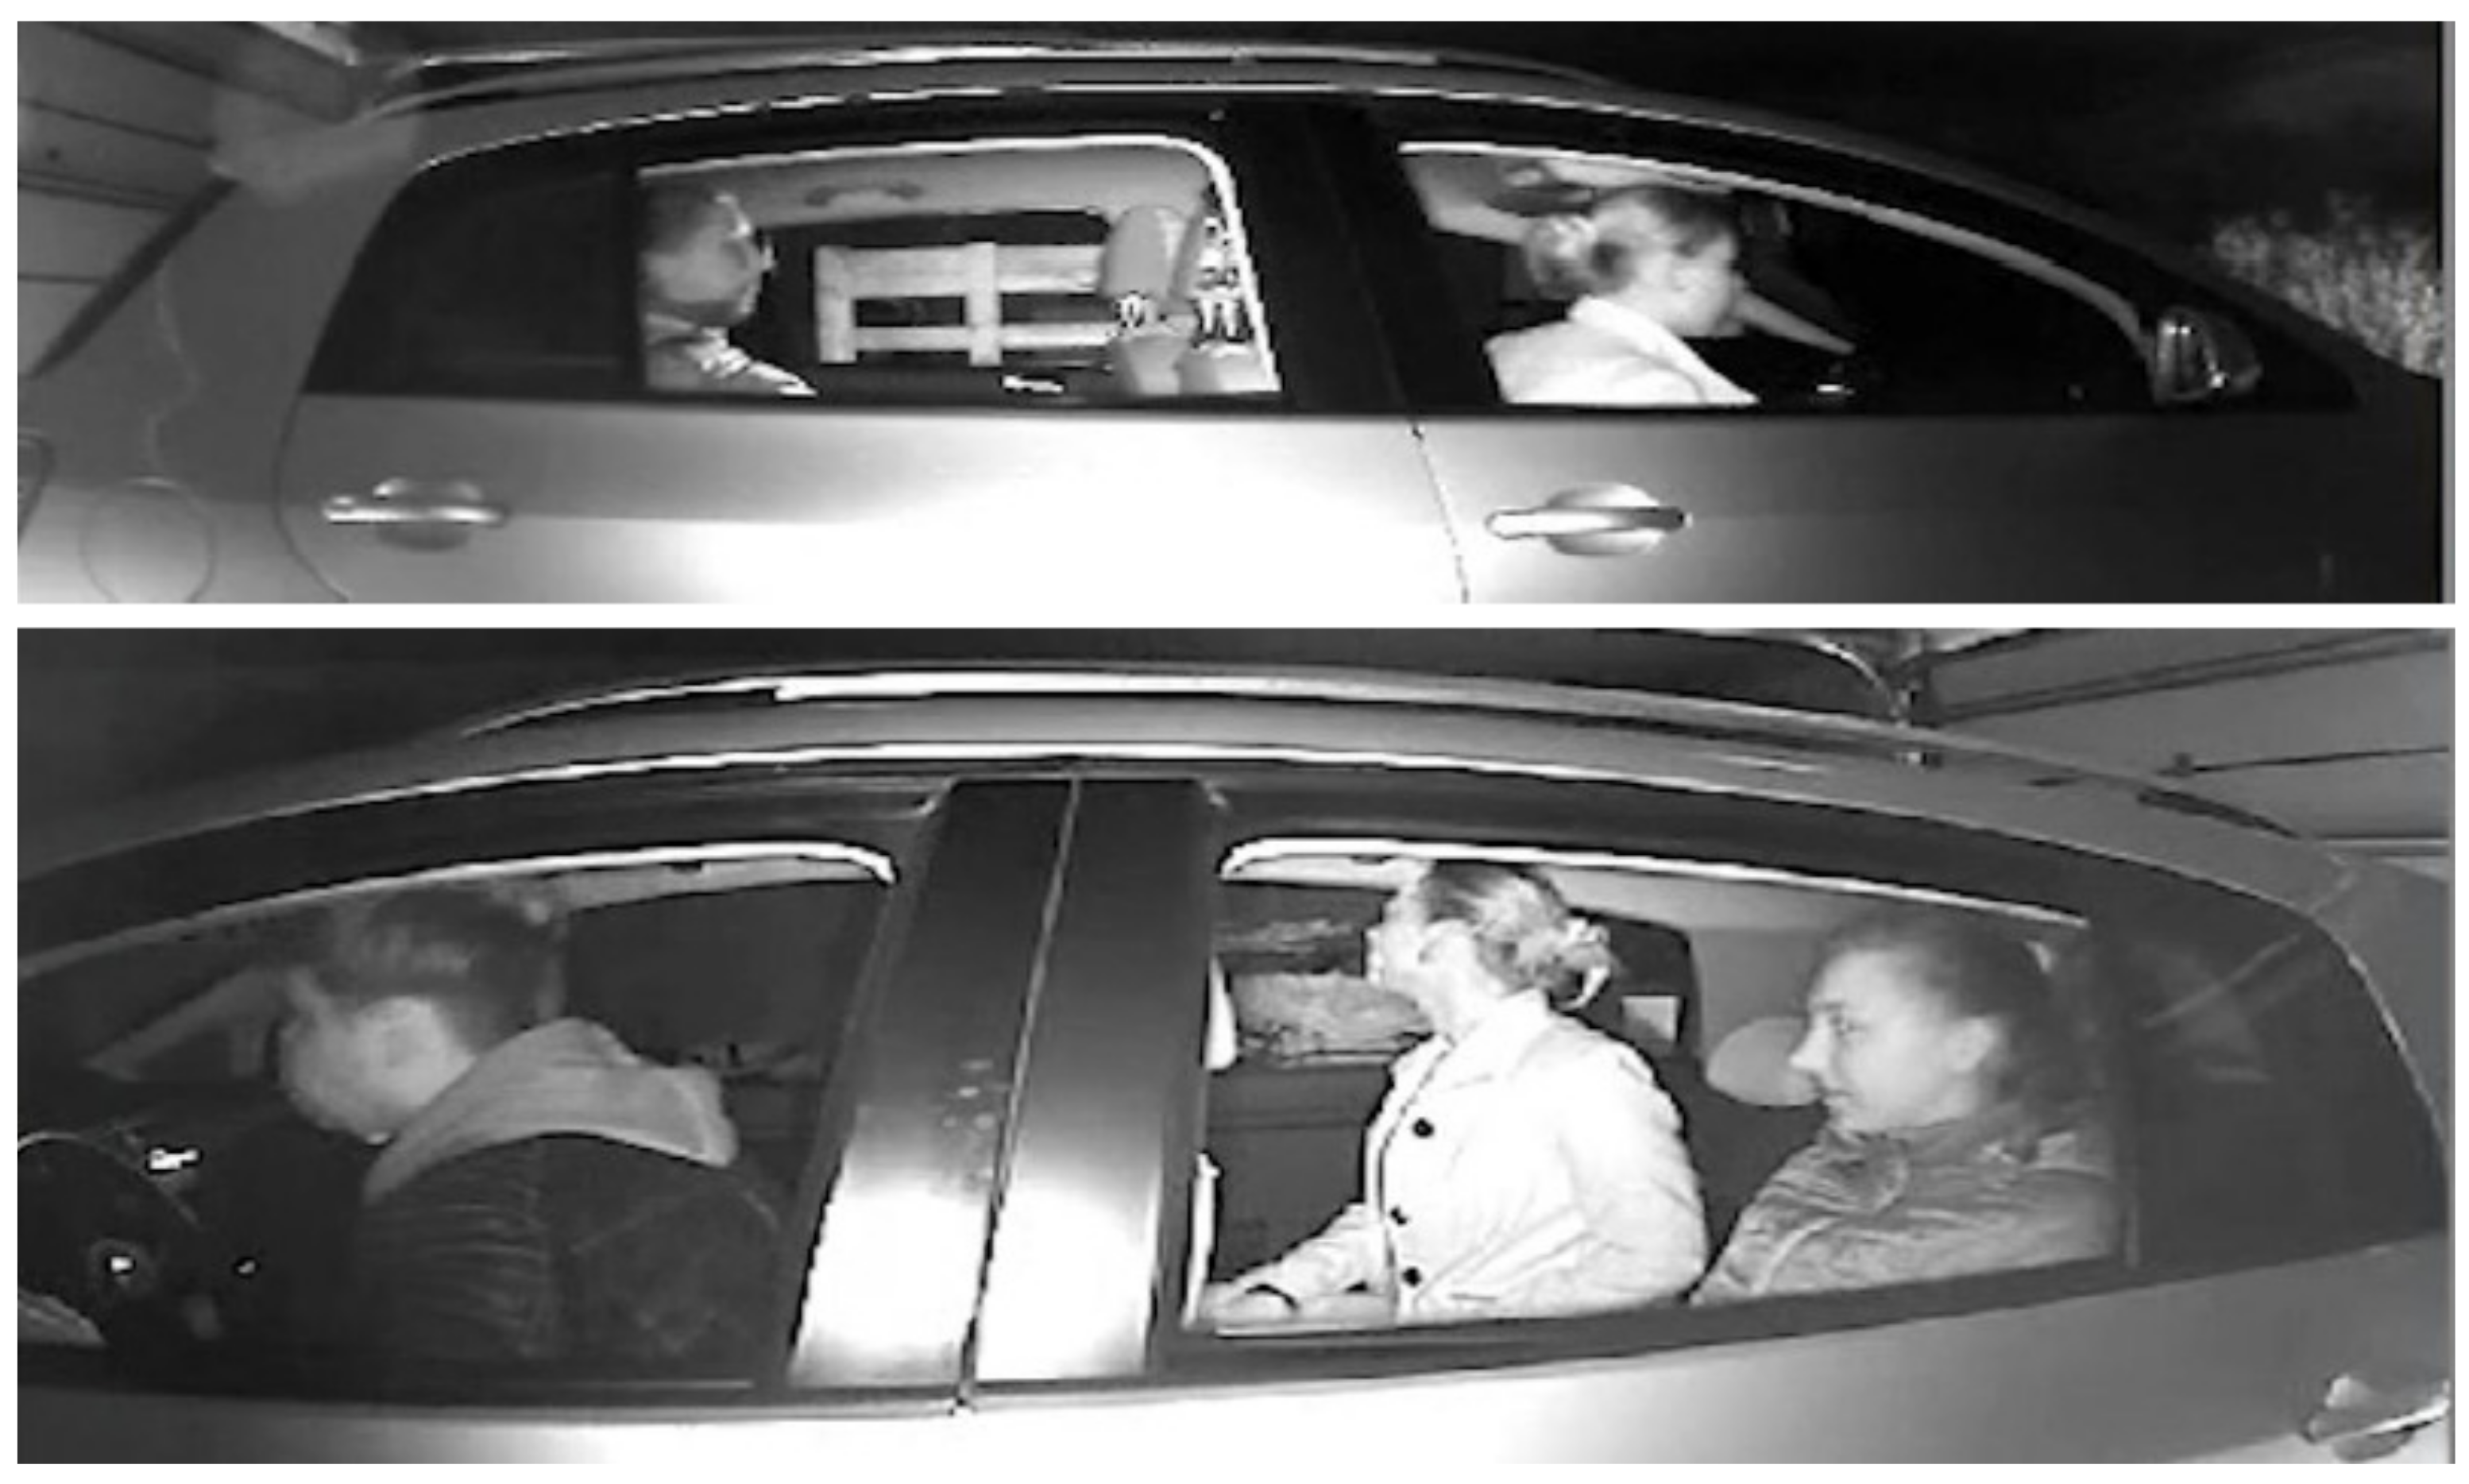
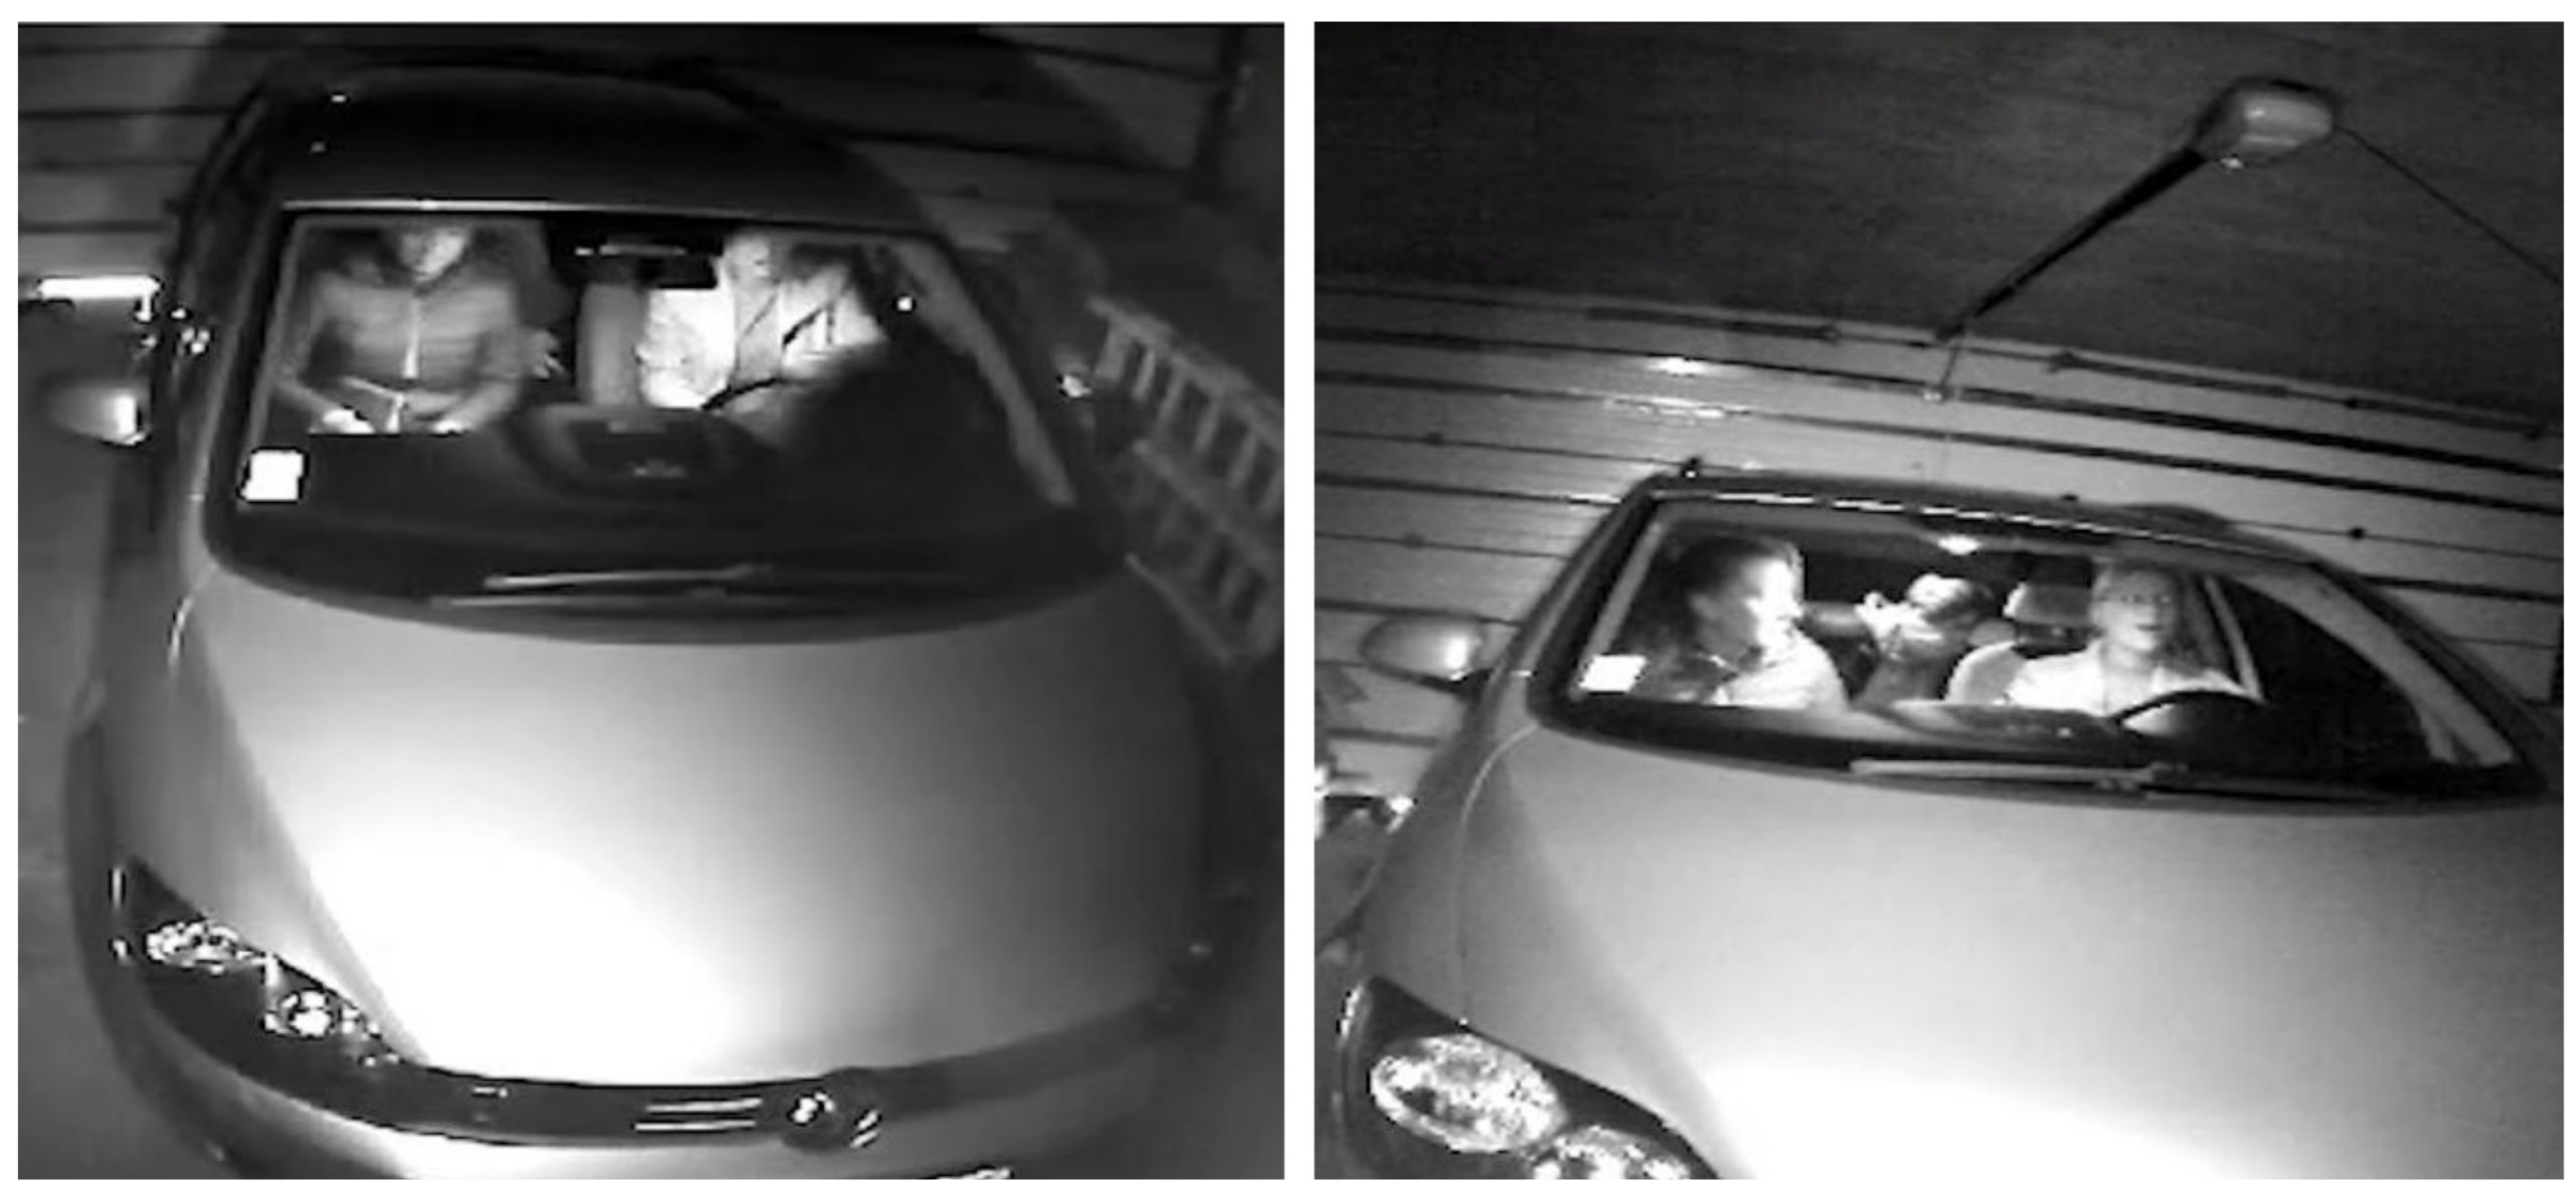
Images were captured with variety of scenarios. With the use of interior lighting, windows down and up, turned high beams on to simulate forced blinding of the cameras and many others. Example of captured images are shown in
Figure 4 and
Figure 5.
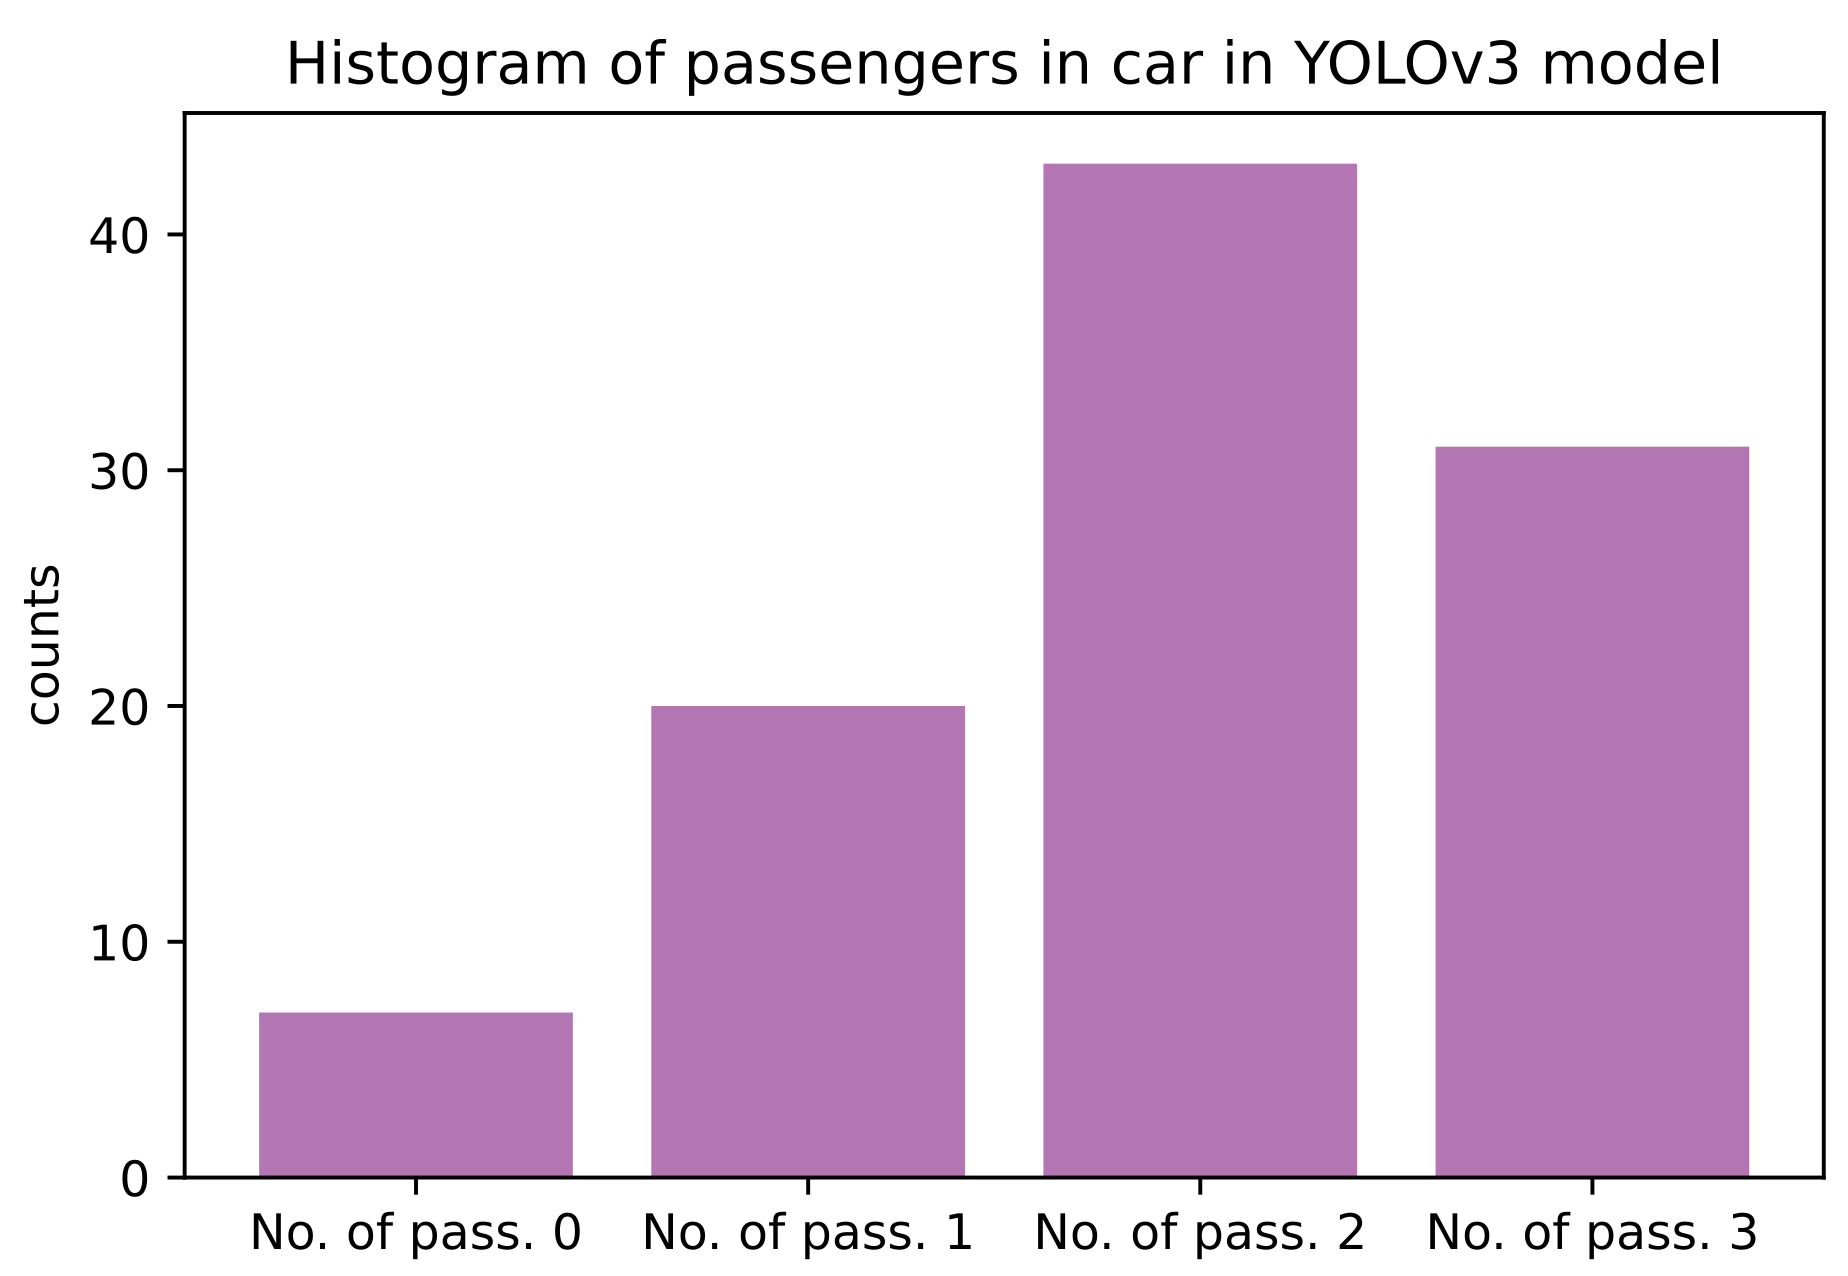
For training our model, we decided to use Google Colab with Nvidia Tesla T4 graphics card based on 12 nm chip. Training our model took more than 9 h. Histogram of testing set is in
Figure 6.
3. Results
The neural-network-based passenger detection tool has one huge advantage over the Haar cascade-based tool—it can detect passengers even if the car’s windows are closed or the car is facing the camera directly due to the technical specifications of our thermal imager TPH3008-S. In the future work, we might combine both tools if we can precisely align and match images from regular camera and thermal imager.
To evaluate the success of the detection, we used 1 video without passengers, 4 videos with 2 passengers, and 1 video with 3 passengers as a test set. The passengers sat in different places, and the position of the windows also changed to check if we could detect people in the vehicle even with the windows not fully open. Since the available TPH3008-S thermal imager only allows us to take photos, we had to capture the videos with an external camera. Therefore, their quality is not at the highest level. It was also necessary to turn off the display indicators on the camera display. The total accuracy for the confusion matrix can be calculated as the average of the values lying on the main diagonal of the matrix:
When calculating the success of the detection of the number of passengers, we achieved the success of 60.52%. Out of the 1117 people in the images, model detected 676. The result is quite good, given the artifacts that are found when capturing images. Detailed results can be seen in
Table 1 and
Figure 7.
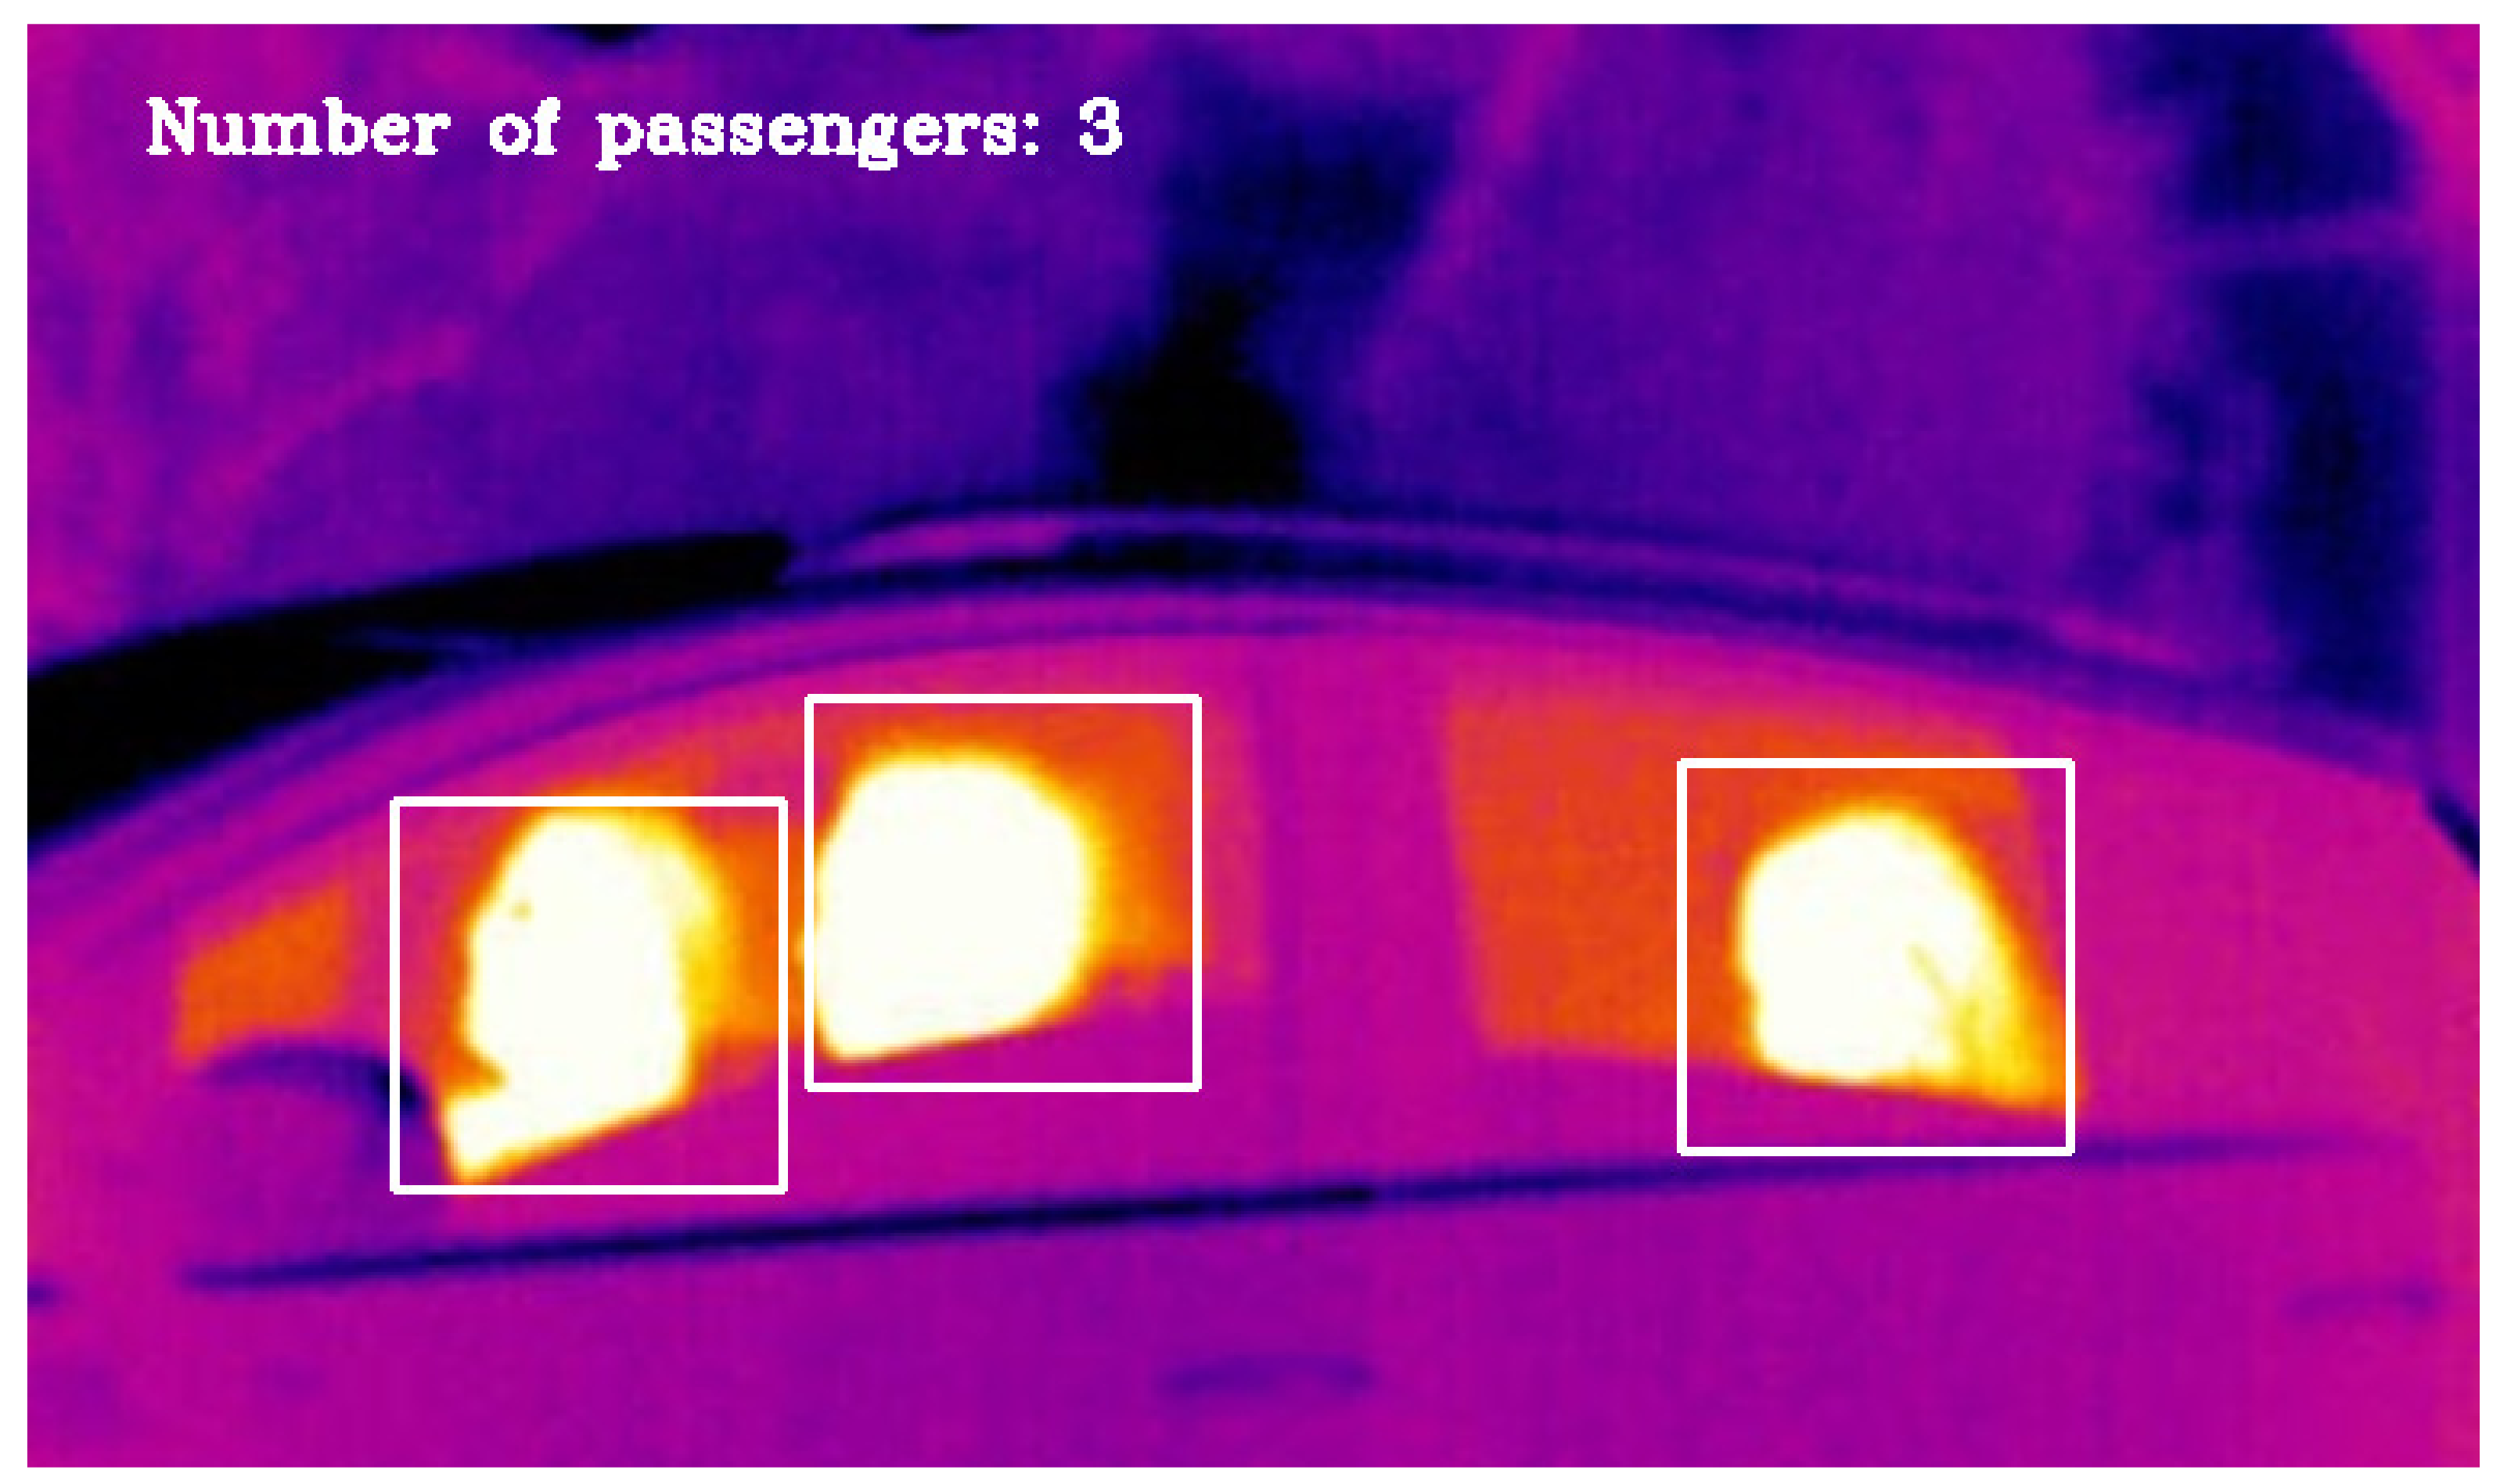
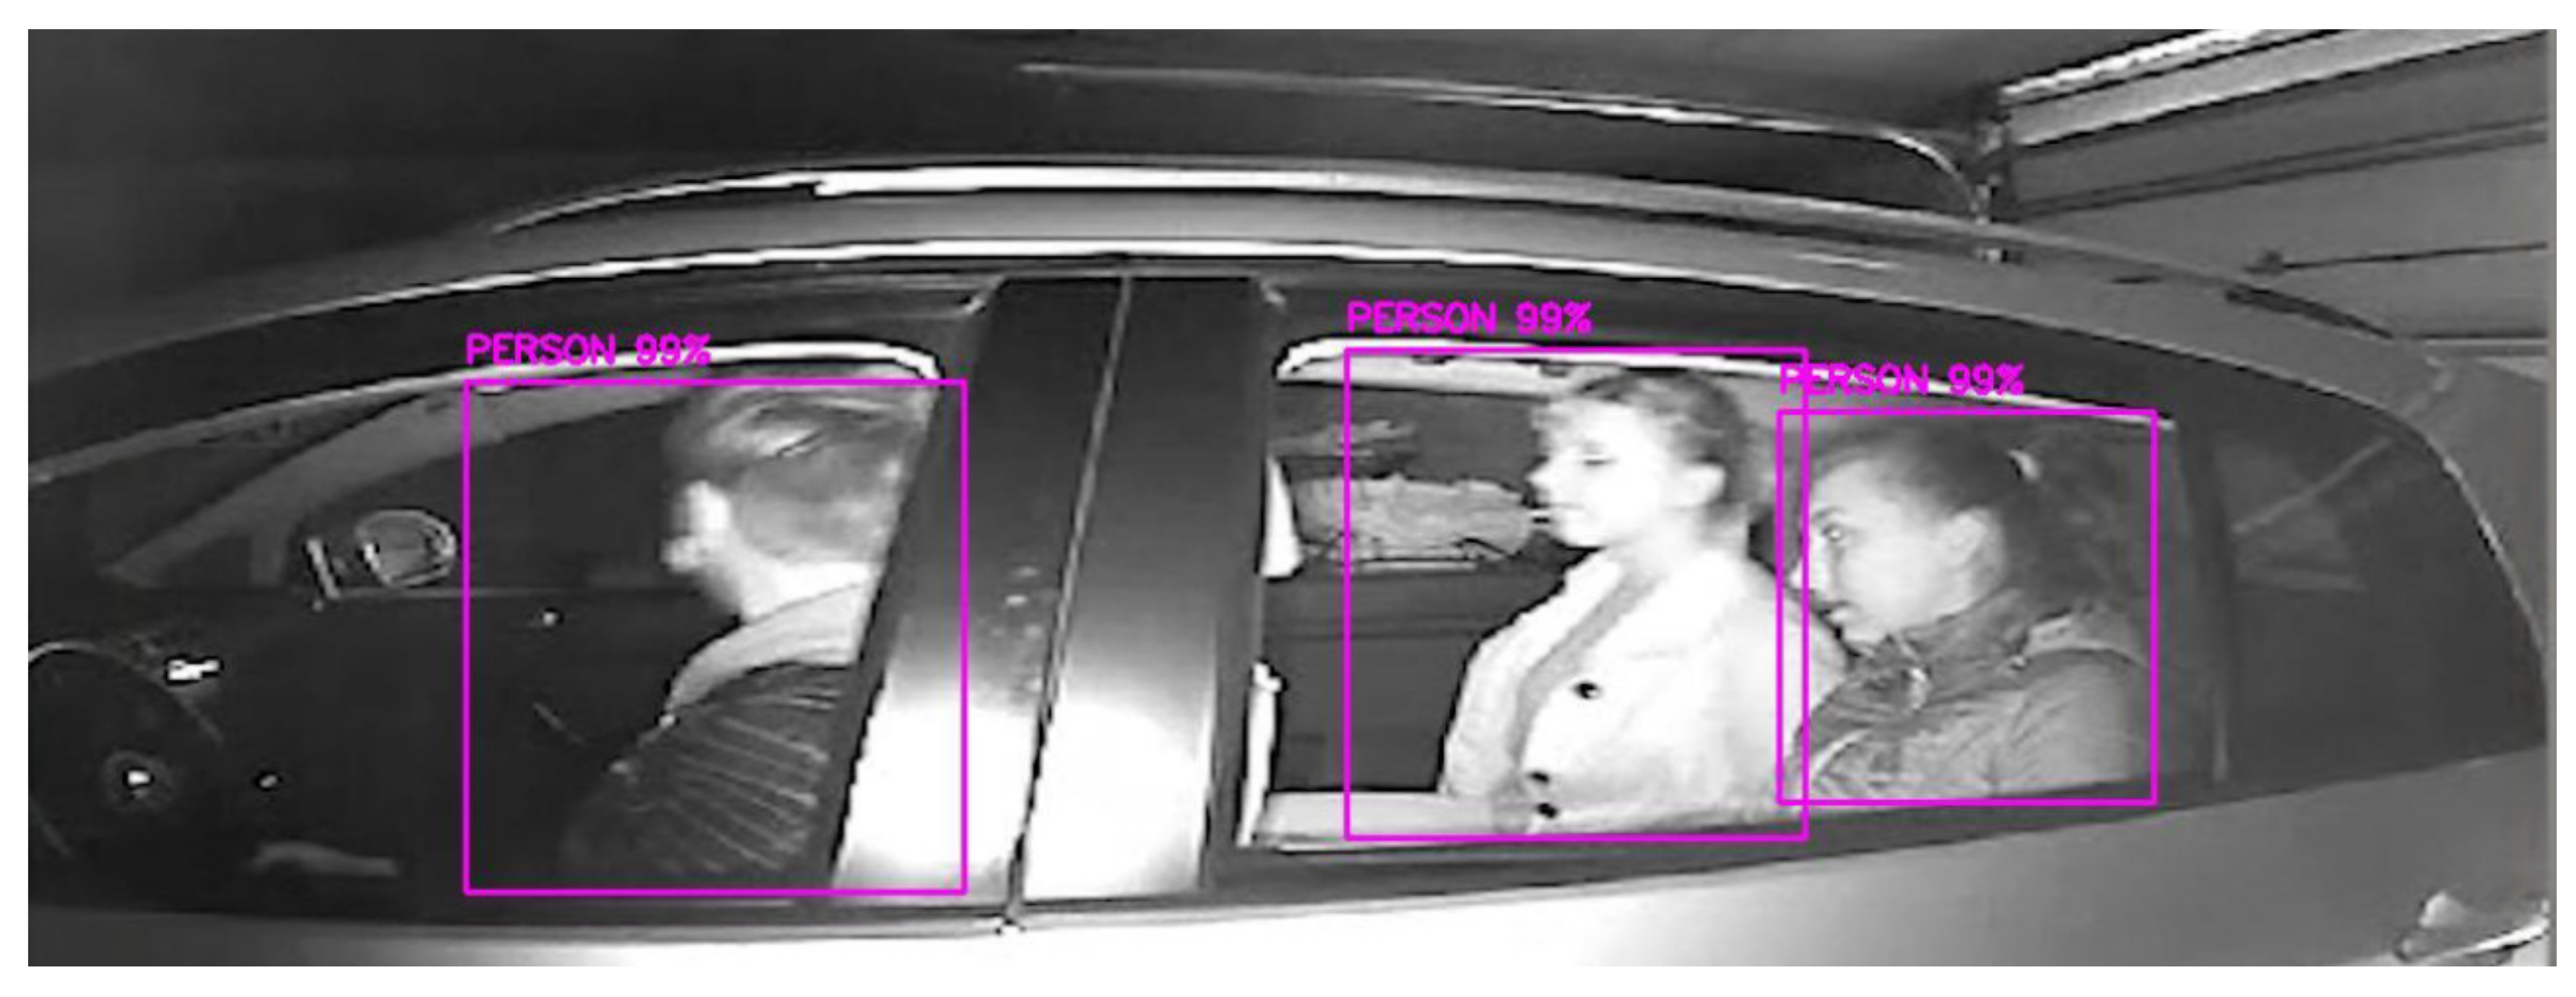
Figure 8 and
Figure 9 show detection results of created programs. Both programs allowed user to choose different parameters and data sources and were used for evaluation process.
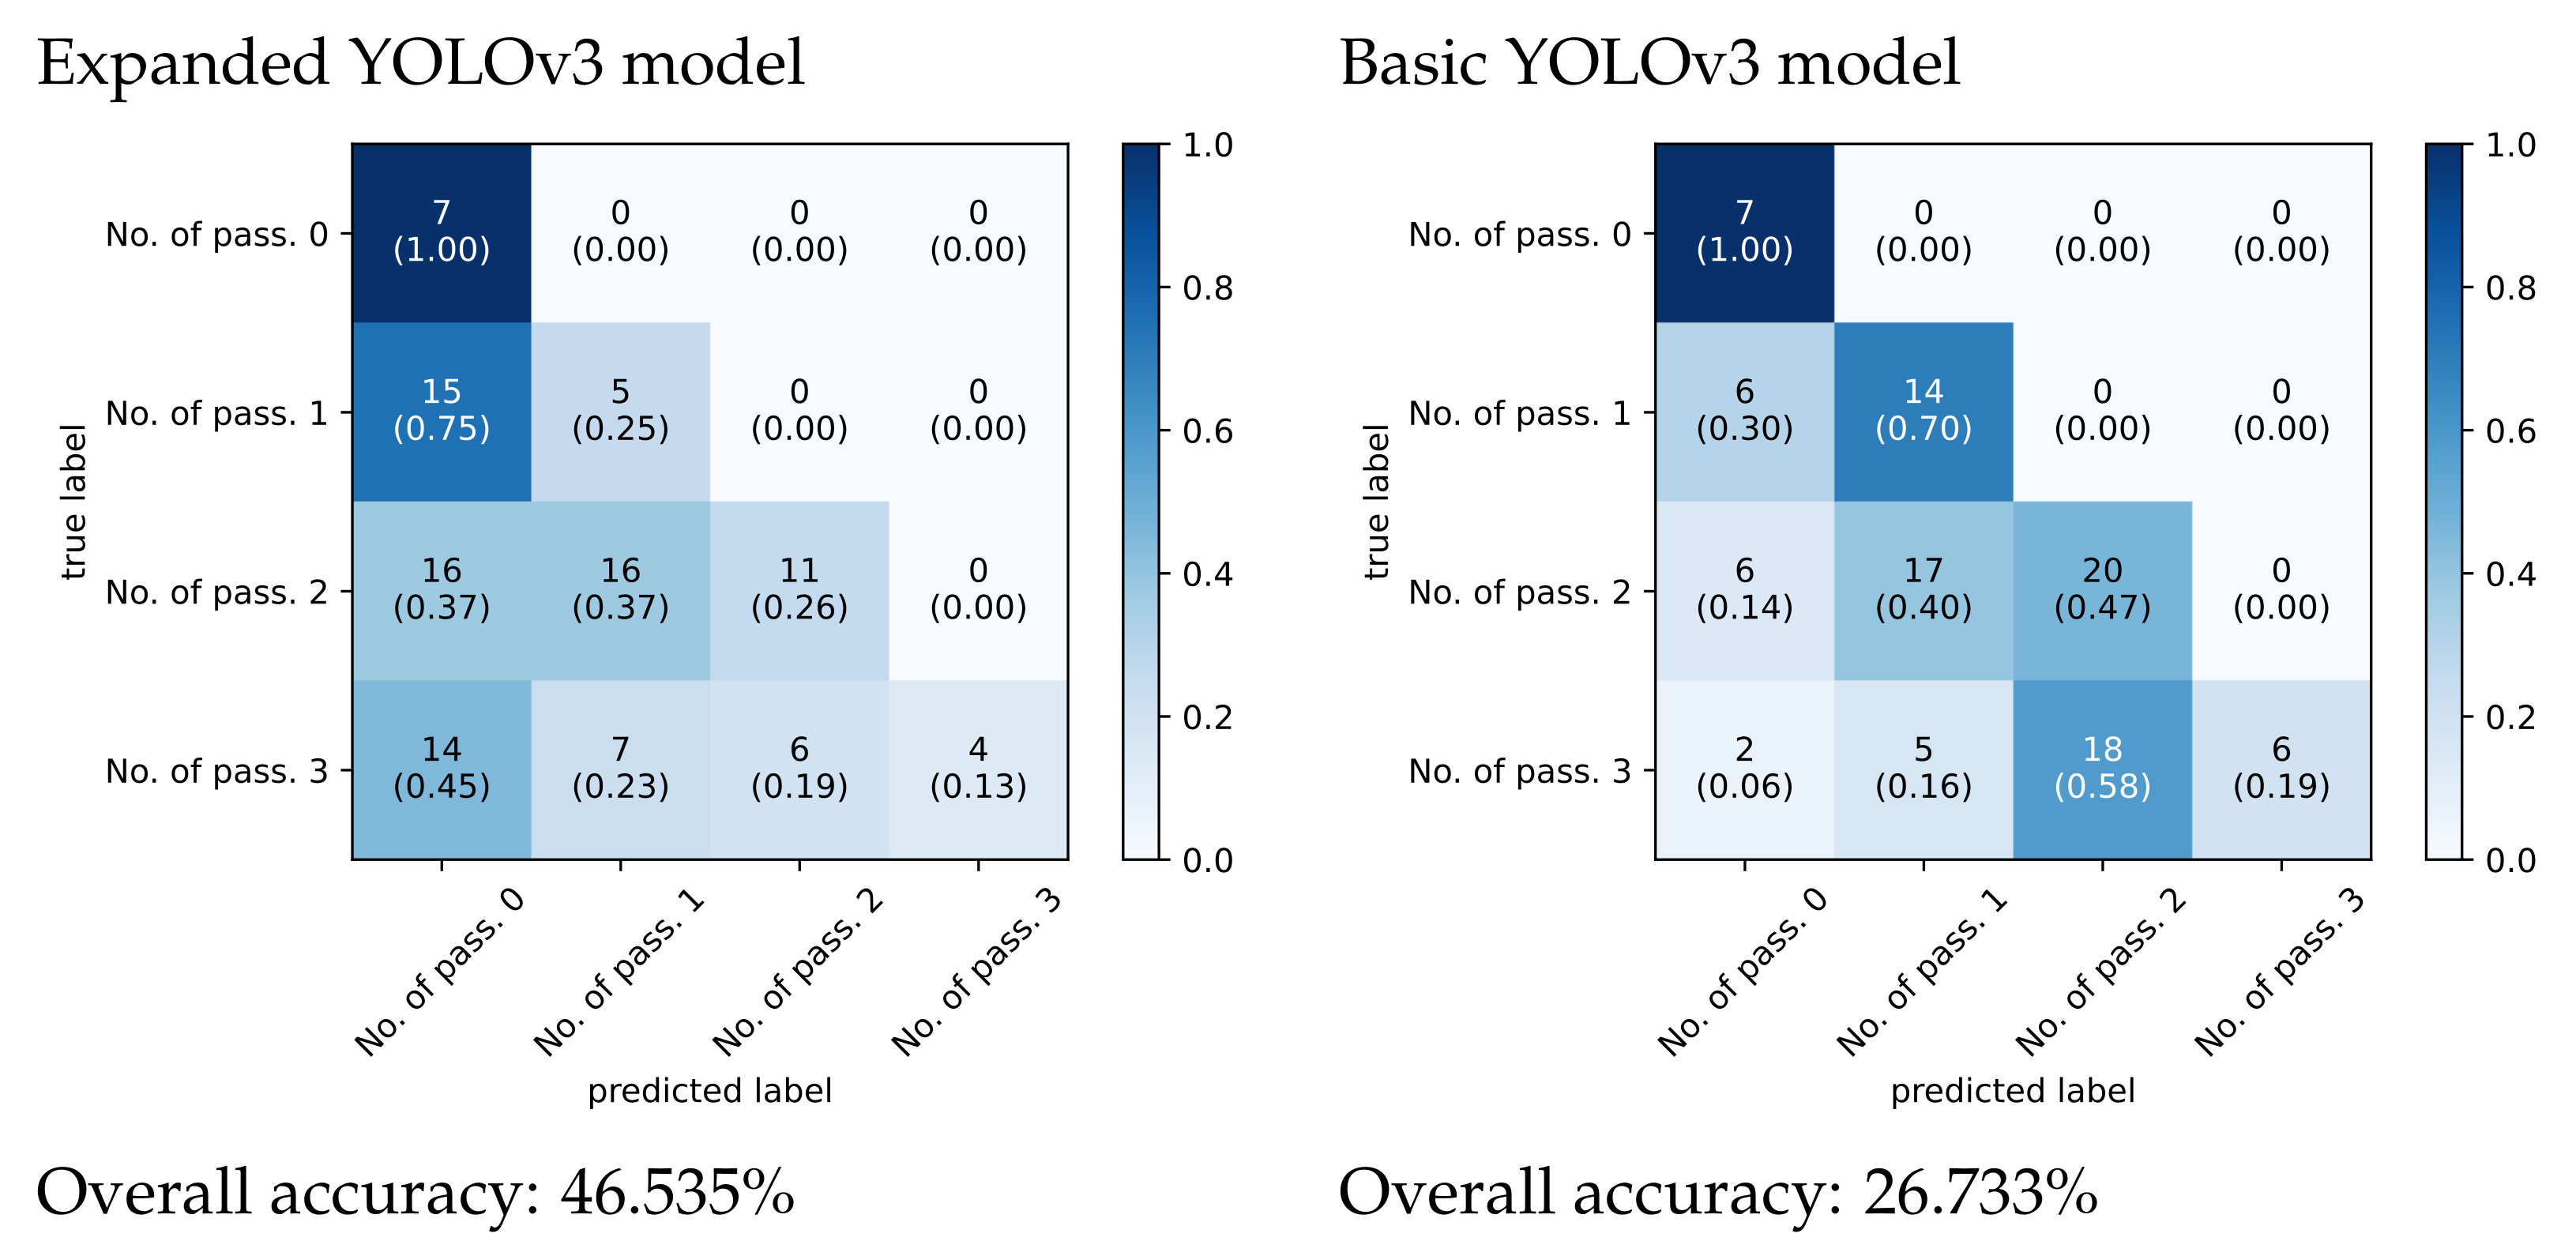
For the evaluation process of YOLOv3 model, we used the same metrics as in the previous model. We used 101 randomly selected images for testing. The total final ratio of images used for testing and training is approximately 1:5. As can be seen from the confusion matrix, both cases do not show false detection, i.e., an error of the first type. While detecting, models are set to search only for objects that have a probability of more than 50%.
The detection capability before starting this work was expected to be at least 50%, which means that we wanted to detect at least half of all passengers. However, when considering a different metric, we achieve a detection of 65.3%. This number represents the number of persons detected in the test images relative to the total number. Out of 199 persons, 130 were detected. In the case of the pretrained network, this is a ratio of 110 detected to 199 persons, which is 55.3%. Thus, from the point of view of passenger detection, this is a good final percentage. Basic confusion matrices can be seen in
Figure 10 and detailed evaluation using precision, recall, accuracy and F1 score are in
Table 2 and
Table 3.
When we compare
Table 2 and
Table 3, we find expanded YOLOv3 model achieves better performance in detecting passengers than unmodified, basic YOLOv3 model.
The neural-network-based passenger detection tool has one huge advantage over the Haar cascade-based tool—it can detect passengers even if the car’s windows are closed or the car is facing the camera. When comparing results between thermal image data set and neural network data set, we can say that by using expanded YOLOv3 model, we can achieve better passenger detection up to 10% when comparing between basic YOLOv3, up to 15% when comparing between Haar cascades and up to 65% when assuming windows on cars are closed and camera PTH-3008S cannot detect any passengers. Matrix evaluation of Haar cascades can be seen in
Appendix A in
Table A1,
Table A2,
Table A3,
Table A4,
Table A5 and
Table A6.
4. Limitations
Video detection using computer algorithms, machine learning and artificial intelligence has made great strides in recent years. However, it also has its pitfalls. The main limitations and shortcomings of computer vision are described in the following subsections.
4.1. Noise and Artifacts
The process of digitizing reality is almost always accompanied by inserting noise into the data. All cameras, even those on mobile phones, can create breathtaking images, and they improve every year. However, saturation, white balance, color intensity and all other parameters only help to capture reality as faithfully as possible. As mentioned in previous lines, the limiting elements include the artifacts we encountered in thermal imaging. These are image distortions that can be caused by a number of things, e.g., number of frames per second, lens flare, image compression itself and much more. There are algorithms that try to combat the artifacts, but this is an area that still requires a lot of effort. In our case, we cannot improve the output image when detecting with a thermal imager TPH3008-S. Therefore, it would be appropriate to try more types of thermal cameras with better properties.
4.2. Weather Conditions and Lighting
For machine vision, incorrectly selected sensor, viewing angles and material flare are among the most serious problems that can completely compromise the reliability of detection or other system functions. For systems that rely on cameras to work properly, lighting is an essential area that should not be forgotten. Even when changing sensors, there is little chance that object detection improves in low light. Then, the appropriate lighting and placement of observation equipment come to the rescue. Poor placement can result in not being able to detect anything at all. Experts have tried to figure out the principle of circumventing the inconveniences associated with shiny objects. The main tools include: using backlight, using different wavelengths in scanning, changing the color of light, using polarized light, changing ambient lighting, using advanced sensors or other unusual trick. Various experiments with backlight or other colors or types of lighting can result in highlighting the contours of objects, reducing the glare of shiny objects due to the different interaction of wavelengths with different objects. If the system operates in the black and white spectrum, adding blue lightens it, and adding orange creates darker spots. Polarized light is also very often used in computer vision applications because shining polarized light on a glossy surface can reduce reflections. However, polarized light is not always the best solution. We need to position the polarized light precisely; otherwise, the reflections may be much worse. The use of advanced sensors and chips can solve the abovementioned problems. It is often assumed that the use of 3D laser scanners and 3D vision eliminates the problems associated with 2D vision. However, in some cases, it is also necessary to create a new algorithmic solution. Therefore, one must choose wisely. The use of advanced technology can also bring more complex problems, which we tried to solve at the beginning.
5. Alternative Detection
In case the detection of passengers using video systems fails, it is advisable to try to estimate the number of passengers by other methods. Mostly all modern passenger cars already have a built-in passenger counting using a central computer in the vehicle or, according to multiple surveys, from 70% to 90% of people carry mobile phones during transportation. These facts can be used to estimate the number of passengers in vehicles.
It is also worth mentioning that passenger detection might be achieved using radars [
24] or using a Wi-Fi probe request [
33]. When using a Wi-Fi probe request, passengers have to enable Wi-Fi in smartphones in order to properly count passengers. All other invasive methods are summarized in the chapter of the literature review.
6. Discussion
For future work, we need to think about the following questions and practical solutions. Not all passengers, especially children, sit in a straight and correct way. Many passengers also lay down and sleep. It is also possible that there are more people in the vehicle than its prescribed capacity or full capacity, but passengers are too close to each other. These are difficult obstacles that the system has to deal with and are a topic for future research. Vehicle speed is another huge problem. During our experiments, we considered speed up to 20 km/h. If our test vehicle was traveling faster, the output from cameras was blurry. If we want to deal with higher speeds, it is necessary to use high-speed traffic cameras to capture smooth video outputs. In real life, there are limited speeds in road tunnels; in our country, the maximum speed is 100 km/h.
The expected accuracy is a difficult question for discussion. For example, if there are 100 vehicles in a tunnel, and all of them have four passengers, if the system detects three passengers in half of them, many passengers are not detected. This is a huge problem, but in terms of alarming rescue services, the rough information about the number of people in tunnel is sufficient enough to help the commander of rescue services to dispatch the adequate amount of vehicles and man force. When there are fewer people in rendezvous, rescue services know the rough estimate of the number of people still in tunnel. Current systems do not provide any pieces of information about the number of passengers. In addition, if an accident happens in the center of a tunnel, the vehicles in front of the accident continue, and there might be half of the people left in tunnel. According to the commander of firefighters in a local department, the starting point of required accuracy is about 80%. Despite the European Union’s great efforts to improve and enhance in-vehicle safety systems, it is estimated that up to 50% of vehicles over the next 15 years will not include these smart support systems. At the same time, it is assumed that car manufacturers must actively bring new services—reporting the number of passengers for the needs of tunnel systems and others. Until then, tunnel system operators must rely on external solutions for counting the number of passengers in vehicles. The integration of information from different external and internal systems provides a prerequisite for a significant improvement in passenger estimates.
This paper is our first stage of passenger detection in tunnels. Based on available options, we decided to compare tools based on machine learning and neural networks. By utilizing thermal camera THP3008-S, we found out that this method would not be right choice, but for comparison and evaluation, we decided to test it with open windows. This approach is not a solution for utilizing thermal cameras because with closed windows, the accuracy drops to 0%. With the maximum transmission of car windows at 70% and lower with the use of tinting or film, thermal cameras have serious limitations. However, thermal cameras might be used in interesting applications [
34,
35], but in this field, they do not find great success. For our future work, we are planning to use multiple sensors and hyperspectral cameras with different wavelengths 380–1000 and 900–1700 nm and active illumination to achieve better performance. We are also planning to change our current approach from image to image based, meaning we are evaluating accuracy based on single images. We are currently working on improved models with tracking and precise counting using hyperspectral cameras to achieve more promising results.
Passenger privacy also plays a huge role in this kind of system. Depending on the implementation of the existing systems (e.g., e-call), it may become maliciously activated without a crash taking place. Moreover, the car passengers have no control over the remote activation of the microphone, making it extremely vulnerable to eavesdropping. For our future work, we are planning to propose smart external cameras capable of sending only pieces of information such as the number plate, number of passengers, date and time of entry to the tunnel if our algorithms are not resource dependent—not whole video stream. Existing tunnel systems and cameras upload videos to remote clouds, where they can be compromised.
7. Conclusions
This paper proposes ideas that can be used to determine the number of passengers in public infrastructure noninvasively. Thermal imager and IP cameras are used, and results are compared. Passenger estimation is accomplished using a thermal image data set with Haar cascade model and using images in visible spectrum using the YOLOv3 model. This was tested during lockdown in laboratory experiments. In order to increase the accuracy of passenger detection noninvasively, the fusion from multiple systems have to be used or try to use a different approach—counting the number of mobile devices connected to cellular network. If we keep our methods, we might approach the passenger counting not only as detecting persons in individual frames and then counting but by using line ROI (region of interest). This might have a little drawback, and we do not count with cars in the opposite direction of flow or reversing cars. There are many options, and we need to choose the right one for our future improvements.
Author Contributions
Conceptualization, P.K. and R.P.; methodology, P.K., K.R., T.T. (Tomáš Tichý), T.T. (Tamas Tettamanti) and P.K.; software, P.K.; validation, R.P., M.S., T.T. (Tomáš Tichý), T.T. (Tamas Tettamanti) and K.R.; formal analysis, K.R. and P.K.; investigation, R.P., K.R. and T.T. (Tomáš Tichý); resources, P.K. and R.P.; data curation, M.S., P.K. and R.P.; writing—original draft preparation, P.K., R.P. and T.T. (Tomáš Tichý); writing—review and editing, K.R., M.S. and T.T. (Tamas Tettamanti); visualization, P.K. and R.P.; supervision, K.R., T.T. (Tomáš Tichý) and R.P.; project administration, R.P. and K.R.; funding acquisition, R.P. All authors have read and agreed to the published version of the manuscript.
Funding
The research was supported by the project APVV-17-0014, “Smart tunnel: telematic support in case of emergencies in the road tunnel”.
Institutional Review Board Statement
“Not applicable” for studies not involving humans or animals.
Informed Consent Statement
Informed consent was obtained from all subjects involved in the study.
Data Availability Statement
The data captured with thermal imager TPH3008-S presented in this study are openly available in [“Images for Haar cascade captured with Thermal imager TPH3008-S”, Mendeley Data, V1, doi: 10.17632/m9rp75gdjt.2]. The data captured with IP cameras VIVOTEK presented in this study are available on request from the corresponding author. The data are not publicly available due to privacy restrictions.
Conflicts of Interest
The authors declare no conflict of interest.
Abbreviations
The following abbreviations are used in this manuscript:
| YOLO | You only look once |
| ROI | Region of interest |
| E-call | Emergency call |
| TOF | Time of flight |
| OWS | Occupant weight sensor |
| IR | Infrared |
| HOV | High-occupancy vehicle |
| HOT | High-occupancy toll |
| GUI | Graphical user interface |
Appendix A
Confusion matrix evaluation using precision, F1 score and recall for Haar cascade matrices.
Table A1.
Confusion matrix evaluation for Video 1.
Table A1.
Confusion matrix evaluation for Video 1.
| No. of Passengers | Precision | Recall | Accuracy | F1 Score |
|---|
| 0 passenger | 0.99 | 1.00 | 98.87% | 0.99 |
| 1 passenger | 0 | 0 | 98.87% | 0 |
Table A2.
Confusion matrix evaluation for Video 2.
Table A2.
Confusion matrix evaluation for Video 2.
| No. of Passengers | Precision | Recall | Accuracy | F1 Score |
|---|
| 0 passenger | 1.0 | 0.90 | 93.93% | 0.95 |
| 1 passenger | 0.77 | 0.60 | 80.36% | 0.67 |
| 2 passengers | 0.34 | 1.00 | 86.43% | 0.51 |
Table A3.
Confusion matrix evaluation for Video 3.
Table A3.
Confusion matrix evaluation for Video 3.
| No. of Passengers | Precision | Recall | Accuracy | F1 Score |
|---|
| 0 passenger | 1.0 | 0.81 | 84.33% | 0.89 |
| 1 passenger | 0.35 | 0.56 | 76.64% | 0.43 |
| 2 passengers | 0 | 0 | 87.46% | 0 |
| 3 passengers | 0 | 0 | 99.15% | 0 |
Table A4.
Confusion matrix evaluation for Video 4.
Table A4.
Confusion matrix evaluation for Video 4.
| No. of Passengers | Precision | Recall | Accuracy | F1 Score |
|---|
| 0 passenger | 1.0 | 0.92 | 94.14% | 0.96 |
| 1 passenger | 0.26 | 0.18 | 84.91% | 0.21 |
| 2 passengers | 0.53 | 1.0 | 90.09% | 0.69 |
| 3 passengers | 0 | 0 | 99.77% | 0 |
Table A5.
Confusion matrix evaluation for Video 5.
Table A5.
Confusion matrix evaluation for Video 5.
| No. of Passengers | Precision | Recall | Accuracy | F1 Score |
|---|
| 0 passenger | 1.0 | 0.71 | 74.73% | 0.83 |
| 1 passenger | 0 | 0 | 82.14% | 0 |
| 2 passengers | 0.34 | 1.0 | 84.34% | 0.50 |
Table A6.
Confusion matrix evaluation for Video 6.
Table A6.
Confusion matrix evaluation for Video 6.
| No. of Passengers | Precision | Recall | Accuracy | F1 Score |
|---|
| 0 passenger | 0.99 | 0.79 | 82.85% | 0.88 |
| 1 passenger | 0.25 | 0.52 | 82.2% | 0.34 |
| 2 passengers | 0.50 | 0.95 | 89.00% | 0.56 |
| 2 passengers | 0.08 | 1.0 | 96.12% | 0.14 |
References
- Tichy, T.; Brož, J.; Bělinova, Z.; Pirnik, R. Analysis of Predictive Maintenance for Tunnel Systems. Sustainability 2021, 13, 3977. [Google Scholar] [CrossRef]
- Halgaš, J.; Pirnik, R. Monitoring of parking lot traffic using a video detection. Acta Tech.-Corviniensis-Bull. Eng. 2015, 8, 17–20. [Google Scholar]
- Šimak, V.; Hrbček, J.; Pirnik, R. Traffic flow videodetection. Int. Conf. Febr. 2010, 10, 13. [Google Scholar]
- Erlik, N.F.; El Ahmar, W.; Laganiere, R.; Ghods, A. In-vehicle occupancy detection with convolutional networks on thermal images. In Proceedings of the IEEE/CVF Conference on Computer Vision and Pattern Recognition Workshops, Long Beach, CA, USA, 16–17 June 2019; pp. 941–948. [Google Scholar]
- Lee, J.; Lee, D.; Jang, S.; Choi, D.; Jang, J. Analysis of Deep Learning Model for the Development of an Optimized Vehicle Occupancy Detection System. J. Korea Inst. Inf. Commun. Eng. 2021, 25, 146–151. [Google Scholar]
- Amanatiadis, A.; Karakasis, E.; Bampis, L.; Ploumpis, S.; Gasteratos, A. ViPED: On-road vehicle passenger detection for autonomous vehicles. Robot. Auton. Syst. 2019, 112, 282–290. Available online: https://0-www-sciencedirect-com.brum.beds.ac.uk/science/article/pii/S0921889018302045 (accessed on 20 September 2021). [CrossRef]
- Vamsi, M.; Soman, K. In-Vehicle Occupancy Detection and Classification Using Machine Learning. In Proceedings of the 2020 11th International Conference on Computing, Communication and Networking Technologies (ICCCNT), Kharagpur, India, 1–3 July 2020; pp. 1–6. [Google Scholar]
- Tibken, B.; Albani, M.; Fischer, T. A new optimization problem for the solution of decision problems with applications to passenger occupation detection in cars. In Proceedings of the 2006 IEEE Conference on Computer Aided Control System Design, 2006 IEEE International Conference on Control Applications, 2006 IEEE International Symposium on Intelligent Control, Munich, Germany, 4–6 October 2006; pp. 726–727. [Google Scholar]
- Géczy, A.; Melgar, R.D.J.; Bonyár, A.; Harsányi, G. Passenger detection in cars with small form-factor IR sensors (Grid-eye). In Proceedings of the 2020 IEEE 8th Electronics System-Integration Technology Conference (ESTC), Tønsberg, Norway, 15–18 September 2020; pp. 1–6. [Google Scholar]
- Bonyár, A.; Géczy, A.; Harsanyi, G.; Hanák, P. Passenger Detection and Counting Inside Vehicles For eCall-a Review on Current Possibilities. In Proceedings of the 2018 IEEE 24th International Symposium for Design and Technology in Electronic Packaging (SIITME), Iasi, Romania, 25–28 October 2018; pp. 221–225. [Google Scholar]
- Sterner, H.; Aichholzer, W.; Haselberger, M. Development of an antenna sensor for occupant detection in passenger transportation. Procedia Eng. 2012, 47, 178–183. [Google Scholar] [CrossRef] [Green Version]
- Faber, P. Image-based passenger detection and localization inside vehicles. Int. Arch. Photogramm. Remote Sens. 2000, 33, 230–237. [Google Scholar]
- Chen, J.; Wen, Q.; Zhuo, C.; Mete, M. Automatic head detection for passenger flow analysis in bus surveillance videos. In Proceedings of the 2012 5th International Congress on Image and Signal Processing, Chongqing, China, 16–18 October 2012; pp. 143–147. [Google Scholar]
- Zhang, S.; Wu, Y.; Men, C.; Li, X. Tiny YOLO optimization oriented bus passenger object detection. Chin. J. Electron. 2020, 29, 132–138. [Google Scholar] [CrossRef]
- Hussain, K.S.; Haroon, Y.M.; Murtaza, F.; Velastin, C.S. Passenger detection and counting during getting on and off from Public transport systems. NED Univ. J. Res. 2020, 2, 35–46. [Google Scholar]
- Pavlidis, I.; Fritz, B.; Symosek, P.; Papanikolopoulos, N.; Morellas, V.; Sfarzo, R. Automatic Passenger Counting in the High Occupancy Vehicle (HOV) Lanes. In Proceedings of the 9th ITS America Meeting, Washington, DC, USA, 17 November 1999. [Google Scholar]
- Billheimer, J.; Kaylor, K.; Shade, C. Use of Videotape in Hov Lane Surveillance and Enforcement: A Technology Sharing Project. 1990. California. Department of Transportation; United States. Federal Highway Administration. 1990. Available online: https://rosap.ntl.bts.gov/view/dot/4132 (accessed on 20 September 2021).
- Pavlidis, I.; Symosek, P.; Fritz, B.; Bazakos, M.; Papanikolopoulos, N. Automatic detection of vehicle occupants: The imaging problemand its solution. Mach. Vis. Appl. 2000, 11, 313–320. [Google Scholar] [CrossRef]
- Chen, Y.; Zhang, L.; Wang, J. Passenger detection for subway transportation based on video. In Proceedings of the 2014 10th International Conference on Natural Computation (ICNC), Xiamen, China, 19–21 August 2014; pp. 720–724. [Google Scholar]
- Pérez-Jiménez, A.; Guardiola, J.; Pérez-Cortés, J. High occupancy vehicle detection. In Proceedings of the Joint IAPR International Workshops on Statistical Techniques In Pattern Recognition (SPR) and Structural and Syntactic Pattern Recognition (SSPR), Orlando, FL, USA, 4–6 December 2008; pp. 782–789. [Google Scholar]
- Kumar, A.; Gupta, A.; Santra, B.; Lalitha, K.; Kolla, M.; Gupta, M.; Singh, R. VPDS: An AI-based automated vehicle occupancy and violation detection system. Proc. AAAI Conf. Artif. Intell. 2019, 33, 9498–9503. [Google Scholar] [CrossRef]
- Chu, L.; Nesamani, K.; Benouar, H. Priority based high occupancy vehicle lanes operation. In Proceedings of the Transportation Research Board Annual Meeting 2007, Washington, DC, USA, 21–25 January 2007. [Google Scholar]
- Artan, Y.; Paul, P. Occupancy detection in vehicles using fisher vector image representation. arXiv 2013, arXiv:1312.6024. [Google Scholar]
- Abedi, H.; Luo, S.; Shaker, G. On the Use of Low-Cost Radars and Machine Learning for In-Vehicle Passenger Monitoring. In Proceedings of the 2020 IEEE 20th Topical Meeting On Silicon Monolithic Integrated Circuits In RF Systems (SiRF), San Antonio, TX, USA, 26–29 January 2020; pp. 63–65. [Google Scholar]
- Satz, A.; Hammerschmidt, D.; Tumpold, D. Capacitive passenger detection utilizing dielectric dispersion in human tissues. Sens. Actuators A Phys. 2009, 152, 1–4. [Google Scholar] [CrossRef]
- Holečko, P.; Bubenikova, E.; Pirnik, R. Communication systems in transport—Hybrid ITS interface. In Proceedings of the 2012 ELEKTRO, Rajecke Teplice, Slovakia, 21–22 May 2012; pp. 292–298. [Google Scholar]
- Pekar, A.; Mocnej, J.; Seah, W.; Zolotova, I. Application domain-based overview of IoT network traffic characteristics. ACM Comput. Surv. (CSUR) 2020, 53, 1–33. [Google Scholar] [CrossRef]
- Lojka, T.; Miškuf, M.; Zolotová, I. Industrial iot gateway with machine learning for smart manufacturing. In IFIP International Conference on Advances in Production Management Systems; Springer: Cham, Switzerland; pp. 759–766.
- Viola, P.; Jones, M. Rapid object detection using a boosted cascade of simple features. In Proceedings of the 2001 IEEE Computer Society Conference on Computer Vision and Pattern Recognition, CVPR 2001, Kauai, HI, USA, 8–14 December 2001; Volume 1, pp. I511–I518. [Google Scholar]
- Huang, R.; Gu, J.; Sun, X.; Hou, Y.; Uddin, S. A rapid recognition method for electronic components based on the improved YOLO-V3 network. Electronics 2019, 8, 825. [Google Scholar] [CrossRef] [Green Version]
- Laskaris, N.; Chouhan, A.; New State-of-the-Art in Logo Detection Using YOLOv3 and Darknet. October 2020. Available online: https://www.platform.ai/post/new-state-of-the-art-in-logo-detection-using-yolov3-and-darknet (accessed on 21 September 2021).
- Redmon, J.; Farhadi, A. YOLOv3: An Incremental Improvement. arXiv 2018, arXiv:1804.02767. [Google Scholar]
- Pattanusorn, W.; Nilkhamhang, I.; Kittipiyakul, S.; Ekkachai, K.; Takahashi, A. Passenger estimation system using Wi-Fi probe request. In Proceedings of the 2016 7th International Conference of Information and Communication Technology for Embedded Systems (IC-ICTES), Bangkok, Thailand, 20–22 March 2016; pp. 67–72. [Google Scholar]
- Tichý, T.; Švorc, D.; Růžička, M.; Bělinová, Z. Thermal Feature Detection of Vehicle Categories in the Urban Area. Sustainability 2021, 13, 6873. [Google Scholar] [CrossRef]
- Švorc, D.; Tichý, T.; Růžička, M. An Infrared Video Detection And Categorization System Based on Machine Learning. Neural Netw. World 2021, 31, 261–277. [Google Scholar] [CrossRef]
| Publisher’s Note: MDPI stays neutral with regard to jurisdictional claims in published maps and institutional affiliations. |
© 2021 by the authors. Licensee MDPI, Basel, Switzerland. This article is an open access article distributed under the terms and conditions of the Creative Commons Attribution (CC BY) license (https://creativecommons.org/licenses/by/4.0/).


 ,
, 


