
The Internal Demand of Cultural Tourism: Understanding Satisfaction and Fidelity to Destination in Spain through a Non-Linear Structural Model


Abstract
:1. Introduction
2. Conceptual Framework
2.1. Components of Fidelity to Destiny
2.2. Behavioral Dimension of Fidelity to Destiny
2.3. Variables That Influence Tourist Loyalty
3. Proposed Conceptual Model
4. Methodology
5. Results
6. Discussion and Implications
6.1. Theoretical Implications
6.2. Practical Implications
6.3. Limitations and Future Research
Author Contributions
Funding
Institutional Review Board Statement
Informed Consent Statement
Data Availability Statement
Conflicts of Interest
References
- UNWTO (World Tourism Organization). Guidelines for Institutional Strengthening of Destination Management Organizations (DMOs)—Preparing DMOs for New Challenges; UNWTO: Madrid, Spain, 2019. [Google Scholar]
- Lončarić, D.; Prodan, M.P.; Dlačić, J. The role of market mavens in co-creating tourist experiences and increasing loyalty to service providers. Econ. Res.-Ekon. Istraživanja 2019, 32, 2252–2268. [Google Scholar] [CrossRef] [Green Version]
- Tomić, S.; Leković, K.; Tadić, J. Consumer behaviour: The influence of age and family structure on the choice of activities in a tourist destination. Econ. Res.-Ekon. Istraz. 2019, 32, 755–771. [Google Scholar] [CrossRef]
- Krishna, A.; Schwarz, N. Sensory marketing, embodiment, and grounded cognition: Implications for consumer behavior. J. Consum. Psychol. 2014, 24, 159–168. [Google Scholar] [CrossRef]
- Butnaru, G.I.; Miller, A.; Nita, V.; Stefanica, M. A new approach on the quality evaluation of tourist services. Econ. Res.-Ekon. Istraživanja 2018, 31, 1418–1436. [Google Scholar] [CrossRef]
- Huang, X.; Dai, S.; Xu, H. Predicting Tourists’ Health Risk Preventative Behaviour and Travelling Satisfaction in Tibet: Combining the Theory of Planned Behaviour and Health Belief Model. Tour. Manag. Perspect. 2020, 33, 100589. [Google Scholar] [CrossRef]
- Acevedo-Duque, Á.; Gonzalez-Diaz, R.; Vega-Muñoz, A.; Mantilla, M.M.F.; Ovalles-Toledo, L.V.; Cachicatari-Vargas, E. The role of B companies in tourism towards recovery from the crisis COVID-19. Instilling social values and responsible entrepreneurship in Latin America. Sustainability 2021, 13, 7763. [Google Scholar]
- Zolfani, S.H.; Sedaghat, M.; Maknoon, R.; Zavadskas, E.K. Sustainable tourism: A comprehensive literature review on frameworks and applications. Econ. Res.-Ekon. Istraživanja 2015, 28, 1–30. [Google Scholar] [CrossRef] [Green Version]
- UNWTO (World Tourism Organization). UNWTO World Tourism Barometer (English Version). 2009, Volume 7. Available online: https://www.e-unwto.org/toc/wtobarometereng/7/2 (accessed on 15 June 2021).
- OECD (Organisation for Economic Co-Operation and Development). Tourism Policy Responses to the Coronavirus (COVID-19). 2020. Available online: https://www.oecd.org/coronavirus/policy-responses/tourism-policy-responses-to-the-coronaviruscovid-19-6466aa20/ (accessed on 25 July 2020).
- Flores Ruiz, D.; Sotillo, E.B.; González, M.O.B. National tourism behavior and growth in Spain National tourism behavior and growth in Spain. Tour. Investig. 2018, 16, 68–86. [Google Scholar]
- Du Cross, H. A new model to assist in planning for sustainable cultural heritage tourism. Int. J. Tour. Res. 2001, 3, 165–170. [Google Scholar] [CrossRef]
- Pine, B.J., II; Gilmore, J.H. The Experience Economy: Work is Theatre and Every Bussines a Stage; Harvard Business School Press: Boston, MA, USA, 1998. [Google Scholar]
- Schmitt, B.H. Experiential Marketing; Free Press: New York, NY, USA, 1999. [Google Scholar]
- NSI (National Statistics Institute). Resident Tourism Survey/FAMILITUR. 2018–2019. Available online: https://www.ine.es/dyngs/INEbase/es/operacion.htm?c=Estadistica_C&cid=1254736176990&menu=ultiDatos&idp=1254735576863 (accessed on 30 July 2020).
- Carrera, C.F.; Bes, A.F. La Encuesta de Turismo de Residentes (ETR/FAMILITUR). Indice Revista de Estadística y Sociedad 2021, 80, 21–25. [Google Scholar]
- Hombur, C.; Jozic, D.; Kuehnl, C. Customer experience management: Toward implementing an evolving marketing concept. J. Acad. Mark. Sci. 2017, 45, 377–401. [Google Scholar] [CrossRef]
- Garduño, M.G.; Cisneros, H.F. Una aproximación a la experiencia turística desde la Antropología del Turismo: Una mirada mutua al encuentro entre turistas y locales. PASOS Rev. De Tur. Y Patrim. Cult. 2018, 16, 197–211. [Google Scholar]
- Acevedo-Duque, Á.; Vega-Muñoz, A.; Salazar-Sepúlveda, G. Analysis of hospitality, leisure and tourism studies in Chile. Sustainability 2020, 12, 7238. [Google Scholar] [CrossRef]
- Gartner, W.C. Image Formation Process. J. Travel Tour. Mark. 1994, 2, 191–216. [Google Scholar] [CrossRef]
- Narangajavana, Y.; Fiol, L.J.C.; Tena, M.Á.M.; Artola, R.M.R.; García, J.S. The influence of social media in creating expectations. An empirical study for a tourist destination. Ann. Tour. Res. 2017, 65, 60–70. [Google Scholar]
- Backman, S.J.; Crompton, J.L. Using Loyalty Matrix to Differentiate Between High, Spurius, Latent and Low Loyalty Participants in Two Leisure Services. J. Park Recreat. Adm. 1991, 9, 1–17. [Google Scholar]
- Yoon, Y.; Uysal, M. An Examination of the Effects of Motivation and Satisfaction on Destination Loyalty: A Structural Model. Tour. Manag. 2005, 26, 45–56. [Google Scholar] [CrossRef]
- Liu, Y.; Hultman, M.; Eisingerich, A.B.; Wei, X. How Does Brand Loyalty Interact with Tourism Destination? Exploring the Effect of Brand Loyalty on Place Attachment. Ann. Tour. Res. 2020, 81, 102879. [Google Scholar] [CrossRef]
- Bigné, J.E.; Sánchez, M.I.; Sánchez, J. Tourism image, evaluation variables and after purchase behaviour: Inter-relationship. Tour. Manag. 2001, 22, 607–616. [Google Scholar] [CrossRef]
- Chi, C.; Qu, H. Examining the structural relationships of destination image tourist satisfaction and destination loyalty: An integrated approach. Tour. Manag. 2008, 29, 624–636. [Google Scholar] [CrossRef]
- Ozdemir, B.; Çizel, B.; Cizel, R.B. Satisfaction with all-inclusive tourism resorts: The effects of satisfaction with destination and destination loyalty. Int. J. Hosp. Tour. Adm. 2012, 13, 109–130. [Google Scholar] [CrossRef]
- Prayag, G.; Ryan, C. The Relationship between the Push and Pull Factors of a Tourist Destination: The Role of Nationality An Analytical Qualitative Research Approach. Curr. Issues Tour. 2011, 14, 121–143. [Google Scholar] [CrossRef]
- McKercher, B.; Denizci-Guillet, B.; Ng, E. Rethinking loyalty. Ann. Tour. Res. 2012, 39, 708–734. [Google Scholar] [CrossRef]
- Barroso, M.; Martín, E. Marketing Relational; ESIC: Madrid, Spain, 2007. [Google Scholar]
- Day, G.S. Consumer Behavior: Theoretical Sources; Prentice-Hall: New York, NY, USA, 1973. [Google Scholar]
- Kyle, G.; Graefe, A.; Manningc, R.; Bacon, J. Effects of place attachment on users’ perceptions of social and environmental conditions in a natural setting. J. Environ. Psychol. 2004, 24, 213–225. [Google Scholar] [CrossRef]
- Yuksel, A.; Yuksel, F.; Bilim, Y. Destination attachment: Effects on customer satisfaction and cognitive, affective and conative loyalty. Tour. Manag. 2009, 31, 274–284. [Google Scholar] [CrossRef]
- Iwasaki, Y.; Havitz, M.E. A Path Analytic Model of the Relationships between Involvement, Psychological Commitment and Loyalty. J. Leis. Res. 1998, 30, 256–280. [Google Scholar] [CrossRef]
- Chen, J.S.; Gursoy, D. An Investigation of Tourists’ Destination Loyalty and Preferences. Int. J. Contemp. Hosp. Manag. 2001, 13, 79–85. [Google Scholar] [CrossRef]
- Oppermann, M. Tourism Destination Loyalty. J. Travel Res. 2000, 39, 78–84. [Google Scholar] [CrossRef]
- Meleddu, M.; Paci, R.; Pulina, M. Repeated behaviour and destination loyalty. Tour. Manag. 2015, 50, 159–171. [Google Scholar] [CrossRef]
- Reichheld, F.F. Loyalty-Based Management. Harv. Bus. Rev. 1993, 71, 64–71. [Google Scholar] [PubMed]
- Alegre, J.; Garau, J. Tourist Satisfaction and Dissatisfaction. Ann. Tour. Res. 2010, 71, 52–73. [Google Scholar] [CrossRef]
- Fakeye, P.C.; Crompton, J.L. Image Differences Between Prospective, First–Time and Repeat Visitors to the Lower Rio Grande Valley. J. Travel Res. 1991, 30, 10–16. [Google Scholar] [CrossRef]
- Kozak, M. Repeaters’ behavior at two distinct destinations. Ann. Tour. Res. 2001, 28, 784–807. [Google Scholar] [CrossRef]
- Chen, C.; Chen, F. Experience quality, perceived value, satisfaction and behavioral, intentions for heritage tourist. Tour. Manag. 2010, 31, 29–35. [Google Scholar] [CrossRef]
- Boo, S.; Busser, J.; Baloglu, S. A model of customer-based brand equity and its application to multiple destinations. Tour. Manag. 2009, 30, 219–231. [Google Scholar] [CrossRef]
- Dolnicar, S.; Coltman, T.; Sharma, R. Do satisfied tourists really intend to come back? Three concerns with empirical studies of the link between satisfaction and behavioral intention. J. Travel Res. 2015, 54, 152–178. [Google Scholar] [CrossRef] [Green Version]
- Henthorne, T.L. An Analysis of Expenditures by Cruise Ship Passengers in Jamaica. J. Travel Res. 2000, 38, 246–250. [Google Scholar] [CrossRef]
- Wang, Y.S. Effects of budgetary constraints on international tourism expenditures. Tour. Manag. 2014, 41, 9–18. [Google Scholar] [CrossRef]
- Lee, S.K.; Jee, W.S.; Funk, D.C.; Jordan, J.S. Analysis of attendees’ expenditure patterns to recurring annual events: Examining the joint effects of repeat attendance and travel distance. Tour. Manag. 2015, 46, 177–186. [Google Scholar] [CrossRef]
- De la Calle Vaquero, M. La Ciudad Histórica Como Destino Turístico; Editorial Ariel: Barcelona, Spain, 2006. [Google Scholar]
- De la Calle Vaquero, M.; García, M. Turismo cultural en viaje de grupo organizado. Medina Azahara/Madinat Al-Zahra como referente. Cuadernos de Turismo 2008, 22, 79–99. [Google Scholar]
- Campo, S.; Garau, J.; Martínez, M. Factors influencing repeat visits to a destination: The influence of group composition. Tour. Manag. 2010, 31, 862–870. [Google Scholar] [CrossRef]
- García, J.; Juaneda, C.; Raya, J.; Sastre, F. A study of traveler decision-making determinants: Prioritizing destination or travel mode? Tour. Econ. 2015, 21, 1149–1167. [Google Scholar] [CrossRef]
- Petrick, J.F.; Backman, S.J. An examination of golf travelers’ satisfaction, perceived value, loyalty, and intentions to revisit. Tour. Anal. 2001, 6, 223–237. [Google Scholar]
- Correia, A.; Zins, A.H.; Silva, F. Why do tourists persist in visiting the same destination? Tour. Econ. 2015, 21, 205–221. [Google Scholar] [CrossRef]
- Barlow, R. Coalitions can support customer loyalty. Brandweek 2001, 42, 48–49. [Google Scholar]
- Gabarino, E.; Johnson, M.S. Dimensions and levels of trust: Implications for commitment to a relationship. J. Mark. 1999, 63, 70–87. [Google Scholar]
- Devesa Fernández, M.; García, M.L.; Picos, A.P. Un modelo estructural sobre la influencia de las motivaciones de ocio en la satisfacción de la visita turística. Revista de Psicología del Trabajo y de las Organizaciones 2008, 24, 253–268. [Google Scholar] [CrossRef] [Green Version]
- Alegre, J.; Cladera, M. Repeat Visitation in Mature Sun and Sand Holiday Destinations. J. Travel Res. 2006, 44, 288–297. [Google Scholar] [CrossRef]
- Antón, C.; Camarero, C.; Laguna-García, M. Towards a new approach of destination royalty drivers: Satisfaction, visit intensity and tourist motivation. Curr. Issues Tour. 2017, 20, 238–260. [Google Scholar] [CrossRef]
- Kim, Y.H.; Kim, M.; Goh, B.K. An examination of food tourist’s behaviour: Using the modified theory of reasoned action. Tour. Manag. 2011, 32, 1159–1165. [Google Scholar] [CrossRef]
- Eusébio, C.; Vieira, A.L. Destination Attributes’ Evaluation, Satisfaction and Behavioural Intentions: A Structural Modelling Approach. Int. J. Tour. Res. 2013, 15, 66–80. [Google Scholar] [CrossRef]
- Medina, C.; Rey, M.; Rufin, R. Imagen de los destinos turísticos urbanos y lealtad del turista. ¿Actitud o comportamiento? Estudios y perspectivas en turismo 2010, 19, 279–298. [Google Scholar]
- Domínguez, A.M.; Camuñez, J.A.; Pérez, M.D.; González, M.R. Analysis of the influence of motivation and authenticity in satisfaction and fidelity in cultural tourism. In Proceedings of the International Conference on Tourism Dynamics and Trends, Seville, Spain, 26–29 June 2017. [Google Scholar]
- López-Guzmán, T.; Pérez-Gálvez, J.C.; Muñoz-Fernández, G.A. Satisfaction, motivation, loyalty and segmentation of tourists in World Heritage cities. PASOS Revista de Turismo y Patrimonio Cultural 2018, 16, 73–86. [Google Scholar] [CrossRef] [Green Version]
- Kim, J.H. The Impact of Memorable Tourism Experiences on Loyalty Behaviors: The Mediating Effects of Destination Image and Satisfaction. J. Travel Res. 2018, 57, 856–870. [Google Scholar] [CrossRef]
- Prado-Mascuñano, J. La lógica de las estadísticas de turismo en España y el papel del Instituto de Estudios Turísticos. Índice Revista de Estadística y Sociedad 2013, 56, 24–26. [Google Scholar]
- Henlein, M.; Kaplan, A. A beginner’s guide to partial least squares analysis. Underst. Stat. 2004, 3, 283–297. [Google Scholar] [CrossRef]
- Sarstedt, M.; Moi, E.A. A Concise Guide to Market Research: The Process, Data and Methods Using IBM SPSS Statistics, 3rd ed.; Springer: Berlin, Germany, 2019. [Google Scholar]
- Bagozzi, R.P.; Philipps, L.W. Representing and testing organizational theories: A holistic construal. Adm. Sci. Q. 1982, 27, 459–489. [Google Scholar] [CrossRef]
- James, G.; Witten, D.; Hastie, T.; Tibshirani, R. An Introduction to Statistical Learning: With Applications in R; Springer: New York, NY, USA, 2021. [Google Scholar]
- Kock, N. Warp PLS 7.0; ScriptWarp Systems: Laredo, TX, USA, 2019. [Google Scholar]
- Efron, B.; Tibshirani, R.J. An Introduction to the Bootstrap; Chapman and Hall: New York, NY, USA, 1993. [Google Scholar]
- Jöreskog, K.G.; Wold, H.O. Systems under Indirect Observation: Causality, Structure, Prediction; North Holland: Amsterdam, The Netherlands, 1982.
- Henseler, J.; Ringle, C.; Sinkovics, R. The Use of Partial Least Squares Path Modelling in International Marketing. Adv. Int. Mark. 2009, 20, 277–320. [Google Scholar]
- Bourdieu, P. The Social Space and the Genesis of Groups. Theory Soc. 1985, 14, 723–744. [Google Scholar] [CrossRef]
- Ramírez-Castillo, N.A.; Müller-Pérez, J.; Acevedo-Duque, A.; Müller-Pérez, S.; González-Díaz, R.R.; Campos, J.S.; Ovalles-Toledo, L.V. Sustainable Moviegoer Intention to Attend Cinemas Based on the Theory of Planned Behavior. Sustainability 2021, 13, 8724. [Google Scholar] [CrossRef]
- Kotler, P.; Cámara, D.; Grande, I.; Cruz, I. Dirección de Marketing Turístico; Prentice Hall: Hoboken, NJ, USA, 2000. [Google Scholar]
- Hui, T.K.; Wan, D.; Ho, A. Tourists’ satisfaction, recommendation and Revisiting Singapore. Tour. Manag. 2007, 28, 965–975. [Google Scholar] [CrossRef]
- Feciková, I. An Index method for measurement of customer satisfaction. TQM Mag. 2004, 1, 57–66. [Google Scholar] [CrossRef]
- Lara de Vicente, F.; López-Guzmán, T.J. El turismo como motor de desarrollo económico en ciudades patrimonio de la humanidad. PASOS Revista de Turismo y Patrimonio Cultural 2004, 2, 243–256. [Google Scholar] [CrossRef]
- Pulido-Fernández, J.I.; Cárdenas-García, P.J.; Carrillo-Hidalgo, I. Trip Cultural Activities and Tourism Expenditure in Emerging Urban-cultural Destinations. Int. J. Tour. Res. 2016, 18, 286–296. [Google Scholar] [CrossRef]
- Fullerton, G.; Taylor, S. Mediating, Interactive and Non-Linear Effects in Service Quality and Satisfaction with Services Research. Can. J. Adm. Sci. 2002, 19, 124–136. [Google Scholar] [CrossRef]
- Li, T.T.; Liu, F.; Soutar, G. Experiences, post-trip destination image, satisfaction, and loyalty: A study in an ecotourism context. J. Destin. Mark. Manag. 2021, 19, 100547. [Google Scholar] [CrossRef]
- Moll-de-Alba, J.; Prats, L.; Coromina, L. Differences between short and long break tourists in urban destinations: The case of Barcelona. Eur. J. Tour. Res. 2016, 14, 29–46. [Google Scholar]
- Klopotan, I.; Vrhovec-Žohar, K.; Mahič, E. Impact of Income on Customers’ Loyalty: Are Customers with Higher Income more Loyal? Bus. Syst. Res. 2016, 7, 81–88. [Google Scholar] [CrossRef] [Green Version]
- Williams, C.; Buswell, J. Service Quality in Leisure and Tourism; CABI: Wallingford, CT, USA, 2003. [Google Scholar]


| Survey Type | Continuous Every Quarter |
|---|---|
| Population scope | Population over 15 years of age that resides in the main family dwelling |
| Scope | The entire national territory |
| Reference period | Monthly |
| Sample size | Around 16,400 interviews conducted each month |
| Information gathering | Telephone interviews and, in some cases, personal interviews |
| Sample Characteristics | |
|---|---|
| Data used | Resident tourist survey/Familitur |
| Data analyzed | Travels of cultural motivation with destiny in Spain |
| Reference period | February to September 2018 |
| Sample Size | n = 18,024 |
| Index | Value | Value Interpretation |
|---|---|---|
| Average path coefficient (APC) | APC = 0.161, p < 0.001 | Significant if p < 0.05 |
| Average R-squared (ARS) | ARS = 0.208, p < 0.001 | Significant if p < 0.05 |
| Average adjusted R-squared (AARS) | AARS = 0.208, p < 0.001 | Significant if p < 0.05 |
| Average block VIF (AVIF) | AVIF = 1.278 | Acceptable if ≤ 5, ideally ≤ 3.3 |
| Average full collinearity VIF (AFVIF) | AFVIF = 1.437 | Acceptable if ≤ 5, ideally ≤ 3.3 |
| TenenhausGoF (GoF) | GoF = 0.281 | Small ≥ 0.1, medium ≥ 0.25, large ≥ 0.36 |
| Sympson’s paradox ratio (SPR) | SPR = 1.000 | Acceptable if ≥ 0.7, ideally = 1 |
| R-squared contribution ratio (RSCR) | RSCR = 0.1.000 | Acceptable if ≥ 0.9, ideally = 1 |
| Statistical suppression ratio (SSR) | SSR = 1.000 | Acceptable if ≥ 0.7 |
| Nonlinear bivariate causality direction ratio (NLBCDR) | NLBCDR = 0.600 | Acceptable if ≥ 0.7 |
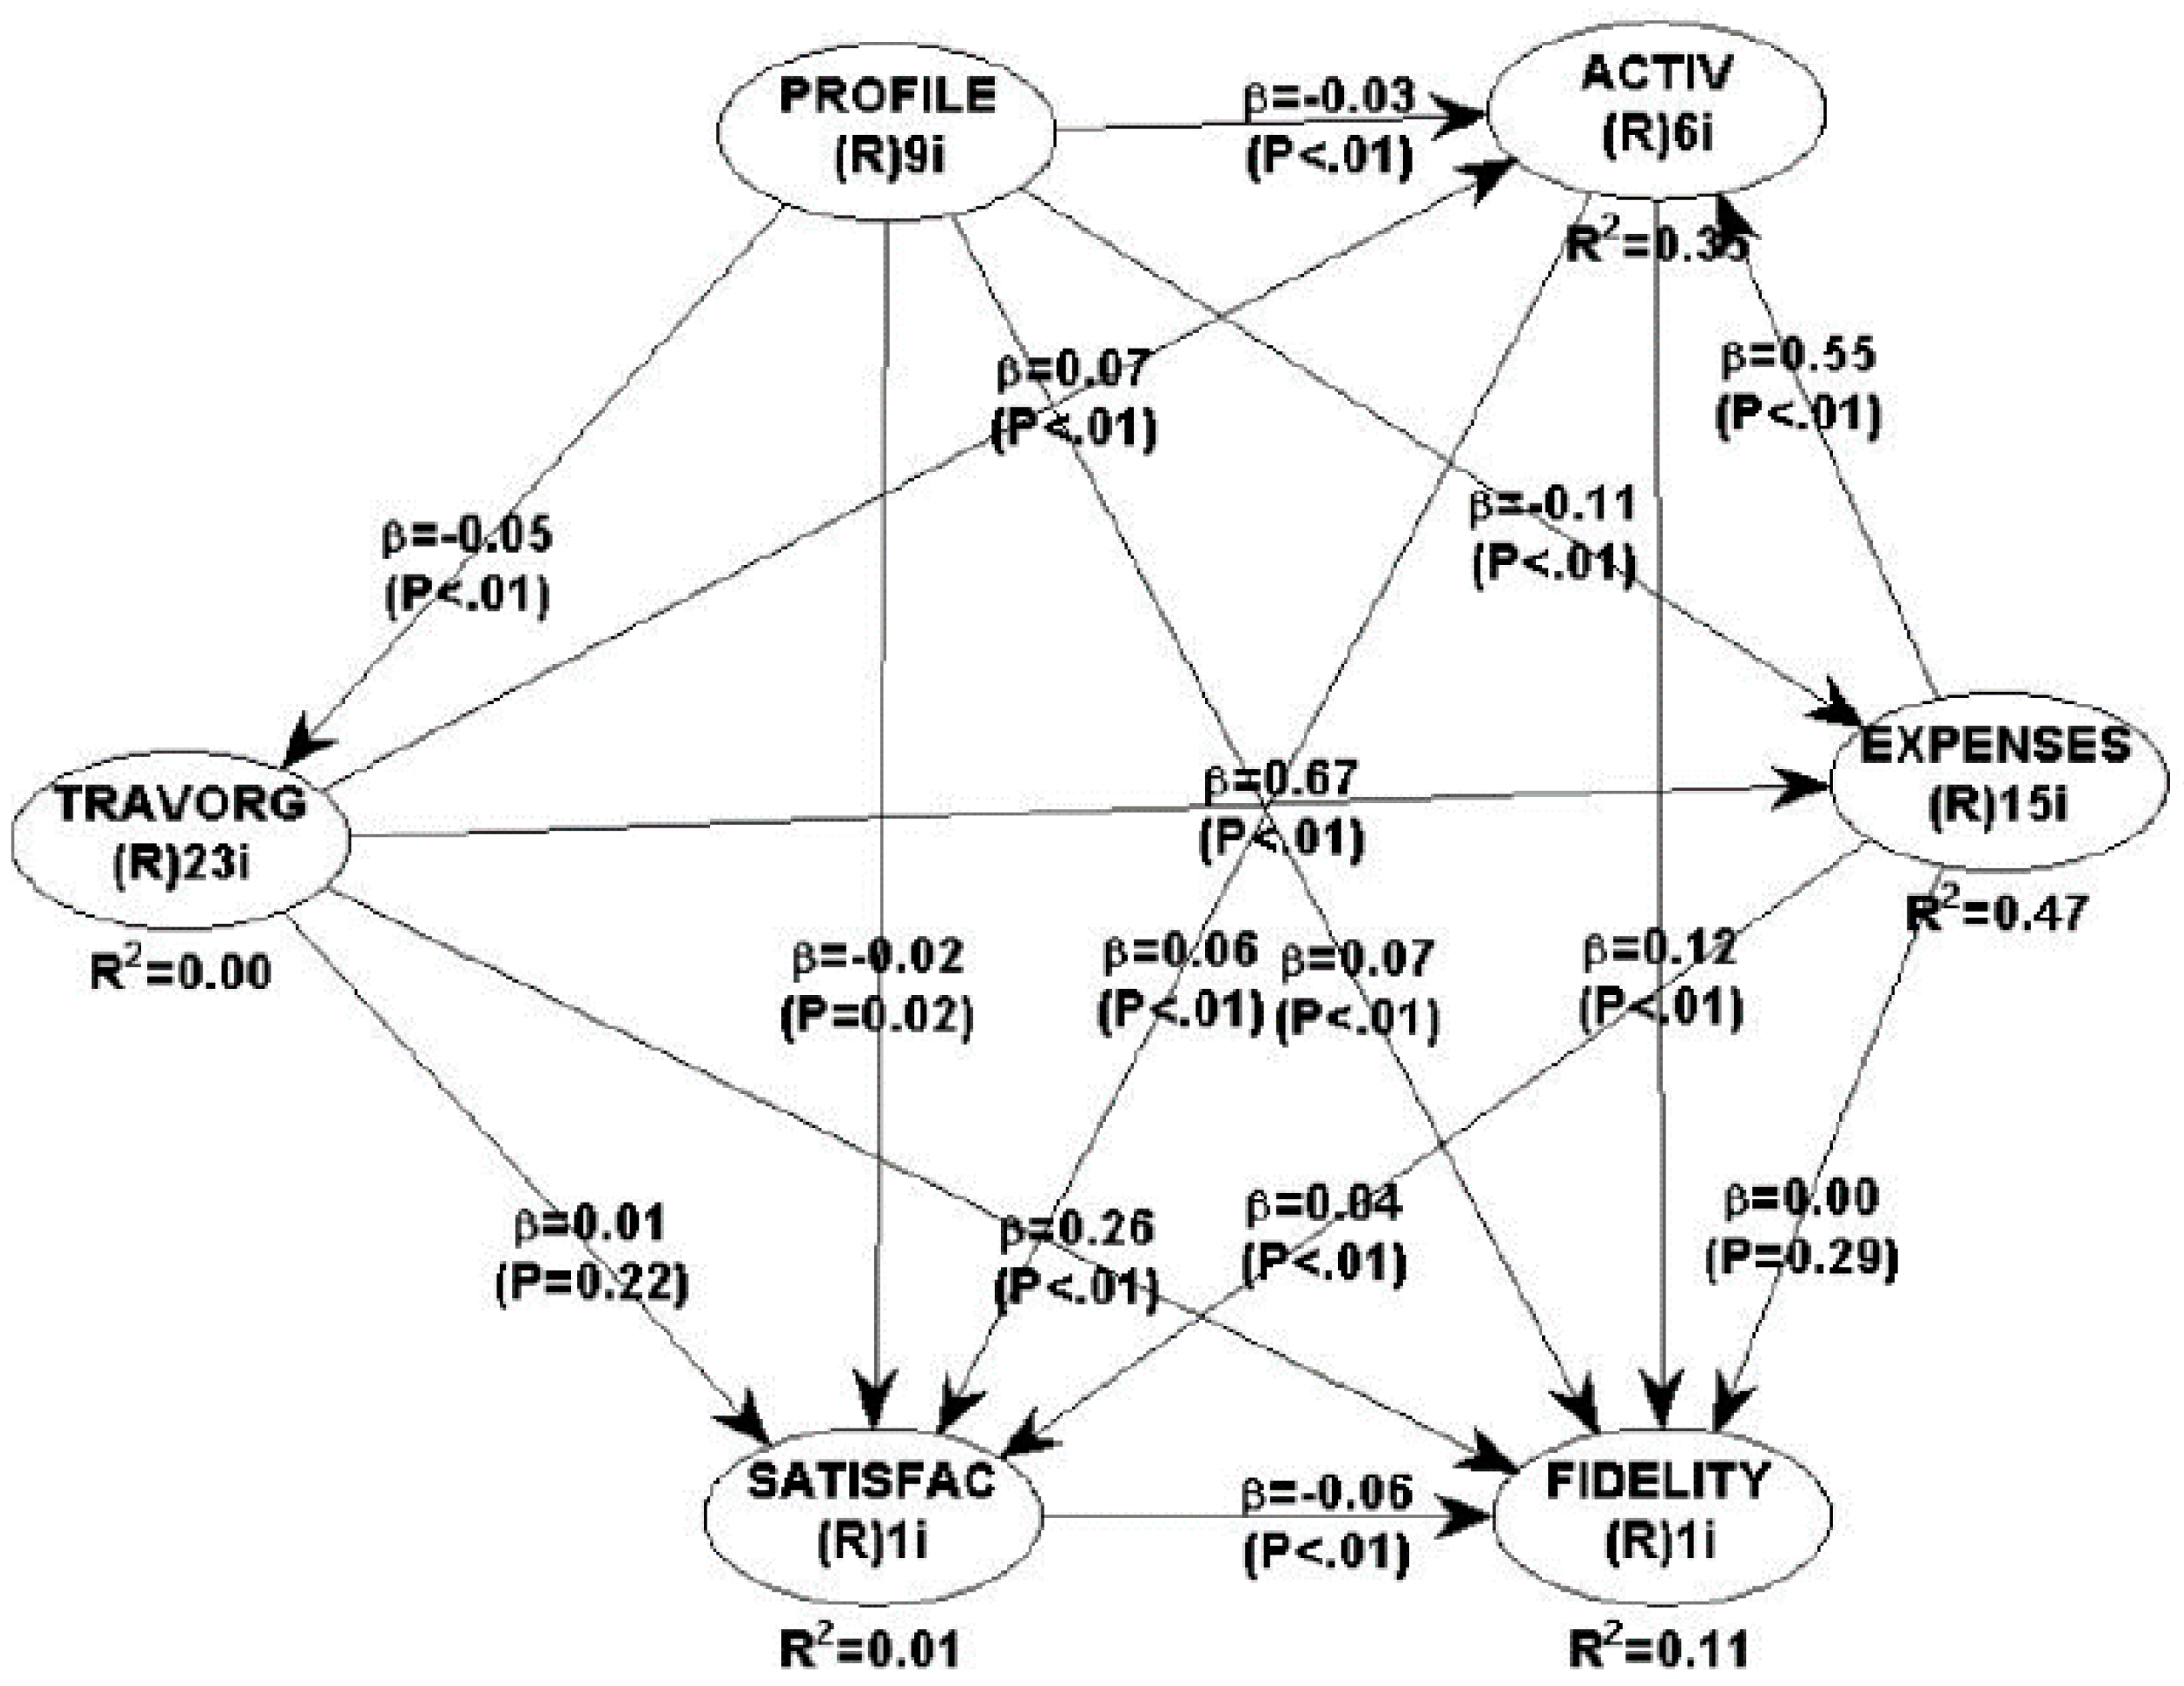
| H1 | Sociodemographic profile → Satisfaction (β = −0.02, p = 0.02) | Confirmed hypothesis. |
| H2 | Travel Organization → Satisfaction (β = 0.01, p = 0.22) | Unconfirmed hypothesis. |
| H3 | Activities carried out → Satisfaction (β = 0.06, p < 0.01) | Confirmed hypothesis. |
| H4 | Spending before and during the trip → Satisfaction (β = 0.04, p < 0.01) | Confirmed hypothesis. |
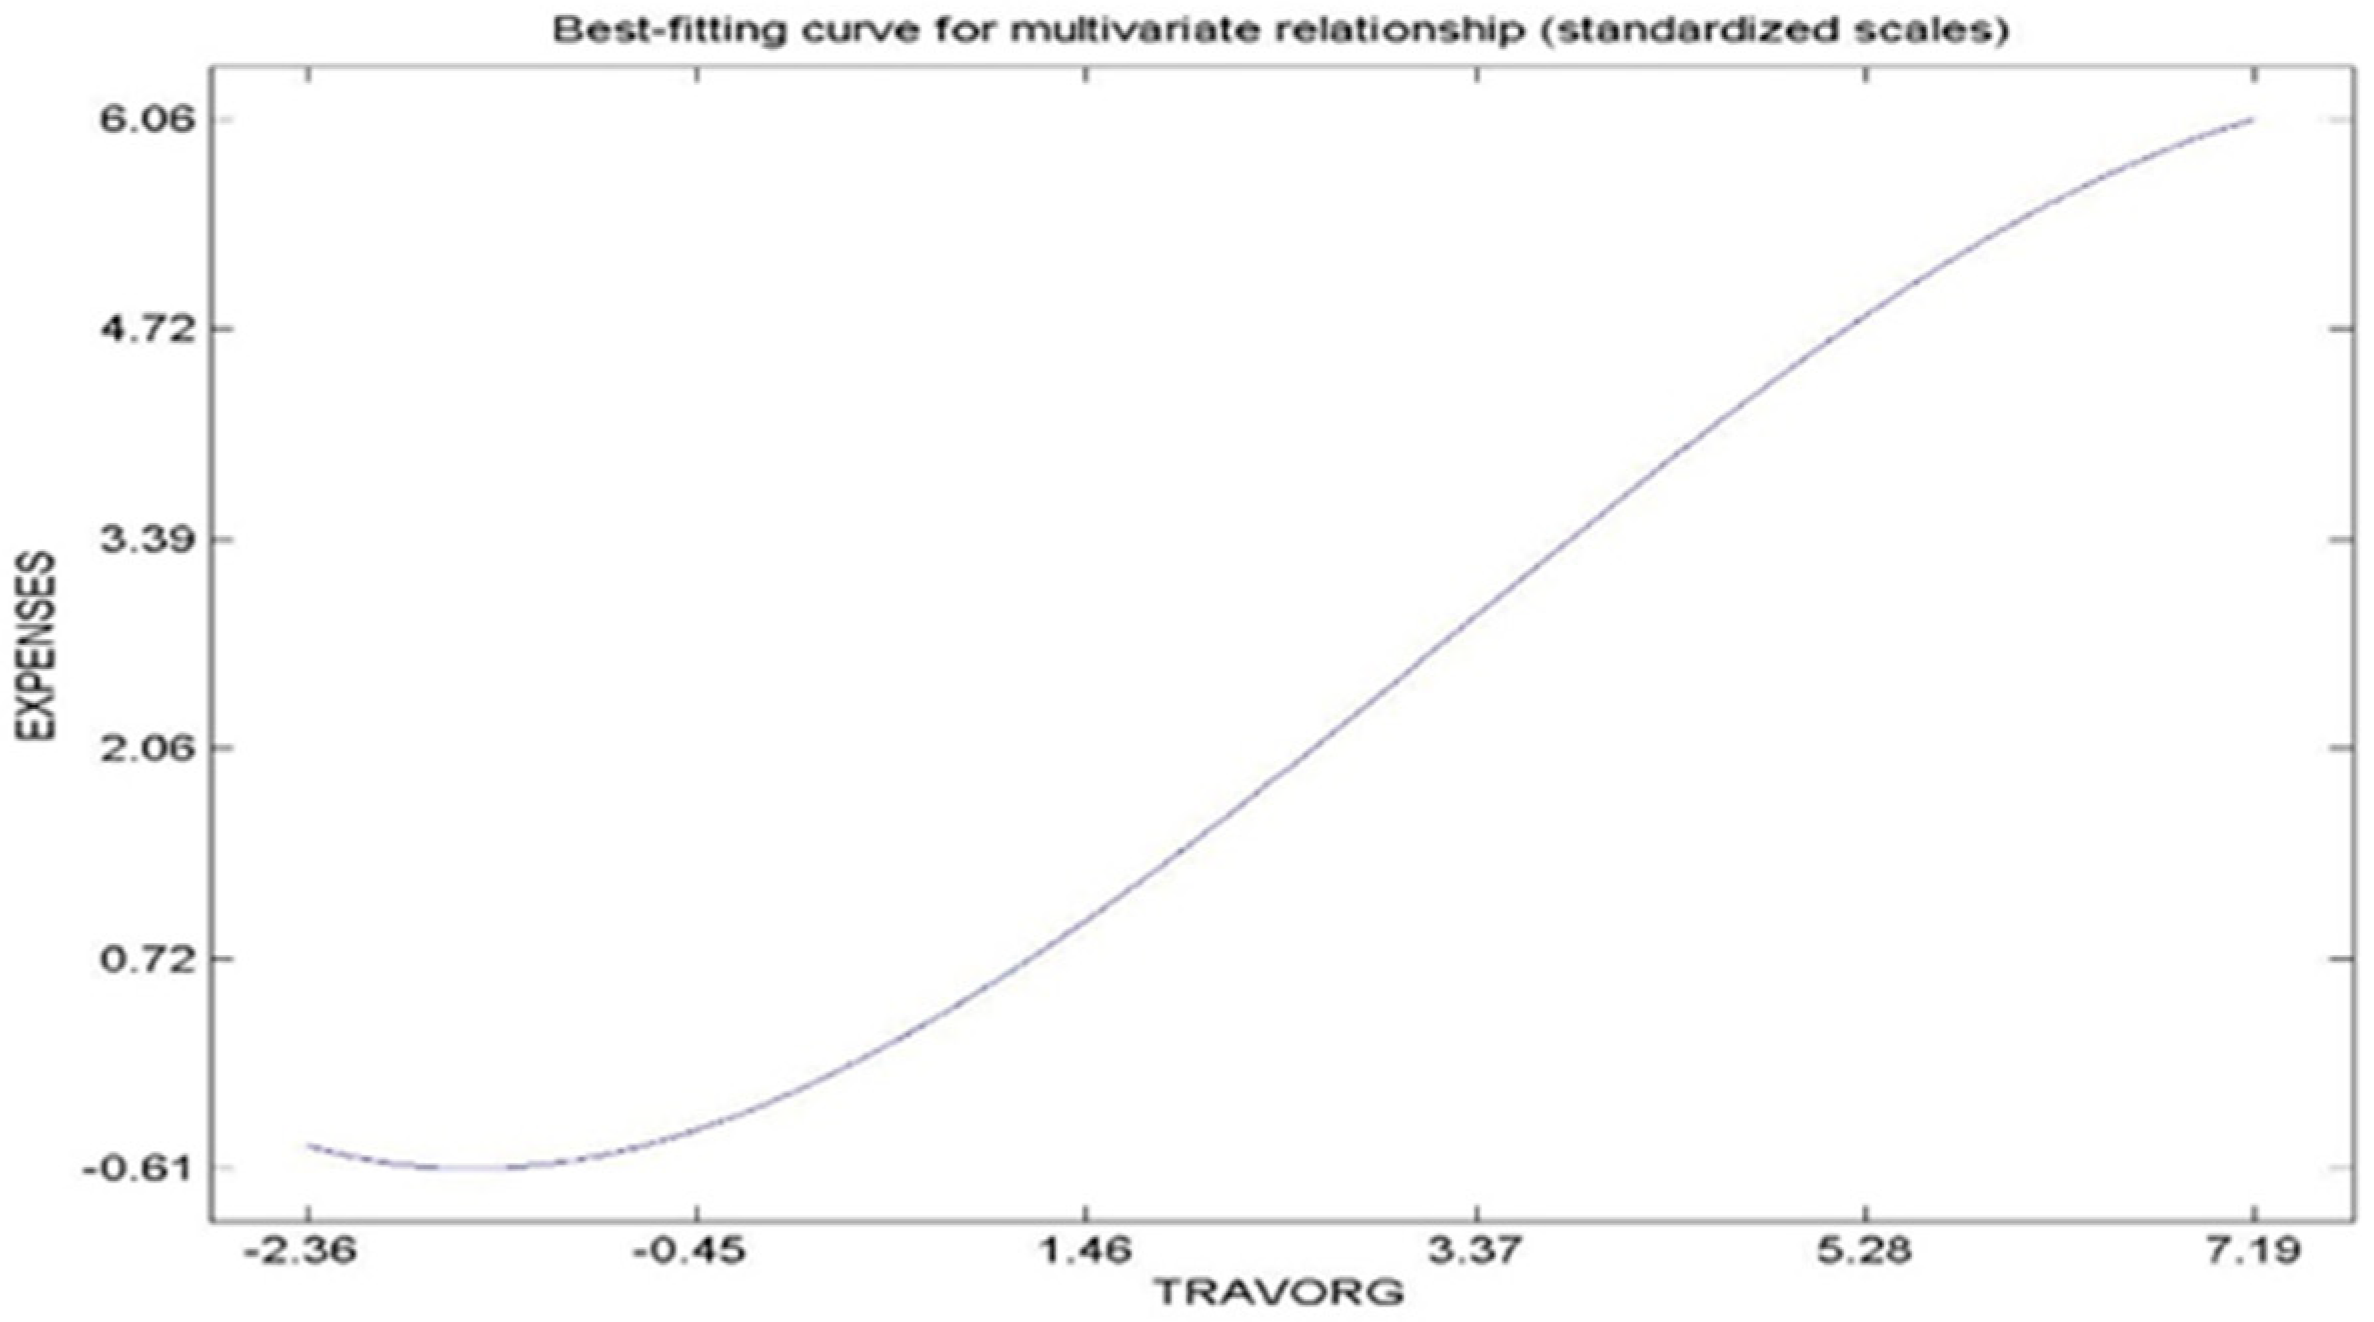
| H5 | Organization of the trip → Expenditure (β = 0.67, p < 0.01) | Confirmed hypothesis. |
| H6 | Organization of the trip → Activities (β = 0.07, p < 0.01) | Confirmed hypothesis. |
| H7 | Expenditure before and during the trip → Activities (β = 0.55, p < 0.01) | Confirmed hypothesis. |
| H8 | Sociodemographic profile → Activities (β = −0.03, p < 0.01) | Confirmed hypothesis. |
| H9 | Sociodemographic profile → Organization of the trip (β = −0.05, p < 0.01) | Confirmed hypothesis. |
| H10 | Sociodemographic profile → Expenditures incurred (β = −0.11, p < 0.01) | Confirmed hypothesis. |
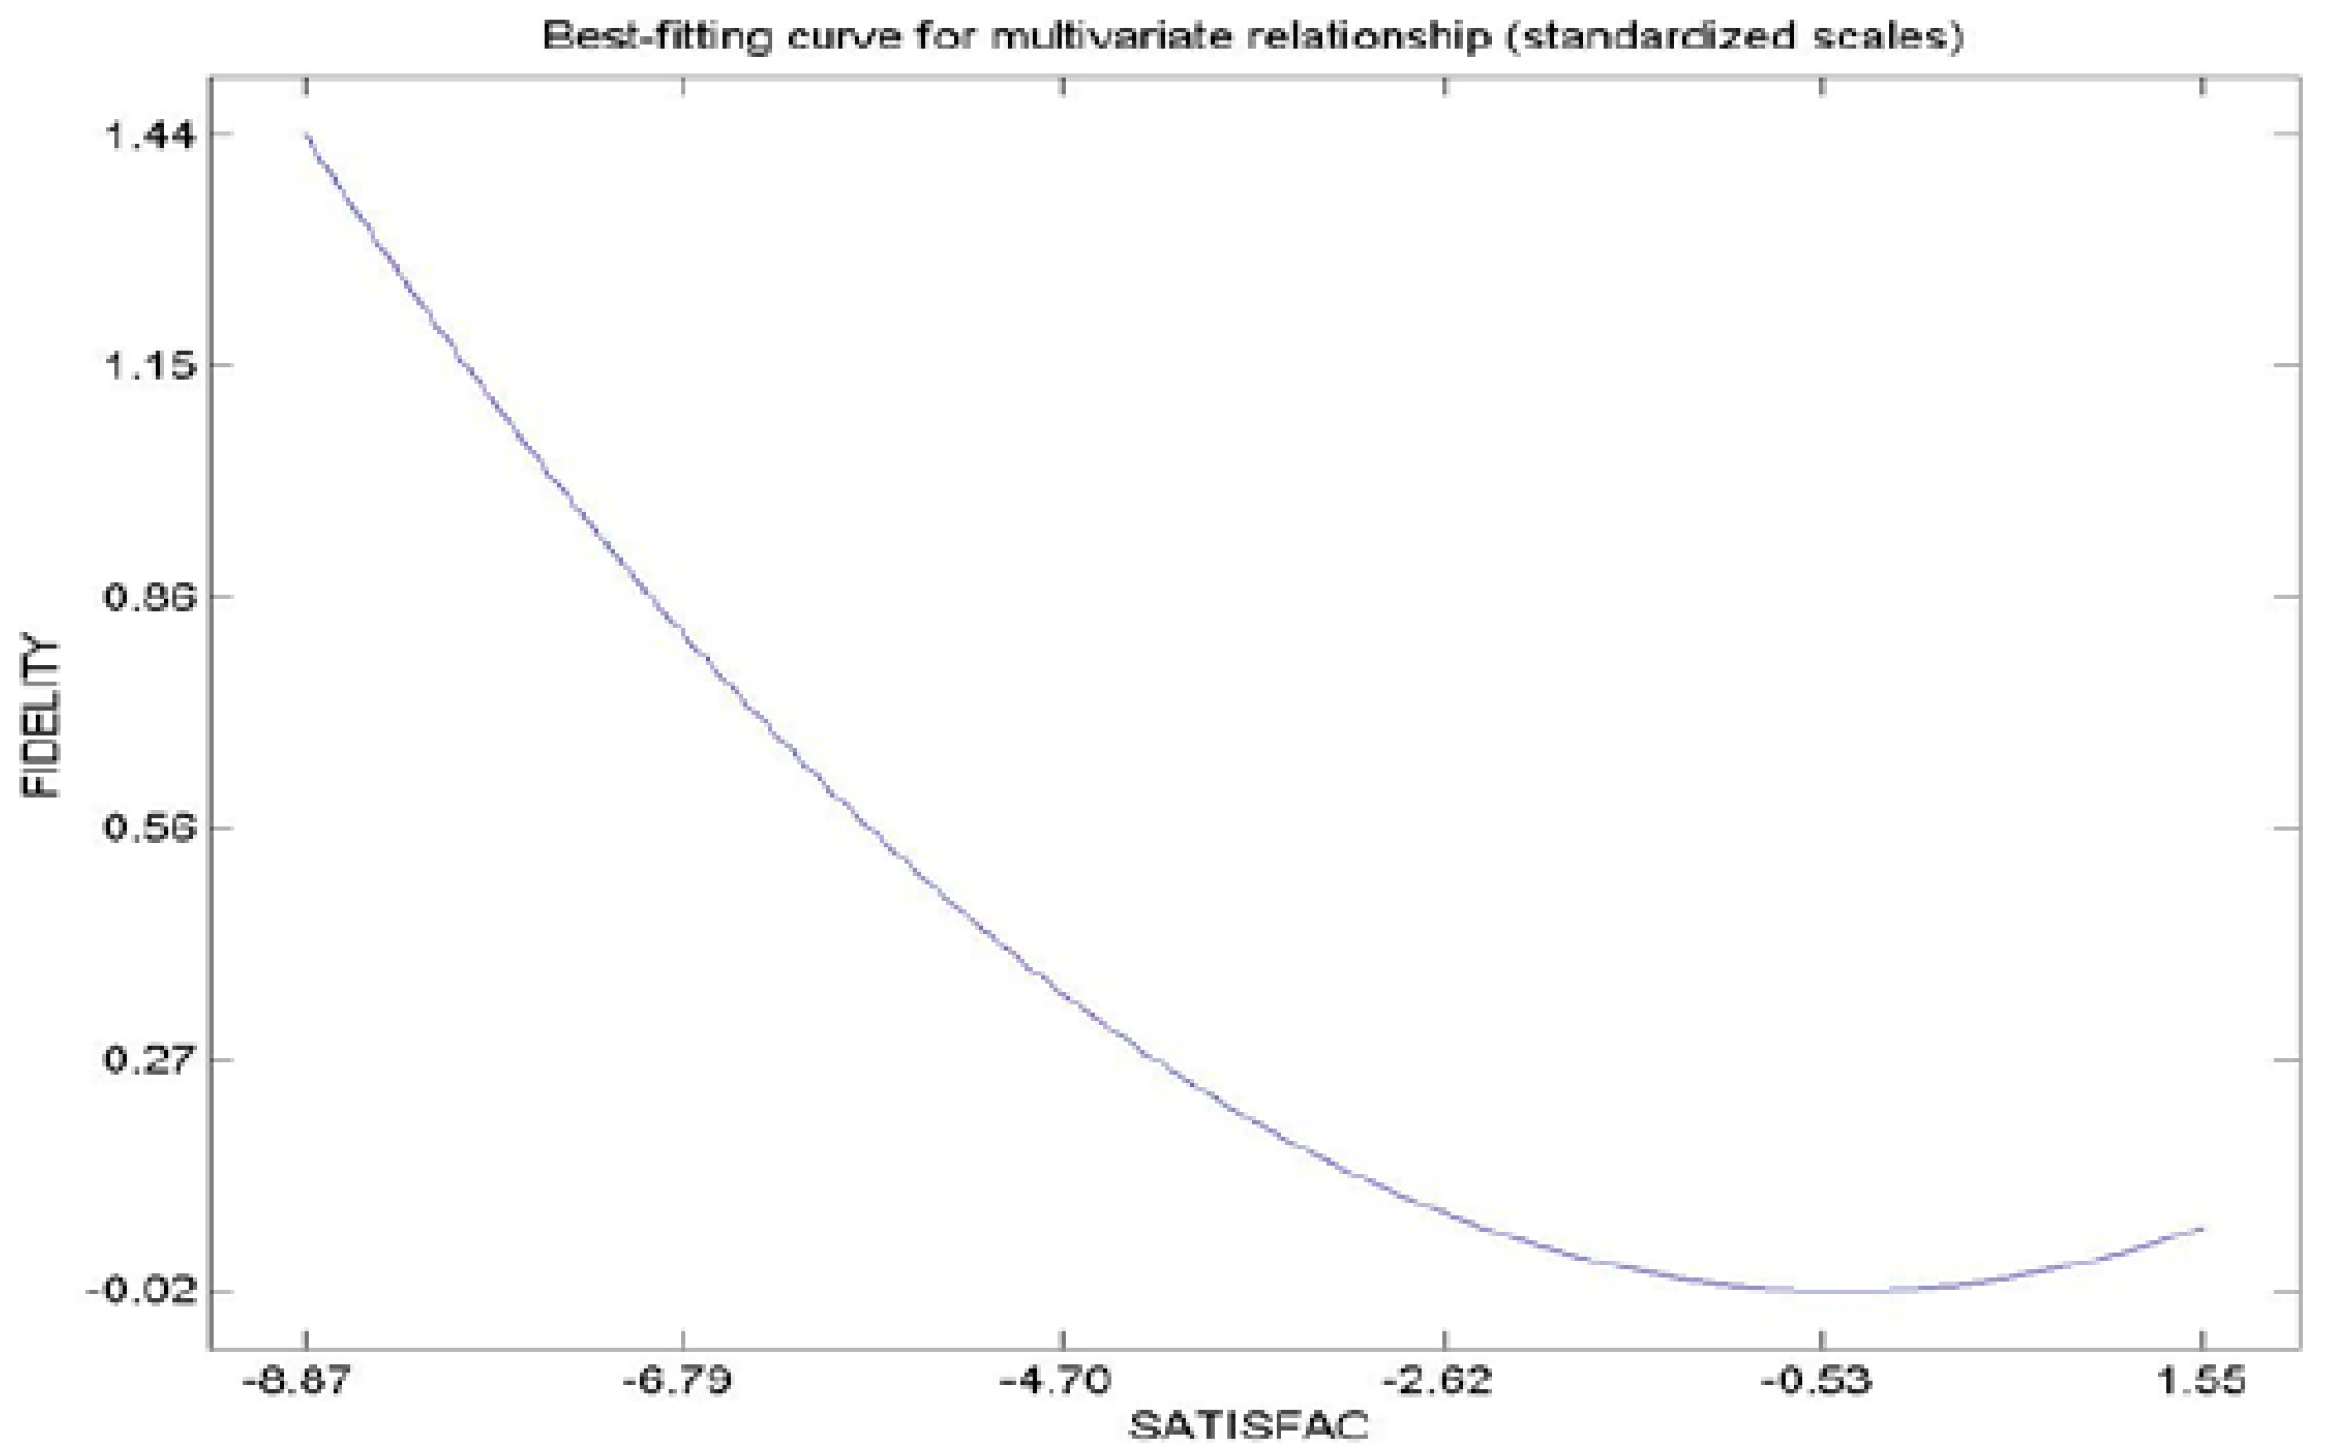
| H11 | Satisfaction → Fidelity (β = −0.06, p < 0.01) | Confirmed hypothesis. |
| H12 | Organization of the trip → Fidelity (β = 0.26, p < 0.01) | Confirmed hypothesis. |
| H13 | Sociodemographic profile → Fidelity (β = 0.07, p < 0.01) | Confirmed hypothesis. |
| H14 | Activities carried out → Fidelity (β = 0.12, p < 0.01) | Confirmed hypothesis. |
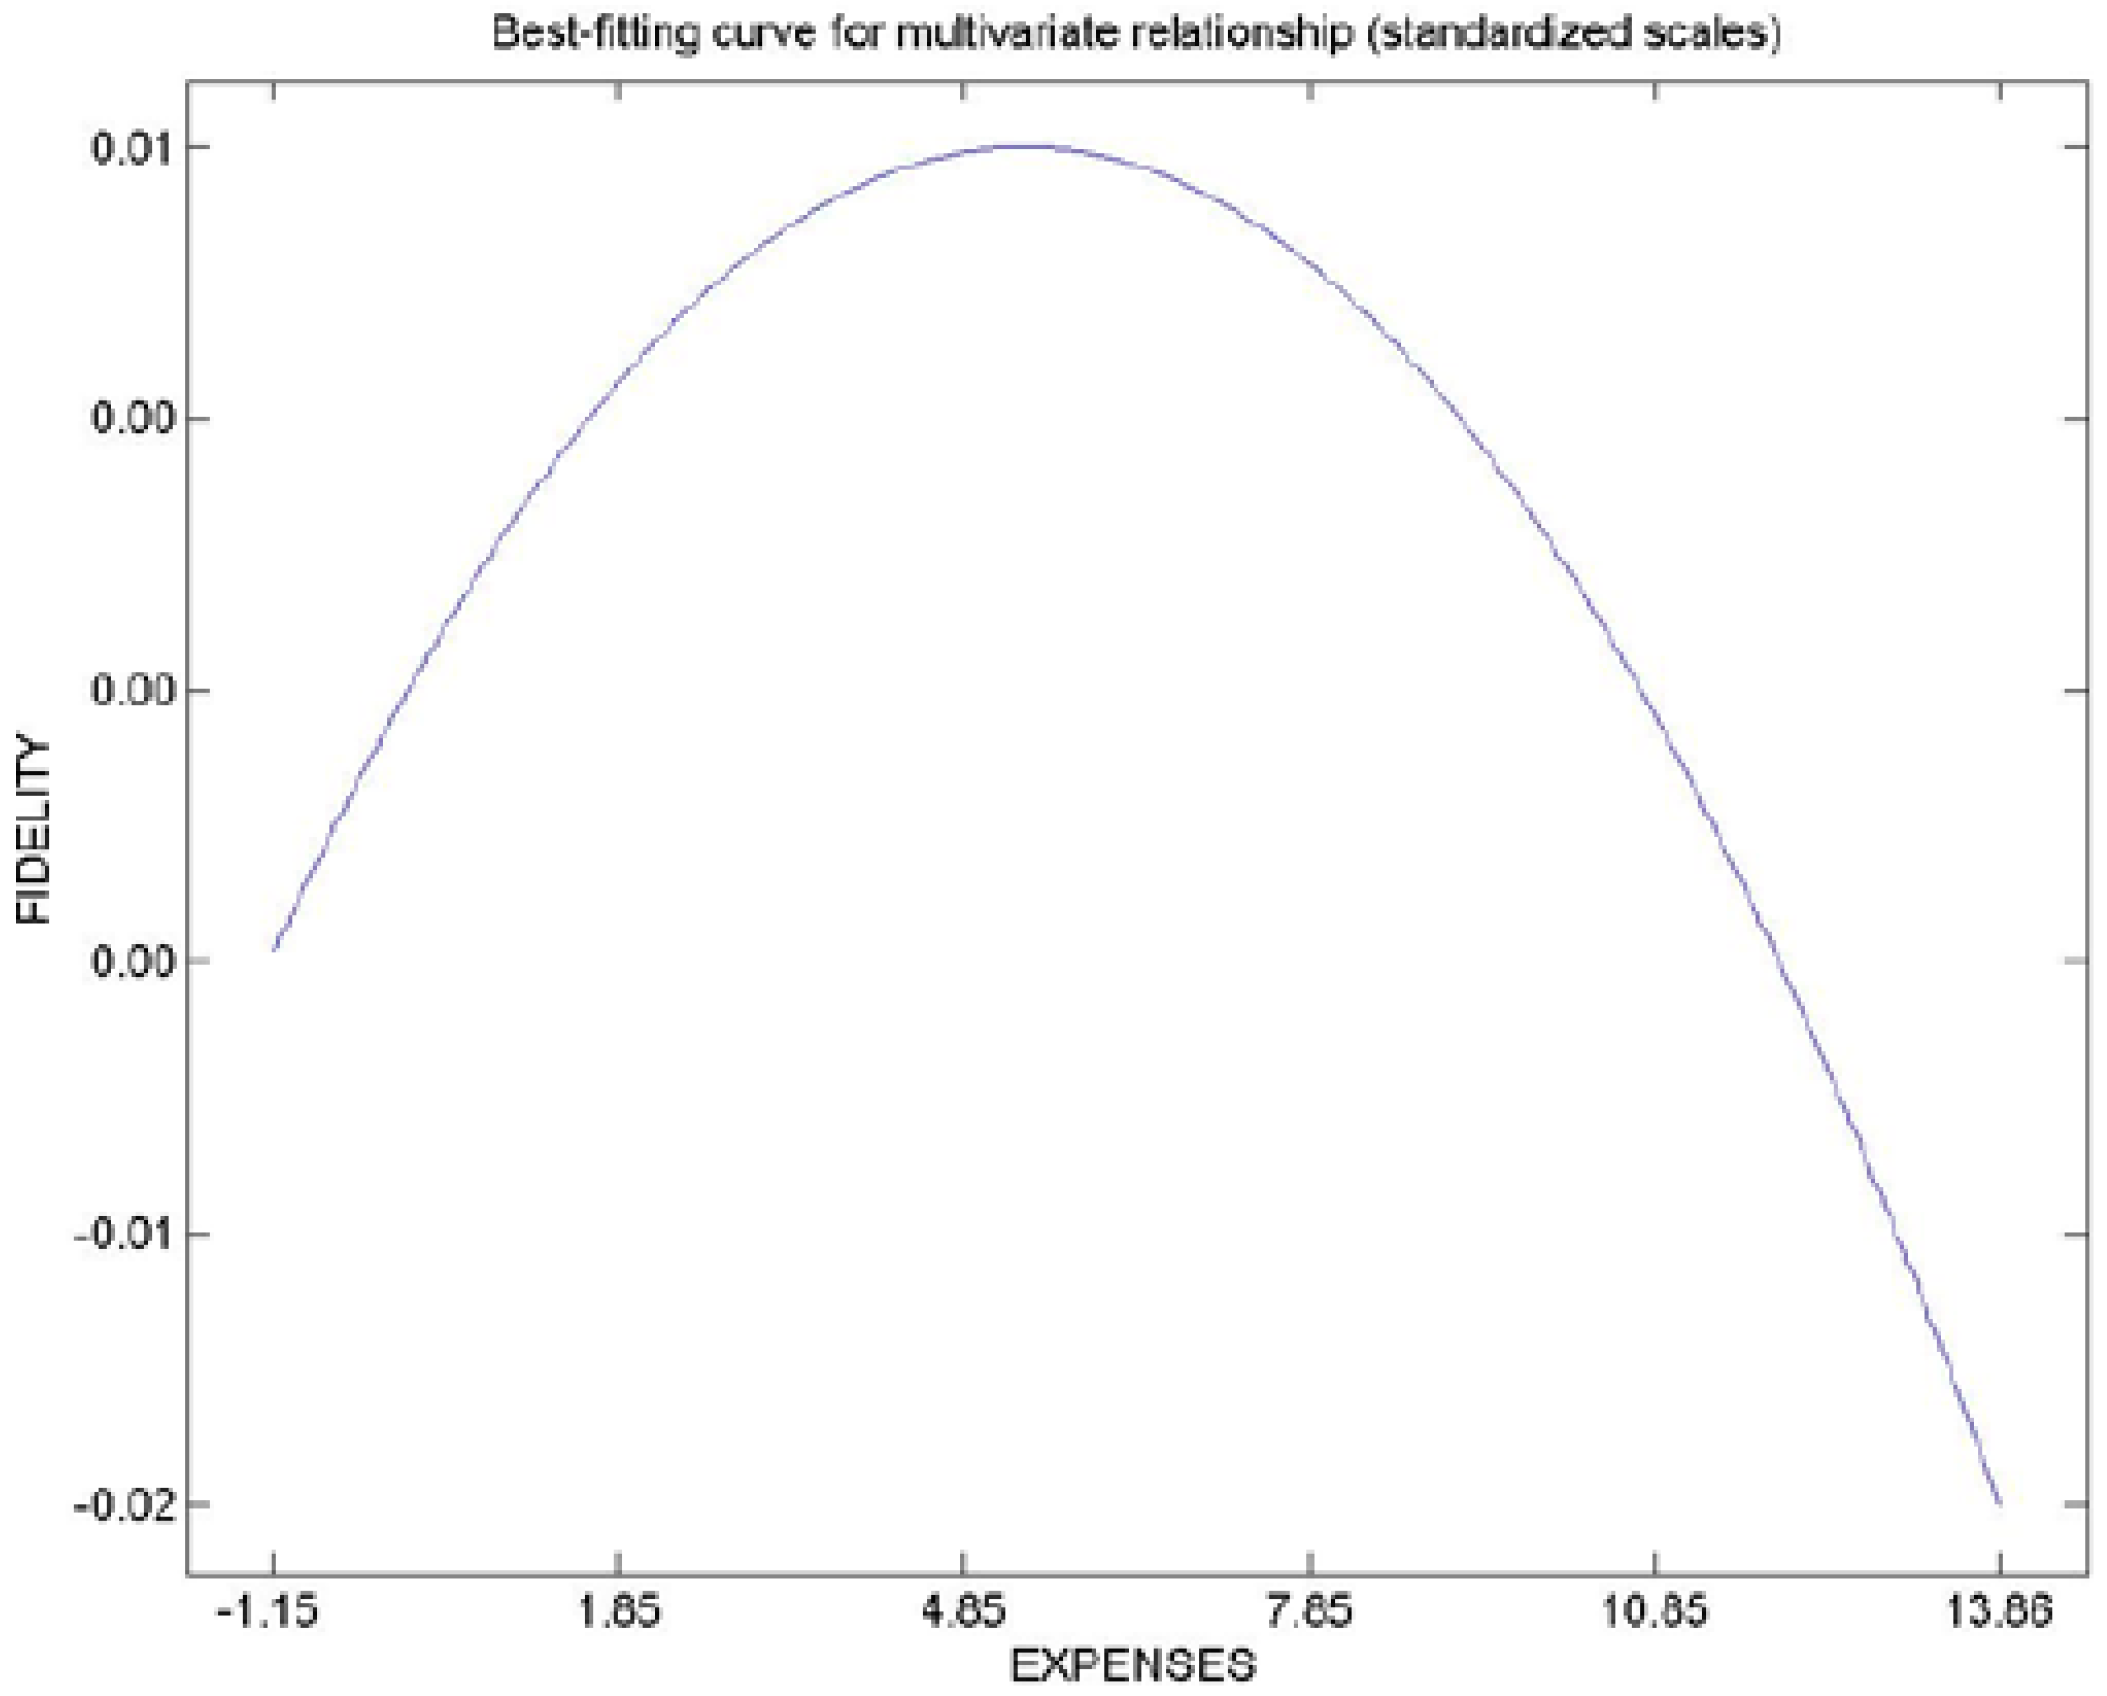
| H15 | Spending before and during the trip → Loyalty (β = 0.00, p = 0.29) | Unconfirmed hypothesis. |
Publisher’s Note: MDPI stays neutral with regard to jurisdictional claims in published maps and institutional affiliations. |
© 2021 by the authors. Licensee MDPI, Basel, Switzerland. This article is an open access article distributed under the terms and conditions of the Creative Commons Attribution (CC BY) license (https://creativecommons.org/licenses/by/4.0/).
Share and Cite
Sánchez-Sánchez, M.-D.; Pablos-Heredero, C.D.; Montes-Botella, J.-L. The Internal Demand of Cultural Tourism: Understanding Satisfaction and Fidelity to Destination in Spain through a Non-Linear Structural Model. Sustainability 2021, 13, 13487. https://0-doi-org.brum.beds.ac.uk/10.3390/su132313487
Sánchez-Sánchez M-D, Pablos-Heredero CD, Montes-Botella J-L. The Internal Demand of Cultural Tourism: Understanding Satisfaction and Fidelity to Destination in Spain through a Non-Linear Structural Model. Sustainability. 2021; 13(23):13487. https://0-doi-org.brum.beds.ac.uk/10.3390/su132313487
Chicago/Turabian StyleSánchez-Sánchez, María-Dolores, Carmen De Pablos-Heredero, and José-Luis Montes-Botella. 2021. "The Internal Demand of Cultural Tourism: Understanding Satisfaction and Fidelity to Destination in Spain through a Non-Linear Structural Model" Sustainability 13, no. 23: 13487. https://0-doi-org.brum.beds.ac.uk/10.3390/su132313487