
Overall Efficiency of On-Site Production and Storage of Solar Thermal Energy

 ,
,  ,
,  , ,
, , 
Abstract
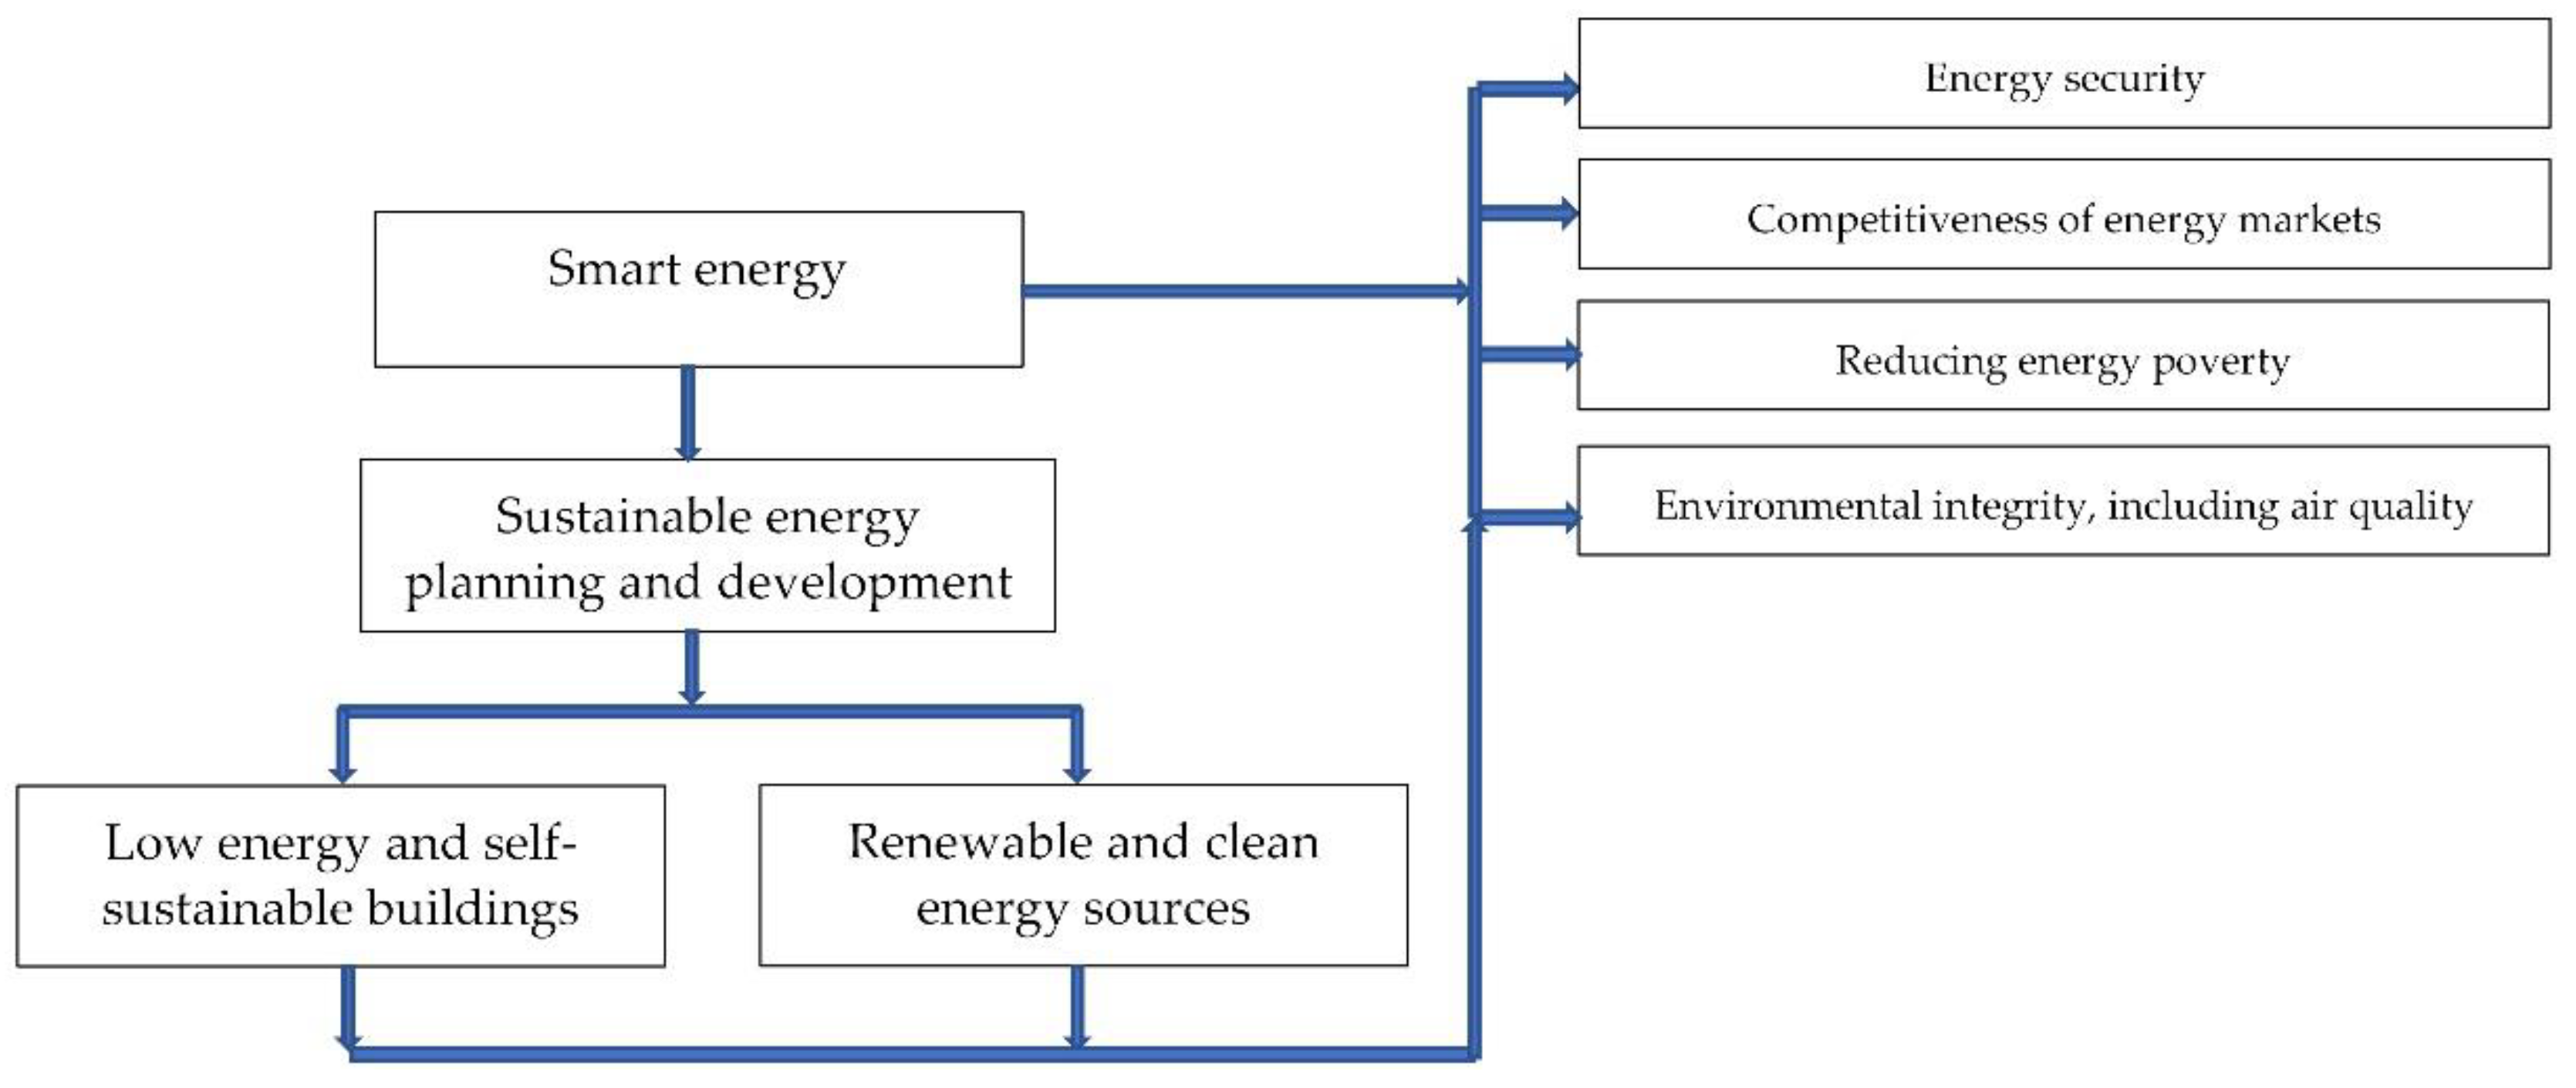
:1. Introduction
- Energetic security;
- Competitiveness of the energy markets;
- Reducing energy poverty and protection of the vulnerable consumer;
- Environmental protection, including of the air quality.
2. Materials and Methods
2.1. Criteria Description, Energy Performance Indicators
- C1.
- Indicator of conventional annual primary energy,
- C2.
- RES harnessing indicator in the building,
- C3.
- RES participation in thermoenergetic systems, and annual solar fraction,
- C4.
- Solar collector field efficiency,
- C5.
- Solar collector yield, ηc
- C6.
- Annual global energy efficiency of the hybrid heating system,
- C7.
- Specific indicator of equivalent emissions, emCO2, in kgCO2 equiv./(m2 year)
- R1.
- Covering the building’s heat demand throughout the calendar year;
- R2.
- Land use footprint.
2.2. Multicriteria Analysis
- To minimize criteria C1, C7;
- To maximize criteria C2–C6, as previously defined.
3. Case Study Framework
3.1. Buildings as Thermal Consumers
- Outdoor conventional temperature for heating is −15 °C, the average temperature of ground is +10 °C, and the wind calculation velocity is considered 4 m/s;
- The average number of days-degrees of calculation is 3150 degree days at tex = +12 °C and 2990 degree days at tex = +10 °C. The starting and duration of the heating period is not the same for all buildings. In the case of the district heating system, threshold values for outdoor temperatures that marks the starting and the ending of the heating period are tex = +10–12 °C, accordingly to the buildings specifications, recorded three days in a row;
- The average duration of the conventional heating periods are 195 days at tex = +12 °C and 175 days at tex = +10 °C;
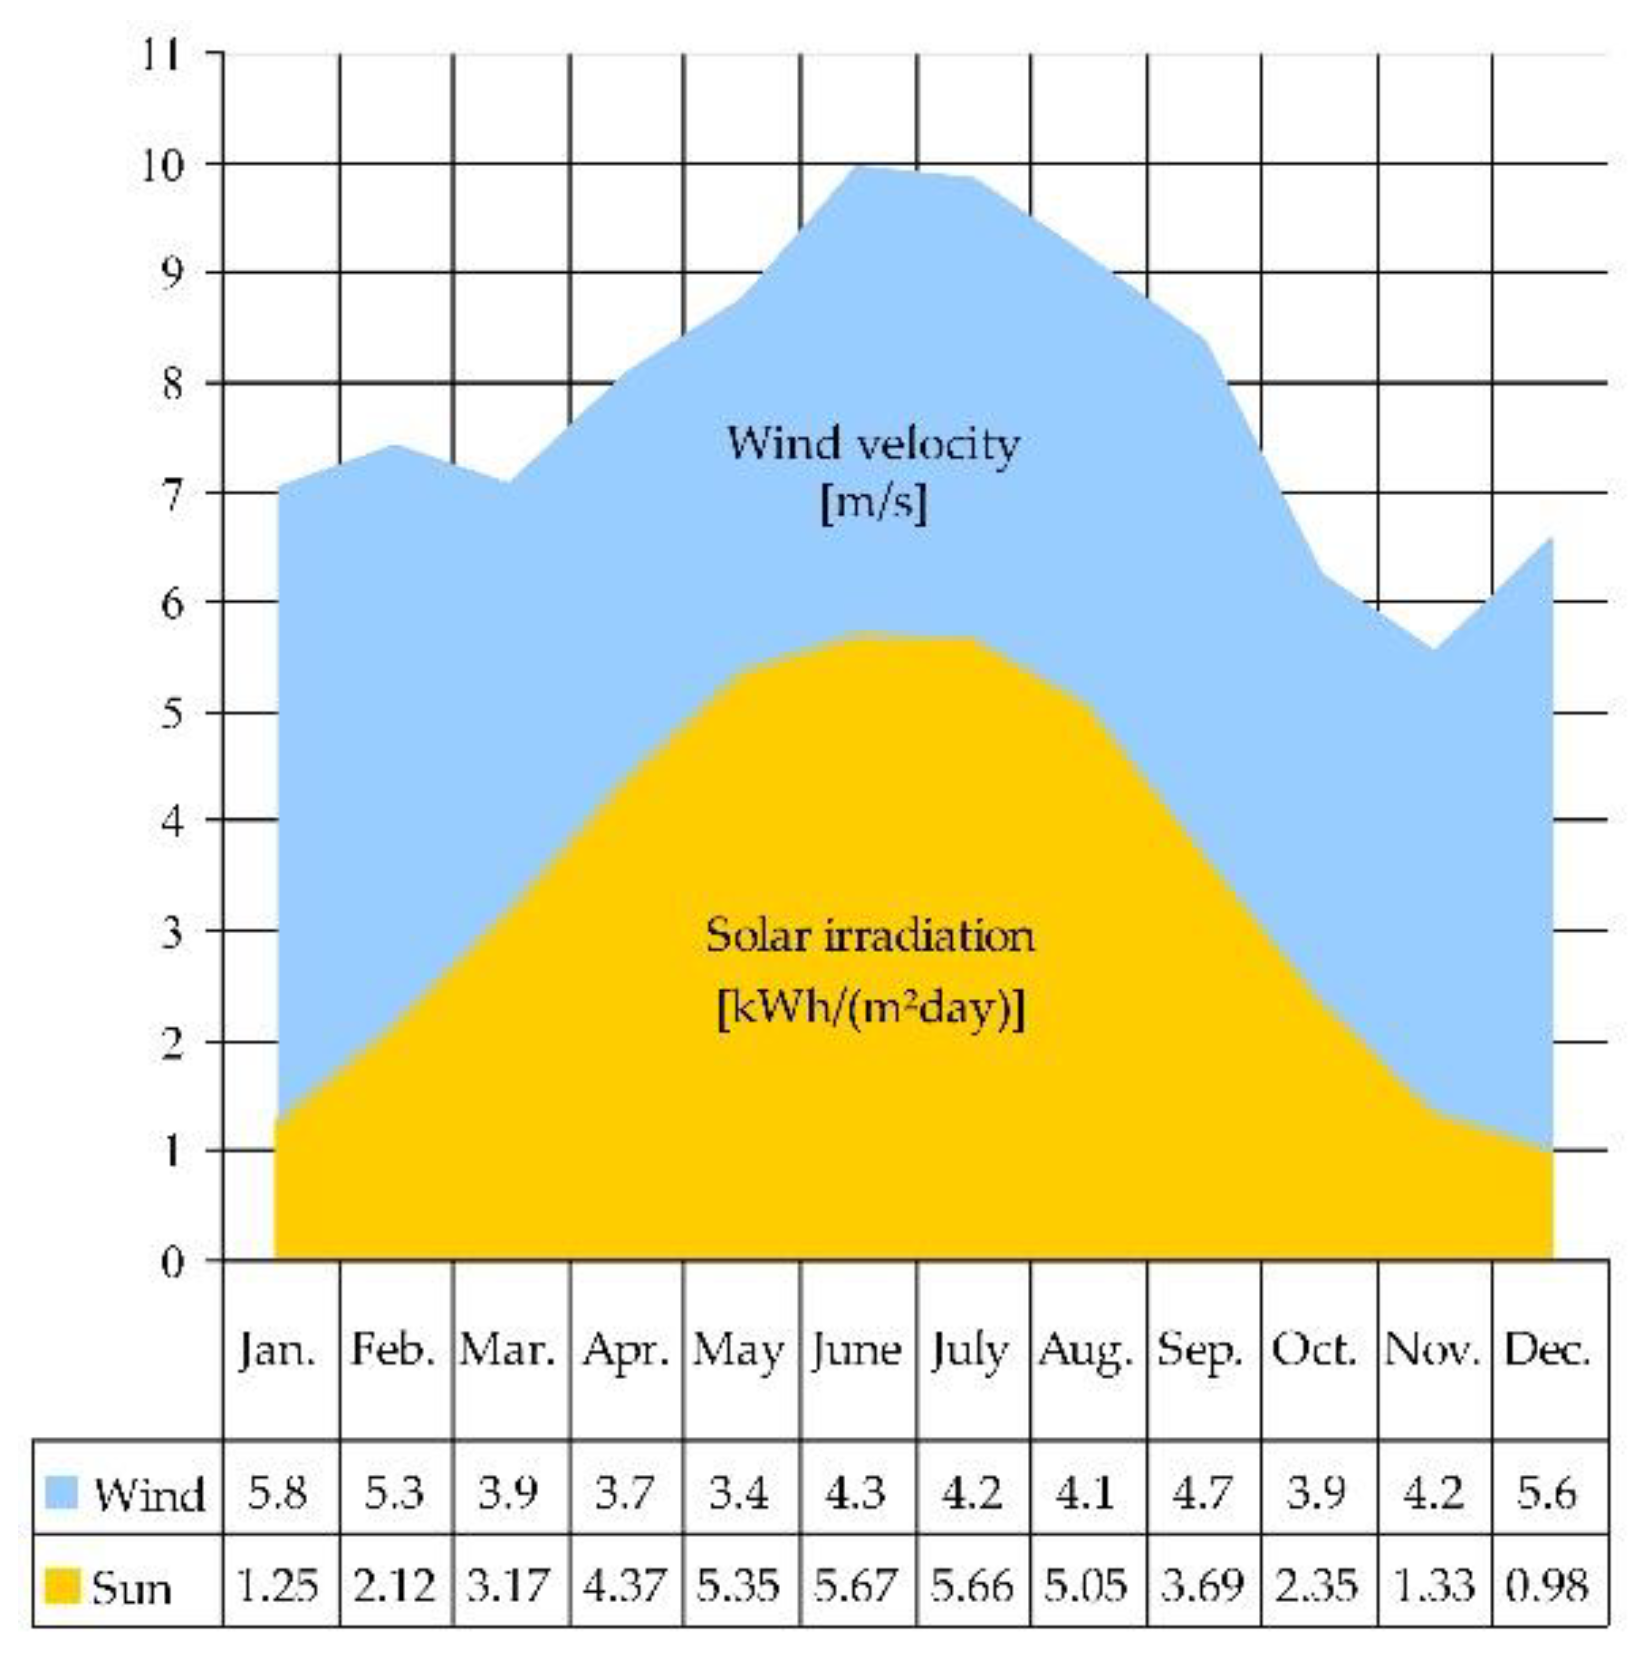
- The annual average of solar radiation is 1150–1250 kWh/m2, and the annual duration of sunlight is 2000–2100 h/year, depending on location.
- Residential (condominium): 90 L/person per day;
- Commercial/Administrative (Offices): 4 L/person per work shift;
- Industrial: 25–57 L/person per work shift.
3.2. On-Site Solar Resource
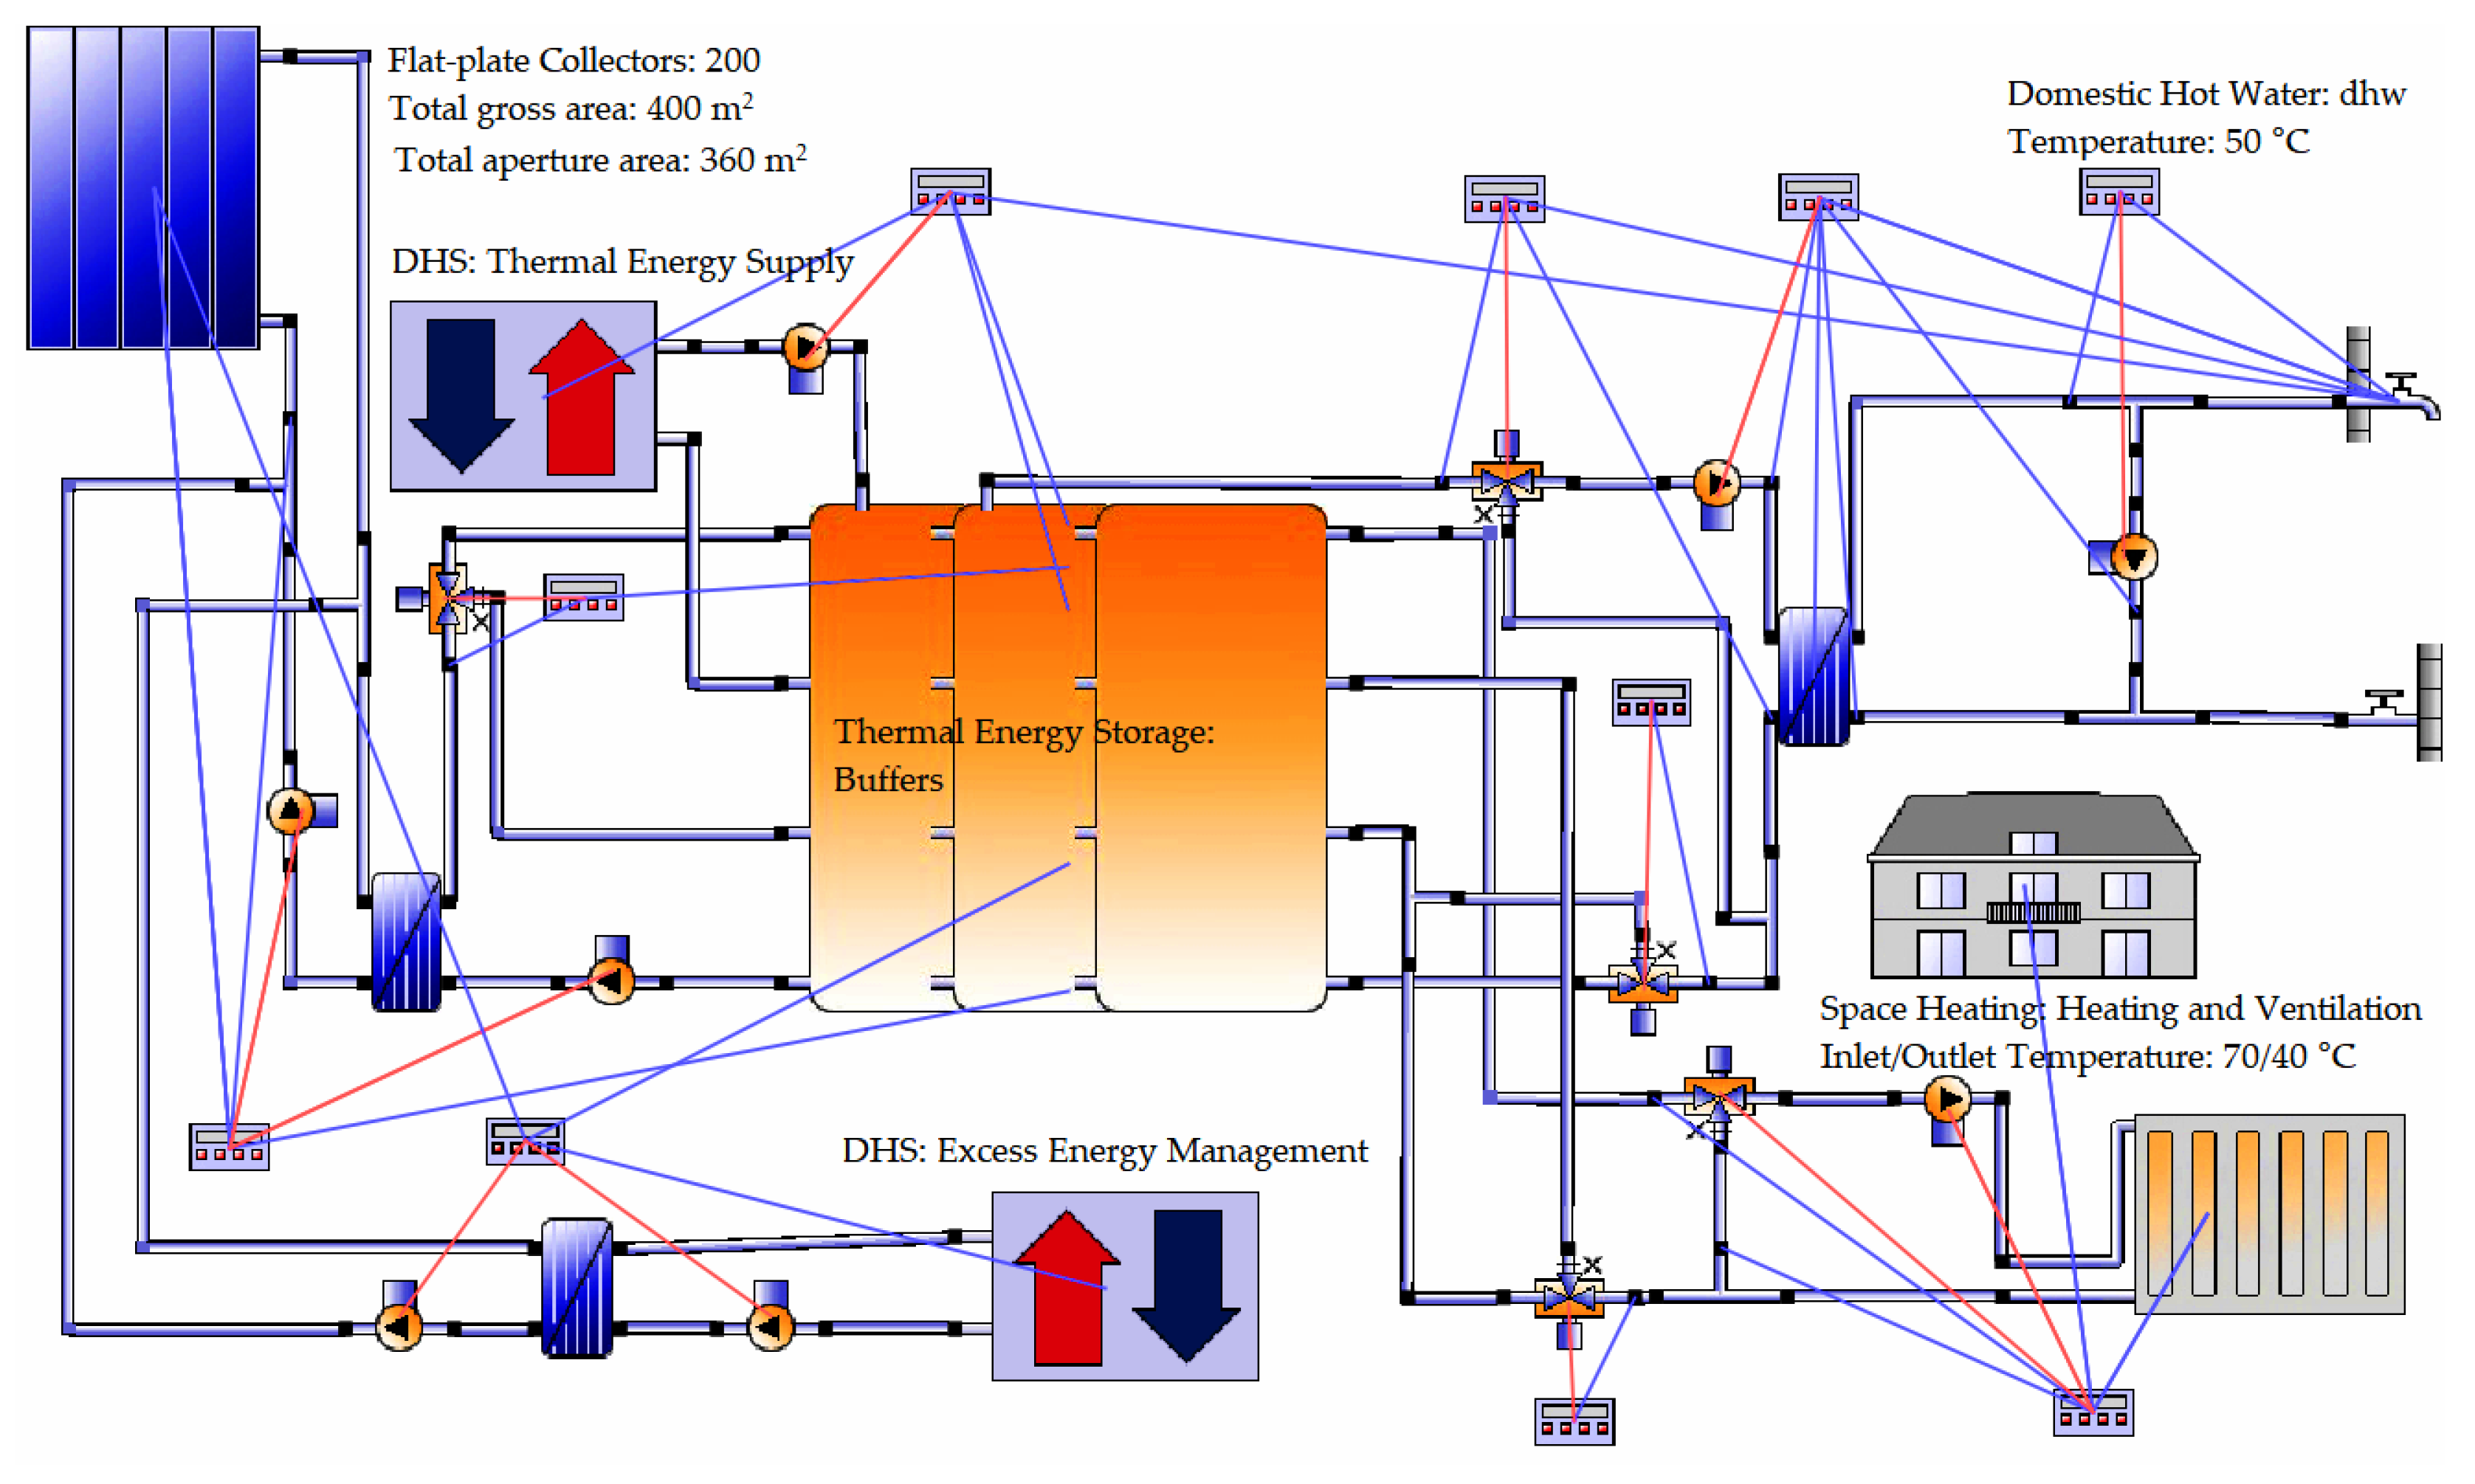
3.3. Hybrid Heating Systems’ Configuration
- The B3 system, characterized by the maximum solar fraction, achieves low values of efficiencies related to the collector field (, ηc) and high values of the global efficiency of the hybrid heating system (), respectively, of RES use efficiency in buiding ();
- Highest values of yield, ηc, and were obtained in the case of residential buildings with the highest dhw consumptions, compared to administrative, commercial, and industrial buildings.
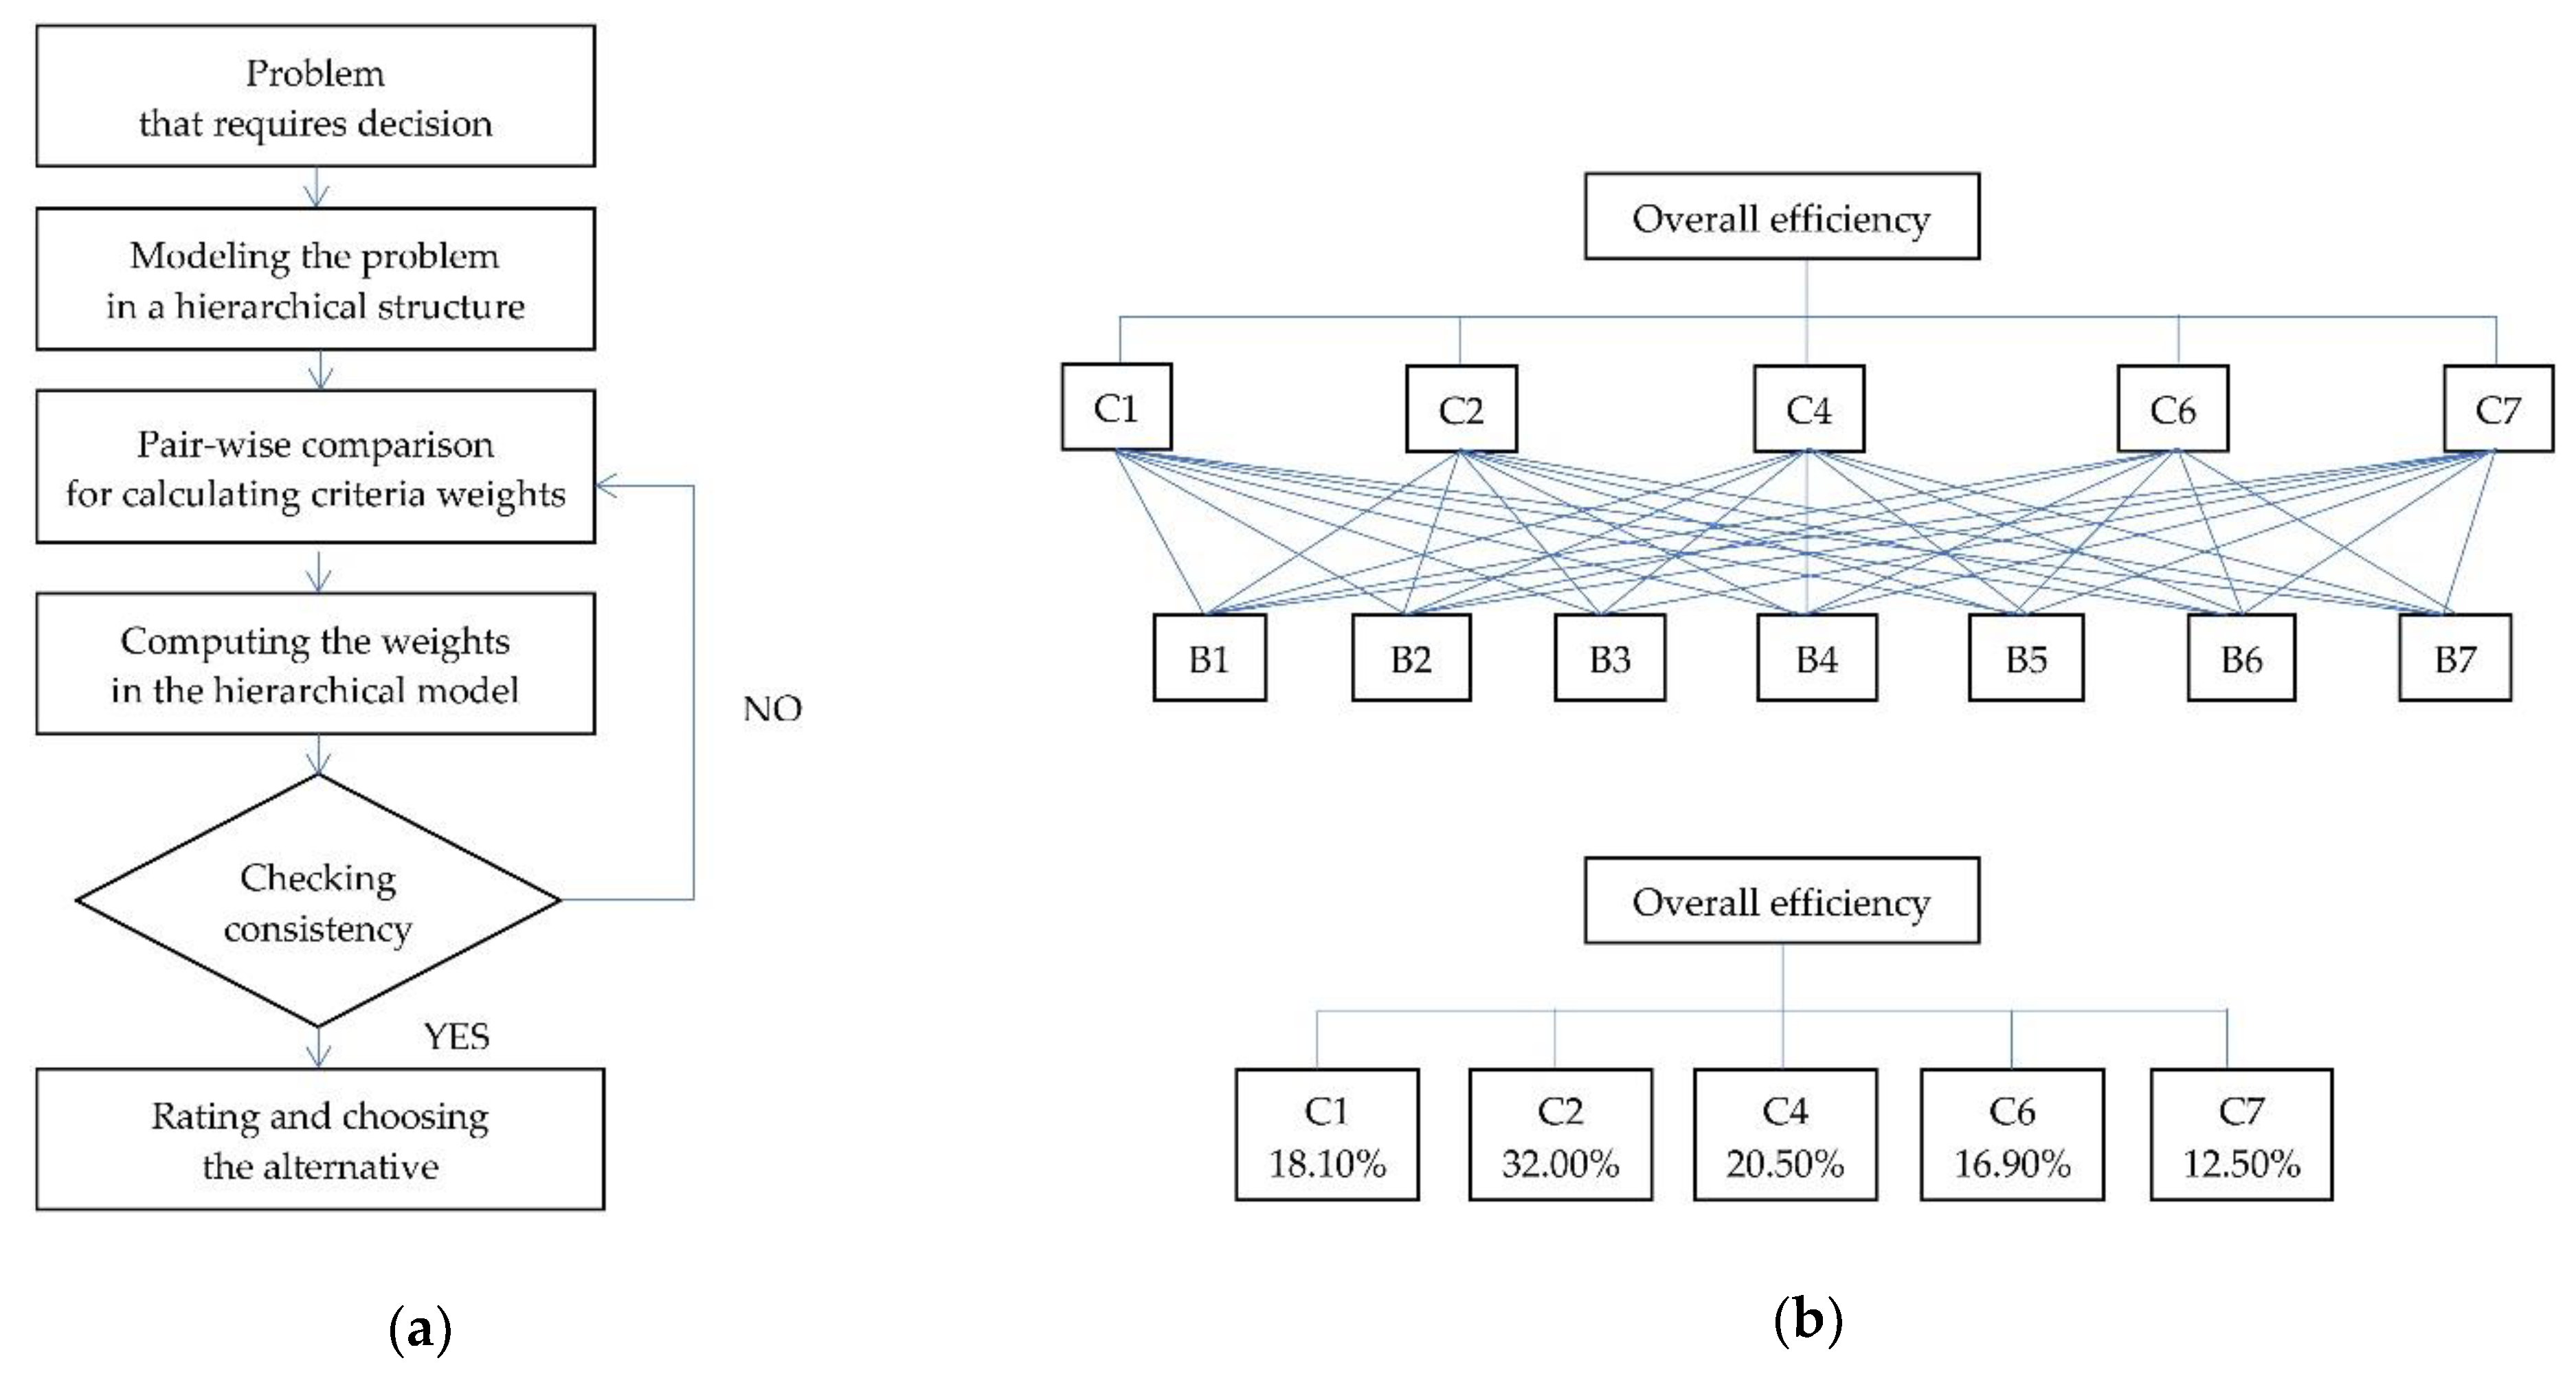
4. Multicriteria Hierarchical Method
4.1. Method Description
4.2. Overall Efficiency Ranking
5. Results
6. Conclusions
- Achieving high annual solar field efficiency (C4) leads to low levels of the global energy efficiency of the hybrid heating systems (C6); B4 with = 636.0 kWh/(m2 year) and = 1.60, followed by B5 with = 618.8 kWh/(m2 year) and = 1.72. From this perspective (C6), the optimal choice seems to be B3 ( = 2.44) followed by B6 ( = 2.21);
- Ranking scenarios by global energy efficiency of the hybrid heating systems (C6) does not always coincide with the rank by specific indicator of equivalent emissions (C7). Pursuant to C7, B6 (emCO2 = 8.13 kgCO2/(m2 year)) and B1 (emCO2 = 8.68 kgCO2/(m2 year)) ranks ahead of B3 (emCO2 = 9.89 kgCO2/(m2 year)). In this perspective, the optimal choice seems to be B6;
- Ranking scenarios by overall efficiency leads to residential buildings characterized by high dhw consumptions, B6 followed by B3;
- Ranking scenarios by overall efficiency leads to the B6 as a first scenario, a residential building characterized by the lowest compactness ratio (0.25 m−1);
- It can be seen that the ranking by overall efficiency coincides with the ranking by specific indicator of equivalent emissions (C7), and the best environmental performances are achieved in the case of the best ranked scenario, validated by AHP.
Author Contributions
Funding
Institutional Review Board Statement
Informed Consent Statement
Data Availability Statement
Conflicts of Interest
Abbreviations
| AHP | analytic hierarchy process |
| ANP | analytic network process |
| DHS | district heating system |
| dhw | domestic hot water |
| energye | electric energy |
| energyt | thermal energy |
| nZEB | nearly zero-energy building |
| RES | renewable energy sources |
| RES-S | renewable energy sources–solar |
Nomenclature
| aperture area of the solar collector field (m2) | |
| Ah | heated area of the building (m2) |
| Ac | gross area of the solar collector field (m2) |
| CI | consistency index (-) |
| CR | consistency rate (-) |
| Edel,i,j | final energy, annually delivered to the building, related to the renewable energy source/conventional fuel of type “i”, “j” (kWh/year) |
| Eexp,i,j | annually on-site generated energy, at the level of building or nearby, and redirected into the district heating system, related to the renewable energy/conventional fuel of type “i”, “j” (kWh/year) |
| annual global energy efficiency of the hybrid heating system (-) | |
| solar collector field efficiency (kWh/(m2 year)) | |
| Econv,j | annual energy, delivered to the building from conventional energy sources of type “j” (kWh/year) |
| emCO2 | specific indicator of equivalent emissions (kgCO2equiv./(m2 year)) |
| Ep | annual consumption of electricity (pumping, automation, and control system) (kWh/year) |
| Epconv | annual consumption of primary energy (electricity and fuels energy) of the conventional heating sources (kWh/year) |
| indicator of annual conventional primary energy (kWh/(m2 year)) | |
| annual consumptions of primary conventional energy type “j”, electricity and fuels energy (kWh/year) | |
| EpRES | annual primary energy, obtained from renewables and used in the building (kWh/year) |
| CO2equiv. emission factor, related to the energy type “j” (kgCO2equiv./kWh) | |
| fi,j | conversion factor into the primary energy, of the final energy of type “i”, “j” (-) |
| annual solar fraction (%) | |
| G | global coefficient of thermal insulation of building (W/(m3K)) |
| Ib | direct solar irradiation on the collector area (kWh/year) |
| Ic | irradiation onto the collector area (MWh/year) |
| Id | diffuse irradiation normal on the tilted surface of the collector (kWh/year) |
| Ir | reflected irradiation normal on the tilted surface of the collector (kWh/year) |
| indicator of RES harnessing in building (-) | |
| Is,equiv. | indicator of equivalent area (-) |
| kw,i, kw,j, | weight coefficients (%) |
| annual conventional energy to the system (kWh/year) | |
| Energy, annually delivered into the district heating network, consisting in excess energy generated by solar resource (kWh/year) | |
| annual specific thermal energy consumption for space heating, ventilation and dhw (kWh/(m2 year)) | |
| annual thermal energy demand/consumption for space heating, ventilation, and dhw (MWh/year) | |
| annual thermal energy related to RES (kWh/year) | |
| annual solar thermal energy to the system (kWh/year) | |
| Rb | ratio of beam radiation on the tilted surface to that on a horizontal surface; the geometric factor (-) |
| RI | random index (-) |
| tex | outdoor conventional temperature for heating (°C) |
| RES participation in the thermoenergetic system (%) | |
| β | tilt angle of the collector (°) |
| ηc | solar collector yield (%) |
| eigenvalue (-) | |
| ρ | albedo coefficient (-) |
References
- International Energy Agency (IEA). Data and Statistics. Available online: www.iea.org/data-and-statistics (accessed on 14 August 2020).
- National Energy Regulatory Authority (ANRE). Report Regarding the Results of the Electricity Market Monitoring in December 2019. Available online: www.anre.ro (accessed on 14 August 2020).
- International Energy Agency (IEA). World Energy Outlook. 2019. Available online: https://www.iea.org/reports/world-energy-outlook-2019 (accessed on 21 July 2020).
- Eurostat. Energy, Transport and Environment Indicators. 2018. Available online: https//ec.europa.eu/Eurostat (accessed on 22 July 2020).
- Eurostat. Energy, Transport and Environment Statistics. 2019. Available online: https//ec.europa.eu/Eurostat (accessed on 22 July 2020).
- Eurostat. Manual for Statistics on Energy Consumption in Households. Available online: https//ec.europa.eu/Eurostat (accessed on 22 July 2020).
- Ministry of Energy. Strategy of Romania 2016–2030 with the Perspective of the Year 2050; Ministry of Energy: Bucharest, Romania, 2016. Available online: https://energie.gov.ro (accessed on 22 July 2020).
- Zeljković, Č.; Mršić, P.; Erceg, B. Simulation Based Energy Assessment of PV Systems Installed in an Urban Environment. In Proceedings of the 20th International Symposium Power Electronics, Novi Sad, Serbia, 23–26 October 2019. [Google Scholar]
- Atănăsoae, P. Technical and Economic Assessment of Micro-Cogeneration Systems for Residential Applications. Sustainability 2020, 12, 1074. [Google Scholar] [CrossRef] [Green Version]
- Qerimi, D.; Dimitrieska, C.; Vasilevska, S.; Rrecaj, A. Modeling of the Solar Thermal Energy Use in Urban Areas. Civ. Eng. J. 2020, 6, 1349–1367. [Google Scholar] [CrossRef]
- Paraschiv, S.; Nicoleta Bărbuţă-Mişu, N.; Paraschiv, L.S. Technical and economic analysis of a solar air heating system integration in a residential building wall to increase energy efficiency by solar heat gain and thermal insulation. Energy Rep. 2020, 6. [Google Scholar] [CrossRef]
- Buildings Performance Institute Europe. Renovation of Romania. In A Strategy for the Sustainable Renovation of the Buildings Fund in Romania; BPIE: Brussels, Belgium, 2014; Available online: www.bpie.eu (accessed on 14 August 2020).
- National Institute of Statistics. Residential Fund. Year 2019; National Institute of Statistics: Bucharest, Romania, 2020. Available online: https://insse.ro (accessed on 14 August 2020).
- Așchilean, I.; Giurca, I. Choosing a water distribution pipe rehabilitation solution using the analytical network process method. Water 2018, 10, 484. [Google Scholar] [CrossRef] [Green Version]
- Chen, Z.; Clements-Croome, D.; Hong, J.; Li, H.; Xu, Q. A multicriteria lifespan energy efficiency approach to intelligent building assessment. Energy Build. 2006, 38, 393–409. [Google Scholar] [CrossRef]
- Cheng, E.; Li, H. Analytic Network Process Applied to Project Selection. J. Constr. Eng. Manag. 2005, 131, 459–466. [Google Scholar] [CrossRef]
- Aciu, C.; Manea, D.L.; Striletchi, C. The ECCOMAT program for the selection of ecological materials in order to ensure a healthy built environment. Procedia Technol. 2015, 19, 490–497. [Google Scholar] [CrossRef] [Green Version]
- Alyamani, R.; Long, S. The Application of Fuzzy Analytic Hierarchy Process in Sustainable Project Selection. Sustainability 2020, 12, 8314. [Google Scholar] [CrossRef]
- Mardani, A.; Jusoh, A.; Zavadskas, E.K.; Cavallaro, F.; Khalifah, Z. Sustainable and Rwenewable Energy: An Overview of the Application of Multiple Criteria Decision Making Techniquea and Approaches. Sustainability 2015, 7, 13497–13984. [Google Scholar] [CrossRef] [Green Version]
- Abdelazim, A.; Ibrahim, A.; Aboul-Zahab, E. Development of an energy efficiency rating system for existing buildings using Analytic Hierarchy Process—The case of Egypt. Renew. Sust. Energy Rev. 2017, 71, 414–425. [Google Scholar] [CrossRef]
- Doczy, R.; AbdelRazig, Y. Green Buildings Case Study Analysis Using AHP and MAUT in Sustainability and Costs. J. Archit. Eng. 2017, 23. [Google Scholar] [CrossRef]
- Hatefi, S.M. Intelligent Building Assessment Based on an Integrated Model of Fuzzy Analytic Hierarchy Process and Fuzzy Preference Degree Approach (FAHP-FPDA). Int. J. Optim. Civ. Eng. 2019, 9, 79–92. [Google Scholar]
- Xu, L.; Yang, J.-B. Introduction to Multi-Criteria Decision Making and the Evidential Reasoning Approach; Working Paper No. 0106; Manchester School of Management: Manchester, UK, 2001; ISBN 186115111X. [Google Scholar]
- Zarchi, A.K.; Marthandan, G.; Eshaghi, M. An Analytical Hierarchically Process (AHP) based Approach for Promoting Green Buildings among the Citizens of Next Generation in Malaysia. In Proceedings of the 2012 International Conference on Economics, Business and Marketing Management, Singapore, 26–28 February 2012; IACSIT Press: Singapore, 2012; pp. 88–93. [Google Scholar]
- Erdogmus, S.; Aras, H.; Koç, E. Evaluation of alternative fuels for residential heating in Turkey using analytic network process (ANP) with group decision-making. Renew. Sustain. Energy Rev. 2006, 10, 269–279. [Google Scholar] [CrossRef]
- Erdogan, S.; Sayin, C. Selection of the Most Suitable Alternative Fuel Depending on the Fuel Characteristics and Price by the Hybrid MCDM Method. Sustainability 2018, 10, 1583. [Google Scholar] [CrossRef] [Green Version]
- Giurca, I.; Badea, G.; Așchilean, I.; Naghiu, G.S.; Megyesi, E. Selecting the number and size of boilers used within the heating units of the residential complexes. Energy Procedia 2017, 112, 134–141. [Google Scholar] [CrossRef]
- Hatefi, S.M.; Tamošaitienè, J. Construction Projects Assessment Based on the Sustainable Development Criteria by an Integrated Fuzzy AHP and Improved GRA Model. Sustainability 2018, 10, 991. [Google Scholar] [CrossRef] [Green Version]
- Șoimoșan, T.M.; Moga, L.M.; Danku, G.; Căzilă, A.; Manea, D.L. Assessing the Energy Performance of Solar Thermal Energy for Heat Production in Urban Areas: A case study. Energies 2019, 12, 1088. [Google Scholar] [CrossRef] [Green Version]
- Saaty, T.L. Decision making with the analytic hierarchy process. Int. J. Serv. 2008, 1. [Google Scholar] [CrossRef] [Green Version]
- Saaty, T.L. Relative Measurement and its Generalization in Decision Making: Why Pairwise Comparisons are Central in Mathematics for the Measurement of Intangible Factors—The Analytic Hierarchy/Network Process. Madr. Rev. R. Span. Acad. Sci. Ser. A Math. 2008, 102, 251–318. Available online: http://www.rac.es/ficheros/doc/00576.PDF (accessed on 5 January 2021). [CrossRef]
- ASRO. Heating installations. Heating demand calculation. In Romanian Standard Indicative SR 1907-1,2/2014; Rev. 2016; ASRO: Bucharest, Romania, 2016. [Google Scholar]
- Ministerul Dezvoltării Regionale și Turismului. Standard Regarding Thermotechnical Calculation of Construction Elements of the Building; Completed by Ord. no. 2513/2010; Ministerul Dezvoltării Regionale și Turismului: București, Romania, 2011.
- Șoimoșan, T.M.; Felseghi, R.A. Efficient Solar Technique for Buildings Connected to the District Heating System. Indicators of Performance. In Proceedings of the 16th International Multidisciplinary Scientific GeoConference SGEM Vienna GREEN 2016, Vienna, Austria, 30 June–6 July 2016. [Google Scholar]
- Basemap Open Source ESRI. Available online: www.esri.com (accessed on 6 January 2021).
- Moga, L.; Moga, I. Analytic study of thermal bridges met at high performance energy efficient buildings. In Proceedings of the 18th International Multidisciplinary Scientific GeoConference SGEM2018, Albena, Bulgaria, 30 June–9 July 2018. [Google Scholar]
- Moga, L. Thermal performance of insulating glazing units established by infrared thermography. IOP Conf. Ser. Mater. Sci. Eng. 2019, 586, 1–8. [Google Scholar] [CrossRef]
- Romanian Ministry of Transport, Construction and Tourism. Calculation Methodology of the Energy Performance of Buildings, Indicative Mc 001-2006; Official Monitor: Bucharest, Romania, 2006.
- Atmospheric Science Data Center (ASDC). Surface Meteorology and Solar Energy, RETScreen Report. 2015. Available online: earthdata.nasa.gov (accessed on 31 August 2015).
- Vela Solaris AG. Polysun Designer; Vela Solaris AG: Winthertur, Switzerland, 2020. [Google Scholar]
- Duffie, J.A.; Beckman, W.A. Solar Engineering of Thermal Processes, 4th ed.; Solar Energy Laboratory, University of Wisconsin-Madison; John Wiley & Sons, Inc.: Hoboken, NJ, USA, 2013. [Google Scholar]
- Ordinance no. 2641/2017. Monitorul Oficial. 2017. Available online: http://www.aaecr.ro/wp-content/uploads/2017/04/normele-privind-calculul-performantei-energetice-a-cladirilor.pdf (accessed on 14 August 2020).
- Vargas, R.V. Using the analytic hierarchy process (ahp) to select and prioritize projects in a portfolio. In Proceedings of the PMI® Global Congress 2010, Washington, DC, USA, 9–12 October 2010. [Google Scholar]
- Ho, W.; Ma, X. The state-of-the-art integrations and applications of the analytic hierarchy process. Eur. J. Oper. Res. 2018, 267, 399–414. [Google Scholar] [CrossRef]
- Saaty, T.L. The Analytic Hierarchy Process: Planning, Priority Setting, Resource Allocation. In Multicriteria Decision Making; McGraw Hill: New York, NY, USA, 1980. [Google Scholar]


| Building | Type | Employment Regime; Operating Regime/Heat Supply Regime |
|---|---|---|
| B1 | Administrative—Offices | Discontinuous employment regime; 12/12 h—normal operating regime/guard heating and reheating regime |
| B2 | Commercial | Discontinuous employment regime; 12/12 h—normal operating regime/guard heating and reheating regime |
| Residential—Condominium | Continuous employment regime; normal operating regime | |
| B3 | Residential—Condominium | Continuous employment regime; normal operating regime |
| B4 | Residential—Condominium | Continuous employment regime; normal operating regime |
| B5 | Residential—Condominium | Continuous employment regime; normal operating regime |
| B6 | Residential—Condominium | Continuous employment regime; normal operating regime |
| B7 | Industrial—Production, Storage and Logistic | Continuous employment regime; normal operating regime |
| Industrial—Administrative | Discontinuous employment regime; 12/12 h—normal operating regime without taking into account technological energy consumption/guard heating and reheating regime |
| Building | Height Regime | Built Footprint | Built Volume | Envelope Area | Compactness Ratio | Heated Volume | Heated Area |
|---|---|---|---|---|---|---|---|
| - | - | m2 | m3 | m2 | m−1 | m3 | m2 |
| B1 | GF + 6L | 3574.7 | 18,067.9 | 4869.3 | 0.27 | 13,545.6 | 5209.9 |
| B2 | SB + GF + | 431.0 | 18,539.0 | 6473.6 | 0.35 | 1623.7 | 624.5 |
| 4L | 2735.8 | 11,570.6 | 4450.2 | ||||
| B3 | GF + 9L | 1749.9 | 10,546.4 | 2851.3 | 0.27 | 8122.1 | 3123.9 |
| B4 | GF + 9L | 3515.9 | 23,300.0 | 6350.6 | 0.27 | 20,807.6 | 6778.2 |
| B5 | GF + 8L | 2265.0 | 14,346.8 | 3976.1 | 0.28 | 12,983.4 | 4280.4 |
| B6 | GF + 8L + | 2969.2 | 18,125.2 | 4499.5 | 0.25 | 16,525.7 | 5268.7 |
| B7 | GF | 6011.9 | 61,091.7 | 15,249.8 | 0.25 | 58,869.8 | 6532.5 |
| GF + 1L |
| Building | Global Coefficient of Thermal Insulation of Building | Total Annual Consumption of Energyt 1 (Space Heating, Ventilation, dhw) | Total Annual Specific Consumption of Energyt 1 (Space Heating, Ventilation, dhw) |
|---|---|---|---|
| - | G | ||
| - | W/(m3K) | MWh/year | kWh/(m2 year) |
| B1 | 0.252 | 356.3 | 68.4 |
| B2 | 0.236 | 645.4 | 127.2 |
| 0.449 | |||
| B3 | 0.467 | 336.5 | 107.7 |
| B4 | 0.361 | 713.3 | 105.2 |
| B5 | 0.357 | 600.5 | 140.3 |
| B6 | 0.373 | 428.8 | 81.4 |
| B7 | 0.075 | 1576.3 | 241.3 |
| 0.185 |
| Building | Annual Solar Fraction | Collector Field Area | Indicator of Equivalent Area | Irradiation onto Collector Area | |
|---|---|---|---|---|---|
| Ac | Aa | Is,equiv. | Ic | ||
| - | % | m2 | - | MWh/year | |
| B1 | 43.6 | 400 | 360 | 0.72 | 529.12 |
| B2 | 36.9 | 0.61 | |||
| B3 1 | 60.3 | 1.00 | |||
| B4 | 34.6 | 0.57 | |||
| B5 | 39.7 | 0.66 | |||
| B6 | 53.8 | 0.89 | |||
| B7 | 17.1 | 0.28 | |||
| Energy Source | Primary Energy Conversion Factor | CO2equiv. Standard Emission Factor | ||
|---|---|---|---|---|
| Non-Renewable | Renewable | Total | ||
| Electrical energy from grid | 2.62 | 0.00 | 2.62 | 0.299 |
| Cogeneration (DHS) | 0.92 | 0.00 | 0.92 | 0.220 |
| Solar thermal energy | 0.00 | 1.00 | 1.00 | 0.000 |
| Bi | Indicator of Conventional Primary Energy in Building | Indicator of RES-S Harness in Building | Annual Solar Fraction | Annual Solar Collector Field Efficiency 1 | Annual Collectors Yield | Global Energy Efficiency of the Hybrid Heating System | Specific Indicator of Equivalent Emissions |
|---|---|---|---|---|---|---|---|
| - | ηc | emCO2 | |||||
| kWh/(m2 year) | - | % | kWh/(m2 year) | % | - | kgCO2/(m2 year) | |
| - | C1 | C2 | C3 | C4 | C5 | C6 | C7 |
| B1 | 38.31 | 0.46 | 43.6 | 419.5 | 31.7 | 1.75 | 8.68 |
| B2 | 76.48 | 0.39 | 36.9 | 615.6 | 46.5 | 1.65 | 17.06 |
| B3 | 42.13 | 0.62 | 60.3 | 542.8 | 41.0 | 2.44 | 9.89 |
| B4 | 65.31 | 0.36 | 34.6 | 636.0 | 48.1 | 1.60 | 14.54 |
| B5 | 80.72 | 0.42 | 39.7 | 618.8 | 46.8 | 1.72 | 18.02 |
| B6 | 36.27 | 0.56 | 53.8 | 604.0 | 45.7 | 2.21 | 8.13 |
| B7 | 160.52 | 0.18 | 17.1 | 586.8 | 44.4 | 1.27 | 35.93 |
| No. | Relative Importance |
|---|---|
| 1 | Equal importance |
| 3 | Moderate importance |
| 5 | Big importance |
| 7 | Very big importance |
| 9 | Extreme importance |
| 2, 4, 6, 8 | Intermediate values |
| 1/3, 1/5, 1/7, 1/9 | Values for reverse comparison |
| Criteria | C1 | C2 | C4 | C6 | C7 | Weight, kw,j [%] |
|---|---|---|---|---|---|---|
| C1 | 1 | 1/5 | 1/5 | 1/7 | 3 | 6.57 |
| C2 | 5 | 1 | 3 | 1/3 | 7 | 21.95 |
| C4 | 5 | 1/3 | 1 | 1/5 | 3 | 16.30 |
| C6 | 7 | 3 | 5 | 1 | 9 | 34.66 |
| C7 | 1/3 | 1/7 | 1/3 | 1/9 | 1 | 15.68 |
| Sum | 18.3333 | 4.6761 | 9.5333 | 1.7872 | 23.0000 | 100.00 |
| C1 | C2 | C4 | C6 | C7 | Sum of Rates | |
|---|---|---|---|---|---|---|
| C1 | 0.0657 | 0.0517 | 0.0276 | 0.0715 | 0.1140 | 0.3305 |
| C2 | 0.3285 | 0.2584 | 0.4146 | 0.1664 | 0.2660 | 1.4339 |
| C4 | 0.3285 | 0.0860 | 0.1382 | 0.0999 | 0.1140 | 0.7666 |
| C6 | 0.4599 | 0.7752 | 0.6910 | 0.4997 | 0.3420 | 2.7678 |
| C7 | 0.0219 | 0.0370 | 0.0460 | 0.0555 | 0.0380 | 0.1984 |
| Weight | 0.0657 | 0.2584 | 0.1382 | 0.4997 | 0.0380 | 1.0000 |
| Order | 4 | 2 | 3 | 1 | 5 | 1–5 |
| Matrix | 1 | 2 | 3 | 4 | 5 | 6 | 7 | 8 | 9 | 10 |
| RI | 0.00 | 0.00 | 0.58 | 0.90 | 1.12 | 1.24 | 1.32 | 1.41 | 1.45 | 1.49 |
| Criterion | Order | Weight | Alternative | ||||||
|---|---|---|---|---|---|---|---|---|---|
| B1 | B2 | B3 | B4 | B5 | B6 | B7 | |||
| Cj | - | kw,j | kw,i | ||||||
| C1 | 4 | 0.0657 | 0.95 | 0.47 | 0.86 | 0.56 | 0.45 | 1 | 0.23 |
| C2 | 2 | 0.2584 | 0.74 | 0.63 | 1 | 0.58 | 0.68 | 0.90 | 0.29 |
| C4 | 3 | 0.1382 | 0.66 | 0.97 | 0.85 | 1 | 0.97 | 0.95 | 0.92 |
| C5 | - | - | 0.66 | 0.97 | 0.85 | 1 | 0.97 | 0.95 | 0.92 |
| C6 | 1 | 0.4997 | 0.72 | 0.68 | 1 | 0.66 | 0.70 | 0.91 | 0.52 |
| C7 | 5 | 0.0380 | 0.94 | 0.48 | 0.82 | 0.56 | 0.45 | 1 | 0.23 |
| Alternative | kw,i ∙kw,j | Sum | Rank | ||||
|---|---|---|---|---|---|---|---|
| B1 | 0.0624 | 0.1912 | 0.0912 | 0.3598 | 0.0357 | 0.740 | 3 |
| B2 | 0.0309 | 0.1628 | 0.1341 | 0.3398 | 0.0182 | 0.686 | 5 |
| B3 | 0.0565 | 0.2584 | 0.1175 | 0.4997 | 0.0312 | 0.963 | 2 |
| B4 | 0.0368 | 0.1499 | 0.1382 | 0.3298 | 0.0213 | 0.676 | 6 |
| B5 | 0.0296 | 0.1757 | 0.1341 | 0.3498 | 0.0171 | 0.706 | 4 |
| B6 | 0.0657 | 0.2326 | 0.1313 | 0.4547 | 0.0380 | 1.141 | 1 |
| B7 | 0.0151 | 0.0749 | 0.1271 | 0.2598 | 0.0087 | 0.486 | 7 |
| Alternative | Ranking Criteria | |||||||
|---|---|---|---|---|---|---|---|---|
| C1 | C2 | C3 | C4 | C5 | C6 | C7 | Overall Efficiency | |
| B1 | 2 | 3 | 3 | 7 | 7 | 3 | 2 | 3 |
| B2 | 4 | 5 | 5 | 3 | 3 | 5 | 5 | 5 |
| B3 | 3 | 1 | 1 | 6 | 6 | 1 | 3 | 2 |
| B4 | 5 | 6 | 6 | 1 | 1 | 6 | 4 | 6 |
| B5 | 6 | 4 | 4 | 2 | 2 | 4 | 6 | 4 |
| B6 | 1 | 2 | 2 | 4 | 4 | 2 | 1 | 1 |
| B7 | 7 | 7 | 7 | 5 | 5 | 7 | 7 | 7 |
Publisher’s Note: MDPI stays neutral with regard to jurisdictional claims in published maps and institutional affiliations. |
© 2021 by the authors. Licensee MDPI, Basel, Switzerland. This article is an open access article distributed under the terms and conditions of the Creative Commons Attribution (CC BY) license (http://creativecommons.org/licenses/by/4.0/).
Share and Cite
Șoimoșan, T.M.; Moga, L.M.; Anastasiu, L.; Manea, D.L.; Căzilă, A.; Zeljković, Č. Overall Efficiency of On-Site Production and Storage of Solar Thermal Energy. Sustainability 2021, 13, 1360. https://0-doi-org.brum.beds.ac.uk/10.3390/su13031360
Șoimoșan TM, Moga LM, Anastasiu L, Manea DL, Căzilă A, Zeljković Č. Overall Efficiency of On-Site Production and Storage of Solar Thermal Energy. Sustainability. 2021; 13(3):1360. https://0-doi-org.brum.beds.ac.uk/10.3390/su13031360
Chicago/Turabian StyleȘoimoșan, Teodora M., Ligia M. Moga, Livia Anastasiu, Daniela L. Manea, Aurica Căzilă, and Čedomir Zeljković. 2021. "Overall Efficiency of On-Site Production and Storage of Solar Thermal Energy" Sustainability 13, no. 3: 1360. https://0-doi-org.brum.beds.ac.uk/10.3390/su13031360