1. Introduction
The social and economic context in which companies now operate has become unprecedentedly dynamic, discontinuous, and complex. In order to face these new challenges, companies are profoundly changing their mission and vision by assuming and embracing new values that greatly impact company culture. The focus of their actions ranges from stakeholders and the competitive context [
1] to the environment and the whole of society. To this end, corporate social responsibility (CSR) has become increasingly significant both at European and international level [
2,
3,
4,
5]. In 1976, Hopwood [
6] had already shown that the social, environmental, and political evolution was increasingly focusing on a wider vision of company responsibility.
Sustainability linked to development has become a key theme on the agendas of national governments and international institutions. The UN approval of the Global Agenda for Sustainable Development [
7] (Agenda 2030) in September 2015 contributed to a strategic process aimed at increasing the knowledge and spread of the Sustainable Development Goals [
8]. The 17 goals (SDGs) of Agenda 2030 aim to increase awareness of economic, social, and environmental development [
9,
10].
Stakeholders have increasingly requested more complete disclosure from companies that goes beyond economic, asset, and financial information in order to highlight the overall impact on society and the environment, even from an intergenerational perspective.
Consequently, companies have begun to use sustainability reporting as a form of accountability and communication on how their activities contribute, either positively or negatively, to the objectives of sustainable development.
Therefore, in both theory and practice, how companies can, and should, measure and communicate their economic, environmental, and social performance has become the focus of much attention [
11,
12]. In order to be effective, global standards are required to improve the quality and comparison of information, thus increasing the transparency and responsibility of organizations [
13,
14].
Legislative Decree no. 254, of 30 December 2016, transposed the EU Directive 2014/95 on non-financial and diversity disclosure by public interest entities (PIE) and large companies into Italian law, therefore, PIEs are obliged to report information of a socio-environmental nature in a non-financial disclosure (NFD) either independently, in a consolidated way if the PIEs are parent companies of a larger enterprise, or as a consolidated group.
The Global Reporting Initiative (GRI) guidelines are the most widely applied [
15,
16] and are structured in such a way as to guide companies on how to provide a global and integrated vision of the impact their activities have on management approach, economics, and environmental and social topics [
17].
Therefore, the aim of this paper is:
- -
to measure the broadness of non-financial information in the sustainability reports of PIEs in Italy that are required to publish non-financial reports (NFD) following the introduction of Legislative Decree 254/2016;
- -
to relate this with some selected variables i.e., the presence of an internal sustainability committee, citing of the SDG in the report, number of employees or revenue.
The analysis aims to provide indications of some of the company variables useful for facilitating the breadth of non-financial information. These variables refer to corporate governance i.e., the presence of an internal sustainability committee, the presence of female directors; the characteristics of the report i.e., the SDG citation; company features, number of employees, revenues, and Return On Assets ROA. The variables considered make no claim to being exhaustive.
The study sample included 134 Italian companies listed on the exchange that had adopted the GRI reporting standards and published their non-financial disclosure document separately from the management report in 2018.
The focus on the Italian case is determined by the need to conduct the analysis on a set of companies operating in a homogeneous legal, cultural, economic and entrepreneurial context. Furthermore, Italy represents a particular object of investigation since the pressure exerted by policy makers and regulators on non-financial disclosure is higher than in other countries [
18].
The research proposes a concise indicator of the entity of non-financial information in companies that have adopted the GRI standards. This provides:
- -
a tool for scholars for future research as it can represent one of the dimensions determining the overall quality of non-financial reports;
- -
a score for operators that allows them to compare companies;
- -
guidance for policy-makers and regulators on the impact of legislation on the willingness of companies to report on social, economic, and environmental sustainability.
The analysis of the relation of this score with some variables provides initial evidence on which dimensions favor the informative broadness.
The paper is structured as follows:
Section 2 is a review of the international literature on non-financial disclosure theoretical framework;
Section 3 shows an overview of the European and Italian legal reference context;
Section 4 describes the research hypotheses and methodology;
Section 5 is an analysis of the study results and discussion; the final section presents the conclusions with suggestions for further research.
2. Literature Review
2.1. Non-Financial Reporting
In recent years, corporate social responsibility (CSR) has been discussed and defined in different ways in the international literature [
2,
4,
19,
20].
The topic was first introduced by Clark in 1916 [
21], then revisited in the 1970s by Friedman [
22] and other scholars, some of whom studied the relationship between CSR and social performance [
23], business ethics [
24], stakeholder management [
25], and accountability [
26].
The international literature defines corporate social responsibility as ‘doing the right thing’ towards others i.e., accountability to the stakeholders with whom the company interacts and to whom it must report the results of its activities [
3,
27]. In this sense, positive results in terms of profits and reputation are directly dependent on the moral principles that define company behavior [
28]. Stakeholder theory [
29], which has evolved over time, states how CSR is the result of the interaction between a company and a stakeholder system [
30,
31,
32,
33,
34,
35].
The various theories of CSR are distinguished by different approaches [
36] that are influenced by the legal, political, and social systems of a country [
37,
38,
39,
40].
Of the different theories, the approach proposed by Husted and Allen [
41]—“strategies for achieving competitive advantages”—highlights how including CSR in company management creates long term value [
42] that is significant for all stakeholders [
43,
44,
45]. Some studies have shown how the integration of CSR in governance not only improves economic performance but also generates positive aspects e.g., in reputation [
46,
47], greater staff involvement [
48], relational capital [
49], the ability to anticipate [
50], and a decrease in transaction and company costs [
51].
Over the last few decades, the socio-economic scenario has been characterized by phenomena such as globalization, the delocalization of companies, changes in work organization and environmental and climate change issues, all of which have led companies to rethink their production and consumption models with a greater emphasis on sustainability [
52].
The implementation of voluntary disclosure, such as the environmental, social, and sustainability reports, derives from the need for companies to demonstrate the social impact of their activities and the ethical behavior adopted. The socio-economic system has concluded that environmental and social protection policies must form part of the development of the economy and of the community; companies, society, and the environment are all interdependent. This is also the case in the relationship between financial and non-financial information [
3].
Financial and non-financial reporting may differ depending on the level of interdependence [
53]. In the integrated report (IR), both forms are fully integrated with economic, environmental, and social aspects and are also present in the decision-making processes [
54,
55]. By integrating this information, the company aims to outline how it will create long- and short-term value [
56,
57].
The integrated report proposed by the International Integrated Reporting Council (IIRC) highlights those elements that distinguish it from the traditional report i.e., the communicative approach, the impact on management, cross-functional logic, focus on information, the time-frame reference, the ability to summarize, and an open approach to digital content.
It provides information on strategic performance and intangible assets which are significant for investors as they are the main stakeholders [
58].
The IIRC Framework had a significant impact and, to date, it is still the only reference for integrated reporting. The IIRC is a global entity comprising regulatory organizations, investors, companies, regulatory bodies, accountancy professionals, and non-governmental organizations. The European Commission allowed organizations to disclose their non-financial reports in accordance with the IIRC. In this sense, the concept of “non-financial reporting” in Europe regards different types of reports, such as combined reports, sustainability reports, and integrated reports [
3].
Therefore, over time, non-financial reporting has become increasingly significant, requiring an appropriate means of communication. Companies have responded by publishing sustainability reports on a voluntary basis, as shown in various international surveys [
59,
60,
61,
62]. Thus, the contribution provided by Directive 2014/95/EU on European PIEs has been limited by their prior orientation towards non-financial reporting practices [
63].
Our study analyzed the compliance of NFD of some Italian PIEs in 2018 with the GRI framework of the Sustainability Reporting Guidelines, the most widely used both at the national and international level [
64,
65].
Criticism of this model has focused on the inability of the guidelines to deal more specifically with the question of sustainability: e.g., the inability of some companies to act responsibly in areas such as gas emissions, human rights, social equality, and no obligation to legal responsibility by third parties [
66,
67,
68].
The founding of the non-profit entity, the Global Reporting Initiative, in Boston in 1997, undoubtedly facilitated the evolution of sustainability reporting at an international level and was further developed after the United Nations became a partner in 2002.
It was characterized by continual updating and changes to ensure the inclusion of various aspects of sustainability [
69]. The current version, the GRI standards, differs from other standards in that it also analyzes anti-corruption and gender policies and is currently the widely adopted standard setter.
The proposed GRI guidelines favor reliable sustainability reporting that provides clear information on sustainability for the benefit of stakeholders. Economic, environmental, and social indicators (GRI indicators) help to illustrate company performance [
70].
2.2. Theoretical Framework
Over the last few years, the scientific debate on non-financial reporting has drawn a high degree of attention from accounting scholars [
36,
43] and much of the debate has centered on the topics related to the analysis of the main items that affect the quality of non- financial reporting [
3]. While there are differences in actions and communications, previous studies agreed to evaluate the orientation of firms towards sustainable development by analyzing non-financial disclosure [
43].
Despite there being specific regulations within the European context, over the last few years, there have been several studies on the impact caused by Directive 2014/95/UE on the accountability practices of European PIEs. More specifically, some research has underlined that despite there being common requirements, non-financial declarations are characterized by different degrees of transparency. An initial evaluation by Venturelli and Caputo [
3] showed that Italian PIEs already tended to disclose part of the information required by the Directive 2014/95/UE while other studies have highlighted the criticism of the different approach towards mandatory reporting [
43,
44]. The effects of the Directive 2014/95/UE on European PIEs have been limited by the lack of mandatory provision on non-financial reporting. In fact, the main characteristics of Directive 2014795/UE are represented by the principle-based approach, therefore firms can comply with the law by adopting accountability mechanisms based on the disclosure of a limited amount of information.
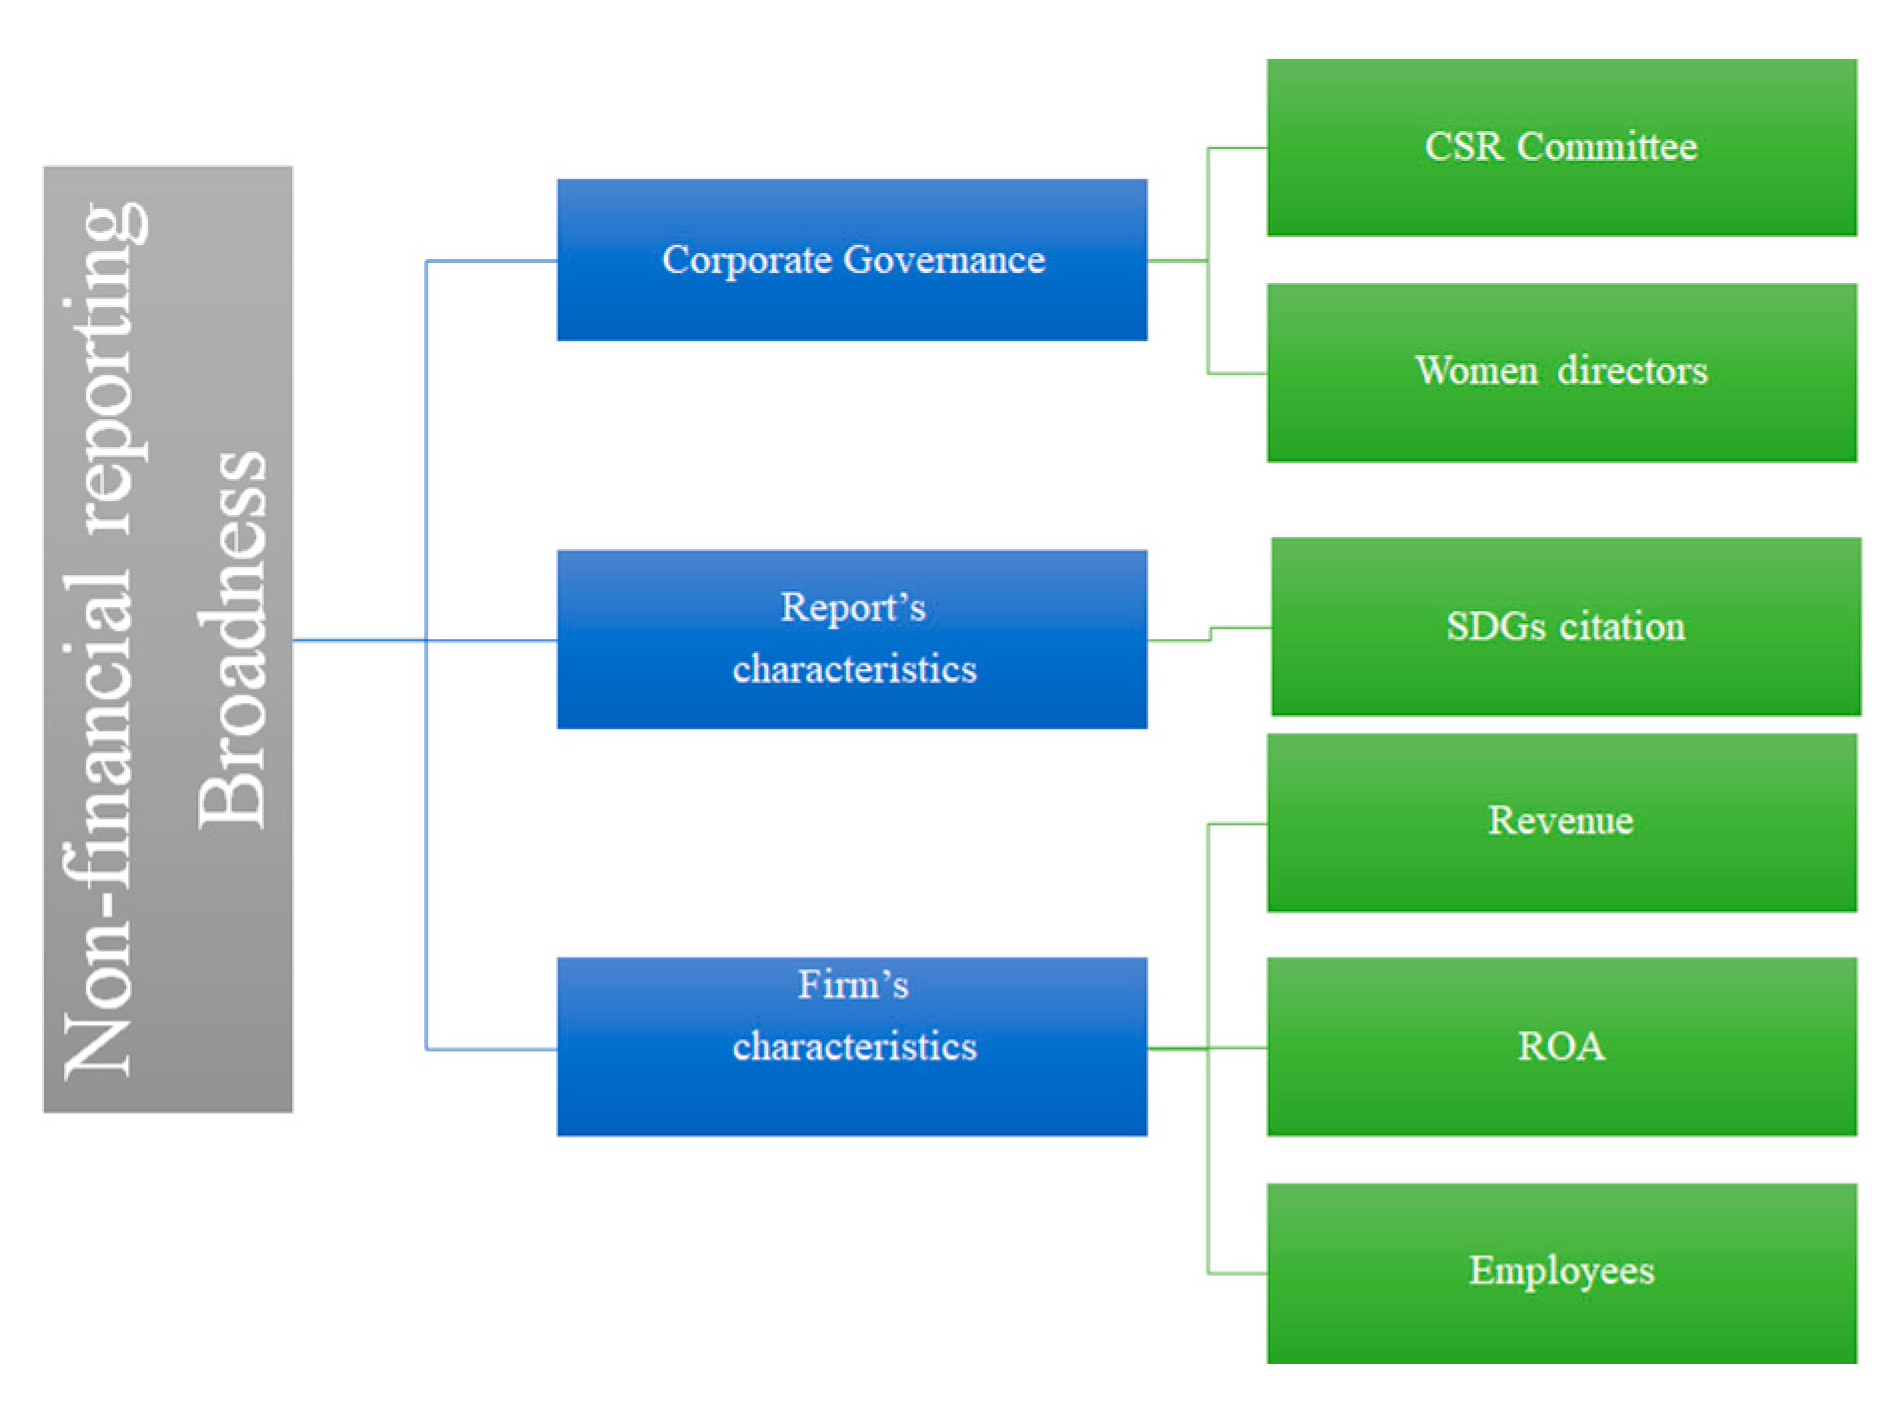
Based on this evidence, it is clear that to understand the determinants that impact the overall amount of information disclosed by European PIEs is a complex process. In fact, prior studies agreed on the need to adopt a holistic approach based on the analysis of specific items that impact non-financial reporting practices [
3]. In particular, one of the widely adopted classifications (
Figure 1) used to evaluate the characteristics of non-financial reporting consists in the analysis of the impact of corporate governance, the reporting framework, and company characteristics [
71].
Corporate governance represents the main items that affect business strategy. The involvement of directors in the sustainability process is a sign of their orientation towards sustainable development. As regarding the characteristics of corporate governance, over the last years, several studies have shown the existence of drivers that favor the disclosure of non-financial information. Two of the main drivers highlighted are the presence of female directors and the provision of a CSR Committee [
63,
71,
72,
73,
74,
75,
76].
As regards female directors, many authors have shown how companies that embrace gender equality on their board and in management show better economic-financial performance, thus highlighting the important contribution of the female members [
77,
78,
79,
80]. Other scholars maintain that women employed in these roles have a positive impact on the social responsibility of companies [
81], on the decision-making ability of management [
82,
83], on ethical leadership [
73,
84], and risk [
85,
86,
87].
There has been a progressive tendency of companies in the last few years towards a system of governance aimed at including CSR Committees within the decision-making process and a growing number has introduced sustainability committees in their organizations. On this point, the literature concurs that they should be attributed with an informative function as to the quality of disclosure [
88,
89]. Previous studies have shown how these committees bring together financial and non-financial profiles thus favoring the adoption of integrated communication models [
90,
91].
The Directive 2014/95/EU allows PIEs to disclose their non-financial information through different reporting standards and frameworks. In particular, one of the main differences from other forms of mandatory non-financial reporting consists in the possibility to comply with the law through combined reports, standalone reports, and integrated reports. However, despite the flexibility of the provision, a survey conducted by KPMG in 2020 showed that the standards released by the Global Reporting Initiative represent the main standard adopted by organizations.
On the basis of this evidence, and contrary to previous situations, the effects related to the adoption of GRI standards have been limited. In this sense, scholars agree on the need to evaluate the overall degree of information disclosed annually, even if there are similar standards [
65].
Furthermore, an increasing number of scholars have begun to consider the role of an explicit citation of SDGs in the reports. Various studies have shown that positive dependency relationships exist between explicit references to the SDGs and specific factors such as the quality of disclosure and recommendations by financial analysts [
88,
92].
In 2015, the UN Agenda 2030 outlined the different sustainability objectives for the wellbeing of the planet [
9,
93]. Not only the countries belonging to the UN, but also the stakeholders operating in its 193 member nations must aim towards these goals. Companies are among the stakeholders that can communicate the impact of their business on SDGs by reporting their activities [
94]. In addition, an understanding of the enabling role of SDG reporting is of relevance in order to increase scientific knowledge due to the lack of studies based on the specific context [
95]. In fact, despite the fact that SDGs are global goals, there are territorial differences linked to the degree of sensitivity towards the goals to be achieved [
96].
Finally, a large number of studies conducted to consider the interlinkage between financial and non-financial dynamics [
97,
98,
99,
100] have shown how economic-financial performance, which is a sign of company size, can favor better disclosure [
101]. The relevance of these factors derives from the greater tendency of large companies to involve their stakeholders in their ‘non-financial’ activity [
102].
Another variable considered by scholars is company size, in terms of the number of employees. Theoretically, companies with a higher number of employees produce more non-financial reports. In fact, large organizations are typically more inclined to disclose their non-financial information to internal and external stakeholders [
103,
104]. Thus, the overall yearly number of employees in the organization represents a useful proxy and is widely adopted by academics to analyze firms oriented towards non-financial disclosure [
3].
3. The Legal Reference Context
The Directive 2014/95/UE is an innovative tool introduced by the European Commission to favor the transition towards more sustainable financial markets [
3]. Several studies and some research have been developed in the last few years by academics and practitioners in order to understand the main implications related to the transposition of the new form of regulation.
The introduction of the directive 2014/95/UE was favored by an intense period of activity of the European Commission. At the European level, the publication of the European Commission’s Green Book in 2001 can be considered the first initiative aimed at promoting the discussion of sustainable development, underlining the need for integration between environmental, social, and economic sectors [
3,
105].
This was followed by other European institution initiatives, including:
The European Commission communication of 13 April 2011 entitled: “Single Market Act. Twelve levers to boost growth and strengthen confidence. Working together to create new growth”;
The European Commission communication of 25 October 2011 entitled: “A renewed EU strategy 2011-14 for Corporate Social Responsibility”;
The European Parliament resolution of 6 February 2013 entitled: “Corporate social responsibility: accountable, transparent and responsible business behaviour and sustainable growth” and European Parliament resolution of 6 February 2013 entitled: “Corporate Social Responsibility: promoting society’s interests and a route to sustainable and inclusive recovery”;
The European Parliament and Council Directive 2014/95 of 22 October 2014, effecting changes to Directive 2013/34/UE on non-financial reporting and diversity reporting by some large-scale companies and groups.
This latter Directive stated that, for large companies, sustainability reporting would no longer be voluntary but mandatory, thus overcoming the limitations of the previous Directive [
106].
There has been ongoing debate in the literature on the subject of voluntary and/or mandatory disclosure of non-financial information [
107,
108,
109,
110,
111,
112,
113,
114].
The most renowned literature highlights how the regulation of non-financial reporting practices does not promote the adoption of sustainable business models [
115,
116].
Evidence of this is found in information imbalances resulting from accountability mechanisms that facilitate the reporting of favorable information. Moreover, recent studies have highlighted how some companies adopt non-financial reporting practices simply as a means of paying lip service to regulations [
117,
118]. In this sense, regulation would seem to support the adoption of non-financial reporting without necessarily influencing the quality of the information produced [
3,
53].
Nevertheless, the EU legislator was of the opinion that regulation could have a positive effect on the quality and comparability of information, as sustained by other authors [
107,
119,
120]. Mandatory reporting would avoid the incompleteness, objectivity, and comparability in voluntary reporting [
121,
122]. In fact, some studies have highlighted how the quality of non-financial reporting in France is much higher than in the USA where it is not regulated by law [
123]. Therefore, regulation would lead to greater standardization and an increase in the number of reports with non-financial information [
124].
The Italian scenario represents one of the principle contexts analyzed by academics [
3,
44]. Its significance is related to the high degree of regulation involved in the transposition of the Directive 2014/95/UE. In fact, the complexity of the topics was confirmed by the need for two public consultations before its official transposition.
The first, in May 2016, was a questionnaire with 26 questions sent to 35 stakeholders operating in different economic, cultural, and social contexts. The aim was to sound out their opinion on the obligation to communicate non-financial disclosure within the Italian judicial system and, in particular, the scope of application of this regulation in the balance sheet and the consolidated financial statement.
The results showed there were different levels of knowledge of the subject. The stakeholder response, representative of the business community, highlighted the relevance of the question in a context where investors are becoming increasingly sensitive to CSR. Prior to this, Italian companies had voluntarily published non-financial disclosure [
3].
Almost all stakeholders excluded extending mandatory disclosure to SMEs as this would have meant increased costs for companies where the administrative and control function, where present, cannot be compared to that of larger companies, as underlined by Confindustria (the Italian Confederation of Industries). However, professional bodies and universities highlighted how companies affected by the regulation could have collected and re-elaborated the necessary data at a minimum cost.
As to the reporting standards, the consultation stated that, as there were already existing standards agreed upon at international level, it was not necessary to enforce the use of specific ones. In this way, obsolete information resulting from regulations that had not been updated would be avoided.
Stakeholders also commented on the collocation of non-financial disclosure and were more in favor of independent compared to financial disclosure. This is supported by academia as, this way, the problems of integrating data in different documents could be avoided.
The second public consultation of September 2016 was a proposal to modify the draft of the transposition decree of the non-financial directive in Italy.
Academics suggested a redefinition of the dimensional limits due to the indistinctiveness of the concept of large dimension in economics and business studies.
As to the standard setter, there were no guidelines to make the activities of the companies affected by the transposition of the directive homogenous. The stakeholders had given the GRI model a high information value.
On conclusion of the consultations, the Gazzetta Ufficiale (the official state journal) published Leg. Decree 256/2016 on 10 January 2017. This concerned the communication of non-financial information and information on diversity by some large companies and groups. The decree came into force on 25 January 2017, with effect from the financial year beginning 1 January 2017.
Leg. Decree 25/2016 made non-financial disclosure mandatory for companies or parent companies registered as public interest entities (PIE). The application of this regulation was subordinate to overcoming the following two limitations:
to have an average of at least five hundred employees.
total assets of at least 20 million euro at the close of the financial year.
total net revenue from sales or services of 40 million euro at the close of the financial year.
Each company was to compile an individual non-financial report, groups compiled a consolidated non-financial report, and the non-financial information of both parent companies and companies controlled directly and indirectly lay within the consolidation area.
Parent companies are public interest entities that compile the consolidated financial statement in accordance with Leg. Decree 127/91 or according to the IAS/IFRS international accounting standards. Subsidiary companies are those that are within the consolidation area of the parent companies according to the accounting regulations of Leg. Decree 127/91.
The Italian legislator, by introducing the general principle of relevance in article 4 of the decree, rendered the reporting scope of the non-financial and financial reporting non-aligned [
125].
Unlisted companies that issue financial instruments that, while not quoted on regulated markets, are widespread among the public, fall within the application of the Decree.
As to the contents, the law requires the following to be indicated: the business management model and business organization, its policies, including those of due diligence and their results, the relative indicators of non-financial loans, the main risks generated or sustained linked to the abovementioned topics and resulting from the company’s activity, products, services, or business relations including, where relevant, the supply and subcontracting chains. Finally, despite the opportunity to comply with Legislative Decree 254/2016 through different reporting standards, all Italian PIEs adopted the GRI standards as reporting models.
4. Research Hypotheses and Methodology
On the basis of this literature review, our research aims to calculate a score to evaluate the broadness of sustainability information reporting by the PIEs analyzed and then to relate this measure to some selected variables.
To this end, the data published by the NFD Observatory—the Observatory of Non-Financial Disclosure and Sustainability Practices (
www.osservatoriodnf.it)—for the year 2018 were used, the last year of data available prior to this study.
In 2018, a total of 200 companies in the data bank had reported their NFD; 144 of them are listed on the stock exchange, 50 other PIEs were under mandate to declare, while 6 voluntarily published NFD.
In order to perform a suitable comparison, only the 146 companies that were obliged to present NFD in a separate report were considered. Twelve of these were excluded due to lack of information and/or inability to compare the NFD. Therefore, 134 companies were analyzed, i.e., 62% of all companies that reported NFD in 2018, according to the Observatory.
The following
Table 1 shows the breakdown of the companies by sector.
The NFD analyzed are, on average, 115.12 pages long; 7.69 pages in the economic section, 12.91 in the environmental one, 5 in governance, and 26.87 in the social section.
To analyze the relation between the calculated score and some of its determinants, the following hypotheses were made (
Figure 1):
Hypothesis 1: There is a direct correlation between Global Reporting Initiative Score GRISC and the existence of an Internal Sustainability Committee (COMS).
Hypothesis 2: There is a direct correlation between GRISC and the inclusion of SDG in the non-financial disclosure (SDGC).
Hypothesis 3: There is a direct correlation between GRISC and female representation in the internal management organization (DIV).
Some control variables were introduced to understand how economic size and performance affects the magnitude of the NFD. As a proxy for size, the number of employees and revenues were considered, for profitability, the return on assets (ROA) was considered as an independent variable.
To calculate a score to assess the extent of the reporting level of information on the sustainability reporting by the analyzed PIEs, we proceeded as follows: In order to assess the completeness of the reporting, the analysis of the GRI Disclosure Index in the NFD of the 134 companies making up the sample was carried out and a score (GRISC) of the information breadth was calculated.
In order to calculate a score to assess the extent of the level of information in the sustainability report of the PIEs studied, an analysis of the GRI Disclosure Index in the NFD of the 134 companies was carried out and a score (GRISC) for the breadth of information was calculated.
The GRI Disclosure Index summarizes the information contained in the NFD, listed with reference to the issues envisaged by the GRI standards, which includes 144 topics classified in the following groups:
General Disclosure
Management Approach
Economics
Environmental
Social
The presence or absence of information was measured by a dichotomous variable (1 = present, 0 = absent).
This approach is used in many studies found in the literature that use the unweighted disclosure approach [
126,
127,
128].
The GRISC is calculated by dividing the number of topics in the NFD of each company by 144 (the total number of topics in the GRI standards):
The independent variables analyzed were:
an Internal Sustainability Committee (COMS), normally formed as part of the Board, identified by a binary variable of 1 if there was and 0 if there was not;
SDG included in the NFD (SDGC): this is also a dichotomous variable with a value of 1 if the SDG are included and 0 if they are not;
number of female board members (DIV), expressed as the percentage of female members on the management committees;
number of employees (EMPL) and the revenue (REV) as independent control variables representative of company size;
ROA, as a measure of company profitability.
In order to test the research hypotheses, a preliminary analysis to verify the correlation between GRISC and the other variables was performed.
Only the variables that significantly correlated with GRISC were considered.
A univariate analysis using an independent t-test was used for dichotomous variables COMS and SDGC.
A multivariate regression model was hypothesized:
5. Results and Discussion
5.1. The Broadness of Sustainability Information
Applying the GRISC calculation to the 134 sustainability reports analyzed revealed an average score of 0.4507. This means that the companies which make up the sample analyzed on average provide information equal to 45.07% of that required by the GRI standards, with a range from 0.0833 to 0.9444. The standard deviation is equal to 0.1369. The distribution based on the calculated score is as follows (
Table 2).
In more detail and disaggregating the GRISC, the reports of the companies analyzed show on average:
- -
65.57% of the information relating to General Disclosures (GRI-102);
- -
66.85% of the information relating to the Management Approach (GRI-103);
- -
36.45% of the information required by the 200 series (Economic topics);
- -
27.94% of the information required by the 300 series (Environmental topics);
- -
30.50% of the information required by the 400 series (Social topics).
These initial data show that the companies included in the sample are more likely to communicate contextual information about themselves, their sustainability reporting practices, and management approach.
As regards the economic section, the topics on which several companies have provided information are: 205-3 confirmed incidents of corruption and actions taken (86.57%) mainly to signal the absence of events; 201-1 direct economic value generated and distributed (67.16%) and 204.1 Proportion of spending on local suppliers (64.18%). Less interest and/or willingness emerge in providing information on: 201-2 financial implications and other risks and opportunities due to climate change (10.45%) and 201-3 defined benefit plan obligation and other retirement plans (11.19%).
As to the environmental section, there is great variation in the number of companies in the sample that provide the different information required by the set of standards. The information mostly provided is: 305-1 and 2 direct and indirect GHG emission (97.01% and 94.03%), 302-1 energy consumption within organization (96.27%) and 306-2 waste by type and disposal method (75.37%). For 13 of the 34 topics of the environmental section, less than 15% of companies provided information.
In the social section, more attention was given in the reports to topics 401 employment (55.47%); 404 training and education (53.58%); 405 diversity and equal opportunities (65.30%); 418 consumer privacy (61.94%) and 419 socio-economic compliance (61.94%): Little attention is paid to 408 child labor, 409 forced or compulsory labor; 412 evaluation of respect for human rights; and 415 public contributions.
5.2. Univariate Analysis
After calculating the GRISC, the research hypotheses were tested.
Before verifying the hypotheses by univariate and multivariate analysis, the correlation between dependent and independent variables was evaluated. The Pearson correlation matrix was used to identify the variables most correlated with the dependent variable to be introduced in the regression function. This analysis was also used to detect cases of multicollinearity that could affect the goodness of fit of the regression model.
The Pearson correlation matrix (
Table 3) shows the strong correlation between the independent variable (GRISC) and the variables of the number of employees (EMPL) and revenue (REV) that reflect the size of the company.
There is also a correlation between GRISC and the internal sustainability committee (COMS) and the inclusion of SDG (SDGC) in the NFD report.
The correlation between GRISC and the inclusion of women on the board (0.177) is not as strong as that found in the other variables.
However, the literature maintains that socially responsible behavior and better ethical performance are found in companies with a higher number of women [
81,
84,
129].
The analysis does not confirm the third hypothesis.
It is likely that the norm issued in Italy (Law 120/2011, modified by law 160/2019 and Leg. D. 124/2019) which made the inclusion of women on the governing and controlling bodies of companies and public institutions compulsory, determined a more balanced sensitivity to ethical and social issues in all companies.
The inclusion of women on company boards, while much greater than in the past, is in line with the parameters required by law. Of the companies studied, no more than 50% of women were included but, in almost all cases, the percentage was around 33%, the minimum required by law.
Profitability is not correlated with the quality of non-financial disclosure. The correlation between GRISC and ROA, which expresses the profitability of companies, is in fact very low and is negative in all cases (−0.055).
The correlation between sustainability and profitability has been studied in literature to great lengths with positive [
101,
130] or negative correlations [
128,
131].
The selection of the variables was made with the correlation matrix as well as by analyzing the values of the t statistic of the various regression coefficients and associated prob > | t |. For all the considered independent variables (COMS, SDGC, EMPL, REV), this probability is less than 5%, while for the variable relating to the female presence (DIV), it was 12.9%. It was therefore excluded from the subsequent analysis.
Therefore, the independent variables for inclusion of women (DIV) and profitability (ROA) were excluded.
Having selected the variables on which to test the hypotheses, the t-test was used to perform a descriptive analysis, as well as a univariate analysis only on the dichotomous variables.
The variables used to test further hypotheses are shown in
Table 4.
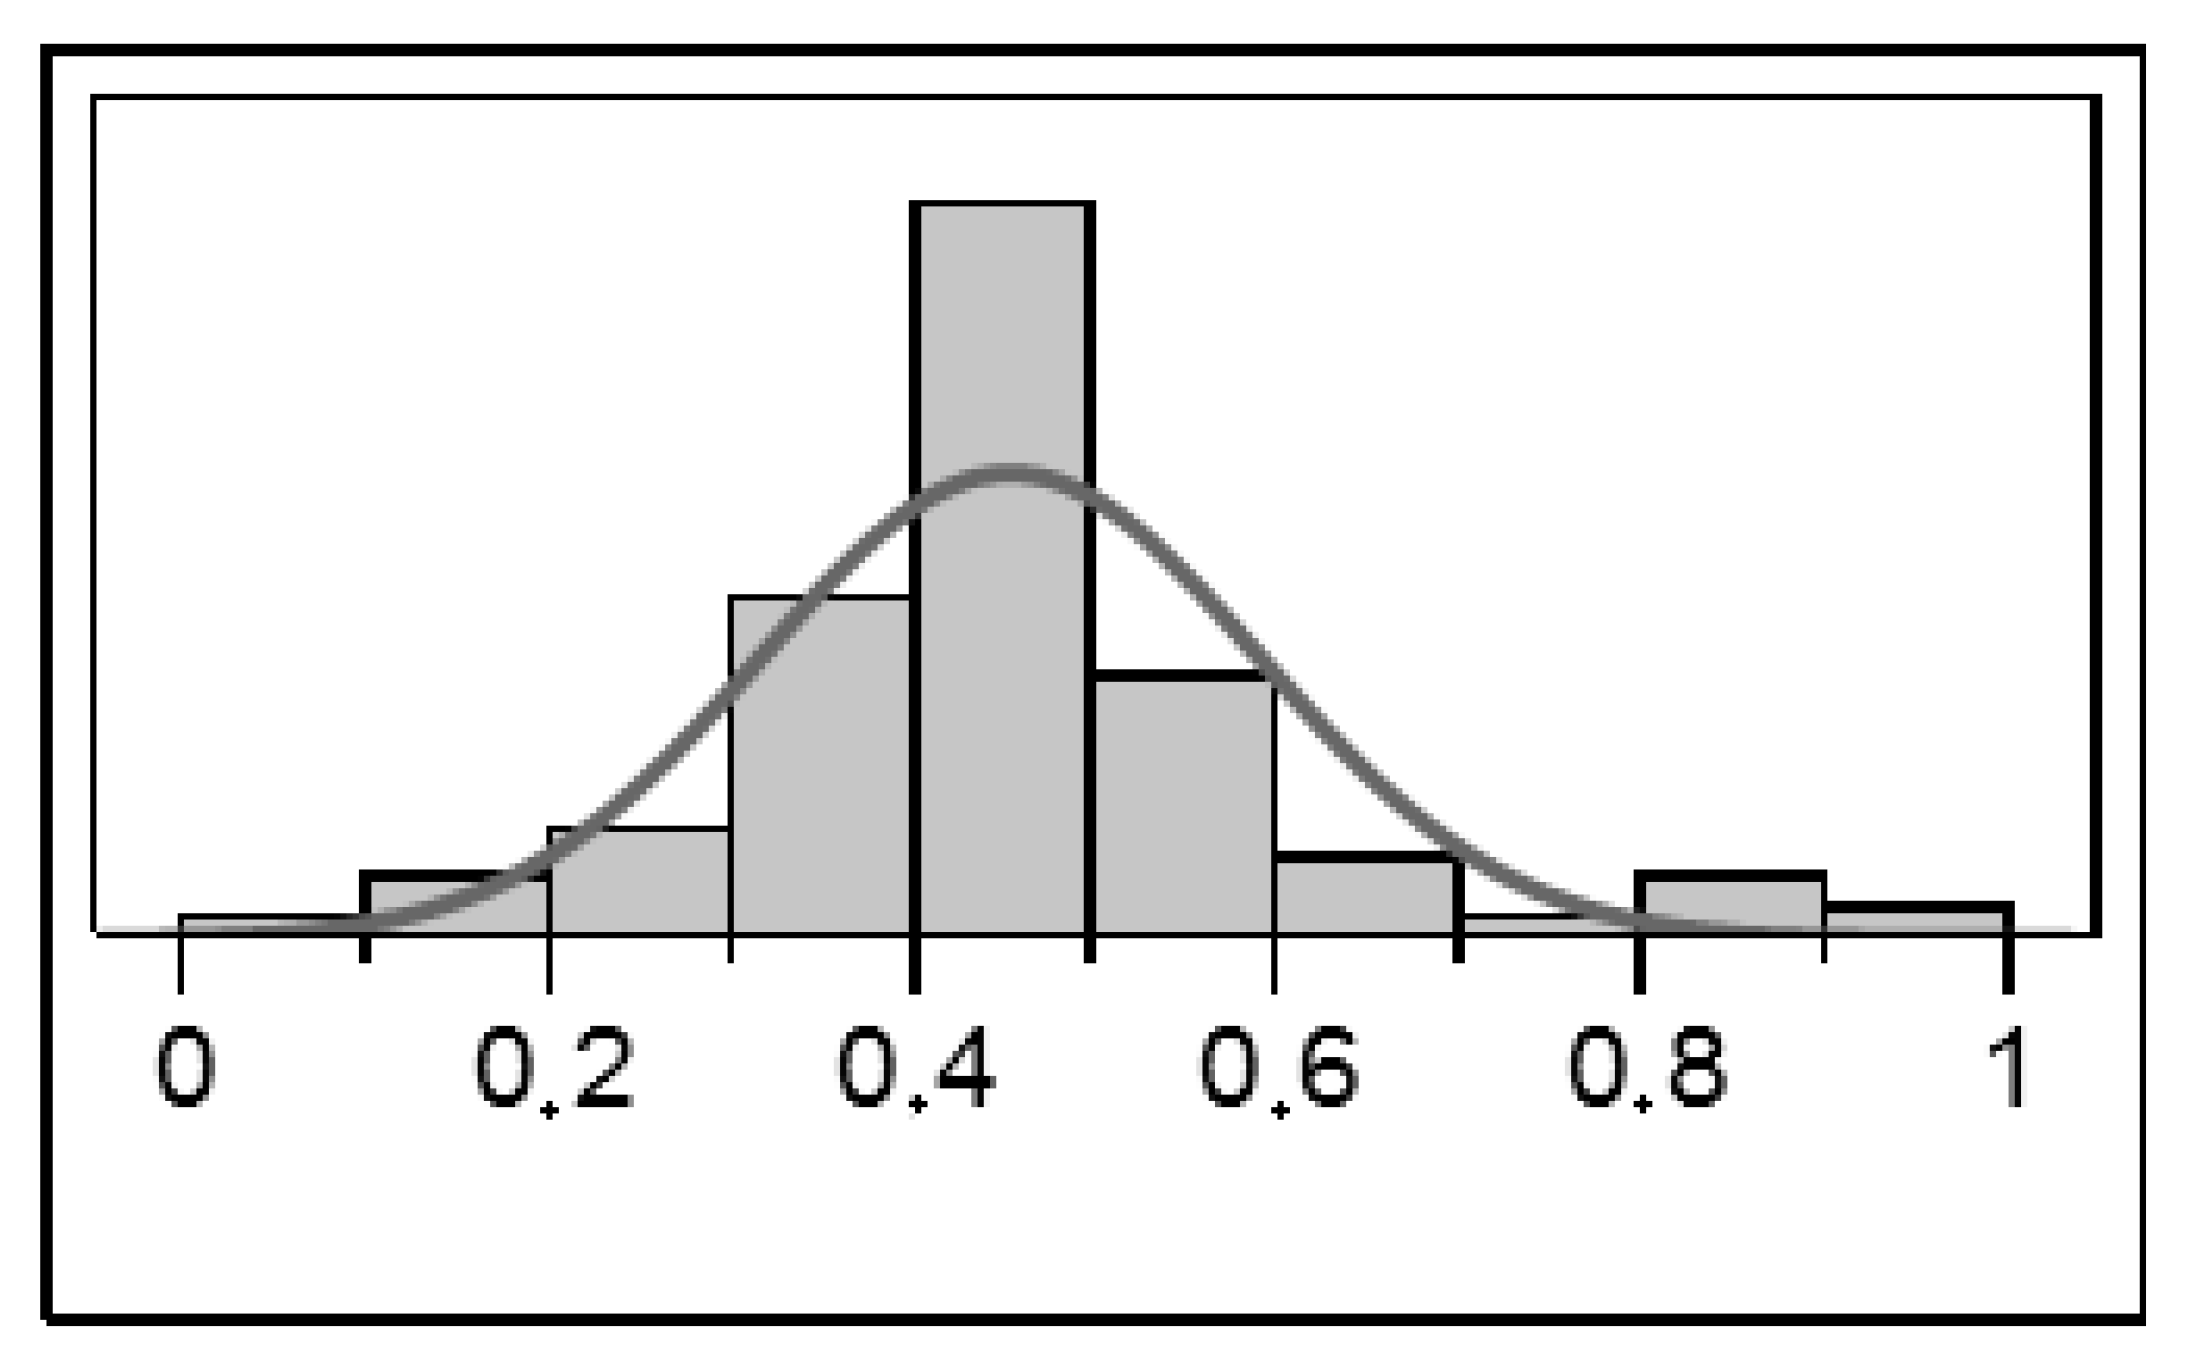
GRISC mean value was 0.451, standard deviation = 0.137, min. value = 0.083, max. value = 0.944. The high variability is due to both the differences in size and in type of activity of the companies.
The value distribution is normal, as confirmed by the Jarque–Bera test, showing a value of 58.57 compared to a χ
2 (Chi-Square) threshold value of 5.99, asymptotically tending where α = 0.05 and 2 degrees of freedom (
Figure 2).
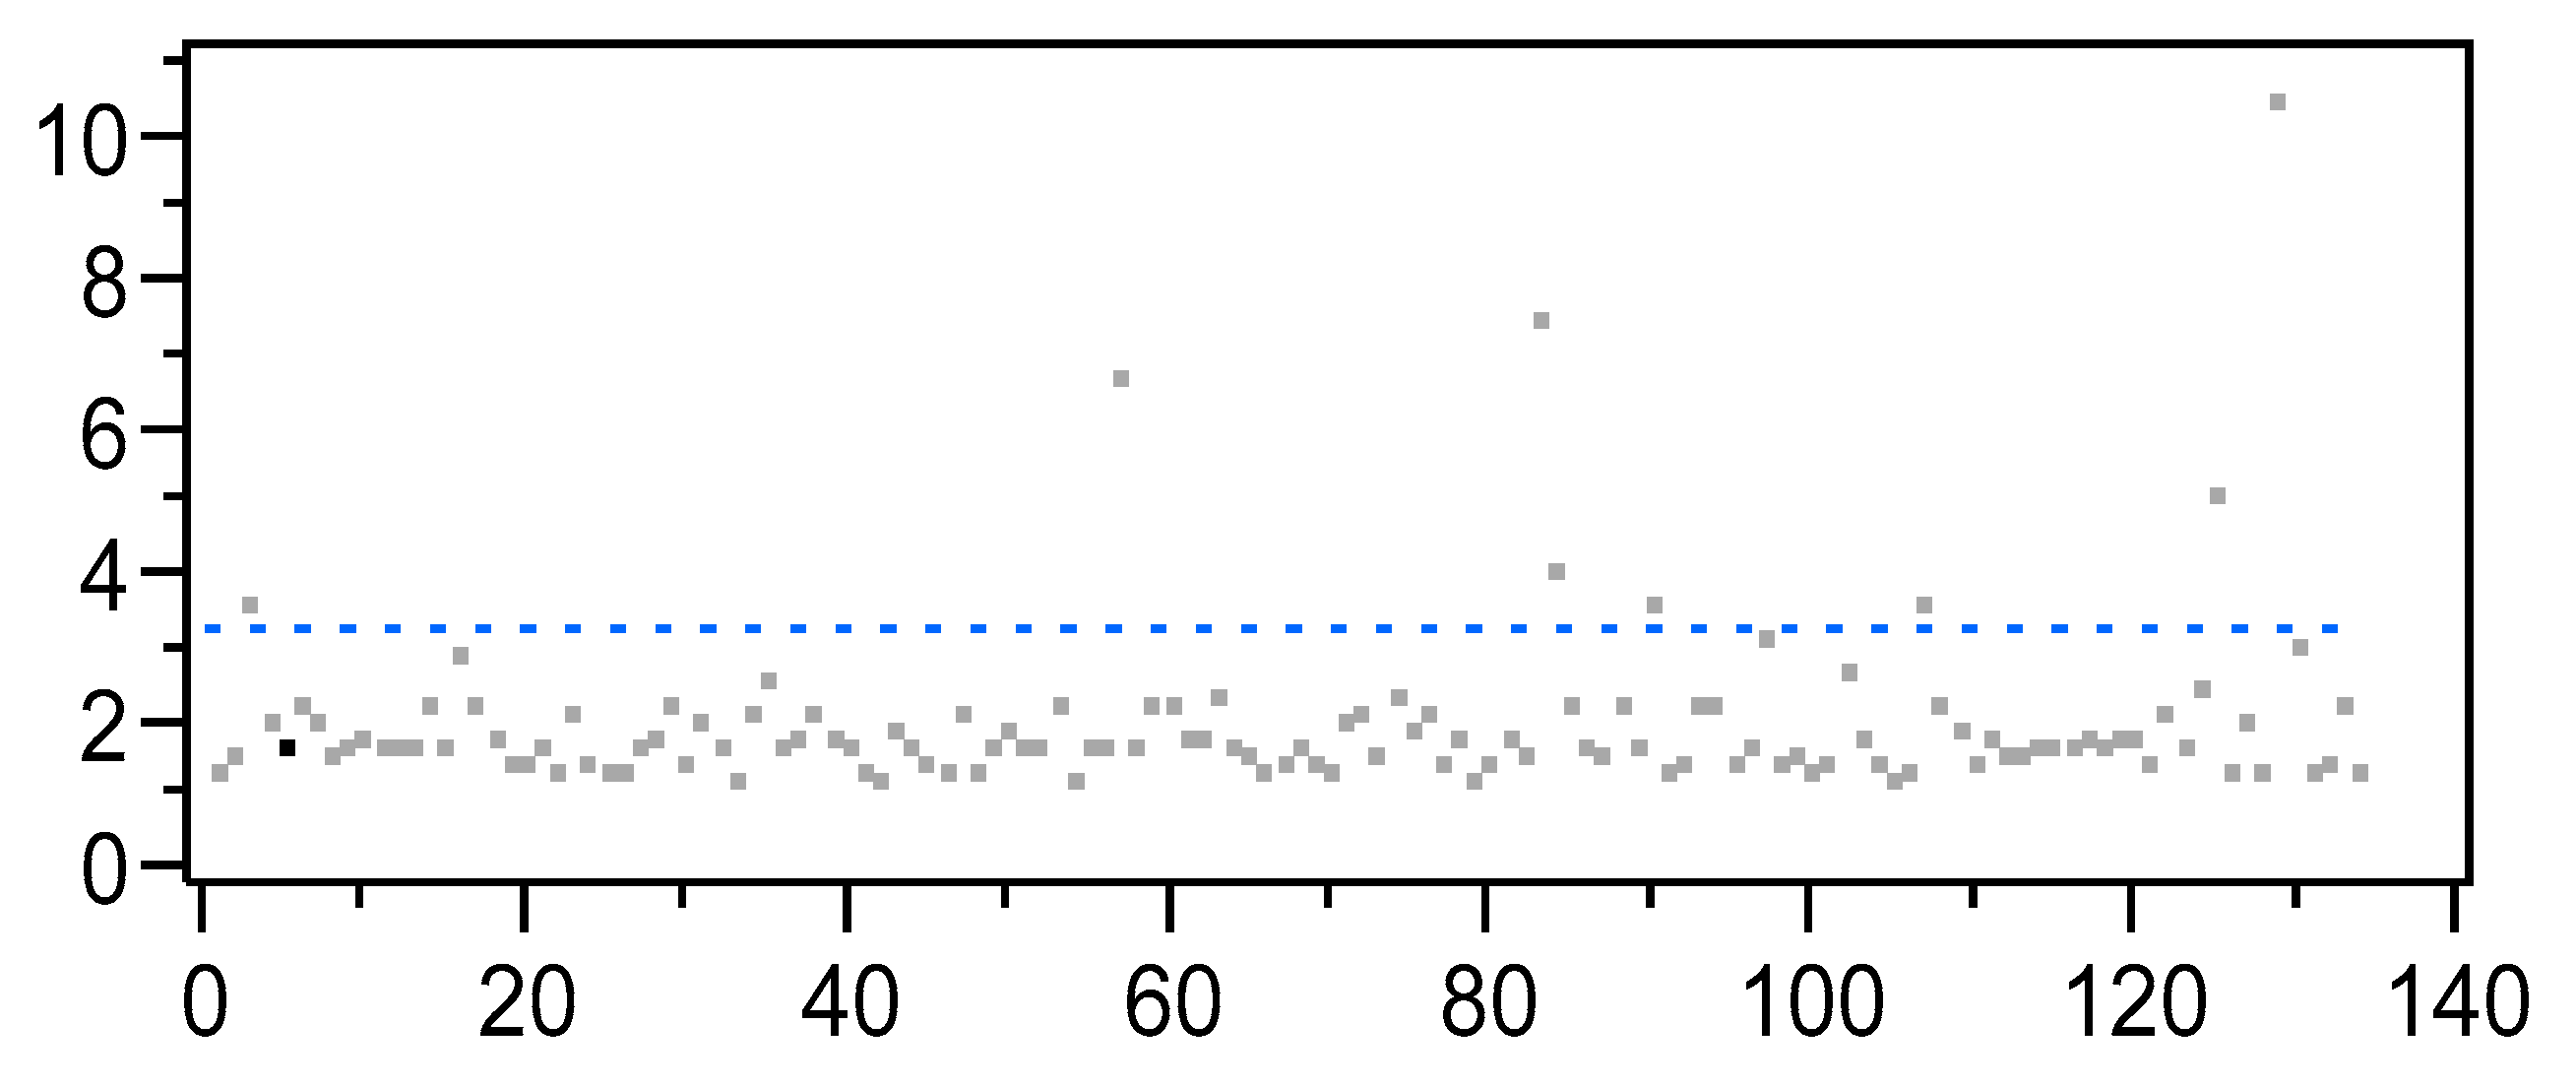
Only 4 of the 134 companies had outlier values. However, it was decided to include them in the analysis as difference in size and type of activity is a characteristic of the group evaluated (
Figure 3).
These analyses are the first step in the study. Further steps could evaluate groups of companies selected on the basis of specific parameters, such as size, type of activity, or the sector in which they operate, in order to evaluate how they influence the level of non-financial reporting.
The variables representing size, such as revenue (REV) and number of employees (EMPL) are highly variable. Revenue ranges from a minimum of 0.40 million to a maximum of 122.60 million euros, mean value = 3.12 million, standard deviation = 12.51 million.
There is also a wide range in the number of employees, from a minimum of 400 to a maximum of 91,526, mean = 6319.
The dichotomous variables (COMS and SDGC), which showed a significant correlation with GRISC, were analyzed separately using an independent
t-test (
Table 5).
For the COMS variable, 52 companies were found to have an internal sustainability committee while 82 did not. The former showed a mean GRISC of 0.508, which was higher than the latter, at 0.413, thus highlighting the important role of this committee. The hypothesis is sustained by a t-value of 1.550 (p-value < 0.10). Standard deviation for both groups was approx. 0.13.
Univariate analysis confirms the first research hypothesis.
Companies implement various programs and activities, such as establishing a sustainability committee to manage sustainability issues. This can have a relevant role in sustainability performances, so many studies have found a positive and statistically significant relationship between a sustainability report and sustainability committee [
128]. The companies with a sustainability committee inside the board of directors are more likely to be formally responsible for sustainability and have a better disclosure of non-financial information [
90,
91,
132].
Other studies found a weak relation between the presence of a CRS committee and the disclosure of a non-financial report, especially the disclosure of social information [
133]. Among the causes of the weak relationship, Michelon and Parabonetti identify the limited number of companies in the sample that have a sustainability committee.
This statement could give greater force to the result of our analysis because almost 40% of companies have a sustainability committee.
The policies introduced by companies to improve communication with stakeholders on sustainability issues include engaging different types of professional figures [
132,
133] on the management boards [
90].
The companies with a sustainability committee provide a greater extent of sustainability disclosure.
The presence of such committees can be a determining factor in assessing the willingness of the company to embark on a path of effective sustainable development.
In Italy, this body is appointed on a voluntary basis as part of a mandatory reporting system and undoubtedly highlights an effort for companies to increase the quality of NFD.
This is in line with the prevailing literature in which the quality of reporting, of which the breadth of information measured by the GRISC is a dimension, is proportional to virtuous conduct.
As to the second independent variable, i.e., referring to SDG goals in the company NFD report, univariate analysis showed 75 companies cited the SDG while the remaining 59 did not. The former had a higher GRISC, with a mean of 0.494, compared to the latter with a mean value of 0.395. Standard deviation for both groups was 0.151 and 0.090, respectively, and the t-value was 1.650 (p-value < 0.10).
This confirms the second research hypothesis.
The increased attention of companies to the sustainable development objectives shows they have a greater sensitivity which is reflected by more detailed information in the non-financial reports.
Some of the literature considers adherence to SDG goals a determining factor for the strategic choices and investments in sustainability [
134,
135].
On the other hand, the integration of SDG in the non-financial report is a way for companies to engage with a greater number of stakeholders [
94,
134] and increase accountability of sustainability information [
136].
5.3. Multivariate Analysis
After univariate analysis was performed, a comprehensive model of all the independent variables correlating to GRISC was tested using a multivariate statistical analysis, more specifically, by multiple linear regression—MLR.
The model studied considered the following variables:
Before performing the analysis, the conditions of absence of normality (the Jarque Bera test presents a value of 28.12 with a p-value = 0.000001) and absence of heteroscedasticity and multicollinearity (the VIF value is between 1 and 2 compared to a minimum threshold of 10) were verified
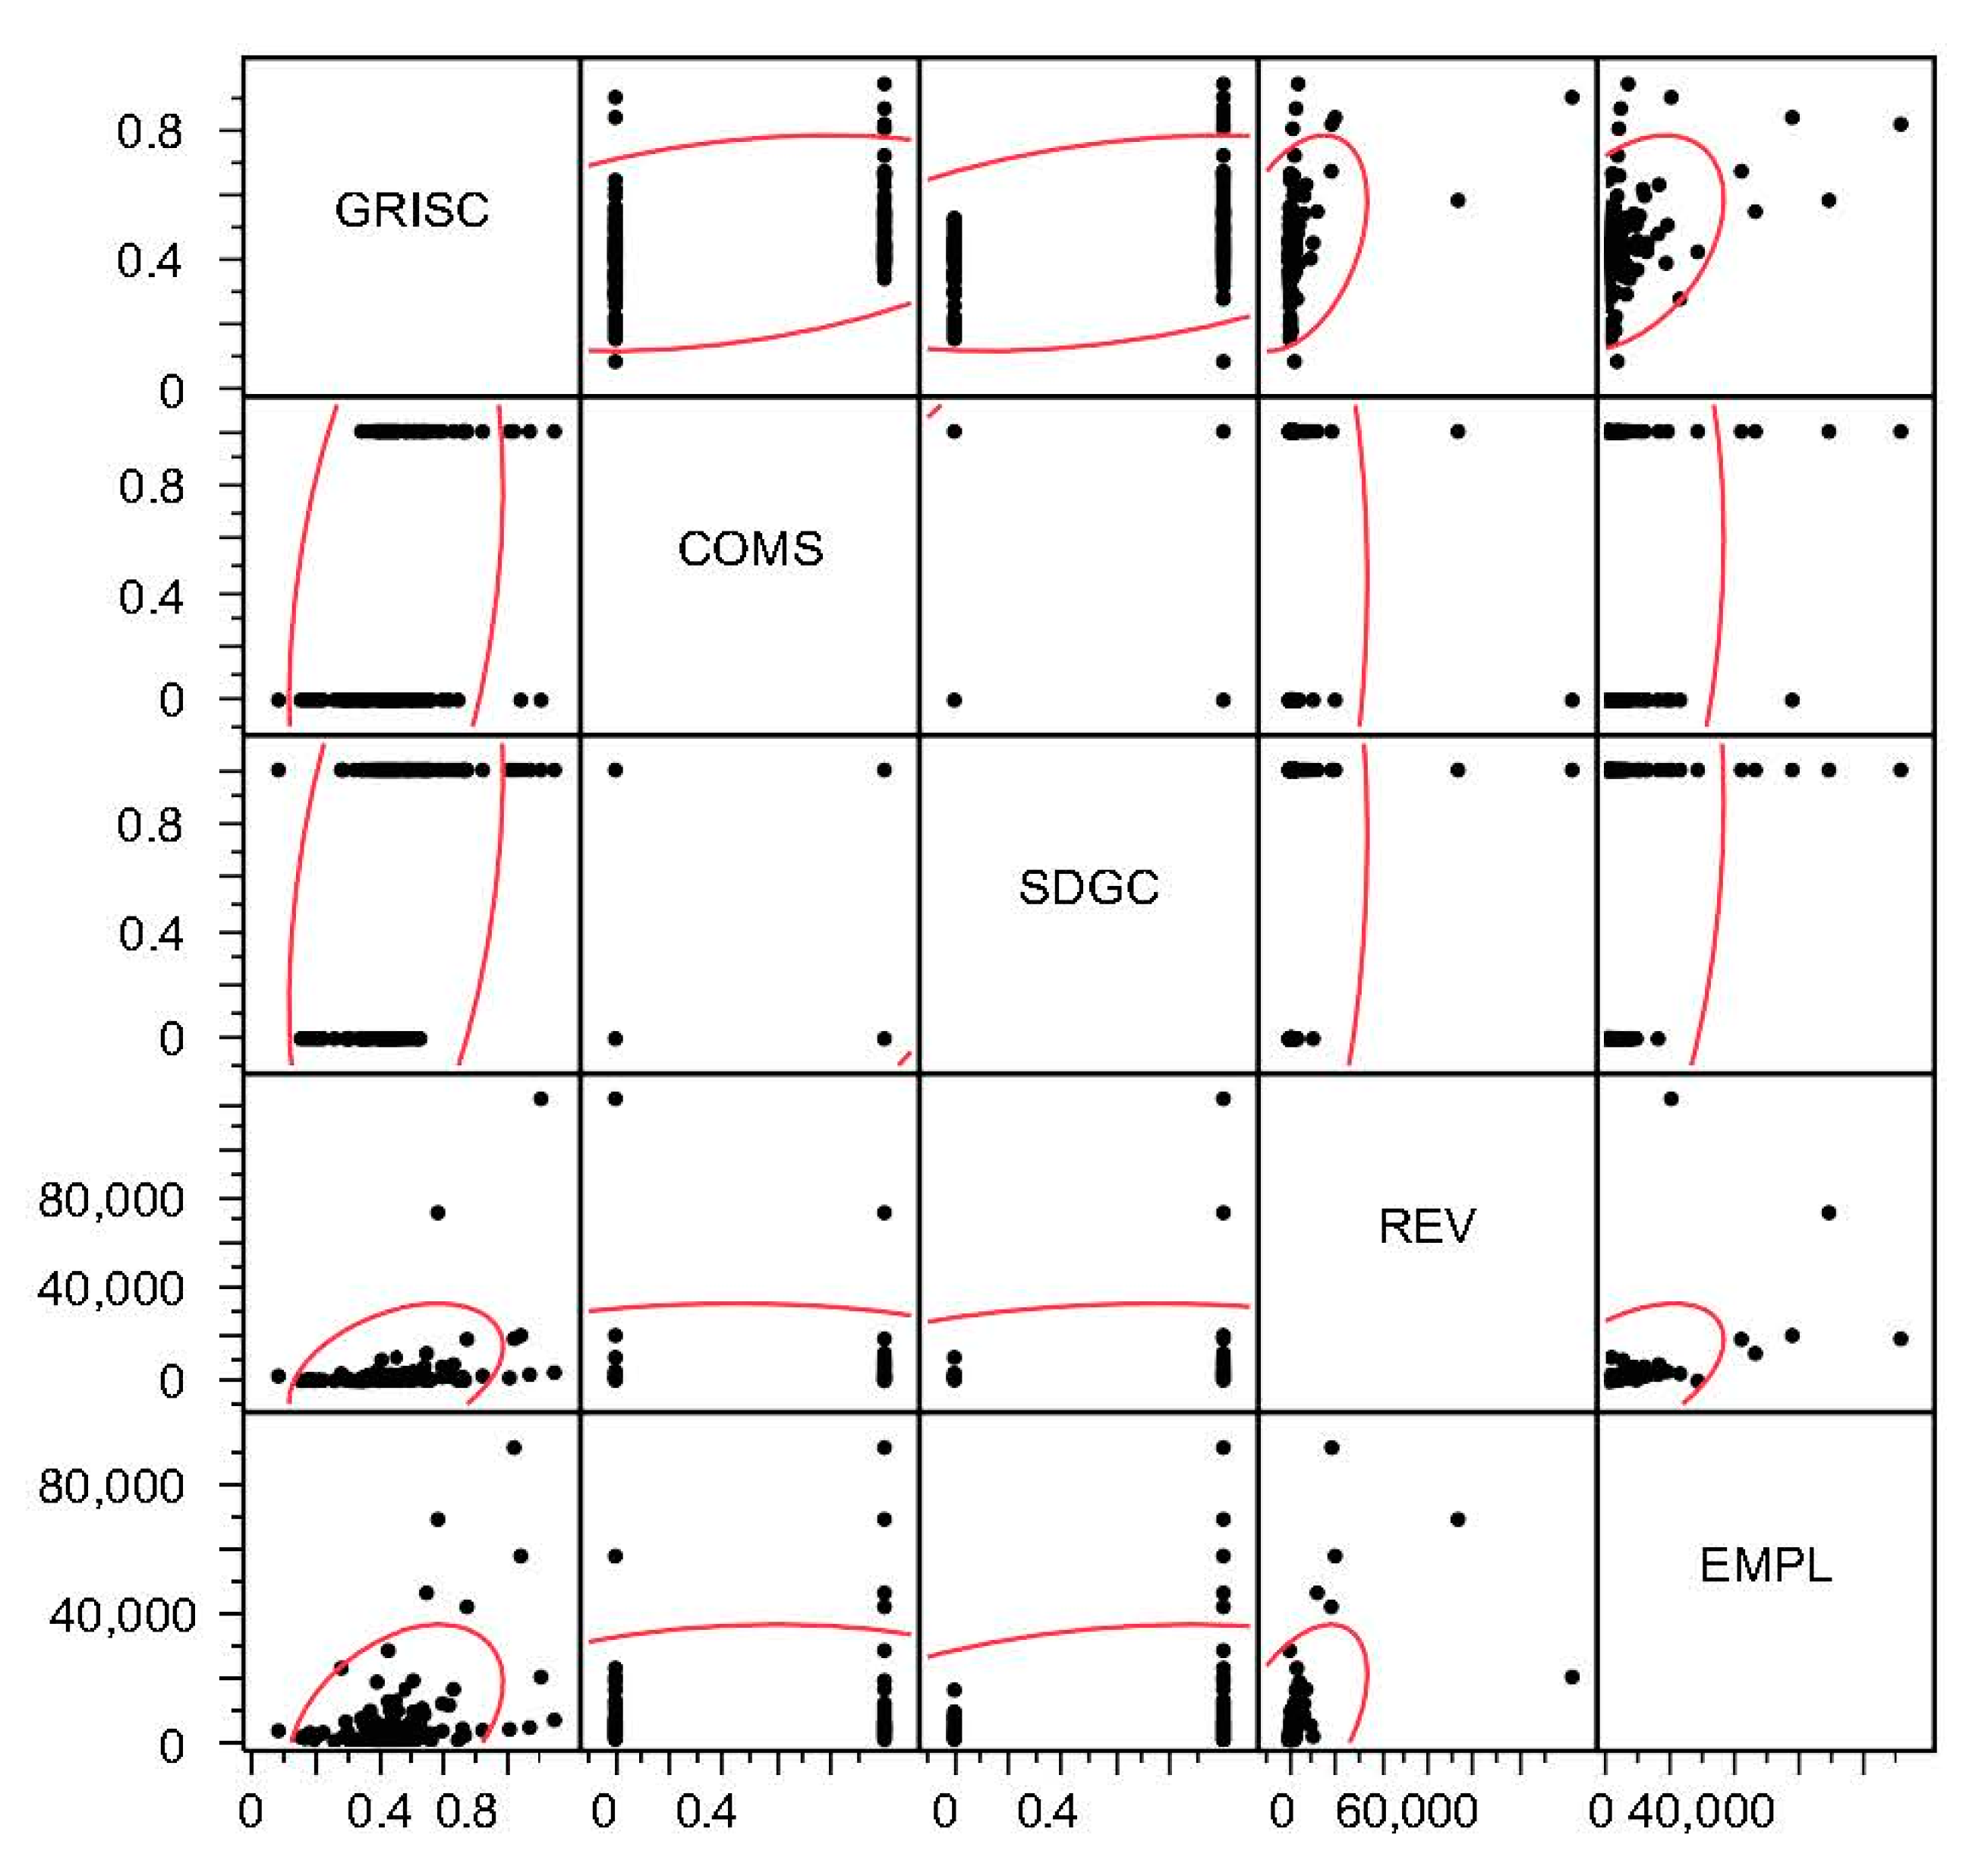
The correlation matrix was again applied with all the variables selected inserted into the model, resulting in a positive correlation (
Table 6,
Figure 4).
The highest correlation was in the dimensional variable relative to the number of employees (0.407). The independent variables were not significantly correlated to each other. In fact, there are only problems of multicollinearity when the co-efficient exceeds the value 0.8 or 0.9 [
137]. Moreover, the absence of multicollinearity was verified using the variance inflation factor (VIF) calculation (
Table 5). This ranged between 1.202 and 1.398, clearly inferior to the threshold of 10 that could determine multicollinearity [
138].
The results of MLS regression are summarized in
Table 7.
The model considers the independent variables EMPL, REV, COMS, and SDG, and explains about 30% of the GRISC variability, a dependent variable (Adj R-square, 0.298) with a high level of significance (p < 0.0001).
Regarding the values assumed by the regression coefficients, in particular, those relating to the number of employees (EMPL) and revenues (REV), we preferred to use the absolute values. As consequence, the low value of the regression coefficients expresses the variation of GRISC to the unitary variation of the number of employees or revenues.
The model further confirmed the first research hypothesis evaluated using univariate analysis. Therefore, a committee for sustainability in a company (COMS), as well as the citing of SDG (SDGC), determine a better report on company sustainability with an average to high significance of the result (p-value ** e ***).
The multivariate analysis model also demonstrates the relationship between GRISC and the number of employees (EMPL) and revenue (REV) as a proxy of the company size.
Company size is confirmed as a determining factor in sustainability disclosure. Both the variables positively express the correlation with GRISC, proving that larger companies publish fully-integrated reports in line with international standards.
This is also accepted by the majority of the literature which sustains that company size widens the range of stakeholders to whom they are accountable for ESG [
139,
140].
For this reason, alignment with widely accepted international standards can be an opportunity for a company to guarantee full understanding to all those interested in their activity [
130].
6. Conclusions
In this paper, we analyzed the extent of non-financial information provided by Italian companies obliged to report their activities in the ESG area by Legislative Decree 256/2016.
The analysis aims to provide scholars and practitioners with an objective measure of the extent of non-financial information, as well as to identify some variables that may positively affect it, such as the presence of a sustainability committee in the board of directors, the citation of SDG in the NFD, or other control variables e.g., number of employees and revenues.
This study contributes to the debate in the literature on non-financial reporting in different sectors.
Firstly, by creating an index (GRISC) based on report content that measures the breadth of information on sustainability and the approach of companies to sustainability. This was obtained from the compliance of the non-financial report with the disclosure of the new draft of the GRI standards and it measures the breadth of information on sustainability.
The most widely used standard is the GRI [
15,
16], which has been revised as of 2018. This is particularly true for Italian companies that, following Legislative Decree 254/2016, are obliged to publish a non-financial report. The new statement of the standard aims to create a disclosure model that takes the different aspects of sustainability into account.
This score was related to other variables, e.g., the existence of an Internal Sustainability Committee (COMS), SDG citation in NFD (SDGC), female presence in the governing bodies (DIV), number of employees and revenue (EMPL; REV), and ROA, previously investigated in the literature but, for the first-time, related to compliance with the GRI disclosure.
Initially, five variables were considered but two of them, the female presence DIV and ROA, were eliminated because there was no strong relation with the constructed score.
The analysis shows that the behavior of companies varies with regard to sustainability policies. The GRISC includes all the values of the interval evaluated, with a higher concentration on the average values. Companies are adapting to the norms that require them to provide information on the minimum standards of environmental, social, and governance sustainability policies. Only a few declare in their non-financial report to have implemented these policies at the highest level required by the GRI standards disclosure.
The presence of members responsible for sustainability issues at board level could indicate the company has an active strategic position with regard to stakeholders and sustainability strategies.
The involvement of professionals for the management and reporting of sustainability policies indicates a way to gain legitimacy and social acceptance for company operations [
133].
However, we cannot exclude cases in which the creation of sustainability committees has the sole purpose of creating a positive image without impacting on sustainability strategies.
As confirmed by other studies, a positive correlation was observed between GRISC and the presence of an internal committee on sustainability [
128,
141,
142]. Having such a committee as part of the management board can influence a company to pursue a sustainability policy, as shown in the non-financial reporting and the level of compliance with the GRI standards.
The positive correlation of GRISC with the SDG citation in the non-financial reports is also confirmed. This demonstrates that adhering to the UN Agenda 2030 is also an important opportunity for companies that, by following the SDG, commit to including the ESG as part of their strategic objectives [
135] and declare their sustainability policies in the non-financial report [
134].
Company size, represented here by the number of employees and revenue, is also positively associated with the compliance of non-financial reporting to the GRI standards thus confirming the current literature [
103,
104,
143].
Larger companies have a greater number of stakeholders to whom they are accountable, and the non-financial report represents an opportunity to gain their consensus on company activity [
130].
The highest association is with the number of employees, confirming that these companies are more aware of social policy and its reporting as a means of increasing development opportunities and reputation.
This analysis is a valid support both for the legislator who regulates the law and company governing bodies as it correlates the level of reporting with other variables, such as the internal sustainability committee, adherence to sustainable development goals, or female representation on the boards, thus underlining how these policies impact the quality of non-financial reporting.
The performances revealed by companies, in terms of sustainability evaluated with GRISC and correlated to the variables studied, could act as a stimulus for the legislator to evaluate the effects of the regulatory procedures already applied or for future application, or they could be a management tool to evaluate the policies enacted, or to be enacted, in order to improve the content of non-financial reporting.
For example, both regulators and management should encourage companies to establish sustainability committees or to adhere to SDG so they could expand the information on ESG dimension. On the other hand, the presence of women on the Board of Directors, mandatory in Italy since 2011, has now exhausted its positive effects on the performance of companies in terms of sustainability.
Furthermore, the GRISC determined on compliance with the GRI Index can become a parameter for assessing the information breadth of companies on sustainability matters. If used on a large scale, it could create competition between companies to expand sustainability actions.
While this research contributes to the existing literature in several ways, it has limitations that should be considered when interpreting its findings.
One limitation in this study is the heterogeneity of the companies studied, however this could be an opportunity for future research.
The results have shown interesting correlations between the level of compliance with the GRI standards and the variables evaluated, which could be studied further by dividing the companies by sector or area of interest.
The type of sector could influence the level of information included in the sustainability disclosure [
144,
145,
146,
147]. For example, due to the impact of company activities on environmental pollution, some sectors are more cautious when providing information, whether required to by law or submitted voluntarily [
70,
148].
Similarly, companies such as banks, that are prominent in the socio-economic environment, are required to provide an example for all companies and for society in general by assuming sustainable behaviors, which are reflected in their non-financial report [
134].
The same independent variables should be correlated with the information in the non-financial report, taking these specific features into consideration.
This research focuses only on one country and this limits the ability to generalize the results. Further studies could consider GRI adopting companies in different countries and perform a cross-country analysis.
A future research topic could be the impact of the effects of the COVID-19 pandemic on non-financial reporting by companies. By comparing non-financial information over time, it could be evaluated whether this event had positive effects due to the increased attention of stakeholders on the ESG of companies or whether the resulting economic crisis reduced the potential of companies to invest in sustainability policies.


