
Study on Relative Carrying Capacity of Land Resources and Its Zoning in 31 Provinces of China


1
Institute of Geographic Sciences and Natural Resources Research, Chinese Academy of Sciences, Beijing 100101, China
2
Chinese Academy of Natural Resources Economics, Beijing 101149, China
3
College of Resources and Environment, University of Chinese Academy Sciences, Beijing 100049, China
4
Key Laboratory of Carrying Capacity Assessment for Resource and Environment, Ministry of Natural Resources of the People’s Republic of China, Beijing 101149, China
*
Authors to whom correspondence should be addressed.
Sustainability 2021, 13(3), 1459; https://0-doi-org.brum.beds.ac.uk/10.3390/su13031459
Submission received: 31 December 2020
/
Revised: 26 January 2021
/
Accepted: 27 January 2021
/
Published: 30 January 2021
Abstract
:Land carrying capacity is an important indicator to quantitatively assess and judge the extents of sustainable economic developing and coexistent harmonizing between human and nature. The significance of land carrying capacity has been highlighted recently by the Sustainable Development Goals (SDGs) of the United Nations, which set clear requirements for arable, construction, and ecological lands. Theories and models of land carrying capacity, however, are suffering from the interference of artificial parameter setting and poor applicability. This paper attempts to overcome these limitations and propose a single factor assessment of the carrying capacity of cultivated land, construction land, and ecological land in terms of the relative carrying capacity from the perspective of a single factor assessment. Through mutual comparison, we found that the deviation caused by simulated parameter setting has been eliminated, and the relative status of each province and/or region in China has been obtained, which could provide a reference for the management and utilization of land resources. We argue that China can achieve basic self-sufficiency in both space capacity and food production without placing pressure on the global sustainable development. The results also indicate that carrying capacity state of the advanced development areas such as the eastern coastal region is relatively poor, while the carrying capacity state of the western region is relatively good.
1. Introduction
Facing the twin challenges of growing China’s economy and ameliorating the natural environment, the resources, and environmental problems of China have become serious and affected China’s sustainable development [1]. Research on resource and environment carrying capacity (RECC) is critical to address these problems and achieve national sustainable development [2]. Land resource carrying capacity (LRCC) is an indispensable part of RECC and one of the most important driving factors of economic development and environmental change [3]. Three of the sustainable development goals (SDGS) proposed recently by the UN, zero hunger (SDG2), sustainable city and community (SDG11), and life on the land (SDG15), are directly linked to land and require sustainable development of agricultural, construction, and ecological lands.
The research on land carrying capacity includes both single factors such as the carrying capacity of agricultural land, construction land, and ecological land, and comprehensive research on the carrying capacity of land [4].
The original research core of land carrying capacity focuses on the feeding capacity of agricultural land to population. Typical examples of such research include the work carried out by FAO in 1977 on the carrying capacity of land to population in developing countries [5] and more recently on agricultural land capacity and demand based on food security carried out by several researchers in different regions [6,7,8]. Research on land carrying capacity gradually expanded from the carrying capacity of cultivated land to the carrying capacity of construction land [9] and ecological land [10] and changed from the distinct type of land carrying capacity to the comprehensive carrying capacity of land [11].
The carrying capacity of construction land was the focus of several studies mainly analyzing urban land in different Chinese cities using ecological sensitivity analysis [9], land pressure index (LRP) [10] and system dynamics [12]. Some scholars also studied the carrying capacity of rural construction land using system dynamics model [13].
Scholars measure land ecological function by calculating land ecological carrying capacity, in which the ecological footprint is the widely used method [14,15,16,17,18,19].
The research on land comprehensive carrying capacity considers the comprehensive function of land resources. Several studies have recently addressed the comprehensive carrying capacity of land in different Chinese regions [11,20,21,22]. For a better comparison, many scholars use the method of relative carrying capacity to carry out comprehensive carrying capacity evaluation. Wang et al. studied the relative carrying capacity of the Tarim river basin based on land resources and water resources and taking Xinjiang as a reference case [23]. Yang et al. calculated the relative carrying capacity of Jiangsu province through four dimensions of nature, environment, society, and economy, using the weighted average method [24]. Li et al. calculated and analyzed the ecological footprint and ecological carrying capacity of 13 cities in Shanxi province [25]. Cheng Jingyao et al. constructed an evaluation index system for carrying capacity of resources and environment and evaluated the carrying capacity of resources and environment of 31 provinces and cities in mainland China [26].
The research method of land carrying capacity has changed from simple to complex, but there is no mature and accepted theory. The traditional method to study the carrying capacity of agricultural land is to quantify the relationship between land and population [7]. The ecological footprint method has been used in many studies on the carrying capacity of ecological land [17,18]. The index system method is used by many scholars to calculate construction land carrying capacity [9] and the land comprehensive carrying capacity [27,28,29,30], which uses the weight to synthesize. The system dynamics method calculates the carrying capacity according to the complex process of the system [12,13]. Other models have been also used including the layered production potential model [30], pressure-support, destructiveness-resilience, and degradation-promotion (PS-DR-DP) hexagon interaction model [31]. In addition, techniques such as remote sensing and geographic information systems have also been utilized in carrying capacity evaluation in recent years [17].
Research of single type of land carrying capacity for more specific problems, such as food security [32,33], the urbanization [34,35], and ecosystem evolution [36] is carried out. These studies estimate an absolute value based on a specific model, which provides a very good reference for solving specific problems. The evaluation objective of comprehensive land carrying capacity is mainly aimed at macropolicies and macrodecisions, such as land resource utilization strategy [37] and sustainable development [38]. Some models for the comprehensive land carrying capacity can obtain absolute numerical results. For instance, the system dynamics model can systematically simulate the process of land resources on the social economy, so as to discuss the carrying capacity of land resources on the social economy [12,13]. The ecological footprint method converts all kinds of resources consumed by human beings into standard land by ecological footprint, connects land resources and human needs, and then calculates land carrying capacity [15,16,17,18,19]. Some methods, such as index system method, only provide relative values, not the absolute answer to the problem. However, these methods can understand the advantages and disadvantages of the research object by comparing each other in the region, which has a good reference value in the regional balanced and sustainable development.
Although research on carrying capacity provides useful information, there are several limitations to existing research. First, although the research on the carrying capacity of agricultural land continues to expand, the capacity of cultivated land to feed the population has been neglected. Some indicators and parameters of the carrying capacity of land to population are still uncertain [39]. Second, the UN sustainable development goals put forward the requirements of sustainable development of land resources for agricultural (SDG2), construction (SDG11), and ecological lands (SDG15). however, there are a few studies on the comprehensive carrying capacity of land that put the three factors together. On the contrary, some comprehensive studies introduce too many economic and social indicators, which complicate the research and depart from the core requirements of the research on land carrying capacity. Third, some current evaluation methods, such as index system method, ecological footprint method and system dynamics method, are relatively complex. And the scientific accuracy of a variable parameter setting in the system has yet to be discussed. Their lack of operability and extensibility makes them difficult to be applied to the daily management of land by the government. In addition, most of the output is only a single result, and the process of weak grasp. Fourth, most of existing research on relative carrying capacity is compared between different units. there is no comprehensive evaluation system that can not only compare each other but also reflect the overall level of one’s own position in the region.
This paper is aimed at addressing these limitations by establishing an evaluation system of comparative carrying capacity. First, the absolute value of agricultural land, construction land, and ecological land was evaluated by single index evaluation method. Then the comprehensive carrying capacity of land was obtained by combining the results of single index. The model was used to evaluate the land carrying capacity of 31 provinces (excluding Hong Kong, Macao, and Taiwan) in China. This paper also classifies 31 provinces according to land resources and land carrying capacity.
2. Materials and Methods
In this paper, the evaluation of land resource carrying capacity includes single index evaluation and comprehensive evaluation. The single index evaluation considers the security of land for food production, space accommodation, and ecological demand of the population. Comprehensive carrying capacity represents the comprehensive carrying capacity and pressure of land resources. Through the background and carrying state partition, the distribution of the partition can be displayed by ArcGIS, which can directly show the current pattern of China’s land and carrying capacity.
In the analysis section, single index evaluation has been conducted initially by the model of land carrying capacity proposed by Feng Zhiming [39]. The core of this model is the number of people supported by the customary land producing food. The carrying capacity of construction land and ecological land also adopt the same idea, that is, how many people can be supported. These indicators are a direct result of the output capacity of cultivated land and the supply and security capacity of the population. In order to measure the carrying state of different regions, the ratio of population to carry capacity is used as the carrying state, and the relative value of different regions is compared to offset the result difference caused by the difficulty in determining the parameter setting. Using the World bank doing business zone method, the level of one evaluation unit in all evaluation units is measured by integrating the population carrying capacity of agricultural land, construction land, and ecological land.
The evaluation of land carrying capacity in this paper considers three types of land, which is relatively comprehensive. The method removes the social and economic factors in general evaluation, avoids the impact of different land use efficiency in different areas, and objectively represents the carrying status of the land itself. The relative carrying capacity was represented by the relative positions of different provinces, and the influence of different general parameter settings on the results was removed. The output result shows that the comprehensive carrying capacity state can be used in the formulation of land use strategy, and the classified land carrying capacity state calculated in the process can be used in the classified land use management. The principle of the method is simple, the process is clear, and it has good operability and extensibility. In this method, the data is more available, the data source is reliable, and the result is objective.
2.1. Single Factor Evaluation
It is a simple and scientific method to calculate the carrying population based on cultivated land production and food demand. The carrying state of cultivated land (Equation (1)) as the index of carrying capacity can be estimated by comparing the existing population with the carrying population. The carrying capacity index reveals the pressure of population on land resources. If the carrying index is greater than 1, it indicates that there is some pressure, and if the carrying index is less than 1, there is no pressure. This paper extends this to construction land and ecological land, that is, how many people’s living demand can be met by the supply of construction land (carrying capacity of construction land), and how many people’s ecological demand can be guaranteed by the ecological products and services provided by ecological land (the carrying capacity of ecological land). Then, calculate the corresponding carrying capacity index.
where CIij is the carrying capacity index of land type j for province or region i, Pi is the population of province i, Lij is land type j provided by province or region i, and Dj is Per capita demand for land of type j.
When J is cultivated land, Lij is the cultivated land available; Dj is cultivated land demand per capita. According to the nutrition standard recommended by the food and agriculture organization of the United Nations, the basic food requirements per capita in China is 400 kg/year/person as estimated [40].According to the basic food requirements per capita and the unit production capacity of land grain in each province provided by the National Bureau of Statistics, the cultivated land demand per capita can be calculated.
When J is Construction land, Lij is the current construction land; Dj is demand for construction land per capita. It is equal to 150 m2/person according to the Urban planning in China [41].
When J is ecological land, Lij is the current ecological land; Dj is demand for ecological land per capita. It is equal to 4344 square meters per person by dividing all the ecological land in China by all the population.
2.2. Comprehensive Evaluation
There are 3 indicators of land carrying capacity, which respectively represent the carrying status of each single factor and reflect the pressure of population on land resources.
It is extremely complicated to comprehensively evaluate different indicators. The world bank has used the average ranking to synthesize all the indicators in its “doing business” index ranking [42]. When assessing countries’ baselines for the sustainable development goals (SDG), Guido Schmidt-Traub (2017) aggregated indicators arithmetically within each SDG and then averaged across goals, applying the same weight to every goal [43]. This paper uses a similar method to carry on the synthesis of each single index of carrying capacity.
The relative carrying capacity index is obtained by the position of each index in the interval formed by the best and the worst of 31 provinces and cities. Data for each indicator of 31 provinces was normalized on a linear scale of 0 to 100. The average of the last 10% and the first 10% was, respectively, defined as 100 points and 0 points to ensure extreme values did not skew the distribution. We aggregated indicators arithmetically within each goal and then averaged across goals, applying the same weight to every goal according to Equation (2):
where Ci is the index score for province i, N is the number of indicators, Sij is the score of indicator j for province i.
2.3. Coefficient of Variation
By calculating the coefficient of variation, the discrete status of carrying capacity of different types of land in each province is measured, and the equilibrium status of land resources in each province is shown. The coefficient of variation is a normalized measure of the dispersion of distribution, which is the ratio of standard deviation to mean. However, this paper simply refers to it to measure the equilibrium degree of three land single factor evaluation results, that is, the closer the coefficient of variation is to 0, the more balanced the carrying capacity of cultivated land, construction land, and ecological land will be. Thus, it can be inferred that whether the population carrying capacity of cultivated land, construction land, and ecological land is balanced in the development process of a region is of indicative significance to whether a region needs to focus on more balanced development in terms of land.
where C.Vi is the coefficient of variation province i, N is the number of indicators, and Sij is the score of indicator j for province i.
2.4. Partition
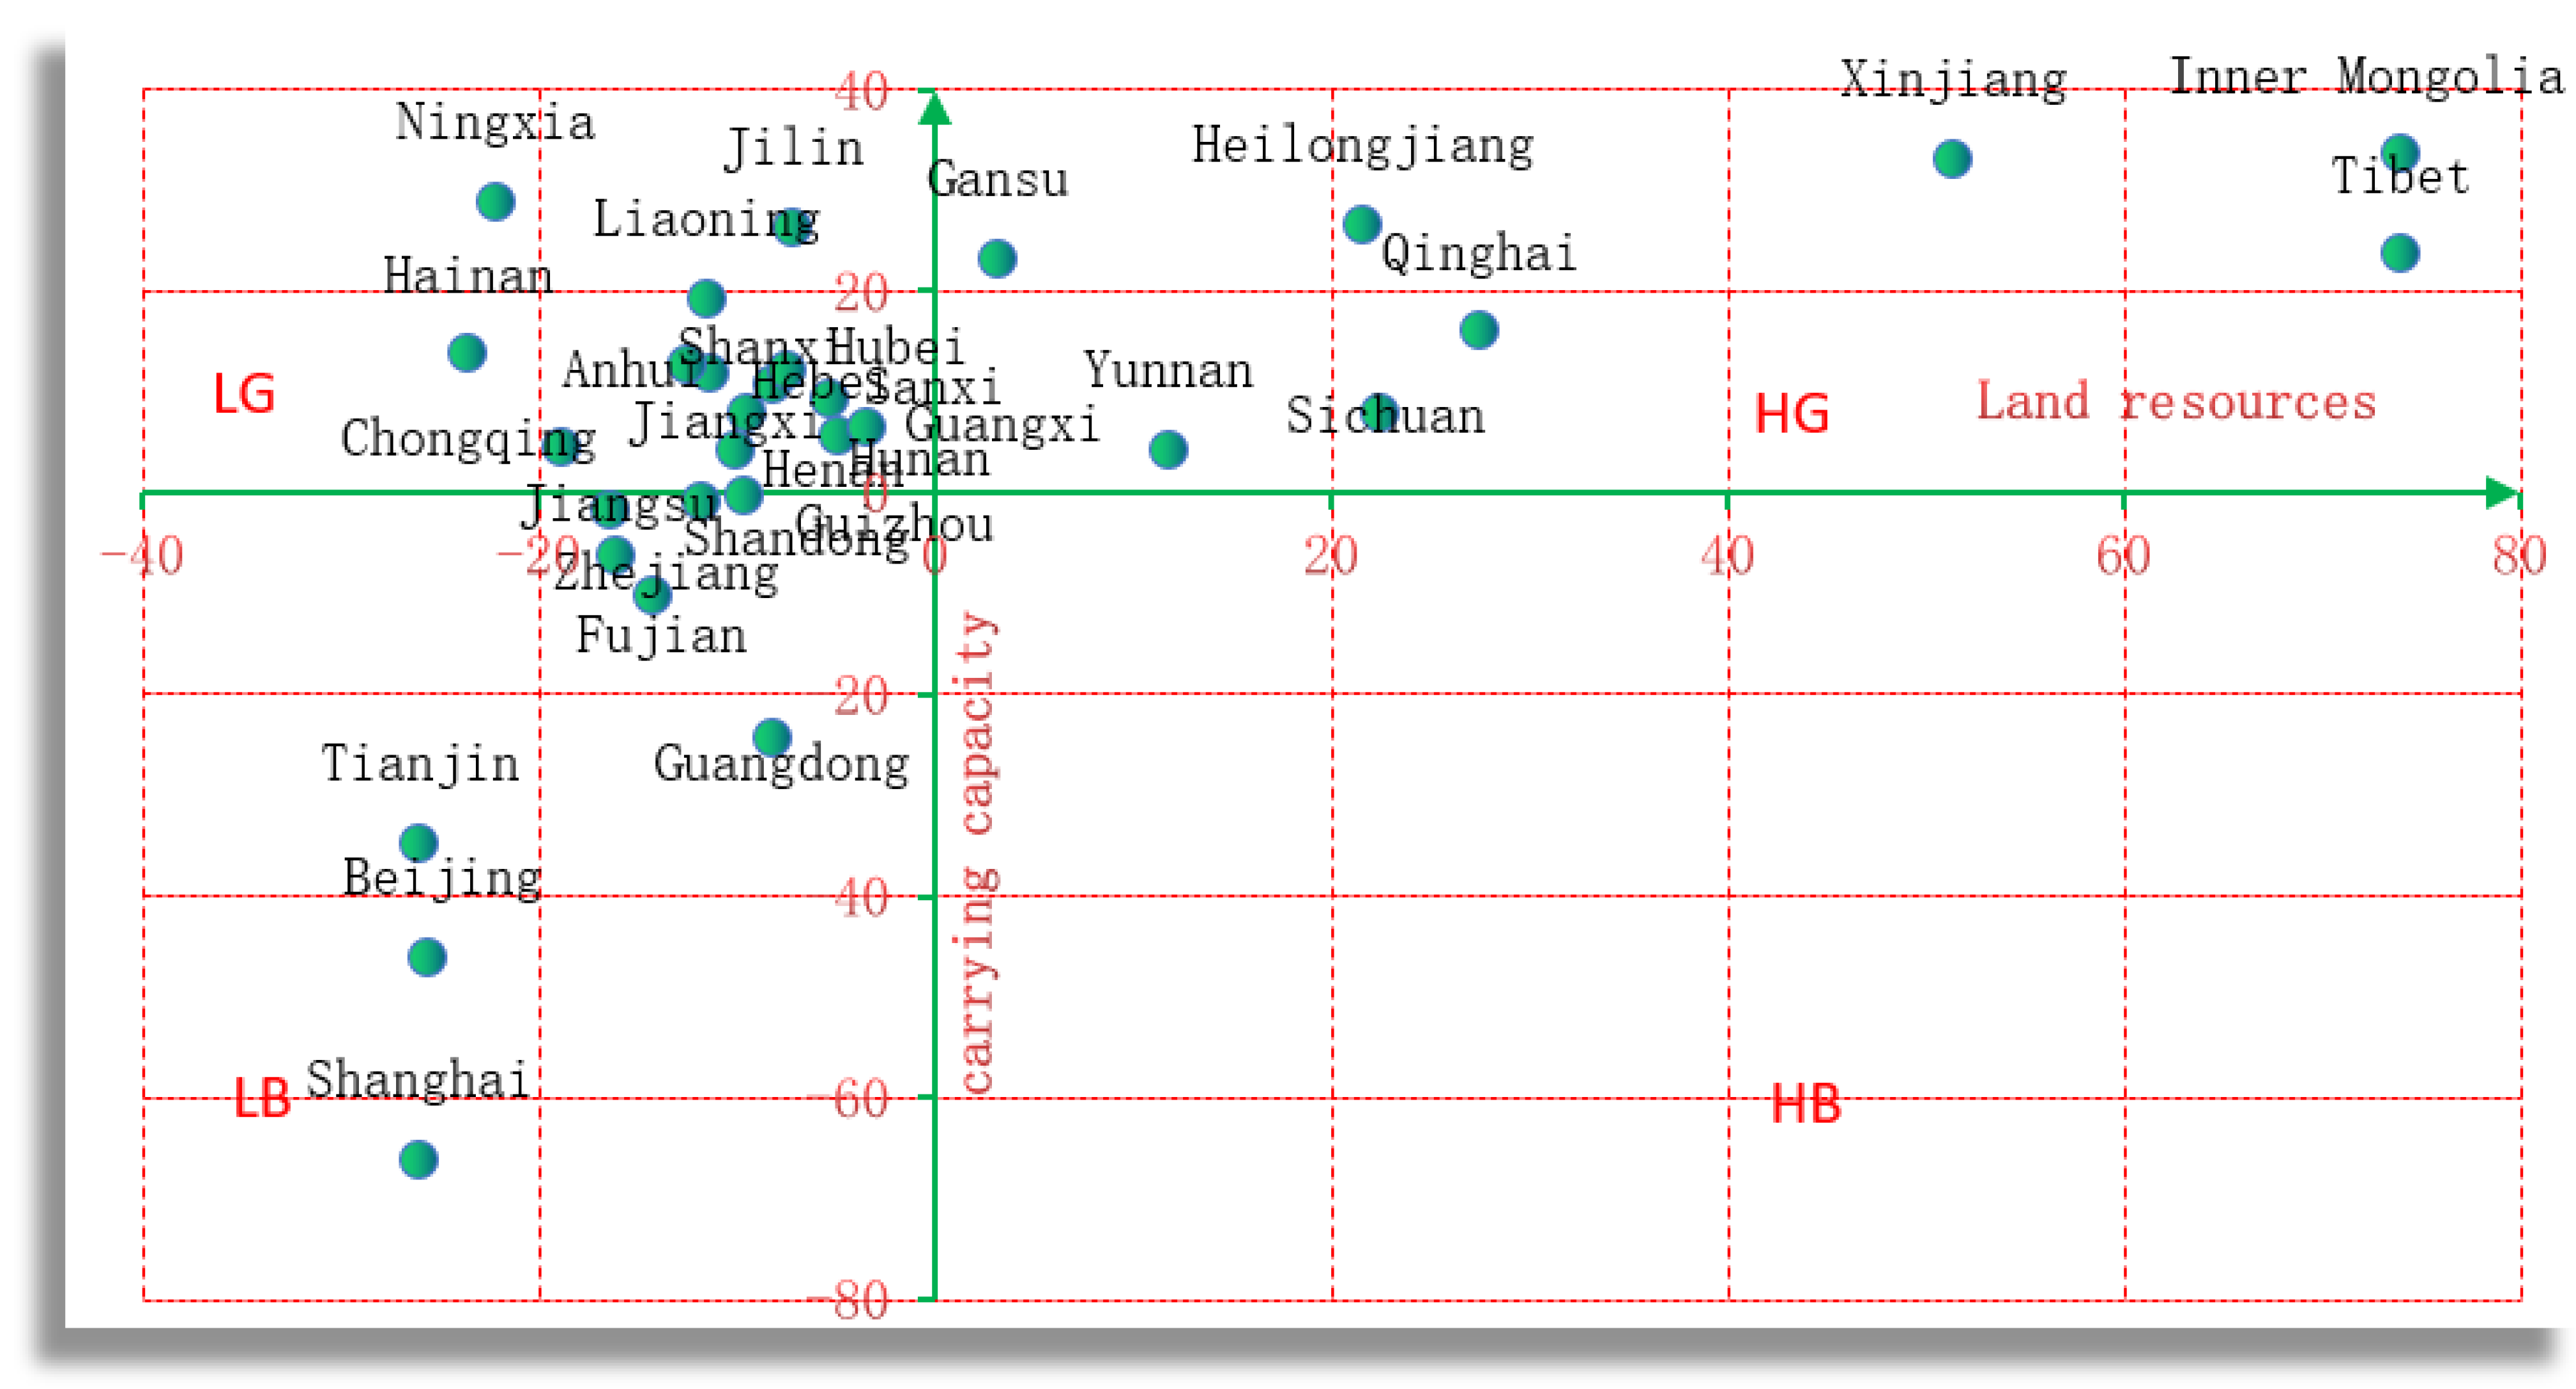
Through the comparative analysis of the background status of land resources and the comprehensive carrying capacity of land, the two-dimensional coordinate system is established. The X-axis represents the background status of land resources in a region, specifically the total resources of cultivated land, construction land, and ecology. The total land resources of 31 provinces were standardized, the national average value was set to 0, and the space between the highest score and the lowest score is evenly divided into 100 parts, each of which is 1 point. The score of each region was determined as the X value. The Y-axis represents the comprehensive carrying capacity of land resources. It is also standardized. The average value of the domestic relative carrying capacity is set to 0, the space between the highest score and the lowest score is evenly divided into 100 parts, each of which is 1 point. The score of each region is determined as Y value. The X-axis crosses the Y-axis to form four quadrants. Thirty-one provinces were divided into four categories. The first quadrant, marked as High Good (HG), indicates that the land resource potential is high and the land carrying condition is good. The second quadrant indicates that the land resource potential is low and the land carrying status is good, which is marked as Low Good (LG). The third quadrant marked as Low Bad (LB) indicates that the land resource potential is low and the land carrying status is bad. The fourth quadrant marked High Bad (HB) indicates that the land resource potential is high and the land carrying condition is bad.
2.5. Data
Data of land resources has been obtained from the Ministry of Natural Resources of the People’s Republic of China [44]. The criteria for land classification came from China’s second national land survey. The arable land includes paddy, dry, and irrigated land. The Construction land includes land for cities, towns, and villages. The ecological land includes woodland, grassland, water area, mudflat, and wetland. Population data and average yield of grain in the region have been obtained from the China’s national bureau of statistics [45].
3. Results
3.1. Carrying Capacity of Cultivated Land
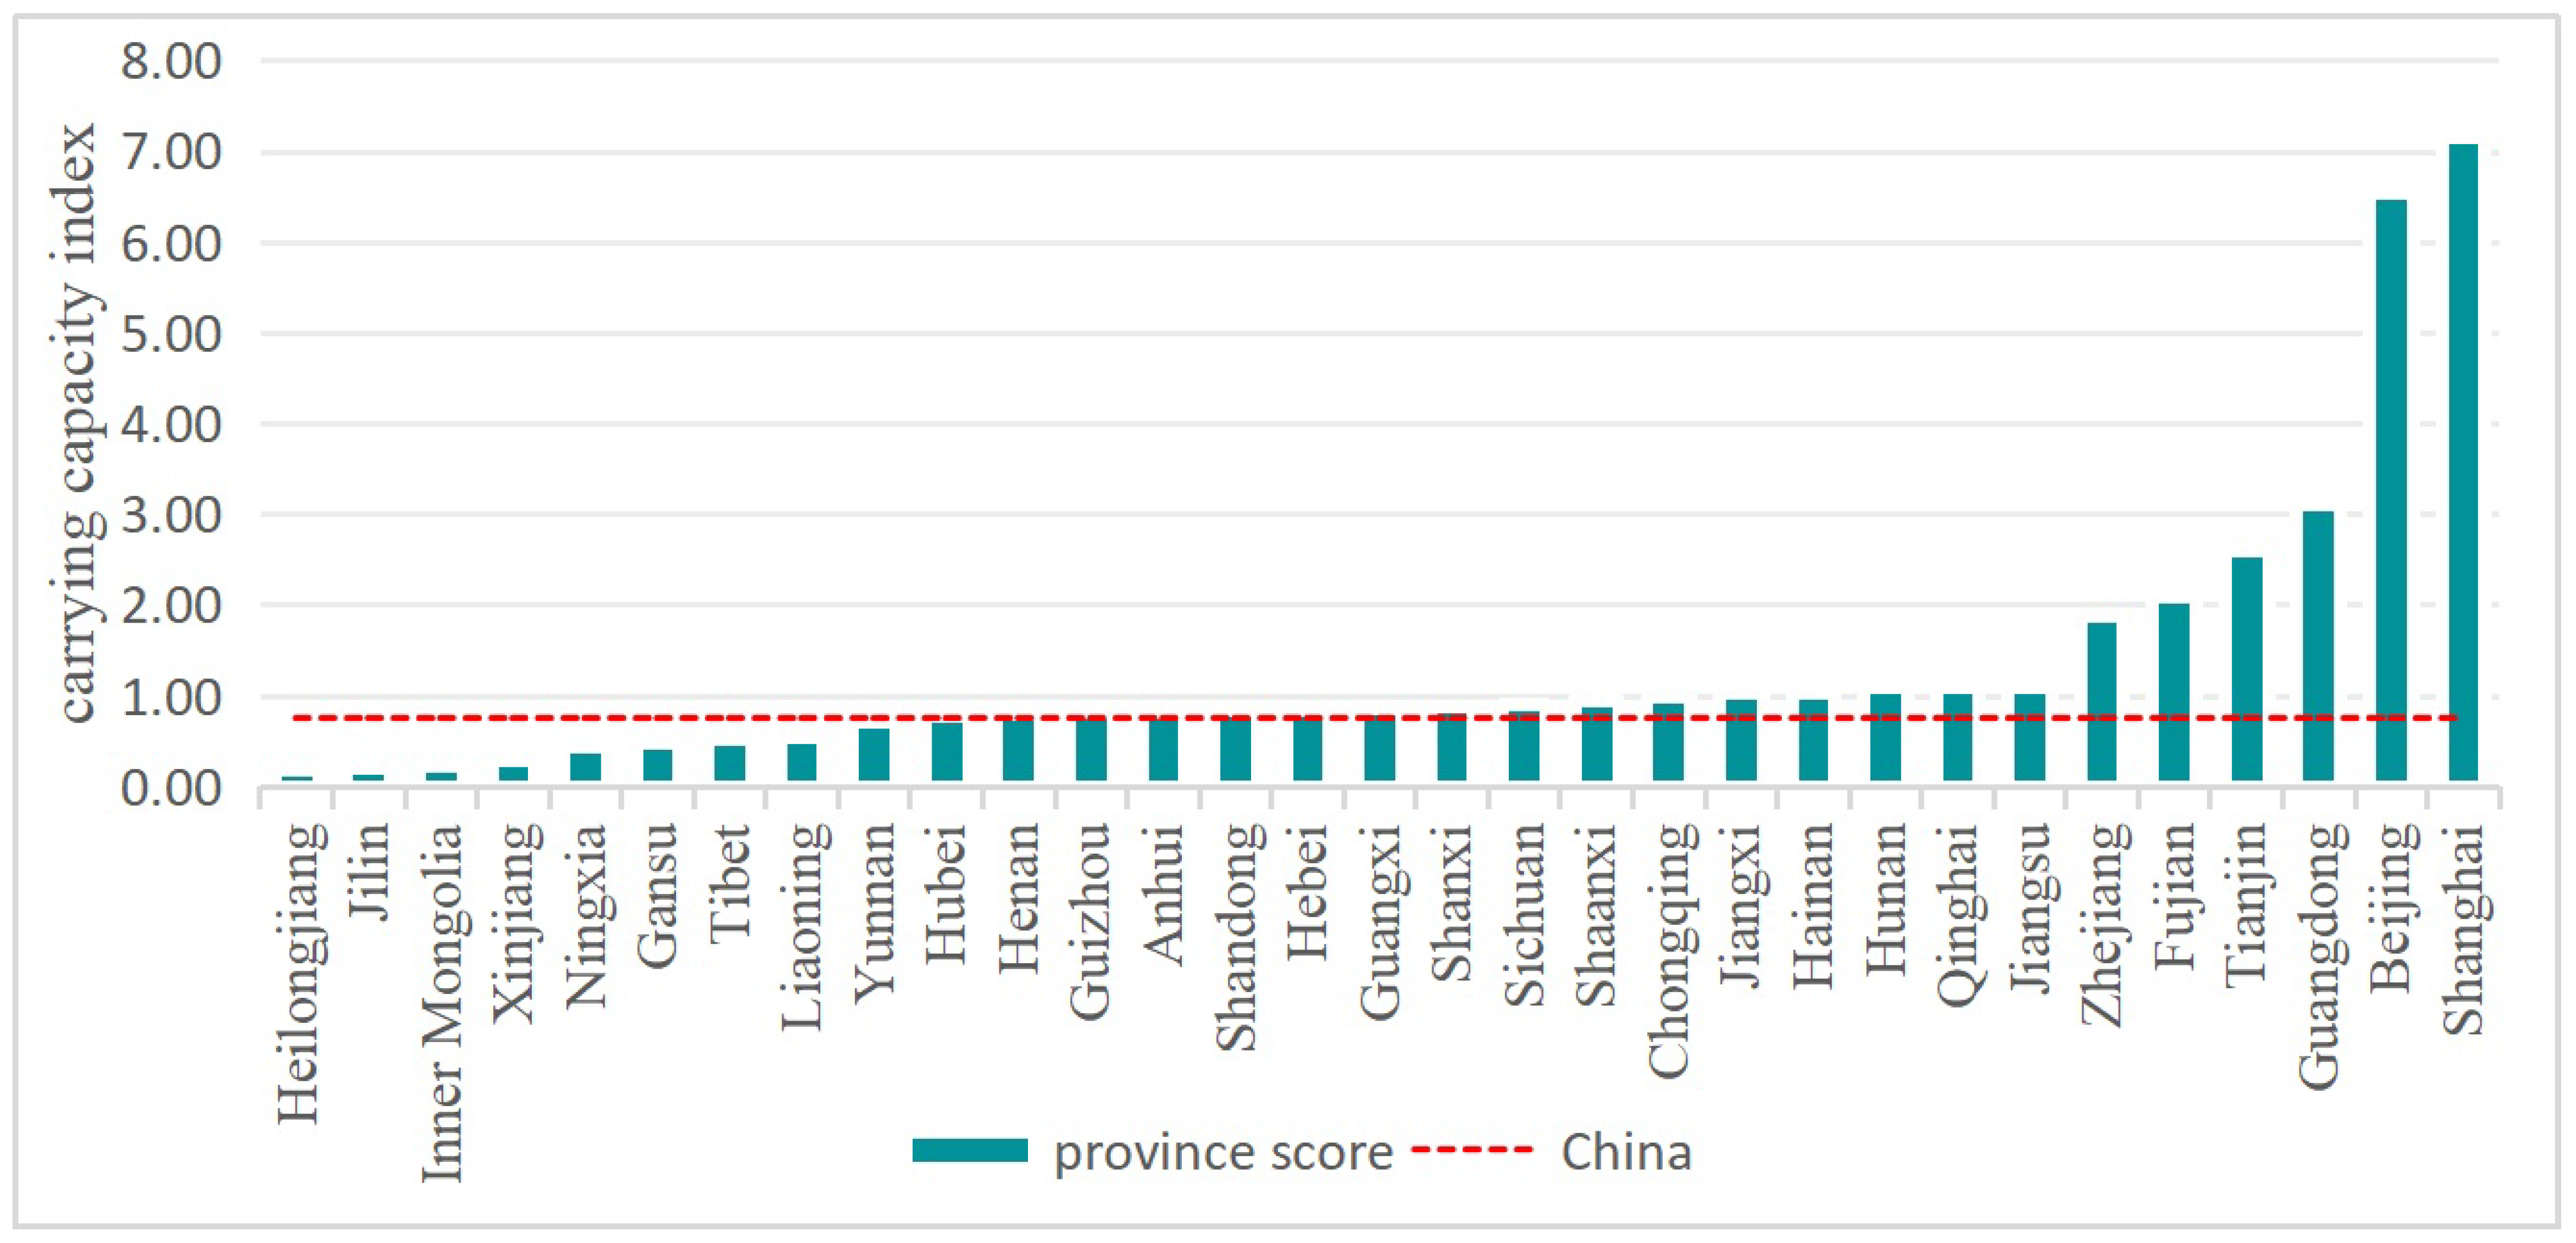
The carrying capacity index of cultivated land in China and in the 31 provinces and cities, which indicates the pressure of the existing population on cultivated land resources, is shown in Figure 1. The cultivated land in China could meet the populations need for food indicated by the carrying capacity index value of China’s cultivated land which is 0.75. However, there are significant differences in the carrying state of cultivated land in various provinces and cities in China (Figure 1). The carrying state index value of cultivated land in 11 regions is greater than one, and the population exerts different pressures on cultivated land resources. While the carrying state index value of cultivated land in 20 regions is less than 1, and its cultivated land resources can meet the demands of the population. The carrying state is poor in several cities including Beijing, Shanghai, Guangdong, and Tianjin. These are the regions with good economic development in China, especially Beijing, Shanghai, and Tianjin, which are municipalities directly under the central government and have large population density, thus bringing huge pressure to cultivated land resources. Areas with good carrying status of cultivated land include Inner Mongolia, Xinjiang, Ningxia, Gansu, Tibet, and other western regions, as well as the fertile areas of Liaoning, Jilin, and Heilongjiang.
3.2. Carrying Capacity of Construction Land
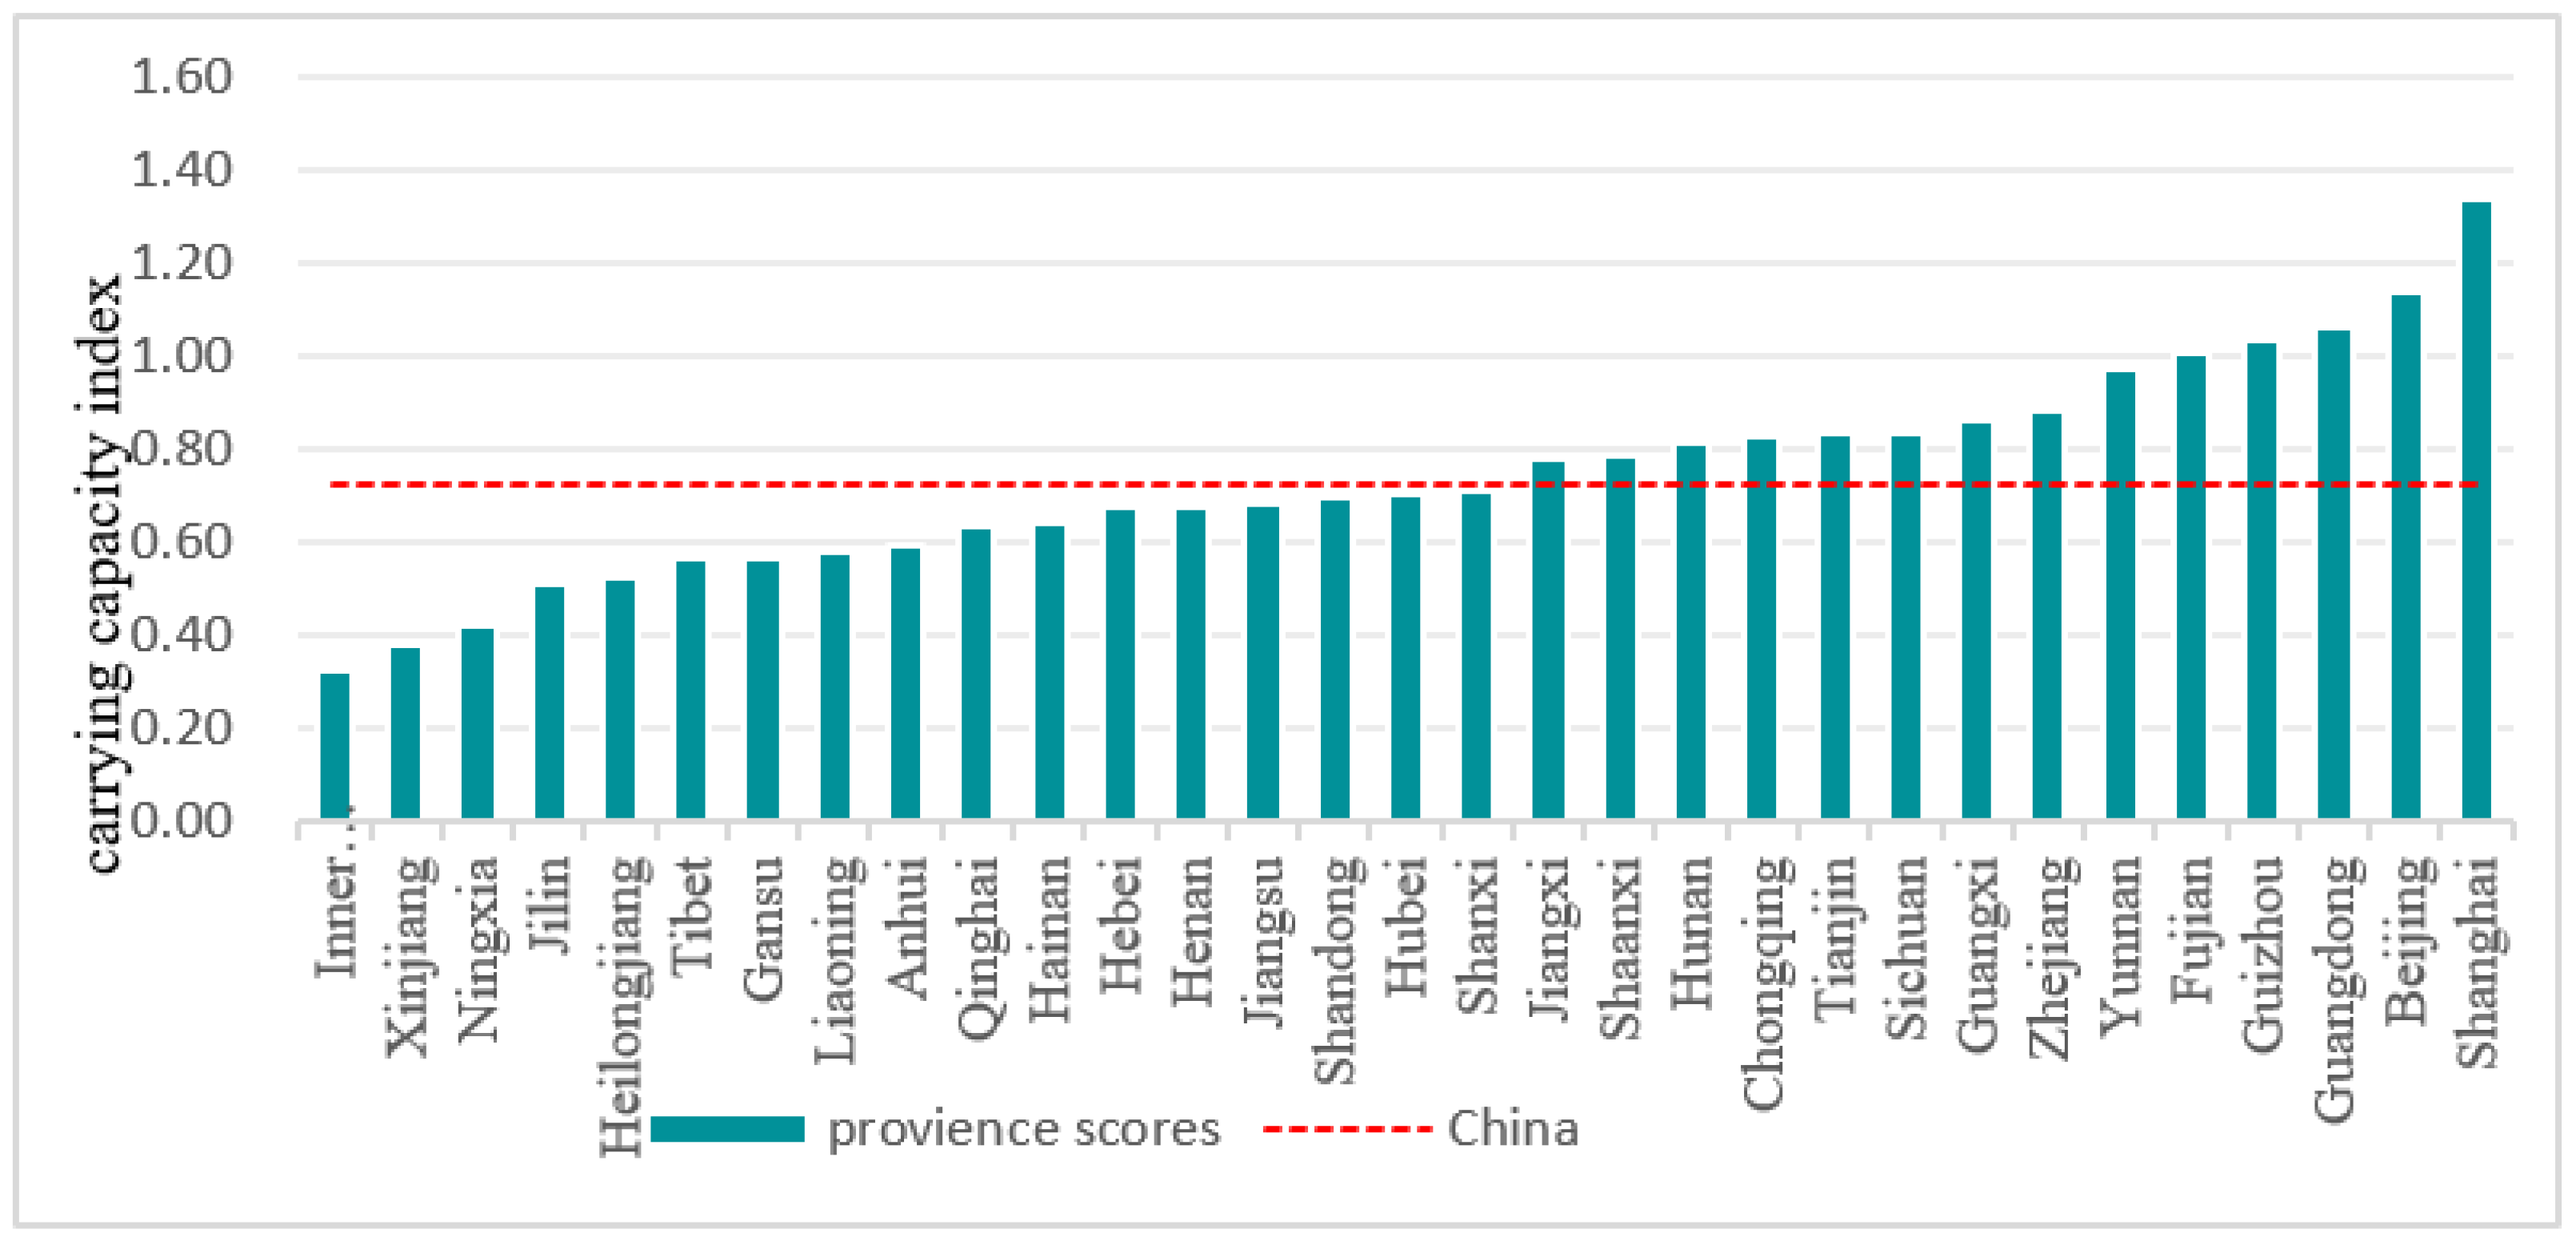
The carrying capacity index of construction land in China and the 31 provinces and cities, which indicates the pressure of the existing population on construction land resources, is shown in Figure 2. The carrying capacity index value of China’s construction land is 0.72 and therefore could meet the production and living space needs of the population. The population of most provinces has almost no pressure on the construction land resources, however, some provinces are under pressure including Beijing, Shanghai, Guangdong, Fujian, and Guizhou. However, the pressure is much less than that of cultivated land. Beijing, Shanghai, Guangdong, and Fujian belong to the developed area, thus, the construction land development intensity is enormous, while Guizhou is a mountainous province, so there is some pressure on the construction land.
3.3. Carrying Capacity of Ecological Land
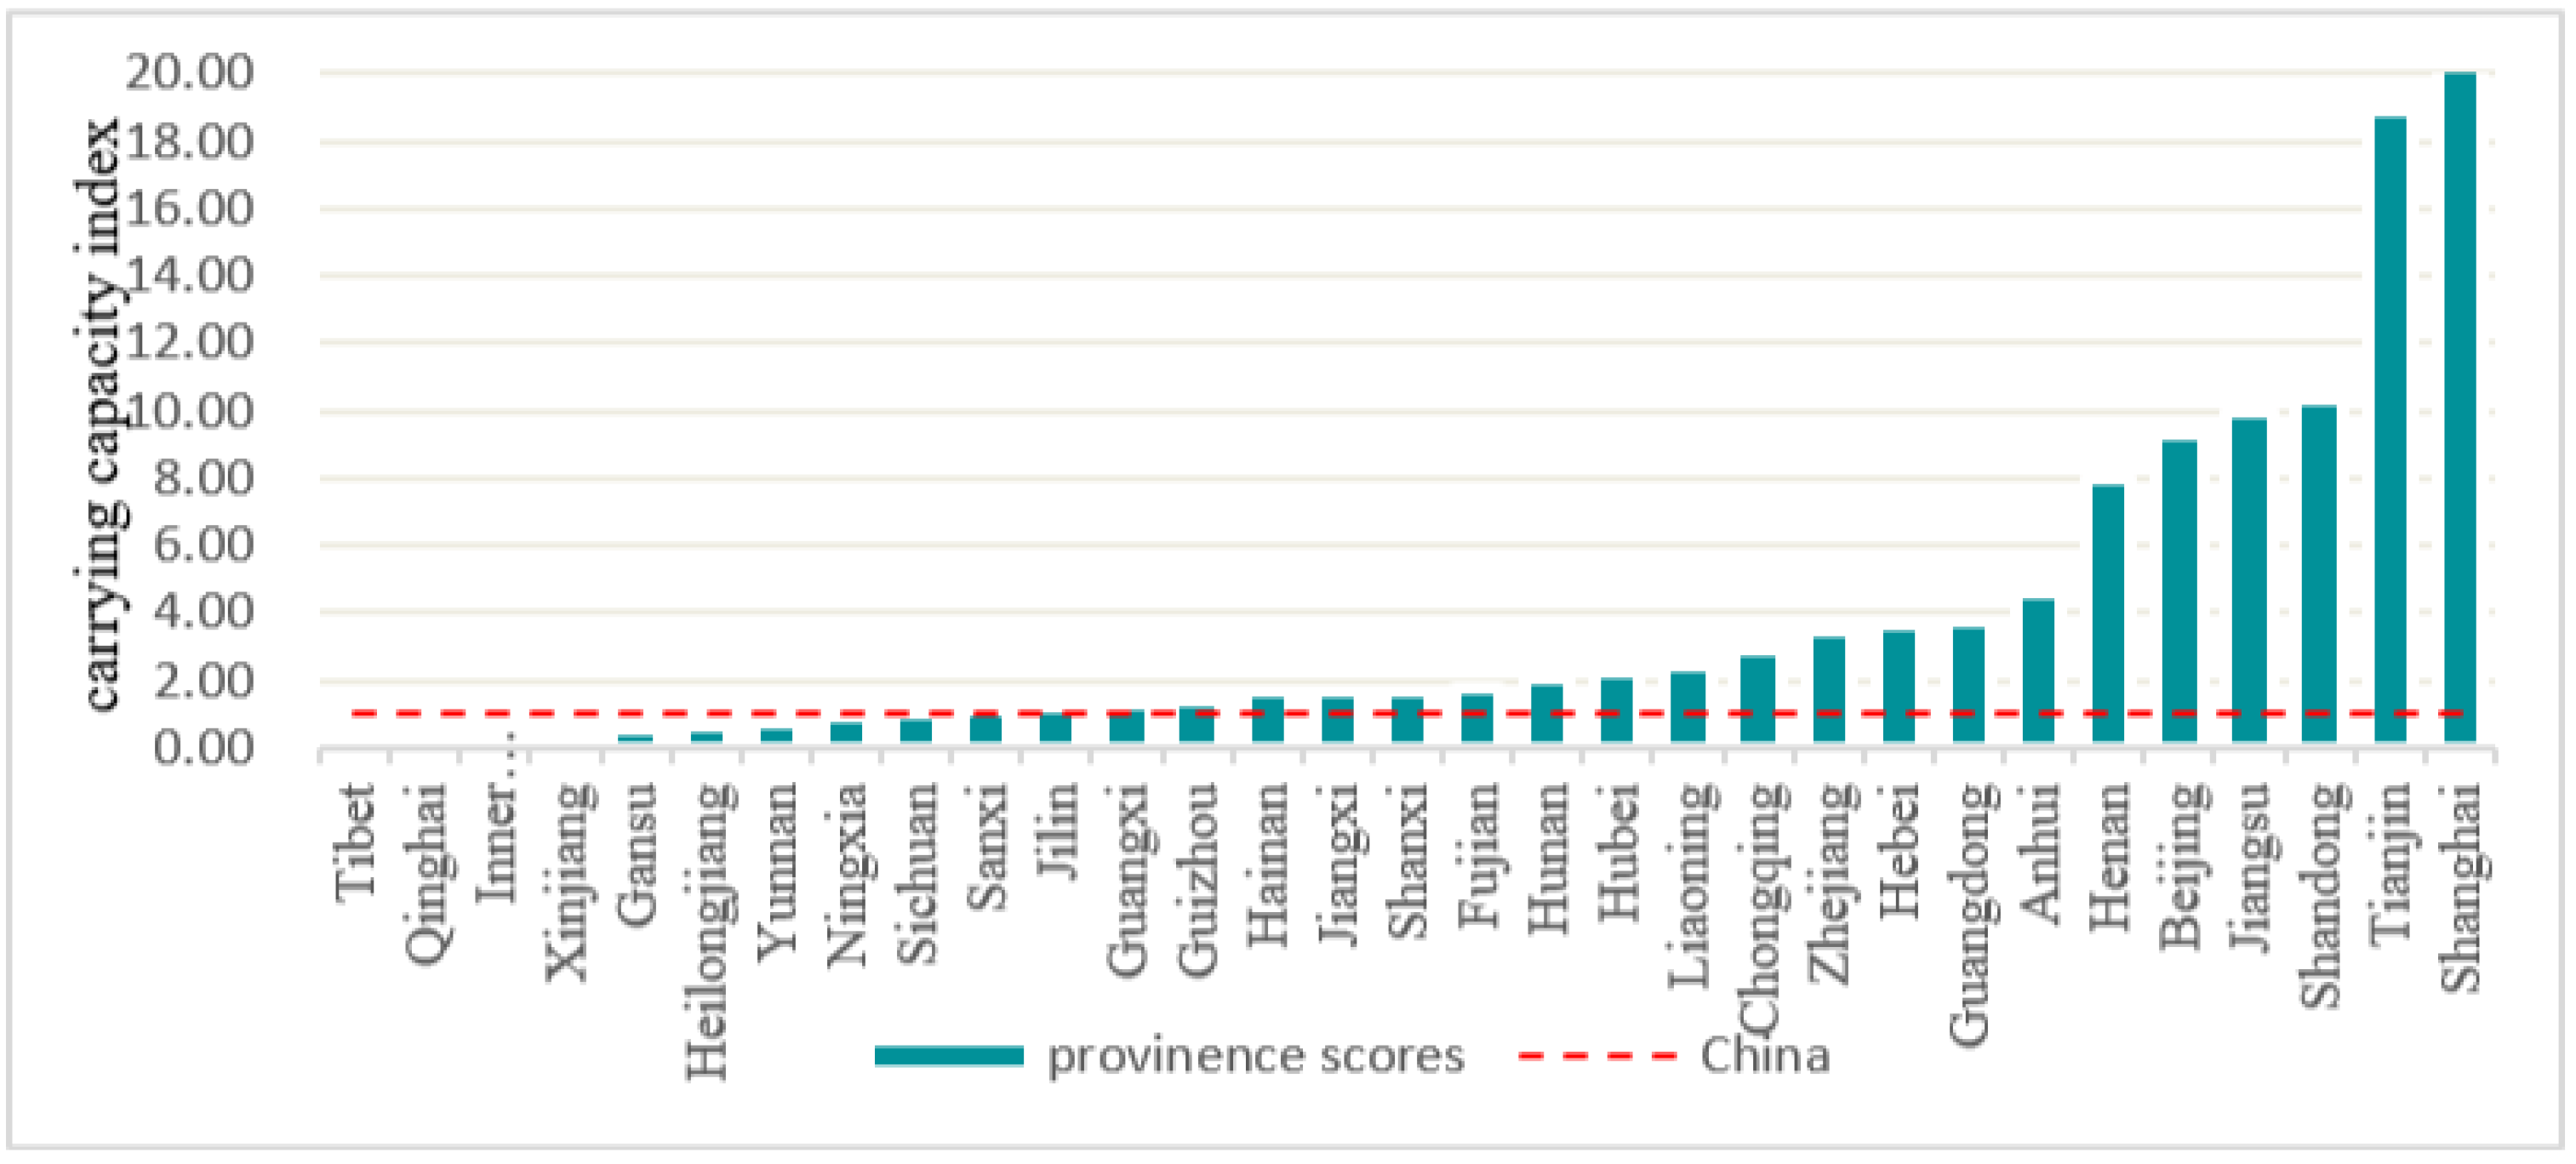
The carrying capacity index of ecological land in China and the 31 provinces and cities, which indicates the pressure of the existing population on ecological land resources, is shown in Figure 3. Of the 31 regions, only 9 are good enough to satisfy the needs of the population. It is clear from the figure that the carrying capacity state of ecological land in Inner Mongolia, Xinjiang, Tibet, Qinghai province is particularly good. The ecological land area of Shanghai, Tianjin, Shandong, Jiangsu, and Beijing is quite small, and the population has significant pressure on the ecological land.
3.4. Carrying Capacity of Land Resource
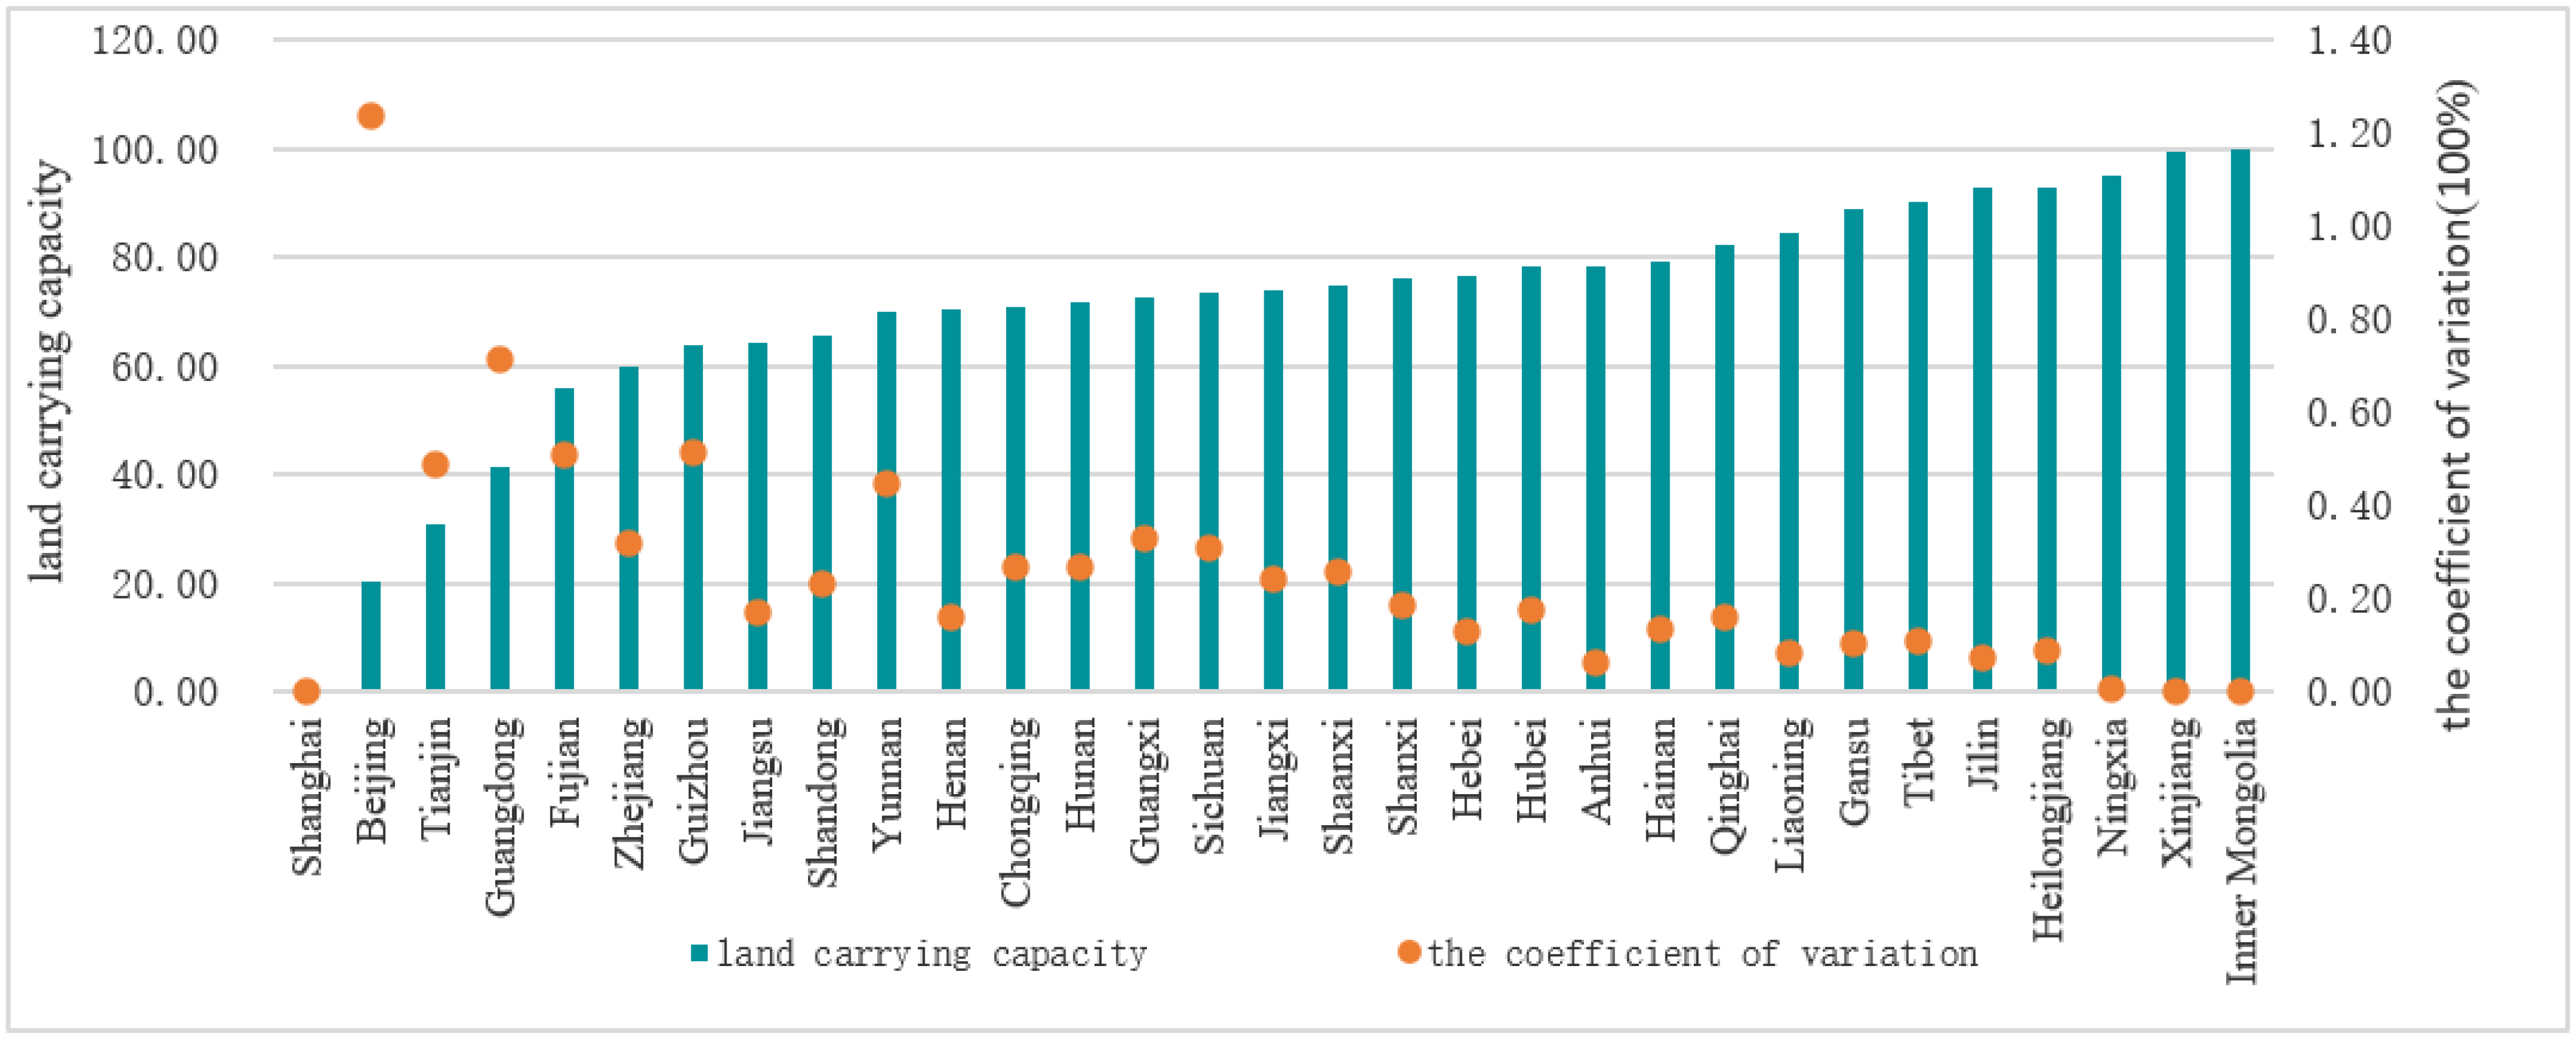
The results of carrying capacity of land resources are obtained through comprehensive evaluation. It represents the combined pressure of population on land. Figure 4 shows that the carrying capacity state of land in economically developed areas is generally poor, while in remote areas of the northeast, northwest, and southwest, China is relatively good.
As can be observed in Figure 4, except for Shanghai, the lower the carrying capacity index score, the worse the coefficient of variation on the trend. The reason for the low carrying capacity index score in these areas with inadequate equilibrium may be that the carrying capacity pressure of one or two types of land is high, rather than that of all three types. Most of them are geographically complex areas. The three types of land in Shanghai are under enormous pressure, while the three types of land with high carrying capacity index score are generally under less pressure.
3.5. Partition
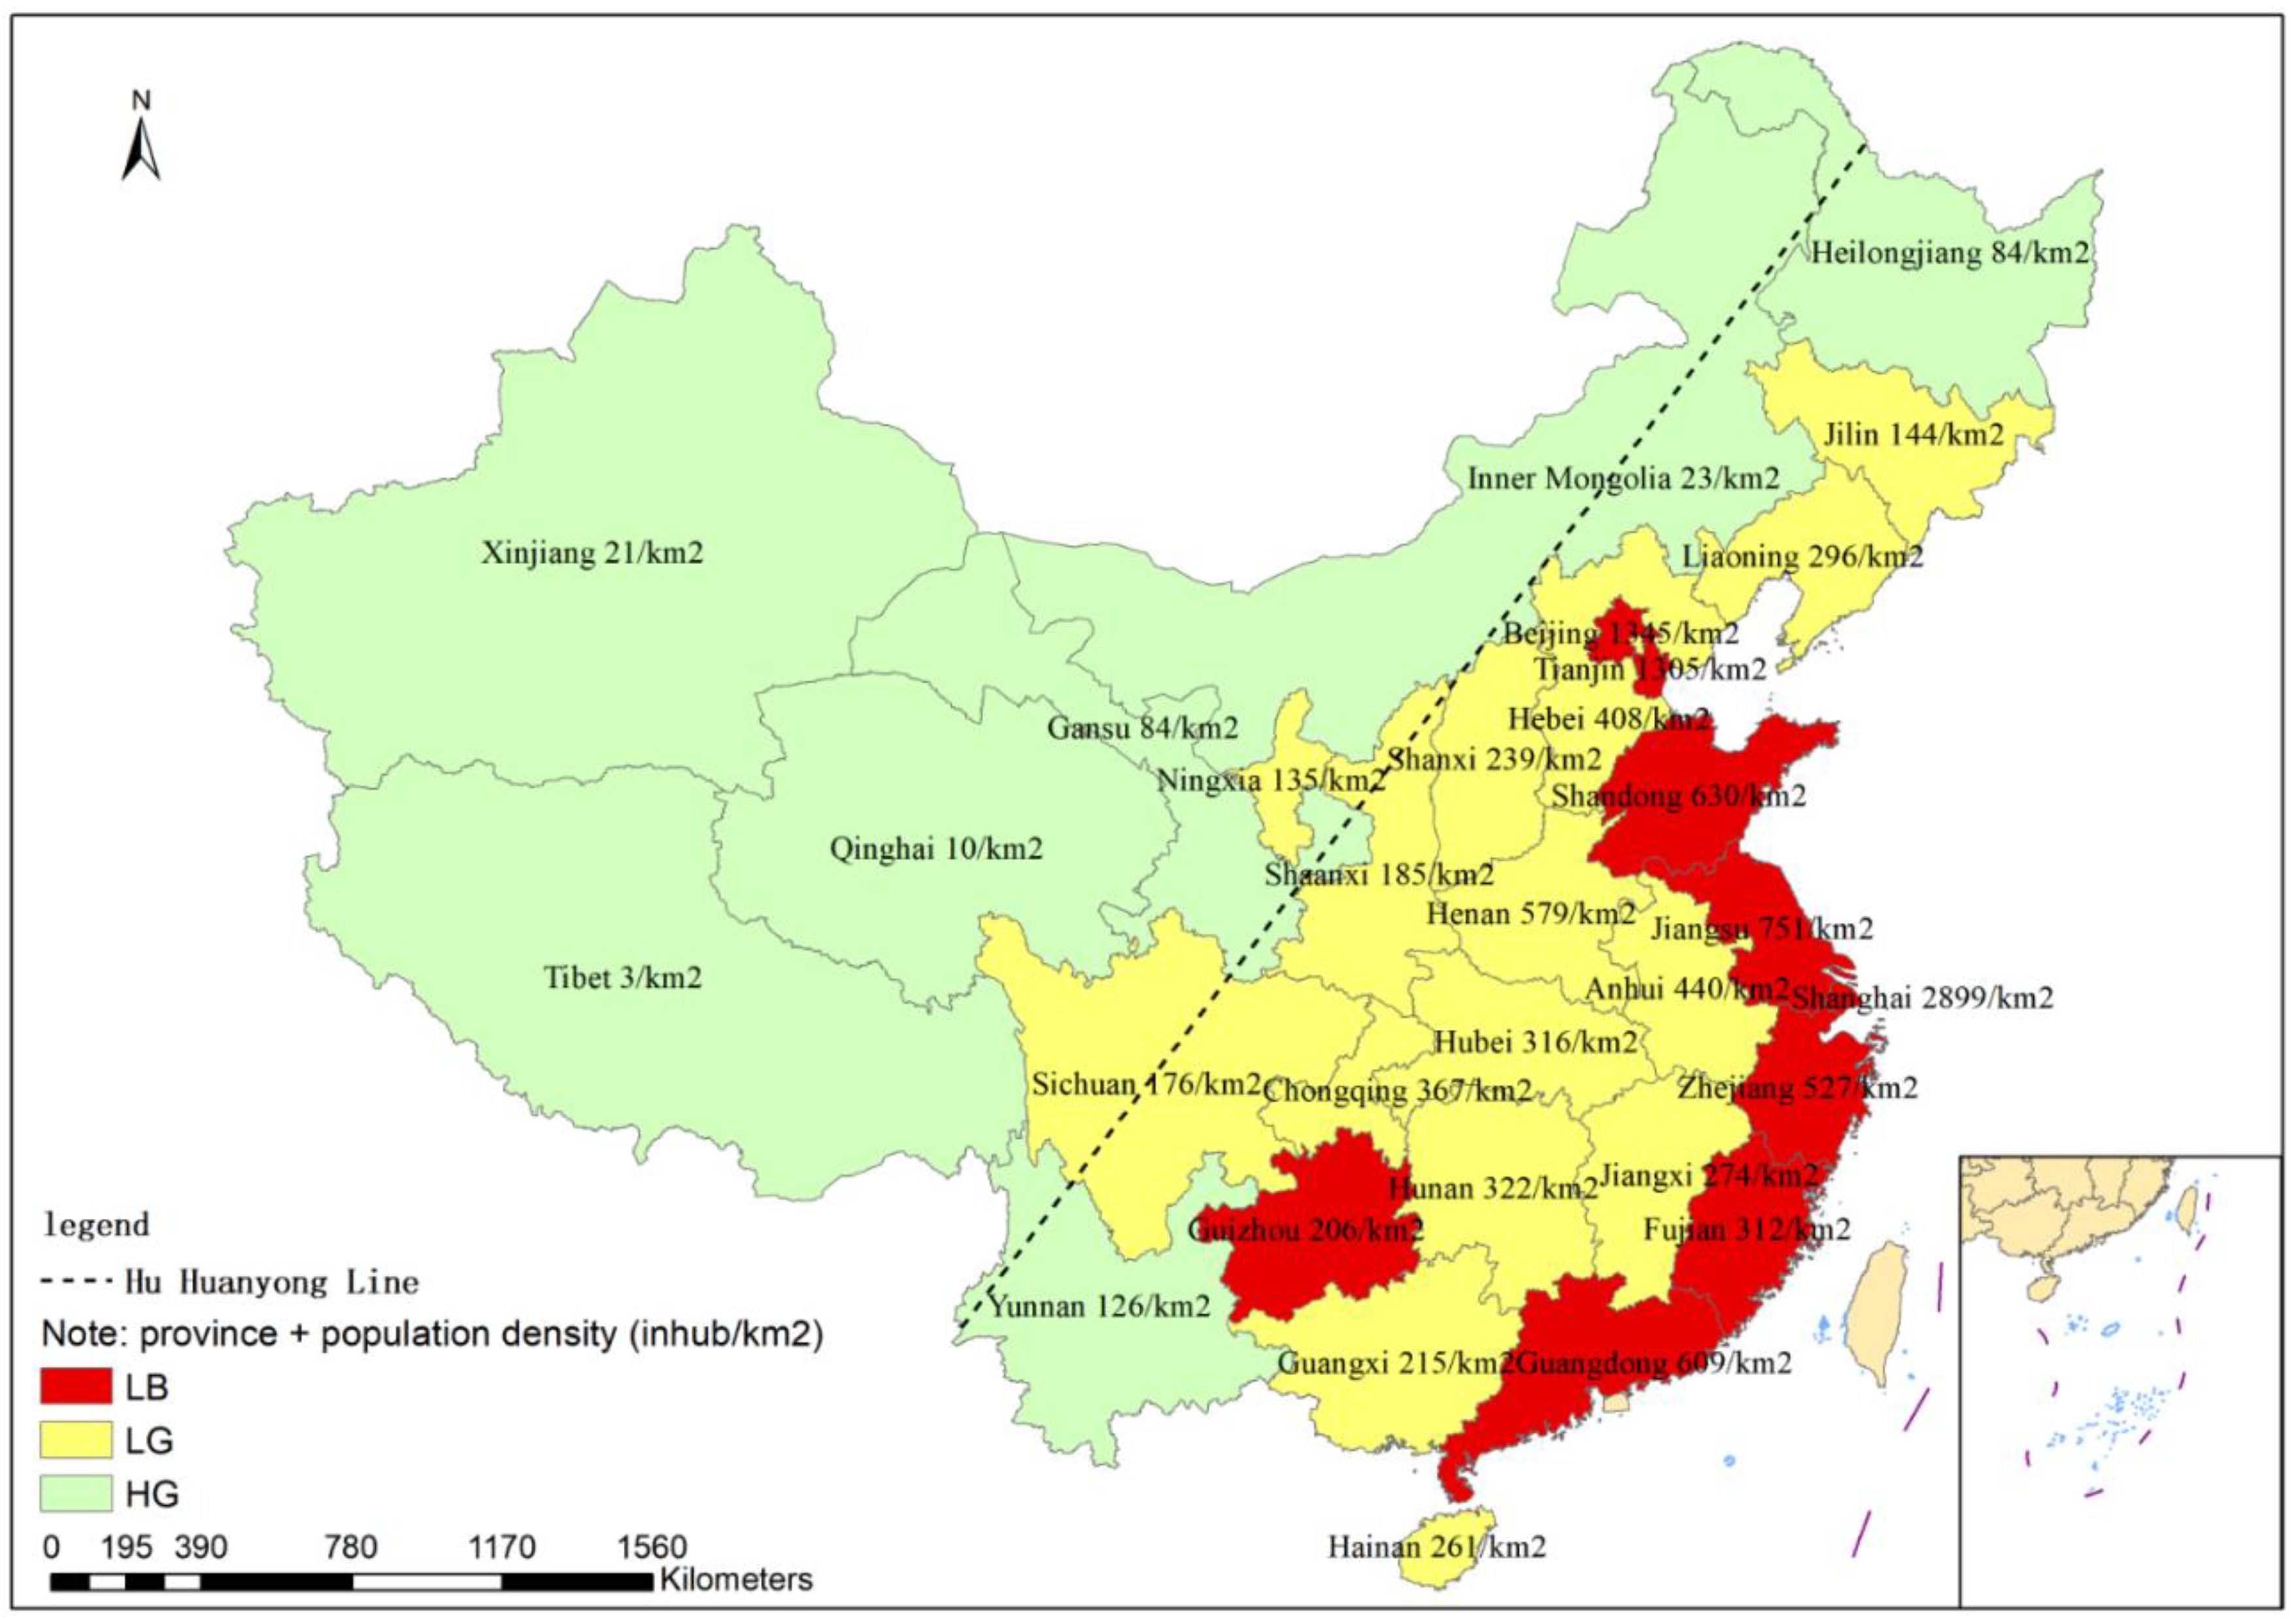
The partition results show that the 31 provinces are mainly in three quadrants (Figure 5). Inner Mongolia, Xinjiang, Tibet, Heilongjiang, Gansu, Qinghai, Sichuan, and Yunnan are in the first quadrant, which indicates that their land resource endowment is good, and the carrying capacity state is good (HG). Ningxia, Shanxi, Jilin, Liaoning, Yunnan, Hainan, Anhui, Hubei, Hebei, Shanxi, Jiangxi, Guangxi, Chongqing, Hunan, and Henan are in the second quadrant, which means that their land resource endowment is not good, but the carrying capacity of land resource is good (LG). The provinces with poor land resource endowment and poor land resource carrying capacity are in the third quadrant (LB), which include Shanghai, Beijing, Tianjin, Guangdong, Fujian, Zhejiang, Shandong, Jiangsu, Guizhou. There are no provinces in the fourth quadrant. The results are also shown in the map (Figure 6). LB and LG areas are mainly located on the east side of the Hu Huanyong line, while HG areas are mainly located on the west side of the line. The geographical distribution is obviously affected by the Hu Huanyong line [46].
4. Discussion
Land carrying capacity calculation of this paper does not use too many economic and social indicators to pursue the complexity of the model. Instead, it adopted the most traditional and basic concept of “To how many people the land can support?” The previous research mostly refers to the grain that cultivated land can provide. This paper applies this basic principle to construction land and ecological land. That is, the number of people that construction land and ecological land can support is calculated based on individual demand for construction land and ecological land. The results are representative and can reflect the condition of land carrying capacity. At the same time, the synthesis method is simple and easy, and has high operability, generalization, and application.
The division of land carrying capacity in China is obviously controlled by the famous geographical division line pointed out by the Chinese well-known geographer of Professor Hu Huanyong [46]. The Hu Huanyong Line, proposed in 1935 and still unbroken after more than 80 years, is the geographical demarcation line of China’s population, revealing the differentiation and mutation lines of China’s population density distribution in the southeast and northwest. Research results of this paper conforms to the geographical distribution pattern and law of China and indirectly confirms the rationality of the evaluation method. The distribution regularity indicates that the results of this study are reliable.
The evaluation results in this paper are not absolute carrying capacity, but relative carrying status. Because of the impact of scientific and technological progress and environmental changes on land yield capacity, as well as changes in human living standards, there is still no particular accurate method to evaluate the absolute land carrying capacity. It is even harder to quantify each person’s need for ecological land. Through the evaluation of the relative carrying state presented in this paper, the level of the carrying state of an area in all the assessed areas can be measured and compared with neighboring or the same type of provinces, so as to define the current status of the carrying capacity of an area. The standard uncertainty does not affect the results because the results are relative values between different regions. The calculation of relative carrying capacity is just an expedient for uncertain parameters. The next step is to do in-depth and detailed research on per capita reasonable farmland, construction land, and ecological land in order to calculate the absolute population carrying capacity.
The results of the carrying capacity index in this paper are consistent with Cheng Jingyao et al.’s research on carrying pressure in 31 provinces and cities in China, but there is a slight difference. Overall, they are all in conformity with the general pattern of high pressure in the east coast and low pressure in the west. In addition, overall carrying capacity of Ningxia and Guizhou is obviously different, and the main reason for the difference is that the two articles have different emphases, while Cheng Jingyao’s article focuses on the economic carrying capacity, this article focuses on the population carrying capacity. The carrying state value of cultivated land in this paper is 0.75, indicating that 75% of the grain produced by cultivated land can meet the food demand of Chinese population, which is consistent with the conclusion of China’s self-sufficiency in grain in the white paper “food security in China.” In addition, this paper also examines the balance of the carrying capacity of the land in each region. The comprehensive method in this paper can clearly quantify the carrying capacity level of a province in the whole country.
5. Conclusions
Several conclusions can be drawn based on the analysis in this paper.
First, although China’s land can support more people than it already has, China must take effective measures to improve agricultural land productivity and construction land use efficiency and protect ecological land due to the possible land degradation, water shortage, and population growth.
Second, China’s land carrying capacity is unbalanced being high in the east and weak in the west, and land carrying pressure is greater in developed areas than in underdeveloped areas.
Third, land status of the three land types is more balanced in areas with good comprehensive carrying status, while only one or two kinds of poor land conditions exist in areas with poor carrying status, except for Shanghai, where all kinds of land conditions are poor.
Fourth, most of China’s developed coastal cities are located in the LB area. These provinces should protect ecological land, make full use of existing construction land, and rely on grain from other provinces. The central region is located in LG area, in which construction land should be developed appropriately under the premise of good protection of cultivated and ecological lands. The western region is located in the HG area, which can be used as a key development area under the condition of good ecological protection. This is also in line with China’s western development strategy.
Fifth, this study can effectively provide reference for the classification and comprehensive management of land resources, and provide policy basis for food security, urban development and ecological protection. The relative carrying capacity evaluation method can also be used to evaluate the carrying capacity of different cities or counties in a province.
Author Contributions
Conceptualization, W.Z. and L.S.; methodology, W.Z.; software, W.Z.; validation, L.S., A.E., and S.Z.; formal analysis, W.Z.; resources, S.Z.; data curation, W.Z.; writing—original draft preparation, W.Z.; writing—review and editing, A.E.; visualization, W.Z.; supervision, L.S.; project administration, L.S.; funding acquisition, L.S. All authors have read and agreed to the published version of the manuscript.
Funding
This research was funded by the Strategic Priority Research Program of the Chinese Academy of Sciences (Grant No. XDA19040102), National Natural Science Foundation of China (Grant No.41771566), and National Key Research and Development Program of China (Grant No. 2016YFC0503501).
Institutional Review Board Statement
Not applicable.
Informed Consent Statement
Not applicable.
Data Availability Statement
Data of land resources has been obtained from the Ministry of Natural Resources of the People’s Republic of China (http://tddc.mnr.gov.cn/to_Login). Ecological land includes woodland, grassland, water area, mudflat, and wetland. Population data and average yield of grain in the region have been obtained from the China’s national bureau of statistics (http://data.stats.gov.cn/easyquery.htm?cn=C01).
Acknowledgments
In this section, you can acknowledge any support given which is not covered by the author contribution or funding sections. This may include administrative and technical support, or donations in kind (e.g., materials used for experiments).
Conflicts of Interest
The funders had no role in the design of the study; in the collection, analyses, or interpretation of data; in the writing of the manuscript; or in the decision to publish the results.
References
- Zhang, M.; Liu, Y.; Wu, J.; Wang, T. Index system of urban resource and environment carrying capacity based on ecological civilization. Environ. Impact Assess. Rev. 2018, 68, 90–97. [Google Scholar] [CrossRef]
- Ma, B. Literature review on land carrying capacity of the coordinated development of population, resources, environment and economy. In Proceedings of the 2nd International Conference on Materials Science, Resource and Environmental Engineering (Msree 2017), Wuhan, China, 27–29 October 2017; AIP Publishing: Melville, NY, USA, 2017. [Google Scholar]
- Yan, H.; Liu, F.; Liu, J.; Xiao, X.; Qin, Y. Status of land use intensity in China and its impacts on land carrying capacity. J. Geogr. Sci. 2017, 27, 387–402. [Google Scholar] [CrossRef] [Green Version]
- Tong, S.; Zhiming, F.; Yanzhao, Y.; Yumei, L.; Yanjuan, W. Research on Land Resource Carrying Capacity: Progress and Prospects. J. Resour. Ecol. 2018, 9, 331–340. [Google Scholar] [CrossRef]
- Food and Agriculture Organization. Potential Population Supporting Capacities of Lands in Developing World; Food and Agriculture Organization of the United Nations: Rome, Italy, 1982. [Google Scholar]
- Yanti, R. The Sustainable of Environmental Carrying Capacity To Support on Food Security (Nagari Sulit Air, X Koto Diatas District, Solok, West Sumatra). IOP Conf. Series Earth Environ. Sci. 2018, 197, 012030. [Google Scholar] [CrossRef]
- Sugiyarto, S.; Hariono, B.; Wijaya, R.; Destarianto, P.; Novawan, A. The impact of land use changes on carrying capacity of sampean watershed in Bondowoso Regency. In Proceedings of the IOP Conference Series: Earth and Environmental Science; IOP Publishing: Bristol, UK, 2018; Volume 207, p. 012005. [Google Scholar]
- Purwanto, P.; Sunoko, H.R. Analysis of Land Carrying Capacity of Tanah Miring District of Merauke Regency. Adv. Sci. Lett. 2017, 23, 2561–2563. [Google Scholar]
- Tsou, J.Y.; Gao, Y.; Zhang, Y.; Sun, G.; Ren, J.; Li, Y. Evaluating Urban Land Carrying Capacity Based on the Ecological Sensitivity Analysis: A Case Study in Hangzhou, China. Remote Sens. 2017, 9, 529. [Google Scholar] [CrossRef] [Green Version]
- Yang, N.; Li, J.; Lu, B.; Luo, M.; Li, L. Exploring the Spatial Pattern and Influencing Factors of Land Carrying Capacity in Wuhan. Sustainability 2019, 11, 2786. [Google Scholar] [CrossRef] [Green Version]
- Shi, Y.; Shi, S.; Wang, H. Reconsideration of the methodology for estimation of land population carrying capacity in Shanghai metropolis. Sci. Total. Environ. 2019, 652, 367–381. [Google Scholar] [CrossRef]
- Lin, W.; Chen, Y. The Impact of Urbanization on Land Carrying Capacity in Beijing-Tianjin-Hebei Region. Agro Food Industry Hi-Tech. 2017, 28, 3747–3751. [Google Scholar]
- Guo, S.; Li, C.; Liu, S.; Zhou, K. Land carrying capacity in rural settlements of three gorges reservoir based on the system dynamic model. Nat. Resour. Model. 2018, 31, e12152. [Google Scholar] [CrossRef]
- Jun, W.; Qiaoming, Z.; Chunjing, Z.; Jinxin, W.; Yongsheng, L.; Mingchun, W. Dynamic evolutions of ecological carrying capacity in poor areas using ecological footprint model at Ruyang County of China. Int. J. Agric. Biol. Eng. 2017, 10, 140–150. [Google Scholar]
- Lee, Y.-J.; Tung, C.-M.; Lin, S.-C. Carrying capacity and ecological footprint of Taiwan. In Advances in Energy and Environment Research; Achour, B., Wu, Q., Eds.; Taylor & Francis Group: London, UK, 2017; pp. 207–218. [Google Scholar]
- Liu, Y.; Zeng, C.; Cui, H.; Song, Y. Sustainable Land Urbanization and Ecological Carrying Capacity: A Spatially Explicit Perspective. Sustainability 2018, 10, 3070. [Google Scholar] [CrossRef] [Green Version]
- He, Y.; Xie, H. Exploring the spatiotemporal changes of ecological carrying capacity for regional sustainable development based on GIS: A case study of Nanchang City. Technol. Forecast. Soc. Chang. 2019, 148. [Google Scholar] [CrossRef]
- Peng, B.; Li, Y.; Elahi, E.; Wei, G. Dynamic evolution of ecological carrying capacity based on the ecological footprint theory: A case study of Jiangsu province. Ecol. Indic. 2019, 99, 19–26. [Google Scholar] [CrossRef]
- Chen, J.; Zhang, H.; Zhou, P. Evaluation of Land Carrying Capacity of Island Cities: Based on the Modified Ecological Footprint Model. In Proceedings of the 20th International Symposium on Advancement of Construction Management and Real Estate; Springer: Singapore, 2016; pp. 181–190. [Google Scholar]
- Cui, G.; Zhang, X.; Zhang, Z.; Cao, Y.; Liu, X. Comprehensive Land Carrying Capacities of the Cities in the Shandong Peninsula Blue Economic Zone and their Spatio-Temporal Variations. Sustainability 2019, 11, 439. [Google Scholar] [CrossRef] [Green Version]
- Lifang, Z.; Yang, L.; Li, Z.; Zhenqin, W. A New Method Applied in the Regional Evaluation of Urban Comprehensive Carrying Capacity. In Proceedings of the 2019 IEEE 4th International Conference on Big Data Analytics (ICBDA), Suzhou, China, 15–18 March 2019. [Google Scholar]
- Xue, Q.; Yang, X.; Wu, F. A three-stage hybrid model for the regional assessment, spatial pattern analysis and source apportionment of the land resources comprehensive supporting capacity in the Yangtze River Delta urban agglomeration. Sci. Total. Environ. 2020, 711, 134428. [Google Scholar] [CrossRef]
- Wang, F.; Wang, C.; Ye, Y.; Wen, B. An Improved Method for Evaluating Regional Resource Carrying Capacities: A Case Study of the Tarim River Basin in Arid China. Pol. J. Environ. Stud. 2019, 28, 2415–2428. [Google Scholar] [CrossRef]
- Yang, J.; Ding, H. A Quantitative Assessment of Sustainable Development Based on Relative Resource Carrying Capacity in Jiangsu Province of China. Int. J. Environ. Res. Public Health 2018, 15, 2786. [Google Scholar] [CrossRef] [Green Version]
- Li, B.; Jin, D.; Ge, G.; Guo, Y.; Zhang, Q.; Zhang, T.; Hu, Z. Regional difference analysis of ecological carrying capacity based on an emergy in Shaanxi province. Land Reclamation in Ecological Fragile Areas. In Proceedings of the International Symposium on Land Reclamation & Ecological Restoration(LRER 2017), Xi’an, China, 23 October 2017; Hu, Z., Ed.; Tayor & Francis Group: London, UK, 2017; pp. 207–210. [Google Scholar]
- Cheng, J.; Zhou, K.; Chen, D.; Fan, J. Evaluation and analysis of provincial differences in resources and environment carrying capacity in China. Chin. Geogr. Sci. 2016, 26, 539–549. [Google Scholar] [CrossRef]
- Li, K.; Jin, X.; Ma, D.; Penghui, J. Evaluation of Resource and Environmental Carrying Capacity of China’s Rapid-Urbanization Areas—A Case Study of Xinbei District, Changzhou. Land 2019, 8, 69. [Google Scholar] [CrossRef] [Green Version]
- Cheng, K.; Fu, Q.; Cui, S.; Li, T.-X.; Fu, Q.; Liu, N.; Meng, J. Evaluation of the land carrying capacity of major grain-producing areas and the identification of risk factors. Nat. Hazards 2016, 86, 263–280. [Google Scholar] [CrossRef]
- Zhang, R.; Sun, J.; Fan, H.; Yang, R. Quantitative Method of Agricultural Land Environmental Bearing Capacity under Resource Constraint. Ekoloji 2019, 28, 3183–3194. [Google Scholar]
- Thapa, G.B.; Paudel, G.S. Evaluation of the livestock carrying capacity of land resources in the Hills of Nepal based on total digestive nutrient analysis. Agric. Ecosyst. Environ. 2000, 78, 223–235. [Google Scholar] [CrossRef]
- Wang, L.; Liu, H. Comprehensive evaluation of regional resources and environmental carrying capacity using a PS-DR-DP theoretical model. J. Geogr. Sci. 2019, 29, 363–376. [Google Scholar] [CrossRef] [Green Version]
- Zhu, N.; Cao, B.; Qin, F. Analysis of land carrying capacity of livestock and poultry breeding in China from the perspective of combination of planting and raising. In IOP Conference Series: Earth and Environmental Science; IOP Publishing: Bristol, UK, 2020; Volume 585, p. 012085. [Google Scholar]
- Kafafa, U.; Nadia, H.; Fadilah, G.O.; Abadi, A.W.; Putri, R.F. Carrying capacity trend and projection analysis for Sumatra Selatan agricultural land in 2030. In IOP Conference Series: Earth and Environmental Science; IOP Publishing: Bristol, UK, 2020; Volume 451, p. 012046. [Google Scholar]
- Sun, M.Y.; Wang, J.G.; He, K.Y. Analysis on the urban land resources carrying capacity during urbanization—A case study of Chinese YRD. Appl. Geogr. 2020, 116, 102170. [Google Scholar] [CrossRef]
- Luo, W.; Ren, Y.; Shen, L.; Zhu, M.; Jiang, Y.; Meng, C.; Zhang, P. An evolution perspective on the urban land carrying capacity in the urbanization era of China. Sci. Total. Environ. 2020, 744, 140827. [Google Scholar] [CrossRef] [PubMed]
- Wei, X.; Shen, L.; Liu, Z.; Luo, L.; Wang, J.; Chen, Y. Comparative analysis on the evolution of ecological carrying capacity between provinces during urbanization process in China. Ecol. Indic. 2020, 112, 106179. [Google Scholar] [CrossRef]
- Nie, X.; Li, K. Evaluation on Spatial of National Land Development Pattern of Lanzhou-Xining Urban Agglomeration Based on Resource and Environment Carrying Capacity. In IOP Conference Series: Earth and Environmental Science; IOP Publishing: Bristol, UK, 2020; Volume 428, p. 012053. [Google Scholar]
- Peng, T.; Deng, H. Comprehensive evaluation for sustainable development based on relative resource carrying capacity—A case study of Guiyang, Southwest China. Environ. Sci. Pollut. Res. 2020, 27, 20090–20103. [Google Scholar] [CrossRef]
- Zhiming, F.; Tong, S.; Yanzhao, Y.; Huimin, Y. The Progress of Resources and Environment Carrying Capacity: From Single-factor Carrying Capacity Research to Comprehensive Research. J. Resour. Ecol. 2018, 9, 125–134. [Google Scholar] [CrossRef]
- Mei, F. Analysis of China’s grain development in the early 21st century. China Soft Sci. 1995, 11, 98–101. (In Chinese) [Google Scholar]
- Ministry of Construction, PRC. Standard for Planning of Town and Village GB50188—93. China Construction Bookstore Co., Ltd.: Beijing, China, 1994; pp. 9–10. [Google Scholar]
- The World Bank. Doing Business. 2020, pp. 17–27. Available online: https://www.doingbusiness.org/ (accessed on 2 March 2020).
- Schmidt-Traub, G.; Kroll, C.; Teksoz, K.; Durand-Delacre, D.; Sachs, J.D. National baselines for the Sustainable Development Goals assessed in the SDG Index and Dashboards. Nat. Geosci. 2017, 10, 547–555. [Google Scholar] [CrossRef]
- Ministry of Natural Resources of the People’s Republic of China. National and Provincial Annual Land Use Status Data. 2019. Available online: http://tddc.mnr.gov.cn/to_Login (accessed on 2 November 2019).
- National bureau of statistics of China. Annual Data. 2019. Available online: http://data.stats.gov.cn/easyquery.htm?cn=C01 (accessed on 2 November 2019).
- Hu, H. The distribution of population in China, with statistics and maps. Acta Geogr. Sin. 1935, 2, 33–74. [Google Scholar]
Figure 1.
The carrying capacity index of cultivated land.

Figure 2.
The carrying capacity index of construction land.

Figure 3.
The carrying capacity of ecological land.

Figure 4.
The carrying capacity of land resources around 31 provinces or regions.

Figure 5.
Thirty-one provincial partition in China.

Figure 6.
Thirty-one regional partition at provincial level of China.

Publisher’s Note: MDPI stays neutral with regard to jurisdictional claims in published maps and institutional affiliations. |
© 2021 by the authors. Licensee MDPI, Basel, Switzerland. This article is an open access article distributed under the terms and conditions of the Creative Commons Attribution (CC BY) license (http://creativecommons.org/licenses/by/4.0/).
Share and Cite
MDPI and ACS Style
Zhou, W.; Elshkaki, A.; Zhong, S.; Shen, L. Study on Relative Carrying Capacity of Land Resources and Its Zoning in 31 Provinces of China. Sustainability 2021, 13, 1459. https://0-doi-org.brum.beds.ac.uk/10.3390/su13031459
AMA Style
Zhou W, Elshkaki A, Zhong S, Shen L. Study on Relative Carrying Capacity of Land Resources and Its Zoning in 31 Provinces of China. Sustainability. 2021; 13(3):1459. https://0-doi-org.brum.beds.ac.uk/10.3390/su13031459
Chicago/Turabian StyleZhou, Wei, Ayman Elshkaki, Shuai Zhong, and Lei Shen. 2021. "Study on Relative Carrying Capacity of Land Resources and Its Zoning in 31 Provinces of China" Sustainability 13, no. 3: 1459. https://0-doi-org.brum.beds.ac.uk/10.3390/su13031459
Note that from the first issue of 2016, this journal uses article numbers instead of page numbers. See further details here.