1. Introduction
The coronavirus pandemic (COVID-19) is a major disruptive event that has impacted global economies and unsettled several value networks [
1]. Analyzing the implications and effects of such disruptions on businesses is an important application aspect of data analytics, particularly in the area of retail supply chain management (SCM) [
2,
3]. The impact of the COVID-19 epidemic transcends across businesses and organizational domains including education, healthcare, tourism, retail, manufacturing, logistics, etc. Specifically, for the retail sector, several studies have been conducted to analyze the impact of COVID-19. The results of these studies vary across countries: the study [
4] shows that most retailers transitioned to online grocery delivery services in Germany. The results of the study [
5] show that household grocery expenditure increased by 30%. Another study [
6] shows that there was a significant increase in the hoarding of food products in China, while a different study [
7] indicates only a little concern about overstocking or panic buying for consumers in Qatar.
An area of great interest of research on COVID-19 is represented by evaluating the development of customer respectively consumer satisfaction in pandemic times. Several articles focused on this issue. One study [
8] analyzed the impact of COVID-19 readiness strategies on customer satisfaction and the consequences for consumer behavioral intentions applying structured questionnaires. The study was conducted for retail stores in South Africa and showed that sanitized retail entrances, counters, and shelves had a statistically significant effect on customer satisfaction during the pandemic while social distancing and senior citizens shopping hours did not affect satisfaction. In a similar way, [
9] conducted research on the issue of how consumer decision-making behavior changed by means of collecting and analyzing survey data pre- and post-declaration of the pandemic. The results indicate that the pandemic has altered consumers’ product needs, shopping, and purchasing behaviors, as well as their post-purchase satisfaction levels. Focusing on customer satisfaction, [
10] also provided an overview of retail practices during the pandemic and derived an action plan for maintaining satisfaction, trust, and loyalty during COVID-19. Findings show that keeping in touch with customers over digital channels and implementing the safety and hygienic regulations issued by the government are key activities. However, the study did not analyze the specific levels of consumer satisfaction and their changes in the course of the pandemic. Another paper [
11] addressed the issue of online consumer retention during COVID-19 and identified consumer satisfaction as a main moderating effect. Again, this study did not analyze actual satisfaction levels before and during the pandemic. The impact of COVID-19 on customer satisfaction in airline travel was analyzed by [
12]. Based on Twitter data, they identified the consumer satisfaction for eight airlines and found that the respective actions of each airline had implications on consumer satisfaction. The commonality of these existing studies on consumer satisfaction in COVID-19 is that they all—except [
12], which did not focus on retail but the airline sector—used classical methods like survey questionnaires to analyze consumer satisfaction.
This is in line with the argumentation of [
13], which states that researchers and practitioners generally use conventional methods like focus groups or questionnaire surveys as the main information source for evaluating customer satisfaction [
14] or consumer perceptions respectively behavior [
15]. These methods are often time-consuming [
16] and inaccurate due to biased conclusions, limited sample sizes, or inconsistent questions [
17,
18]. When reviewing the literature on the analysis of consumer satisfaction levels, the usage of big data from the open web in the form of online customer review (OCR) data or user-generated content (UCG) offers an alternative with high potential [
13,
19]. One major advantage of open web data is its amount: while traditional surveys focus on samples of a thousand to a couple of thousand participants, OCR and UCG-based reviews can analyze hundreds of thousands of comments and evaluations from a huge crowd of customers: more than 127,000 textual reviews were analyzed by [
19], [
18] included more than 266,000 consumer satisfaction ratings and [
20] collected more than 7.8 million reviews in the context of analyzing satisfaction with electronic products. Another benefit is the fact that customer reviews from the open web are widely available online and are accessible for free or at low costs [
13,
21]. Despite the opportunities and benefits provided by OCR- and UCG-based consumer satisfaction analysis, none of the analyzed papers on consumer satisfaction during COVID-19 have applied this approach.
The current study addresses exactly this research gap and focuses on understanding the impact of COVID-19 on the customer end of retail supply chains (SC) in physical grocery shopping in Austria (AT). By capturing and evaluating consumer data and sentiments available on the open web, the impact of COVID-19 on consumer satisfaction and perceptions at the point-of-sale (PoS) is evaluated. The PoS is where consumers actually purchase groceries and hence represents the very end of retail SCs on the customer side. From the perspective of SCM, the end of a SC is especially relevant for the overall success of SCM [
22]. The vision of creating a truly demand-driven SC is a topic of high interest in SCM research, especially in retail contexts [
23]. Missing or insufficient integration of demand information from the very last stage of a retail SC has effects on all previous stages [
24], e.g., in the form of too many products ordered that could not be sold or in the form of the wrong products supplied, which are returned to the stores. In both cases, the return logistics effort and the costs arising in the course of it are high and decrease overall profitability [
25,
26]. In a physical grocery retail SC, the PoS represents the very last stage and is the only part of the SC that involves direct physical contact with the end consumer. Integrating PoS data in the form of Big Data from the open web offers huge potential for SCM [
27,
28,
29,
30], both in normal and pandemic times. Analyzing consumer satisfaction and sentiments based on data produced at the PoS during COVID-19 provides a deep understanding of the impact of this epidemic. Google reviews are potential sources for gathering consumer perception data [
31]. A recent study that evaluated review websites for gathering consumer sentiment data has shown that Google reviews have a high potential for providing consumer satisfaction data, especially for physical retail businesses [
32].
In summary, the usage of big data in the form of UCG and ORC offers huge potential for analyzing consumer satisfaction. At the same time, COVID-19 was found to have high impacts on various aspects of the retail sector, one of these aspects being consumer satisfaction. However, none of the existing papers with a focus on analyzing consumer satisfaction in pandemic times applied big data but rather focused on conventional approaches like questionnaire surveys. Considering the impact of COVID-19 and the discussed effects like panic buying, shop closure, or product shortages, retail SCM is one of the domains directly impacted by this crisis. The impacts are directly reflected in consumer satisfaction at the PoS. Knowledge about these impacts provides a better demand planning basis, e.g., in terms of which products are seen more negatively or more positively due to COVID-19 or in terms of how retailers’ activities influenced consumer satisfaction and could be applied to steer sales. Focusing on the research gap arising at the intersection of consumer satisfaction and Big Data at the PoS in times of COVID-19, the paper explores the following main research question:
How did the COVID-19 pandemic impact the satisfaction and perceptions of consumers at the customer end of physical retail supply chains based on Google reviews?
To achieve proper separation of concerns, we further derive the following sub-questions:
How did satisfaction and perceptions of consumers at the PoS of physical grocery retail change during COVID-19 and how did political regulations and responses of retail chains influence these changes? (cf.
Section 4)
What are the specific factors that influenced consumers’ perceptions and satisfaction at the PoS of physical grocery retail during COVID-19? (cf.
Section 5)
The rest of the paper is structured as follows.
Section 2 introduces the concept of consumer satisfaction.
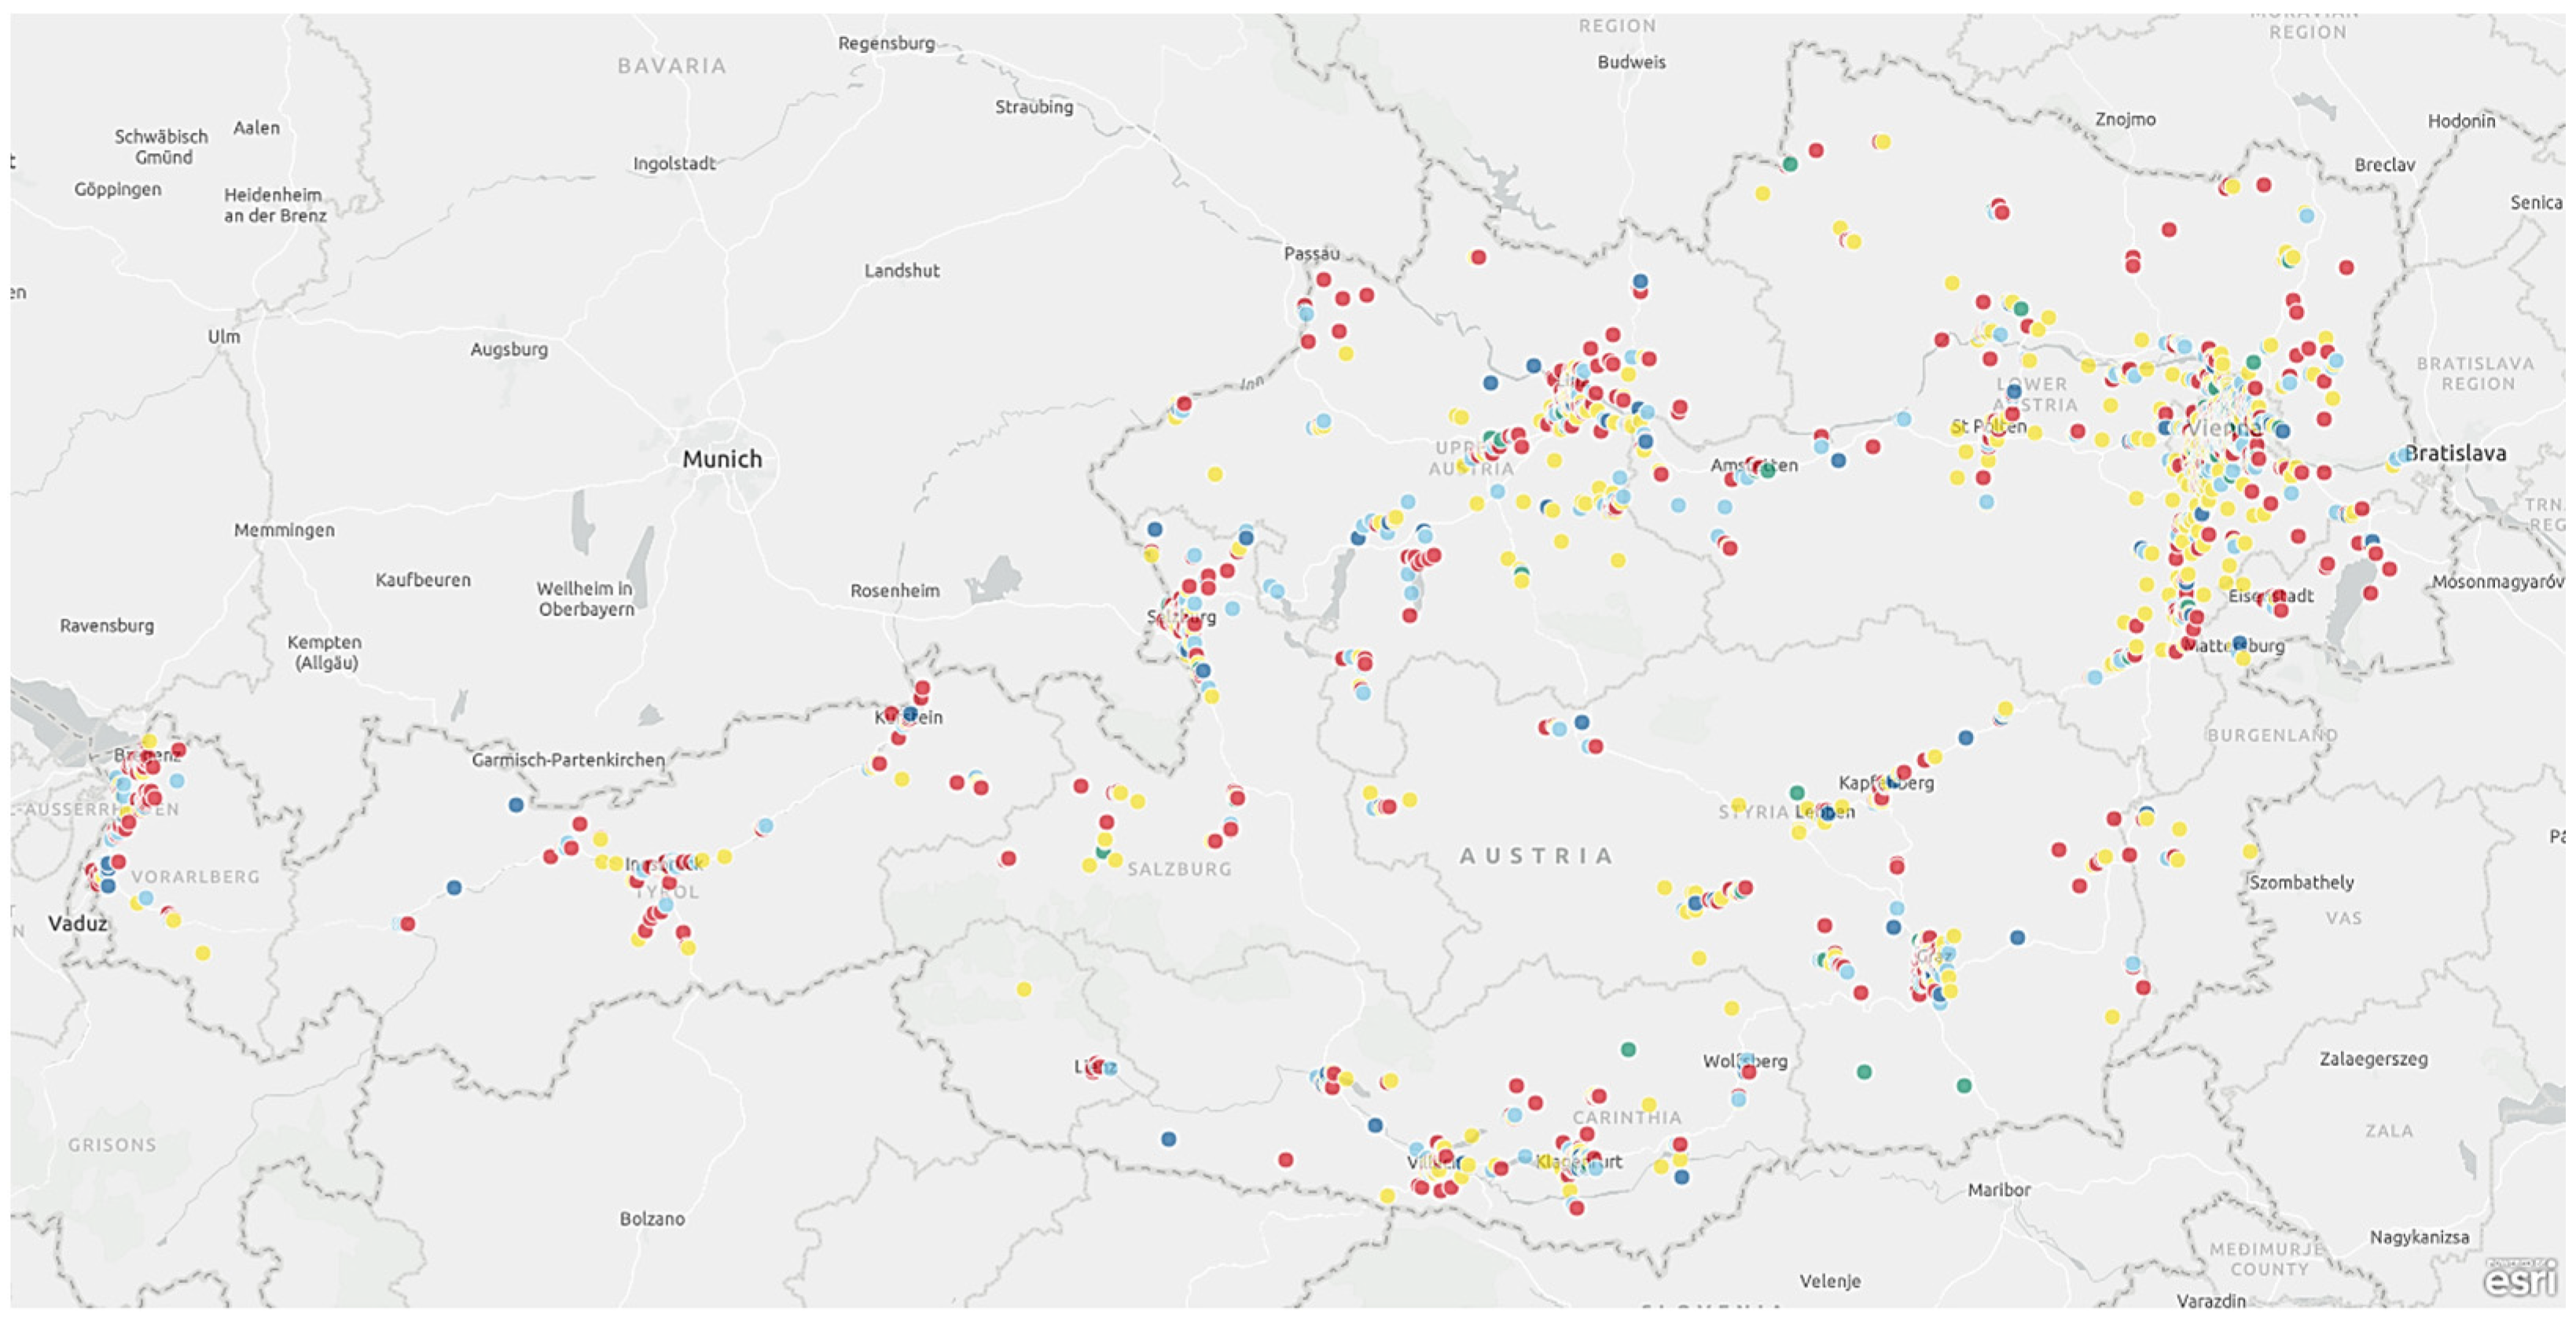
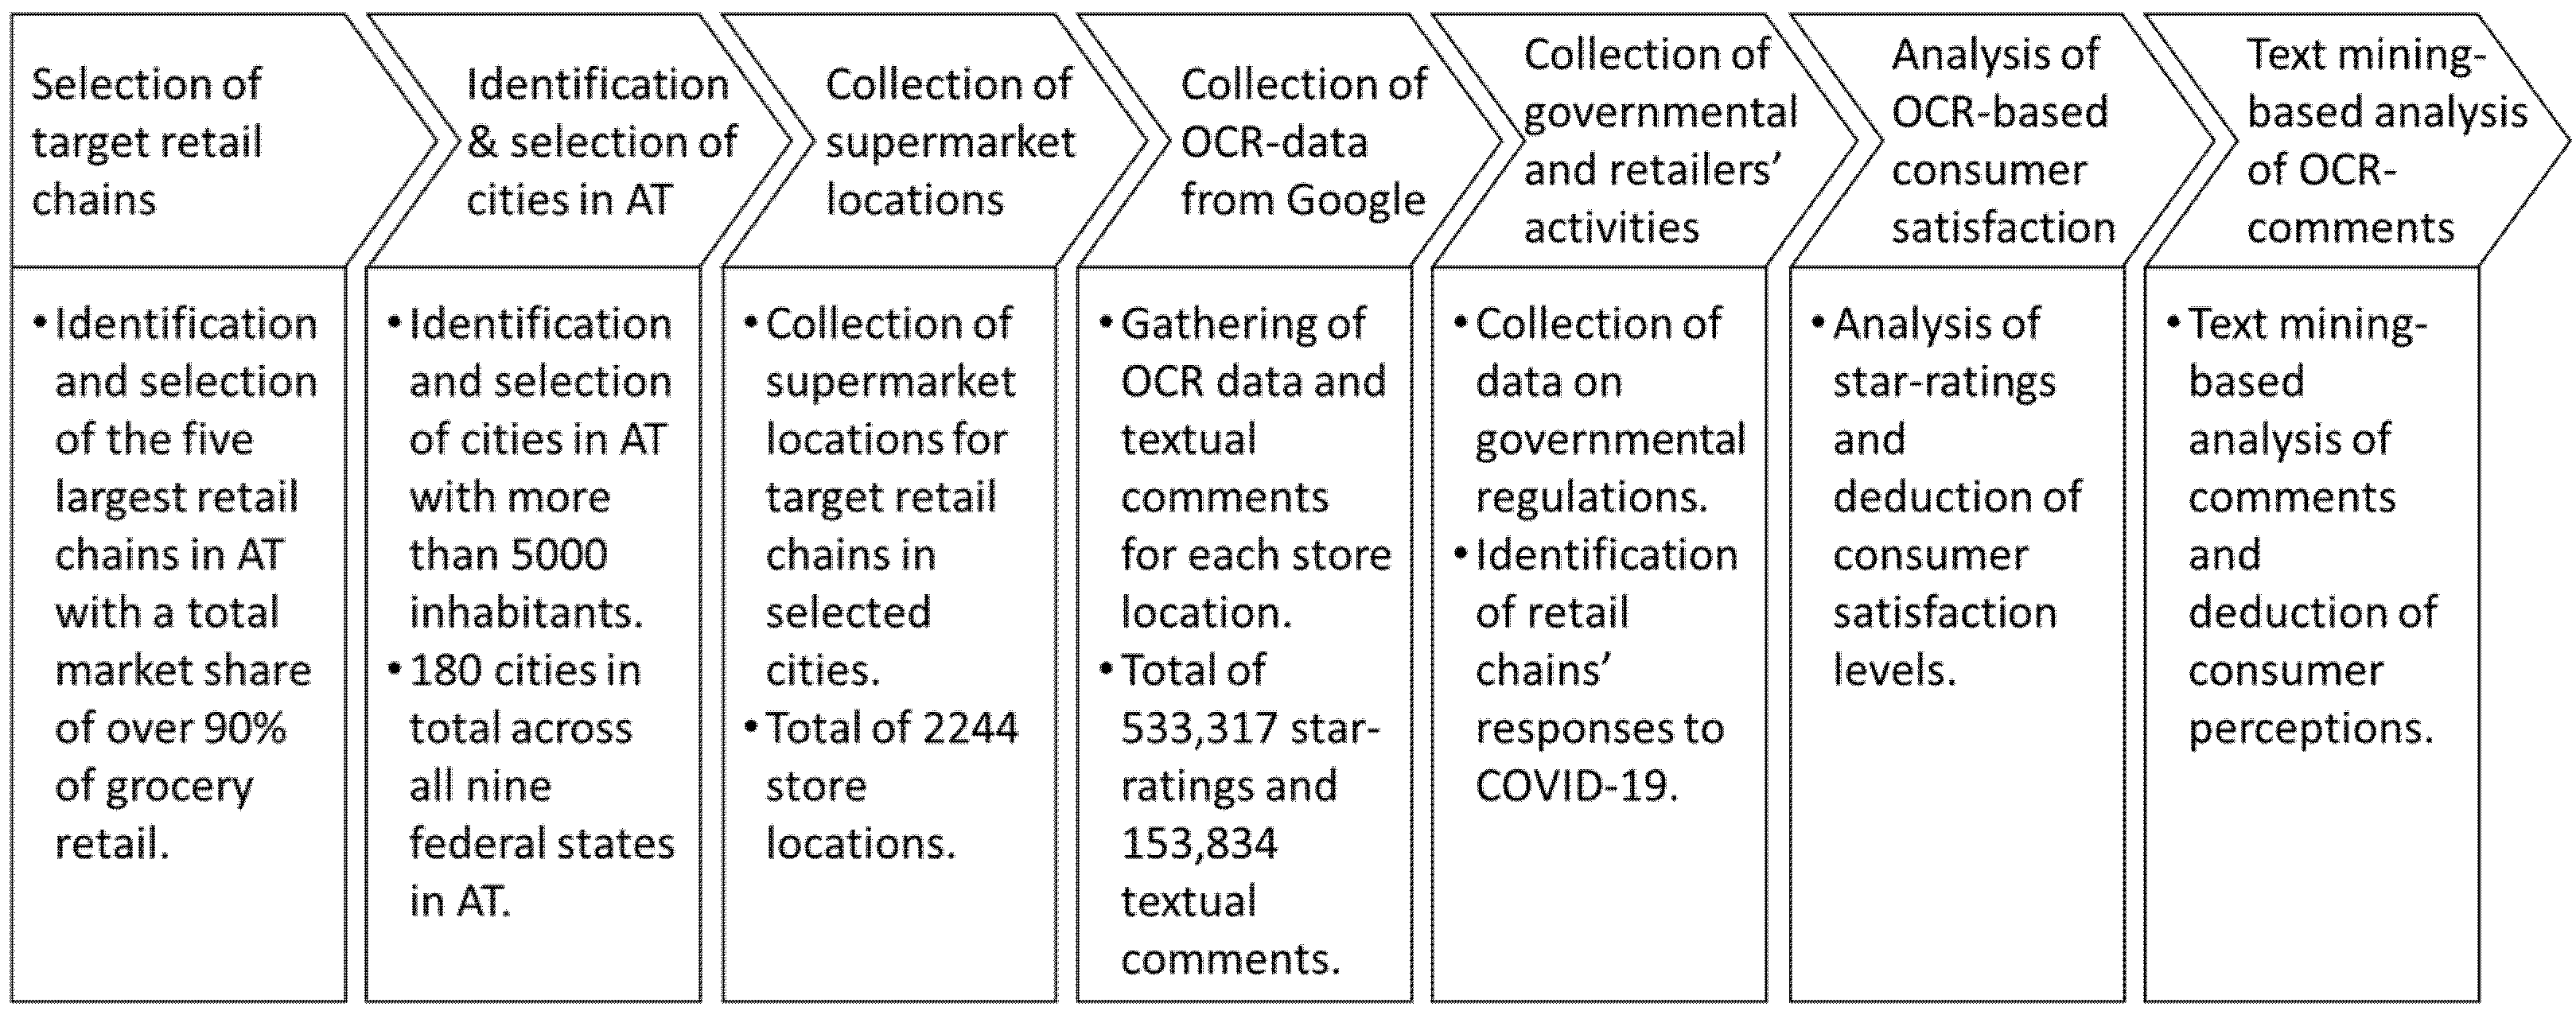
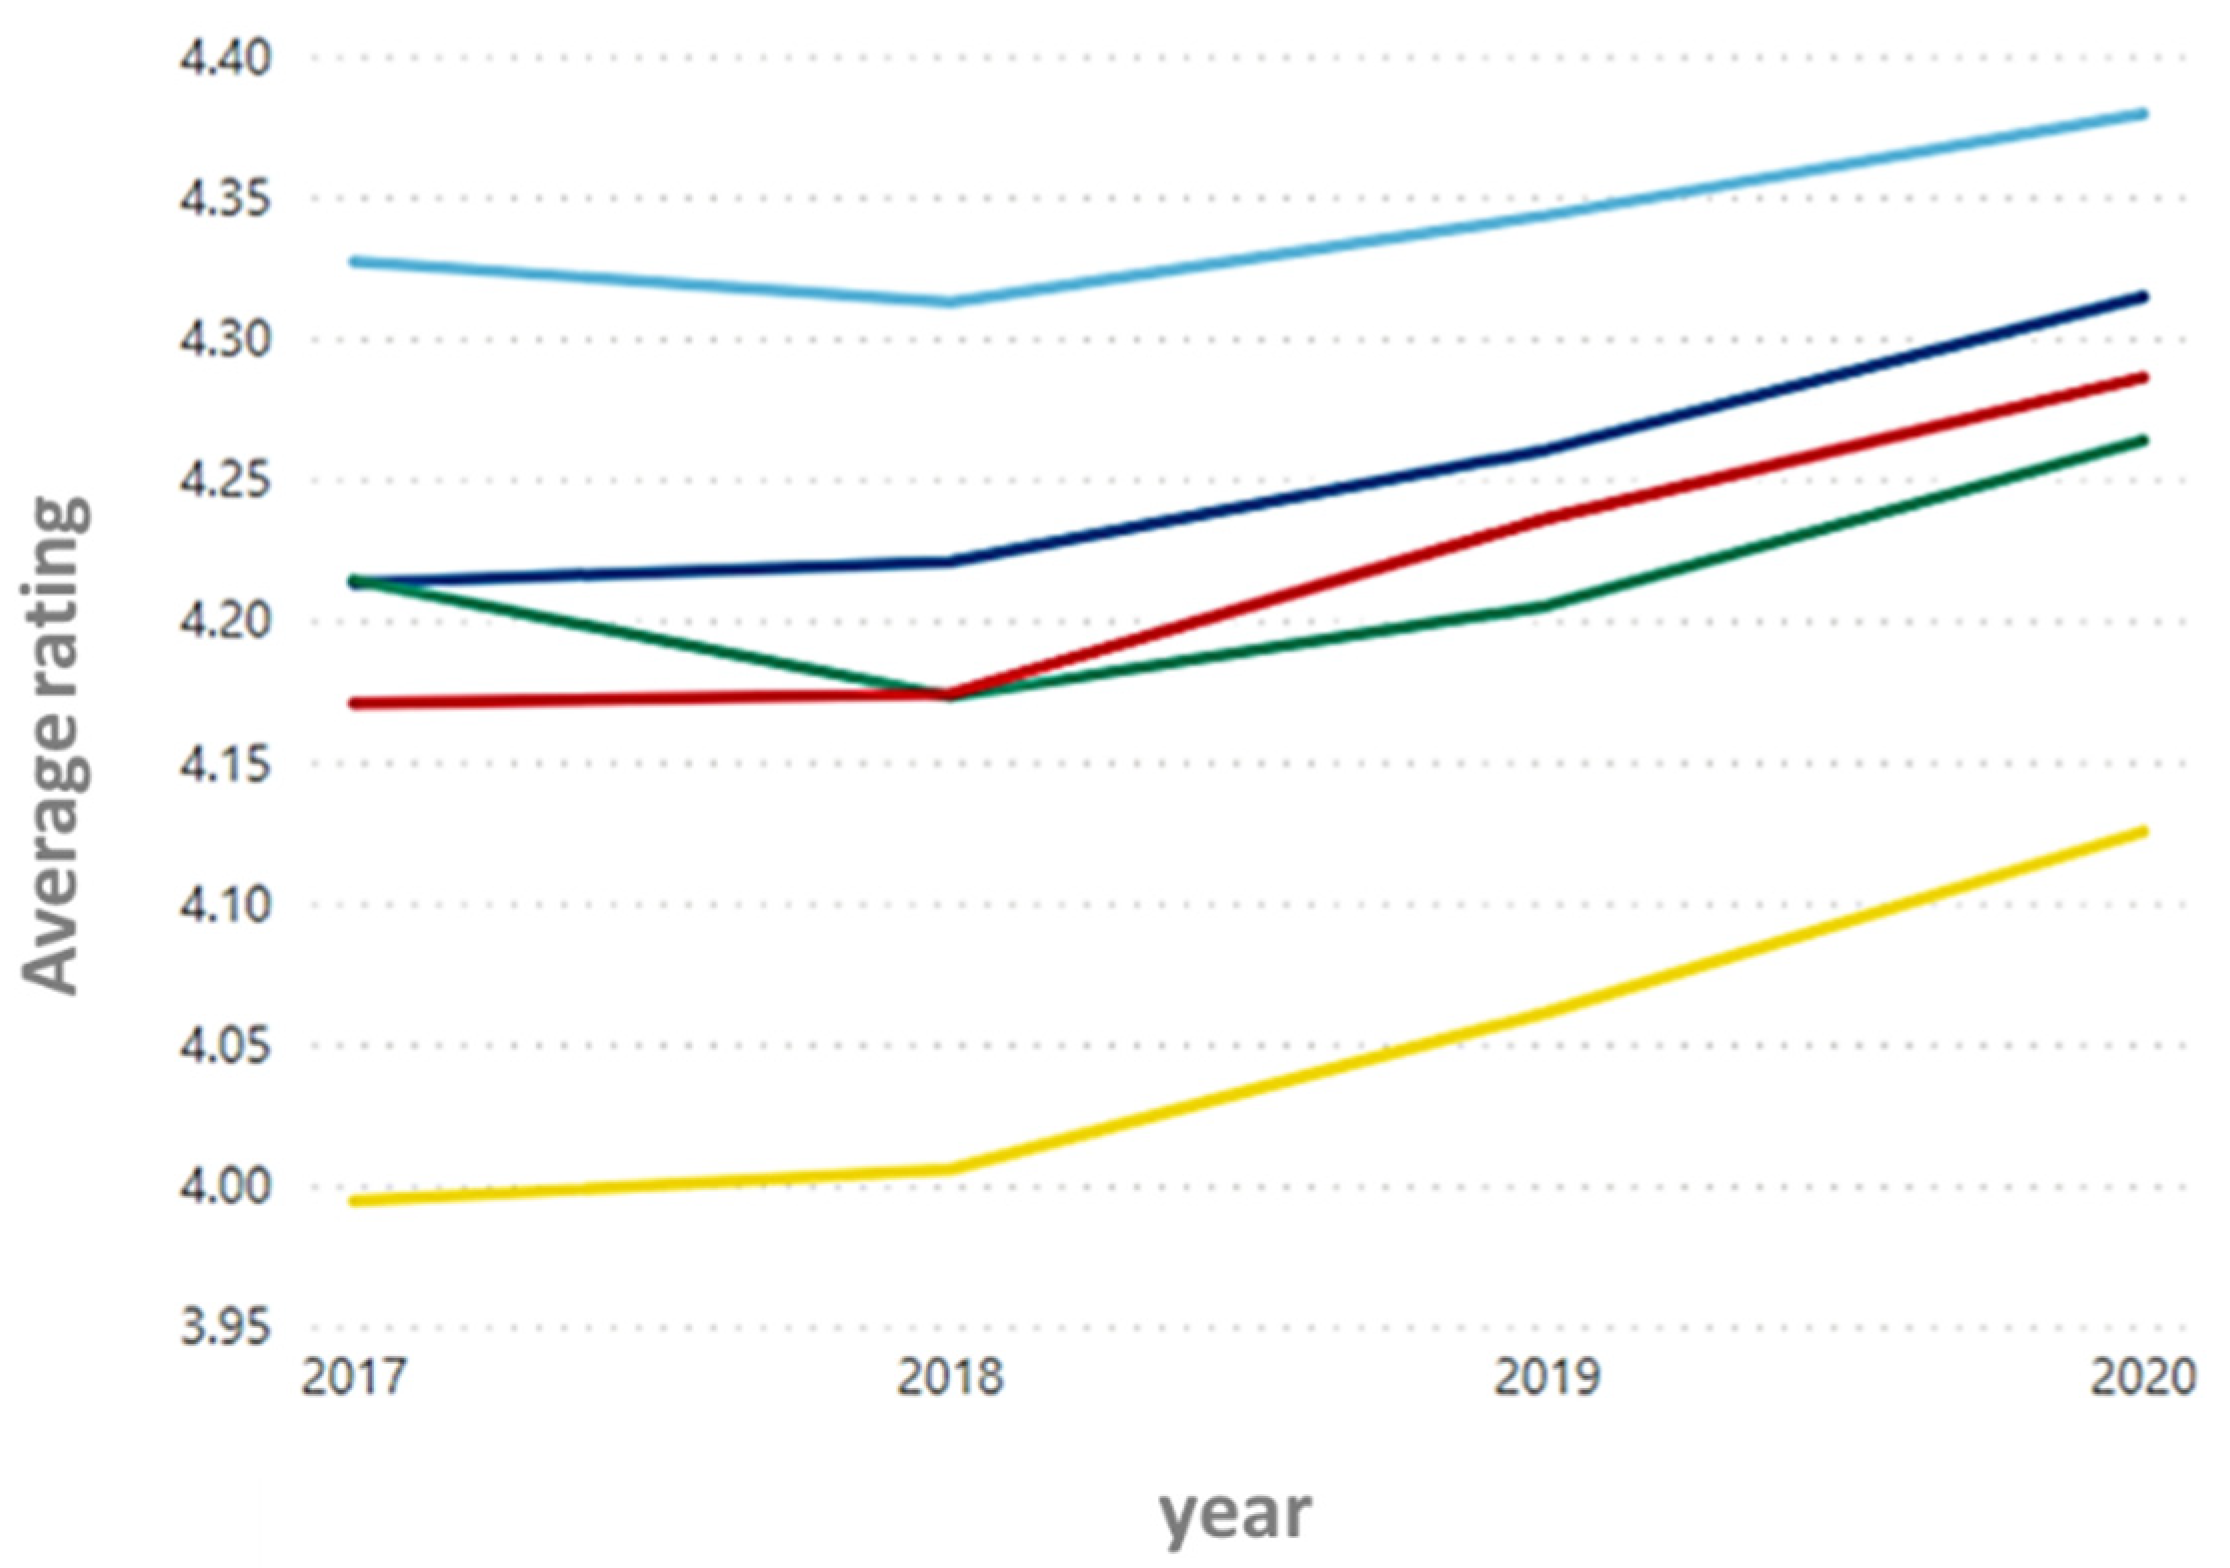
Section 3 provides the background of the study by describing the composition of the analyzed retail chains and the data acquisition method as well as the analysis dimensions used for this study.
Section 4 provides the answer to the first research sub-question by presenting the results of a detailed analysis of changes in consumer satisfaction levels of major retailers in Austria and discusses the impact of political regulations and retail chains’ responses to the pandemic on consumer satisfaction.
Section 5 addresses the second research sub-question by providing a text-mining-based analysis of consumer sentiment data and by identifying factors that have impacted consumer satisfaction levels during COVID-19. Finally,
Section 6 provides the summary and discussion of results, followed by
Section 7, which presents the conclusion and limitations of the study.
2. Literature Review on Consumer Satisfaction
The concept of consumer satisfaction (CS) represents a central element of modern marketing. A broad variety of literature has dealt with the issues of how to define, measure, improve, and extend this concept over the last decades [
33]. An acknowledged definition of CS goes back to [
34], defining it as “
a summary affective response of varying intensity […] with a time-specific point of determination and limited duration […] directed toward focal aspects of product acquisition and/or consumption” [
34] (p. 15). Hence, the three general components of consumer satisfaction according to [
34] are as follows: (i) CS is a response (could be emotional or cognitive) that (ii) pertains to a particular focus (could be expectations, product, consumption experience, etc.) and (iii) occurs at a particular time (after consumption, after choice, based on accumulated experience, etc.). Other definitions of CS describe it as “
the buyer’s cognitive state of being adequately or inadequately rewarded for the sacrifices he has undergone” [
35] (p. 145), respectively as “
an emotional response to the experiences […] associated with […] patterns of behavior such as shopping and buyer behavior, as well as the overall marketplace” [
36] (p. 256). Ref. [
37] define consumer satisfaction as “
an evaluation rendered that the [consumption] experience was at least as good as it was supposed to be” [
37] (p. 459). Following these definitions, consumer satisfaction is the outcome of an evaluative process of the consumer’s responses to a particular focal aspect (e.g., the shopping experience or behavior) at a specific time (e.g., during the shopping process). In correspondence with the focus of the current paper, CS is defined as the summary of affective responses of a consumer occurring during the physical shopping process in times of COVID-19 and directed toward product acquisition.
A strong relation between CS and consumer behavior was found in [
38]. More precisely, higher CS levels positively affect consumer behavior in terms of expressing preferences for a specific company over others, increasing purchase volumes, or agreeably pay a higher price. According to [
39] a negative consumer satisfaction, i.e., dissatisfaction leads to consumer-complaining behavior (CCB). CCB is manifested in consumer responses, e.g., in the form of negative (online) feedback and word-of-mouth communication [
39]. By not only capturing OCR ratings, but also analyzing the textual evaluation comments associated with these ratings, the current paper provides deeper insights into CS and the specific consumer perceptions underlying it. In [
40,
41], it is asserted that consumer satisfaction is directly related to service quality and that there is a direct relationship between consumer’s perceptions and attitude regarding a retail store’s service quality and their satisfaction level. In the course of the current paper, CS is measured via the online response of consumers by means of the submitted OCR-ratings. The consumer perceptions underlying the specific ratings are analyzed via the comment(s) associated with them. Following [
40,
41], analysis of comments is done based on the acknowledged dimensions of service quality as discussed in
Section 3.3.
5. Changes in Consumer Perceptions and Sentiments Related to COVID-19
In the previous section, we showed how consumer satisfaction levels have developed across all major retailers and how these developments are related to political regulations and retail chain responses. A valuable insight would be to know the actual factors that caused these changes in consumer satisfaction across the major retailers. This section, therefore, provides detailed results from text mining and analyzes over 153,000 consumer comments gathered in this study. As a result, the factors that have influenced consumer perceptions of grocery retailers most during the pandemic could be determined.
In summary, the impact of COVID-19 could be observed across all the sub-dimensions for measuring consumer sentiment as presented in
Section 3.3. In
Table 2, the actual changes in the single factors are presented: a value of 1 equals no change in the relevance of the dimension, while a value above or below 1 indicates and increased, respectively, a decreased relevance of the specific sub-dimension. The results show that the value for each category changed when compared with the pre-epidemic sentiment data. Our findings also show that physical aspects of the store such as store layout and store’s facilities are the two most important factors that shaped consumer sentiment during COVID-19:
Other factors that experienced an increased relevance for consumers during the pandemic include announcement, product availability, waiting time, shopping material, and payment methods. The obvious reason could be their relation to a feared infection. Previous work has shown that COVID-19 mainly spread due to physical close contacts and confinement in limited physical space [
49]. Based on this and confirmed by our results, consumers also seem to prefer a shopping experience where the store layouts and markings ensure less human to human contacts.
Shoppers also seem to prefer payment methods that reduce contact at the cashier desks as well. With regards to the time factors, shoppers prefer to spend less time in the stores. This could be because of the fact that the longer the time spent in an enclosed environment (such as supermarkets) is, the higher the risk of contracting the virus gets. Therefore, shopping experiences that involve long queues are considered a negative factor for shoppers.
Furthermore, the non-availability of products greatly affected consumers’ perception of retailers since some consumers seemed to want to overstock on certain products and were rather unsatisfied when these products were not available or not given to them in the amount desired. Such effects were also observed in previous work [
6].
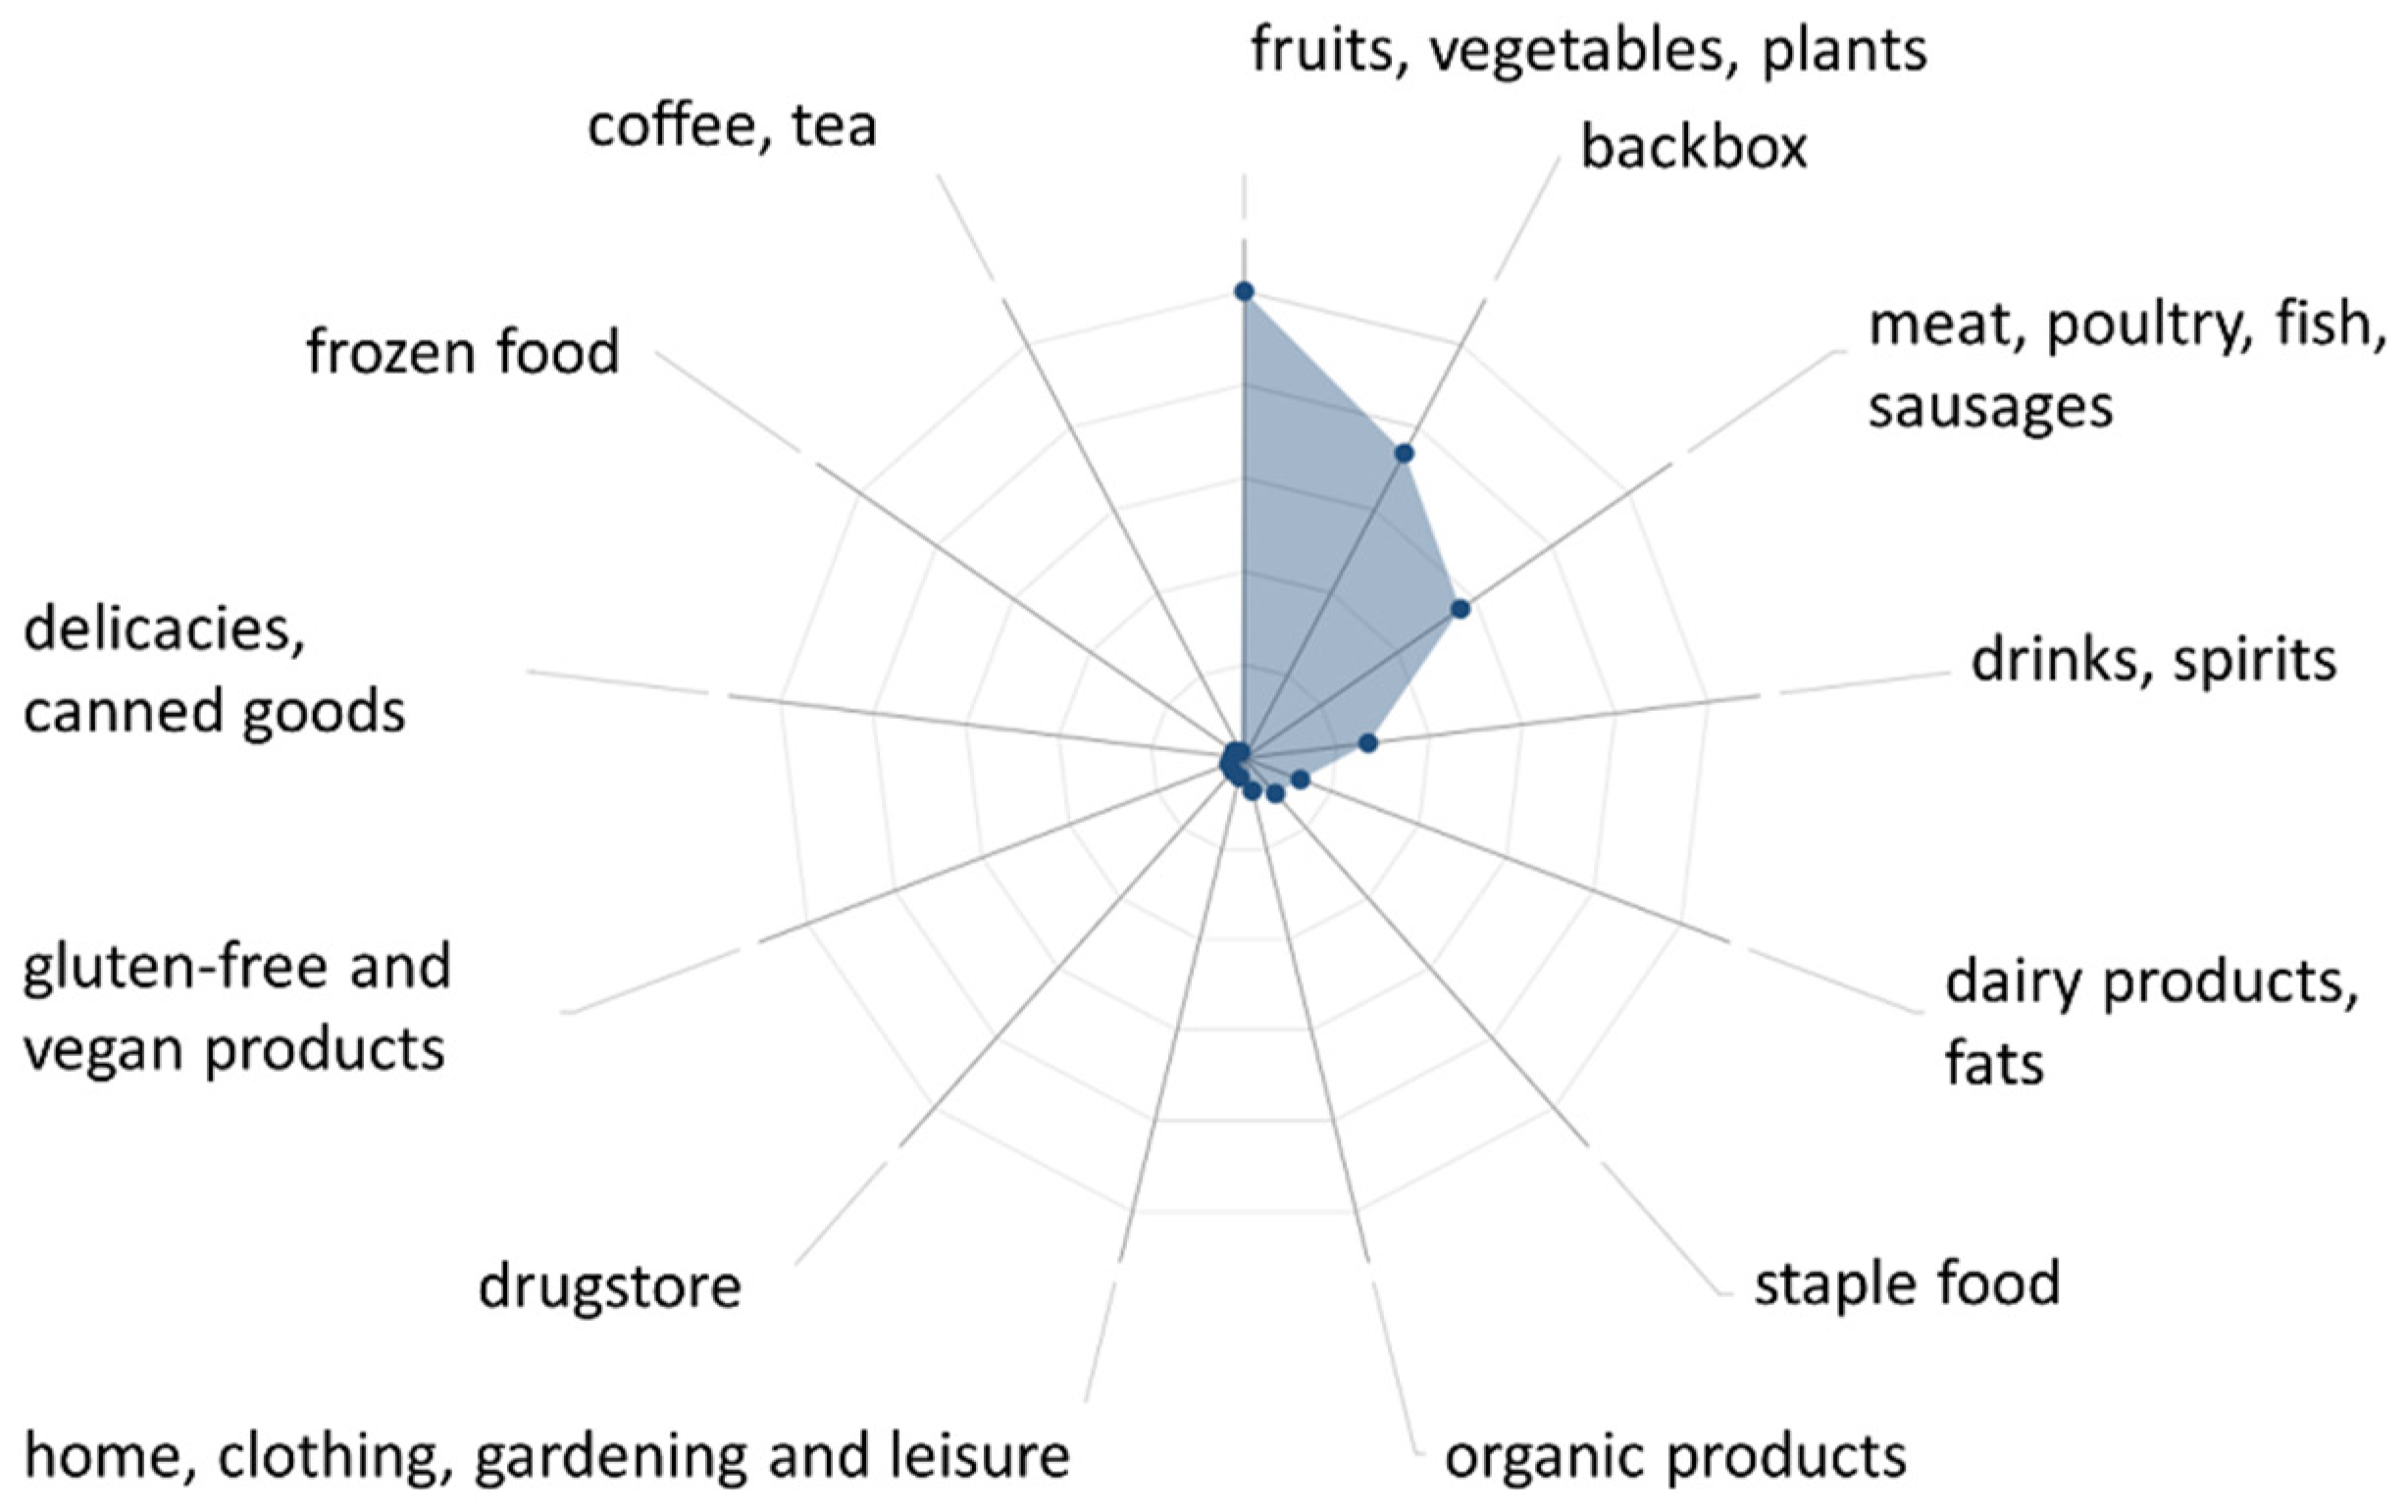
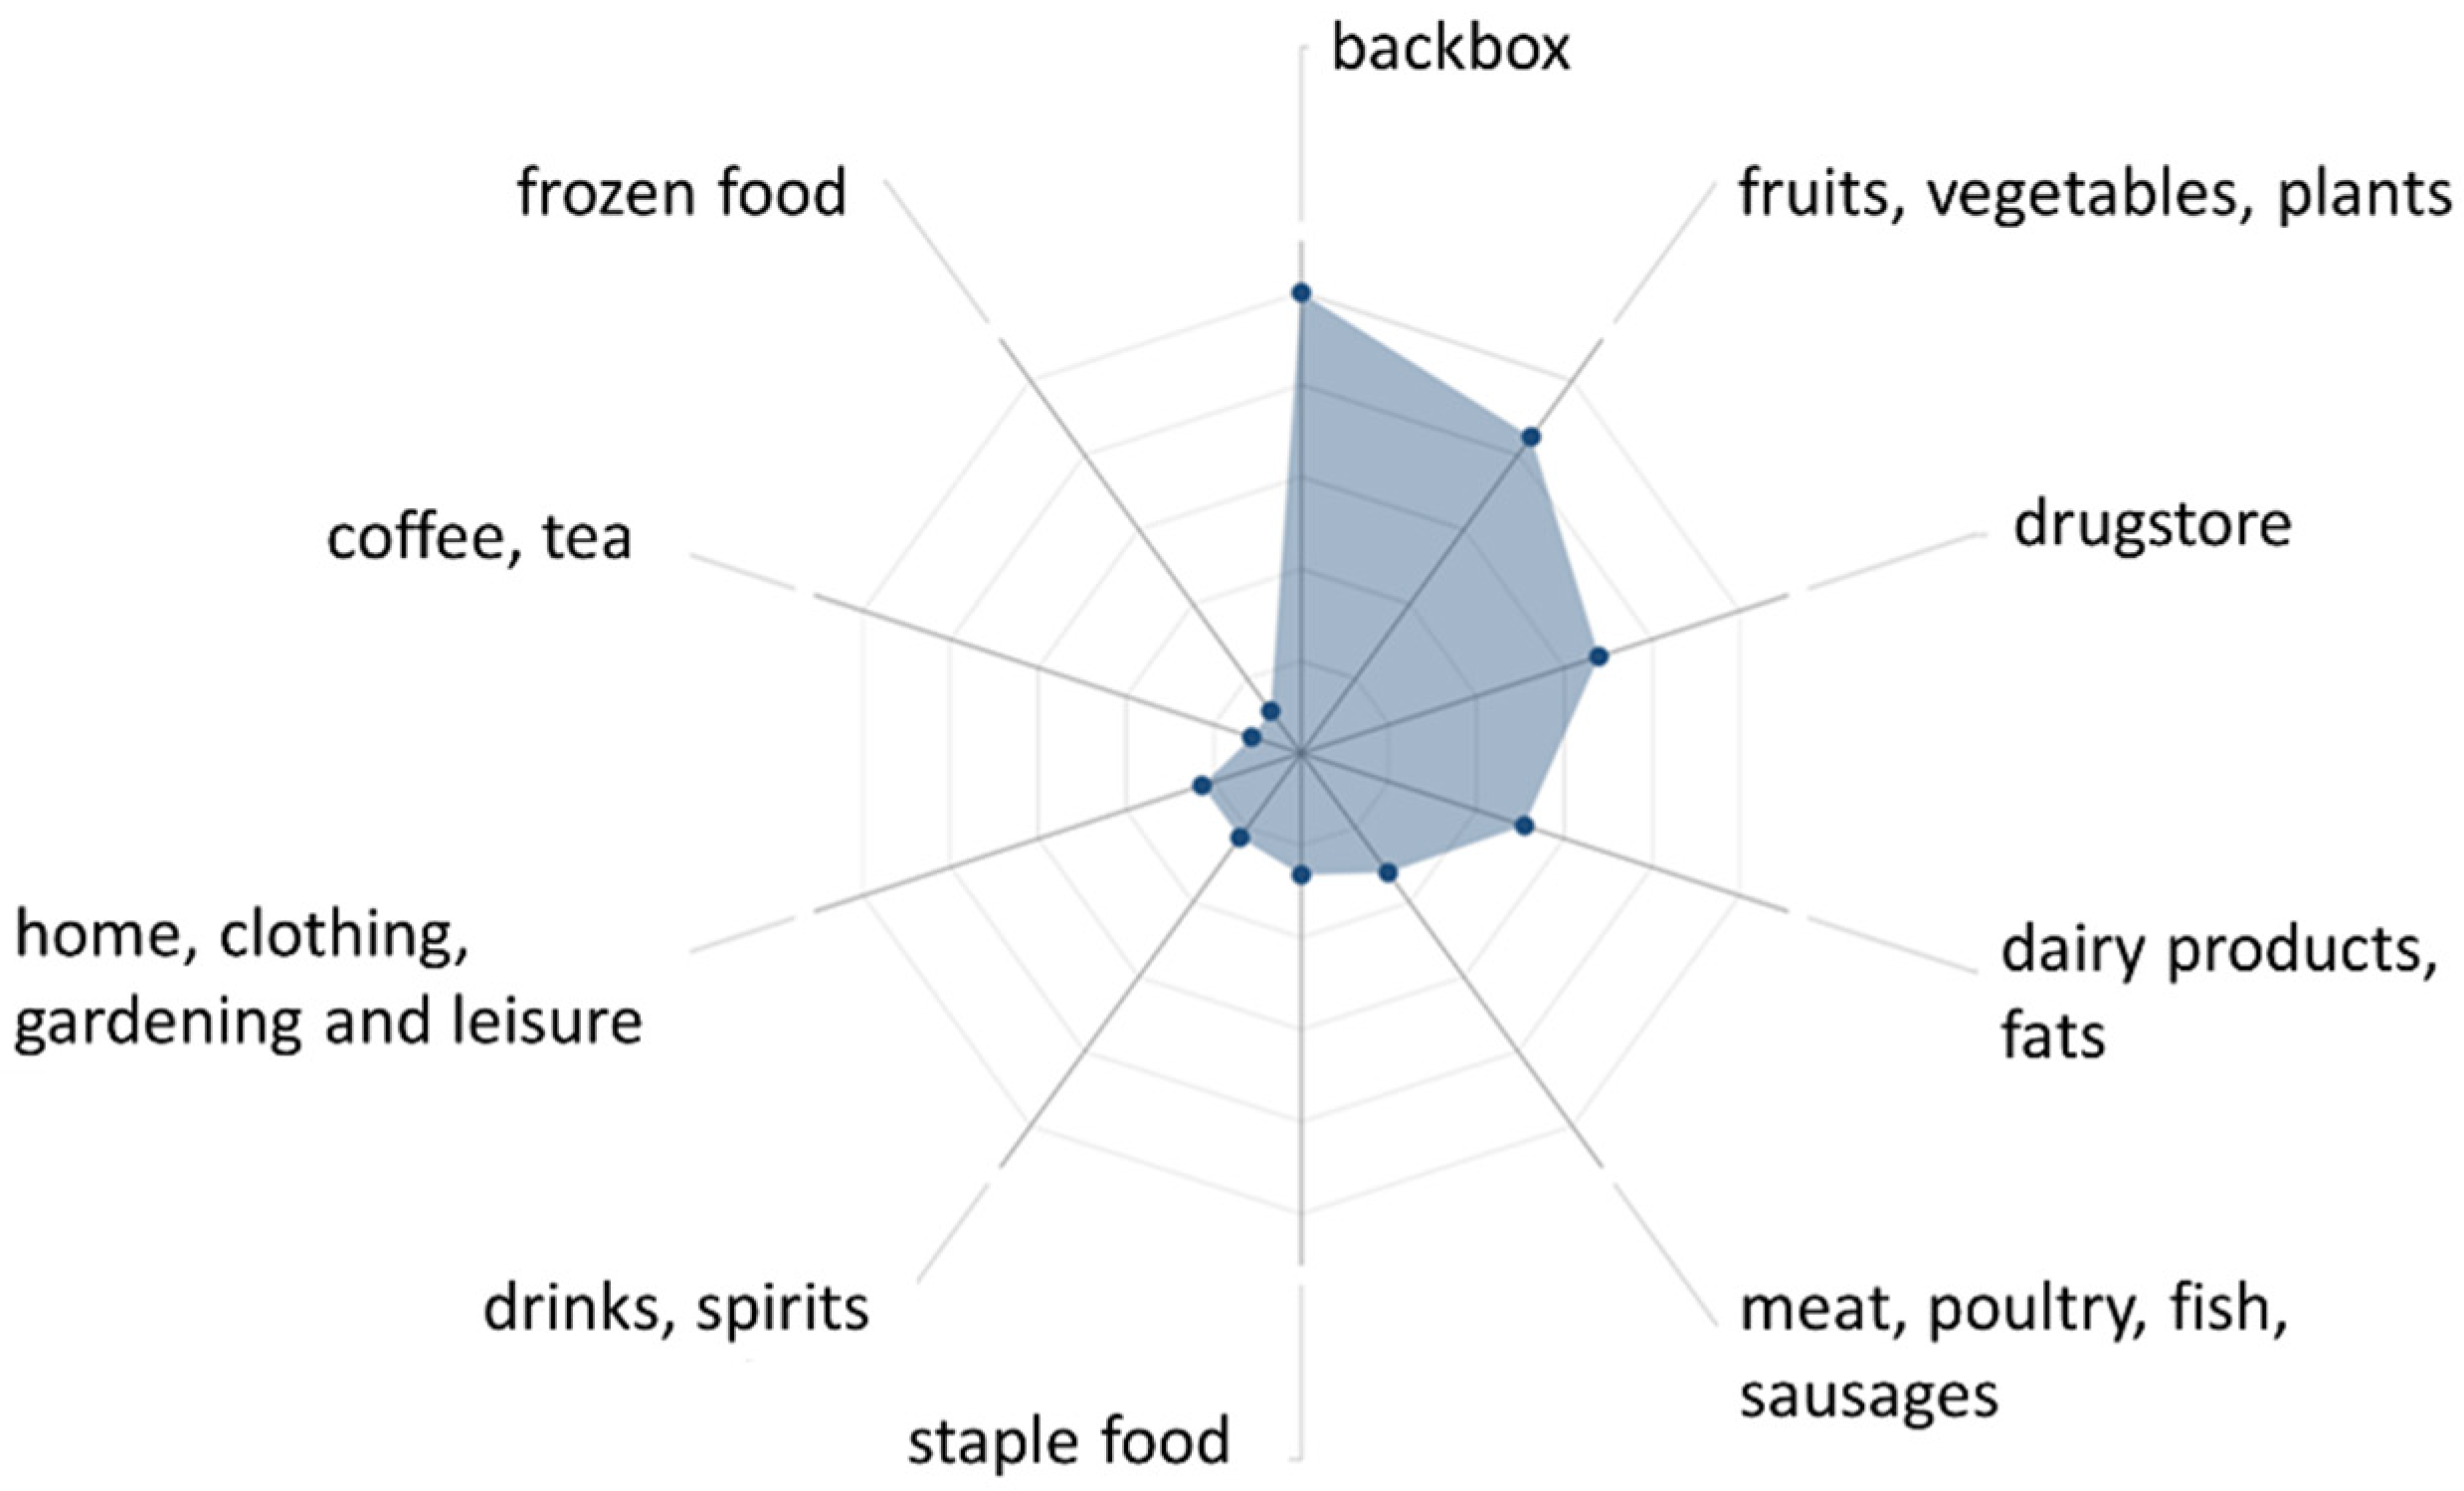
Another finding of the conducted text mining is the fact that people seem to care more about drugstore products like soap or sanitizers. While, before COVID-19, these products were mentioned in a very small proportion of negative reviews as can be seen in
Figure 8, they became the third-largest group of products responsible for negative satisfaction ratings during the pandemic, see
Figure 9:
As shown in
Figure 8 and
Figure 9, the two main product groups that have an outstanding impact on the consumers’ opinions with regards to the performance of these stores are fruits, vegetables and plants, and “backbox” products (i.e., bakery products from pick-up boxes like bread or rolls).
The products included in these groups mostly represent articles that are not packed separately (e.g., with plastics) and have short expiration dates. While fruits and vegetables had the highest impact on negative reviews before COVID-19, they were replaced by backbox products during the pandemic. An explanation could be the fact that people started to worry more about these unpacked bakery products than before the pandemic due to a perceived higher risk of contracting the virus and the fact that bakery products cannot be sanitized due to missing packages. Customers may not be aware of the correct method for cleaning these types of products. A further reason for the higher impact of backbox products could be the fact that they also include pre-prepared and ready to go bakery, which is normally also available in fast food restaurants that had to close down during the pandemic.
Another interesting finding is related to organic products: while they represented the seventh-largest product group responsible for negative reviews before COVID-19, they completely vanished from the top 10 product groups involved in negative store evaluations during the epidemic.
6. Summary and Discussion of Results
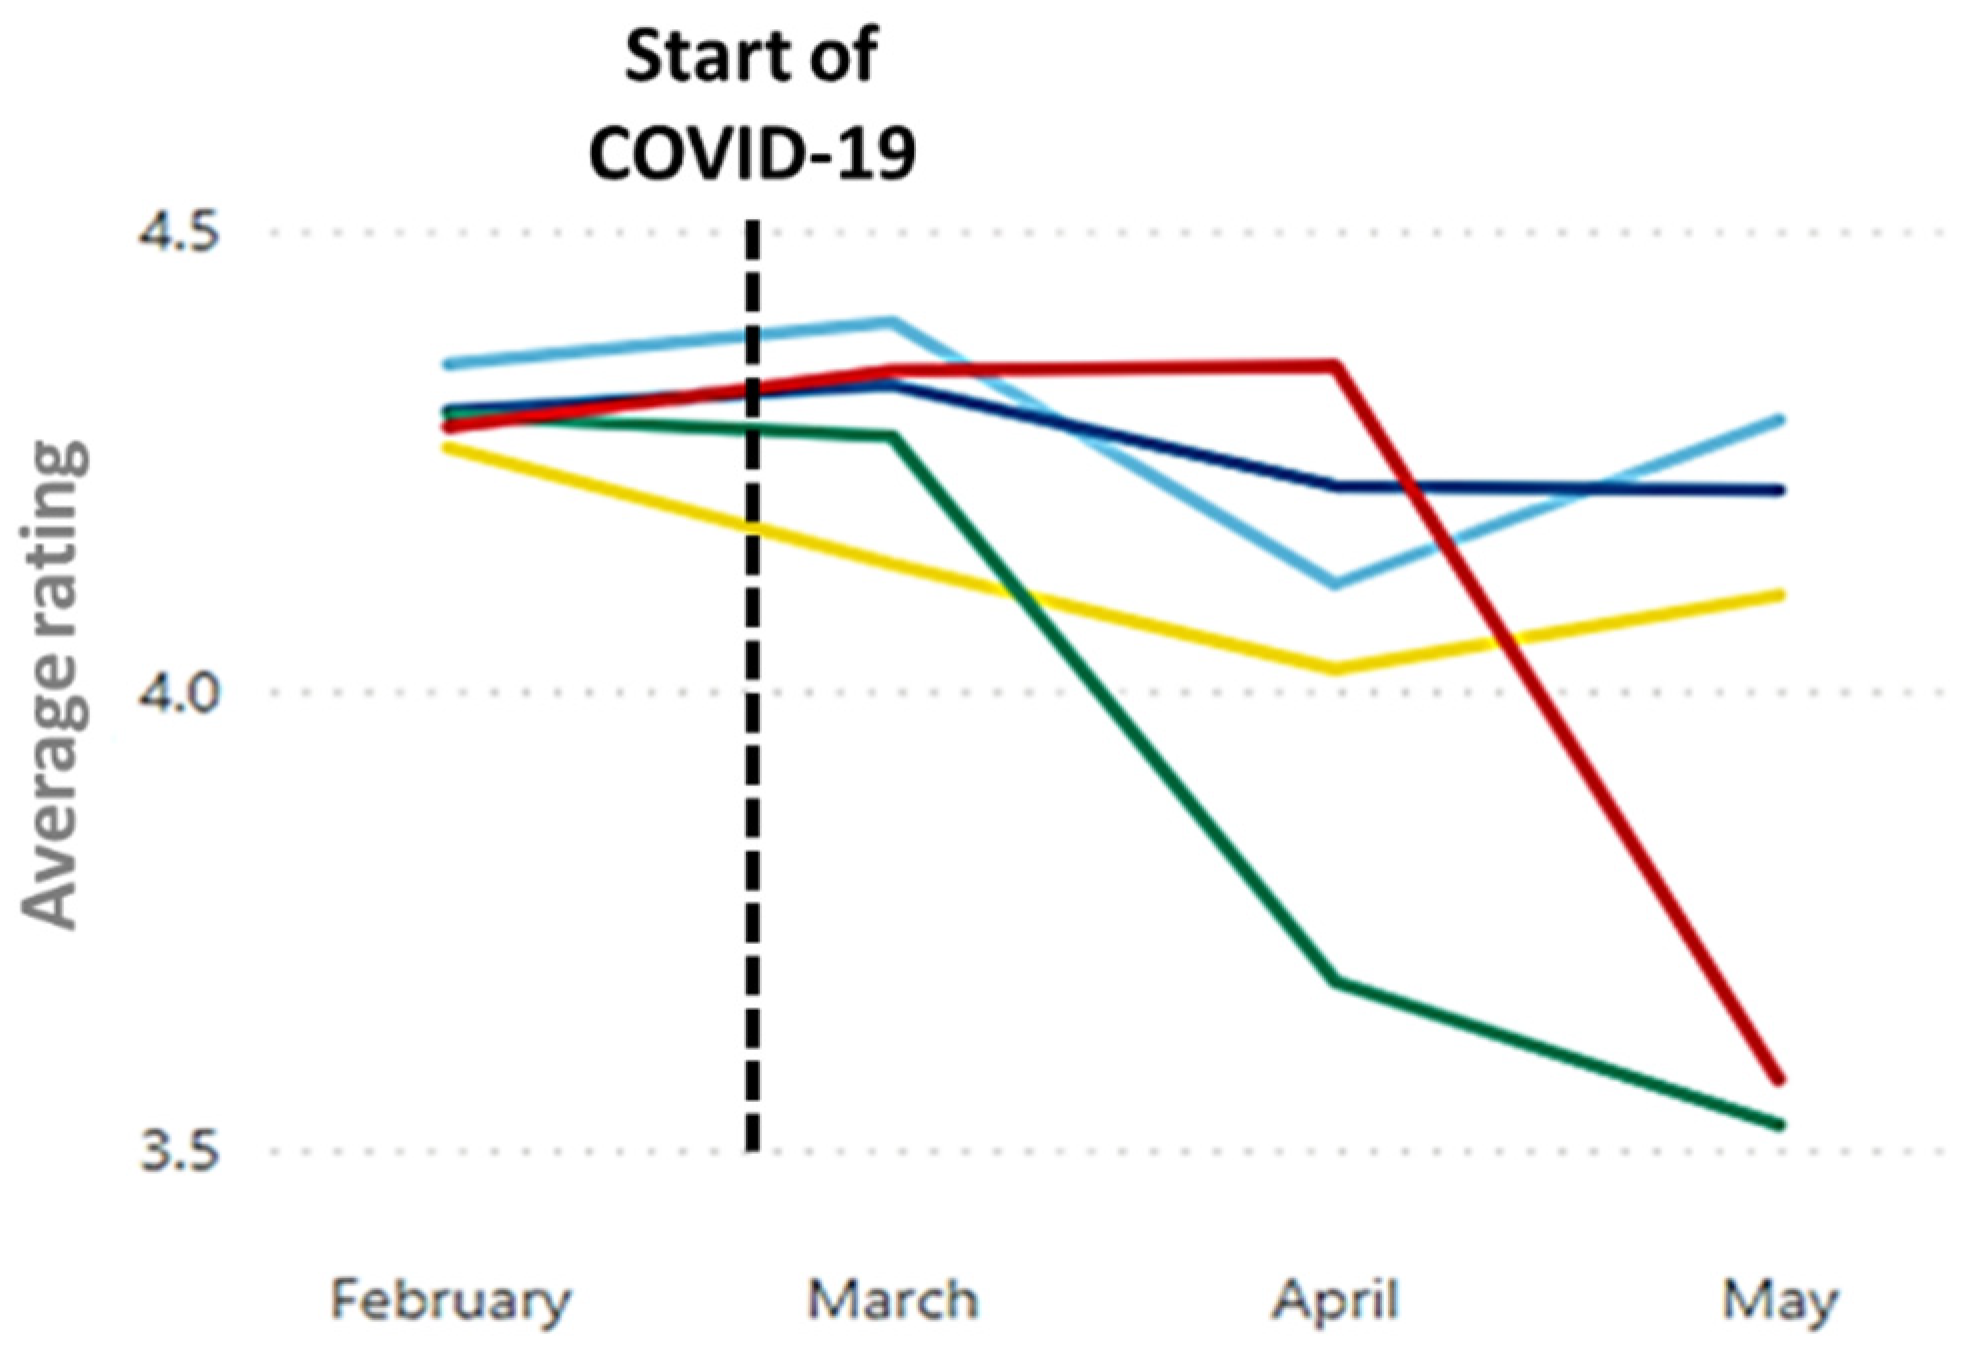
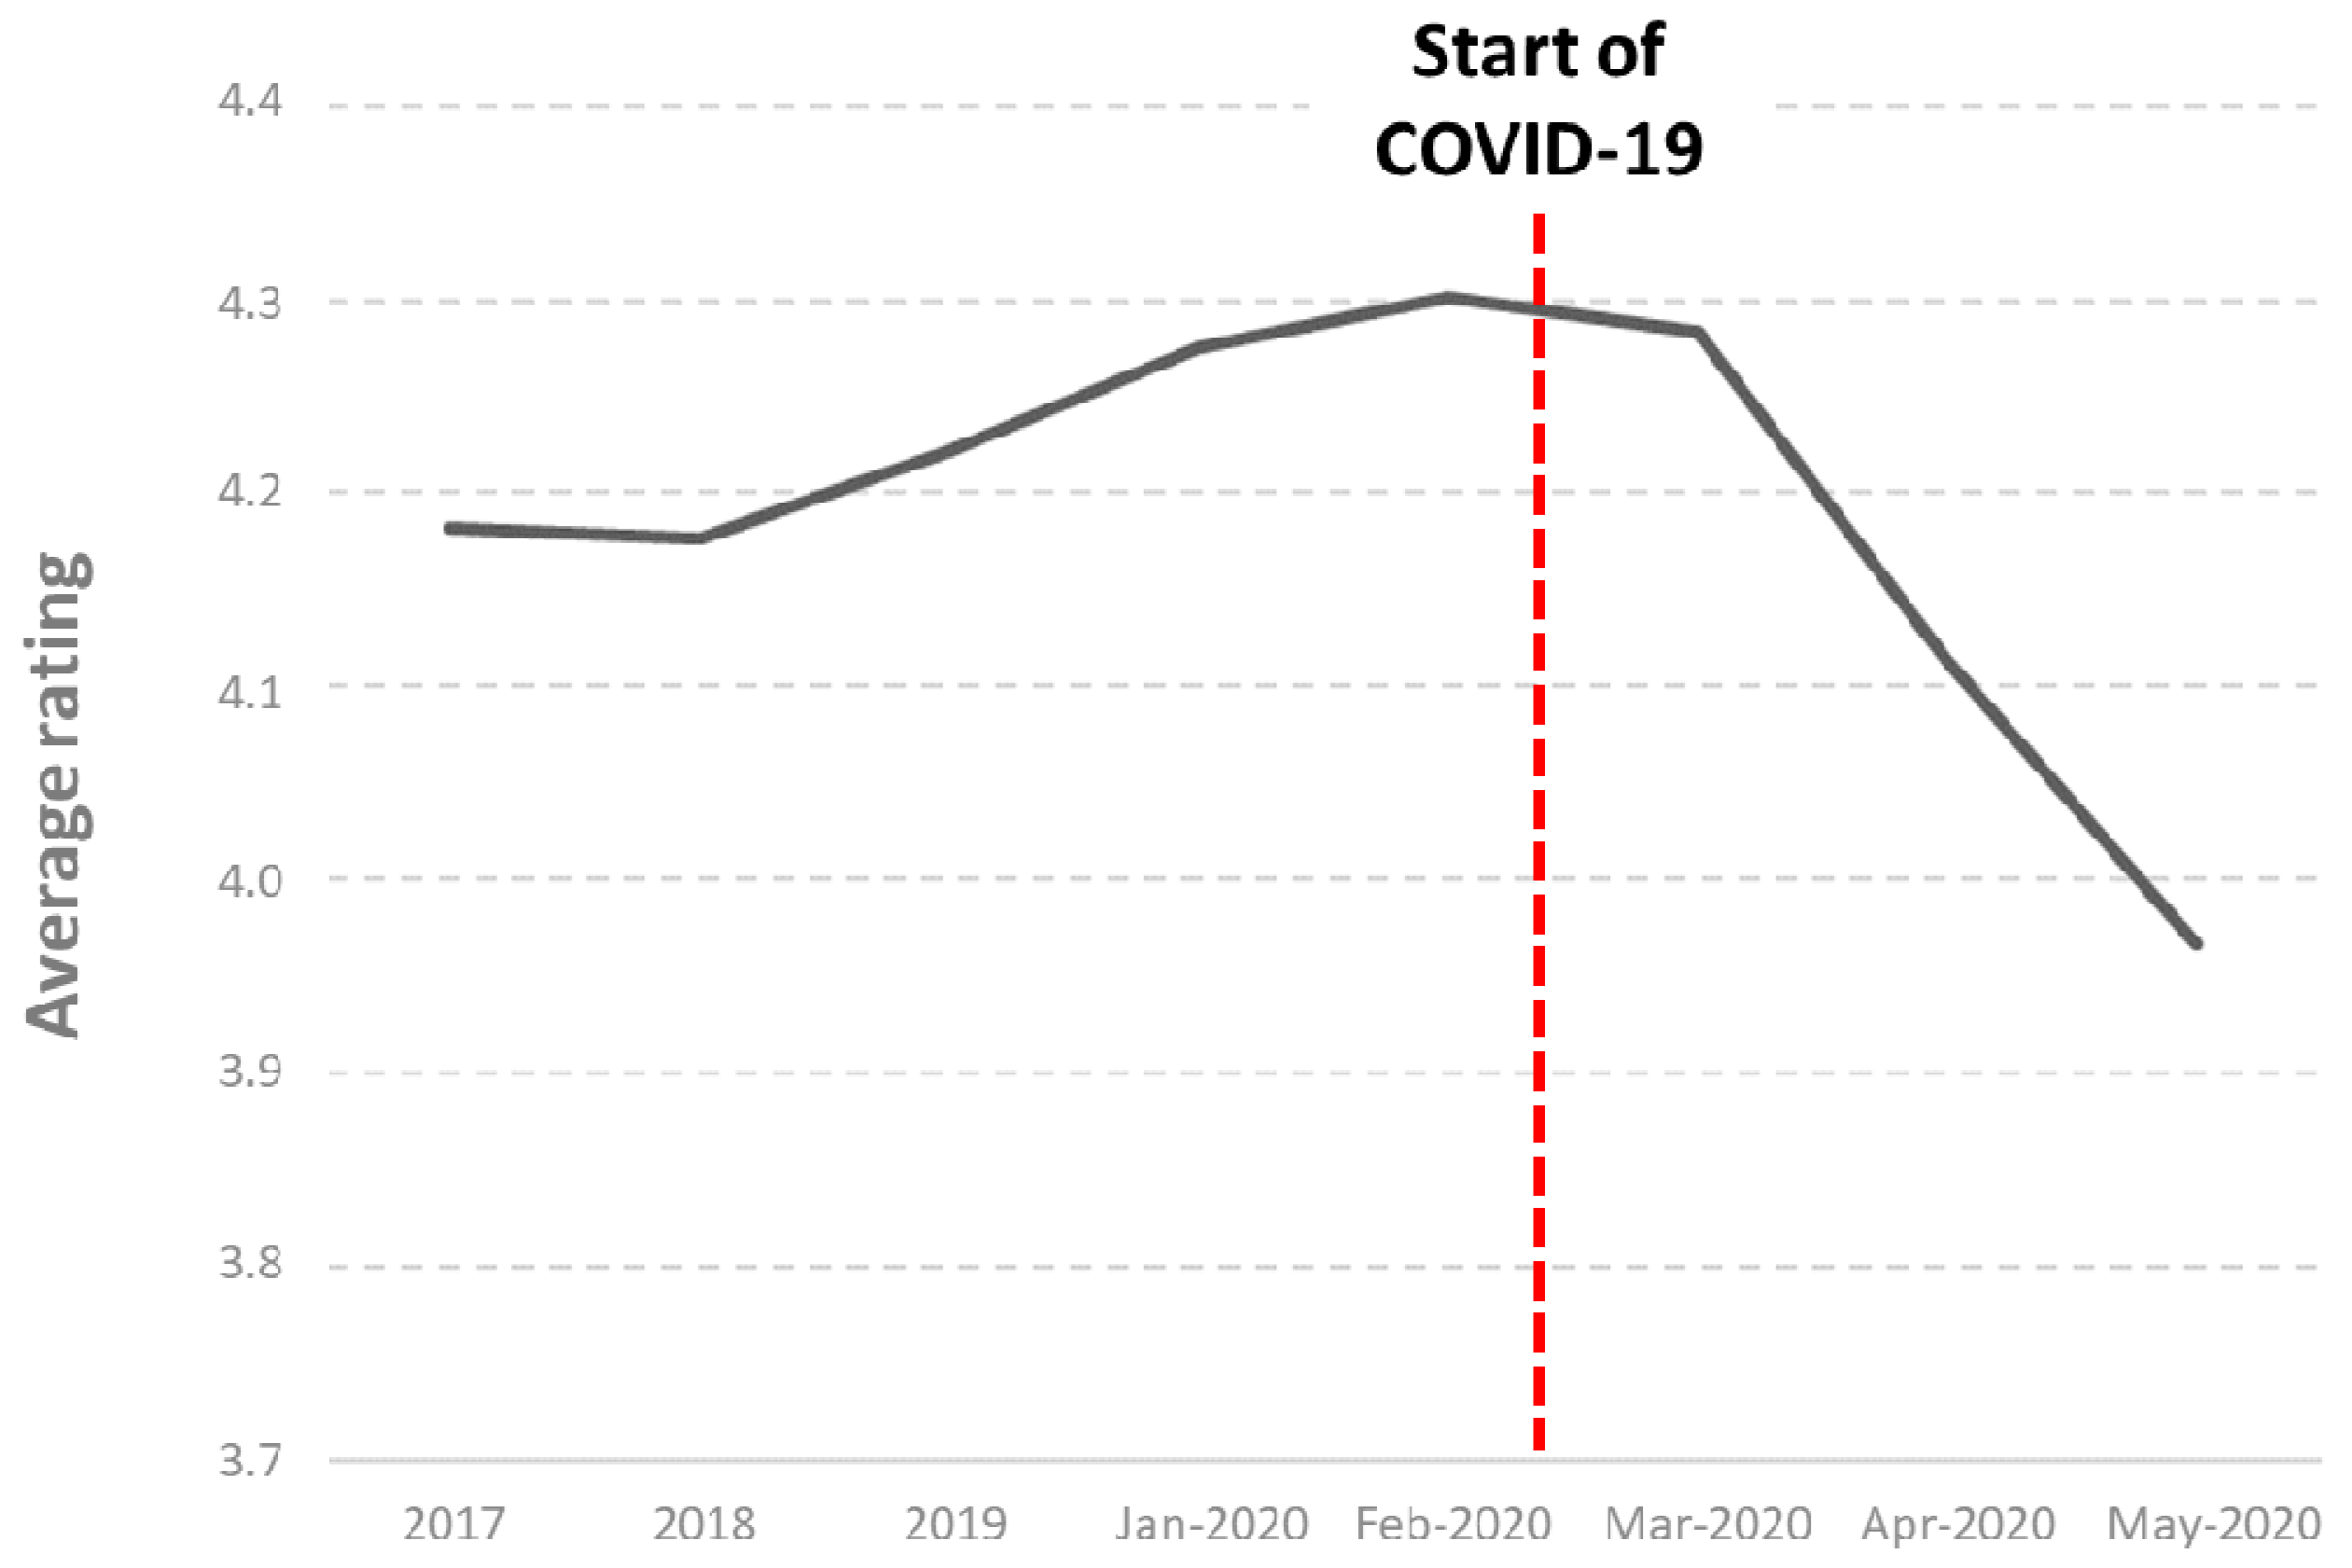
To summarize the main findings of our study, the main results of the research are outlined and discussed against the background of previous work. The overall result was a general and significant decline in consumer satisfaction across the major retailers in Austria due to COVID-19. When comparing the consumer satisfaction level before and during COVID-19, a negative impact of the pandemic can be observed. Directly before the start of the pandemic, consumer satisfaction in Austria had an average value of 4.282 in late February 2020. In parallel to the spread of the virus and the associated governmental regulations, a continuous drop of satisfaction down to a level of 3.96 took place. Following [
47,
48] a consumer satisfaction level below 4 can be regarded as a negative satisfaction. Hence, one of the impacts of COVID-19 on consumer satisfaction in Austrian grocery retail was to turn the average positive to an overall negative satisfaction level of consumers. This is in line with similar research on the issue of the overall development of consumer satisfaction in times of COVID-19, which also identified a decrease in satisfaction [
9]. The findings of our study show, that the impact of COVID-19, as well as the starting points for decreased satisfaction levels, varied across the retailers. Three out of the five main grocery retail chains in Austria managed to maintain a positive satisfaction level, whereas the remaining two had a clear decrease. This varying impact of the pandemic on different providers of products or services was also confirmed by [
12].
Another main finding of the study is that the implementation of safety measures in terms of providing free masks by the retailers did not have as huge an effect on consumer satisfaction as could be expected. When comparing stores with free masks vs. stores that charged consumers for masks, no correlation between mask policy and consumer satisfaction could be found. Rather, the range of product assortment and store size (and hence the number of consumers in the store) seem to be factors that influence consumer satisfaction in pandemic times. While normal grocery retailers with large stores and assortments were hit more by COVID-19 in terms of a drop of consumer satisfaction, discounters, respectively soft-discounters with medium-sized stores and a limited range of products, managed to keep satisfaction drop rates at a lower level respectively to maintain positive overall consumer satisfaction. However, previous research also showed that retail chain employees ignoring norms regarding what is considered as appropriate behavior during a pandemic have a negative impact on consumer satisfaction [
50]. Our study can partially confirm these results, as we found that personal interaction with store employees increased in relevance in the COVID-19 period. Previous work by [
8] showed that the availability of sanitized retail entrances, sanitized retail counters, and sanitized retail shelves had a statistically significant effect on customer satisfaction during the pandemic. As all of the Austrian retailers implemented sanitization during COVID-19 and only differed in terms of free masks or purchasable masks, our study could neither confirm nor reject these results of [
8].
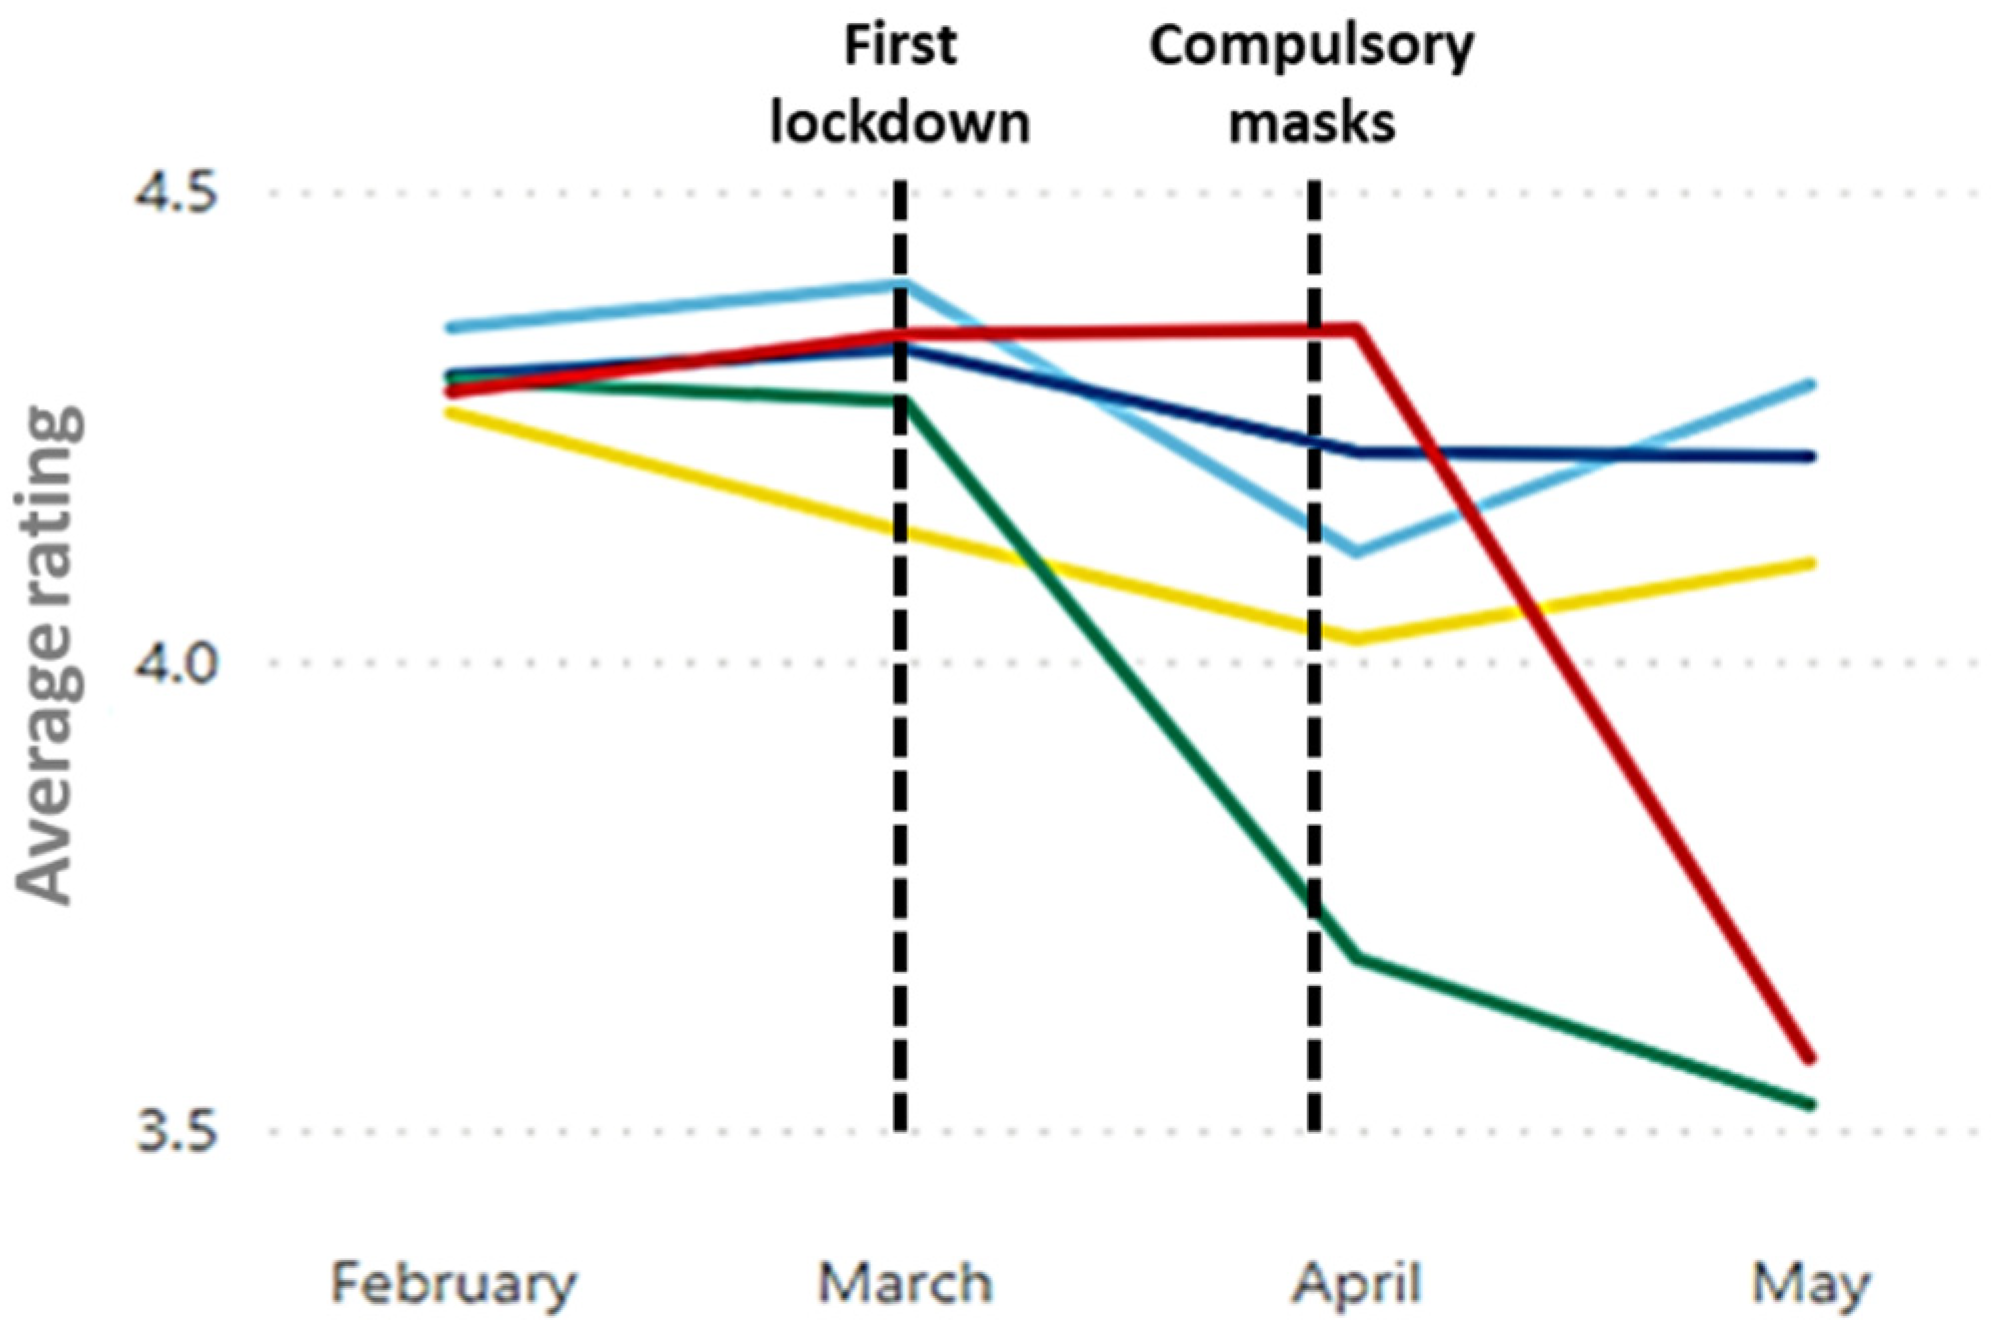
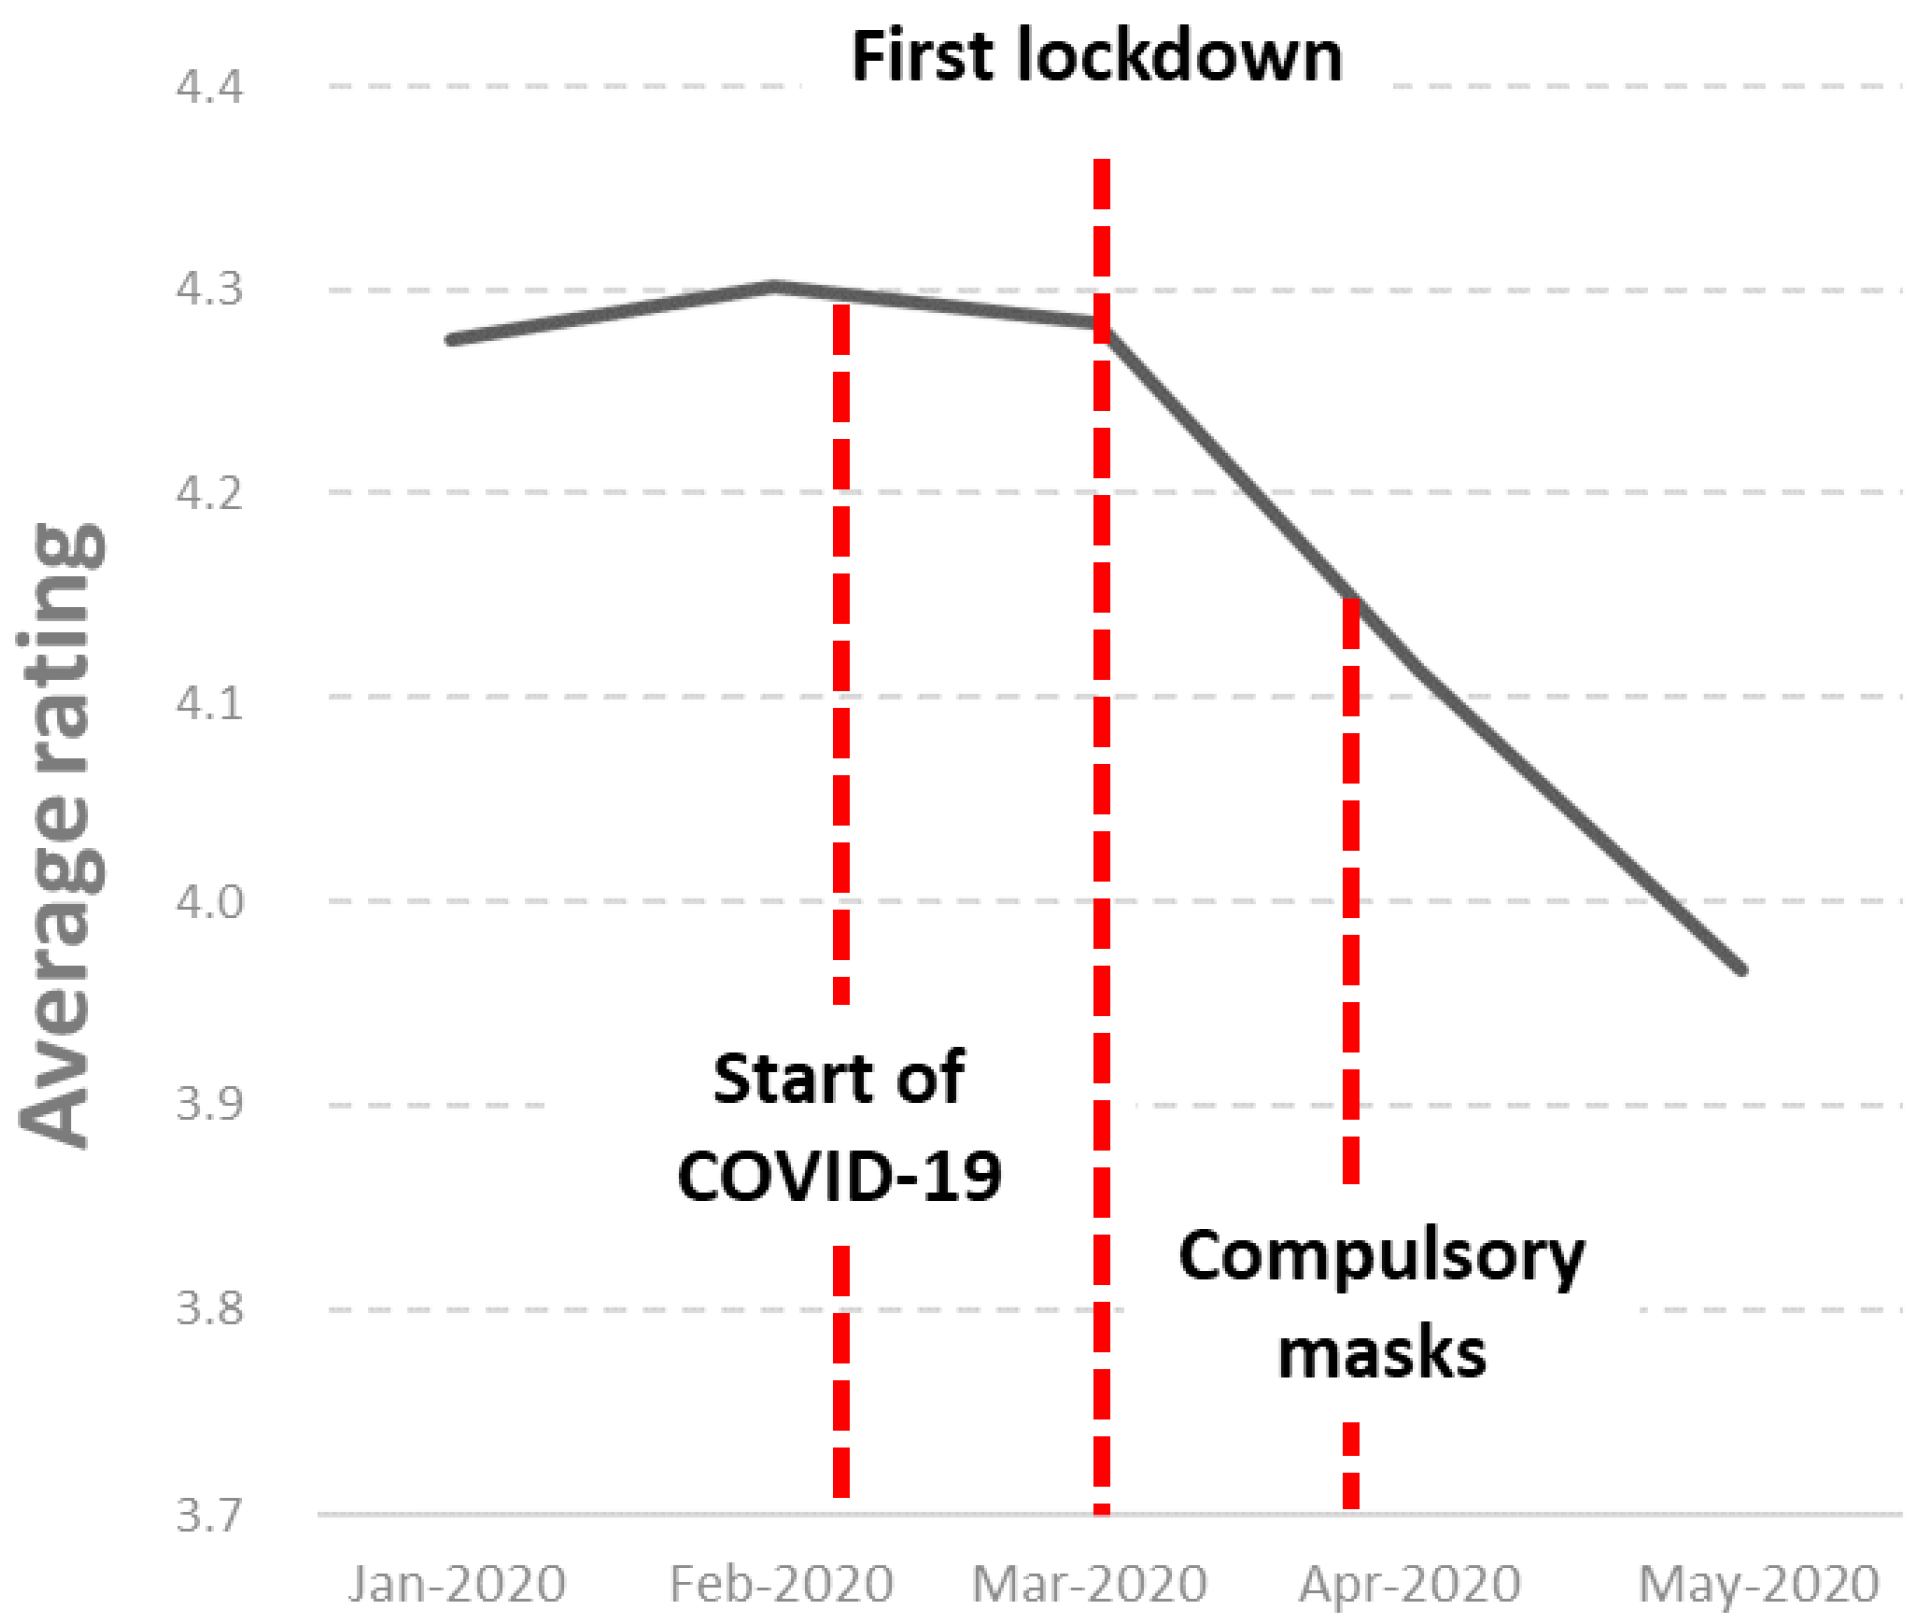
When analyzing the impact of political regulations on consumer satisfaction, the study results indicated a high interconnection of the strictness of measures and decreases in consumer satisfaction. From the beginning of the first nationwide lockdown on the 16th of March consumer satisfaction dropped down radically and way faster than before for all retail chains. The Austrian government announced new safety measures for grocery retail and made it compulsory to wear masks in early April. Although potentially reducing the number of new COVID-19 cases, these measures led to a continuation of the decrease of average consumer satisfaction levels across the country. However, some retailers seem to have better handled these new safety measures than others and managed to improve their satisfaction levels from there on, while others suffered radical decreases. Previous work showed that in situations, where COVID-19 is spreading at an increasing speed, consumers are less willing to shop inside physical stores [
51]. This is also reflected by the results of our study: the stricter the governmental regulations in Austria, which, in turn, correlated with the number of daily increases in infection rates, became, the higher the decrease of consumer satisfaction as discussed in
Section 4.3 was.
In terms of the COVID-19 impact on the sub-dimensions for measuring consumer sentiment, results show that all four main dimensions (i.e., physical aspects, reliability, personal interaction, and policies) were affected by the virus. Physical aspects of the store such as store layout and store facilities are the two most important factors that shaped consumer sentiment during COVID-19. Other factors that experienced an increased relevance for consumers during the pandemic include announcement, product availability, waiting time, shopping material, and payment methods. Factors that had a lower impact on consumer satisfaction during COVID-19 than before the pandemic include accessibility, promotions, and discounts, store environment, product varieties, and product quality. These findings of our study confirm previous research results, which stated that consumers have higher expectations and care more about in-store safety and in-store time in pandemic periods than in normal periods [
52].
By a detailed, text-mining-based analysis of the collected evaluation comments, we were able to also identify the main product groups affected by COVID-19. The results show that drugstore products like soap and disinfectant are much more likely to be involved in negative consumer satisfaction reviews during the pandemic than before COVID-19. More precisely, drugstore products became the third largest group of products responsible for negative satisfaction ratings during the pandemic. Hence, consumers seem to be dissatisfied with these products to a larger extent. An explanation could be the missing availability of these products, which was observable in various stores. The two main product groups with the highest impact on consumers’ satisfaction during COVID-19 are “backbox” products (i.e., bakery products from pick-up boxes like bread or rolls) and fruits and vegetables. The products included in these groups mostly represent articles that are not packed separately and have short expiry dates. A feared risk of contracting the virus when buying and consuming this type of product could be an explanation for this result.
Another finding is related to organic products: while they represented the seventh-largest product group responsible for negative reviews before COVID-19, their impact on negative reviews completely vanished during the epidemic. An explanation for this development could be that other issues, such as the mentioned backbox, fruit and vegetables, drugstore products, and other store-layout-related factors, increased in relevance. This could have led to a comparably lower relevance of organic products in terms of their impact on consumer satisfaction. In this context, previous research found that shoppers in high-income countries appear to be buying more organic products than before the pandemic [
53]. Our study could neither confirm nor reject this statement. However, [
53] argues that the increased purchasing of organic products may be because consumers’ needs for safe and nutritious foods in pandemic times are higher than in normal times. This fear of products perceived as unsafe is also partially reflected in our results, which show that, e.g., unpacked products are much more involved in negative reviews than before COVID-19. In line with this, [
54] also found that food safety concerns have become more important in pandemic times. In the same context, [
55] suggest an increased relevance of staple foods and explain it by an increased amount of home cooking. They also state that—despite higher prices and concerns about future incomes—a significant proportion of consumers have shifted to buying healthier, more sustainable food in pandemic times. This explanation could also be applied to our study’s results: due to higher prices of organic products they have a higher probability of receiving negative evaluations in normal times, however, these price-related issues were found to be less important in pandemic times in the context of healthy and sustainable nutrition [
55]. This argument could explain the fact that organic products completely vanished from evaluations related to negative consumer reviews in the pandemic period.
The study [
6] conducted an empirical analysis to investigate where stockpiling of food products is likely to occur due to COVD-19. The result shows that food hoarding occurred more in online channels for Chinese consumers. While our study focused only on physical grocery retailing, our results show that hoarding also occurred in physical stores since product availability respectively unavailability is among the main factors that affect consumer satisfaction. Similarly, [
56] indicates that consumers’ impulsive and obsessive buying behaviors during COVID-19 were increased due to limited quantity scarcity (LQS) and limited time scarcity (LTS). The same was found by [
57] for the Indian retail context. The text-mining based results of our study confirm these findings. Our results also show that availability (i.e., LQS) played an important role in negative satisfaction ratings. The availability of drugstore products was found to be a particularly big issue for consumers. In this context, [
58] also stated an increased perceived relevance and importance of hand sanitization products from consumers’ point of view.
A study on the impact of COVID-19 on food consumption behavior in Qatar [
7] showed that many consumers preferred online grocery purchase during COVID-19. Hence, physical aspects and a lack of distance from other potentially infected people seemed to be an issue of worry. This is also shown in the results of our study, where the physical layout of stores and the waiting time are among the major concerns for consumers. Results indicate that consumers seem to prefer not spending a long time waiting or shopping in physical stores considering the risk of infections. Such consumers would easily switch to online grocery shopping if such options would be available to them as well. However, online grocery shopping in Austria is comparably low and we could not specifically analyze the likelihood and amount of grocery retail sales and consumers switching to online channels.
In comparison to the previous research, the biggest difference to our paper is the method of data collection and analysis as well as the number of consumer reviews considered: an online survey was applied and 200 consumer reviews were analyzed in [
57], [
50] used an experiment-setting and included 220 participants, [
52] conducted a national survey with 2500 participants, [
8] used self-administrated questionnaires from 344 participants, and [
7] applied an online survey including 579 participants. Hence, the study conducted in the course of our paper is both novel in terms of the data collection and analysis method applied and in terms of the larger volume of consumer reviews (over 533,000) and additional textual comments (over 153,000) analyzed.
7. Conclusions and Limitations
The objective of this study was to understand the impact of COVID-19 on grocery retailers from the viewpoint of the consumers. To achieve this, we applied an acknowledged consumer satisfaction data acquisition technique and analyzed the sentiments of consumers using a service-quality assessment model. First, we identified the changes in consumer satisfaction before and during the first wave of the epidemic period. Then, using text-mining, we identified the major service quality factors and product types that affected consumers the most during the pandemic.
Our results show that before the epidemic period, consumers expressed positive sentiments across all the major supermarket retailers in Austria, however, during the epidemic, overall negative sentiment was expressed by the consumers. Furthermore, we identified the main factors that shaped consumer sentiment during this period: they include the layout of the stores and spaces available for consumers, facilities, and equipment available for shopping, announcement, product availability (and unavailability), and waiting time, as well as the overall time spent during the shopping experience. Other factors that are also important to the consumers include means of payment, personal interaction with store employees, and problem-solving and product price.
The practical implications of our study can be summarized as follows: demand planning in the course of retail SCM can benefit from our results by better understanding which products are more relevant in pandemic times than in normal times. Our findings also support product management by showing that unpacked products like fruits and vegetables or bakery products and drugstore products were perceived as more critical during COVID-19 than before. Considering the specific factors that had the greatest effect on consumer sentiment before and during COVID-19, store planning and store management could benefit from the results in terms of adapting store layout or employee–customer interaction in possible future pandemic situations. Compared to previous research, our results comprise a set of over 533,000 consumer reviews and over 153,000 textual evaluation comments. Hence, the basis of our research is much broader than that of other research in the context of consumer satisfaction during COVID-19. Practitioners from Austrian grocery retail could benefit from these comprehensive results in the course of future research cooperation, where we could provide non-anonymized results and more detailed text-mining-based analysis on the level of the specific retail chain. Additionally, from a practical point of view, our results could be compared with future data (i.e., after the end of the COVID-19 pandemic), to analyze the development and results of retail chains activities in a retrospective way and over a longer period of time than the first pandemic wave in Austria.
From a theoretical point of view, our paper enriches academia by providing the first Big Data-based consumer satisfaction analysis results in times of COVID-19. The benefits of OCR- and UCG-based Big Data analysis have been discussed in the introduction section of our paper. In conclusion, our basis of reviews and evaluation comments analyzed is much more comprehensive. The same applies to our methodological approach, which differs from the method of data collection and analysis applied in previous research in consumer satisfaction in COVID-19, which was mainly done in the form of questionnaire surveys. The developed methodological approach of our paper could be taken as a basis and could be applied to other countries than Austria or other settings than grocery retail. Hence, from a scientific point of view, our results provide a solid basis for a variety of future research settings. Possible future work resulting from the study could also focus on further exploring the problem of product unavailability during disruption and on proposing possible solutions that will mitigate these types of problems in the future. Furthermore, future work could apply the adapted data acquisition technique to additional data sources other than Google reviews.
The main limitation of this study is the risk of generalization. Our study only focused on the five major grocery retailers in Austria. The consumer experience of the retailers may not be the same for consumers of smaller retail providers or retailers in other countries. Our study only focused on consumer sentiment data available via Google reviews. Several additional social media sources exist for gathering consumer sentiment data. Therefore, although relatively large in number compared to traditional consumer satisfaction studies, the data available from the selected review website may not generally and completely describe the behavior of all grocery retail consumers in Austria.
In conclusion, our study applied the novel methodological approach of using Big Data to the urgent problem of analyzing consumer satisfaction in physical grocery retail in pandemic times. The results show a clear reduction in consumer satisfaction and provide details on the specific dimensions and product types that influence consumers’ perception the most during COVID-19.


