
Fail to Yield? An Analysis of Ambulance Crashes in Taiwan


1
Department of Civil Engineering, College of Science and Technology, National Chi Nan University, Nantou 545301, Taiwan
2
Department of Physical Therapy, Asia University, Taichung 413305, Taiwan
3
Department of Physical Medicine and Rehabilitation, Cheng-Ching Hospital, Taichung 407211, Taiwan
*
Author to whom correspondence should be addressed.
Sustainability 2021, 13(3), 1566; https://0-doi-org.brum.beds.ac.uk/10.3390/su13031566
Submission received: 9 January 2021
/
Revised: 26 January 2021
/
Accepted: 29 January 2021
/
Published: 2 February 2021
(This article belongs to the Collection Accident Prevention and Risk Management for Safe and Sustainable Transportation)
Abstract
:Introduction—Medical emergency vehicles help patients get to the hospital quickly. However, there were more and more ambulance crashes on the road in Taiwan during the last decade. This study investigated the characteristics of medical emergency vehicle crashes in Taiwan from January 2003 to December 2016. Methods—The ordered logit (OL) model, multinominal logit (MNL) model, and partial proportional odds (PPO) model were applied to investigate the relationship between the severity of ambulance crash injuries and its risk factors. Results—We found the various factors have different effects on the overall severity of ambulance crashes, such as ambulance drivers’ characteristics and road and weather conditions. When another car was involved in ambulance crashes, there was a disproportionate effect on the different overall severity, as found by the PPO model. Conclusions—The results showed that male ambulance drivers and car drivers who failed to yield to an ambulance had a higher risk of severe injury from ambulance crashes. Ambulance crashes are an emerging issue and need further policies and public education regarding Taiwan’s ambulance transportation safety.
1. Introduction
Ambulances are a key component of an emergency medical service and previous studies have been greatly focused on their response times [1,2]. However, as well as other emergency vehicles, they are in risk situations if the other non-emergency vehicle drivers fail to yield right of way, especially at intersections [3,4]. Even though the number of ambulances has not increased in Taiwan, the official ambulance journeys nearly doubled over ten years. The statistics of Taiwan’s National Fire Agency show that the official ambulance journeys increased from 614,656 times per year in 2004 to 1,078,727 in 2014, as shown in Figure 1 and Figure 2. It is definitely an emerging issue in most densely populated developing countries, such as Taiwan.
Due to the inherent risks of driving/riding in an ambulance, poor ambulance safety standards and design, and increased provider vulnerability to injury while delivering critical patient care in the back of a moving ambulance, emergency medical service personnel have a high incidence of transportation-related fatalities [5,6]. Younger ambulance drivers, compared to older drivers, have a higher risk for crashes, as noted in a previous study [7], and most ambulance crash fatalities occur among those traveling in the rear compartment, where the patient may not be securely fixed to the chassis and where other occupants are less likely to be wearing seatbelts. The Fatality Analysis Reporting System (FARS) data of the United States Department of Transportation further revealed that many emergency vehicle operators had poor driving histories [8]. There are other crash characteristics that are worthy of the public’s attention. For example, there may be increased crash frequency when ambulances are in the use of lights and sirens [9,10]. More emergency vehicle crashes occurred when driving straight through intersections with traffic signals, especially at night [10].
For the crash severity modeling, Savolainen [11] and Mannering [12] gave us comprehensive reviews of these methodologies. The ordered logit/probit (OL) models, generalized ordered response models, multinomial logit (MNL) model, mixed logit models, and heteroscedastic models were commonly used for analyzing crash severity [13,14]. OL models are used when there are three or more categories of the dependent variable and the order of these categories are important. In contrast, the MNL model does not account for the order of the categories. Furthermore, in the partial proportional odds (PPO) model, the proportional odds assumption was relaxed. These three models were applied to analyze the vehicular and pedestrian crash injury severities [13,14,15]. Mooradian et al. [13] suggested that the PPO models performed exceptionally well for those data with sample sizes of less than 20,000 crashes. The aim of our study was to also analyze the Taiwan ambulance crash data with a relatively small sample size.
Due to the lack of previous Taiwan ambulance crash evidence, this study focused on the relationships between ambulance crash severity and the potential risk factors belonging to two levels: the ambulance driver and the environmental level. The remainder of this paper is structured as follows: Section 2 describes the model methodology and data; Section 3 introduces the results and estimations given by the proposed model; finally, Section 4 gives our discussions and conclusions.
2. Methods and Data
2.1. OL Regression Model, MNL Regression Model, and PPO Model
Frequently used in injury analyses, ordinal regression refers to the case where the dependent variable is categorical. One of the common ordinal regression models is the proportional odds model. Even though the dependent variable is continuous, it is recorded ordinally (as might, for instance, happen if income were asked about in terms of ranges, rather than precise numbers).
In the ordinal logistic model with the proportional odds assumption, the model included different intercept estimates (where j is the number of levels of the dependent variable). However, only one estimate of the parameters is associated with the independent variables. If the dependent variable is not ordered, this assumption will be violated (i.e., because we could reorder the levels of the dependent variables arbitrarily) [16]. The MNL model generates j − 1 sets of parameter estimates by comparing different levels of the dependent variable to a base level (the mild severity level in this study). This makes the model considerably more complex, but also much more flexible [17,18].
Since one of the properties inherited in this model is its assumption of the independence of irrelevant alternatives (IIA), a Hausman test is therefore applied to justify the use of the MNL regression model [19].
OL regression models meet the proportional odds assumption between different level categories. The assumption underlying OL regression is that the relationship between each pair of outcome groups is the same. In other words, an OL regression assumes that the coefficients that describe the relationship between, say, the lowest versus all higher categories of the response variable are the same as those that describe the relationship between the next lowest category and all higher categories, etc. This is called the proportional odds assumption or the parallel regression assumption. Because the relationship between all pairs of groups is the same, there is only one set of coefficients (only one model). If this was not the case, we would need different models to describe the relationship between each pair of outcome groups (Brant test can be used to test the proportional odds assumption) [20,21]. On the other hand, MNL models completely ignore the sequential order of dependent variables. The PPO model is an intermediate method since OL and MNL regression models both have their limitations regarding data estimations. The PPO model admits some individual independent variables to affect each level of the dependent variable differently, while other independent variables adhere to the proportional odds assumption.
There were three injury severity levels in this study and we had two panels of results using the PPO model. The first panel recorded the dependent variable as mild crashes vs. others. The second panel had the dependent variable as mild and moderate crashes vs. others. This study used Stata with the gologit2 program to fit the PPO model (please refer to StataCorp. 2011. Stata Statistical Software: Release 12. College Station, TX: StataCorp LP). The coefficients of the intermediate categories were interpreted with caution because the sign of the coefficient does not always determine the direction of the intermediate outcome [22,23]. Since the marginal effect revealed how the change of the independent variables influenced the dependent variables, the marginal effects of the dummy predictors in this study were computed by taking the difference rather than the derivative as continuous variables [14].
2.2. Comparison of the Three Presented Models
The models estimated in this study were compared based on the model fit, where the model fit was assessed using pseudo R2, Akaike’s information criterion (AIC), and the Bayesian information criterion (BIC). The AIC and BIC are two measures that better assess model selection uncertainty. More predictors will improve the likelihood value of the model, but this may result in overfitting of the models [24]. On the contrary, using AIC and BIC for a model comparison considers the goodness of fit and complexity of the model simultaneously. The difference between BIC and AIC is that the penalty term for the number of parameters is larger in BIC than in AIC. We expect smaller values of AIC and BIC since both indicate a better fitting model when using the Stata 12.0 statistical software.
2.3. Data
2.3.1. Data Source
The Taiwan National Police Agency maintains the national road injury data bank. Local police were called after serious road traffic injuries and completed the report forms, which included three files: injury file, vehicle/victim file, and contributory factor. The crashes with property damage only were not included in our analysis since these reports are deposited by local police agencies and not acquired by the National Police Agency, Taiwan.
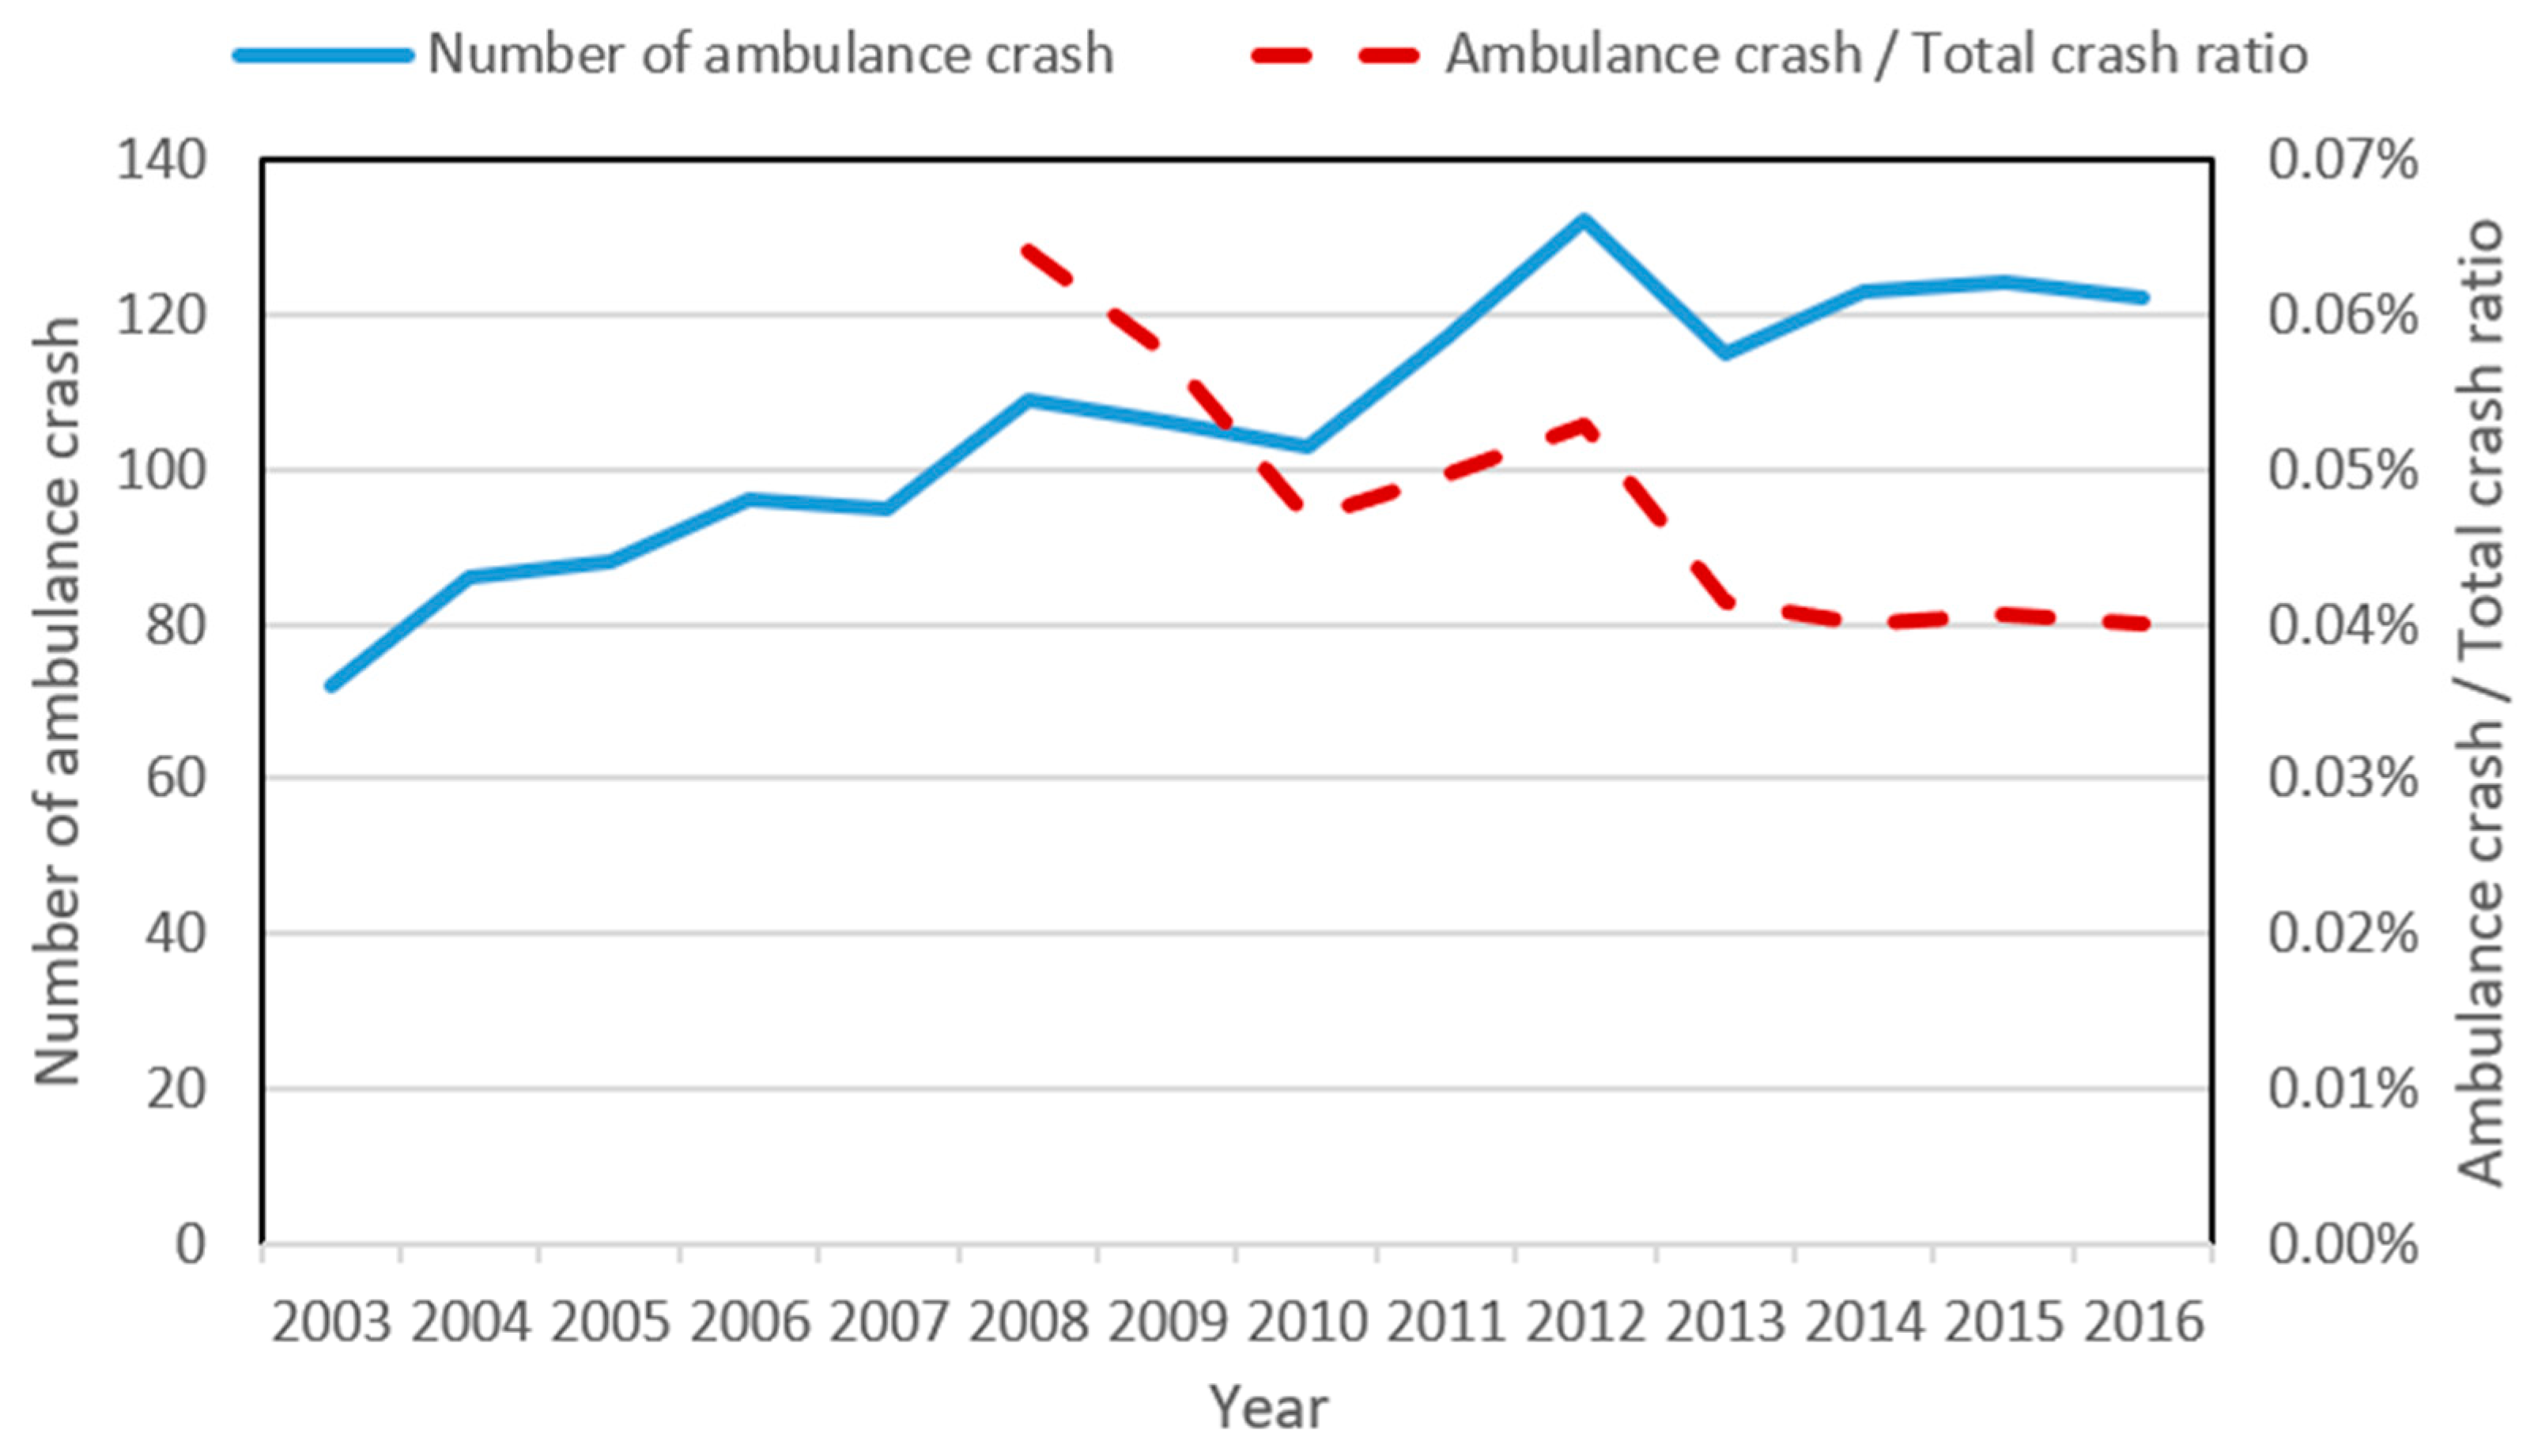
To investigate the relationship of victims and environments in serious ambulance crashes, only crashes involving fatalities or injuries were extracted from this data bank. We used monthly data from January 2003 to December 2016. Figure 3 showed a roughly increasing trend of ambulance crashes annually. The downhill slope of the ratio between ambulance crashes and total crashes annually became irrelevant.
2.3.2. Statistical Analysis
Table 1 presents the definitions of the variables in our model. In the data, only injuries and fatalities were included, which means crashes with property damage only were excluded. The potential risk factors were grouped into two sets: ambulance driver level and environmental level. For example, if there was car driver involved in the ambulance crash, the car involvement variable was coded “yes.” The total injury severity was defined as mild: one injured, moderate: two injured, severe: three to eight injured and a fatality.
There were 1488 observations in total, including 1045 injuries in the mild category, 258 in the moderate category, and 185 in the severe category. As indicated in Section 1, the ambulance driver’s age, gender, his/her injury type, and drinking may affect the crash severity. In our data bank, 1488 ambulance drivers were aged between 16 to 76, mostly male (97%), with 240 injured with 1 dead. Eighty-six (5.8%) ambulance drivers suffered from multiple trauma, while 58 (3.9%) ambulance drivers had a head injury and 39 (2.6%) ambulance drivers had a hand injury. Seventeen (1.1%) ambulance drivers failed to pass a sobriety test.
At the environmental level, 145 (9.7%) ambulance injuries happened on rainy days. The lighting condition distributions were as follows: 993 (66.7%) in the daylight, 434 (29.2%) in the dark but lighted, 37 (2.5%) in the dawn, and 24 (1.6%) in the dark. The traffic controls nearby the injuries were 857 traffic lights, 212 pedestrian lights, 77 flashing yellow lights, and 342 without traffic lights. The statistics showed that many more injuries happened on the urban road than those not on the urban road (976 vs. 512), and many more happened in the intersections than those that were not in the intersections (1225 vs. 263). The ambulance crashes occurred less in sideswipe condition than in non-sideswipe injuries (447 vs. 1041). There were fewer ambulance injuries involving cars than motorcycles (475 vs. 898) and they happened less in rush hour (526 vs. 962). The further different percentages and numbers in different severity categories are thoroughly listed in Table 1.
Since the injured severity levels were divided into three groups, we calculated the odds ratios and compared the mild group with the combined moderate and severe group first. Then, we compared the combined mild and moderate group with the severe group. The odds ratios are in Table 2.
There were some variables worth noting. For example, the odds ratio of injured ambulance driver was 0.09 for the mild group, and 12.07 for the severe group. It seems that the higher the total injury severity, the higher the probability of the injured ambulance driver. In contrast, the odds ratio of a sideswipe was 1.03 for the mild group, and 0.9 for the severe group. The differences were not significant. After this preliminary analysis, we dropped some variables and continued further model analyses.
3. Results
3.1. OL Regression Model
As shown in Table 3, it was found that a male driver, an injured ambulance driver, sunny weather, dark but lighted conditions, in the intersection, and a car’s involvement were significant factors that induced worse total injury severity. At the same time, an urban road was negatively correlated with the ambulance injury severity. Insignificant variables were dropped during the model estimations. The ambulance drivers, usually violating the traffic rule for the sake of time constraints [25], determined the severity of the injury the most. It appeared that male drivers or injured ambulance drivers were involved more in crashes with the worse injuries.
The siren effect, warning other road users of the presence of an ambulance, was decreased in the dark-but-lighted situation and may lead to increased injury [9,10]. Furthermore, brightness and diminished contrast occurred in sunny weather and the drivers usually drove faster. The crashes occurred more in the intersections since these victims usually did not slow down at the crossing. At the same time, a car’s involvement increased the crash severity in the OL model.
Interestingly there was a decreased ambulance crash severity on urban roads. Maybe this was because on an urban road, the traffic volume is higher and the speed limit is lower. The previous study also revealed that the general motor vehicle injury fatality rate was much higher in rural areas [26]. These variables in the environment level did play important roles in Taiwan ambulance crashes.
We used the Brant test in the Stata statistical software to evaluate the parallel regression assumption [14]. The χ2 was 7.36 and the null hypothesis was not rejected due to an insignificant difference in the coefficients between these ambulance crash models (see Table A1 in Appendix A). By the way, a car’s involvement was the only predictor violating the parallel regression assumption.
3.2. MNL Regression Model
The Hausman test was used to evaluate the possibility of violating the property of the IIA. The result was strong evidence that we could not reject the null hypothesis. Then, we continued to use the MNL regression model for observing further estimation results.
In the MNL model, we found that nearly all the variables, including male, injured ambulance driver, sunny weather, in the dark but lighted, in the intersection, and a car’s involvement, caused an increased overall crash severity in all panels in Table 4. The only exception was the insignificant effect of a male ambulance driver on the moderate severity panel. On the other hand, ambulance crashes on urban roads led to milder overall ambulance crash severity in both panels and did play a key role in Taiwan’s ambulance crashes.
3.3. PPO Model
The estimated results of the PPO model are in Table 5. A male ambulance driver, an injured ambulance driver, sunny weather, dark-but-lighted condition, an urban road, and an intersection were the variables that adhered to the proportional odds assumption and had the same coefficient across the two panels. Among them, ambulance crash injuries on urban roads had a significantly negative coefficient and led to a lower overall crash severity. Only a car’s involvement violated the proportional odds assumption, increasing the crash severity in the first and second panels.
Ambulance drivers suffer during crashes. Previous studies had little focus on the behavior of male ambulance drivers [27]. However, male traffic offenders are more likely to be involved in fatal/serious injuries [28]. The possibility of an injured ambulance driver increased, as well as the overall crash severity. This probably suggests that when an ambulance hits other motor vehicles or other objects, the ambulance driver was usually fine since the ambulance is relatively safer and heavier. However, when the ambulance driver was hurt in the injury, the collision involved more people and was more likely to be life-threatening.
In previous studies, the light condition was essential for determining driving safety. In comparison with the dawn and dark, the possibility of a higher overall crash severity was increased in sunny weather in our study. Meanwhile, the ambulance crashes became worse in the dark-but-lighted condition. Vehicle drivers, as well as pedestrians, may overlook the approaching of an ambulance since the contrast effect of the lights is diminished in that situation [10,29].
In intersections, there were markedly more severe and fatal ambulance injuries in Taiwan. Usually, drivers slow down, which prevents major injures in the intersections. In contrast, because traffic conditions determine most ambulance response times [30], the ambulance drivers usually hurry or keep the same speed across traffic and pedestrian lights. Consequently, more severe ambulance crashes happened in the intersections.
When an ambulance hits a car or cars, rather than other types of vehicles and pedestrians, the overall crash severity tended to increase. The effect was more obvious in comparison with mild + moderate vs. severe injuries. Failure to yield, especially to the ambulance, was of great concern regarding the car drivers in Taiwan. Not only on-the-job education of the ambulance drivers but also the public traffic safety propaganda needs to draw more attention and be carried out, especially regarding the car users in Taiwan. As for the transportation policy, the government may consider increasing the fine or other punishments for those who refuse to yield to an ambulance (The fine of failure to yield to the emergency vehicles is 3600 NTD, around 120 USD in December 2017). The right of way of the Taiwan emergency vehicles should be protected more by the laws.
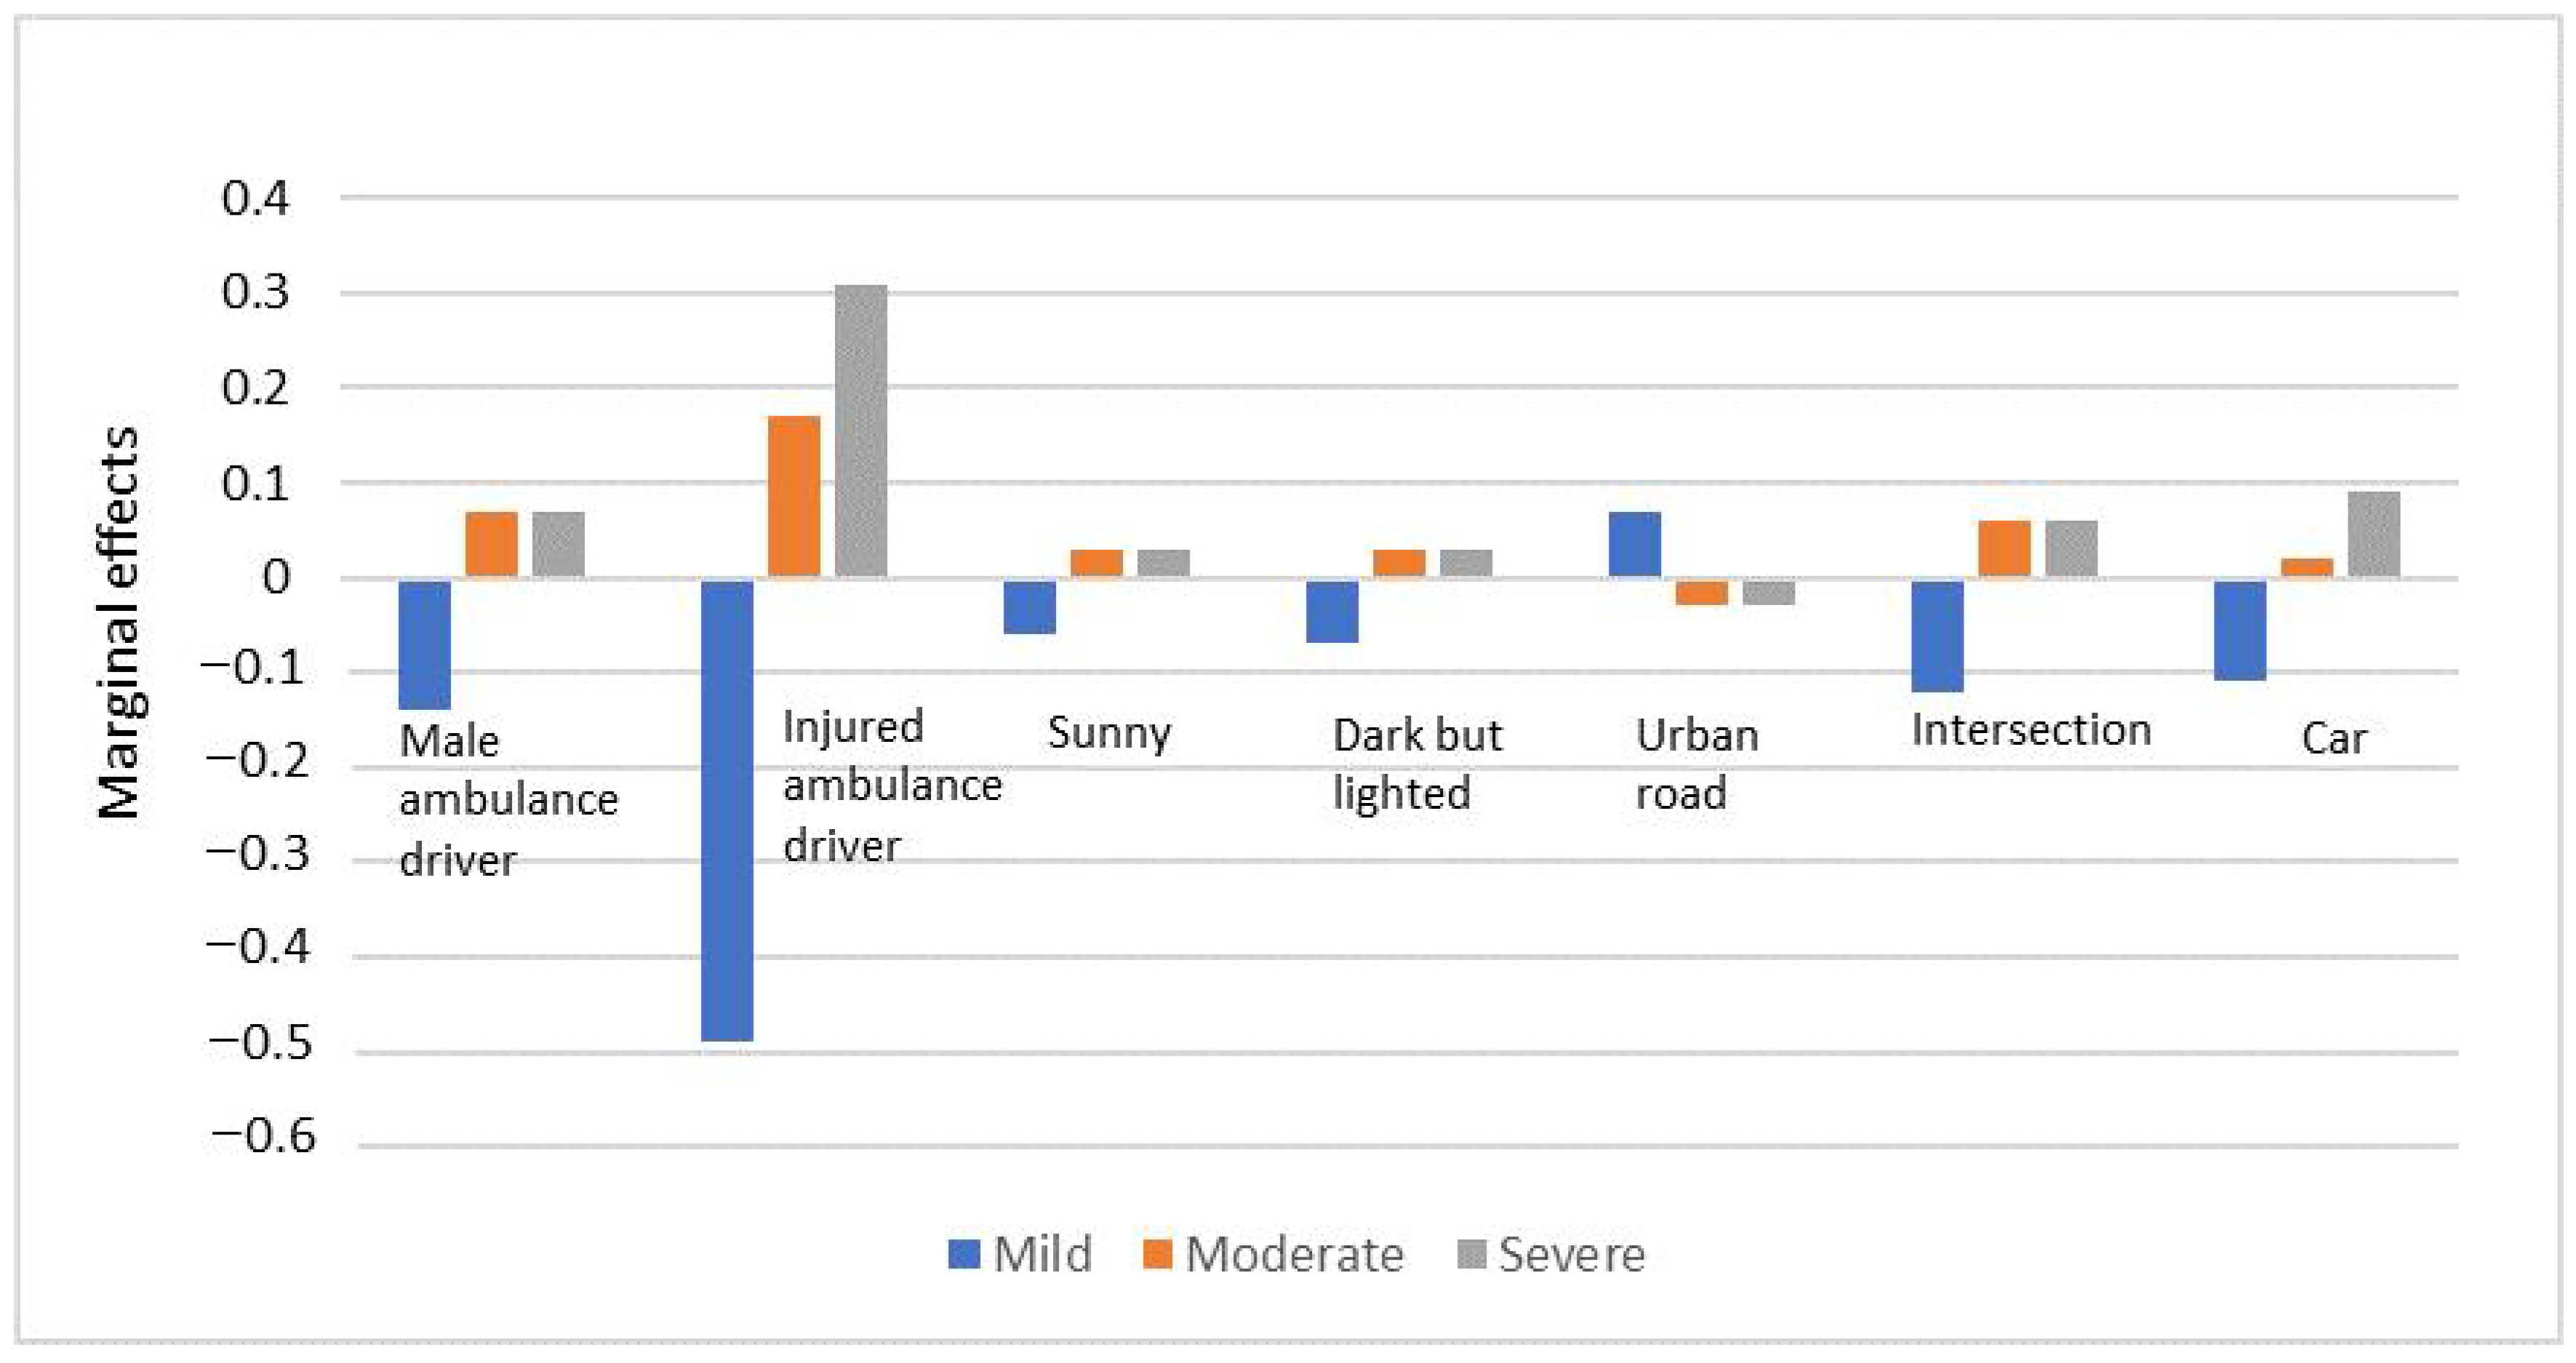
Marginal effects were calculated to examine the rationality of the coefficients. The results are shown in the following Figure 4. For example, a car’s involvement had a positive coefficient in both panels of the PPO models. Its marginal effect was −0.11 for the mild crash severity, 0.02 for the moderate crash severity, and 0.09 for the severe crash severity. By comparing Table 3 and Figure 4, the signs of the variables seemed rational in these models.
3.4. Model Comparison
Regarding the AIC shown in Table 6, the partial proportional odds model performed better than the ordered logit and multinomial models. The AIC of the PPO model was 2054.453 and the BIC was 2107.505. The BIC of the PPO was mildly higher than that of the OL. However, the OL model had the worst pseudo R2 of 0.156 and the PPO model improved it to 0.157. This evidence suggests that the PPO model was somehow more suitable in terms of explaining Taiwan ambulance crashes.
4. Discussion and Conclusions
In this study, we examined the potentially risky factors in ambulance crashes in Taiwan. We used monthly data from January 2003 to December 2016. To investigate whether ambulance crashes were associated with specific victim characteristics and environment factors, investigating different crash probability models in the process. The OL, MNL, and PPO models were chosen since they are widely used for crash analysis. After the analysis of model fitness, the PPO model had better results since it allowed us to assume the proportional odds assumption for some predictors, while not for others.
In both sunny and the dark-but-lighted situations, without an obvious contrast background, both the ambulance driver and the other non-ambulance victims had higher crash risks on roads. It reminds us that even when ambulances use lights and sirens, they are still dangerous across intersections since others pay less attention than in the lane [10,29]. The ambulance drivers, as well as others, should always notice the traffic lights and give way to careless drivers, especially in the intersections.
Failure to yield to an ambulance, especially for car drivers, is an emerging issue in Taiwan. As such, transportation policymakers should consider increasing the fine or other punishments for those who refuse to yield to an ambulance. The right of way of the Taiwan emergency vehicles should be protected much more by the laws.
While previous studies have revealed that flashing amber signals do not increase the number of conflicts in intersections [30], flashing yellow signals in Taiwan had no significant effect on ambulance crashes. Vehicle dynamics in sideswipe collisions are markedly different from other types of collisions [31]. However, no evidence was found in the sideswipe injuries of Taiwan ambulance crashes.
Even though they are under investigation and implementation, new strategies, such as traffic signal control systems and other integrated software applications, may be helpful for transferring patients safely and preventing both emergency and non-emergency vehicles from crashes in the near future.
There are some limitations to this study. First, because Taiwan is a relatively small and highly urbanized country, there was a relatively small number of cases in this study. Second, without the help of emergency medical technicians (EMTs), these data were recorded mostly on the spot by the police, where some information, such as the injured area of the victims, may have been omitted or overlooked. Third, due to the data collection limitation, it is not easy to judge whether the ambulance was on duty or off duty at the time of the ambulance crash. Furthermore, even though the flashing lights and sirens are often used while on duty, it is not recorded in this data bank.
Author Contributions
R.-C.J. started the idea and asked for the specific data from the data bank. M.-C.C. prepared the material and discussed with R.-C.J. for the modelling results and manuscript writing. All authors have read and agreed to the published version of the manuscript.
Funding
This research received no external funding.
Institutional Review Board Statement
Not applicable.
Informed Consent Statement
Not applicable.
Data Availability Statement
Restrictions apply to the availability of these data.
Conflicts of Interest
The authors declare no conflict of interest.
Appendix A

Table A1.
Brant test of the parallel regression assumption in the OL model.
| Variable | χ2 | p |
|---|---|---|
| All | 7.36 | 0.392 |
| Male ambulance driver | 2.12 | 0.145 |
| Injured ambulance driver | 0.00 | 0.944 |
| Sunny weather | 0.31 | 0.581 |
| Dark but lighted | 0.44 | 0.508 |
| Urban road | 0.19 | 0.662 |
| Intersection | 0.42 | 0.519 |
| Car | 4.02 | 0.045 |
References
- Amorim, M.; Ferreira, S.; Couto, A. Road safety and the urban emergency medical service (uEMS): Strategy station location. J. Transp. Health 2017, 6, 60–72. [Google Scholar] [CrossRef]
- Amorim, M.; Ferreira, S.; Couto, A. How do traffic and demand daily changes define urban emergency medical service (uEMS) strategic decisions? A multi-period survival approach. J. Trans. Health 2019, 12, 60–74. [Google Scholar] [CrossRef]
- Kahn, C.A.; Pirrallo, R.G.; Kuhn, E.M. Characteristics of fatal ambulance crashes in the United States: An 11-year retrospective analysis. Prehospital Emerg. Care 2001, 5, 261–269. [Google Scholar] [CrossRef] [PubMed]
- Savolainen, P.T.; Dey, K.C.; Ghosh, I.; Karra, T.L.N.; Lamb, A. Investigation of Emergency Vehicle Crashes in the State of Michigan; Nextrans: Lafayette, IN, USA, 2009. [Google Scholar]
- Sethasathien, A.; Sirisamutr, T.; Wachiradilok, P.; Dairoop, S.; Nimma, S. 529 Ambulance crash in Thailand. Inj. Prev. 2016, 22, A191. [Google Scholar] [CrossRef] [Green Version]
- Slattery, D.E.; Silver, A. The Hazards of Providing Care in Emergency Vehicles: An Opportunity for Reform. Prehospital Emerg. Care 2019, 13, 388–397. [Google Scholar] [CrossRef] [PubMed]
- Studnek, J.R.; Fernandez, A.R. Characteristics of emergency medical technicians involved in ambulance crashes. Prehospital Disaster Med. 2008, 23, 432–437. [Google Scholar] [CrossRef] [PubMed] [Green Version]
- Sanddal, N.D.; Albert, S.; Hansen, J.D.; Kupas, D.F.; Albert, S.M. Contributing factors and issues associated with rural ambulance crashes: Literature review and annotated bibliography. Prehospital Emerg. Care 2008, 12, 257–267. [Google Scholar] [CrossRef] [PubMed]
- Custalow, C.B.; Gravitz, C.S. Emergency medical vehicle collisions and potential for preventive intervention. Prehospital Emerg. Care 2004, 8, 175–184. [Google Scholar] [CrossRef]
- Drucker, C.; Gerberich, S.G.; Manser, M.P.; Alexander, B.H.; Church, T.R.; Ryan, A.D.; Becic, E. Factors associated with civilian drivers involved in crashes with emergency vehicles. Accid. Anal. Prev. 2013, 55, 116–123. [Google Scholar] [CrossRef]
- Savolainen, P.T.; Mannering, F.L.; Lord, D.; Quddus, M.A. The statistical analysis of crash–injury severities: A review and assessment of methodological alternatives. Accid. Anal. Prev. 2011, 43, 1666–1676. [Google Scholar] [CrossRef]
- Mannering, F.L.; Bhat, C.R. Analytic methods in accident research: Methodological frontier and future directions. Anal. Methods Accid. Res. 2014, 1, 1–22. [Google Scholar] [CrossRef]
- Mooradian, J.; Ivan, J.N.; Ravishanker, N.; Hu, S. Analysis of driver and passenger crash injury severity using partial proportional odds models. Accid. Anal. Prev. 2013, 58, 53–58. [Google Scholar] [CrossRef] [PubMed]
- Sasidharan, L.; Menéndez, M. Partial proportional odds model—An alternate choice for analyzing pedestrian crash injury severities. Accid. Anal. Prev. 2014, 72, 330–340. [Google Scholar] [CrossRef] [PubMed]
- Bhat, C.; Born, K.; Sidharthan, R.; Bhat, P. A count data model with endogenous covariates: Formulation and application to roadway crash frequency at intersections. Anal. Methods Accid. Res. 2014, 1, 53–71. [Google Scholar] [CrossRef] [Green Version]
- Wang, X.; Abdel-Aty, M. Analysis of left-turn crash injury severity byconflicting pattern using partial proportional odds models. Accid. Anal. Prev. 2008, 40, 1674–1682. [Google Scholar] [CrossRef]
- Greene, W.H. Econometric Analysis, 5th ed.; Prentice Hall: Englewood Cliffs, NJ, USA, 2003. [Google Scholar]
- Tay, R.; Choi, J.; Kattan, L.; Khan, A. A Multinomial Logit Model of Pedestrian–Vehicle Crash Severity. Int. J. Sustain. Transp. 2011, 5, 233–249. [Google Scholar] [CrossRef]
- Hausman, J.; McFadden, D. Specification tests for the multinomial logit model. Econometrica 1984, 52, 219–1240. [Google Scholar] [CrossRef] [Green Version]
- Agresti, A. An Introduction to Categorical Data Analysis; John Wiley & Sons, Inc.: New York, NY, USA, 1996. [Google Scholar]
- Agresti, A. Categorical Data Analysis, 2nd ed.; John Wiley & Sons, Inc.: Hoboken, NJ, USA, 2002. [Google Scholar]
- Washington, S.P.; Karlaftis, M.G.; Mannering, F.L. Statistical and Econometric Methods for Transportation Data Analysis, 2nd ed.; Taylor & Francis; Chapman and Hall: London, England, 2010. [Google Scholar]
- Wooldridge, J.M. Econometric Analysis of Cross Section and Panel Data; MIT Press: Cambridge, UK, 2010. [Google Scholar]
- Posada, D.; Buckley, T.R. Model Selection and Model Averaging in Phylogenetics: Advantages of Akaike information Criterion and Bayesian Approaches over Likelihood Ratio Tests. Syst. Biol. 2004, 53, 793–808. [Google Scholar] [CrossRef]
- Rehn, M.; Davies, G.; Smith, P.; Lockey, D. Emergency versus standard response: Time efficacy of London’s Air Ambulance rapid response vehicle. Emerg. Med. J. 2017, 34, 806–809. [Google Scholar] [CrossRef]
- Zwerling, C.; Peek-Asa, C.; Whitten, P.S.; Choi, S.-W.; Sprince, N.L.; Jones, M.P.; Zwerling, C.; Peek-Asa, C.; Whitten, P.S.; Choi, S.-W.; et al. Fatal motor vehicle crashes in rural and urban areas: Decomposing rates into contributing factors. Inj. Prev. 2005, 11, 24–28. [Google Scholar] [CrossRef]
- Sundström, A.; Albertsson, P. Self-and peer-assessments of ambulance drivers’ driving performance. IATSS Res. 2012, 36, 40–47. [Google Scholar] [CrossRef] [Green Version]
- Zhang, G.; Yau, K.K.W.; Chen, G. Risk factors associated with traffic violations and accident severity in China. Accid. Anal. Prev. 2013, 59, 18–25. [Google Scholar] [CrossRef] [PubMed]
- Hsieh, P.-J.; Colas, J.T.; Kanwisher, N. Pop-Out without Awareness: Unseen Feature Singletons Capture Attention Only When Top-Down Attention Is Available. Psychol. Sci. 2011, 22, 1220–1226. [Google Scholar] [CrossRef] [PubMed] [Green Version]
- Mahalel, D.; Peled, A.; Livneh, M. Safety evaluation of flashing amber operation at signalized intersections. Accid. Anal. Prev. 1985, 17, 57–65. [Google Scholar] [CrossRef]
- Funk, J.R.; Cormier, J.M.; Bain, C.E. Analytical Model for Investigating Low-Speed Sideswipe Collisions. In Proceedings of the 2004 SAE World Congress, Detroit, MI, USA, 8–11 March 2004. [Google Scholar]
Figure 1.
Annual number of ambulance journeys.

Figure 2.
Number of ambulances.

Figure 3.
The trend of ambulance crashes and the ratio of ambulance crashes to total crashes.

Figure 4.
Marginal effects of the variables.

Table 1.
Statistics of the crash variables.
| Variable | 1 Injured % (n) | 2 Injured % (n) | 3–8 Injured and Fatality % (n) |
|---|---|---|---|
| Severity (total N = 1488) | 70.2 (1045) | 17.3 (258) | 12.4 (185) |
| Ambulance Driver Level | |||
| Age (16–76, ave = 34.5) | |||
| Gender | |||
| Female (n = 44) | 75 (33) | 20.5 (9) | 4.5 (2) |
| Male (n = 1444) | 70.1 (1012) | 17.2 (258) | 12.7 (185) |
| Injured level | |||
| Death (n = 1) | 0 (0) | 0 (0) | 100 (1) |
| Injured (n = 240) | 25.8 (62) | 29.6 (71) | 44.6 (107) |
| Not injured (n = 964) | 79.3 (764) | 14.8 (143) | 5.9 (57) |
| Unknown (n = 283) | 77.4 (219) | 15.5 (44) | 7.1 (20) |
| Injured area | |||
| Multiple (n = 86) | 19.8 (17) | 34.9 (30) | 45.3 (39) |
| Head (n = 58) | 32.8 (19) | 29.3 (17) | 37.9 (22) |
| Hand (n = 39) | 20.5 (8) | 33.3 (13) | 46.2 (18) |
| Drunken | |||
| Yes (n = 17) | 58.8 (10) | 23.5 (4) | 17.6 (3) |
| No (n = 1471) | 70.4 (1035) | 17.3 (254) | 12.4 (182) |
| Environmental Level | |||
| Weather | |||
| Rainy (n = 145) | 75.9 (110) | 12.4 (18) | 11.7 (17) |
| Cloudy (n = 132) | 72.0 (95) | 17.4 (23) | 10.6 (14) |
| Sunny (n = 1211) | 69.4 (840) | 17.9 (217) | 12.7 (154) |
| Lighting condition | |||
| Daylight (n = 993) | 72.8 (723) | 15.8 (157) | 11.4 (113) |
| Dawn (n = 37) | 59.5 (22) | 18.9 (7) | 21.6 (8) |
| Dark but lighted (n = 434) | 65.4 (284) | 20.5 (89) | 14.1 (61) |
| Dark (n = 24) | 66.7 (16) | 20.8 (5) | 12.5 (3) |
| Traffic control | |||
| Traffic lights (n = 857) | 67.0 (574) | 18.0 (154) | 15.1 (129) |
| Pedestrian lights (n = 212) | 74.1 (157) | 15.6 (33) | 10.4 (22) |
| Flashing yellow (n = 77) | 72.7 (56) | 13.0 (10) | 14.3 (11) |
| No lights (n = 342) | 75.4 (258) | 17.8 (61) | 6.7 (23) |
| Urban road | |||
| Yes (n = 976) | 75.2 (734) | 15.6 (152) | 9.2 (90) |
| No (n = 512) | 60.7 (311) | 20.7 (106) | 18.6 (95) |
| Intersection | |||
| Yes (n = 1225) | 68.6 (840) | 17.9 (219) | 13.6 (166) |
| No (n = 263) | 77.9 (205) | 14.8 (39) | 7.2 (19) |
| Sideswipe | |||
| Yes (n = 447) | 70.7 (316) | 17.7 (79) | 11.6 (52) |
| No (n = 1041) | 70.0 (729) | 17.2 (179) | 12.8 (133) |
| Car | |||
| Yes (n = 475) | 53.7 (255) | 21.3 (101) | 25.1 (119) |
| No (n = 1013) | 78.0 (790) | 15.5 (157) | 6.5 (66) |
| Motorcycle | |||
| Yes (n = 898) | 80.2 (720) | 14.5 (130) | 5.3 (48) |
| No (n = 590) | 55.1 (325) | 21.7 (128) | 23.2 (137) |
| Rush hour (6–10 a.m. and 4–8 p.m.) | |||
| Yes (n = 526) | 74.0 (389) | 15.6 (82) | 10.5 (55) |
| No (n = 962) | 68.2 (656) | 18.3 (176) | 13.5 (130) |
Table 2.
The odds ratios of the variables.
| Variables | Odds Ratio | |
|---|---|---|
| Mild/(Moderate + Severe) | Severe/(Mild + Moderate) | |
| Male ambulance driver | 0.78 | 3.05 |
| Injured ambulance driver | 0.09 ** | 12.07 ** |
| Multiple injured areas | 0.09 ** | 7.14 ** |
| Head injury | 0.19 ** | 4.75 ** |
| Hand injury | 0.10 ** | 6.58 ** |
| Drunken | 0.60 | 1.52 |
| Rainy weather | 1.17 | 1.07 |
| Sunny weather | 0.86 | 1.11 |
| Dawn | 0.61 | 1.99 |
| Dark but lighted | 0.73 ** | 1.23 |
| Dark | 0.85 | 1.01 |
| Traffic lights | 0.69 * | 1.82 ** |
| Pedestrian lights | 1.25 | 0.79 |
| Flashing yellow | 1.14 | 1.18 |
| Urban road | 1.96 ** | 0.45 ** |
| Intersection | 0.62 ** | 2.01 ** |
| Sideswipe | 1.03 | 0.90 |
| Car | 0.33 ** | 4.80 ** |
| Motorcycle | 3.30 ** | 0.19 ** |
| Rush hour | 1.32 * | 0.75 |
* p ≤ 0.05, ** p ≤ 0.01.
Table 3.
The results of ordered logit (OL) models.
| Variables | OL Model | |
|---|---|---|
| Coefficient | SE | |
| Male ambulance driver | 1.12 | 0.418 ** |
| Injured ambulance driver | 2.32 | 0.161 ** |
| Sunny | 0.37 | 0.163 * |
| Dark but lighted | 0.39 | 0.132 ** |
| Urban road | −0.40 | 0.128 ** |
| Intersection | 0.80 | 0.181 ** |
| Car | 0.70 | 0.129 ** |
| Cut1 | 3.47 | 0.486 |
| Cut2 | 4.90 | 0.499 |
| Pseudo R2 | 0.156 | |
No. of observations: 1488; log-likelihood at zero: −1207.089, log-likelihood at convergence: −1019.332; Akaike’s information criterion (AIC): 2056.664, Bayesian information criterion (BIC): 2104.411; * p ≤ 0.05, ** p ≤ 0.01.
Table 4.
The results of the multinomial logit (MNL) regression models.
| Variables | Moderate Injury | Severe Injury | ||
|---|---|---|---|---|
| Coefficient | SE | Coefficient | SE | |
| Male ambulance driver | 0.38 | 0.432 | 2.17 | 0.804 ** |
| Injured ambulance driver | 1.79 | 0.209 ** | 2.93 | 0.223 ** |
| Sunny | 0.41 | 0.197 * | 0.50 | 0.250 * |
| Dark but lighted | 0.43 | 0.156 ** | 0.46 | 0.202 * |
| Urban road | −0.35 | 0.153 * | −0.63 | 0.192 ** |
| Intersection | 0.51 | 0.205 * | 1.05 | 0.295 ** |
| Car | 0.37 | 0.157 * | 1.08 | 0.195 ** |
| Constant | −2.80 | 0.517 ** | −6.15 | 0.901 ** |
| Pseudo R2 | 0.158 | |||
No. of observations: 1488; log-likelihood at zero: −1207.089, log-likelihood at convergence: −1016.174; AIC: 2064.347, BIC: 2149.23; * p ≤ 0.05, ** p ≤ 0.01.
Table 5.
The results of the partial proportional odds (PPO) models.
| Variables | Panel I | Panel II | ||
|---|---|---|---|---|
| Coefficient | SE | Coefficient | SE | |
| Male ambulance driver | 1.09 | 0.415 ** | 1.09 | 0.415 ** |
| Injured ambulance driver | 2.30 | 0.161 ** | 2.30 | 0.161 ** |
| Sunny | 0.37 | 0.163 * | 0.37 | 0.163 * |
| Dark but lighted | 0.39 | 0.132 ** | 0.39 | 0.132 ** |
| Urban road | −0.40 | 0.128 ** | −0.40 | 0.128 ** |
| Intersection | 0.79 | 0.181 ** | 0.79 | 0.181 ** |
| Car | 0.62 | 0.135 ** | 0.96 | 0.183 ** |
| Constant | −3.41 | 0.485 ** | −5.00 | 0.500 ** |
| Pseudo R2 | 0.157 | |||
No. of observations: 1488; log-likelihood at zero: −1207.089, log-likelihood at convergence: −1017.227; AIC: 2054.453, BIC: 2107.505; * p ≤ 0.05, ** p ≤ 0.01.
Table 6.
Model comparison.
| Model | AIC | BIC | Pseudo R2 |
|---|---|---|---|
| OL | 2056.664 | 2104.411 | 0.156 |
| MNL | 2064.347 | 2149.23 | 0.158 |
| PPO | 2054.453 | 2107.505 | 0.157 |
Publisher’s Note: MDPI stays neutral with regard to jurisdictional claims in published maps and institutional affiliations. |
© 2021 by the authors. Licensee MDPI, Basel, Switzerland. This article is an open access article distributed under the terms and conditions of the Creative Commons Attribution (CC BY) license (http://creativecommons.org/licenses/by/4.0/).
Share and Cite
MDPI and ACS Style
Jou, R.-C.; Chao, M.-C. Fail to Yield? An Analysis of Ambulance Crashes in Taiwan. Sustainability 2021, 13, 1566. https://0-doi-org.brum.beds.ac.uk/10.3390/su13031566
AMA Style
Jou R-C, Chao M-C. Fail to Yield? An Analysis of Ambulance Crashes in Taiwan. Sustainability. 2021; 13(3):1566. https://0-doi-org.brum.beds.ac.uk/10.3390/su13031566
Chicago/Turabian StyleJou, Rong-Chang, and Ming-Che Chao. 2021. "Fail to Yield? An Analysis of Ambulance Crashes in Taiwan" Sustainability 13, no. 3: 1566. https://0-doi-org.brum.beds.ac.uk/10.3390/su13031566
Note that from the first issue of 2016, this journal uses article numbers instead of page numbers. See further details here.