Article

Trade-Offs and Synergies of Multiple Ecosystem Services for Different Land Use Scenarios in the Yili River Valley, China

1
College of Grass and Environmental Sciences, Xinjiang Agricultural University, Urumqi 830000, China
2
School of Public Administration, China University of Geosciences (Wuhan), Wuhan 430074, China
3
Aerospace Information Research Institute, Chinese Academy of Sciences, Beijing 100094, China
4
College of Resources and Environment, University of Chinese Academy of Sciences, Beijing 100049, China
*
Author to whom correspondence should be addressed.
Sustainability 2021, 13(3), 1577; https://0-doi-org.brum.beds.ac.uk/10.3390/su13031577
Submission received: 28 December 2020 / Revised: 25 January 2021 / Accepted: 27 January 2021 / Published: 2 February 2021

Abstract

:
Environmental managers and policymakers increasingly discuss trade-offs between ecosystem services (ESs). However, few studies have used nonlinear models to provide scenario-specific land-use planning. This study determined the effects of different future land use/land cover (LULC) scenarios on ESs in the Yili River Valley, China, and analyzed the trade-offs and synergistic response characteristics. We simulated land-use changes in the Yili River Valley during 2020–2030 under three different scenarios using a patch-generating land-use simulation (PLUS) model—business as usual (BAU), economic development (ED), and ecological conservation (EC). Subsequently, we evaluated the water yield (WY), carbon storage (CS), soil retention (SR), and nutrient export (NE) ESs by combining the PLUS and integrated valuation of ecosystem services and trade-offs (InVEST) models, thus exploring multiple trade-offs among these four ESs at a regional scale. For the BAU scenario, there are some synergistic effects between WY and SR in the Yili River Valley, in addition to significant trade-off effects between CS and NE. For the ED scenario, the rapid expansion of cropland and constructed land is at the expense of forested grassland, leading to a significant decline in ESs. For the EC scenario, the model predicted that the cumulative regional net future carbon storage, cumulative water retention, and cumulative soil conservation would all increase due to ecological engineering and the revegetation of riparian zones and that formerly steep agricultural land can be effective in improving ESs. Meanwhile, the trade-off effect would be significantly weakened between CS and NE. These results can inform decision makers on specific sites where ecological engineering is implemented. Our findings can enhance stakeholders’ understanding of the interactions between ESs indicators in different scenarios.

1. Introduction

Ecosystem services (ESs) are the direct or indirect contributions of an ecosystem to human welfare [1,2]. Many studies have quantified and investigated the trade-offs of ecosystem resources since ESs were first proposed. With global population growth and rapid societal development, human demands on ecosystems continue to increase [3,4,5,6]. Studies have shown that land use/land cover (LULC) has a critical impact on ESs [7,8]. In recent years, human activities such as cropland expansion and urbanization have led to increased ecosystem sensitivities, decreased carbon sequestration capacities, and aggravated soil erosion [9,10,11]. Future land-use planning should therefore meet the needs of environmental protection policies, and the characteristics of the impacts of changes in land use on ESs are essential for ecological planning and management [12,13].
The interactions between ecosystems should be understood to achieve sound ecological management strategies in China [14,15]. The interactions between ESs are often reflected in trade-offs and synergies [7]. Recent reports have evaluated ESs trade-off analyses under land-use changes. For example, a study of the Miyun Reservoir in Beijing found significant trade-offs between water production, water purification, and nitrogen export [8]. A study of Lake Taihu, China, evaluated the impacts of seven ESs, and a trade-off analysis demonstrated a significant synergistic relationship between carbon storage and soil retention [16]. On the Sanjiang Plain in China, various trade-offs and synergistic responses were found between ESs, with a significant negative relationship between water yields and carbon stocks (trade-off) [17]. Furthermore, ecosystem trade-off analyses help determine the best locations to implement ecological engineering to balance human needs and the benefits to the ecosystem [7]. However, the abovementioned studies had some limitations. They failed to analyze the ESs trade-offs in different future scenarios and only assessed the present ESs trade-offs, failing to provide stakeholders with future ESs dynamics. Therefore, understanding the interactions among ESs is a major area of interest in the field to achieve rational ecological management [18,19,20].
Scenario analysis is currently one of the most established approaches in future ESs trade-off and synergy research [7]. By developing different land-use scenarios to analyze the effects of changes and internal interactions between ESs, recommendations can be made for land-use planning scenarios [15,21]. However, some limitations exist in previous studies. First, many researchers have failed to refer to policy guidelines in their scenarios, which typically leads to various results [22,23]. Second, ecosystem functions provide people with multiple levels of service, and the interconnection of these services has become an important challenge when discerning ecosystem management methods [24,25]. In addition, previous studies have mostly considered current interactions between ESs, but they have not studied multiple interactions between ESs in future scenarios; therefore, they cannot satisfy the needs of stakeholders [26,27]. Third, most of the land-use models used for future LULC scenario planning, including the FLUS, CA-Markov, and CLUE-S models [6,28,29], have deficiencies. These models are insufficient for determining the underlying drivers of land-use changes [30] and are unable to spatiotemporally capture the evolution of multi-land use patches, particularly for the patch evolution of natural land use [31,32]. However, the patch-level land-use simulation (PLUS) model can accurately simulate the non-linear relationships behind LULC using a patch-level land-use simulation model, which allows for a more accurate representation of the effects of LULC on potential ESs under different future policy scenarios [33]. Therefore, under a future scenario of intensifying land succession, research that accurately simulates the potential for future LULC development is required. It can be accurately quantified and evaluated for subsequent ESs and then to analyze the trade-offs and synergistic effects to achieve the optimal development scenarios for ESs under different scenarios [34,35].
To narrow these research gaps, this study focused on the Yili River Valley, which is a relatively intact ecological service area on the northern slopes of the Tianshan Mountains in China and is an important national ecological and environmental protection barrier. In recent years, owing to socio-economic development, the rapid expansion of urban construction land in the Yili River Valley, excessive deforestation, and forest and grassland conversions to agricultural land have led to an overall decline in ESs [36]. As a key junction of China’s overland Silk Road, the ecological quality of the Yili River Valley is directly related to the comprehensive benefits of the Yili River Valley and the ecological security of downstream neighboring Kazakhstan. Studies on ESs under different scenarios of land-use changes in the Yili River Valley should be urgently conducted to address many terrestrial ecosystem problems. Hence, this study analyzed three aspects of particular interest—(1) present a science-policy framework for ESs assessments that is applicable to the Yili River Valley in 2030, (2) quantify the evolution of ESs for different scenarios in the Yili River Valley, and (3) evaluate and analyze the trade-offs and synergy between the interactions of multiple ESs indicators.

2. Materials and Methods
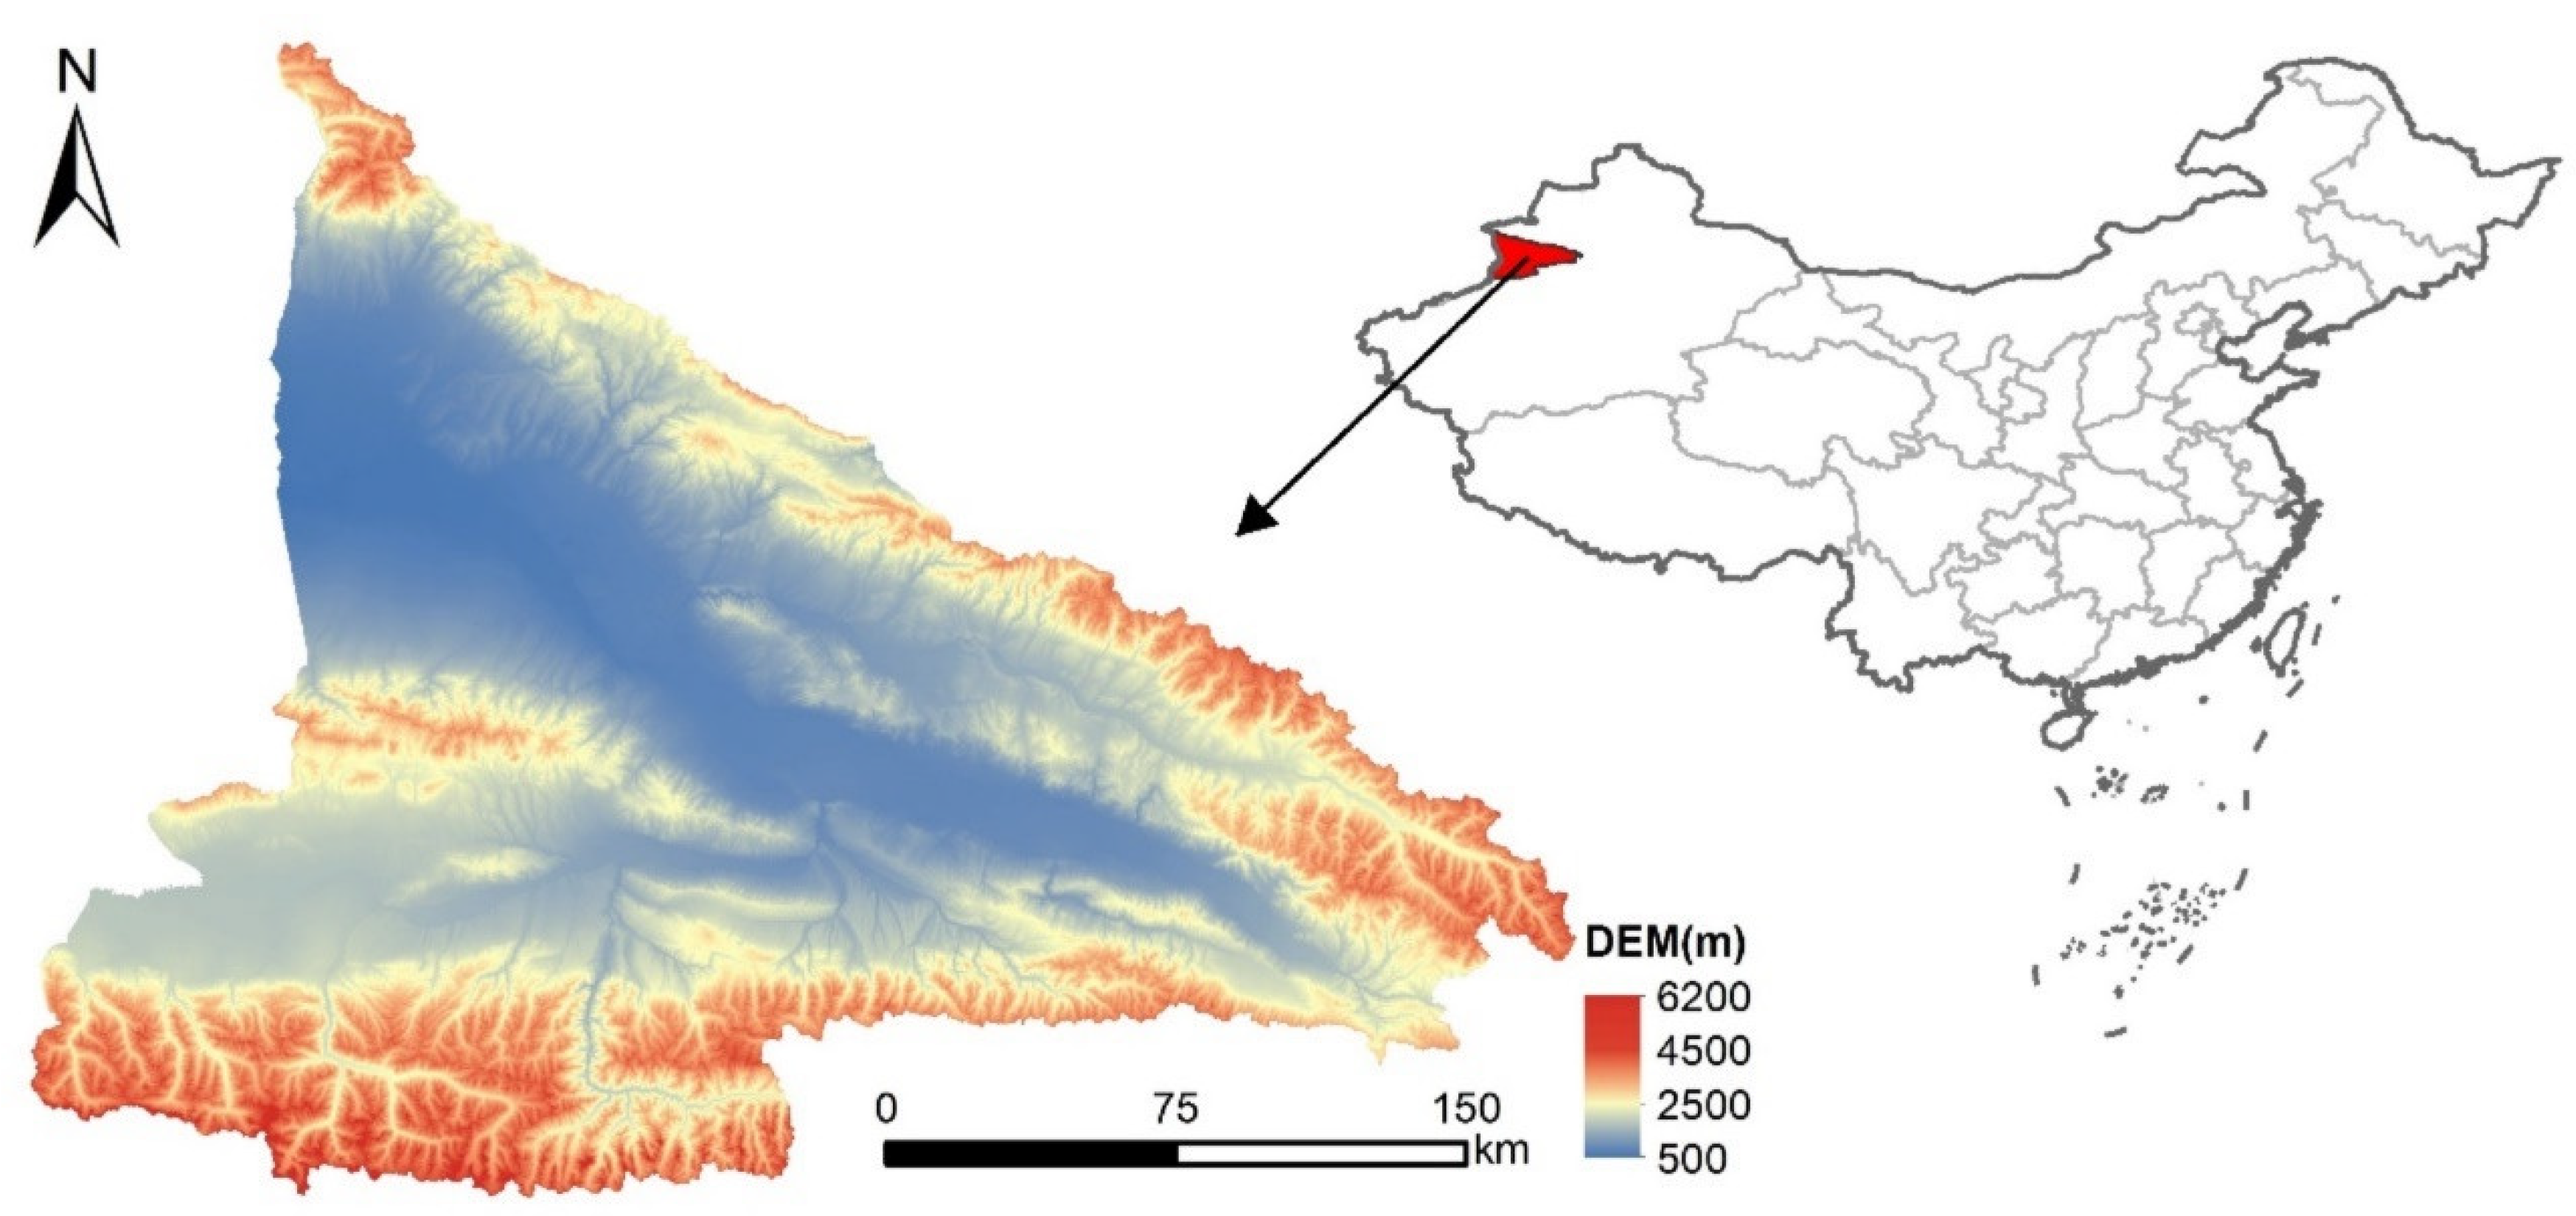
2.1. Study Area

The Yili River Valley (42°15′–44°50′ N, 80°10′–84°56′ E) is located in the western part of the Tianshan Mountains of China (Figure 1). The valley covers an area of approximately 5.53 × 10⁴ km2 and has a temperate climate, with an average annual temperature of 6.68 °C and overall average annual precipitation of 332.69 mm. The mountainous areas of the river valley have an average annual precipitation of 300–900 mm and a temperate continental climate. With a large temperature difference between day and night, the river valley is the wettest region in Xinjiang. The eastern summit of the Yili River Valley is the confluence of the Tekesi and the Gongnaisi rivers, and the western lower edge is toward the border between China and Kazakhstan, providing this region an overall eastern-high and western-low topographic profile. The study region has distinct climatic differences, complex geologic environments, and large elevation gradients, which provide an appreciable representation of the response relationships between terrestrial ESs in complex environments [36].

2.2. Data Sources

The datasets used to simulate different land-use scenarios in 2030 mainly included (1) 30-m resolution LULC data from 2010, 2018, and 2020, which were obtained from the Chinese Academy of Sciences Resource and Environmental Science Data Center (http://www.resdc.cn). Among these data, the 2020 LULC data were updated by visually interpreting the 2018 LULC data using remote sensing images, and the total accuracy of this interpretation reached over 90% by combining field surveys, visual interpretations, and confusion matrix judgments. Croplands, forests, grasslands, water, constructed, and bare lands were classified according to China’s primary land-use classification system [37]; (2) annual mean temperature accumulation data were used to determine the suitability conditions for different land types and were obtained from the CAS Resource and Environmental Science Data Center (http://www.resdc.cn). Average annual precipitation was spatially interpolated to 30-m resolution raster data based on cumulative multi-year averages from weather stations; (3) digital elevation model (DEM), slopes, and groundwater data for the natural environmental factors driving land-use changes were obtained from the Geospatial Data Cloud (http://www.gscloud.cn); (4) socio-economic data that drive land-use changes, mainly containing spatial distributions of the population and gross domestic product (GDP) raster data were obtained from the CAS Resource and Environment Science Data Center (http://www.resdc.cn); and (5) raster data for road networks, river systems, etc. were obtained from the National Catalogue Service for Geographic Information (http://www.webmap.cn). Data with a pixel size of 30 m × 30 m were applied in the Yili River Valley to account for different planning policies in the PLUS model. Due to large amount of data, all layers in the InVEST model were re-sampled to 100 m × 100 m.

2.3. PLUS Model

Previous land-use simulation models are linear, numerically based, and do not include all processes of land-use change [28,38]. In this study, the coupled Markov chain and PLUS models were applied to simulate land-use changes, which improves the ability to predict land use in the future. The Markov chain model is a stochastic progression that measures the need for land use under various conditions by changing the transfer matrix’s likelihood of analyzing the potential LULC over time [39]. The PLUS model uses the land extension analysis strategy (LEAS) and a cellular automata (CA) model based on multi-type random seeds (CARS). Compared to other models, the PLUS model can determine the drivers of land expansion and project landscape dynamics [40,41].
To predict the patch evolution for various land-use type scenarios, a multi-type random patch seeding mechanism based on threshold descent was used in the PLUS model. By applying a Monte Carlo approach, the probability surface ( P i , k 1 ) for each land-use type is determined when the neighborhood’s effect of land use k is 0,
O P i , k 1 , t = { P i , k 1 × ( r × μ k ) × D k t             i f   Ω i , k t = 0   a n d   r < P i , k 1 P i , k 1 × Ω i , k t × D k t                                                                   a l l   o t h e r s
where r is a random value in the range 0–1 and μ k is the threshold value for producing new land-use patches. In order to create new land-use patches, the land-use type k may be used. Seeds can create new forms of land use and expand into a series of new patches. If the new land-use type wins in a round, a declining threshold τ is used to determine the candidate land-use type c chosen by the roulette wheel as follows [33]:
I f   k = 1 N | G c t 1 | k = 1 N | G c t | < S t e p T h e n , d = d + 1
{ C h a n g e                     P i , c 1 > τ   a n d   T M k , c = 1 U n c h a n g e                     P i , c 1 τ   o r   T M k , c = 0             τ = δ d × r
where Step is the step size needed to simulate the land use, δ is the factor of attenuation, r is a stochastic value distributed with a mean of 1, and d is the number of attenuation steps. Furthermore T M k , c is the transformation matrix for deciding when type k is permitted to be transformed to type c for land use. The driving factors of the PLUS model are shown in Table 1. Furthermore, the specific variables of the PLUS model were set as follows: the number of regression tree: 50, sampling rate: 0.01, and mTry: 10. The abovementioned parameter settings were taken obtained from the model manual.

2.4. Land-Use Scenarios Modeling

This research provides three alternate possible possibilities for land-use transition, namely, business as normal (BAU), economic growth (ED), and ecological conservation (EC). The principles and aims of these scenarios were as follows:
(1)
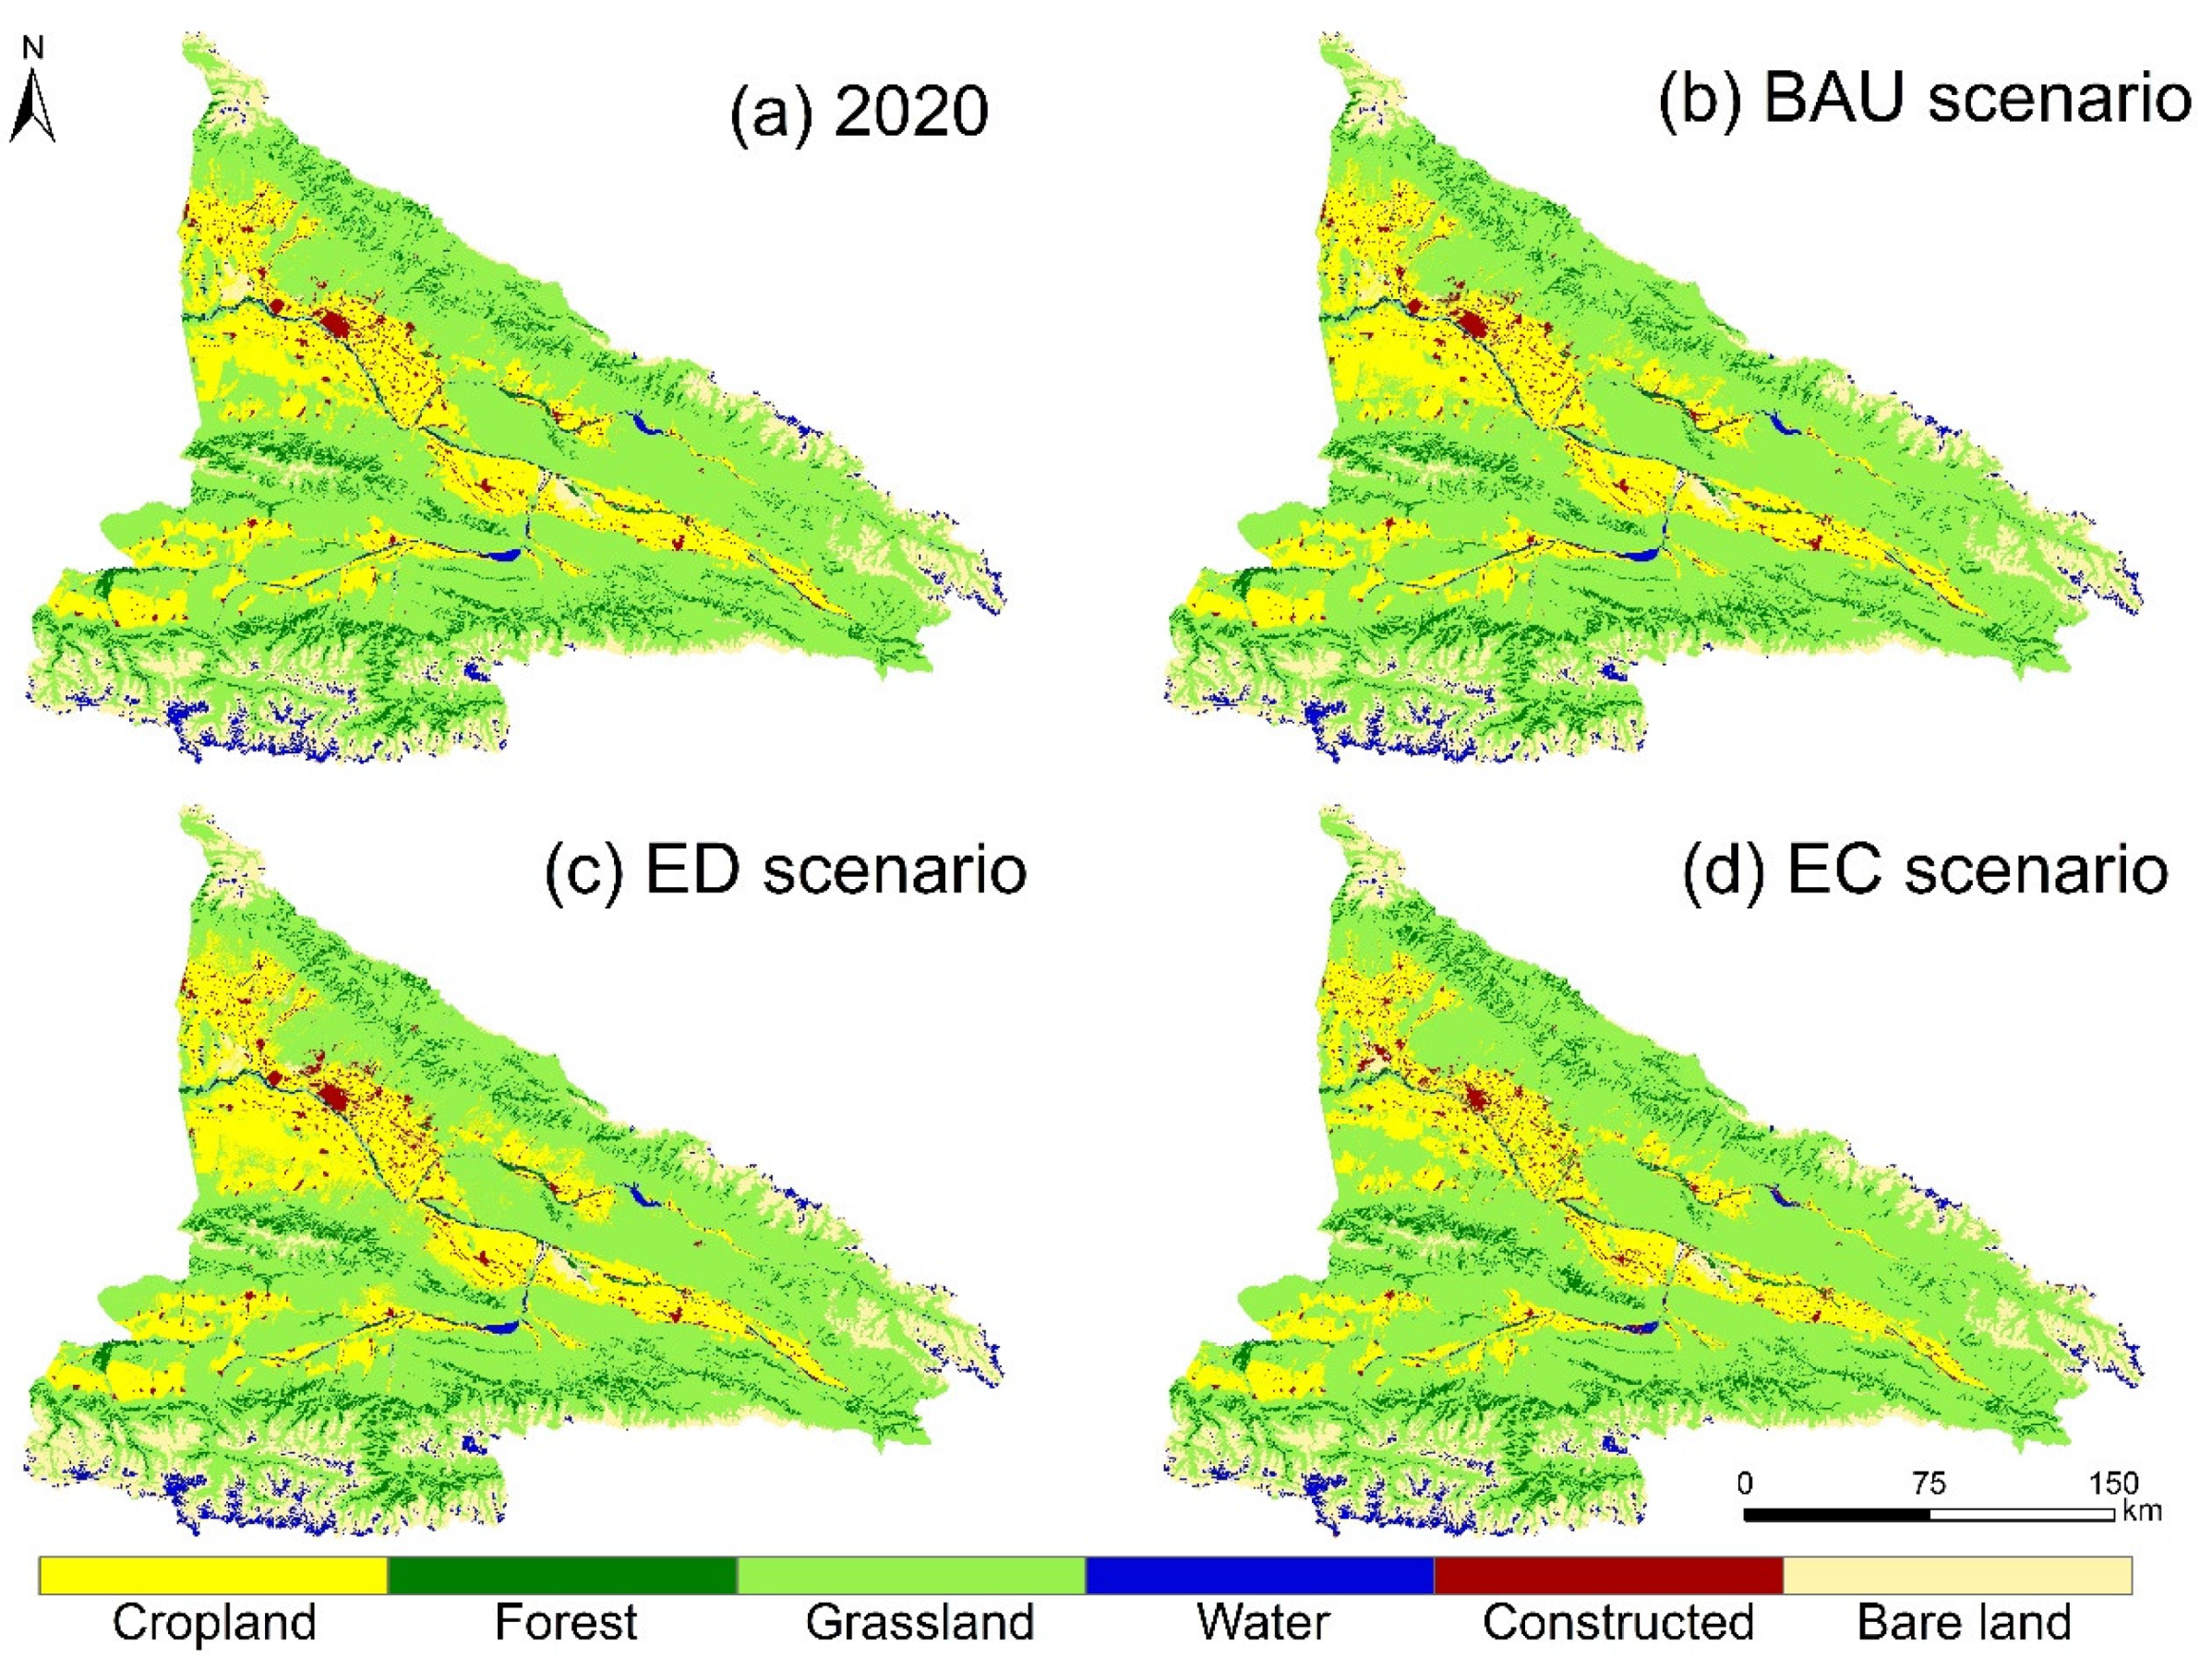
The BAU scenario assumes that past patterns of land-use transition are sustained and that land demand for 2020–2030 is calculated based on the transition probability of shifting the Markov chain model for 2010–2020;
(2)
The ED scenario is based on a policy of rapid development of urban construction land in the Xinjiang Uygur Autonomous Region Land Use Master Plan. A linear regression module of the PLUS model was used to input 2000, 2010, and 2020 land-use datasets to analyze the land-use demands in 2030. The transfer transition matrix analyzed the probability of transferring croplands and construction lands in 2000–2020. This matrix showed that cropland was mainly transformed from grassland, development land, and bare land, while cropland, grassland, and water were mainly converted to construction land. By combining the thresholds set by previous studies with expert opinions, we assumed that the ED scenario increased the conversion rates of grassland, construction land, and bare land to cropland by 50%, and the conversion rates of cropland, grassland, and water to construction land also increased by 50% [6,42];
(3)
The EC scenario is based on the guidelines found in the Three-North Shelter Forest Program (TNSFP) and in the Yili-Tianshan Mountains Western Section Ecological Function Reserve in China [43]. This scenario represents a local governmental policy that strengthens the protection of forests, grasslands, and water sources, strictly controls the growth of cropland and construction land, and encourages the conversion of cropland to forests, grasslands, and lakes. In this scenario, we modified the development potential of the cropland layer, returned all cropland with slopes greater than 15° to forests, and converted a 50 m wide buffer zone near a river to grassland [6,44].

2.5. Ecosystem Services Indicators

One key challenge when assessing ESs is selecting appropriate ESs indicators [45]. We used three parameters in this report to assess the ESs markers for Yili River Valley—(1) indicators in the Common International Classification of Ecosystem Services (CICESs) [46] and the Millennium Ecosystem Assessment [47] classification frameworks; (2) indicators that are closely monitored by local governments, such as those proposed by the Regulations on Ecological and Environmental Protection of the Yili River Valley; and (3) indicators that are closely related to human well-being and are easily quantifiable [45]. According to these abovementioned criteria, the integrated valuation of ecosystem services and trade-offs (InVEST) model was used to quantify the ESs in this study. Compared to other ecological models, the InVEST model can realize ESs digitization and visualization with changing regional land use and has been widely used in many countries and regions [34,48,49]. Based on the Regulations on Ecological and Environmental Protection of the Yili River Valley, four key ESs indicators were selected—water yield (WY), carbon storage (CS), soil retention (SR), and nutrient export (NE) [19,28,34,49].

2.6. Analysis of Trade-Offs and Synergies

The various services of an ecosystem tend to exhibit two kinds of relationships in response to internal and external influences—trade-off and synergistic relationships [2]. A Spearman correlation analysis was applied to identify correlations between the landscape characteristic metrics and the ESs indicators over time (2020–2030 for the different scenarios). A key step in the Spearman correlation analysis is to determine the correlations of non-normally distributed characteristics to statistically analyze the significance and trade-offs of the correlation coefficient (r) [50]. In this study, we generated 2500 random points at the regional scale and extracted ESs (WY, CS, SR, and NE). Landscape characteristic indicators were then aggregated for the correlation analysis to identify synergies and trade-offs between the ecosystem service functions.

2.7. Model Validation

The accuracy of the land-use model simulation has a direct impact on the quantitative ESs of the InVEST model. Therefore, this study used the PLUS model to verify the accuracy of the LULC in the Yili River Valley in 2010 and 2020 based on the changes in LULC landscape patterns and the actual LULC data from 2010 and 2020. The spatial allocation results obtained from the simulations were verified by the overall accuracy and Kappa coefficient, which is often used to assess the agreement between the two data images [51]. The value of the Kappa coefficient was between −1 and +1, where +1 indicates superior performance and a value ≤0 indicates non-performance over the random results [52]. Finally, the optimal parameter set was selected to simulate LULC in 2030 for each of the scenarios.
To ensure the accuracy of the output of the InVEST model, the results were validated by combining the field validation datasets and the findings of previous studies. For the CS and WY models, the parameters entered in the CS model for this study were the actual carbon density data based on soil profiles in the Yili River Valley under different land-use types. For the WY model, the input rainfall data were interpolated from the multi-year average at meteorological stations. The final results were compared with relevant literature [36] and the Water Resources Bulletin for validation. For the SR and NE models, the annual mean values collected at 12 hydrological stations in the Yili River Valley were validated by comparing them with average values obtained from relevant literature [53].

3. Results

3.1. Future Land-Use Plan

We used the PLUS model to simulate LULC spatiotemporal differentiation patterns in the Yili River Valley in 2010 and 2020 and with the actual LULC accuracy verifications. The Kappa coefficient was 0.9102 and the overall accuracy was 0.9481. The Kappa coefficients were 0.9112, 0.8550, 0.96532, 0.9376, 0.9045, and 0.9727 for cropland, forest, grassland, water, constructed, and bare land, respectively. The results indicate that the random-seeds based on the PLUS model can achieve very high simulation precision and a more equivalent landscape pattern [40]. Therefore, the PLUS model can more accurately reflect actual variations in LULC in the Yili River Valley. We then used the PLUS model to select the optimal parameter set and explore the three different 2030 scenarios.
We compared the land dynamic change rates of the BAU, ED, and EC scenarios in 2020 and 2030 (Table 2), and the compositions and landscape differentiation characteristics in each of the different scenarios (Figure 2). The BAU scenario continued the urbanization trend already present in the Yili River Valley (Figure 2a) and the main land-use changes in this scenario included the expansion of cropland and construction land (Figure 2b). Urban construction in the ED scenario expanded at an accelerated rate and urban patches become more compact (Figure 2c). Compared to 2020, the ED scenario intensified cropland and construction land expansions, which increased by 13.39% and 14.24%, respectively (Figure 2d). In the 2030 ED scenario, the Yili River Valley shifted from 13.87% grassland to cropland and construction land, at the expense of forests and grassland, to support the region’s urban and rural construction and economic development needs. In the EC scenario, the forest and grassland areas increased due to the implementation of policies that return land to forests and ecological engineering. The increased forest and grassland areas were mainly concentrated in the riparian buffer zone near the Tekesi and Yili river basins, where 13.04% of the cropland was converted to forests and grassland, increasing the forest and grassland areas by 7.61% and 2.98%, respectively.

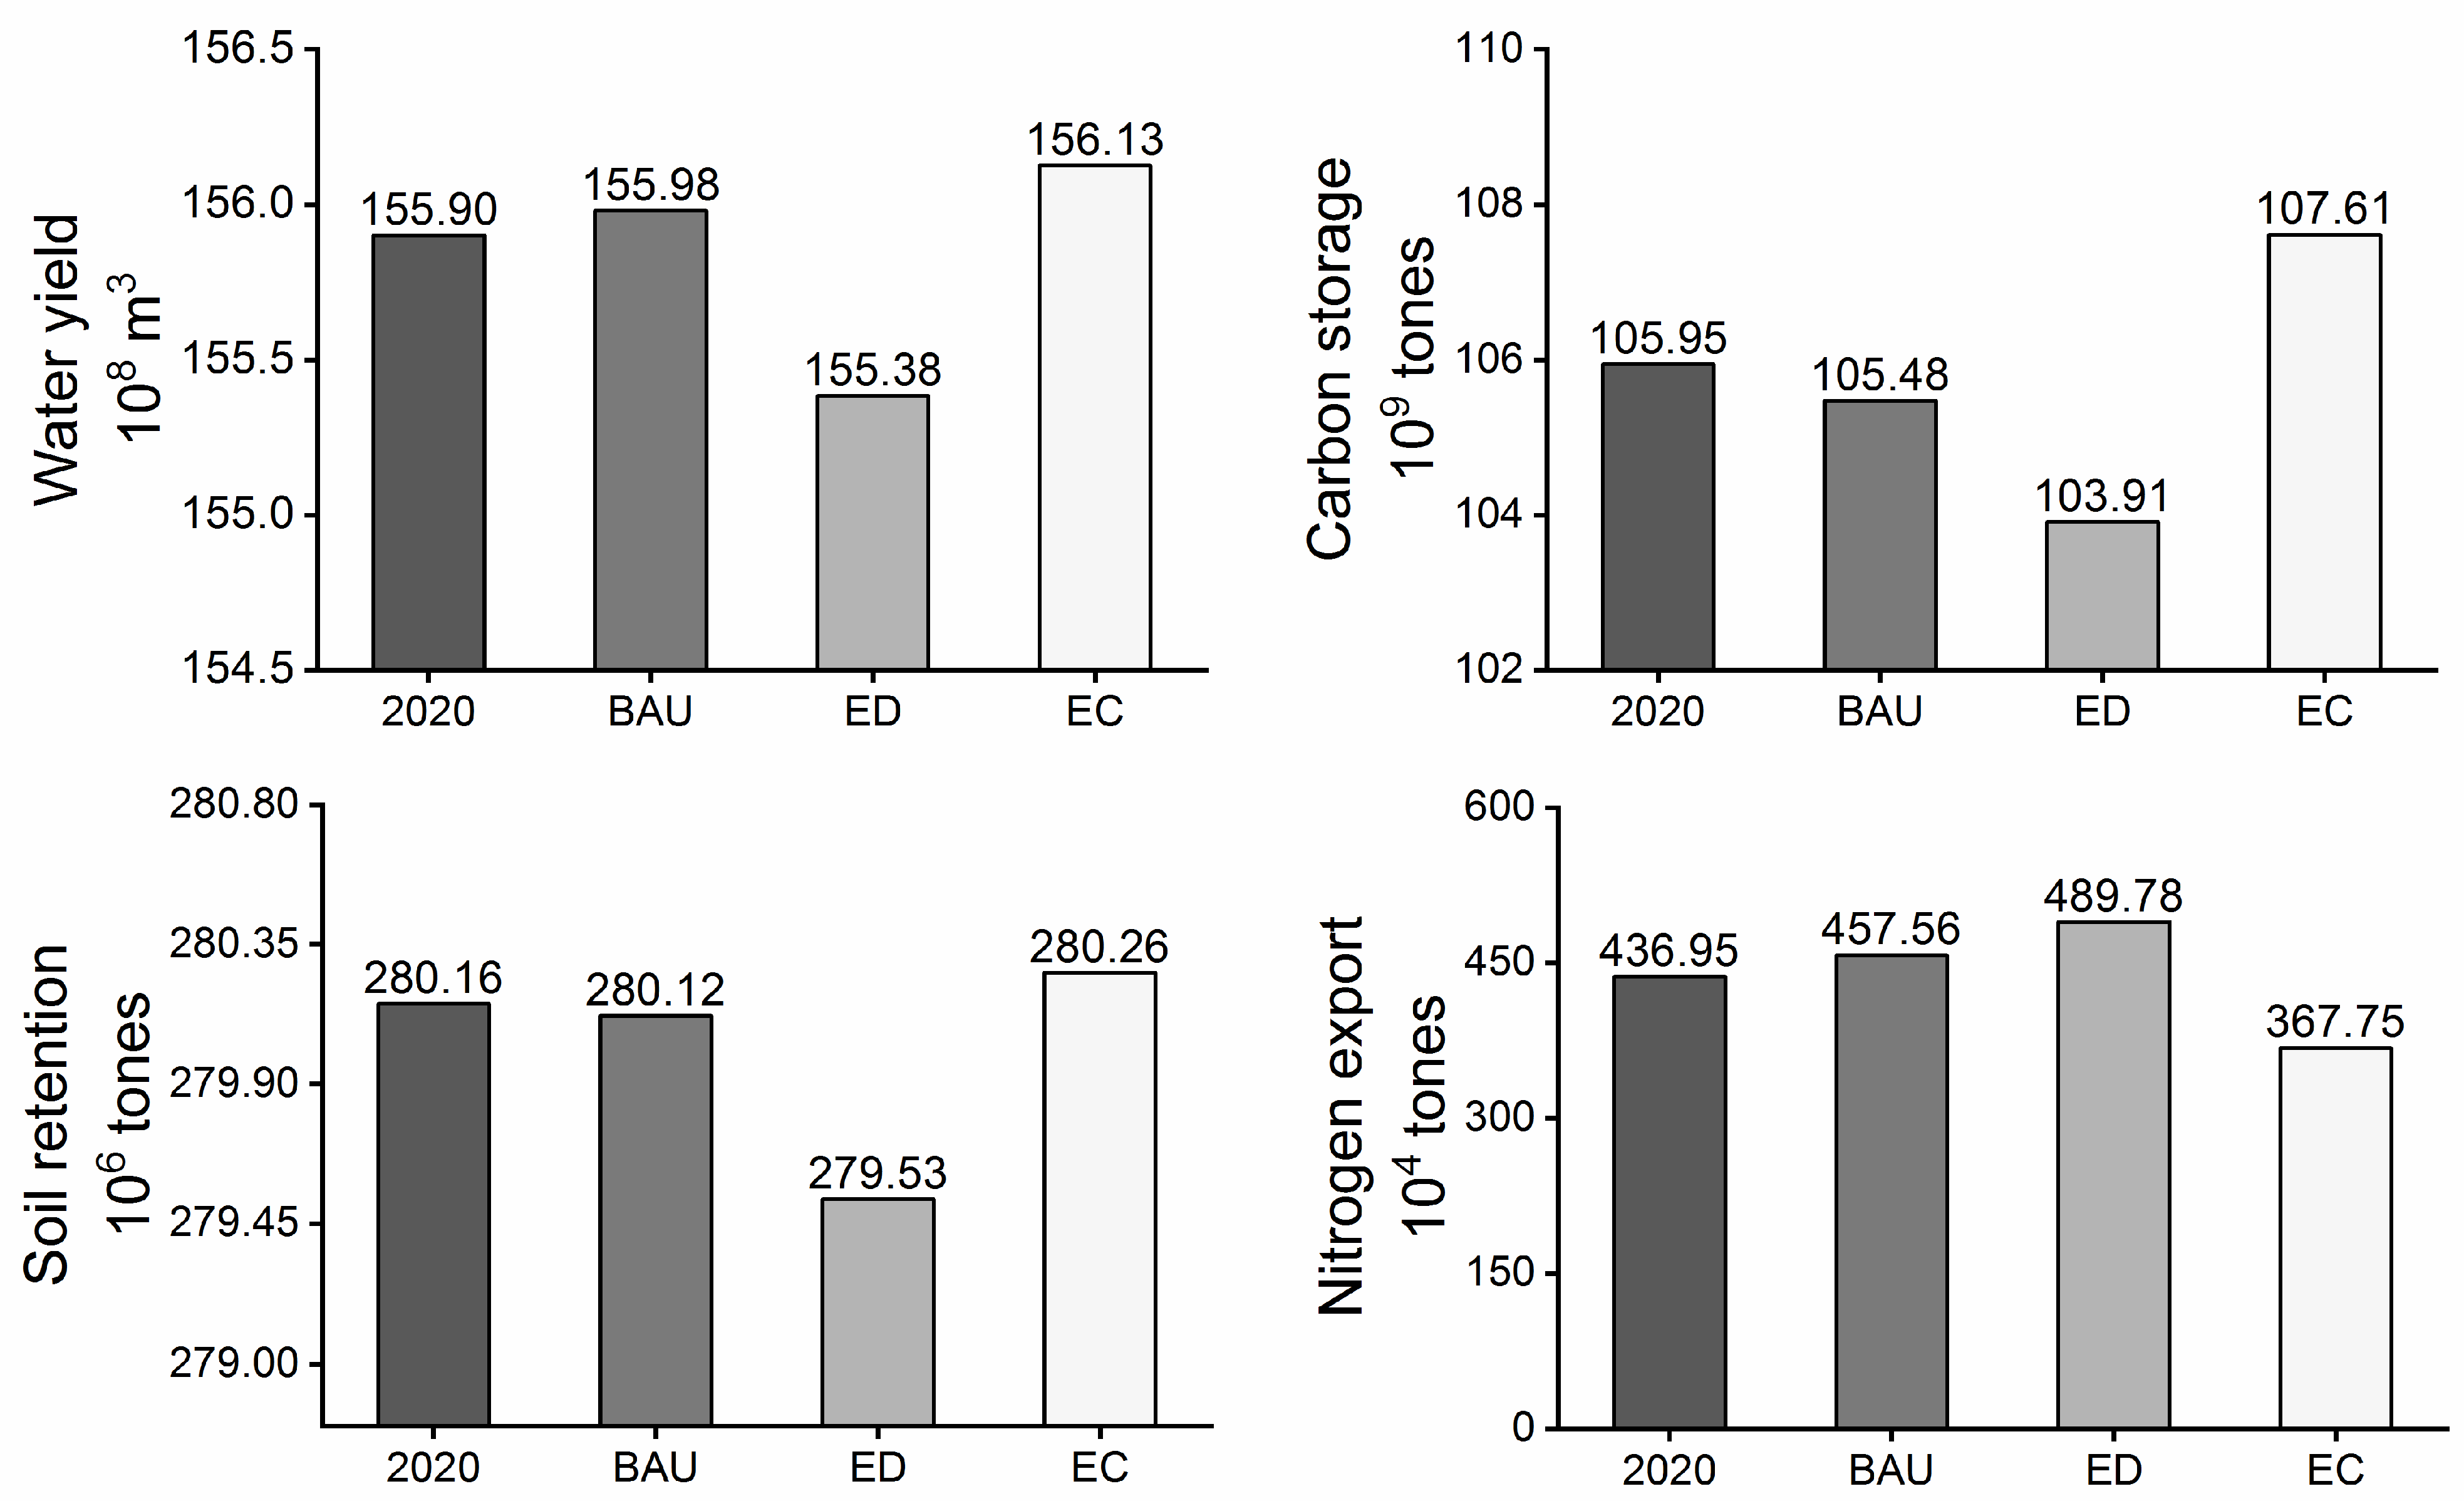
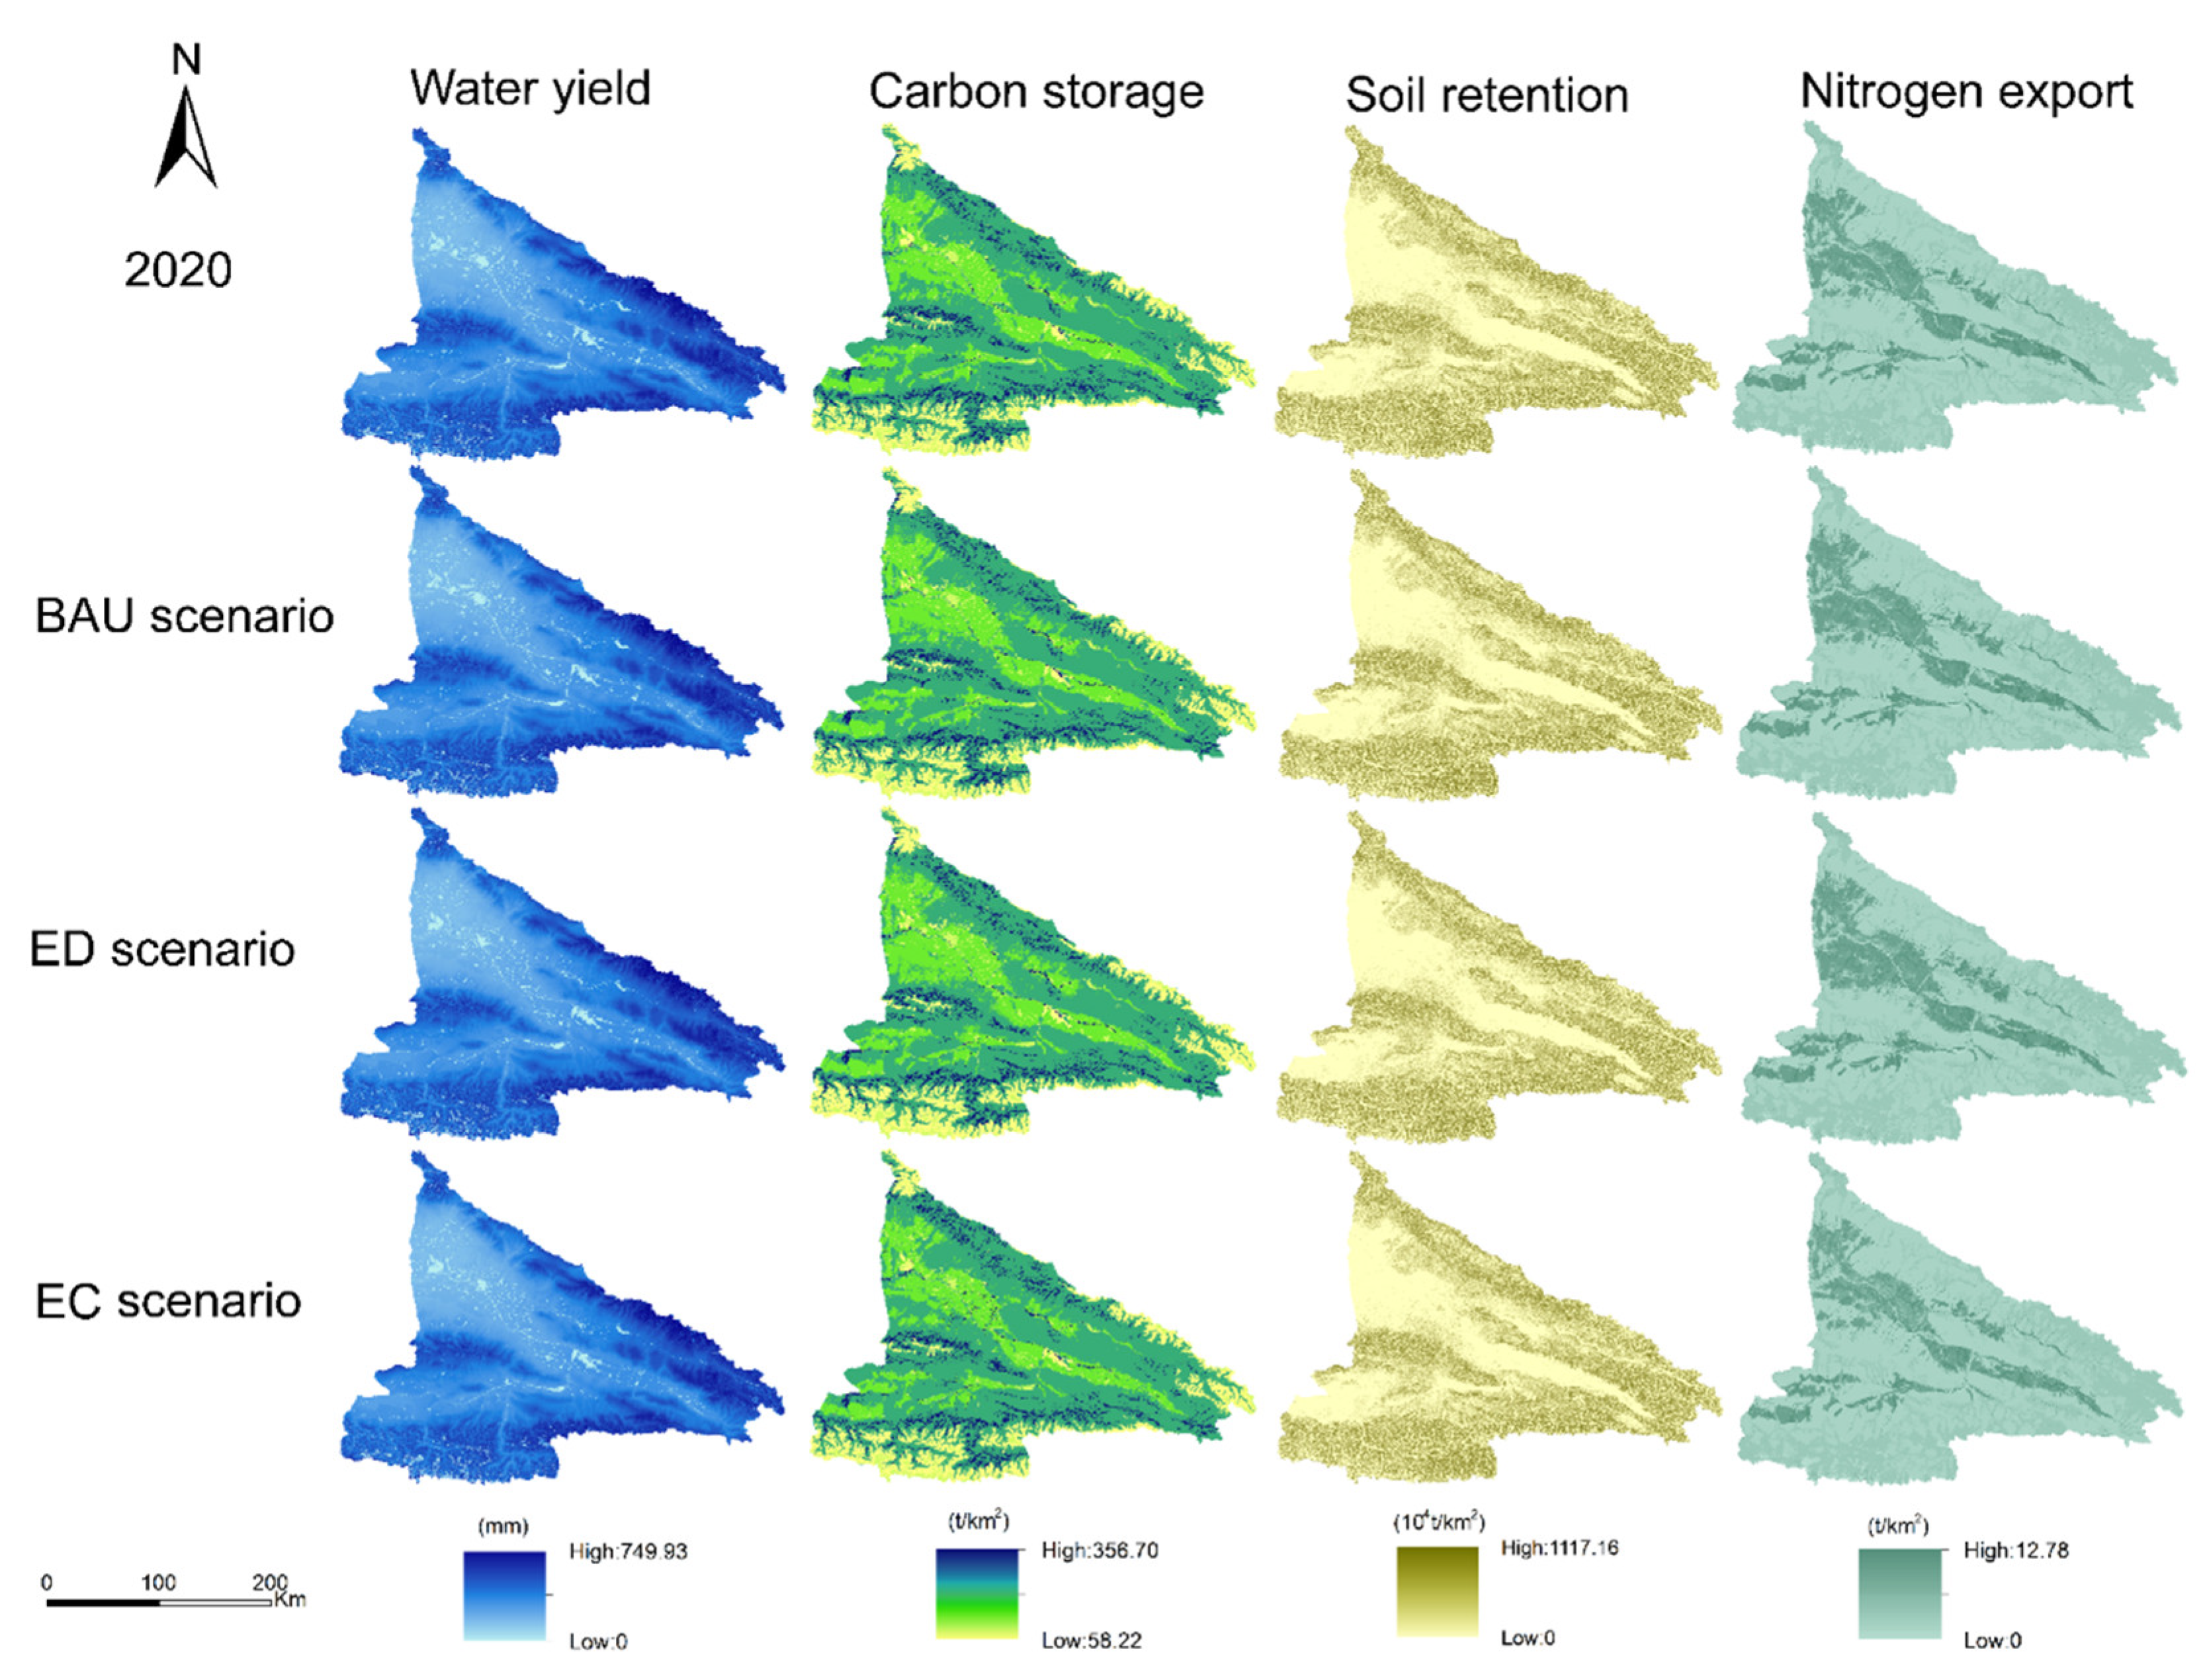
3.2. Ecosystem Services Changes

We used the InVEST model to quantify four ecosystem service functions in the Yili River Valley in the different scenarios (Figure 3). In the 2030 BAU scenario, WY increased, but CS and SR decreased, with the decline in CS and SR mainly occurring in the southern and northern high mountain forest grasslands of the study area (Figure 4). We estimated a significant expansion of cropland and construction land in the ED scenario, resulting in a drastic downward trend in ESs metrics for the region. In this scenario, a net loss of 2.04 × 10⁷ t of carbon, a reduction of 5.17 × 10⁷ m3 of water production, and an exacerbation of 6.37 × 10⁵ t of soil erosion were expected. Due to the significant increase in arable land, NE tended to increase slightly, but the higher the nitrogen export, the poorer the water purification capacity [6]. The EC scenario predicted upward trends in CS, WY, and SR, given that ecological policy implementation contributed to enhanced carbon sequestration and water retention in forests and grasslands. In this scenario, the cumulative net increase in carbon stocks was 1.66 × 10⁷ t, water retention was 2.26 × 10⁷ m3, and soil retention was 9 × 10⁴ t [53]. The most significant ESs improvements in the Yili River Valley occurred in the EC scenario, and the main goal of future planning should be to enhance ecosystem functions through land restoration.

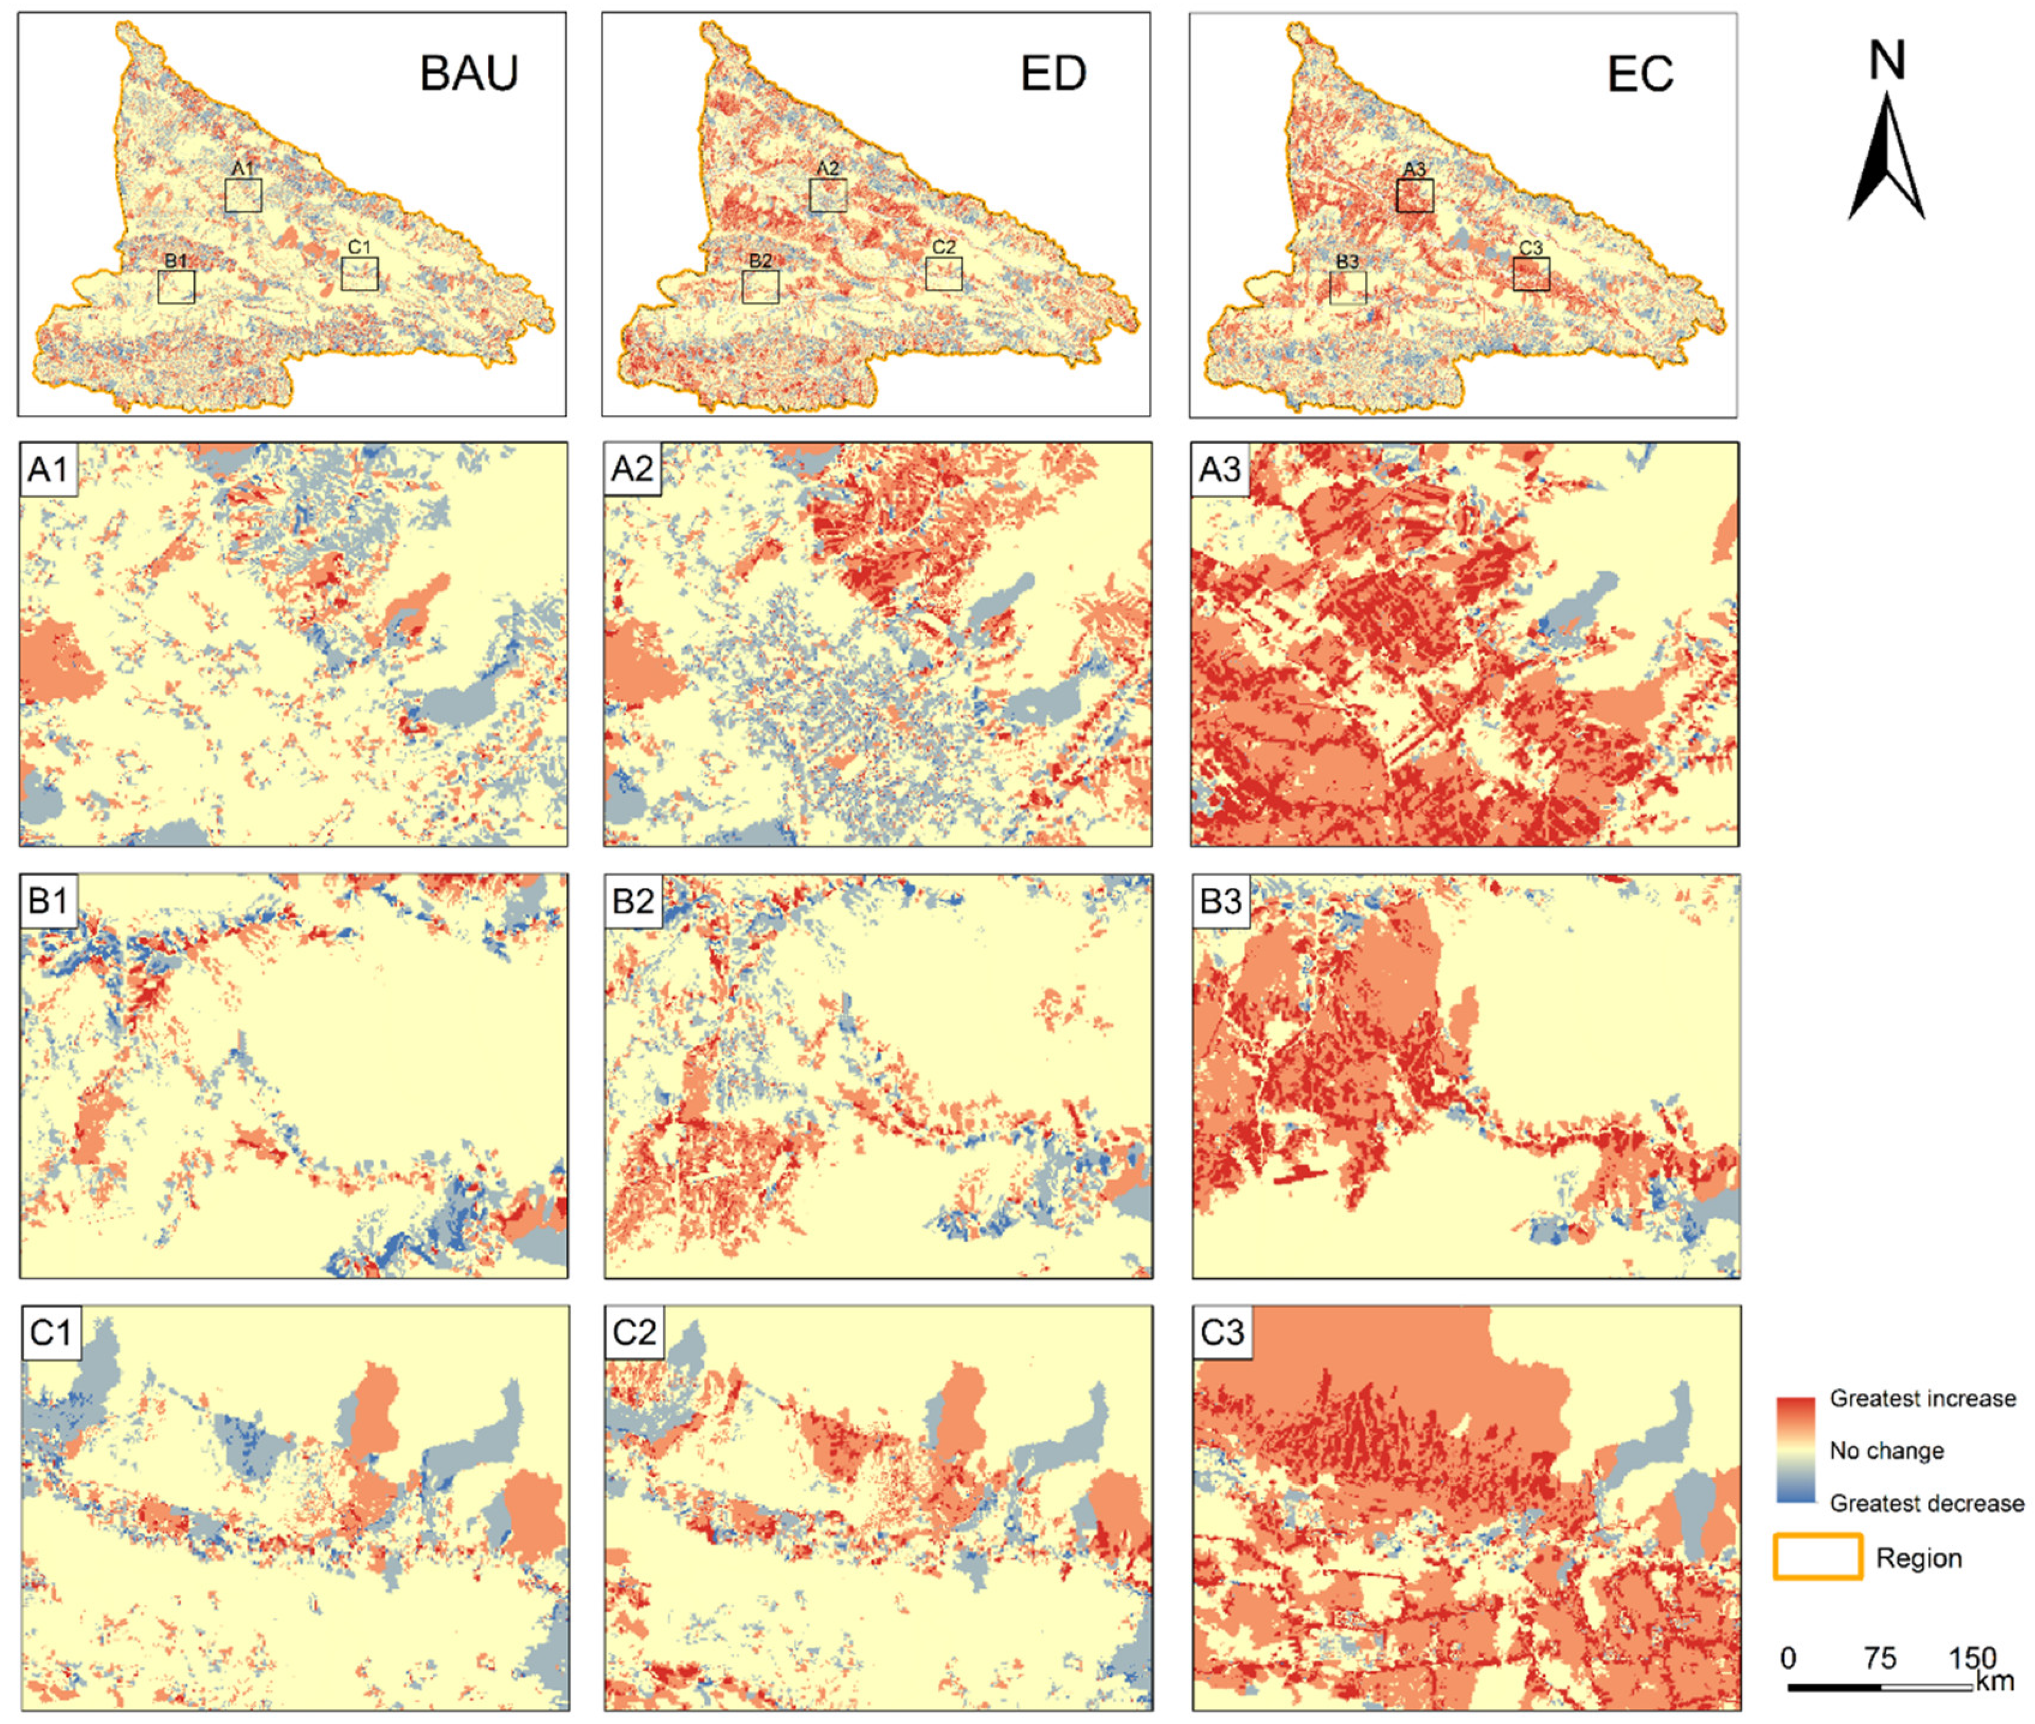
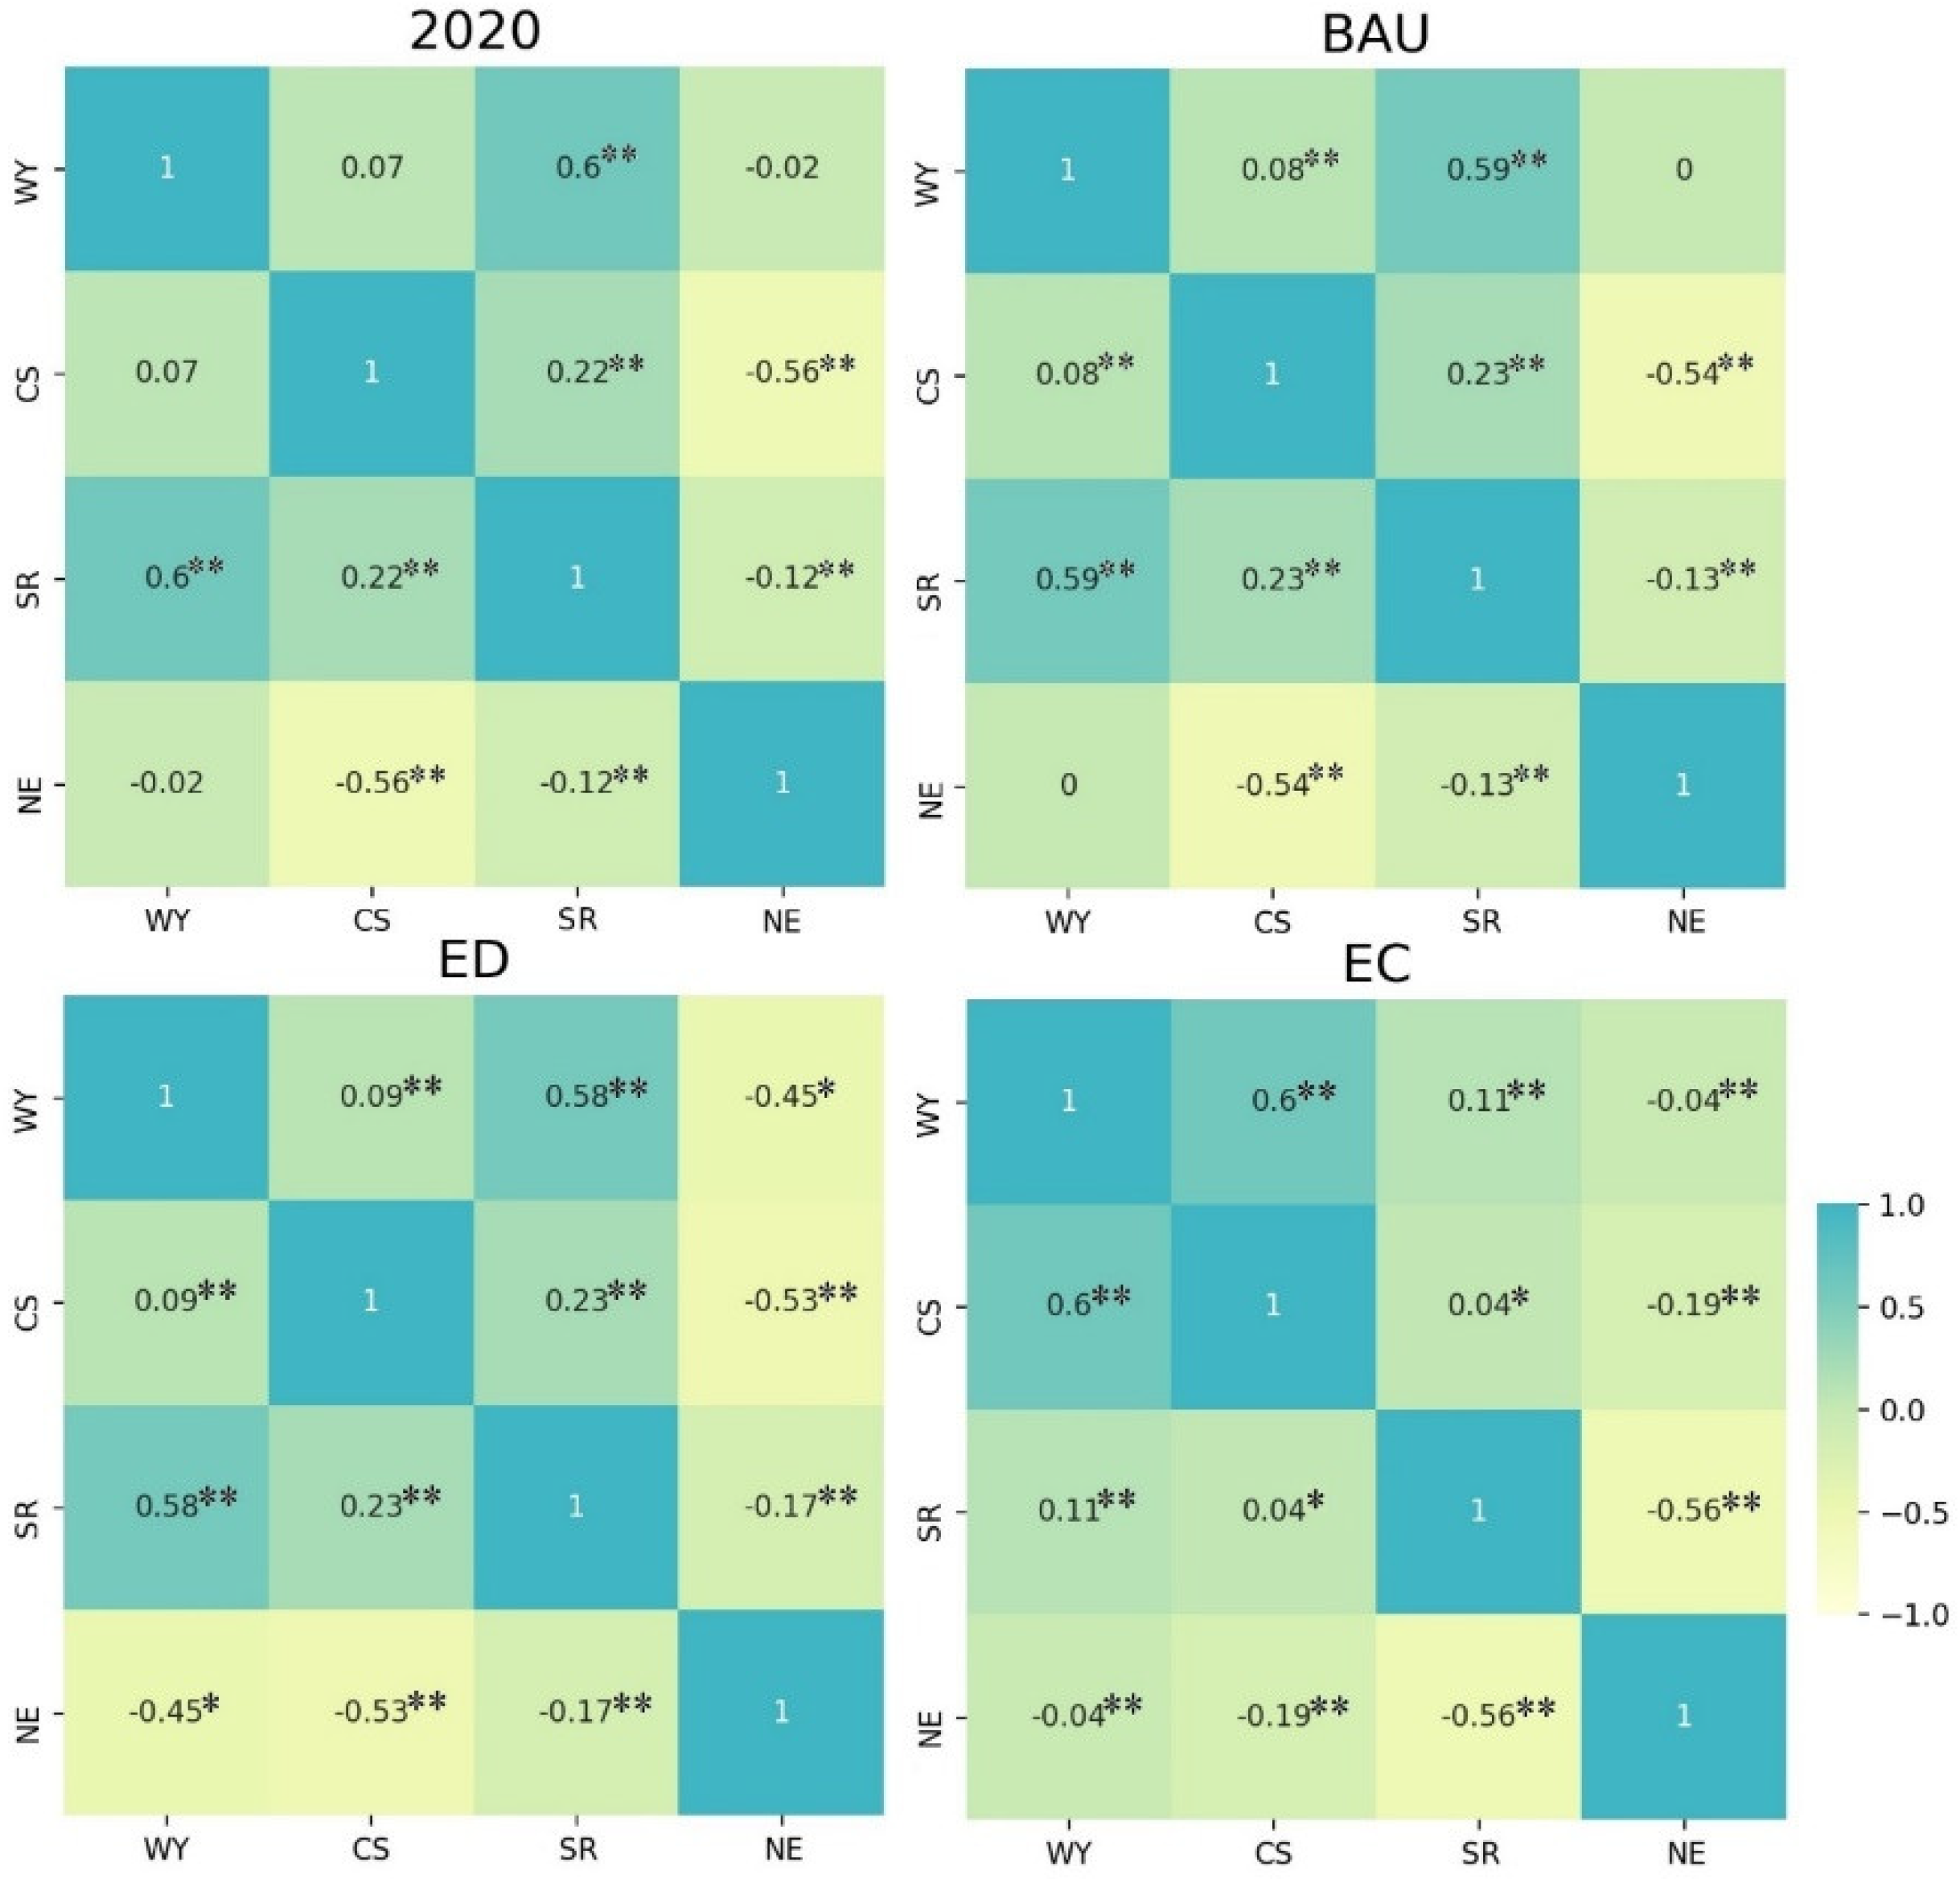
3.3. Impact of LULC on Synergies and Trade-Offs among ESs

From the perspective of the study area as a whole unit, Figure 5 shows the different relationships between ESs. In the ED and EC scenarios, the increased forest and grassland areas had significant effects on ESs (Figure 2). At the nodes in the upper and middle reaches of the Yili River, ESs were significantly enhanced by returning cropland to forests and by implementing ecological engineering policies (Figure 5A3). In the EC scenario, in Zhaosu County, located in the Tekesi River basin, large areas of cultivated land were returned to forests, resulting in a significant improvement in the ecological quality of the farming zone on the plain near the basin (Figure 5B3).
We also found strong correlations between the four ESs indicators in the different scenarios (Spearman correlation; df = 2457, p < 0.01) [49]. In the BAU scenario, CS and NE exhibited significant trade-off effects (df = 2457, p < 0.01), while WY and SR exhibited significant synergistic effects (df = 2457, p < 0.01). In the ED scenario, the trade-off effects between WY and NE were stronger than in the BAU scenario, likely due to the significant increase in nitrogen output from the expanded cropland area, producing a trade-off effect. In the EC scenario, significant synergistic effects occurred between WY and CS (df = 2457, p < 0.01), while significant trade-off effects occurred between SR and NE (df = 2457, p < 0.01). Thus, WY and CS are connected by synergistic relationships with complementary strengths and weaknesses, while SR and NE are connected by trade-offs with complementary strengths and weaknesses [8].

4. Discussion

4.1. Land-Use Impacts on Ecosystem Services

This study is the first to link the PLUS and InVEST models to predict and quantitatively assess ESs (four indicators) for different future scenarios in the Yili River Valley and to analyze the trade-offs and synergies between ESs. This study indicates that grasslands account for more than 58% of the total Yili River Valley and that farmland and construction land are located near the Yili River basin. Because of the flat landscape, dense soil layers, and good drainage conditions in the plains of the watershed area, the vicinity of the Yili and Turks river watersheds are often reclaimed for cultivated and construction land [36]. In the 2030 BAU scenario, there was a minor expansion of cropland and construction land, which is consistent with the findings of previous studies [54]. The increase in construction led to an increase in regional impervious surface area, which further led to an increasing trend in regional WY (Figure 3).
The analyses indicate that there were rapid expansions of both cropland and construction land in the ED scenario. In many studies, an increase in cultivated and construction lands is mainly caused by the conversion of forests and grassland, which is consistent with the findings of this study [23,55,56]. In the ED scenario, a large amount of forested grassland was cleared, resulting in a significant decline in ESs (Figure 5). If economic development policies are implemented in this situation, the ecological recovery is slower and with smaller patches [57,58,59].
In the EC scenario, the forest, vegetation, and water ecosystems in the study area are restored due to ecological engineering and environmental protection policies. In order to further analyze the land-use changes in each of the scenarios, we selected several key areas as case studies. Area A in Figure 5 shows the Yammadu, which is the confluence of the upper and middle reaches of the Yili River. The Yili River is a transboundary river, and approximately 75% of its volume flows out of China [60]. If the EC scenario is implemented, the sustainable economic development and ecological protection of the Yili River basin are affected, and the downstream neighboring country can also achieve a high-quality ecological environment in the basin, thereby promoting the ecological security of both China and Kazakhstan. In the EC scenario, owing to the implementation of returning farmland to forests and ecological protection policies, the ESs functions are restored. This is in agreement with the findings of Fu et al. [6], indicating that the multiple effects of ESs are spatially heterogeneous in the BAU, ED, and EC scenarios.

4.2. Trade-Off Effects between ESs

Synergies and trade-offs on ESs quality change when assessing local ESs production shifts (Figure 6) [61]. For the entire study area, we found that the spatial relationships of ESs in the different scenarios had different corresponding characteristics (Figure 5). The results indicate a significant negative correlation between CS and NE, namely, there is a trade-off effect between CS and NE. The interpretation is that aboveground biomass is a substantial source of soil carbon by litterfall. The conversion of litter biomass to soil carbon has a certain turnover rate and presents a time gap between NE and CS [62]. In contrast, in wetter areas, the time gap may be shorter due to the higher availability of water, which promotes the decomposition of litter. Similarly, in addition to atmospheric N deposition and N fixation by plant roots, the trade-off between NE and CS may be partially related to the time lag between litterfall and the release of biomass nitrogen into the soil, as litter is a major N source for the soil [63].
This effect may also be related to the amount of nitrogen retained by the vegetation, which is consistent with the findings of Sun [48]. In this study, WY and SR were positively correlated with synergistic effects, which is consistent with the findings of Sun and Shi [54]. When forests are converted to grassland, farmland, and construction land, they have greater evapotranspiration, retention, and evaporation than grasses or crops, thus reducing water production [64]. Thus, clarifying the trade-offs between multiple ESs and the use of stakeholder feedback to determine the optimal ESs and their spatial distributions will help facilitate the implementation of interventions that produce beneficial effects across multiple dimensions [65].

4.3. Model Validation

To ensure the accuracy of the study, we calibrated the input parameters and output results of the InVEST models using results from other studies in the Yili River Valley. For the WY model, the output result was verified using Water Resources Bulletin data, and the InVEST model yielded a value of is 1.56 × 10¹¹ m3, while the Water Resources Bulletin had an annual average water yield of 1.59 × 10¹¹ m3. For the CS model, the input value was the measured value, so the output result was more accurate. We found that by calculating the distribution areas of different soil types and soil carbon storage in the Yili River Valley, the total organic carbon storage of 0–60 cm soil in the Yili River Valley was 925 Tg C, which is consistent with the findings of Yang et al. [36]. For the SR model, this study and previous studies have calculated that the soil and water conservation volume of the Yili River Valley (based on actual measurements) was 2.64 × 10⁸ tons [53], which is consistent with the value of 2.80 × 10⁸ tons obtained in this study. For the NE model, we obtained data from 12 hydrological monitoring stations in the Yili River Valley and compared the nitrogen retentions. The measured nutrient retention values ranged from 0.63–2.49 t/km−2. The estimate obtained in this study was 0.92 t/km−2, which falls within the range of reported values.

4.4. Limitations and Further Research

Combining the PLUS and InVEST models overcomes the drawbacks of a single model and fully exploits the advantages of both models in terms of quantity predictions and spatial allocations. Previous studies have focused on the linear variations in LULC under different future scenarios, while only a few studies have attempted to strengthen knowledge of the non-linear relationships that drive transitions in LULC. The PLUS model can better represent the LULC spatiotemporal distinction patterns in a land expansion analysis strategy and using the CA model based on multi-type random patch seeds. In addition, scenario planning allows the comparison of ESs differences between scenarios and the realization of trade-offs between ESs under the different scenarios. This study plays a critical role in subsequent assessments and quantification of ESs and helps to provide new perspectives for decision makers.
This study used the PLUS model to portray only three different future LULC scenarios through policy guidelines. However, these three alternatives are not representative of all possible LULC realities. More comprehensive scenarios should be explored in future studies to address the needs of multiple stakeholders for optimal land-use policies [1,66]. This will further improve the accuracy of land-use predictions, which in turn will help analyze the quantitative results of the subsequent ESs. In addition, the InVEST model should contain more field data to set the model parameters, thereby more accurately determining the dynamic characteristics of ESs in the study area.

5. Conclusions

This study provides new insights, based on a combination of the PLUS and InVEST models, to predict and evaluate ESs (WY, CS, SR, and NE) in the Yili River Valley in 2030. We quantified the ESs under regional land-use impacts and analyzed the trade-off response relationships. The results indicate that the PLUS model can accurately depict future generalized LULC patterns with sufficient accuracy to meet the requirements of the study. In the 2030 BAU scenario, cropland and construction land demonstrated a small expansion trend, leading to a decrease in WY and SR, and WY was projected to increase by 2030. In this scenario, NE and CS are significant trade-offs (i.e., negatively correlated). In the ED scenario, the rapid expansion of construction land led to a decrease in CS, SR, and WY, with the decrease mainly located in urban centers. To improve environmental benefits, policymakers in the Yili River Valley should pay attention to the intensive use of construction land and the protection of forests, grasslands, and surface water bodies with high environmental benefit values. In the EC scenario, CS, SR, and WY increased due to the implementation of ecological engineering. Furthermore, the trade-off effect between CS and NE is significantly weaker than that in BAU and ED scenarios. In addition, although seldom used in China, our scenario analysis indicates that restoring vegetation in riparian zones and on steep slopes can effectively improve ESs. To improve ESs trade-offs, we suggest that policymakers in the Yili River Valley should pay attention to the use of land for construction, and they must designate ecological red line areas to protect forests, grassland, and surface water bodies with high ecological functions. In summary, this study supports the use of ESs decision-making functions in urban planning, which can help decision makers develop more comprehensive planning for more comprehensive ecosystem conservation plans.

Author Contributions

M.S. and H.W. were responsible for the research design, analysis, and manuscript design and review. M.S. drafted the manuscript and was responsible for data preparation, experiments, and analyses. T.D. and P.H. were responsible for the research design field survey and manuscript review. Resourced by X.F. and M.F.B. Funding acquisition by H.J. and P.J. All authors contributed to the editing and reviewing of the manuscript. All authors have read and agreed to the published version of the manuscript.

Funding

This research was financially supported by the National Natural Science Foundation of China (No. 31560171), and the Major Science and Technology Special Projects in Xinjiang Uygur Autonomous Region, China (No. 2020A01002).

Institutional Review Board Statement

Not applicable.

Informed Consent Statement

Not applicable.

Data Availability Statement

Not applicable.

Acknowledgments

A special acknowledgment should be expressed to the China University of Geosciences (Wuhan) and College of Resources and Environment, University of Chinese Academy of Sciences that supported the implementation of this study. We also thank anonymous reviewers for their constructive comments on the manuscript.

Conflicts of Interest

The authors declare no conflict of interest.

References

  1. Zheng, H.; Wang, L.; Peng, W.; Zhang, C.; Li, C.; Robinson, B.E.; Wu, X.; Kong, L.; Li, R.; Xiao, Y. Realizing the values of natural capital for inclusive, sustainable development: Informing China’s new ecological development strategy. Proc. Natl. Acad. Sci. USA 2019, 116, 8623–8628. [Google Scholar] [CrossRef] [PubMed] [Green Version]
  2. Costanza, R.; d’Arge, R.; de Groot, R.; Farber, S.; Grasso, M.; Hannon, B.; Limburg, K.; Naeem, S.; O’Neill, R.V.; Paruelo, J.; et al. The total value of the world’s ecosystem services and natural capital. Nature 1996, 387, 253–260. [Google Scholar] [CrossRef]
  3. Guerry, A.D.; Polasky, S.; Lubchenco, J.; Chaplin-Kramer, R.; Daily, G.C.; Griffin, R.; Ruckelshaus, M.; Bateman, I.J.; Duraiappah, A.; Elmqvist, T.; et al. Natural capital and ecosystem services informing decisions: From promise to practice. Proc. Natl. Acad. Sci. USA 2015, 112, 7348–7355. [Google Scholar] [CrossRef] [PubMed] [Green Version]
  4. Gao, J.; Yu, Z.; Wang, L.; Vejre, H. Suitability of regional development based on ecosystem service benefits and losses: A case study of the Yangtze River Delta urban agglomeration, China. Ecol. Indic. 2019, 107, 105579. [Google Scholar] [CrossRef]
  5. Danilo, R.; Luciano, B.; Leonardo, A. Novel perspectives on bat insectivory highlight the value of this ecosystem service in farmland: Research frontiers and management implications. Agric. Ecosyst. Environ. 2018, 266, 31–38. [Google Scholar] [CrossRef]
  6. Fu, Q.; Hou, Y.; Wang, B.; Bi, X.; Li, B.; Zhang, X. Scenario analysis of ecosystem service changes and interactions in a mountain-oasis-desert system: A case study in Altay Prefecture, China. Sci. Rep. 2018, 8, 12939. [Google Scholar] [CrossRef]
  7. Deng, X.; Li, Z.; Gibson, J. A review on trade-off analysis of ecosystem services for sustainable land-use management. J. Geogr. Sci. 2016, 26, 953–968. [Google Scholar] [CrossRef] [Green Version]
  8. Liang, X.; Liu, X.; Chen, G.; Leng, J.; Wen, Y.; Chen, G. Coupling fuzzy clustering and cellular automata based on local maxima of development potential to model urban emergence and expansion in economic development zones. Int. J. Geogr. Inf. Sci. 2020, 34, 1930–1952. [Google Scholar] [CrossRef]
  9. Brovkin, V.; Boysen, L.; Arora, V.K.; Boisier, J.P.; Cadule, P.; Chini, L.; Claussen, M.; Friedlingstein, P.; Gayler, V.; van den Hurk, B.J.J.M.; et al. Effect of anthropogenic land-use and land cover changes on climate and land carbon storage in CMIP5 projections for the 21st century. J. Clim. 2013, 26, 6859–6881. [Google Scholar] [CrossRef]
  10. Yang, G.; Yu, Z.; Jørgensen, G.; Vejre, H. How can urban blue-green space be planned for climate adaption in high-latitude cities? A seasonal perspective. Sustain. Cities Soc. 2020, 53, 101932. [Google Scholar] [CrossRef]
  11. Polasky, S.; Nelson, E.; Pennington, D.; Johnson, K.A. The Impact of Land-Use Change on Ecosystem Services, Biodiversity and Returns to Landowners: A Case Study in the State of Minnesota. Environ. Res. Econ. 2010, 48, 219–242. [Google Scholar] [CrossRef]
  12. Lin, Z.; Ye, X.; Wei, Q.; Xin, F.; Lu, Z.; Kudva, S.; Dai, Q. Ecosystem services value assessment and uneven development of the Qingjiang River Basin in China. Sustainability 2017, 9, 2356. [Google Scholar] [CrossRef] [Green Version]
  13. Zhang, Y.; Liu, Y.; Zhang, Y.; Liu, Y.; Zhang, G.; Chen, Y. On the spatial relationship between ecosystem services and urbanization: A case study in Wuhan, China. Sci. Total Environ. 2018, 637, 780–790. [Google Scholar] [CrossRef] [PubMed]
  14. Liu, L.; Chen, X.; Chen, W.; Ye, X. Identifying the impact of landscape pattern on wcosystem aervices in the middle reaches of the Yangtze River urban agglomerations, China. Int. J. Environ. Res. Public Health 2020, 17, 5063. [Google Scholar] [CrossRef] [PubMed]
  15. Li, B.; Wang, W. Trade-offs and synergies in ecosystem services for the Yinchuan Basin in China. Ecol. Indic. 2018, 84, 837–846. [Google Scholar] [CrossRef]
  16. Bai, Y.; Chen, Y.; Alatalo, J.M.; Yang, Z.; Jiang, B. Scale effects on the relationships between land characteristics and ecosystem services- a case study in Taihu Lake Basin, China. ScTEn 2020, 716, 137081–137083. [Google Scholar] [CrossRef]
  17. Wang, Z.; Mao, D.; Li, L.; Jia, M.; Dong, Z.; Miao, Z.; Ren, C.; Song, C. Quantifying changes in multiple ecosystem services during 1992–2012 in the Sanjiang Plain of China. ScTEn 2015, 514, 119–130. [Google Scholar] [CrossRef]
  18. Andrade, E.M.; Guerreiro, M.J.S.; Palácio, H.A.Q.; Campos, D.A. Ecohydrology in a Brazilian tropical dry forest: Thinned vegetation impact on hydrological functions and ecosystem services. J. Hydrol. Reg. Stud. 2020, 27, 100649. [Google Scholar] [CrossRef]
  19. Hu, W.; Li, G.; Gao, Z.; Jia, G.; Wang, Z.; Li, Y. Assessment of the impact of the Poplar Ecological Retreat Project on water conservation in the Dongting Lake wetland region using the InVEST model. Sci. Total. Environ. 2020, 733, 139423. [Google Scholar] [CrossRef]
  20. Zhu, W.; Zhang, J.; Cui, Y.; Zhu, L. Assessment of territorial ecosystem carbon storage based on land use change scenario: A case study in Qihe River Basin. Acta Geogr. Sin. 2020, 30, 1507–1522. [Google Scholar] [CrossRef]
  21. Harmáčková, Z.V.; Vačkář, D. Modelling regulating ecosystem services trade-offs across landscape scenarios in Trebonsko Wetlands Biosphere Reserve, Czech Republic. Ecol. Model. 2015, 295, 207–215. [Google Scholar] [CrossRef]
  22. Bai, Y.; Zheng, H.; Ouyang, Z.; Zhuang, C.; Jiang, B. Modeling hydrological ecosystem services and tradeoffs: A case study in Baiyangdian watershed, China. Environ. Earth Sci. 2013, 70, 709–718. [Google Scholar] [CrossRef]
  23. Zheng, H.; Li, Y.; Robinson, B.E.; Liu, G.; Ma, D.; Wang, F.; Lu, F.; Ouyang, Z.; Daily, G.C. Using ecosystem service trade-offs to inform water conservation policies and management practices. Front. Ecol. Environ. 2016, 14, 527–532. [Google Scholar] [CrossRef]
  24. Cai, Y.; Li, H.; Ye, X.; Zhang, H. Analyzing three-decadal patterns of land use/land cover change and regional ecosystem services at the landscape level: Case study of two coastal metropolitan regions, Eastern China. Sustainability 2016, 8, 773. [Google Scholar] [CrossRef] [Green Version]
  25. Van Jaarsveld, A.; Biggs, R.; Scholes, R.; Bohensky, E.; Reyers, B.; Lynam, T.; Musvoto, C.; Fabricius, C. Measuring conditions and trends in ecosystem services at multiple scales: The Southern African Millennium Ecosystem Assessment (SA f MA) experience. Philos. Trans. R. Soc. B Biol. Sci. 2005, 360, 425–441. [Google Scholar] [CrossRef] [PubMed] [Green Version]
  26. Lauf, S.; Haase, D.; Kleinschmit, B. Linkages between ecosystem services provisioning, urban growth and shrinkage—A modeling approach assessing ecosystem service trade-offs. Ecol. Indic. 2014, 42, 73–94. [Google Scholar] [CrossRef]
  27. Fu, Q.; Li, B.; Yang, L.; Wu, Z.; Zhang, X. Ecosystem Services Evaluation and Its Spatial Characteristics in Central Asia’s Arid Regions: A Case Study in Altay Prefecture, China. Sustainability 2015, 7, 8335–8353. [Google Scholar] [CrossRef] [Green Version]
  28. Zhao, M.; He, Z.; Du, J.; Chen, L.; Lin, P.; Fang, S. Assessing the effects of ecological engineering on carbon storage by linking the CA-Markov and InVEST models. Ecol. Indic. 2019, 98, 29–38. [Google Scholar] [CrossRef]
  29. Huang, J.; Tang, Z.; Liu, D.; He, J. Ecological response to urban development in a changing socio-economic and climate context: Policy implications for balancing regional development and habitat conservation. Land Use Policy 2020, 97, 104772. [Google Scholar] [CrossRef]
  30. Sohl, T.L.; Claggett, P.R. Clarity versus complexity: Land-use modeling as a practical tool for decision-makers. Environ. Manag. 2013, 129, 235–243. [Google Scholar] [CrossRef]
  31. Meentemeyer, R.K.; Tang, W.; Dorning, M.A.; Vogler, J.B.; Cunniffe, N.J.; Shoemaker, D.A. FUTURES: Multilevel simulations of emerging urban–rural landscape structure using a stochastic patch-growing algorithm. Ann. Assoc. Am. Geogr. 2013, 103, 785–807. [Google Scholar] [CrossRef] [Green Version]
  32. Yang, J.; Gong, J.; Tang, W.; Liu, C. Patch-based cellular automata model of urban growth simulation: Integrating feedback between quantitative composition and spatial configuration. Comput. Environ. Urban Syst. 2020, 79, 101402. [Google Scholar] [CrossRef]
  33. Liang, X.; Guan, Q.; Clarke, K.C.; Liu, S.; Wang, B.; Yao, Y. Understanding the drivers of sustainable land expansion using a patch-generating land use simulation (PLUS) model: A case study in Wuhan, China. Comput. Environ. Urban Syst. 2021, 85, 101569. [Google Scholar] [CrossRef]
  34. Fang, Z.; Bai, Y.; Jiang, B.; Alatalo, J.M.; Liu, G.; Wang, H. Quantifying variations in ecosystem services in altitude-associated vegetation types in a tropical region of China. Sci. Total. Environ. 2020, 726, 138565. [Google Scholar] [CrossRef]
  35. Wu, K.; Ye, X.; Qi, Z.; Zhang, H. Impacts of land use/land cover change and socioeconomic development on regional ecosystem services: The case of fast-growing Hangzhou metropolitan area, China. Cities 2013, 31, 276–284. [Google Scholar] [CrossRef]
  36. Yang, Y.; Chen, Y.; Li, W.; Chen, Y. Soil Organic Carbon Distribution of Different Vegetation Typesin the Ili River Valley. Acta Geogr. Sin. 2010, 65, 605–612. [Google Scholar] [CrossRef]
  37. Liu, J.; Liu, M.; Deng, X.; Zhuang, D.; Zhang, Z.; Di, L. The land use and land cover change database and its relative studies in China. J. Geogr. Sci. 2002, 12, 27–34. [Google Scholar] [CrossRef]
  38. Zheng, H.W.; Shen, G.Q.; Wang, H.; Hong, J. Simulating land use change in urban renewal areas: A case study in Hong Kong. Habitat Int. 2015, 46, 23–34. [Google Scholar] [CrossRef] [Green Version]
  39. López, E.; Bocco, G.; Mendoza, M.; Duhau, E. Predicting land-cover and land-use change in the urban fringe: A case in Morelia city, Mexico. Land. Urban Plan. 2001, 55, 271–285. [Google Scholar] [CrossRef]
  40. Yao, Y.; Liu, X.; Li, X.; Liu, P.; Hong, Y.; Zhang, Y.; Mai, K. Simulating urban land-use changes at a large scale by integrating dynamic land parcel subdivision and vector-based cellular automata. Int. J. Geogr. Inf. Sci. 2017, 31, 2452–2479. [Google Scholar] [CrossRef]
  41. Liu, S.; Su, H.; Cao, G.; Wang, S.; Guan, Q. Learning from data: A post classification method for annual land cover analysis in urban areas. Isprs J. Photogramm. Rem. Sens. 2019, 154, 202–215. [Google Scholar] [CrossRef]
  42. Ma, L.; Niu, S.; Yang, L. Dunhuang city land use/cover scenario simulation based on Markov and CLUE-S models. Chin. J. Ecol. 2012, 31, 1823–1831. [Google Scholar]
  43. Niu, Q.; Xiao, X.; Zhang, Y.; Qin, Y.; Dang, X.; Wang, J.; Zou, Z.; Doughty, R.B.; Brandt, M.; Tong, X.; et al. Ecological engineering projects increased vegetation cover, production, and biomass in semiarid and subhumid Northern China. Land Degrad. Dev. 2019, 30, 1620–1631. [Google Scholar] [CrossRef] [Green Version]
  44. Hu, Y.; Zheng, Y.; Zheng, X. Simulation of land-use scenarios for Beijing using CLUE-S and Markov composite models. Chin. Geogr. Sci. 2013, 23, 92–100. [Google Scholar] [CrossRef]
  45. Wong, C.P.; Jiang, B.; Kinzig, A.P.; Lee, K.N.; Ouyang, Z. Linking ecosystem characteristics to final ecosystem services for public policy. Ecol. Lett. 2015, 18, 108–118. [Google Scholar] [CrossRef] [Green Version]
  46. Haines-Young, R.; Potschin-Young, M.B. Revision of the Common International Classification for Ecosystem Services (CICES V5.1): A Policy Brief. One Ecosyst. 2018, 3, e27108. [Google Scholar] [CrossRef]
  47. Ahmed, M.T. Millennium ecosystem assessment. Environ. Sci. Pollut. Res. 2002, 9, 219–220. [Google Scholar] [CrossRef]
  48. Sun, X.; Lu, Z.; Li, F.; Crittenden, J.C. Analyzing spatio-temporal changes and trade-offs to support the supply of multiple ecosystem services in Beijing, China. Ecol. Indic. 2018, 94, 117–129. [Google Scholar] [CrossRef]
  49. Bai, Y.; Wong, C.; Jiang, B.; Hughes, A. Developing China’s Ecological Redline Policy using ecosystem services assessments for land use planning. Nat. Commun. 2018, 9, 1–13. [Google Scholar] [CrossRef] [Green Version]
  50. Marco, M.; Harald, B.; Thomas, C.; Florian, I.; Matija, K. Future ecosystem services from European mountain forests under climate change. J. Appl. Ecol. 2017, 54, 389–401. [Google Scholar] [CrossRef]
  51. Samie, A.; Deng, X.; Jia, S.; Chen, D. Scenario-Based Simulation on Dynamics of Land-Use-Land-Cover Change in Punjab Province, Pakistan. Sustainability 2017, 9, 1285. [Google Scholar] [CrossRef] [Green Version]
  52. Pontius, R.G.J. Quantification Error versus Location Error in Comparison of Categorical Maps. Photogramm. Eng. Remote Sens. 2000, 66, 1011–1016. [Google Scholar] [CrossRef]
  53. Gao, Y.; Sun, H. Two Kinds of Ecological Service Values of Soil and Water Conservation in the Ili River Valley. Arid Zone Res. 2018, 35, 540–548. [Google Scholar]
  54. Sun, S.; Shi, Q. Global Spatio—Temporal Assessment of Changes in Multiple Ecosystem Services Under Four IPCC SRES Land—use Scenarios. Earth’s Future 2020, 8, 8. [Google Scholar] [CrossRef]
  55. Liu, Z.; Verburg, P.H.; Wu, J.; He, C. Understanding Land System Change Through Scenario-Based Simulations: A Case Study from the Drylands in Northern China. Environ. Manag. 2017, 59, 1–15. [Google Scholar] [CrossRef] [PubMed]
  56. Wan, L.; Ye, X.; Lee, J.; Lu, X.; Zheng, L.; Wu, K. Effects of urbanization on ecosystem service values in a mineral resource-based city. Habitat Int. 2015, 46, 54–63. [Google Scholar] [CrossRef]
  57. Hinz, R.; Sulser, T.B.; Huefner, R.; Mason-D’Croz, D.; Dunston, S.; Nautiyal, S.; Ringler, C.; Schuengel, J.; Tikhile, P.; Wimmer, F. Agricultural Development and Land Use Change in India: A Scenario Analysis of Trade—Offs Between UN Sustainable Development Goals (SDGs). Earth’s Future 2020, 8, e2019EF001287. [Google Scholar] [CrossRef] [Green Version]
  58. Qi, Z.; Ye, X.; Zhang, H.; Yu, Z. Land fragmentation and variation of ecosystem services in the context of rapid urbanization: The case of Taizhou city, China. Stoch. Envrion. Res. Risk Assess. 2014, 28, 843–855. [Google Scholar] [CrossRef]
  59. Yu, Z.; Yang, G.; Zuo, S.; Jørgensen, G.; Koga, M.; Vejre, H. Critical review on the cooling effect of urban blue-green space: A threshold-size perspective. Urban For. Urban Green. 2020, 49, 126630. [Google Scholar] [CrossRef]
  60. Lili, W.; Qiong, Z.; Congxin, X.; Jiangong, N.; Lingang, C.; Hong, L. Community Structure of Periphyton and Biological Assessment of Water Quality in the Yili River, Xinjiang Uyghur Autonomous Region. J. Hydroecol. 2015, 36, 29–38. [Google Scholar] [CrossRef]
  61. Lu, N.; Fu, B.; Jin, T.; Chang, R. Trade-off analyses of multiple ecosystem services by plantations along a precipitation gradient across Loess Plateau landscapes. Landsc. Ecol. 2014, 29, 1697–1708. [Google Scholar] [CrossRef]
  62. Farley, K.A.; Kelly, E.F.; Hofstede, R.G. Soil organic carbon and water retention after conversion of grasslands to pine plantations in the Ecuadorian Andes. Ecosystems 2004, 7, 729–739. [Google Scholar] [CrossRef]
  63. Davidson, E.A.; de Carvalho, C.J.R.; Figueira, A.M.; Ishida, F.Y.; Ometto, J.P.H.; Nardoto, G.B.; Sabá, R.T.; Hayashi, S.N.; Leal, E.C.; Vieira, I.C.G. Recuperation of nitrogen cycling in Amazonian forests following agricultural abandonment. Nature 2007, 447, 995–998. [Google Scholar] [CrossRef] [PubMed]
  64. Farley, K.A.; Jobbágy, E.G.; Jackson, R.B. Effects of afforestation on water yield: A global synthesis with implications for policy. Glob. Chang. Biol. 2005, 11, 1565–1576. [Google Scholar] [CrossRef]
  65. Geertsema, W.; Rossing, W.A.; Landis, D.A.; Bianchi, F.J.; Van Rijn, P.C.; Schaminée, J.H.; Tscharntke, T.; Van Der Werf, W. Actionable knowledge for ecological intensification of agriculture. Front. Ecol. Environ. 2016, 14, 209–216. [Google Scholar] [CrossRef]
  66. Liang, X.; Liu, X.; Li, D.; Zhao, H.; Chen, G. Urban growth simulation by incorporating planning policies into a CA-based future land-use simulation model. Int. J. Geogr. Inf. Sci. 2018, 32, 2294–2316. [Google Scholar] [CrossRef]
Figure 1. Digital elevation model of the study area.
Sustainability 13 01577 g001
Figure 2. Land-use maps for 2020–2030 generated by the PLUS model for each of the different scenarios. (a) 2020, (b) BAU scenario, (c) ED scenario, (d) EC scenario.
Sustainability 13 01577 g002
Figure 3. Quantitative ESs changes from 2020 to 2030 for each of the scenarios.
Sustainability 13 01577 g003
Figure 4. Spatial distributions of regulating service indicators (water yield, carbon storage, soil retention, and nitrogen export) in the Yili River Valley from 2020 to 2030 for each of the scenarios.
Sustainability 13 01577 g004
Figure 5. Spatial patterns of multiple interactions among the ESs in each of the scenarios from 2020 and 2030. (A1A3) are the ES changes for the BAU, ED and EC scenarios in region A. (B1B3) are the ES changes for the BAU, ED and EC scenarios in region B. (C1C3) are the ES changes for the BAU, ED and EC scenarios in region C.
Sustainability 13 01577 g005
Figure 6. Correlation analysis between the ESs indicator pairs for each of the scenarios in the Yili River Valley. The significance level is denoted by stars on the upper right side of each correlation coefficient (No * means p 0.05; * means p < 0.05; ** means p < 0.01).
Sustainability 13 01577 g006
Table 1. Driving factors data used in the patch-generating land-use simulation (PLUS) model.
DataData AttributesSpatial ResolutionData Source
LULC30 mResources and Environment Data Center, Chinese Academy of Sciences
http://www.resdc.cn/
Climate dataAnnual mean temperature
Annual precipitation
Accumulated temperature
30 mChina Meteorological Data Network
http://data.cma.cn
Environment dataDEM
Slope
Groundwater depth
30 mGeospatial data clouds
http://www.gscloud.cn/
Socioeconomic dataPopulation
GDP
Proximity to the river
Proximity to the road
30 mResources and Environment Data Center, Chinese Academy of Sciences
http://www.resdc.cn/
Table 2. Land use/land cover (LULC) and its dynamic index K (%) in the Yili River Valley for each of the 2020–2030 scenarios.
LULC TypeAreal Coverage (km2)LULC Dynamic Index K (%)
2020BAUEDEC2020–BAU2020–ED2020–EC
Cropland9357.349875.8710,610.938342.210.55411.3397−1.0848
Forest3603.013600.143591.903877.41−0.0080−0.03080.7616
Grassland33,914.6633,389.6532,089.7634,925.39−0.1548−0.53810.2980
Water1358.501359.801356.621155.200.0096−0.0138−1.4965
Constructed930.20957.851062.71947.900.29721.42450.1903
Bare land6219.286199.686671.066143.90−0.03150.7264−0.1212
Publisher’s Note: MDPI stays neutral with regard to jurisdictional claims in published maps and institutional affiliations.

