Article

Impact of Climate Change on Agricultural Development in a Closed Groundwater-Driven Basin: A Case Study of the Siwa Region, Western Desert of Egypt

by
Noha H. Moghazy
1,2,* and
Jagath J. Kaluarachchi
3
1
Department of Civil and Environmental Engineering, Utah State University, Logan, UT 84322, USA
2
Irrigation Engineering and Hydraulics Department, Faculty of Engineering, Alexandria University, Alexandria 21544, Egypt
3
College of Engineering, Utah State University, Logan, UT 84322, USA
*
Author to whom correspondence should be addressed.
Sustainability 2021, 13(3), 1578; https://0-doi-org.brum.beds.ac.uk/10.3390/su13031578
Submission received: 18 December 2020 / Revised: 23 January 2021 / Accepted: 29 January 2021 / Published: 2 February 2021
(This article belongs to the Special Issue Sustainable Groundwater Resource Development for Agriculture)

Abstract

:
The Siwa region located in the Western Desert of Egypt has 30,000 acres available for reclamation as a part of a national project to increase agricultural production. This study addressed the climate change-driven long-term concerns of developing an agricultural project in this region where groundwater from the non-renewable Nubian Sandstone Aquifer System (NSAS) is the only source of water. Different climate models were used under two representative concentration pathways (RCPs); RCP 4.5 and RCP 8.5. Projected seasonal temperatures show that the maximum increase in summer is 1.68 ± 1.64 °C in 2060 and 4.65 ± 1.82 °C in 2100 under RCP 4.5 and RCP 8.5, respectively. The increase in water requirement for crops is estimated around 6–8.1% under RCP 4.5 while around 9.7–18.2% under RCP 8.5. Maximum reductions of strategic crop yields vary from 2.9% to 12.8% in 2060 under RCP 4.5, while from 10.4% to 27.4% in 2100 under RCP 8.5. Project goals are feasible until 2100 under RCP 4.5 but only until 2080 with RCP 8.5. When an optimization analysis was conducted, these goals are possible from 2080 to 2100 by modified land allocation. The proposed methodology is useful to project impact of climate change anywhere such that management and adaptation options can be proposed for sustainable agricultural development.

1. Introduction

Egypt has been facing major challenges due to the increase in population, limited water resources, and insufficient agriculture production. At the beginning of 2020, the population in Egypt exceeded the 100 million (https://www.worldometers.info/world-population/egypt-population/ accessed August 2020), an increase of 60% since the early 2000s [1]. The Nile River represents 94% of all renewable water resources in Egypt, which provides 55.5 billion m3 annually since the agreement between Egypt and Sudan in 1959 [2]. However, there are concerns about the future availability of this resource with the commencement of the Grand Ethiopian Renaissance Dam (GERD) that may reduce the water share of Egypt during the filling period. Crop production in Egypt is insufficient for its population’s needs, where self-sufficiency values of some strategic crops such as wheat, maize, broad bean, and barley were 34.5%, 47%, 30.7%, and 86%, respectively in 2017 [3]. As a result, these concerns are the major threats to the long-run food security in Egypt.
Accordingly, the Egyptian government initiated a new development project in 2015 to reclaim 1.5 million acres, mostly lands located in the Western Desert of Egypt. The goals of this project are to: Increase agricultural areas enabling rural development, population resettlement from dense regions such as the Delta region, increase strategic crop production, and increase investments. The primary source of water is the non-renewable NSAS, which is a transboundary aquifer shared between Egypt, Libya, Sudan, and Chad. In Egypt, NSAS has two aquifers; the upper aquifer is the Post Nubian Aquifer (PNA), which has high groundwater salinity around 3000 to 7000 ppm, and the lower aquifer, the Nubian Aquifer System (NAS), which has high groundwater quality with salinity around 200 to 400 ppm [
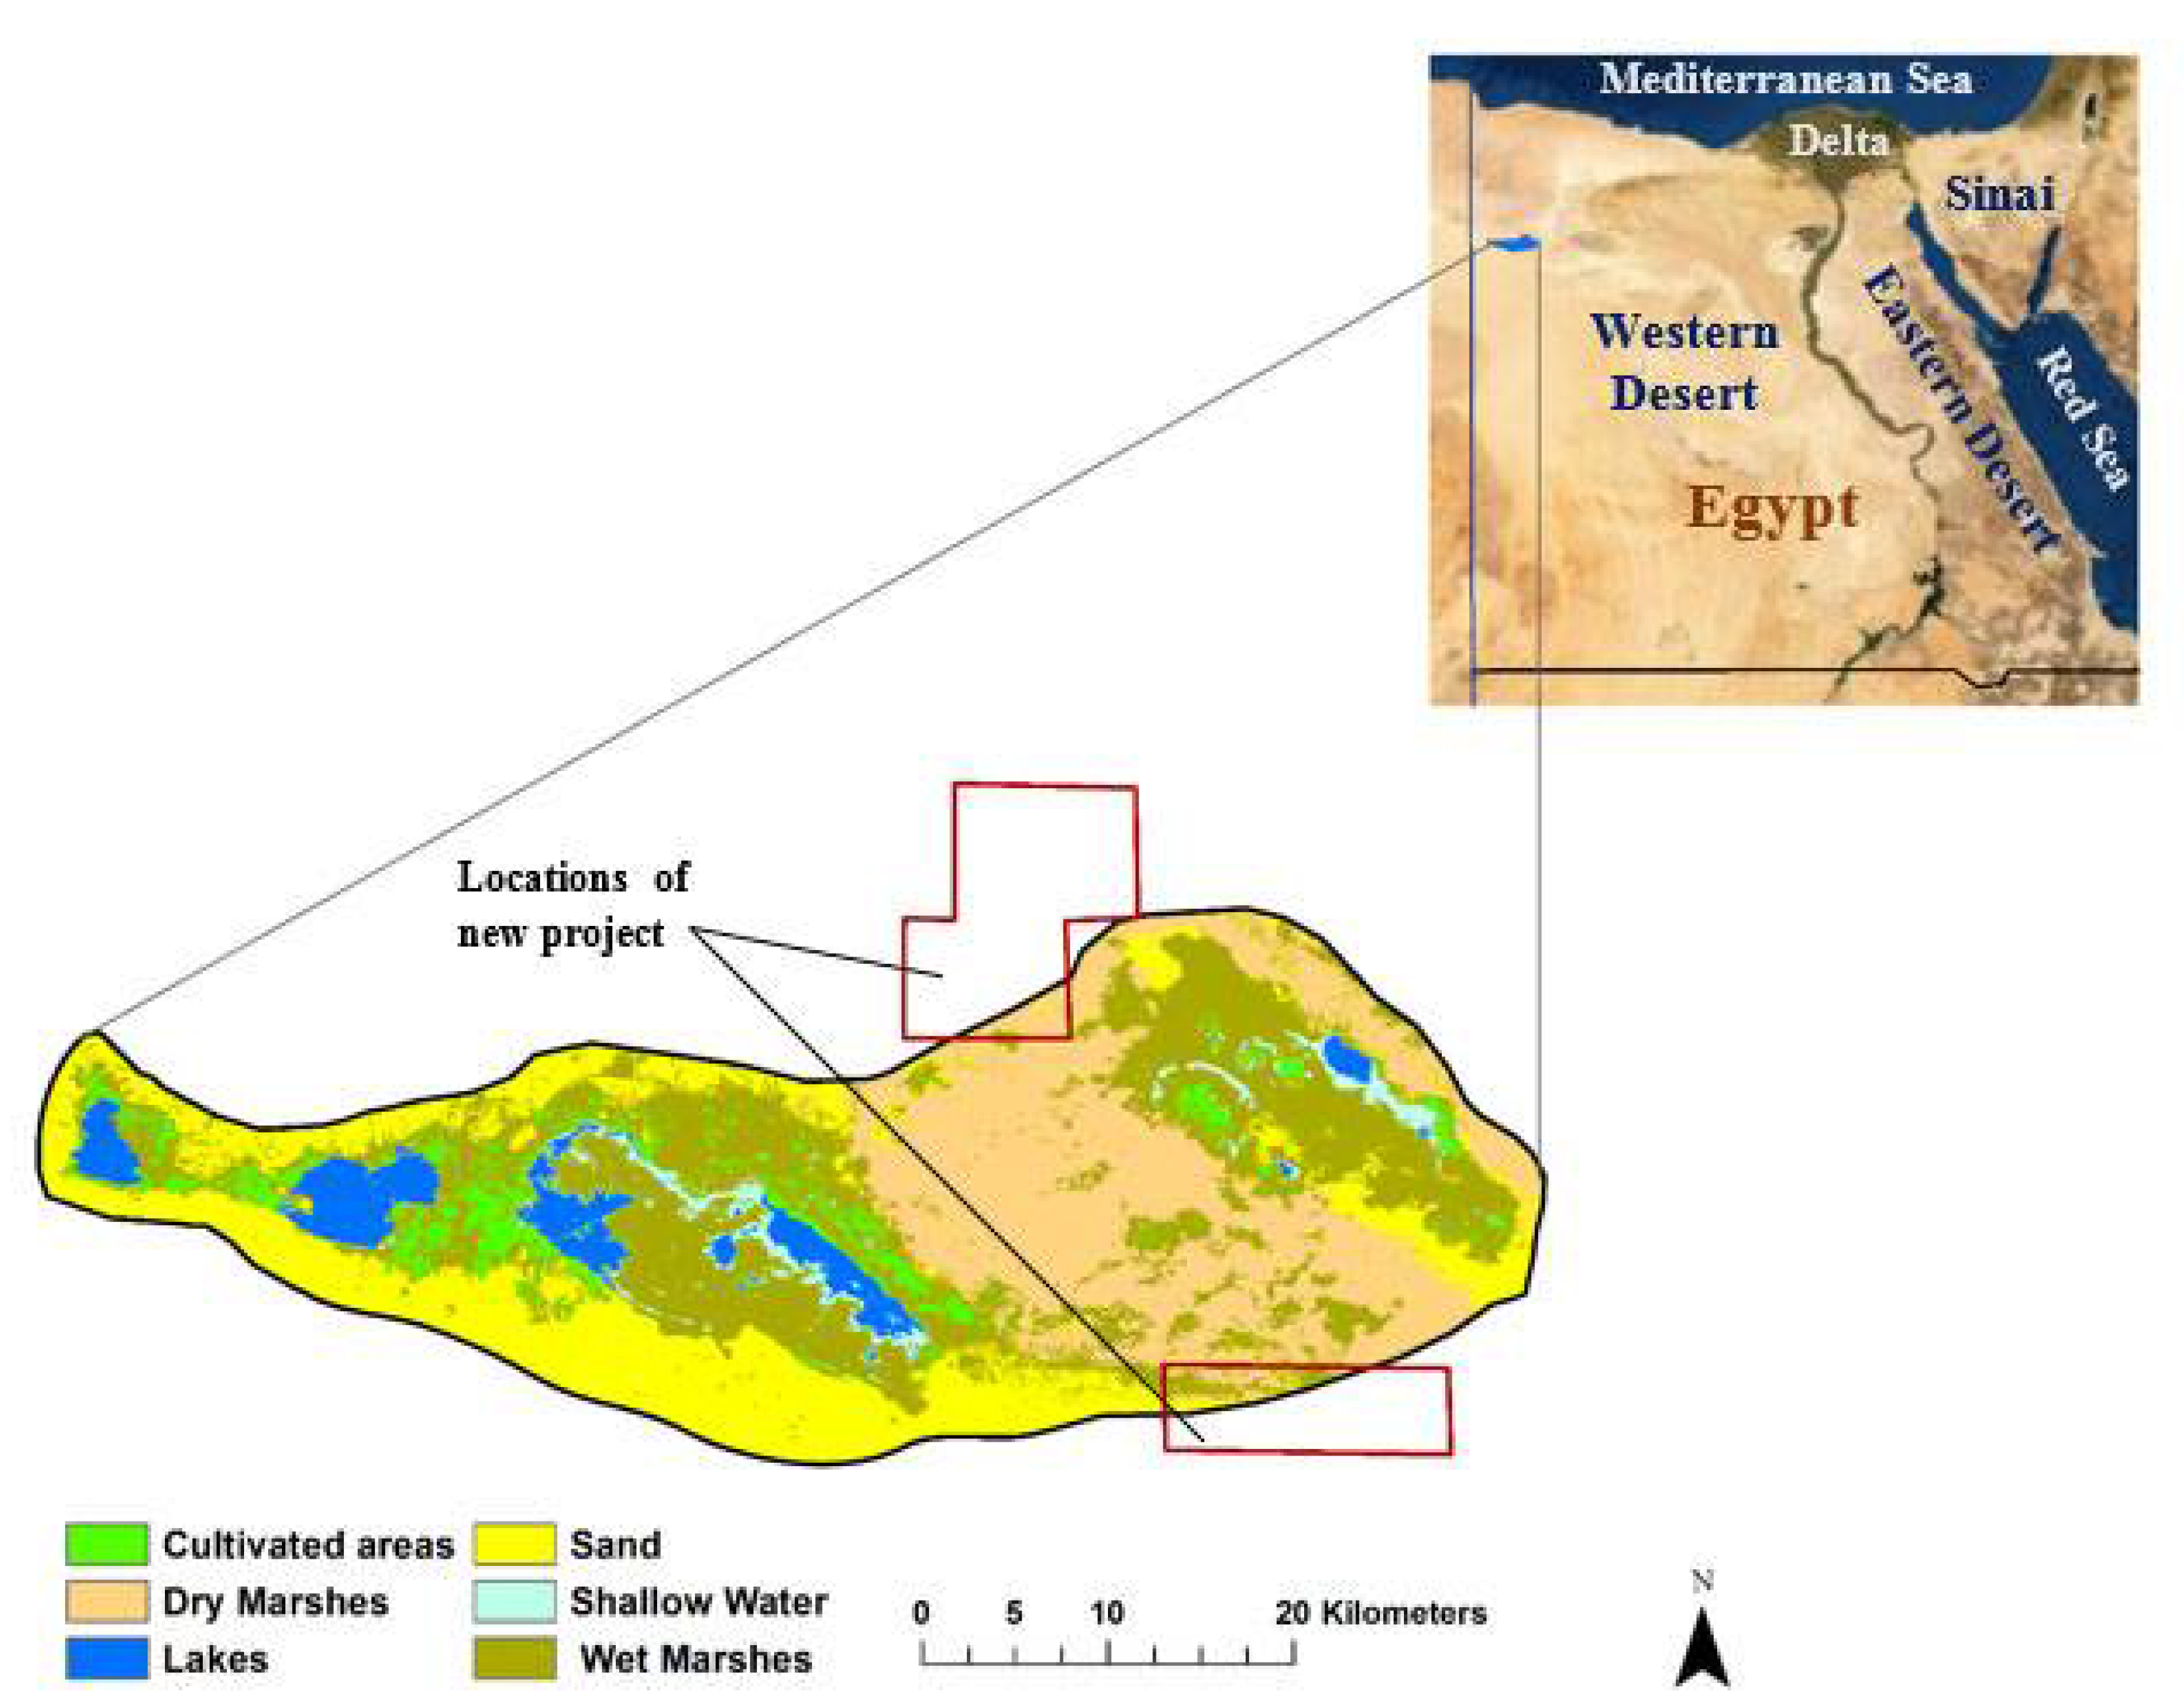
4]. The Siwa region is one of the areas that will be reclaimed with an area of about 30,000 acres (see Figure 1), which is the focus of this study.
To ensure sustainability of any future agriculture development, the possible impacts of climate change must be considered. An assessment of climate change would consider the increase in temperature, the increase of carbon dioxide (CO2), sea-level rise, and precipitation variability that can have a significant effect on crop production [5]. Rising CO2 might increase crop yield due to the enhancement of photosynthesis process and the efficiency of water use [6]. However, the effect of CO2 varies due to the uncertainty in many complex interaction mechanisms [7,8]. Therefore, this study considers the effect of rising temperature only while the impact of CO2 is neglected. The Intergovernmental Panel on Climate Change (IPCC) Fifth Assessment Report (AR5) predicted an increase in global temperature of 0.3–4.8 °C by the end of the 21st century under different greenhouse gas (GHG) emission scenarios [9,10]. Zhao et al. [11] investigated the impacts of global mean temperature increase on different crops and showed that the reduction of global yields of wheat and maize are 6 ± 2.9% and 7.4 ± 4.5%, respectively, per degree Celsius increase in temperature. In Africa, temperature is projected to exceed 2 °C by mid-21st century and 4 °C by the end of the 21st century [12] where crop yields are expected to decrease by 10% to 20% in 2050 [13].
To simulate the response of the global climate system due to the increase of GHG emissions, global climate models (GCMs) are typically used, but the spatial resolutions of GCMs are coarse (>100 km). Therefore, downscaling techniques are used to obtain local and regional climate information through regional climate models (RCMs) with resolution ( 50 km) [14]. Coordinated Regional Downscaling Experiment (CORDEX) is a project established by the World Climate Research Programme (WCRP), which produced a large number of RCM scenarios. CORDEX covered the globe through 14 spatial domains that provide historical data from 1951 to 2005, and projection data from 2006 to 2100 through different representative concentration pathways (RCPs): RCP 2.6, RCP 4.5, and RCP 8.5. For RCP 4.5, global GHG emissions are stable at 4.5 W/m2 before 2100 by using technology and different strategies. While RCP 8.5 assumes continuous increases of GHG emissions over time until 8.5 W/m2 in 2100 (https://sos.noaa gov/datasets/climate-model-temperature-change-rcp-45-2006-2100/ accessed in January 2020). In this study, RCMs are used due to the higher resolution under two emission scenarios, RCP 4.5 and RCP 8.5, where these represent two situations of moderate and high GHG emissions, respectively. Future economic growth of the region is uncertain especially industrial growth. However, the probability for low industrial growth is small given the demand for food and consumer products. Therefore, we have not considered the low emission scenario of RCP 2.6 in this work.
It is expected that Egypt may be affected by climate change, which may produce a decrease in its agricultural economy [15]. Abdrabbo et al. [
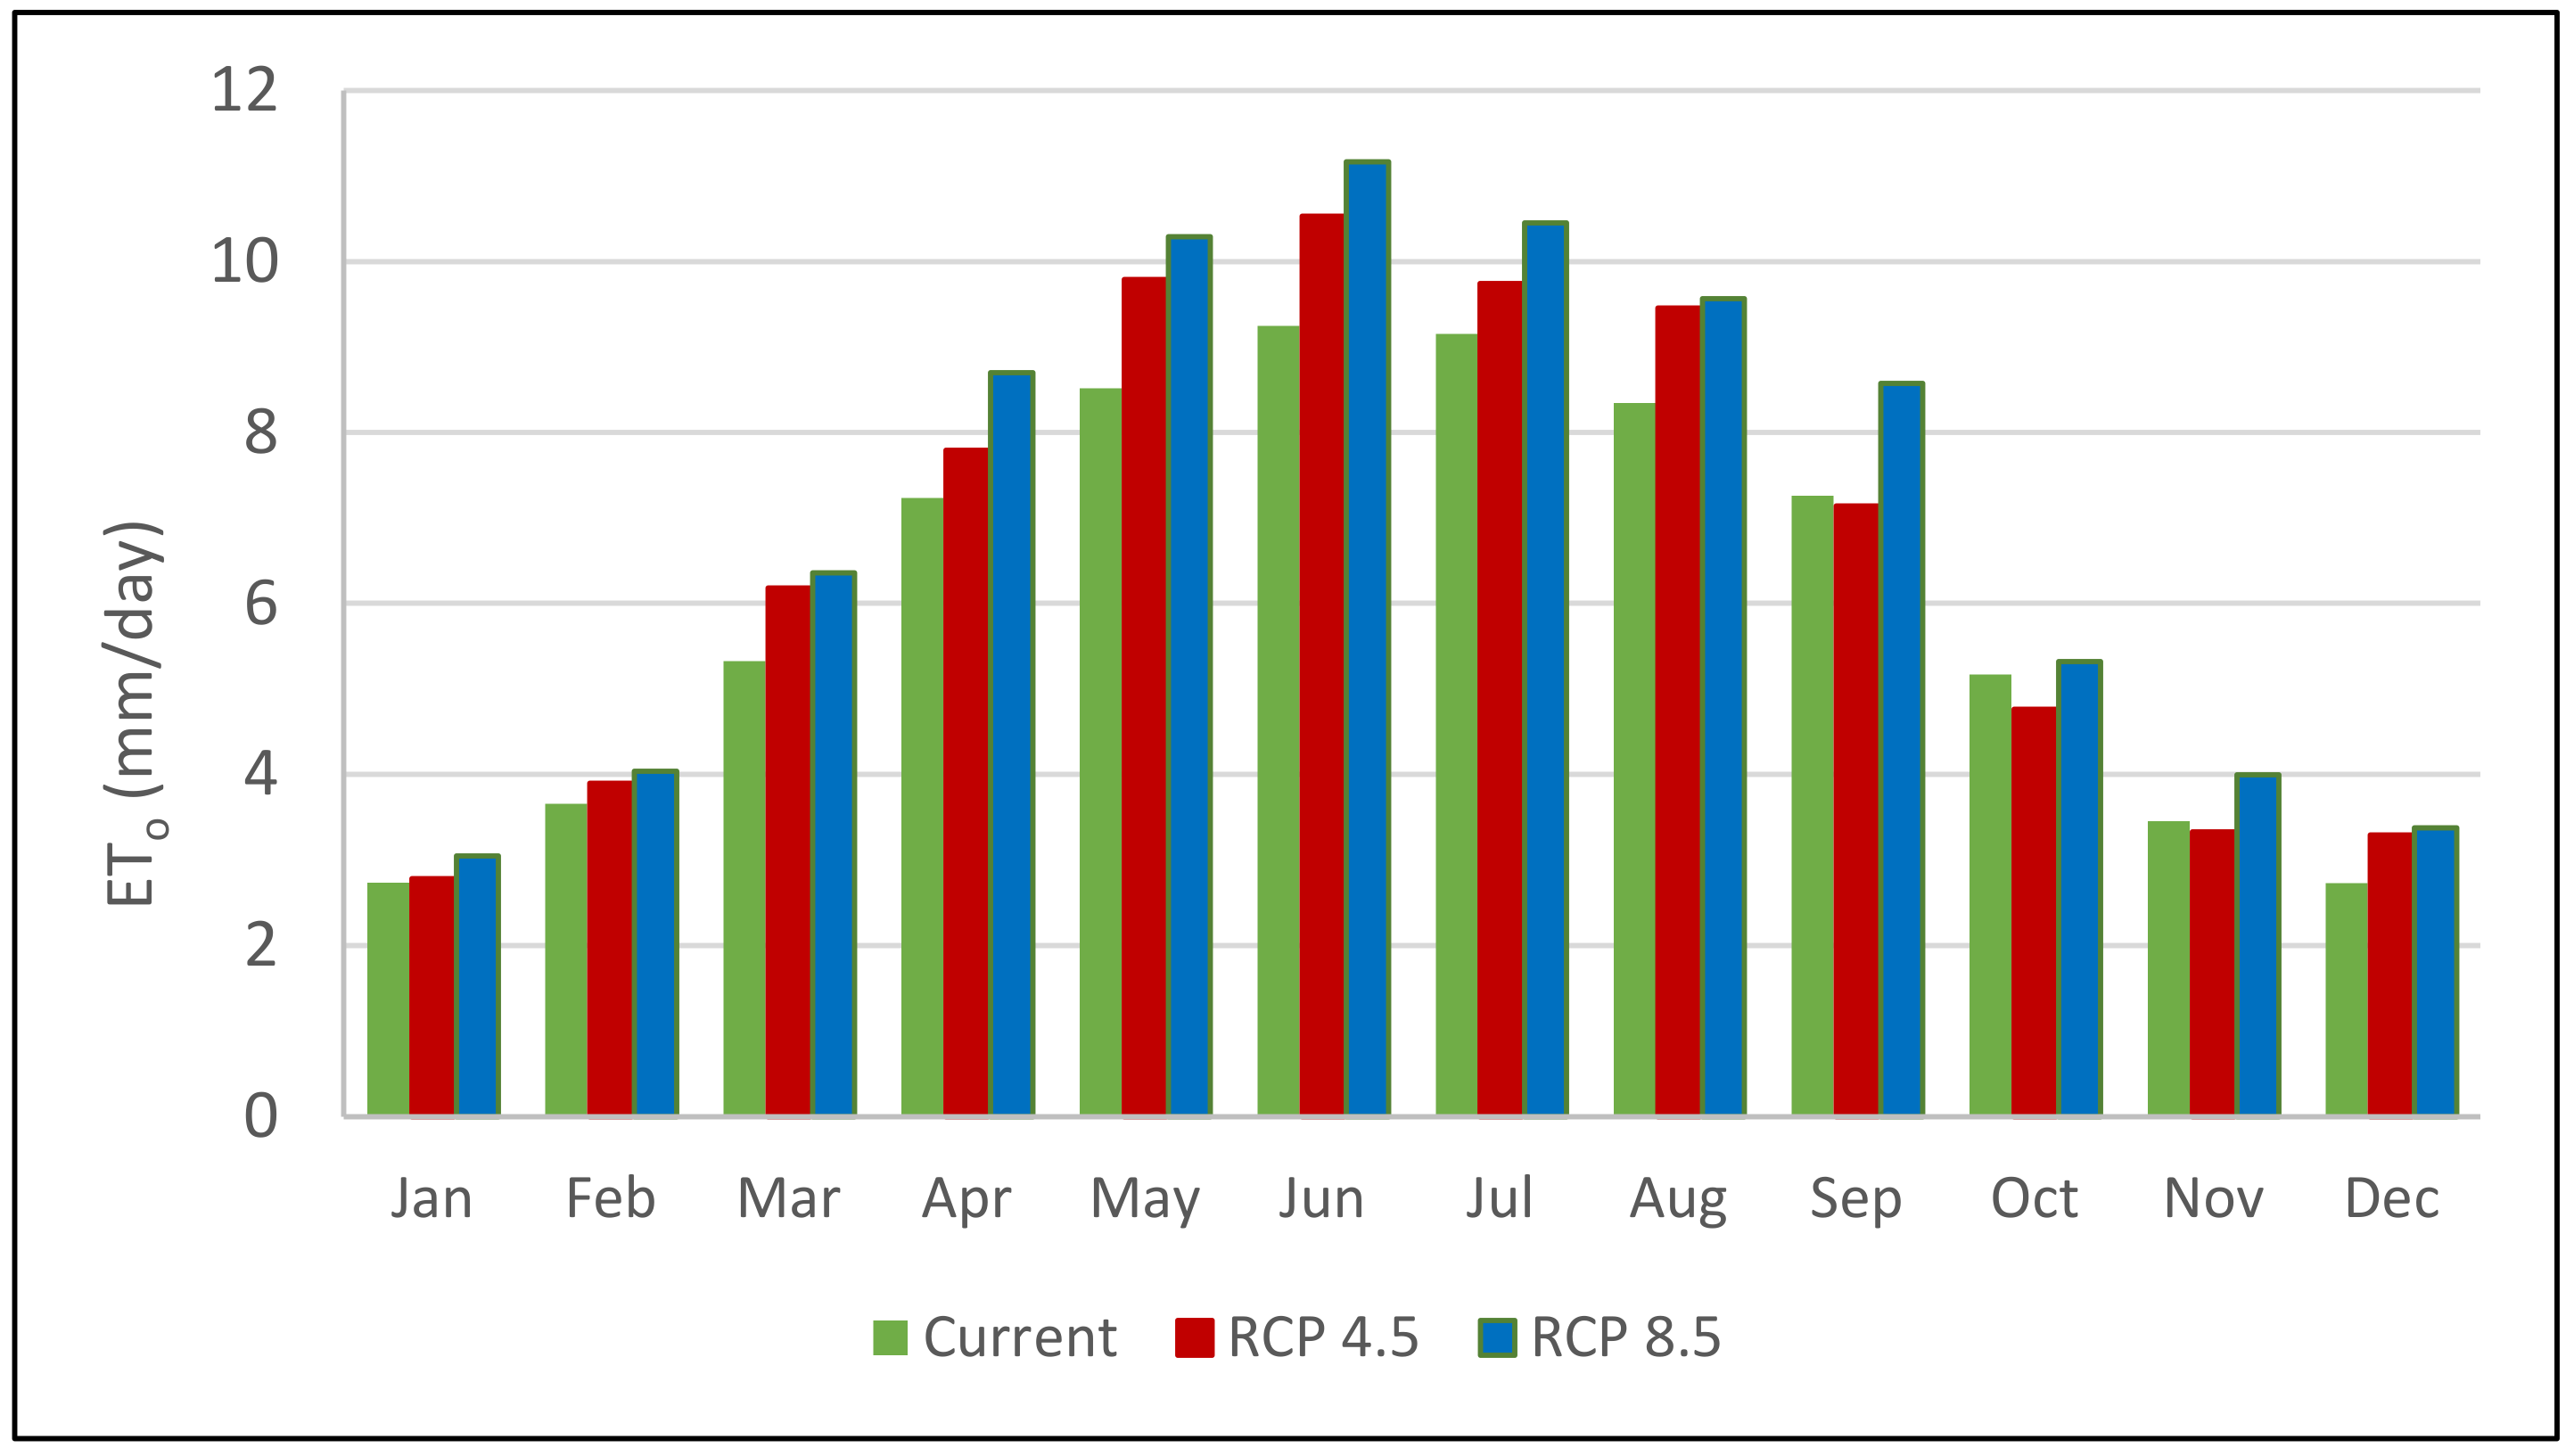
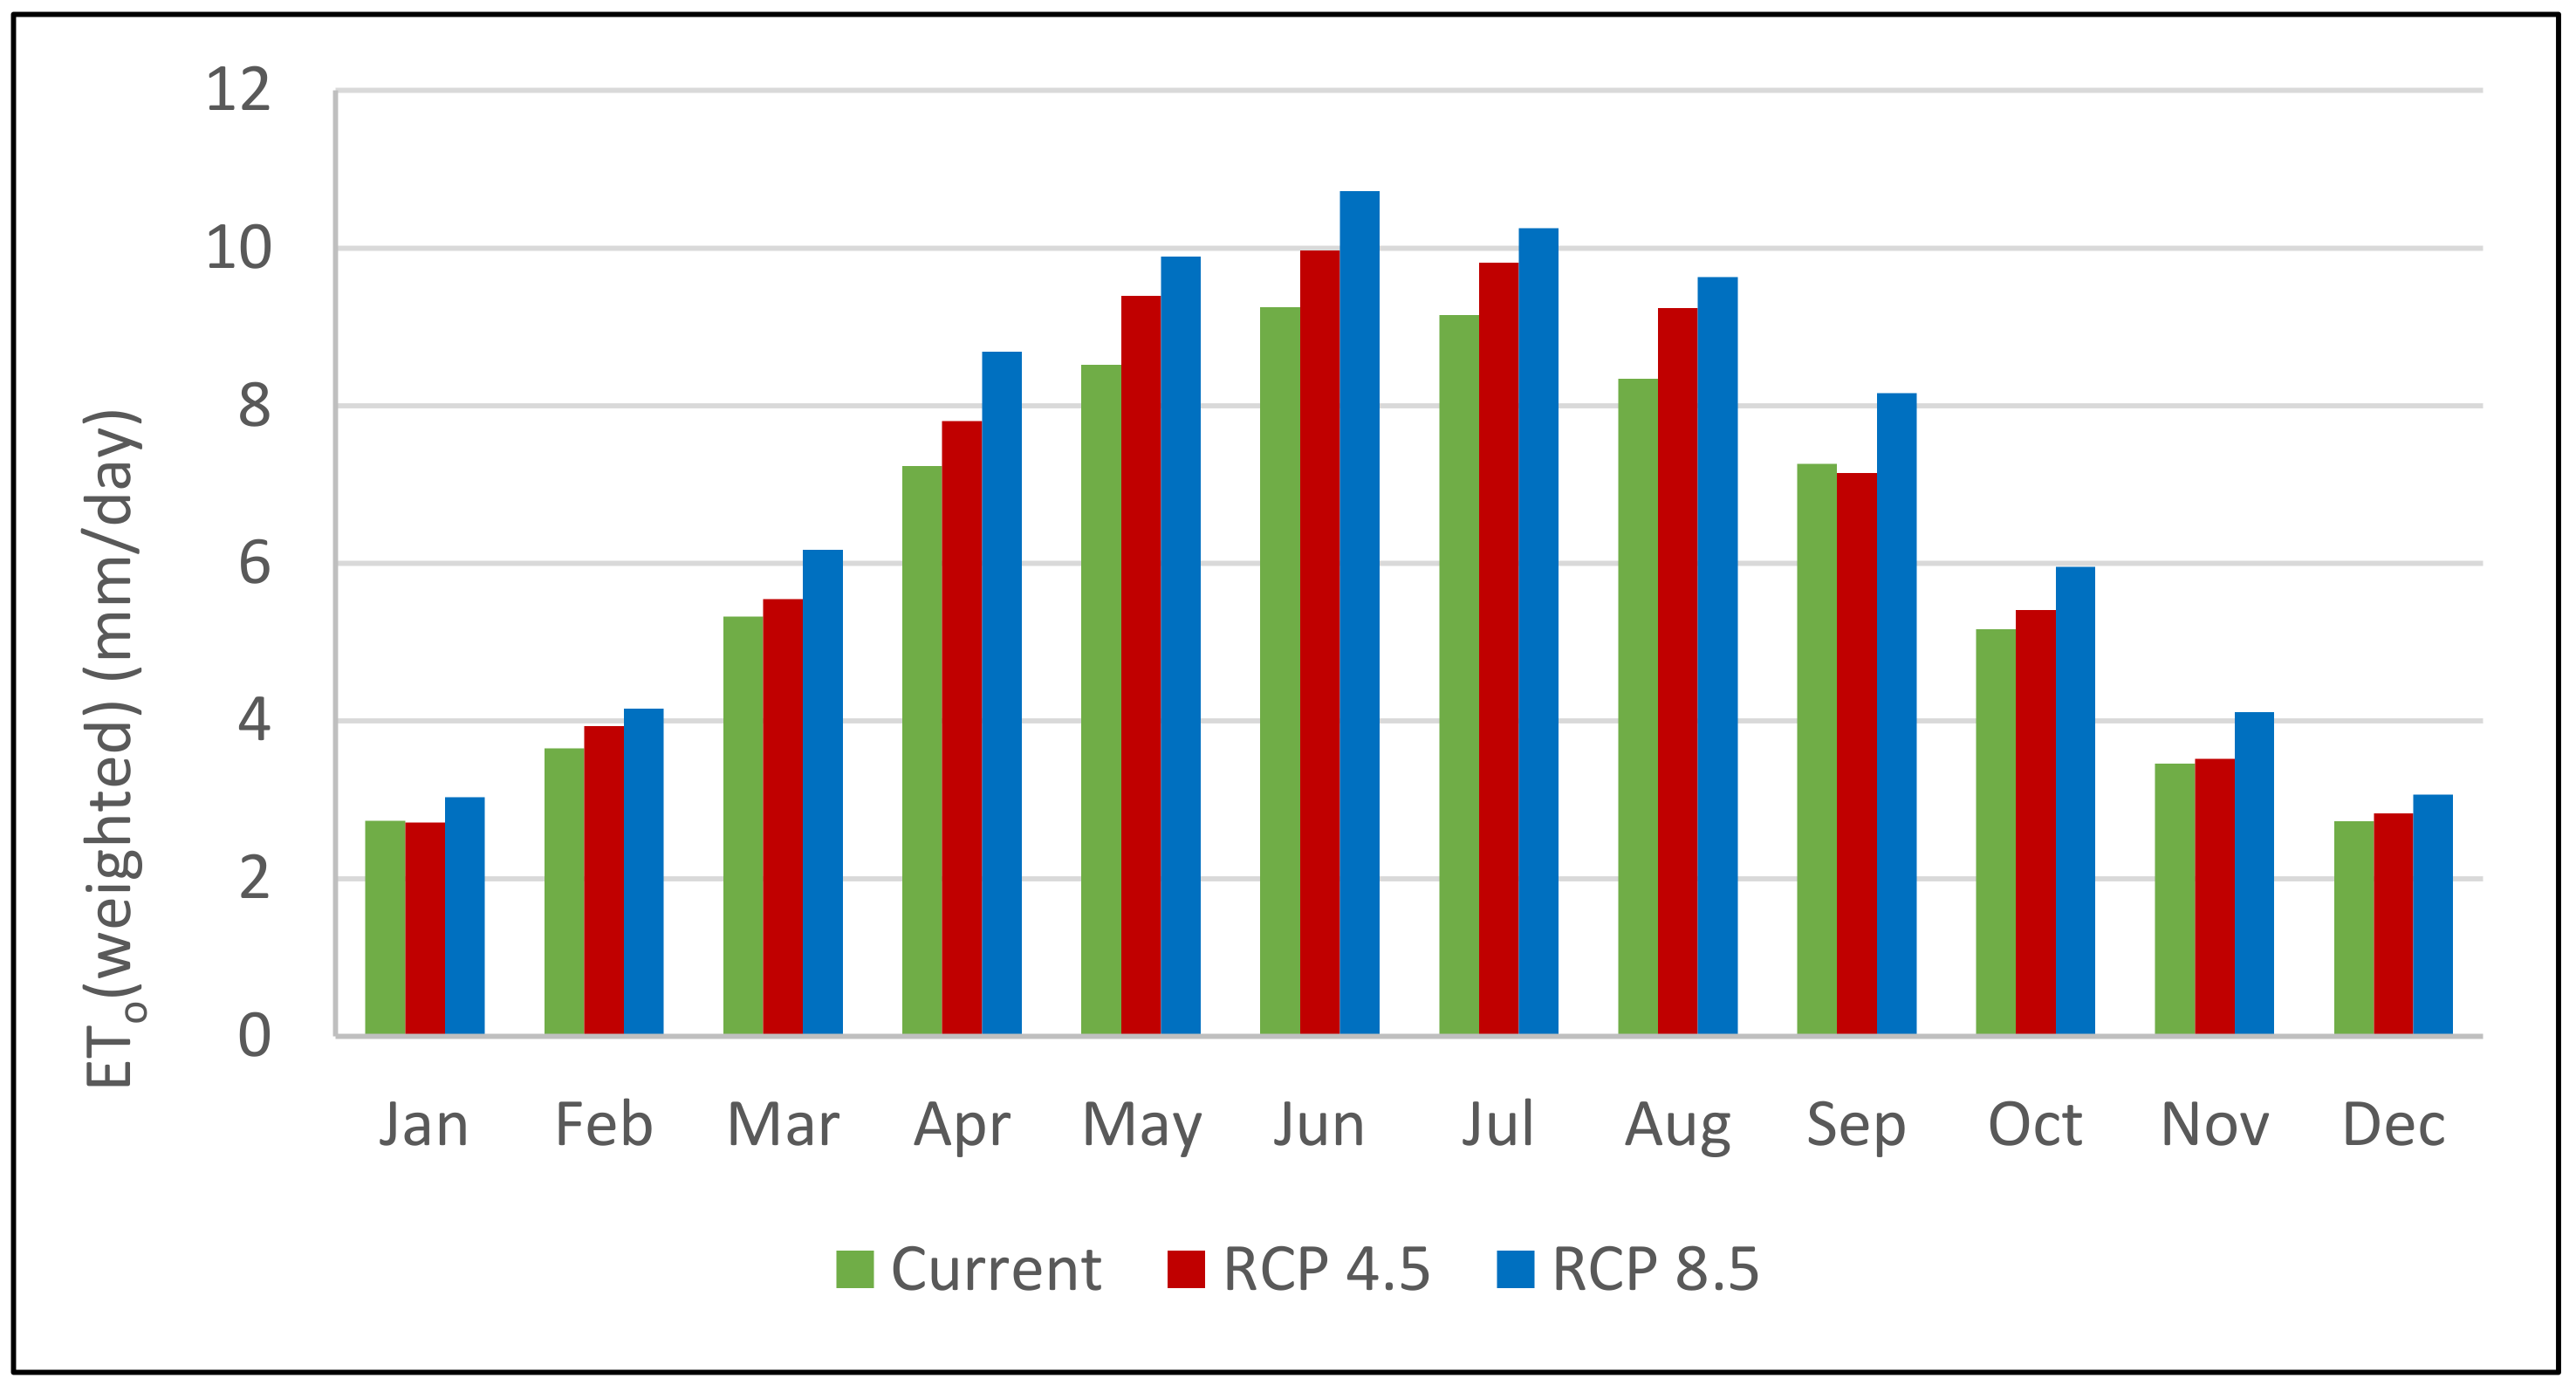
16] studied reference evapotranspiration (ETo) over time in Egypt using different RCPs; RCP 2.6, RCP 4.5, RCP 6, and RCP 8.5 for three time periods; 2011–2040, 2041–2070, and 2071–2100. The comparison between the results and observed data from 1971 to 2000 showed that ETo can increase in the Delta region by about 5% to 20.1%, while 4.7% to 19.6% in the Middle of Egypt. The increase of ETo in the South of Egypt can be between 11% and 26.8%.
This study addressed the practical concerns of developing new and sustainable agricultural practices in Siwa considering the impact of climate change on agriculture productivity and crop water requirement in this century. Thereafter, we can investigate if the government goals of increasing agricultural production and population resettlement are achievable by the end of this century. An optimization analysis was conducted to maximize crop production using the available capacity in Siwa. The methodology developed in this study is a useful guide for analyzing and assessing the development potential of other areas of the Western Desert in Egypt.

2. Study Area Description and Data

The Siwa region is a natural depression with an area of 0.28 million acres located in the northwest of the Western Desert in Egypt as shown in Figure 1. The region is unique because it is a closed basin where groundwater is the only source of water with no recharge given the prevailing arid conditions. A closed basin such as Siwa with only groundwater available from ancient times is not common in most parts of the world and, therefore, a study of sustainable water management practices considering both food demand and available land and water capacities is very much warranted. The climate is semiarid where rainfall is almost negligible [17]. The development project in Siwa of 30,000 acres will depend on groundwater from the NAS due to high groundwater quality.
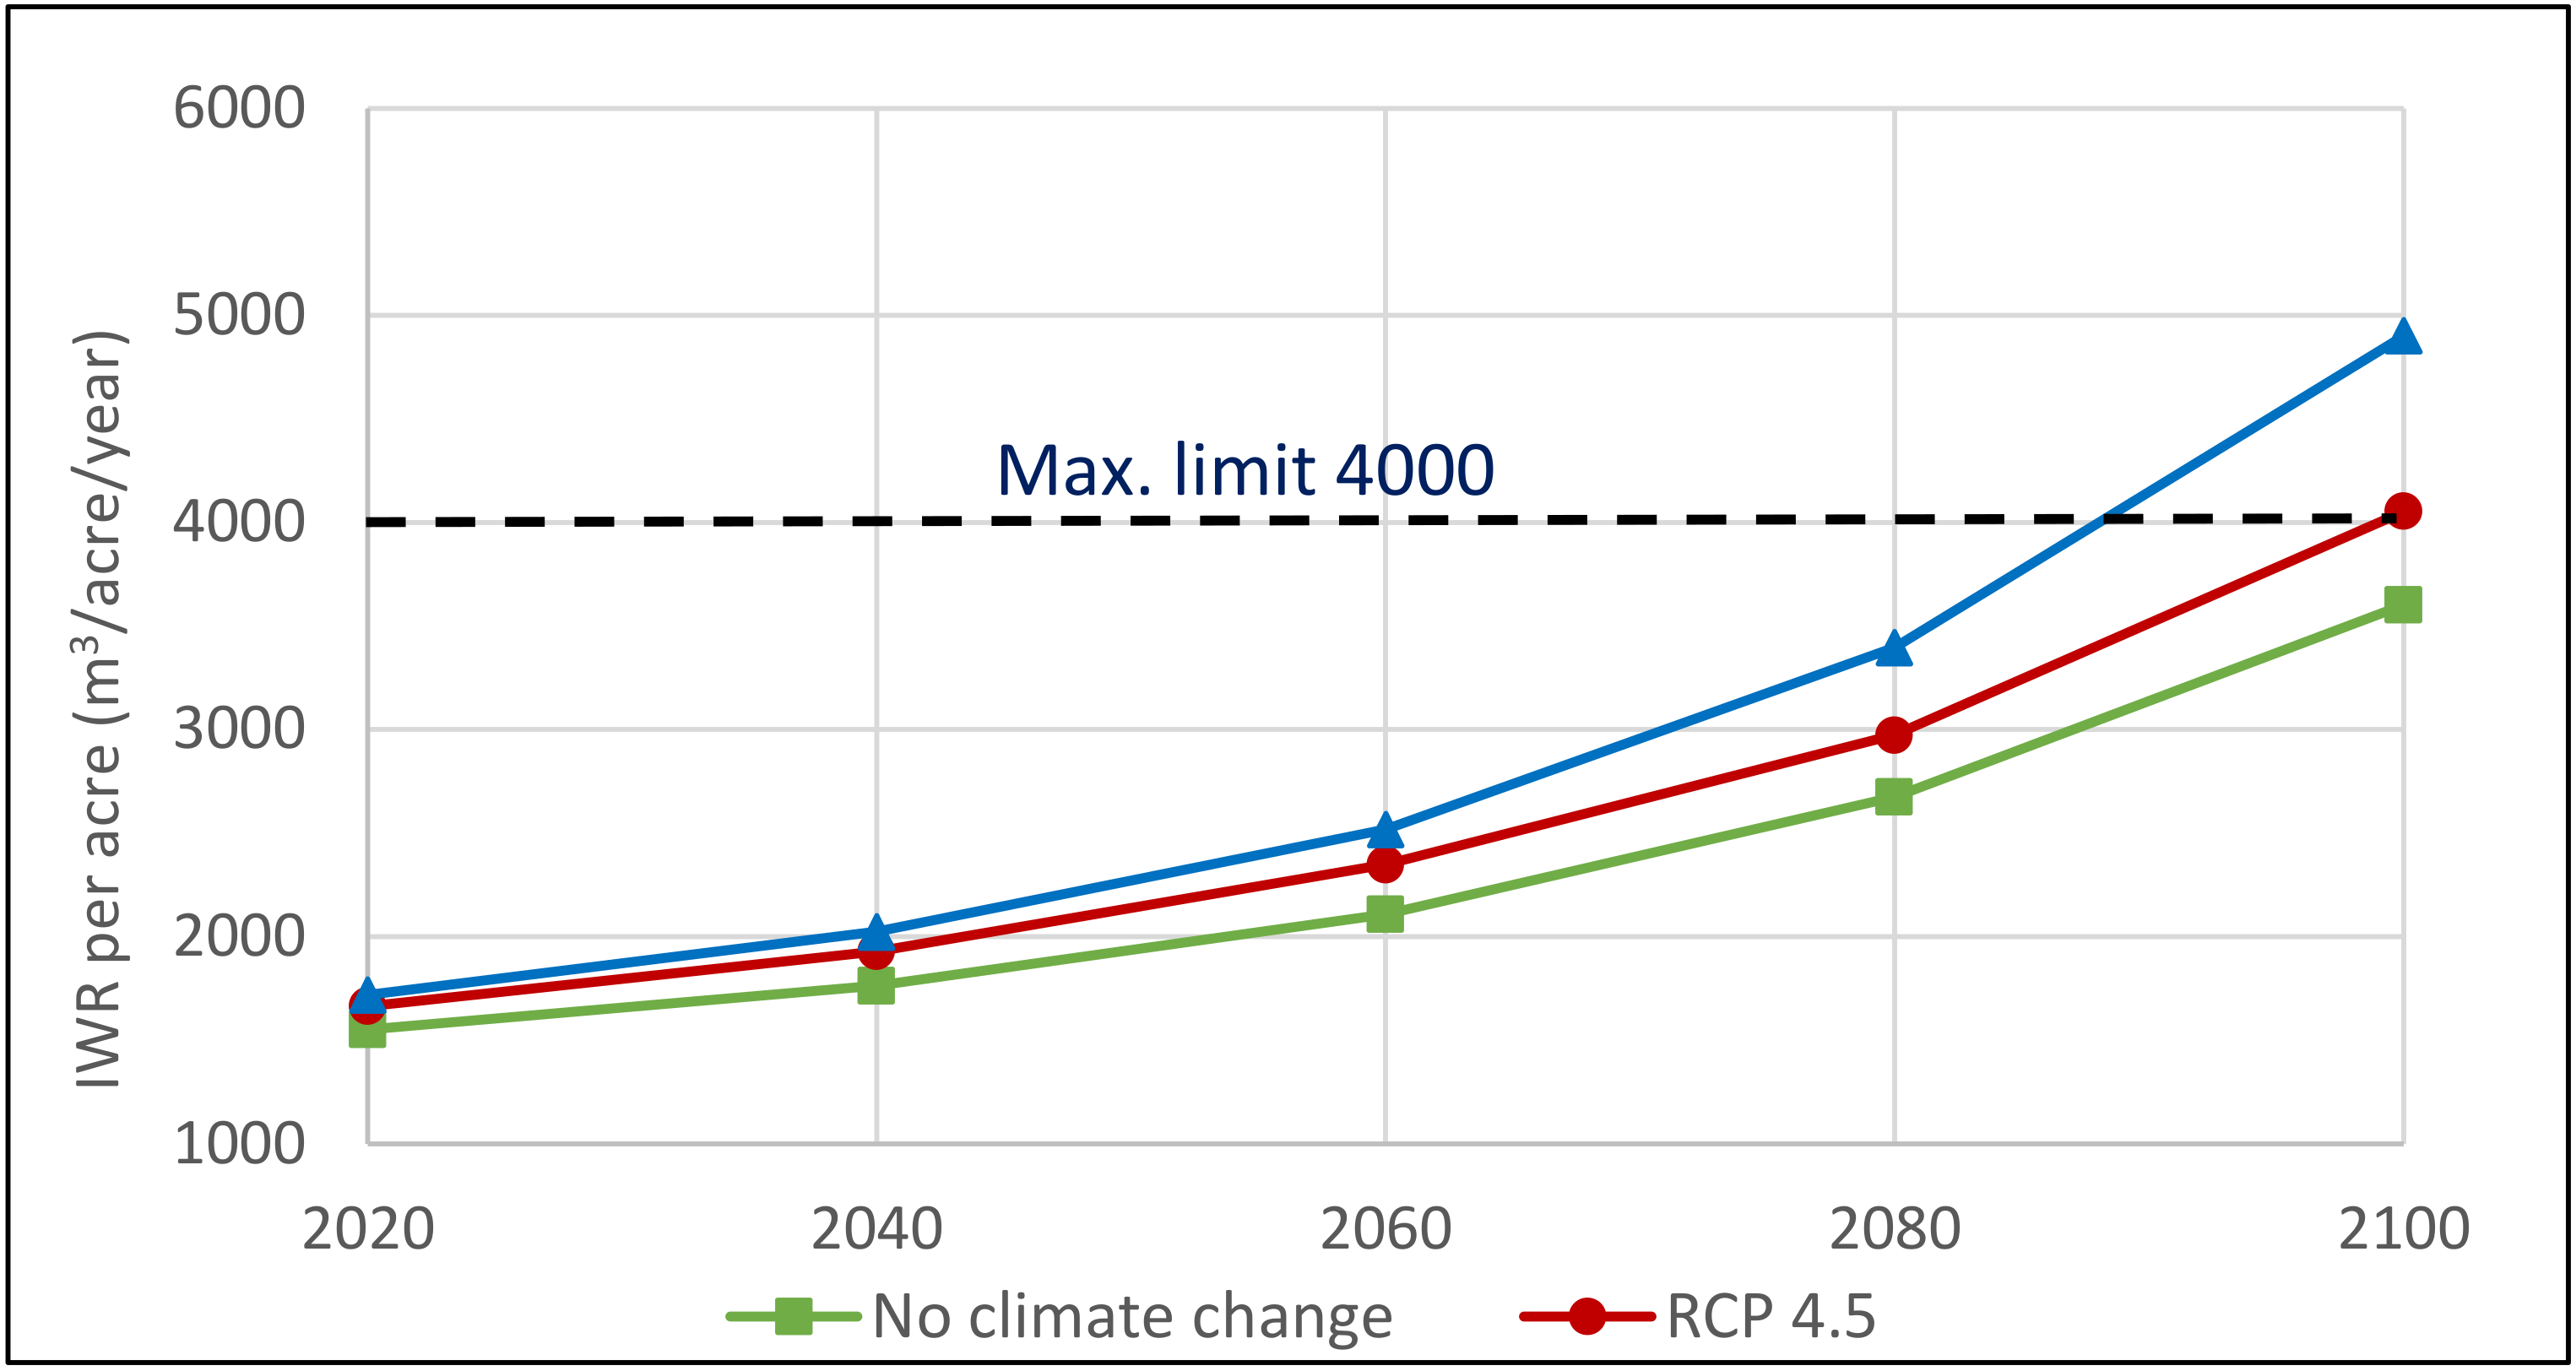
This study followed the proposed government policies to avoid significant depletion of NSAS and to ensure sustainability of the aquifer for future generations. The Ministry of Water Resources and Irrigation (MWRI) has restricted policies about prioritizing water consumption, where some of these policies are related to the maximum discharge rate of each well, maximum daily working hours per pump, spacing between wells, and maximum allowable crop water use, which is estimated to be 4000 m3/acre/year [18]. The Research Institute for Groundwater (RIGW) of Egypt provided recommendations to extend the use of the non-renewable NSAS until the end of this century. Accordingly, the government policies on maximum annual groundwater withdrawal from the PNA and the NAS are 60 and 88 million cubic meters (MCM), respectively [19]. The Ministry of Agriculture and Land Reclamation (MALR) suggested the land distribution to be 70% for seasonal crops and the remaining for permanent crops [20].

2.1. Collected Data

Recent studies predicted a negative impact of increase in temperatures on crop yield as shown in Table 1. Kheir et al. [21] studied the impacts on wheat in the North coast of Egypt while Hassanein and Medany [22] predicted maize yield under different climatic conditions in Egypt. EL-Mansoury and Saleh [23] assessed the impact of climate change on broad bean in the North Nile Delta. Calzadilla et al. [24] provided data about the response of crop yield to changes in temperature of 2 °C and 4 °C using crop types C3 and C4, and the location. As barley is considered a C3 crop, which is a type that is highly affected by temperature, results related to North Africa are used. Eid et al. [25] found that an increase in temperature of 2 °C can decrease barely yield by 20% in Egypt, which is in agreement with Calzadilla et al. [24]. Knezević et al. [26] investigated the possible impact of climate change on olives production through nine stations in Montenegro, Europe. Results related to the northern stations are shown in Table 1 given their similar climatic conditions as in Egypt. Ponti et al. [27] studied the effect of climate change on olives in different sub-regions of the Mediterranean basin. Their results showed that with an increase in temperature of 1.8 °C from 2041 to 2050, the yield of olives in Egypt can decrease by 9.4%, which is compatible with the results of Knezević et al. [26]. Due to the limited data about date palm, it is assumed that the reduction in date palm yield due to the increase in temperature is the same as oil palm. As a result, the study made by Sarkar et al. [28] is used where they assessed the relationship between climate change and oil palm production using multiple regression in Malaysia. Finally, the results provided in Table 1 are used here to define the linear relationship between the increase in temperature and crop yield over time.

2.2. Climate Change Models

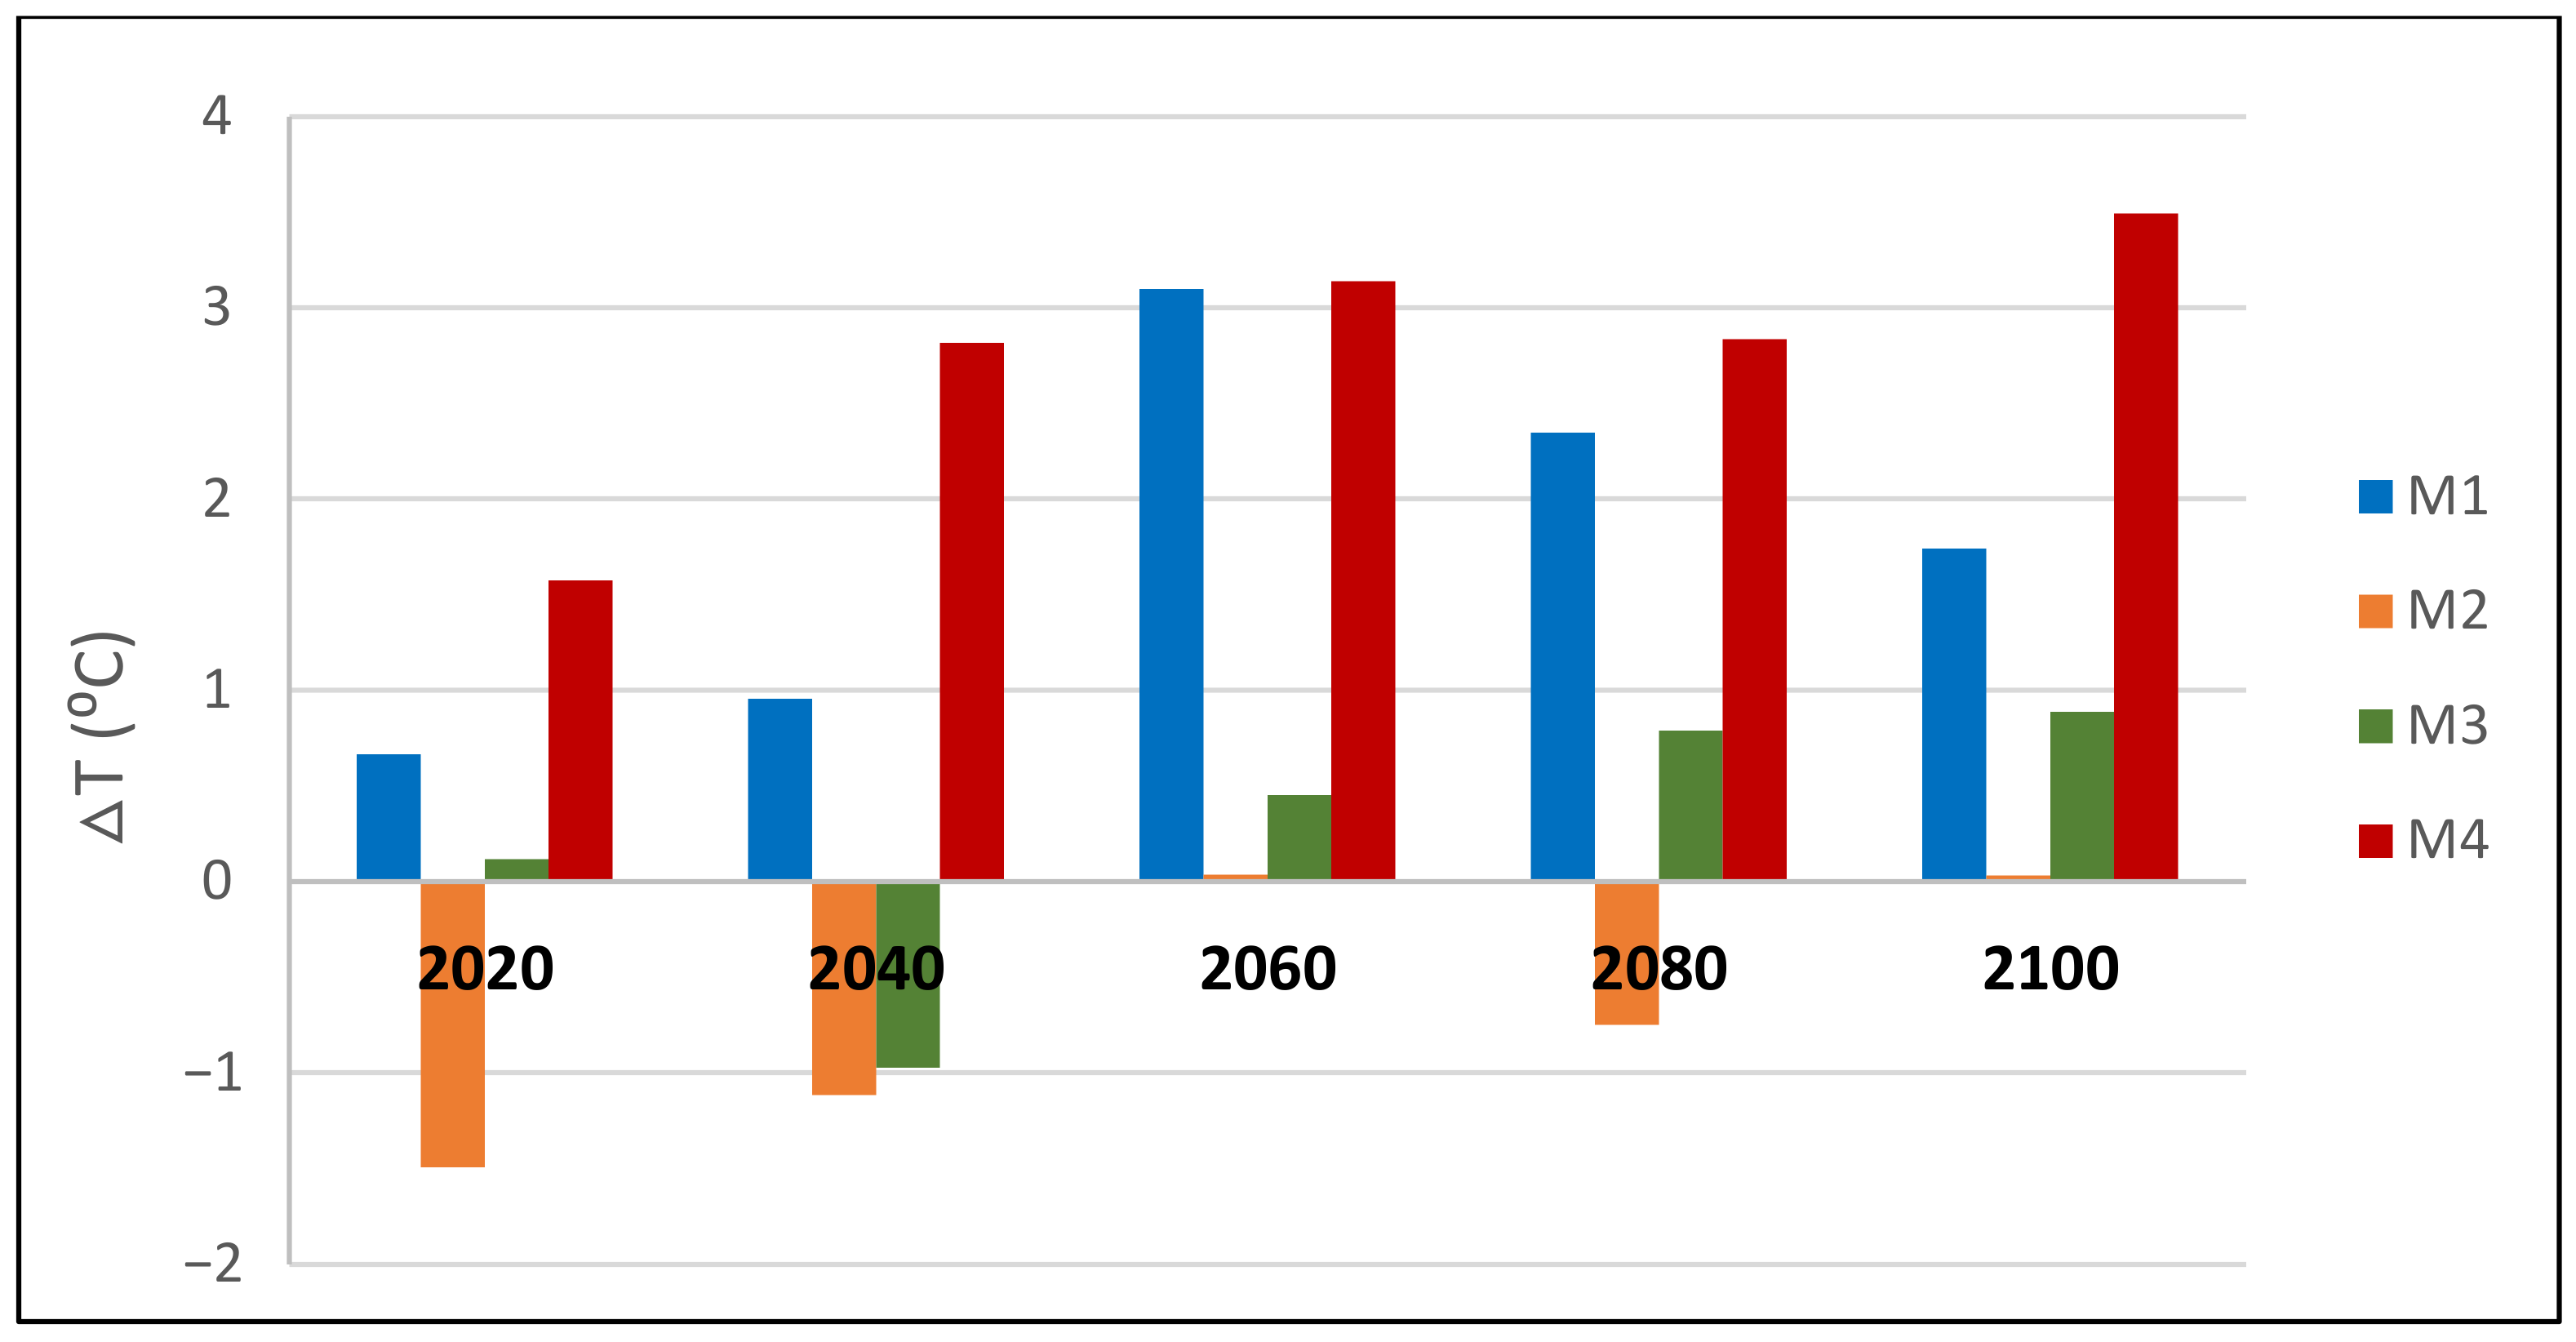
This study used two RCMs: the Rossby Centre regional climate model (RCA4) and the Regional Atmospheric Climate Model (RACMO22T). RCA4 is developed at the Swedish Meteorological and Hydrological Institute (SHMI) and considered three downscaled GCMs; the Centre National de Recherches Météorologiques (CNRM-CM5), the EC-EARTH consortium (EC-EARTH), and the Max Planck Institute for Meteorology (MPI-ESM-LR). RACMO22T is developed at the Koninklijk Netherlands Meteorological Institute (KNWI) and linked to the downscaled EC-EARTH model. Table 2 shows the combinations of these four climate models. The selection of these combinations depends on the availability of four meteorological data: Maximum temperature (Tmax), minimum temperature (Tmin), relative humidity (RH), and wind speed (U) for the historical climate condition and future climate projection under RCP 4.5 and RCP 8.5. Daily meteorological data are downloaded using CORDEX-Africa domain (AFR-44) with a spatial resolution of 0.44° by 0.44° (approximately 50 km by 50 km) (http://www.cordex.org/domains/region-5-africa/ accessed January 2020) for years; 2020, 2040, 2060, 2080, and 2100. Data were downloaded in NetCDF format and Grid Analysis and Display System (GrADS) software (http://opengrads.org/) was used in the analysis.

3. Methodology

3.1. Reference Evapotranspiration (ETo)

The United Nations Food and Agriculture Organization (FAO) Penman–Monteith equation is applied to project ETo (mm/day) using the four meteorological data mentioned earlier. As a result, crop evapotranspiration (ETc) (mm/day) can be calculated [29]. Details about ETo and ETc calculations for different cultivated crops in Siwa region are provided by Moghazy and Kaluarachchi [30]. Thereafter, crop water requirement (CWR) (m3/acre/year) can be calculated which is a function of the projected ETc, irrigation efficiency, and leaching requirements [31].
After downloading the daily meteorological data using the four climate models, a bootstrap technique is applied for monthly data for resampling with replacement of 10,000 runs. Thereafter, the new values of daily meteorological data are used to estimate ETo for each model. However, different climate models produce uncertainty, therefore, to evaluate the performance of these models, long-term average monthly historical ETo values from 1981 to 2005 are compared with observed values using root mean squared error (RMSE) as follows:
RMSE   =   1 U   i = 1 U ( E i E ^ i ) 2
where E i and E ^ i represent historical and observed ETo values, respectively, for the long-term average of month i, and U is the number of months. The observed data in the Siwa region were downloaded from the National Centers for Environmental Prediction (https://globalweather.tamu.edu/).
To estimate ETo using the accuracy of each climate model, a weighted model is developed and used. ETo is a function of Tmax, Tmin, RH, and U, therefore, the uncertainty of ETo is a combination of errors from these variables. Monthly uncertainty of ETo for each model ( δ ET o M ) is computed using an error propagation method as shown in Equation (2) using the work of Askari et al. [32].
δ ET o M = ET o T max   δ T max M 2 + ET o T min   δ T min M 2 + ET o RH   δ RH M 2 + ET o W   δ W M 2
where ET o T max , ET o T min , ET o RH , and ET o W are partial derivative of ETo with respect to Tmax, Tmin, RH, and W, respectively, M is order of the climate model (see Table 2), and δ T max M , δ T min M , δ RH M , and δ W M are monthly errors of these variables when comparing historical data of each model (M) with observed data from 1981 to 2005. δ ET o M values are inversely weighted to determine the accuracy of each model. Therefore, a monthly weighted ETo model (ETo (weighted)) is calculated as follows:
ET o weighted   =   1 M ET o M * W M 100
where ETo(M) is monthly predicted ETo of model M (mm/day), and W is weight of model M (%). As a result, the corresponding water requirement of cultivated crops is projected until 2100 and compared with the current requirements from 2000 to 2017 to explore the need for adaptation actions due to climate change.

3.2. Projection of Temperature and Crop Yield

The resampled values of Tmax and Tmin are used to project the trend of future temperature. To study the impact of temperature on crop yield, seasonal average temperature (Tavg) of the primary growing seasons of summer and winter is used. The winter season is from October to April for wheat, barley, and broad bean while the summer season is from May to September for soybean, maize, and cotton, etc. [33].
Seasonal Tavg is compared with observed values from 2000 to 2017 to determine the changes in temperatures for each season (ΔT) using the four climate models for years: 2020, 2040, 2060, 2080, and 2100. To account for uncertainty, the mean of ΔT values is used with 95% confidence intervals (CI).
To identify the relationship between increase in temperature and crop yield, the following linear regression equation is used with data presented earlier:
CY = a + b * ΔT + e
where CY is change in crop yield (%), a and b are constants, and e is error. As a result, crop yields until 2100 can be projected under different emission scenarios. Results are considered significant when two-sided p-value < 0.025. R software version 3.6.1 was used (https://www.r-project.org/).

3.3. Projected Crop Area and Water Requirements

The goal of this study is to investigate if the government’s goals of increasing agricultural areas and population resettlements from the already over-populated Delta region are achievable this century. Therefore, crop area and total water requirements for population and livestock are estimated then compared with available land and groundwater in the Siwa region. The assumptions made by Moghazy and Kaluarachchi [31] on population and livestock at the beginning of the proposed project in 2020 are used in this study where the annual growth rate of population is 2.5% [1].
Although there are 30,000 acres available in the Siwa region, stipulated government policies are considered in the estimation of actual available land for cultivation (AV) per details of Moghazy and Kaluarachchi [31]. This study used the land distribution suggested by Moghazy and Kaluarachchi [31] to maximize the production of strategic crops in Siwa where seasonal crops cover 80% of AV and consist of wheat, barley, and broad bean in the winter, and maize in the summer as sources of strategic crops to cover crop deficit in Egypt. The remaining 20% of AV is for permanent crops such as olives and date palm, which are the sources of rural income. To calculate the area of strategic crops needed to satisfy population consumption annually, Equation (5) is used.
Crop   area   ( acres )   =   N * Crop   Consumption   kg / capita / year 1000 * Crop   Yield   tons / acre
where N is population, and crop consumptions are 143.2, 0.3, 7.8, and 62 kg/capita/year for wheat, barley, broad bean, and maize, respectively [34]. These values are assumed to remain the same in the future. Crop yield depends on the projected temperature under each emission scenario. The area of strategic crops required for livestock feeds as concentrate feeds and roughage feeds is calculated per Moghazy and Kaluarachchi [31]. For permanent crops, olives and date palm are assumed to cover the area equally. As a result, the total required crop area in winter or summer season can be estimated then compared with AV to assess land availability.
Total water requirement is the summation of irrigation water requirement (IWR), industrial water requirement, and water requirement for population and livestock. Industrial water requirement is neglected because this project is primarily focused on reclamation and rural development. Current domestic water requirement is 250 L/capita/day [35], and water requirement for sheep, goats, and chickens is 10, 10, 0.3 L/head/day, respectively [36,37]. Both domestic and livestock water requirements are assumed to remain constant. IWR of crops is the summation of CWR multiplied by the area of each crop. As a result, total water requirement can be estimated over time and compared with 88 MCM of allowable annual groundwater extraction from the NAS. When IWR is divided by Av, the value of IWR per acre can be compared with the allowable crop water use of 4000 m3/acre/year to determine if government policy is satisfied.

3.4. Optimization Analysis

Optimization is a method used for optimal allocation of available resources based on an objective with specific constraints. Commonly used optimization methods are linear programming (LP), nonlinear programming, dynamic programming, integer programming, binary programming, etc. [38]. LP is one of the best and most simple techniques [39] that helps decision-makers in water resources planning and management. In this work, LP is used because the mathematical formulation of the proposed optimization problem described here is linear and therefore easily represented by a LP problem. The goal of optimization is to find opportunities to maximize strategic crop production through the most appropriate cropping pattern subject to a given set of constraints. Moghazy and Kaluarachchi [31] suggested different scenarios to maximize crop production in Siwa. This study used one scenario from this earlier study to maximize the production of strategic crops as a part of government goals. This scenario increases the area of strategic crops to 80% of AV instead of 70% while relaxing the crop water use constraint. Therefore, the objective function and constraints are as follows:
Max   P   =   i = 1 n Y i * A i   ( i   =   1 ,   2 ,   . ,   n )
where P is total crop production (tons), n is number of crops, Y i is yield of crop i (tons/acre), and A i is area of crop i (acres).
For land availability, an additional constraint is added where olives and date palm cover the area of permanent crops equally to control date palm cultivation given high water requirement.
i = 1 w A i     80 %   Av
where w is number of seasonal crops in winter, which are wheat, barley, and broad bean.
i = 1 s A i     80 %   Av
where s is number of seasonal crops in, summer which is maize.
A o     10 %   Av
A d     10 %   Av
where A o and A d are the areas of olives and date palm (acres), respectively.
For crop production, the total production of strategic crops should satisfy the total requirement of population and livestock.
Y j * A j   CP j *   N   +   k = 1 2 CL jk * L k
where Y j is yield of strategic crop j (tons/acre), j is number of strategic crops (wheat, barley, broad bean, and maize), A j is area of strategic crop j needed for population and livestock (acres), CP j is annual consumption of strategic crop j per capita (ton/capita/year), k is number of livestock categories (sheep and goats), CL jk is consumption of strategic crop j for each category k (ton/head/year), and L k is number of heads in each category k.
In addition, total water requirement should be less than the available groundwater from the NAS.
i = 1 n CWR i * A i   +   Population   and   livestock   water   requirement     88   MCM / year
where CWR i is water requirement of crop i (m3/acre/year).
In this work, optimization is used in the year 2100 as it represents the worst period of this century and analysis is conducted for each emission scenario. The reason is to assess whether crop and water requirements are sustainable across all years as sought by the government. The LP model was applied using General Algebraic Modeling Systems (GAMS; http://www.gams.com/).

4. Results and Discussion

4.1. Projected Temperature

Annual Tmax is projected using the four climate models (see Table 2) under different emission scenarios as shown in Figure 2. Results show the fluctuations of Tmax over time under RCP 4.5 where median is the highest at 30 °C in 2060 then decreased to 29.5 °C in 2100. This is compatible with the expectations of RCP 4.5 where greenhouse gas emissions are expected to be controlled before 2100.
However, median values are increasing gradually until 2100 under RCP 8.5 with a maximum value of 32 °C. These increases in temperatures are expected due to the continuous increase of GHG. The same is observed with projected Tmin where the median has a maximum of 15 °C in 2080 and 18 °C in 2100 under RCP 4.5 and RCP 8.5, respectively.
Predicted Tavg in summer using the four models under RCP 4.5 is compared with observed values and the corresponding Δ T values are shown in Figure 3. It shows that Models 1 and 4 (see Table 2) have positive values of Δ T until 2100 while the other models show a decrease in temperature in some years. The same comparison was done for winter, and under RCP 8.5. Results show that at the end of this century, Δ T values in summer range from 0.03 to 3.49 °C and 2.4 to 6.9 °C under RCP 4.5 and RCP 8.5, respectively. In the winter, these values range from −0.2 to 1.5 °C and 1.9 to 3.1 °C, respectively.
Due to the uncertainty in seasonal ΔT values, the mean is used to study the impact of climate change on crop yield, which is discussed later. Table 3 shows the mean of ΔT with 95% CI for each season over time under both emission scenarios. Results show that the maximum increase in temperature in summer is 1.68 ± 1.64 °C in 2060 and 4.65 ± 1.82 °C in 2100 under RCP 4.5 and RCP 8.5, respectively. In winter, these values are 0.66 ± 0.74 °C in 2060 and 2.51 ± 0.47 °C in 2100, respectively.

Impact of Temperature on Crop Yield

A linear distribution between increase in temperature and change in crop yield is developed and presented in Table 4. Results show that the intercept values for all crops are significant except for wheat and date palm where p-values are more than 0.025. Slope values for all crops are significant. As a result, the projected values of crop yields can be calculated as shown in Table 5. Results show that the maximum reduction in yields of wheat, barley, broad bean, and maize are 2.9%, 9.2%, 0, and 12.8%, respectively, in 2060 under RCP 4.5, while these values under RCP 8.5 are 10.4%, 20.4%, 22.6%, and 27.4%, respectively, at the end of this century. It is clear that the most affected strategic crop is maize due to the high increase of temperatures in summer.

4.2. Predicted ETo

ETo is predicted using the resampled daily meteorological data for each climate model. Figure 4 shows the comparison between the current ETo values and the median values for each month using Model 1 in 2100 under different emission scenarios. Results show that a minimum of 2.79 mm/day and a maximum of 10.53 mm/day can happen in January and June, respectively under RCP 4.5, which are higher than the current values of 2.73 and 9.25 mm/day, respectively. With RCP 8.5, these values are 3.05 mm/day and 11.17 mm/day, respectively with an increase of more than 6% compared to RCP 4.5. Similar comparisons were conducted with other models in different years. As expected, ETo is showing uncertainty among the four climate models as shown in Figure 5 for monthly ETo in 2100 under RCP 4.5. To evaluate the performance of these models given this uncertainty, RMSE is calculated using Equation (1) and the results are shown in Table 6 demonstrating that Model 1 is the best to use while model 2 is the worst. Table 7 shows the accuracy of each model to determine monthly ETo using an error propagation method described in Equation (2). Results indicate that Model 1 is not always the best model, as Models 3 and 4 have also better accuracy in some months. The advantage of using multiple climate models is that uncertainty produced by each model can be used to develop an appropriate weighted model for future use. As a result, a monthly weighted model is used to calculate ETo (weighted) using Equation (3). RMSE for this weighted model is 0.259, which is better than 0.278 produced by Model 1. Thereafter, ETo (weighted) can be calculated in the future using the accuracy of each model (see Table 7). Figure 6 shows ETo (weighted) in 2100 under RCP 4.5 and RCP 8.5 where the highest values are in June of 9.97 and 10.72 mm/day, respectively.
Using the calculated values of ETo (weighted), CWR in this century can be projected as shown in Table 8. Results show that the maximum water requirement of crops is 26,786 m3/acre in 2040 under RCP 4.5 while it is 29,279 m3/acre in 2100 under RCP 8.5. Annual water requirement of crops is compared with the current requirement of 24,771 m3/acre and the results show that the increase over time ranges from 6% to 8.1% under RCP 4.5, while it is 9.7% to 18.2% under RCP 8.5 as shown in Table 8.

4.3. Estimated Crop Area and Total Water Requirements

Population and livestock data are calculated to estimate future requirements of crop area and water. Accordingly, population in 2020 of 16,460 is projected to be 118,669 by 2100. Similarly for livestock of sheep, goats, and chickens are expected to increase from 3129, 4864, and 125,096, respectively in 2020 to be 22,555, 35,062, and 901,889, respectively in 2100. AV is determined by Moghazy and Kaluarachchi [31], which is 17,010 acres and consistent with government policies. Population and livestock consumption of strategic crops over time is calculated and Table 9 and Table 10 show crop area for years 2020, 2040, 2060, 2080, and 2100 under both emission scenarios. Results show that the required areas of wheat, barley, broad bean, and maize in 2100 under RCP 4.5 are 6846, 928, 1570, and 3809 acres, respectively. However, these areas increased by 8.9%, 14.5%, 29.5%, and 21%, respectively, under RCP 8.5 due to the impact of temperature increase on crop yield. Results also show that the total cultivated areas in winter or summer are less than AV of 17,010 acres through all years. Total water requirement (m3/year) is estimated over time as shown in Table 9 and Table 10 where the projected values are 80.1 and 94.5 MCM in 2100 under RCP 4.5 and RCP 8.5, respectively. Figure 7 shows the corresponding IWR per acre of 4000 and 4900 m3/acre under RCP 4.5 and RCP 8.5, respectively, in 2100 where 4900 m3/acre is more than the government limit of 4000 m3/acre/year. Results show that under RCP 4.5 government goals of this project are achievable until the end of this century where adequate land and groundwater are available in the Siwa region.
On the other hand, government goals under RCP 8.5 are satisfied until the 2080s only, while total water requirement exceeds available groundwater in the NAS of 88 MCM by 2100. As a result, changes to crop area distribution are required, for example decreases in the areas of olives or date palm, to satisfy population needs and be consistent with government policies. Figure 7 also shows the values of IWR per acre when neglecting the impact of climate change. These values are the lowest compared with RCP 4.5 and RCP 8.5 due to the higher crop water requirement under climate change and the impact of temperature increase on crop yield.
Required area of strategic crops is calculated disregarding the impact of climate change on crop yield then compared with values presented in Table 9 and Table 10. Figure 8 shows the possible future deficits to these areas where the deficit in maize is the largest compared to other crops due to the highest impact by temperature. Broad bean is not affected by climate change until 2080 under RCP 8.5. This figure shows that under RCP 4.5, there is no deficit in the areas of wheat and barley in 2040 due to the slight decrease in the predicted temperature in the winter season compared to the curent condition (see Table 3). Figure 8 also shows that the maximum deficits in the areas of wheat, barley, broad bean, and maize are 3.7%, 10%, 0, and 14.8%, respectively in 2060 under RCP 4.5. More significant deficits are exhibited in 2100 under RCP 8.5 with values of 13%, 26%, 29.5%, and 37.5%, respectively. These results clearly show while climate models have inherent uncertainty among their projections, there is a definite impact of climate change on agriculture productivity in Siwa. Therefore, climate change plays an important role in the decision-making of agriculture planning and management.

4.4. Optimization

As mentioned earlier, LP is used to identify the opportunities to maximize strategic crop production considering climate change impacts under both emission scenarios. Previous results showed that the development project in Siwa is achievable through this century under RCP 4.5 and not possible in 2100 under RCP 8.5 due to the proposed groundwater constraint of the government. As a result, LP is applied in 2100 under RCP 4.5. Since RCP 8.5 showed unsustainable development from 2080 through 2100, optimization is applied in 2080. Table 11 shows crop area that can be cultivated using the available land and groundwater under different emission scenarios. Results show that under RCP 4.5, the areas of strategic crops for wheat, barley, broad bean, and maize are 11,111, 928, 1570, and 3809 acres, which are adequate for population and livestock needs until 2100. However, these areas under RCP 8.5 are 11,980, 607, 1022, and 2518 acres, respectively until 2080. It is noticed that the area of olives does not occupy the 10% of AV to increase the area of strategic crops. LP shows that the total cultivated area in winter and summer can be increased to cover around 96% and 34% of Av, respectively, given the summer season has higher crop water requirement.
The cultivated areas for barley, broad bean, and maize under RCP 8.5 are not sufficient for population needs in 2100 per results shown in Table 10. Therefore, it was decided to use optimization to identify if land allocations can be modified to achieve some of the development targets. The results of this optimization using LP for 2100 under RCP 8.5 are presented in Table 11. Results show that olives cannot be cultivated to satisfy the population needs of strategic crops causing some loss of profit, but development targets are achievable with improved land and groundwater management. The corresponding values of IWR per acre are presented in Figure 9 where these values range from 4470 to 4554 m3/acre/year and from 4420 to 4774 m3/acre/year under RCP 4.5 and RCP 8.5, respectively. It is therefore recommended to increase the limit of crop water use to be 4774 m3/acre/year instead of 4000 m3/acre/year. Figure 9 showed that IWR per acre is increasing gradually until 2080 under RCP 8.5 then decreased in 2100 because of the decrease in the cultivated area as shown in Table 11.
This analysis also calculated the strategic crop demand for population and livestock annually then compared it with the expected production after applying optimization and the results are presented in Figure 10. It shows the increase in production for all years demonstrating the contribution of optimization to increase agriculture areas and therefore production that exceeeds the demand by a large percentage while maintaining sustainability. For example, the extra production in 2020 is 891% and 847% under RCP 4.5 and RCP 8.5, respectively showing that extra production of strategic crops may be used to cover the shortfalls in other parts of Egypt. Of course as expected, this percent increase decreases with time given the increase in population.
The projected total water requirement is also compared before and after optimization under both emission scenarios as shown in Figure 11. The results display the increase in water requirement over time due to the increase in agriculture areas predicted through optimization. In 2020, water requirement increases by 160% and 149% under RCP 4.5 and RCP 8.5, respectively, after optimization using the available groundwater in the NAS. It is noticed that under RCP 8.5 water requirement decreases by 7% in 2100, therefore this development project is achievable without the depletion of the Nubian aquifer. Figure 11 also shows that there is still extra groundwater available for possible system expansion; for example, in 2020, total water requirement is estimated to be 29.86 MCM under RCP 4.5 while optimization showed that this requirement can increase to 77.58 MCM, which is still less than 88 MCM.
Finally, this work projected the future changes in temperature in the Siwa region under two emission scenarios and assessed the impacts on crop water requirement and crop productivity. Results show that the proposed development in Siwa is possible until 2100 under the moderate emission scenario RCP 4.5 using the available land and groundwater. However, in the more aggressive emission scenario RCP 8.5, changes are needed in the land distribution to satisfy the required crop area for population and livestock farming needs until 2100. These results based on assumptions such as using current population and livestock water requirement, current crop consumption, and population growth rate of 2.5%. Also, there is a possibility that more water is needed in the future to address any increase in groundwater and soil salinity.

5. Conclusions

The proposed development project in Siwa is to reclaim 30,000 acres, which is part of a national project to reclaim 1.5 million acres mostly in the Western Desert of Egypt. The goals of this project are to increase agricultural areas enabling rural development and increase agriculture production to cover crop production needs in Egypt. This study investigated if stipulated government goals are possible under climate change during this century. As a part of this study, the estimated population and livestock data are used with projected temperatures to calculate land area needed, water requirement, and crop production. To maximize the benefits of this project, LP-based optimization analysis was conducted to explore the possibility of maximizing crop production subject to government policies.
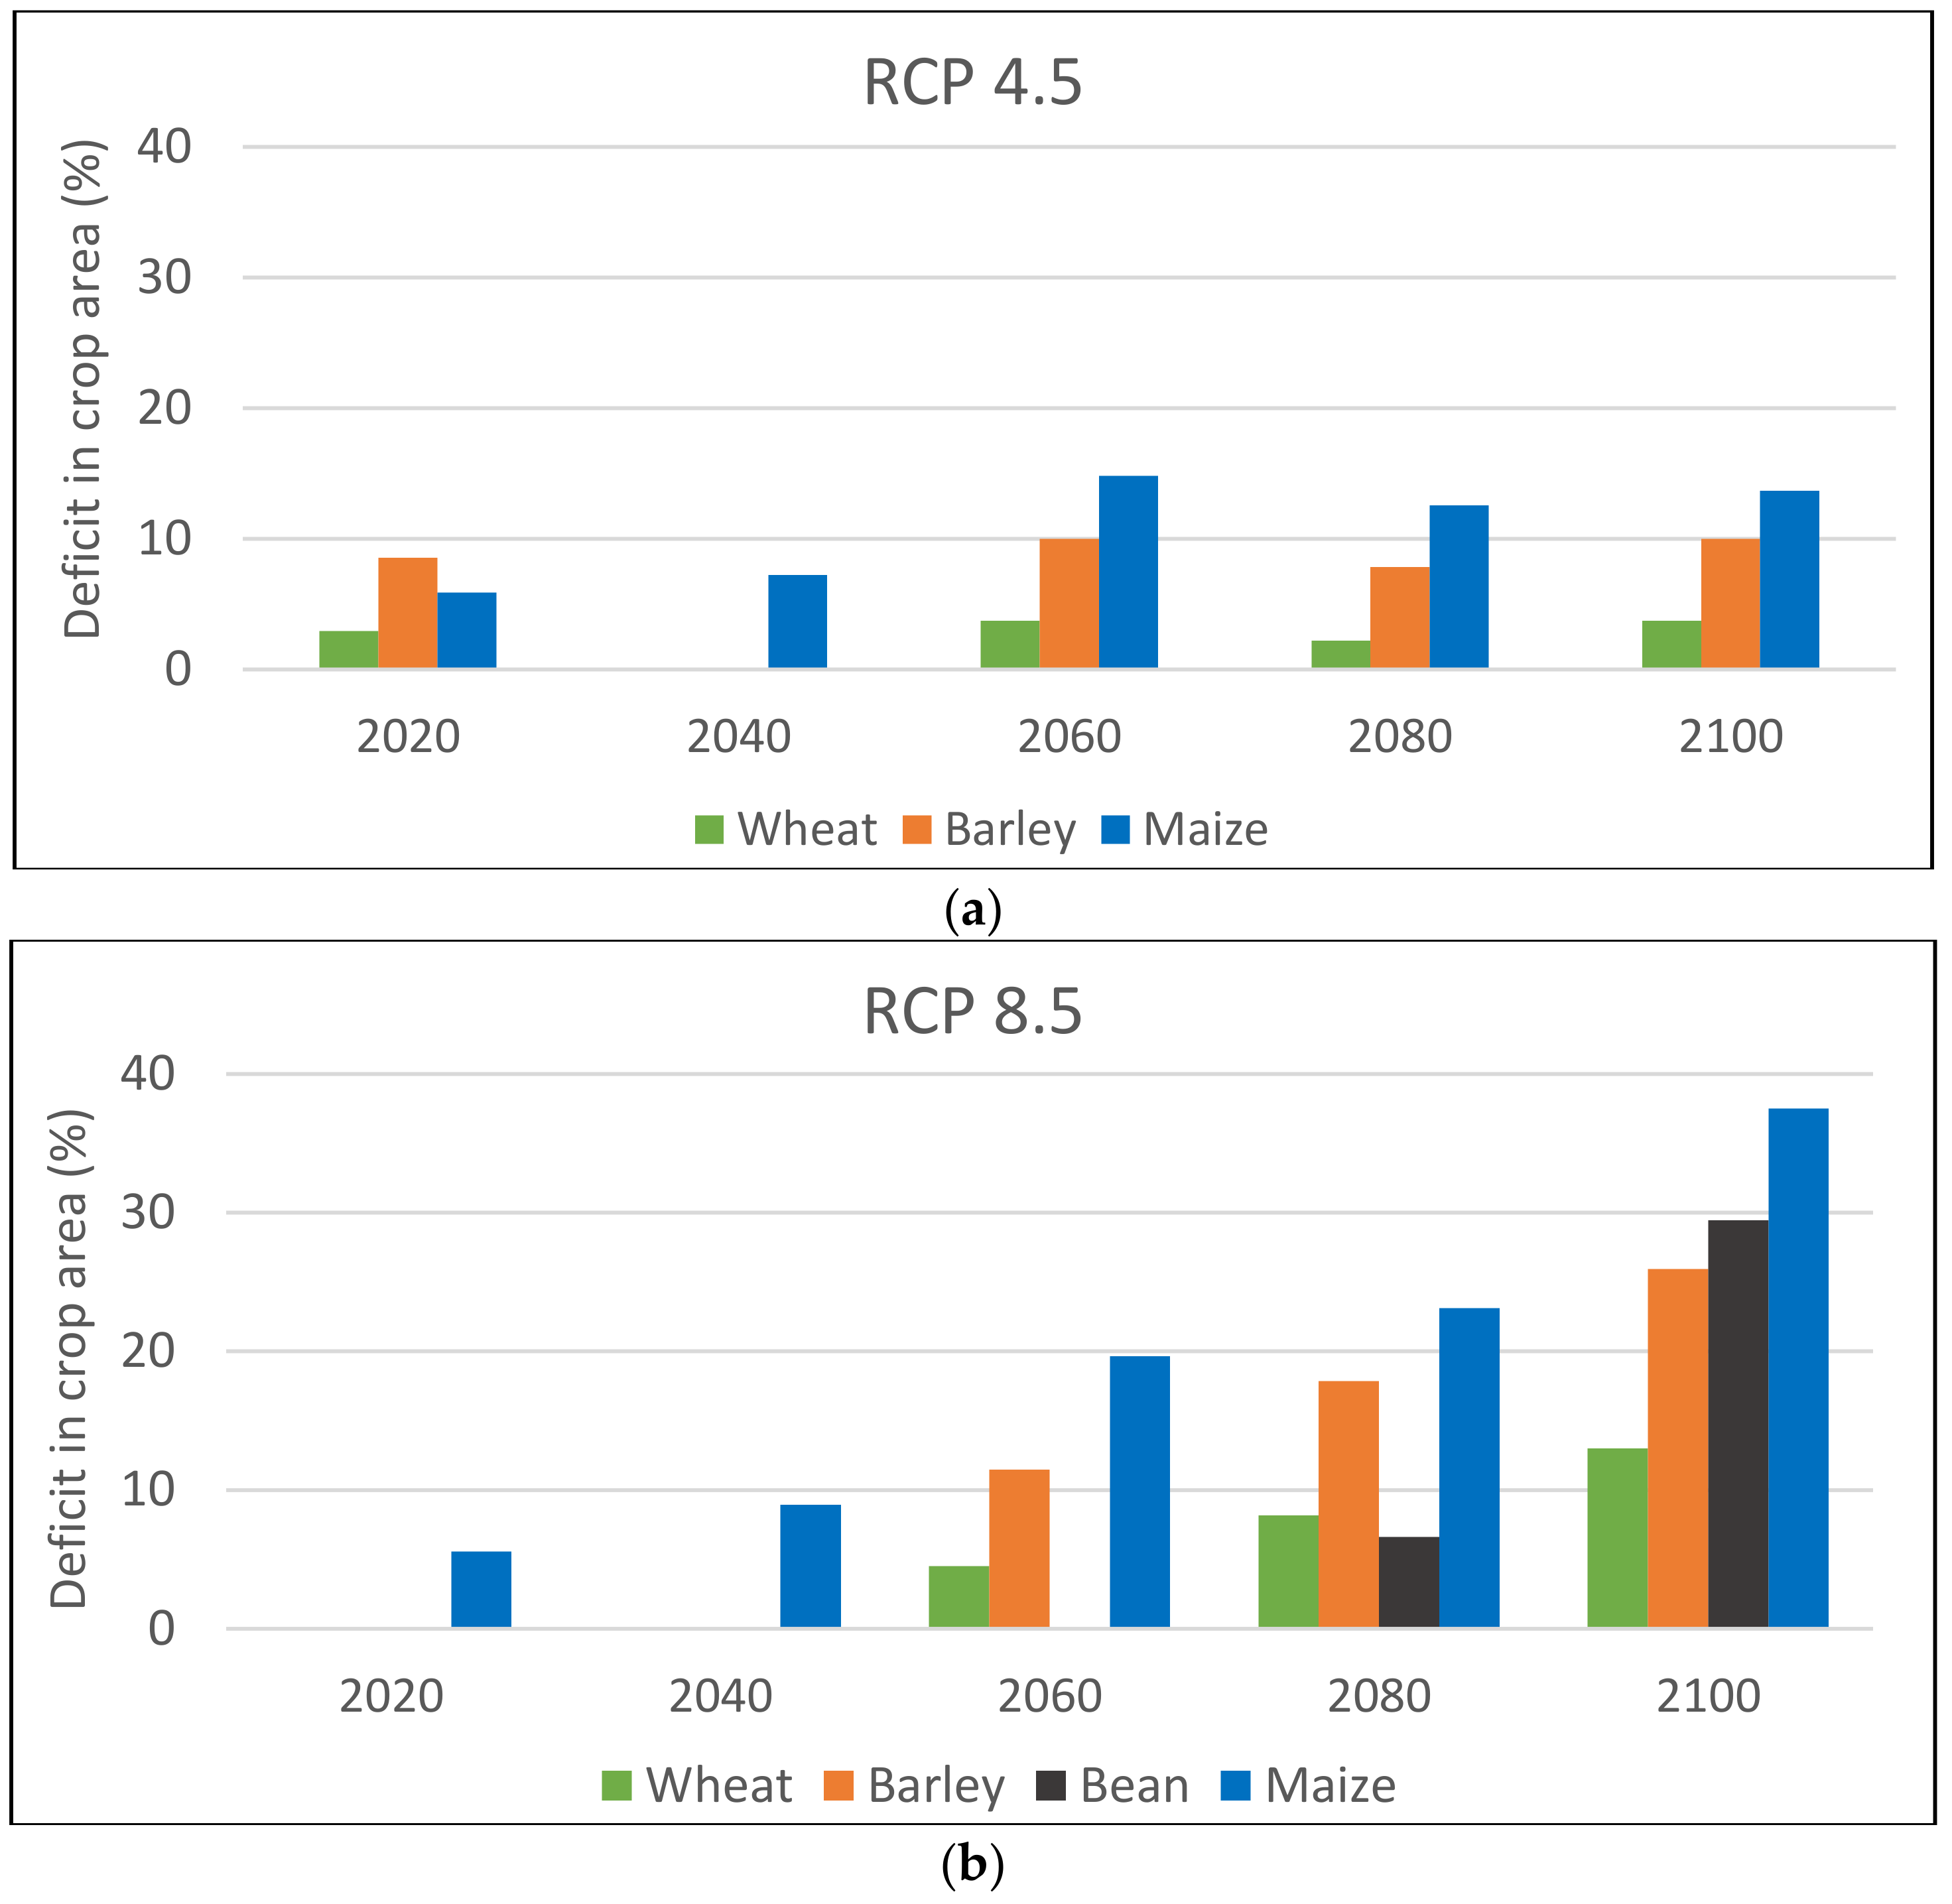
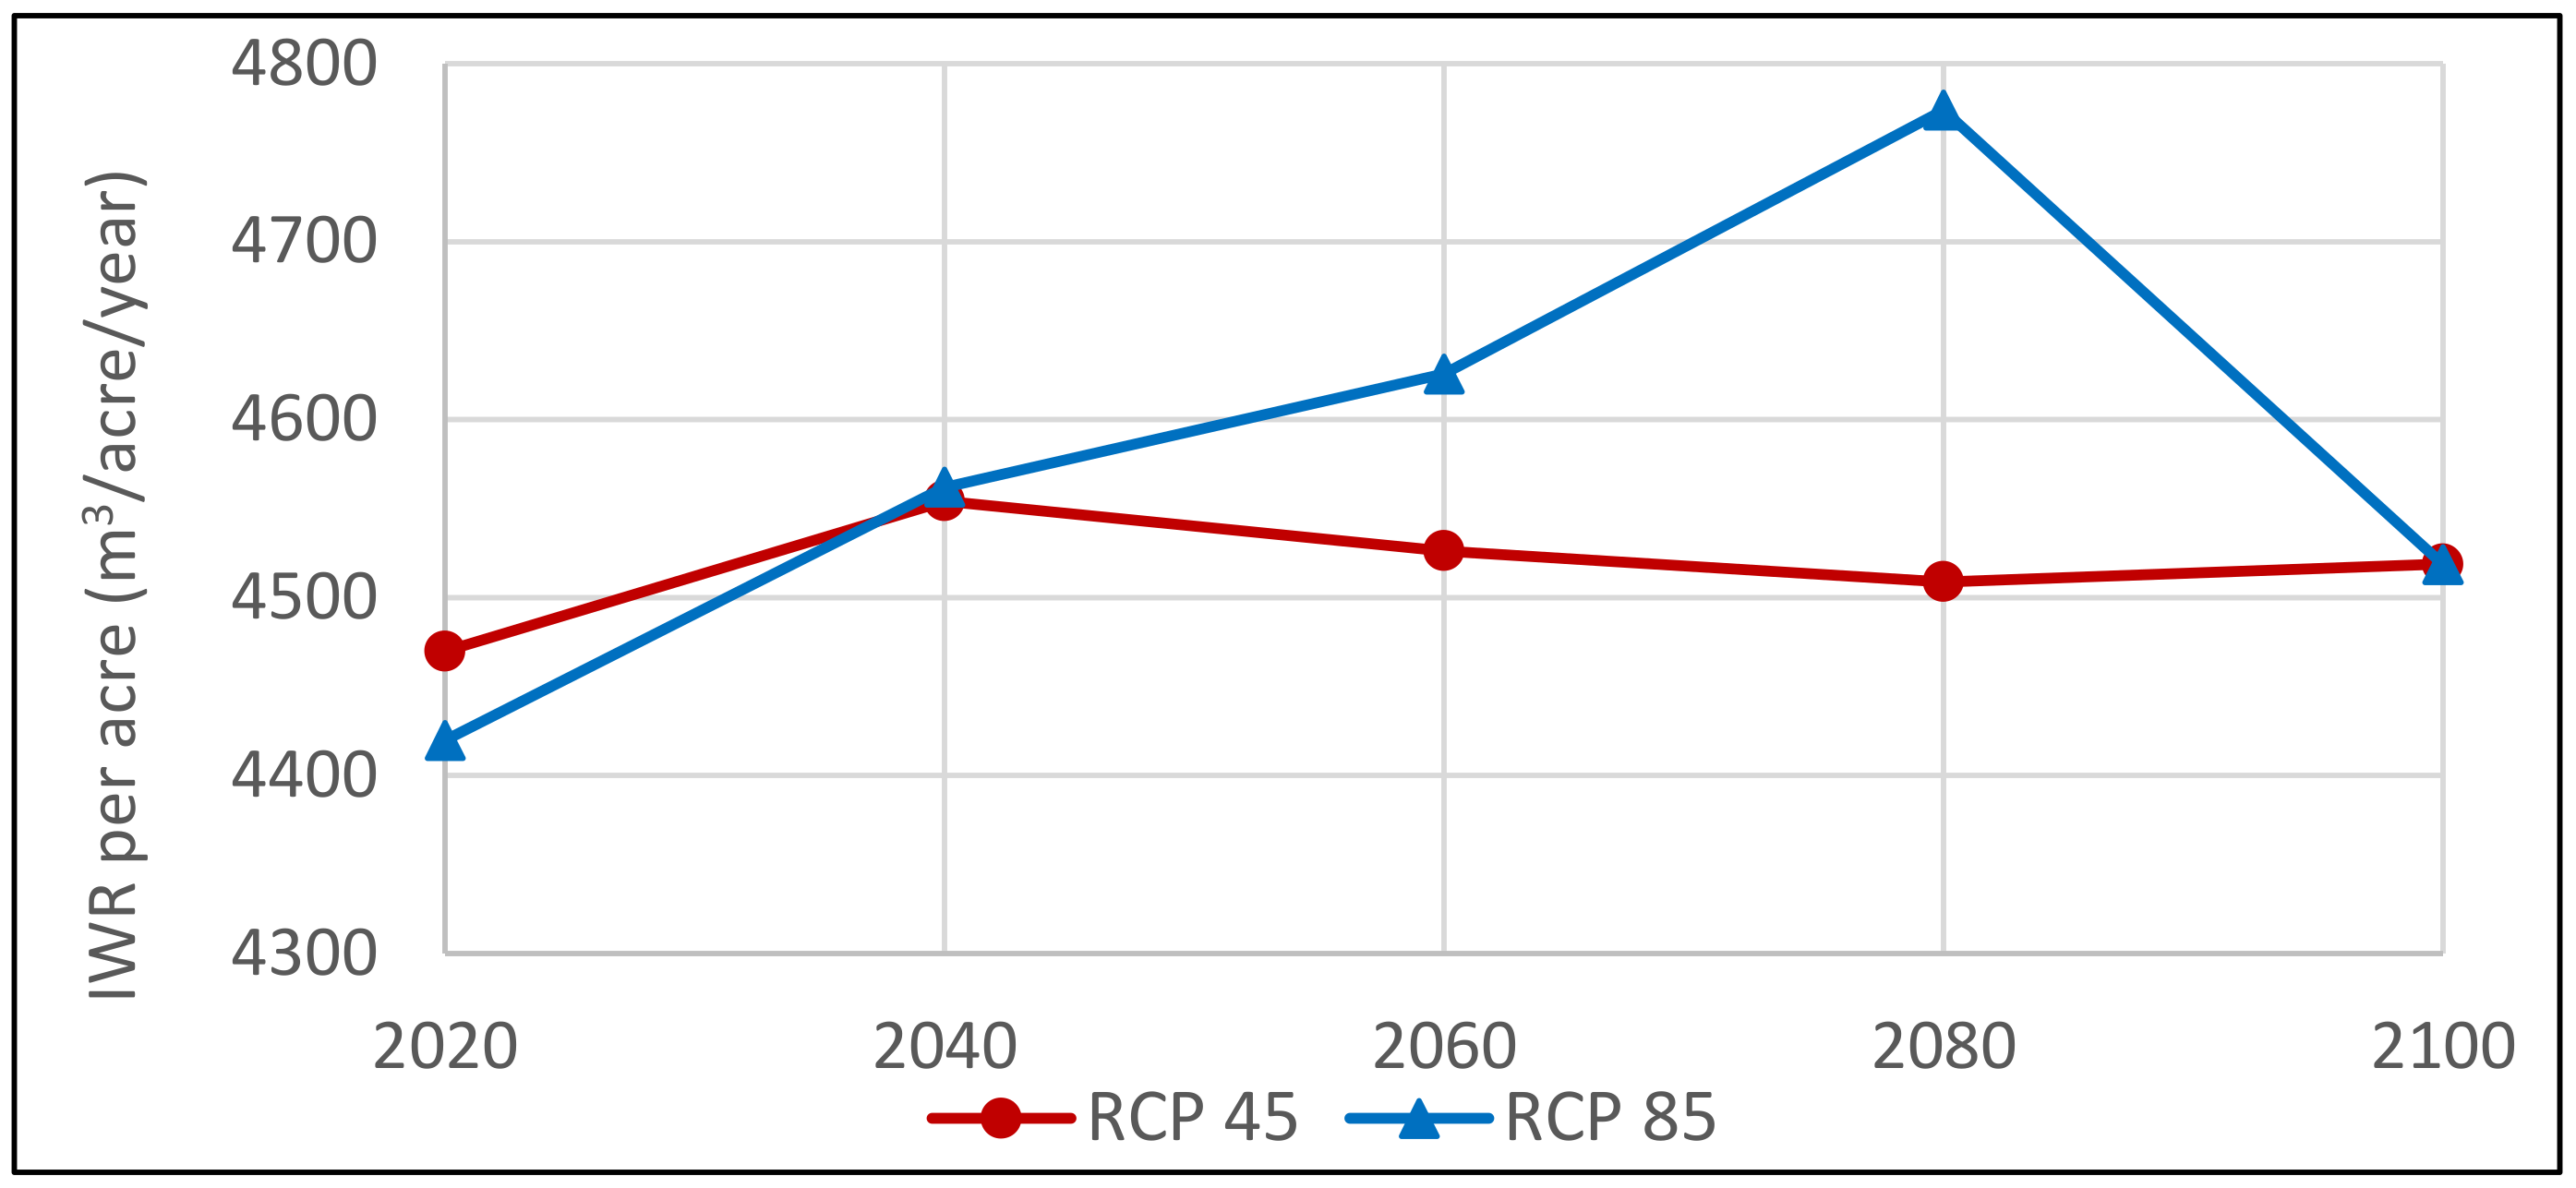
Different meteorological data are downloaded using CORDEX-Africa under four climate models with two emission scenarios: RCP 4.5 and RCP 8.5. Results show that the maximum increase in temperature in summer is 1.68 ± 1.64 °C in 2060 and 4.65 ± 1.82 °C in 2100 under RCP 4.5 and RCP 8.5, respectively. In winter, these values are 0.66 ± 0.74 °C in 2060 and 2.51 ± 0.47 °C in 2100, respectively. The impact of temperature increase on crop yield is addressed and results show that the maximum reduction in yields of wheat, barley, broad bean, and maize are 2.9%, 9.2%, 0, and 12.8%, respectively, in 2060 under RCP 4.5, while 10.4%, 20.4%, 22.6%, and 27.4%, respectively, under RCP 8.5 at the end of this century. Maize is the most affected crop due to climate change with higher temperatures in the summer. The increase in water requirement of crops over time ranges from 6% to 8.1% under RCP 4.5 and from 9.7% to 18.2% under RCP 8.5.
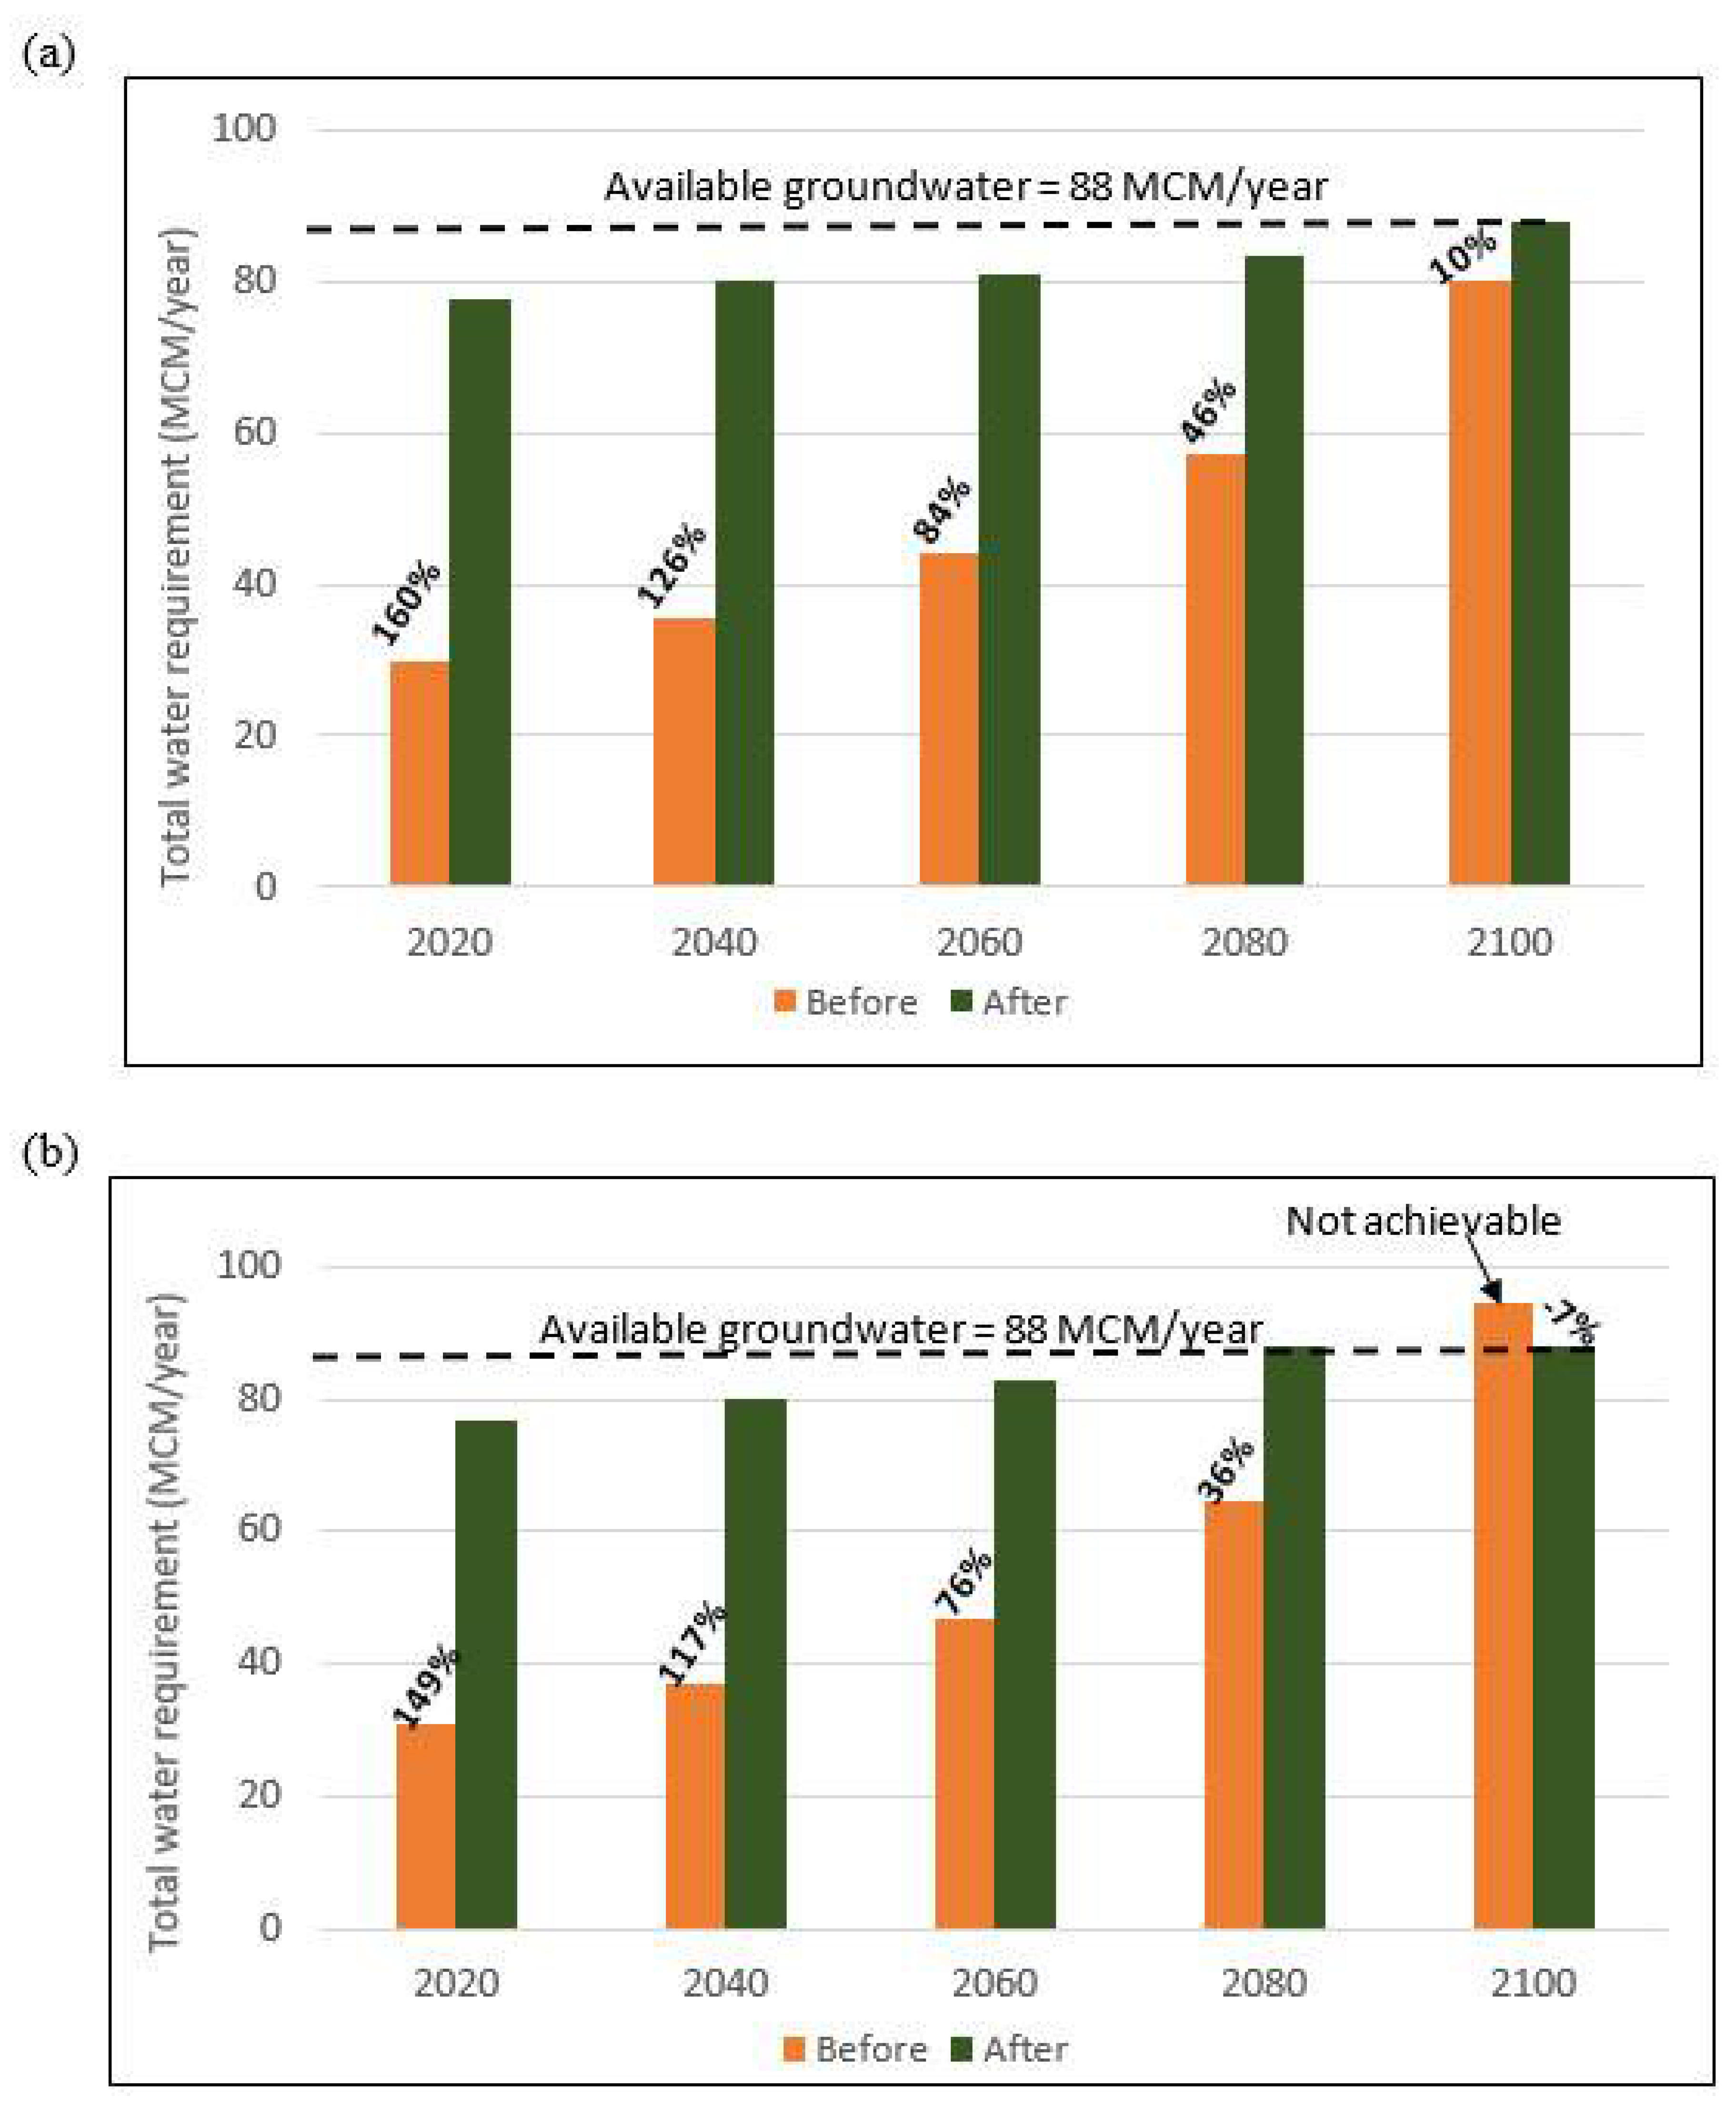
Figure 11. Estimated total water requirement before and after optimization; (a) RCP 4.5, and (b) RCP 8.5. Numbers in bold represent percent change in water requirement after optimization.
Sustainability 13 01578 g011
The required area of strategic and permanent crops is determined then compared with the limit of 17,010 acres to assess land availability in Siwa. Future water requirement is also estimated until 2100 then compared with 88 MCM of available groundwater from the NAS. Results show that this development project is possible in Siwa under the moderate emission scenario RCP 4.5 in this century. While under RCP 8.5, some of the proposed agricultural practices may need to be changed especially after 2080 such as olives crop that will not be cultivated in 2100.
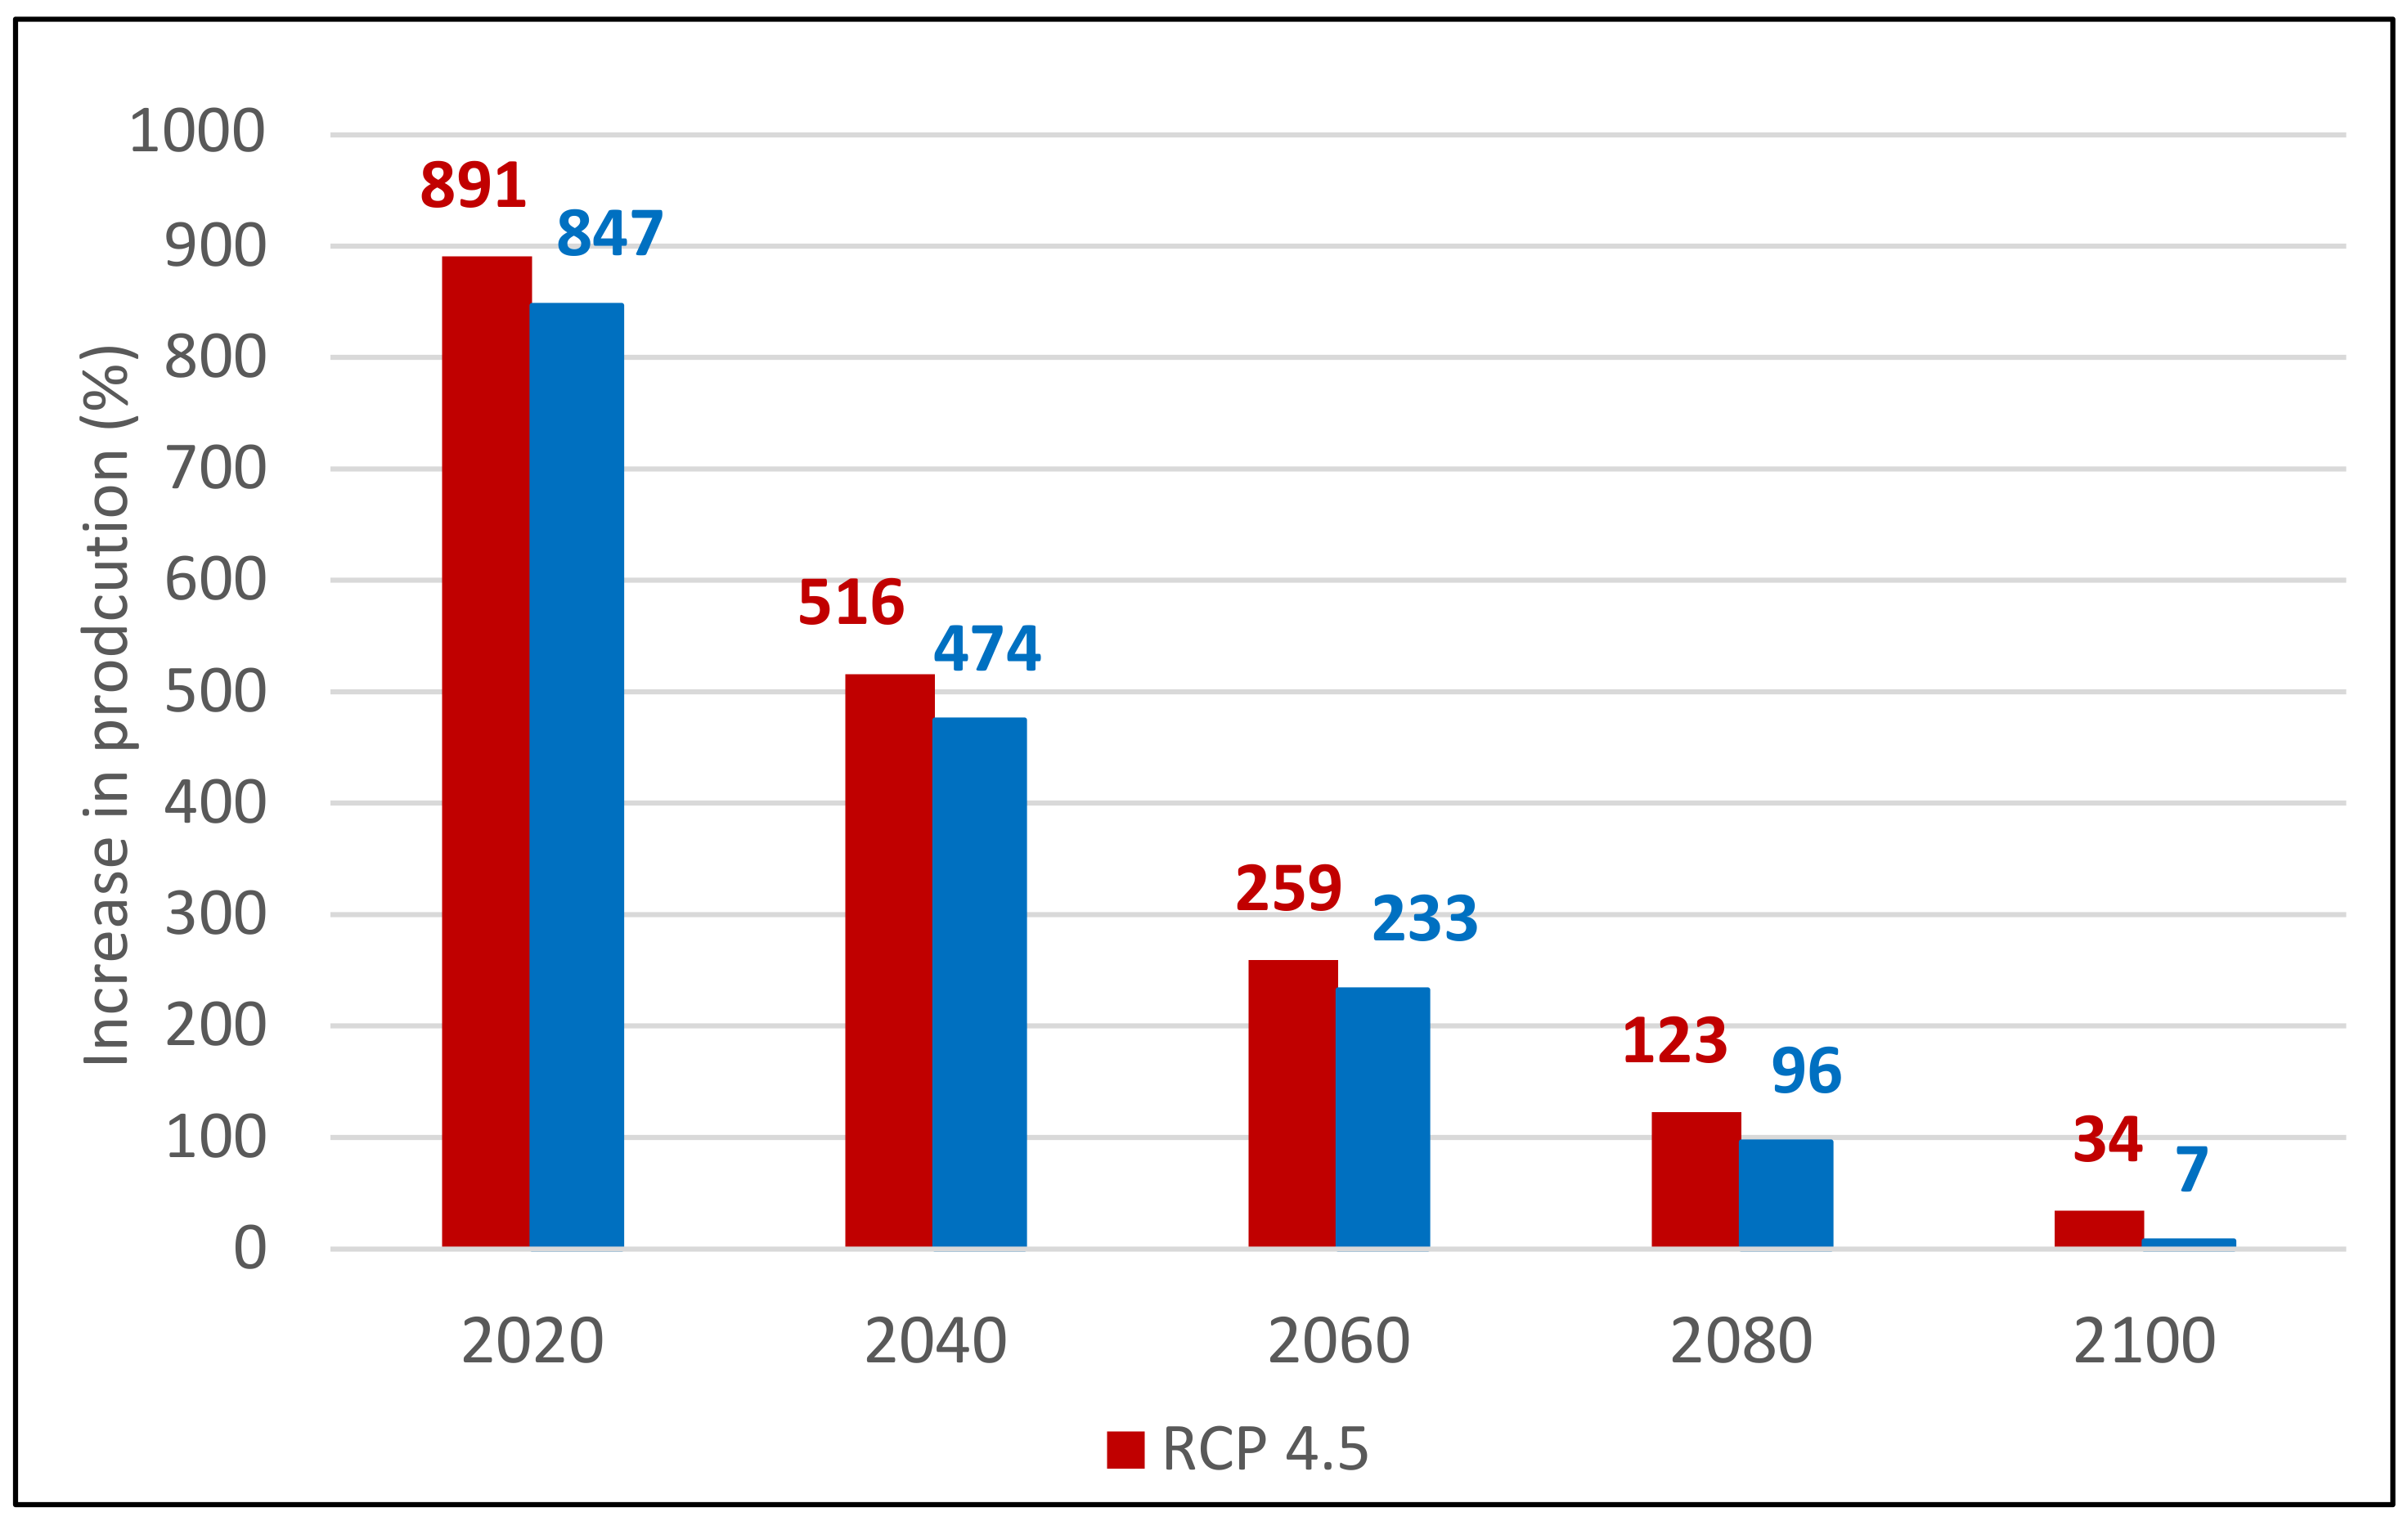
The optimization analysis showed the possible increase in strategic crop production over time where the extra production is 891% and 847% in 2020 under RCP 4.5 and RCP 8.5, respectively. Also, water requirement increases over time due to the increase in agriculture areas through optimization. In 2020, water requirement increases by 160% and 149% under RCP 4.5 and RCP 8.5, respectively, using the available groundwater in NAS.
In conclusion, the findings from this study show that the proposed agriculture development in the Siwa region under the national project to reclaim 1.5 million acres is possible. Although climate models produced uncertainty in their projections, one can agree that there is a definite impact of climate change on temperature, crop water requirement, and agriculture productivity. While this work is a case study demonstrating the viability of the proposed national project in the Siwa region, the key benefit is that the proposed methodology can be readily applied elsewhere in the Western Desert to assess the potential agriculture development projects under climate change.

Author Contributions

Conceptualization, N.H.M. and J.J.K.; Data curation, N.H.M.; Formal analysis, N.H.M.; Funding acquisition, N.H.M. and J.J.K.; Methodology, N.H.M. and J.J.K.; Resources, J.J.K.; Software, N.H.M.; Supervision, J.J.K.; Writing—original draft, N.H.M.; Writing—review & editing, N.H.M. and J.J.K. All authors have read and agreed to the published version of the manuscript.

Funding

This work was funded by Cultural Affairs and Missions Sector, Ministry of Higher Education, Egypt, and Utah Water Research Laboratory, Utah State University.

Institutional Review Board Statement

Not applicable.

Informed Consent Statement

Not applicable.

Data Availability Statement

All data are available in this study and no additional files needed.

Conflicts of Interest

The authors declare no conflict of interest.

References

  1. CAPMAS. Egypt in Figures; Central Agency for Public Mobilization and Statistics: Cairo, Egypt, 2018. Available online: https://www.capmas.gov.eg/Pages/StaticPages.aspx?page_id=5035 (accessed on 25 November 2019).
  2. Nour El-Din, M.M. Proposed Climate Change Adaptation Strategy for the Ministry of Water Resources & Irrigation in Egypt. 2013. Available online: http://www.eeaa.gov.eg/portals/0/eeaaReports/CCRMP/7.CCWaterStrategy/CCFinalSubmitted8-March2013AdptStrtgy.pdf (accessed on 10 May 2017).
  3. CAPMAS. Annual Bulletin of the Movement of Production, Foreign Trade & Available for Consumption of Agricultural Commodities; Central Agency for Public Mobilization and Statistics: Cairo, Egypt, 2017. Available online: https://www.capmas.gov.eg/Pages/Publications.aspx?page_id=5104&Year=23426 (accessed on 10 December 2019).
  4. RIGW. Report about the Groundwater in Siwa and the Future Development Plans; RIGW: Cairo, Egypt, 2015.
  5. Knox, J.; Daccache, A.; Hess, T.; Haro, D. Meta-analysis of climate impacts and uncertainty on crop yields in Europe. Environ. Res. Lett. 2016, 11, 113004. [Google Scholar] [CrossRef]
  6. Verma, M.; Misra, A.K. Effects of elevated carbon dioxide and temperature on crop yield: A modeling study. J. Appl. Math. Comput. 2018, 58, 503–526. [Google Scholar] [CrossRef]
  7. Wang, S.M.; Heckathorn, D.; Wang, S.A.; Philpott, X. A meta-analysis of plant physiological and growth responses to temperature and elevated CO2. Oecologia 2012, 169, 1–13. [Google Scholar] [CrossRef] [PubMed]
  8. Boote, K.J.; Jones, J.W.; White, J.W.; Asseng, S.; Lizaso, J.I. Putting mechanisms into crop production models. Plant Cell Environ. 2013, 36, 1658–1672. [Google Scholar] [CrossRef] [PubMed]
  9. Collins, M.; Knutti, R.; Arblaster, J.; Dufresne, J.-L.; Fichefet, T.; Friedlingstein, P.; Gao, X.; Gutowski, W.J.; Johns, T.; Krinner, G.; et al. Long-term Climate Change: Projections, Commitments and Irreversibility. In Climate Change 2013: The Physical Science Basis. Contribution of Working Group I to the Fifth Assessment Report of the Intergovernmental Panel on Climate Change; Cambridge University Press: Cambridge, UK, 2013; pp. 1029–1136. [Google Scholar] [CrossRef]
  10. Kirtman, H.J.; Power, B.; Adedoyin, S.B.; Boer, J.A.; Bojariu, G.J.; Camilloni, R.; Doblas-Reyes, I.; Fiore, F.J.; Kimoto, A.M.; Meehl, M.; et al. Near-term Climate Change: Projections and Predictability. In Climate Change 2013: The Physical Science Basis. Contribution of Working Group I to the Fifth Assessment Report of the Intergovernmental Panel on Climate Change; Cambridge University Press: Cambridge, UK; New York, NY, USA, 2013. [Google Scholar]
  11. Zhao, C.; Liu, B.; Piao, S.; Wang, X.; Lobell, D.B.; Huang, Y.; Huang, M.; Yao, Y.; Bassu, S.; Ciais, P.; et al. Wall, Temperature increase reduces global yields of major crops in four independent estimates. Proc. Natl. Acad. Sci. USA 2017, 114, 9326–9331. [Google Scholar] [CrossRef] [Green Version]
  12. Niang, P.; Ruppel, I.; Abdrabo, O.C.; Essel, M.A.; Lennard, A.; Padgham, C.; Urquhart, J. Africa. In Climate Change 2014: Impacts, Adaptation, and Vulnerability. Part B: Regional Aspects; Cambridge University Press: Cambridge, UK; New York, NY, USA, 2014. [Google Scholar]
  13. Jones, P.G.; Thornton, P.K. The potential impacts of climate change in tropical agriculture: The case of maize in Africa and Latin America in 2055. Glob. Environ. Chang. 2003, 13, 51–59. [Google Scholar] [CrossRef]
  14. Luhunga, F.; Botai, P.; Kahimba, J. Evaluation of the Performance of Cordex Regional Climate Models in Simulating Present Climate Conditions of Tanzania. J. South. Hemisph. Earth Syst. Sci. 2016, 66, 32–54. [Google Scholar] [CrossRef]
  15. Fawaz, M.M.; Soliman, S.A. The Potential Scenarios of the Impacts of Climate Change on Egyptian Resources and Agricultural Plant Production. Open J. Appl. Sci. 2016, 6, 270–286. [Google Scholar] [CrossRef] [Green Version]
  16. Abdrabbo, W.M.S.; Farag, M.A.; El-Desokey, A.A. Implementing of RCPs Scenarios for the Prediction of Evapotranspiration in Egypt. Int. J. Plant Soil Sci. 2015, 6, 50–63. [Google Scholar] [CrossRef]
  17. Rashed, H. Change Detection in Land Degradation and Environmental Hazards Sensitivity in Some Soils of Siwa Oasis, Egypt. J. Soil Sci. 2016, 56, 433–451. [Google Scholar] [CrossRef]
  18. MWRI. Reference Conditions for the Project of 1.5 Million Acres in Egypt; Ministry of Water Resources and Irrigation: Cairo, Egypt, 2015.
  19. RIGW. Report of Groundwater Potential and Total Extraction from Different Locations in Egypt; Research Institute for Groundwater, Ministry of Water Resources and Irrigation: Cairo, Egypt, 2012.
  20. ARC. Proposed Crops Distribution for the Project of 1.5 Million Acres in Egypt; Agricultural Research Center, Ministry of Agriculture and Land Reclamation: Giza, Egypt, 2016.
  21. Kheir, A.M.S.; El Baroudy, A.; Aiad, M.A.; Zoghdan, M.G.; Abd El-Aziz, M.A.; Ali, M.G.M.; Fullen, M.A. Impacts of rising temperature, carbon dioxide concentration and sea level on wheat production in North Nile delta. Sci. Total Environ. 2019, 651, 3161–3173. [Google Scholar] [CrossRef] [PubMed]
  22. Hassanein, M.K.; Medany, M.A. The impact of climate change on production of maize (Zea mays L.). In Proceedings of the International Conference on Climate Changes and Their Impacts on Coastal Zones and River Deltas: Vulnerability, Mitigation and Adaptation, Alexandria, Egypt, 23–25 April 2007; pp. 268–281. [Google Scholar]
  23. EL-Mansoury, M.A.M.; Saleh, S.M. Influence of Climatic Changes on Faba Bean (Vicia faba L.) Yield in North Nile Delta. J. Soil Sci. Agric. Eng. Mansoura Univ. 2017, 8, 29–34. [Google Scholar] [CrossRef]
  24. Calzadilla, R.S.J.; Rehdanz, A.; Betts, K.; Falloon, R.; Wiltshire, P.; Tol, A. Climate change impacts on global agriculture. Clim. Chang. 2013, 120, 357–374. [Google Scholar] [CrossRef]
  25. Eid, O.; El-Marsafawy, H.M.; Ainer, S.M.; El-Mowelhi, N.G.; El-Kholi, N.M. Vulnerability and Adaptation to Climate Change in Maize Crop. In Proceedings of the Meteorology & Environmental Cases Conference, Cairo, Egypt, 2–6 March 1997. [Google Scholar]
  26. Knezević, M.; Zivotić, L.; Perović, V.; Topalović, A.; Todorović, M. Impact of climate change on olive growth suitability, water requirements and yield in Montenegro. Ital. J. Agrometeorol. 2017, 22, 39–52. [Google Scholar] [CrossRef]
  27. Ponti, L.; Gutierrez, A.P.; Ruti, P.M.; Dell’Aquila, A. Fine-scale ecological and economic assessment of climate change on olive in the Mediterranean Basin reveals winners and losers. Proc. Natl. Acad. Sci. USA 2014, 111, 5598–5603. [Google Scholar] [CrossRef] [Green Version]
  28. Sarkar, M.S.K.; Begum, R.A.; Pereira, J.J. Impacts of climate change on oil palm production in Malaysia. Environ. Sci. Pollut. Res. 2020, 27, 9760–9770. [Google Scholar] [CrossRef] [PubMed]
  29. Allen, M.; Pereira, R.G.; Raes, L.S.; Smith, D. Crop Evapotranspiration: Guidelines for Computing Crop Water Requirements; FAO Irrigation and Drainage Paper No. 56; FAO: Rome, Italy, 1998. [Google Scholar] [CrossRef]
  30. Moghazy, N.H.; Kaluarachchi, J.J. Assessment of groundwater resources in Siwa Oasis, Western Desert, Egypt. Alexandria Eng. J. 2020, 59, 149–163. [Google Scholar] [CrossRef]
  31. Moghazy, N.H.; Kaluarachchi, J.J. Sustainable Agriculture Development in the Western Desert of Egypt: A Case Study on Crop Production, Profit, and Uncertainty in the Siwa Region. Sustainability 2020, 12, 6568. [Google Scholar] [CrossRef]
  32. Askari, M.; Mustafa, M.A.; Setiawan, B.I.; Soom, M.A.M.; Harun, S.; Abidin, M.R.Z.; Yusop, Z. A Combined Sensitivity Analysis of Seven Potential Evapotranspiration Models. J. Teknol. 2015, 76, 61–68. [Google Scholar] [CrossRef] [Green Version]
  33. Abdelaal, H.S.A.; Thilmany, D. Grains Production Prospects and Long Run Food Security in Egypt. Sustainability 2019, 11, 4457. [Google Scholar] [CrossRef] [Green Version]
  34. FAO. Statistical Databases: Food Balance Sheet, Egypt Country; FAO: Rome, Italy, 2017; Available online: http://www.fao.org/faostat/en/#data/FBS (accessed on 10 June 2019).
  35. HBRC. Egyptian Code for Design and Construction of Water and Wastewater Pipe Networks; Housing and Building National Research Center: Cairo, Egypt, 2010.
  36. Lardy, R.; Stoltenow, G.; Johnson, C. Livestock and Water [AS-954]; North Dakota State University: Fargo, ND, USA, 2008. [Google Scholar]
  37. Leeson, J.D.; Summers, S. Commercial Poultry Nutrition, 3rd ed.; Nottingham University Press: Nottingham, UK, 2008. [Google Scholar]
  38. Daghighi, A.; Nahvi, A.; Kim, U. Optimal Cultivation Pattern to Increase Revenue and Reduce Water Use: Application of Linear Programming to Arjan Plain in Fars Province. Agriculture 2017, 7, 73. [Google Scholar] [CrossRef] [Green Version]
  39. Zare, M.; Koch, M. Optimization of Cultivation Pattern for Maximizing Farmers’ Profits under Land and Water Constraints by Means of Linear-Programming: An Iranian Case Study. In Proceedings of the 11th International Conference on Hydroscience & Engineering, Hamburg, Germany, 28 September–2 October 2014; Bundesanstalt für Wasserbau: Karlsruhe, Germany, 2014. ISBN 978-3-939230-32-8. [Google Scholar]
Figure 1. Physical description of the proposed reclamation project in Siwa.
Sustainability 13 01578 g001
Figure 2. Box plots of annual Tmax under; (a) representative concentration pathways (RCP) 4.5 and (b) RCP 8.5.
Sustainability 13 01578 g002
Figure 3. Δ T values in the summer using four climate models from Table 2 under RCP 4.5.
Sustainability 13 01578 g003
Figure 4. Comparison between current ETo and monthly projected ETo using Model 1 in 2100 under RCP 4.5 and RCP 8.5.
Sustainability 13 01578 g004
Figure 5. Uncertainty of monthly ETo between models in 2100 under RCP 4.5.
Sustainability 13 01578 g005
Figure 6. ETo (weighted) under RCP 4.5 and RCP 8.5 in 2100.
Sustainability 13 01578 g006
Figure 7. Irrigation water requirement per acre over time under both emission scenarios and in case of neglecting the impact of climate change.
Sustainability 13 01578 g007
Figure 8. Percent deficit in strategic crop areas produced when climate change is disregarded; (a) RCP 4.5, and (b) RCP 8.5.
Sustainability 13 01578 g008
Figure 9. Irrigation water requirement per acre after optimization for both emission scenarios.
Sustainability 13 01578 g009
Figure 10. Percent increase in strategic crop production with optimization under RCP 4.5 and RCP 8.5 compared to annual population and livestock demand.
Sustainability 13 01578 g010
Table 1. Impact of temperature on crop yield from prior studies.
CropChange in Crop Yield (%) at Different Increases in TemperatureReference
1 °C2 °C3 °C4 °C
Wheat−5.08−9.35−13.11−17.65Kheir et al. [21]
Date Palm−10.17−20.38−30.55−40.75Sarkar et al. [28]
Olives−6 −14−18Knezević et al. [26]
Maize −14.4 −24.2Hassanein and Medany [22]
Barley −17.29 −29.32Calzadilla et al. [24]
Broad Bean1.9 °C2.1 °C2.3 °C2.5 °CEL-Mansoury and Saleh, [23]
−11.43−14.15−18.15−23.14
Table 2. Description of regional climate models (RCMs) used and the corresponding global climate models (GCMs).
DeveloperRCMGCMModel
Identifier
ModelResolutionModelResolution 1
SMHIRCA40.44° × 0.44°CNRM-CM51.4° × 1.4°M1
KNMIRACMO22T0.44° × 0.44°EC-EARTH1.125° × 1.125°M2
SMHIRCA40.44° × 0.44°EC-EARTH1.125° × 1.125°M3
SMHIRCA40.44° × 0.44°MPI-ESM-LR1.875° × 1.875°M4
Table 3. Projected Δ T with 95% CI over time.
RCPSeasonΔT (°C)20202040206020802100
RCP 4.5SummerMean0.220.421.681.311.54
Lower Limit−1.05−1.400.050.290.09
Upper Limit1.482.243.322.902.99
WinterMean0.47−0.160.660.310.60
Lower Limit−0.91−1.49−0.07−1.47−0.14
Upper Limit1.851.161.402.091.34
RCP 8.5SummerMean0.120.732.402.904.65
Lower Limit1.801.091.781.621.86
Upper Limit−1.64−0.340.651.312.82
WinterMean−0.76−0.750.841.612.51
Lower Limit0.731.171.771.100.48
Upper Limit−1.47−1.90−0.900.532.04
Table 4. Relationship between Δ T (°C) and change in crop yield (%).
CropLinear Regression Equation
Interceptp-ValueSlopep-Value
Wheat−0.930.0778−4.1470.000589
Barley−5.260.0000−6.0150.0000
Broad bean26.320.0221−19.560.0083
Maize−4.60.0000−4.90.0000
Olive−1.950.0048−4.010.00079
Date palm0.0150.4020−10.190.00000026
Table 5. Predicted crop yield under two emission scenario RCP 4.5 and RCP 8.5.
CropCrop Yield (Tons/Acre)
RCP 4.5
20202040206020802100
Wheat2.732.782.72.742.71
Barley1.521.651.501.531.50
Broad bean1.451.451.451.451.45
Maize3.223.182.973.033.00
Olive4.004.043.873.933.88
Date palm14.0014.3112.7713.3012.92
RCP 8.5
Wheat2.782.782.682.592.49
Barley1.651.651.481.401.31
Broad bean1.451.451.451.361.12
Maize3.233.132.852.772.48
Olive4.144.143.793.693.47
Date palm14.5014.5012.1111.189.21
Table 6. Root mean squared error (RMS produced by different climate models.
Model IdentifierRMSE
M10.278
M20.726
M30.419
M40.327
Table 7. Accuracy of each climate model (%). Numbers in bold represent the highest accuracy value in each month.
MonthModel 1Model 2Model 3Model 4
January24.8516.3232.5326.30
February41.6411.8231.6614.88
March18.6018.5631.4531.39
April26.069.4338.5825.94
May22.0112.1823.9741.84
June37.3315.0720.7126.89
July37.8115.4422.1624.59
August36.9114.7520.1428.19
September36.4713.7018.2331.60
October27.6013.4021.0037.99
November25.3117.7024.5032.49
December19.8010.3619.4150.43
Table 8. Change in projected crop water requirement (CWR) with different emission scenarios.
RCPWater Requirement20202040206020802100
RCP 4.5Cultivated crops (m3/acre/year)26,24726,78626,62626,67726,554
Changes to current requirment (m3/acre/year)14752014185519061783
Changes (%)6.08.17.57.77.2
RCP 8.5Cultivated crops (m3/acre/year)27,16928,07228,34629,07529,279
Changes to current requirment (m3/acre/year)23983301357443044508
Change (%)9.713.314.417.418.2
Table 9. Projected crop area and water requirements under RCP 4.5.
Crop20202040206020802100
Wheat (acres)9431500255041176846
Barley (acres)128192346556928
Broad bean (acres)2183575859581570
Maize (acres)493817143323023809
Olives (acres)17011701170117011701
Date Palm (acres)17011701170117011701
Total area in Winter (acres)469154516883903312,746
Total area in Summer (acres)38954219483557047211
Estimated total water requirement (MCM/year)29.935.344.157.480.1
Table 10. Projected crop area and water requirements under RCP 8.5.
Crop20202040206020802100
Wheat (acres)9161500256943577458
Barley (acres)1171923516071063
Broad bean (acres)21835758510222033
Maize (acres)491830149425184608
Olives (acres)17011701170117011701
Date Palm (acres)17011701170117011701
Total area in Winter (acres)465354516907938813,956
Total area in Summer (acres)38934232489659208010
Estimated total water requirement (MCM/year)30.8374764.694.5
Table 11. Crop area and water requirements predicted from optimization analysis.
Crop2020–2100
(RCP 4.5)
2020–2080
(RCP 8.5)
2100
(RCP 8.5)
Wheat (acres)11,11111,9808445
Barley (acres)9286071063
Broad bean (acres)157010222033
Maize (acres)380925184608
Olives (acres)76813180
Date Palm (acres)170117011701
Total area in Winter (acres)16,07816,62813,242
Total area in Summer (acres)627855376309
Estimated total water requirement (MCM/year)≤88≤8888
Publisher’s Note: MDPI stays neutral with regard to jurisdictional claims in published maps and institutional affiliations.

