Article

Spatial Evolution of Urban Expansion in the Beijing–Tianjin–Hebei Coordinated Development Region

1
Aerospace Information Research Institute, Chinese Academy of Sciences, Beijing 100094, China
2
University of Chinese Academy of Sciences, Beijing 100049, China
3
College of Resources and Environment, Xingtai University, Xingtai 054001, China
4
Regional Planning Research Centre, Xingtai University, Xingtai 054001, China
*
Author to whom correspondence should be addressed.
Sustainability 2021, 13(3), 1579; https://0-doi-org.brum.beds.ac.uk/10.3390/su13031579
Submission received: 26 December 2020 / Revised: 20 January 2021 / Accepted: 27 January 2021 / Published: 2 February 2021

Abstract

:
Against the background of coordinated development of the Beijing–Tianjin–Hebei region (BTH), it is of great significance to quantitatively reveal spatiotemporal dynamics of urban expansion for optimizing the layout of urban land across regions. However, the urban expansion characteristics, types and trends, and spatial coevolution (including urban land, GDP, and population) have not been well investigated in the existing research studies. This study presents a new spatial measure that describes the difference of the main trend direction. In addition, we also introduce a new method to classify an urban expansion type based on other scholars. The results show the following: (1) The annual urban expansion area (UEA) in Beijing and Tianjin has been ahead of that in Hebei; the annual urban expansion rate (UER) gradually shifted from the highest in megacities to the highest in counties; the high–high clusters of the UEA presented an evolution from a “seesaw” pattern to a “dumbbell” pattern, while that of the UER moved first from Beijing to Tianjin and eventually to Hebei. (2) Double high speed for both UEA and UER was the main extension type; most cities presented a U-shaped trend. (3) Qinhuangdao has the largest difference between the main trend direction of spatial distribution of urban land, GDP and population; the spatial distribution of GDP is closer to that of urban land than population. (4) The area and proportion of land occupied by urban expansion varied greatly across districts/counties. BTH experienced dramatic urban expansion and has a profound impact on land use. These research results can provide a data basis and empirical reference for territorial spatial planning.

1. Introduction

Urbanization is an important symbol of the economic development level of a country or region. It reflects the historical process of a region’s gradual transformation from a traditional rural society dominated by agriculture to a modern urban society dominated by non-agricultural industries, such as industry and the service industry. Since the reform and opening up in 1978, China’s economy has maintained 40 years of rapid growth. Along with economic development, China’s urbanization process is also advancing at an unprecedented speed. Joseph Eugene Stiglitz, the winner of the Nobel Prize in Economics in 2001, pointed out that China’s urbanization and America’s high-tech development are the two main factors that will change the world in the 21st century [1]. Therefore, it is of great empirical significance to study the urbanization process in China after 2000, especially in the Beijing–Tianjin–Hebei Coordinated Development region (BTH), one of China’s three major urban agglomerations. However, urbanization is a complex engineering system, involving the profound changes of the dual social structure of urban and rural division, and it is difficult to thoroughly analyze its evolution process. Urbanization is mainly manifested as the agglomeration of population and non-agricultural industries in cities, and urban land is the place where the economic activities generated by the agglomeration are carried out. Urban population and GDP growth indirectly lead to the spatial spread of urban built-up areas, that is, urban expansion [2]. The accurate monitoring of the magnitude of urban expansion is a prerequisite for evaluating its environmental and social impact [3]. The motivation of this paper is to explore the urbanization characteristics of BTH from 2000 to 2015 by studying the spatiotemporal evolution characteristics of urban expansion, as well as the differences in the spatial distribution of urban land, urban population, and GDP. In addition, many countries have restricted grain exports since the novel coronavirus pandemic outbreak. Food security is an important basis for national security. Strictly protecting cropland and reducing as much as possible the cropland occupied by urban construction has always been an important way to ensure food security. Ecological priority and green development have become the guiding principles for China’s economic development in the new era. Therefore, it is necessary to explore the quantity and spatial distribution of cropland occupied by urban expansion, as well as ecological land, such as woodland, grassland, and water body.
Urban expansion is a double-edged sword with both disadvantages and advantages. How to better avoid disadvantages and enhance advantages is a practical point that urban planners and city managers need to face. Urban expansion is a process of transforming natural land into artificial land [4], resulting in the loss of cultivated land and rural settlements around the city [5], air pollution [6], water pollution [7], heat island effects [8], biodiversity reduction [9], and other ecological environmental problems. However, the urban expansion also has its advantages. The new construction land produced by urban expansion and the urban land stock play a very important role in regional economic development. Although urban land is not directly involved in the production process of commodities, it can provide sites and space for production activities and transactions. Land is an important way for local governments to attract capital, labor, and technology, so urban expansion indirectly promotes economic growth [10]. Reasonable macro-control of urban land is helpful to promote and improve regional economic development for a long time. The Chinese Government has made concerted efforts to manage and guide urban expansion through land-use planning, urban planning, and annual plan of land utilization [11]. Cities with higher administrative status can obtain a higher quota of construction land, resulting in more significant urban expansion [12]. Therefore, by dividing BTH into megacities, prefecture-level cities, county-level cities, and counties, a comparative study on the expansion characteristics of cities with different administrative positions can better grasp the effect of urban expansion on the implementation of urban development policies. Understanding the agglomeration or dispersion characteristics and change trend of adjacent counties in the process of urban expansion can also provide support for relevant decision-making. China’s Ministry of Natural Resources launched territorial spatial planning in 2019. Territorial spatial planning is based on a unified spatial reference, realizing the integration of multiple plans, including national economic and social development planning, land-use planning, urban planning, and other planning, which will effectively improve the level of control and governance of the government. This is the first time in Chinese history that the planning of several different government departments has been unified on the same planning drawing. The Chinese government has implemented a five-level planning mechanism in its territorial space planning, including national, provincial, prefecture-level city, county, and township planning. Nation- and province-level territorial spatial planning focuses on macroscopic deployment. Prefecture-level cities will allocate construction land quotas, including urban land, to each county within their jurisdiction, and counties and townships will implement urban land quotas to specific spatial locations. In other words, prefecture-level cities and counties/districts play a decisive role in the layout of urban land. Therefore, it is particularly important to consider the prefecture-level city as the spatial unit when analyzing the types and trends of urban expansion, as well as the spatial evolution relationship between urban land, urban population, and GDP. Different from China, the corresponding relationship between the planning system and administrative sequence is not obvious in European and American countries. Due to the differences in the economic and social development of different countries, the planning systems of different countries are also different. France’s national plan provides guidance on infrastructure and public services. Spatial planning at the regional level is a local planning document prepared by the central government for specific strategic areas. Regional planning aims to implement the spatial planning objectives and guidelines of the central government for these areas. The city/town shall draw up and implement the local city plan according to the actual situation [13]. In England, there are planning guidelines at the national level, which are used to clarify the basic direction and principles of local planning. Germany has only ideas, principles, or goals at the national level, with specific plans drawn up and implemented locally. There is no national level spatial planning in the United States. The operational system of spatial planning in the United States includes four levels: State planning, regional planning, local planning, and community planning. The planning positioning of each level is clear, and the functions are complementary to each other, forming a local-led operation system. The United States has developed a “diverse” or “free-form” spatial planning system from the bottom up. Diversity refers to developing plans with regional characteristics by various states according to development needs [14]. How to supply the land needed for urban development and minimize the adverse impact caused by urban expansion is now an important issue to be considered. Ultimately, we will achieve people-centered urbanization and build a more livable, prosperous, and sustainable urban development model.
The data of urban land, population, and GDP were detailed to the counties/districts scale of BTH, while the data of megacities and prefecture-level cities were the sum of the corresponding data of municipal districts. The study time involved four years, including 2000, 2005, 2010, and 2015, and three periods, including 2000–2005, 2005–2010, and 2010–2015. This paper has four objectives: (1) To make a comparative study of the differences and statistical characteristics of urban expansion at different administrative levels, as well as the agglomeration and dispersion characteristics of urban expansion at the county level, (2) to investigate the types and trends of urban expansion in prefecture-level cities, (3) to identify the spatial evolution relationship between urban land, urban population, and GDP, and (4) to analyze the area and spatial distribution of various land types occupied by urban expansion.
This paper is organized into six sections: Section 1 presents the introduction and research objectives; Section 2 presents a literature review; Section 3 introduces the study area, data sources, and research methods; Section 4 provides an analysis of the empirical results; Section 5 presents a discussion; Section 6 concludes.

2. Literature Review

The rapid and large magnitude expansion of China’s cities has attracted extensive attention from scholars. Many studies have examined the characteristics of the urban expansion from the following aspects. (1) Many scholars have investigated the spatiotemporal characteristics of urban expansion at the individual city level (e.g., Beijing [15], Shanghai [16], Wuhan [17], Nanjing [18], Xi’an [19], and Guangzhou [20]), the regional level (e.g., Yangtze River Delta [21], Pearl River Delta [22], Beijing–Tianjin–Hebei [23], Northeast China [24], and the Middle Reaches of the Yangtze River [25]), and the national level [26]. However, few studies fit into the actual policy of allocating urban land quota according to the administrative status of cities in China and comparatively study the differences of urban expansion characteristics among megalopolises, prefecture-level cities, county-level cities, and counties. In addition, a concentric circular buffer [15], azimuth analysis [18], and a radar map [27] were used to characterize the spatial characteristics of urban expansion in the existing literature. The spatial autocorrelation between spatial units is rarely considered in the study of urban expansion characteristics. However, the urban expansion is not carried out by one city alone. There is an interaction between neighboring cities, and urban expansion is more or less affected by neighboring cities. For example, Zhang al. [28] compared the urban expansion characteristics of Beijing, Tianjin, and Tangshan from the 1970s to 2013 and found that neighboring cities had a significant impact on the expansion direction of local cities. From a spatial perspective, the spatial structure of a metropolitan area can be described as a series of cities “physically independent but functionally networked, clustered around one or more larger cities” [29]. In the post-industrial period, the spatial pattern of the metropolitan area is a typical urban polycentric system [30]. The London and Paris metropolitan areas are the oldest metropolitan areas in the world and have formed a polycentric urban spatial structure. Jiao compared the spatiotemporal differences of the growth of construction land in different stages in New York, Tokyo, and Shanghai metropolis from multiple perspectives [31]. Kantakumar et al. used remote sensing data to analyze patterns and processes of urban growth in the Pune metropolis [32]. (2) Many scholars have used one or more indexes of annual expansion area [24,33,34,35], expansion rate [24,33,36,37,38], growth rate [34,35], and expansion intensity [19,25,39] to study the speed of urban expansion, but few studies have combined the two indexes for analysis. Shi et al. [40] introduced a composite index combining the two parameters of growth rate and form and defined the urban expansion type by this composite index. Based on the idea of Shi et al., this paper selected the absolute and relative speed of urban expansion to construct a comprehensive index of urban expansion speed. The comprehensive index was used to classify the types of urban expansion in prefecture-level cities, and the spatial distribution difference of urban expansion types in each city was analyzed. (3) Although many scholars have used linear regression [41], ridge regression [42], a geographic detector [43], a spatial econometric model [44], and other methods to quantitatively study the influence of multiple factors on urban land, the existing research pays little attention to the temporal coevolution of urban land area with urban population and GDP. Using the power scaling law, Fei and Zhao [45] calculated the scaling coefficient of urban population and urban land area, as well as that of urban GDP and urban land area. It was found that the population growth of Shenzhen and Beijing exceeded the urban land area growth, and the population growth of the other four cities lagged behind the urban land area growth. In all six cities, the growth of GDP greatly exceeded the growth of urban land area. Yu et al. [46] found that there was an obvious log–linear relationship between urban land and population, as well as between urban land and GDP. Moreover, the slope of the former was higher than that of the latter, indicating that, although both population and GDP had a positive impact on urban land, the increase in population had a more significant impact on urban land than GDP. However, the two scholars did not consider the spatial evolution relationship between urban land, population, and GDP. (4) In the existing literature, the spatiotemporal characteristics and driving force of urban expansion are still the core of the research [47]. The amount of cropland is very important to food security. Woodland, grassland, and bodies of water are closely related to the ecological environment. However, few studies have used a combination of proportional and absolute quantities to trace the sources of newly increased urban land in the process of urban expansion at the county level. This research aims to fill this gap.

3. Materials and Methods
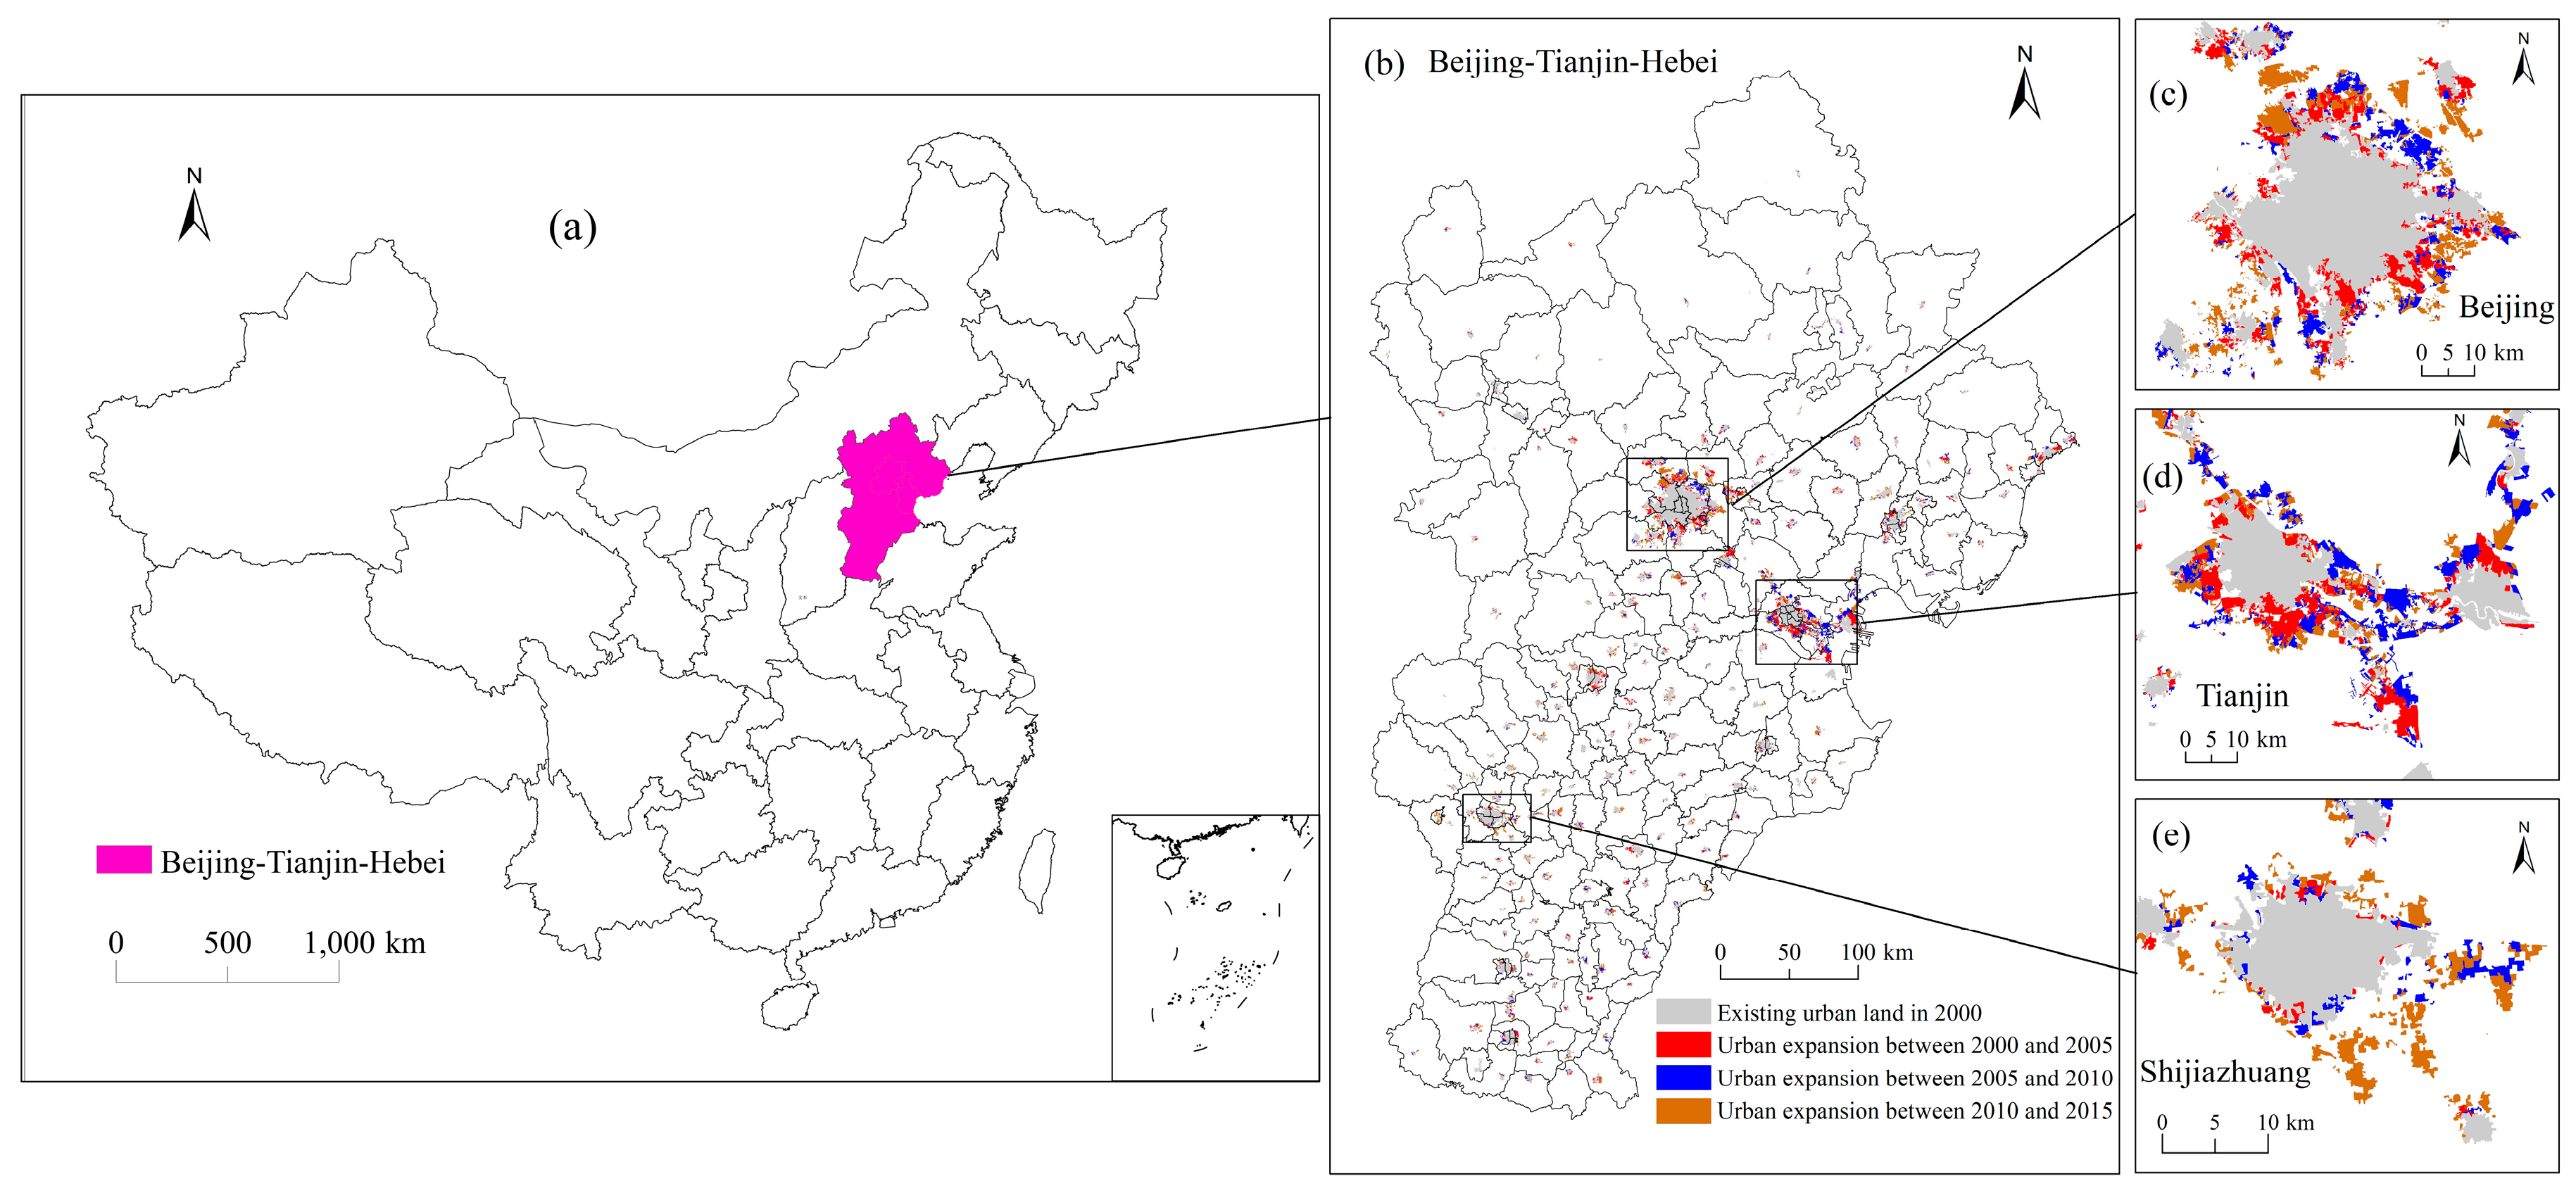
3.1. The Study Area

BTH is China’s “capital economic circle,” including Beijing, Tianjin, and 11 prefecture-level cities in the province of Hebei (Figure 1). In 2015, the Chinese government issued the Outline of the Beijing–Tianjin–Hebei Coordinated Development Plan, highlighting the role of the region in China’s development pattern. Coordinated development is an important measure to build a new modern capital circle. It is one of China’s three national strategies. The core of coordinated development is to break through administrative barriers, consider Beijing, Tianjin, and Hebei as a whole, promote a regional development system and mechanism innovation, and form a new pattern of coordinated development with integrated measures. The approval and construction of Xiongan New Area is an important decision and deployment for coordinated development. It will foster new regional growth poles in Hebei, optimize the urban layout, and adjust the urban system of Beijing, Tianjin, and Hebei.
At the end of 2015, the population of BTH was 111 million, accounting for 8.1% of the total population of China. The GDP was 6.94 trillion yuan, accounting for 10.1% of China’s total GDP. The urbanization rate of Beijing, Tianjin, and Hebei was 86.5%, 82.6%, and 51.3%, respectively. BTH is located at the juncture of coastal and inland areas. The terrain is high in the northwest and low in the southeast. The altitude drops in a semicircle from northwest to southeast. The northern part of the study area is the Bashang Plateau and the Yanshan Mountain Range, while the western part is the Taihang Mountain Range. The Hebei Plain, which lies to the east of the Taihang Mountain Range and to the south of the Yanshan Mountain Range, is part of the North China Plain. Hebei, which surrounds Beijing and Tianjin, is the only province in China that combines plateaus, mountains, hills, plains, lakes, and coasts. The study area is a typical temperate continental monsoon climate, which is characterized by high temperature and rain in summer and cold and dry in winter.

3.2. The Data Source

The data of urban land in this paper are from China’s 1:100,000 scale remote sensing monitoring database of land use. The database was constructed by Zengxiang Zhang and his team from the land resources remote sensing research department, Aerospace Information Research Institute, Chinese Academy of Sciences [48].
Based on remote sensing images, the vector boundary of urban built-up area was extracted using visual interpretation, human–computer interaction, and field verification. The remote sensing image was mainly Landsat images. If the quality of the Landsat images was poor or data was missing, a CBERS CCD image or HJ-1 CCD image is supplemented. Landsat images involve Landsat TM, ETM, ETM+, and OLI, with a spatial resolution of 30 m. To minimize the influence of mixed pixels, we selected images with lush vegetation in summer, with less than 10% cloud cover and a clear texture. To retain the most original spectral information and visual interpretation of ground objects, no atmospheric correction, color balance, or image enhancement was performed. Geometric precision correction was the key point of image preprocessing. Standard false-color was used to synthesize images of different bands. The space reference adopted a double standard parallel, equal area, and cut conic projection. The double parallel was 25° N and 47° N, the central meridian was 105° E, and the ellipsoid was Krasovsky [2]. The minimum standard for drawing graphics was 6 × 6 pixels. A remote sensing image with a spatial resolution of 30 m is equivalent to an actual area of 200 × 200 m2. The three remote sensing monitoring periods of urban land were 2000–2005, 2005–2010, and 2010–2015.
Population and GDP data were collected from the Hebei Economic Yearbook, the Beijing Regional Statistical Yearbook, the Beijing Statistical Yearbook, and the Tianjin Statistical Yearbook in 2001, 2006, 2011, and 2016.

3.3. Research Methods

3.3.1. Urban Expansion Index

The urban expansion index describes the speed of urban land growth during a given monitoring period. This index is divided into an absolute index (UEA) and a relative index (UER) [38]. UEA represents the annual urban expansion area, and UER represents the annual urban expansion rate. The definitions of UEA and UER are as follows:
U E A = U L e n d U L s t a r t T
U E R = U L e n d U L s t a r t U L s t a r t × 1 T × 100 %
where UEA is the absolute urban expansion index (km2), UER is the relative urban expansion index (%); ULstart and ULend represent the urban land area at the beginning and end of the monitoring period (km2), respectively; T is the time interval (years).

3.3.2. Spatial Autocorrelation

In this paper, Moran’s I is used to measure the global spatial autocorrelation of urban expansion in the study area. The formula is as follows [49]:
I = n i = 1 n j = 1 n W i j ( X i X ¯ ) ( X j X ¯ ) i = 1 n j = 1 n W i j i = 1 n ( X i X ¯ ) 2
where I is the Moran Index; Xi and Xj represent the attribute values of space units i and j, respectively; ( X ¯ ) is the average value of the attributes of the n-many spatial units; Wij is a spatial weight matrix. The range of Moran’s I is [−1, 1]. If Moran’s I is significantly positive, there is a significant positive correlation between urban land, and the variable presents a clustering distribution pattern. If Moran’s I is significantly negative, there is a significant negative correlation between urban land, and the variable presents a dispersed distribution pattern. If Moran’s I is close to 0, there is no spatial autocorrelation, and the variables are randomly distributed in space. We used the first order rook spatial weight for characterizing neighbors. Z-score tests whether the spatial position pattern is significant.
The Moran’s I uses a single value to reflect the “global” spatial autocorrelation of values over the whole dataset [50]. Hence, we used the local indicators of spatial association (LISA) statistic to identify the spatial agglomeration of the urban land variables [51]. LISA checks whether similar or dissimilar values are clustered in a local area [52]. LISA includes four types: High–high (HH), low–low (LL), high–low (HL), and low–high (LH) [53]. Moran’s I and LISA statistics were calculated using GeoDa (version 1.12) software [54]. LISA values were visualized using ArcGIS (Version 10.2) software.

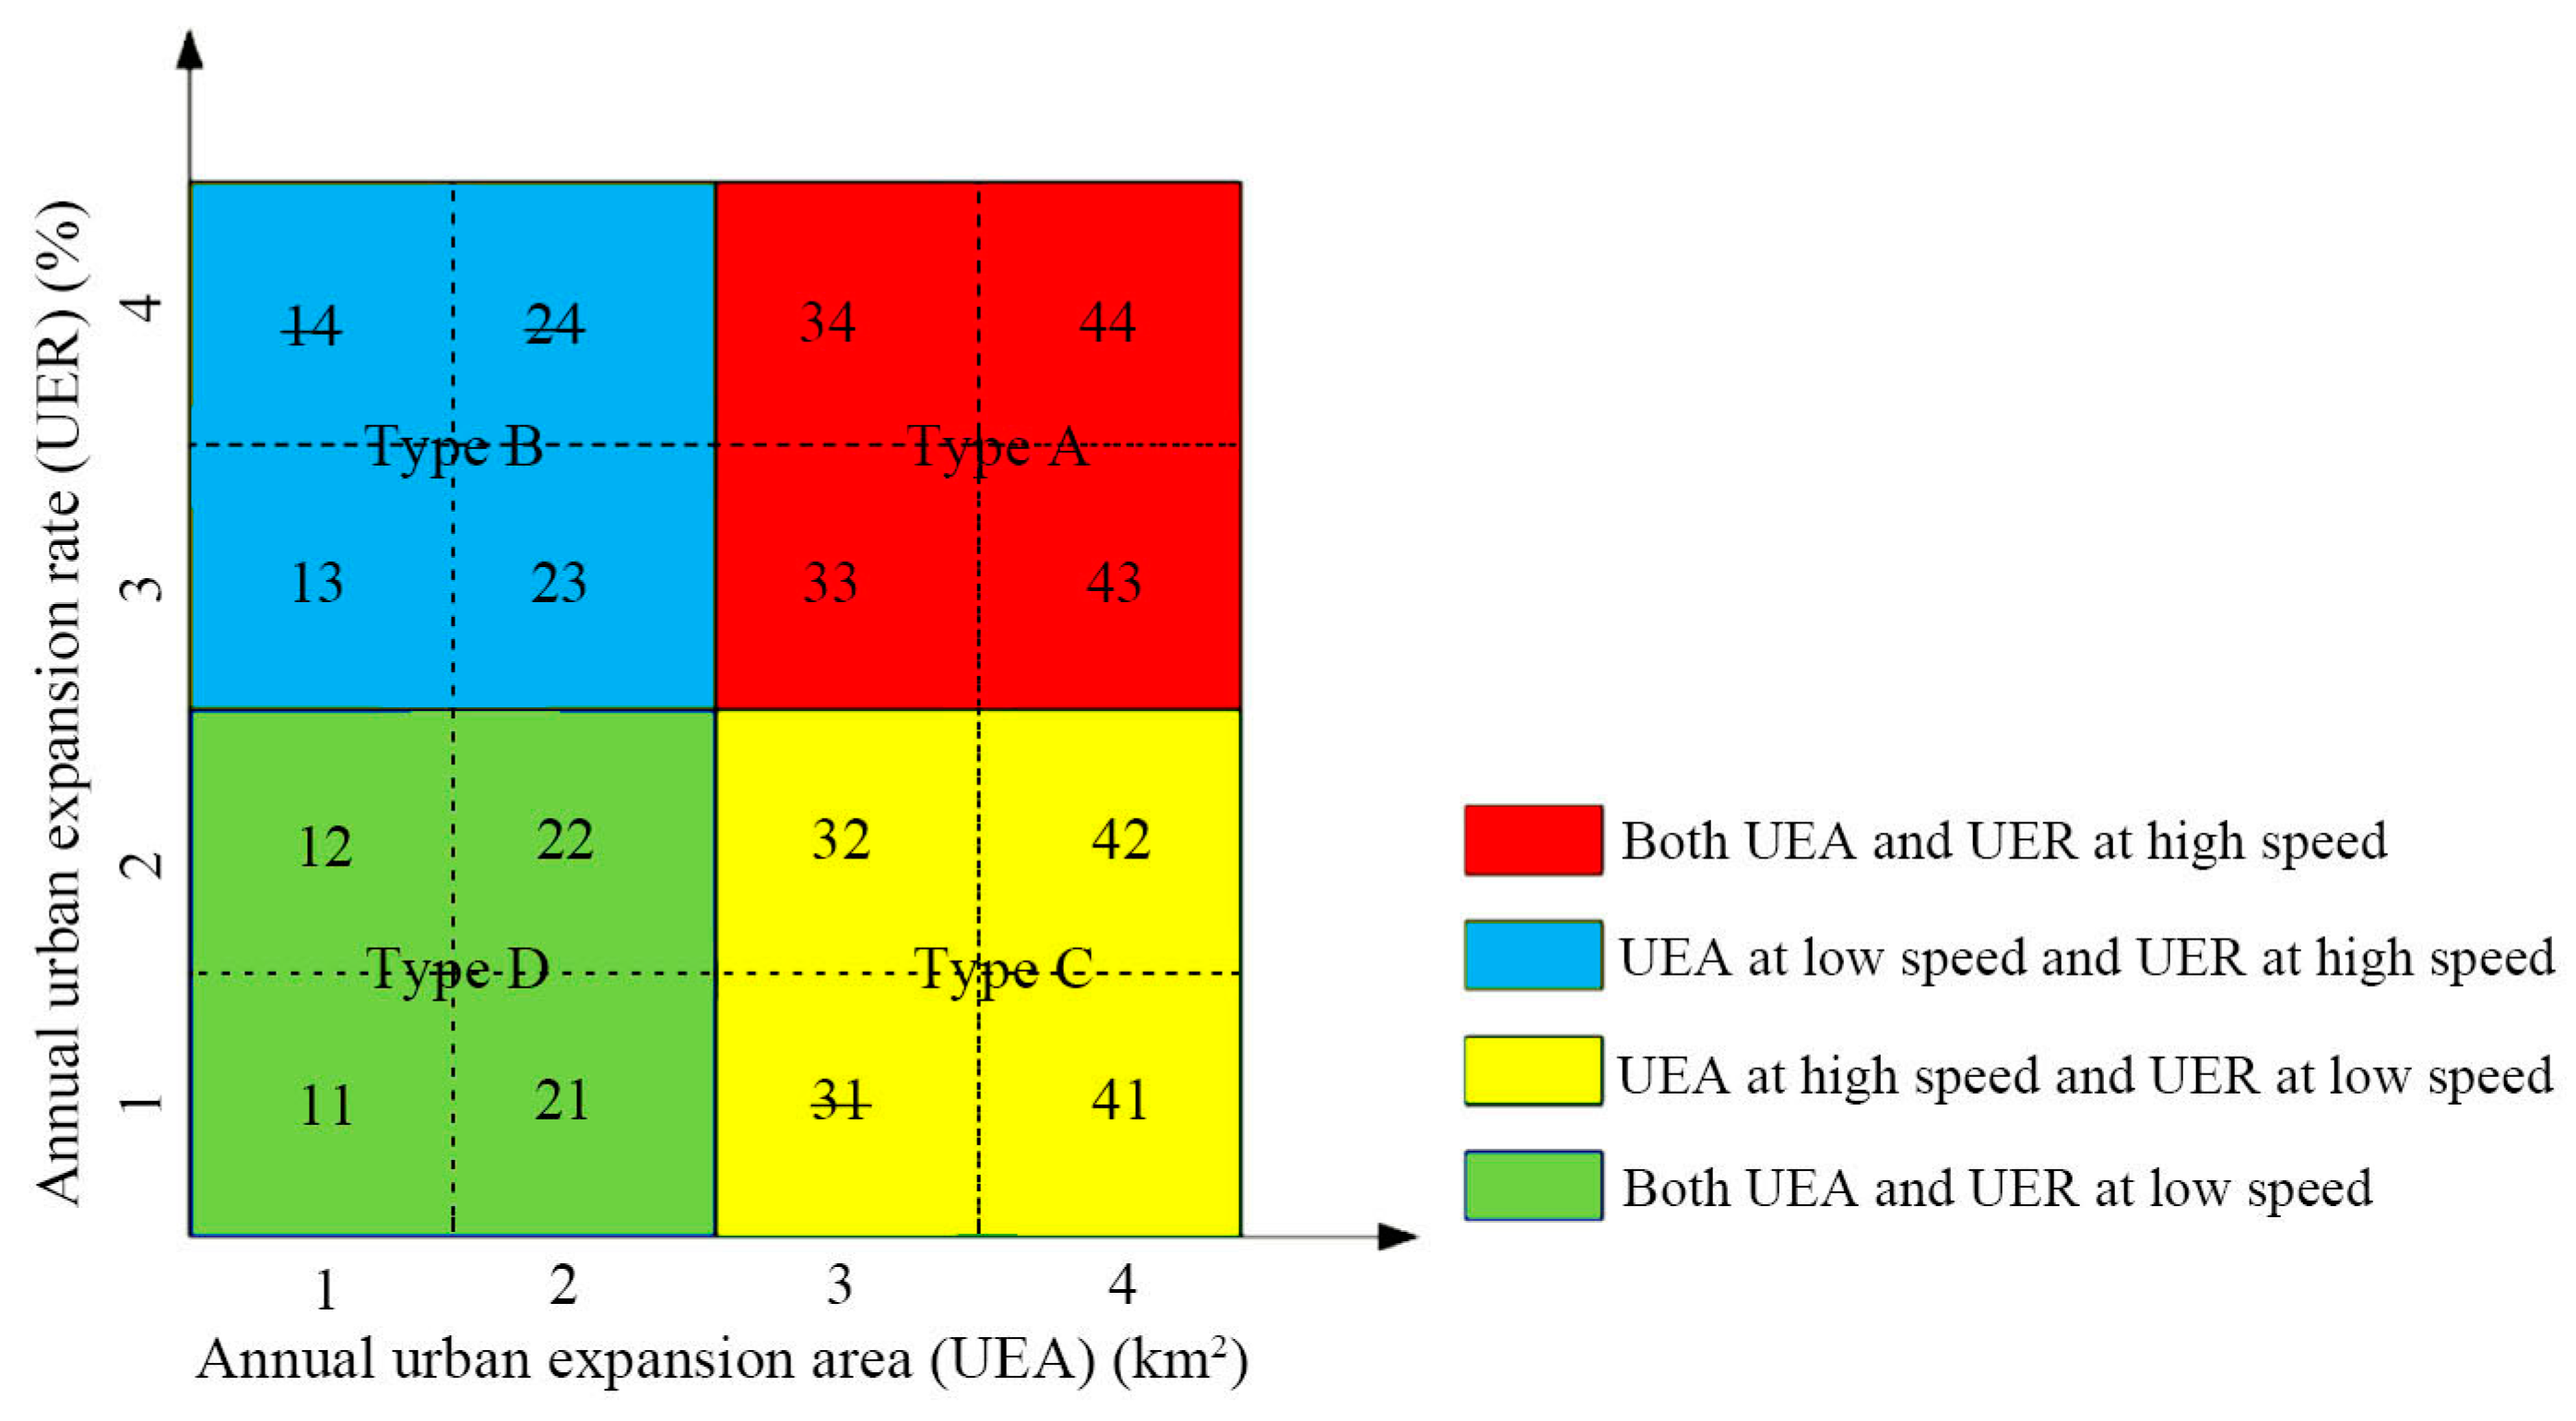
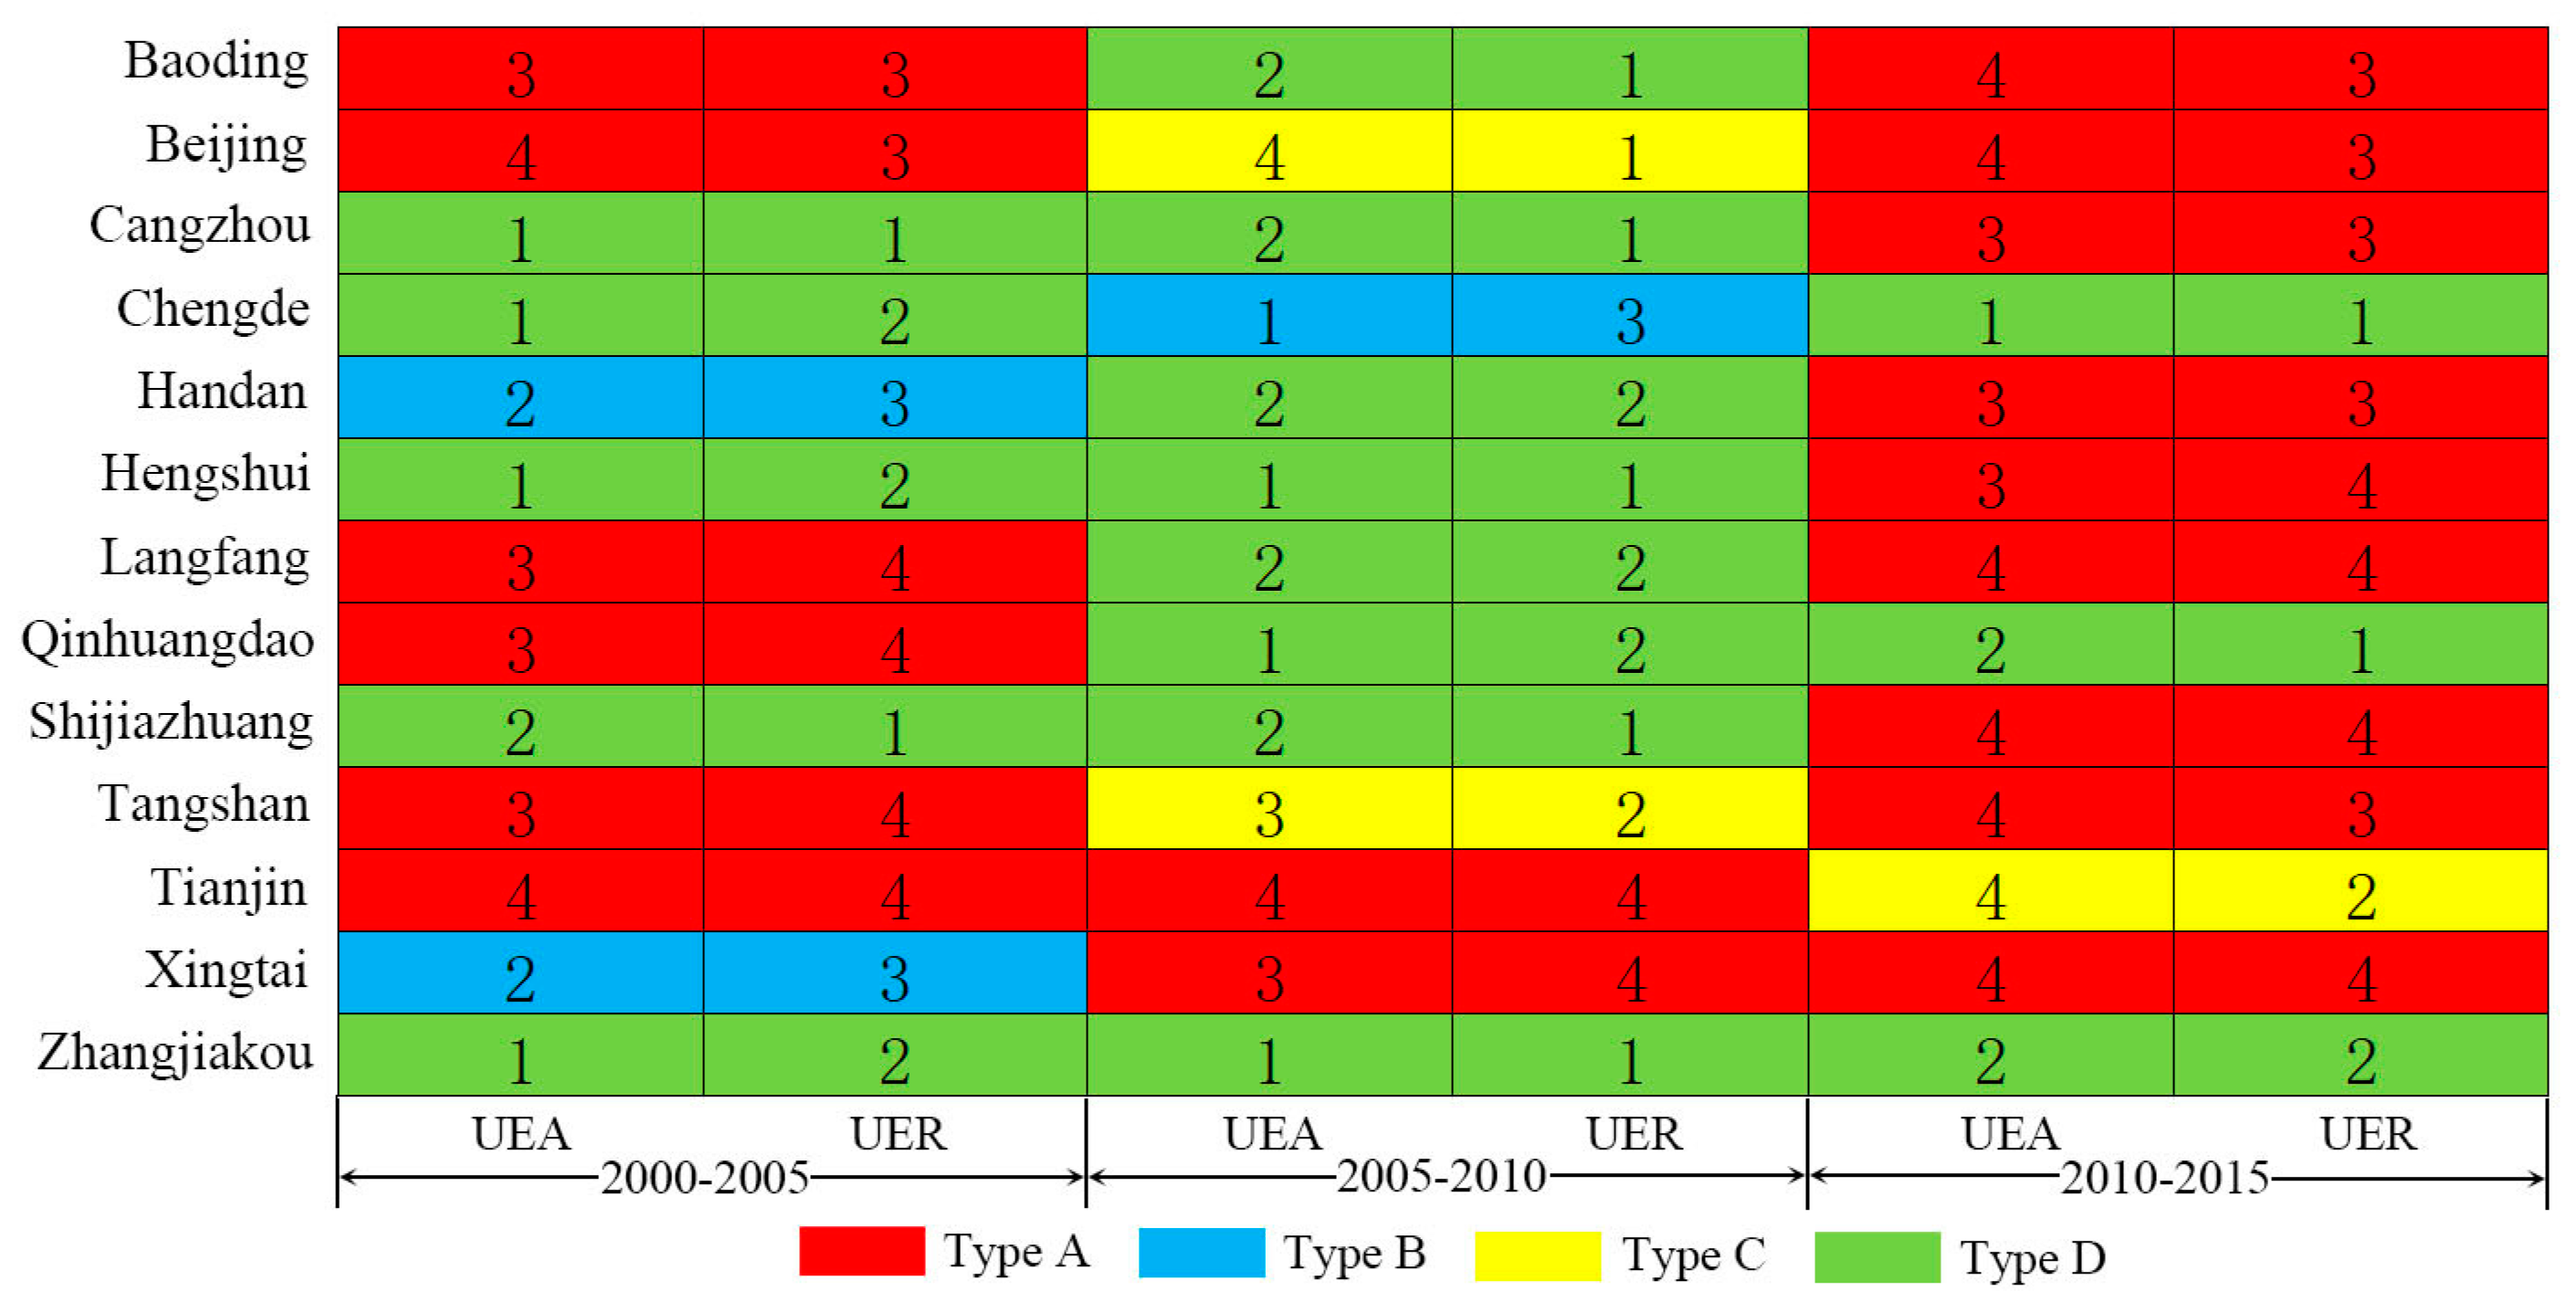
3.3.3. Classifying Urban Expansion Types

Based on the approach proposed by Shi et al. [40], we introduce a new method to classify urban expansion type by the following steps:
Step 1.
The UEA and UER in 2000, 2005, 2010, and 2015 are calculated for each city.
Step 2.
All UEA and UER values are standardized using standard deviation standardization.
Step 3.
The normalized UEA and UER are divided into four classes according to the quartile. The four classes are Grade 1 (minimum, lower quartile), Grade 2 (lower quartile, median), Grade 3 (median, upper quartile), and Grade 4 (upper quartile, maximum), respectively.
Step 4.
A chunked matrix (4 by 4) is created to list the combinations of UEA and UER (Figure 2). The first and second numbers represent the grade of the UEA and UER, respectively. Some combinations are crossed out because they do not exist in the 13 cities.
Step 5.
The combination of UEA and UER is divided into four urban expansion types.
Type A represents a double high speed for both UEA and UER. Type B defines UEA at low speed and UER at high speed. Type C describes UEA at high speed and UER at low speed. Type D stands for double low speed for both UEA and UER.

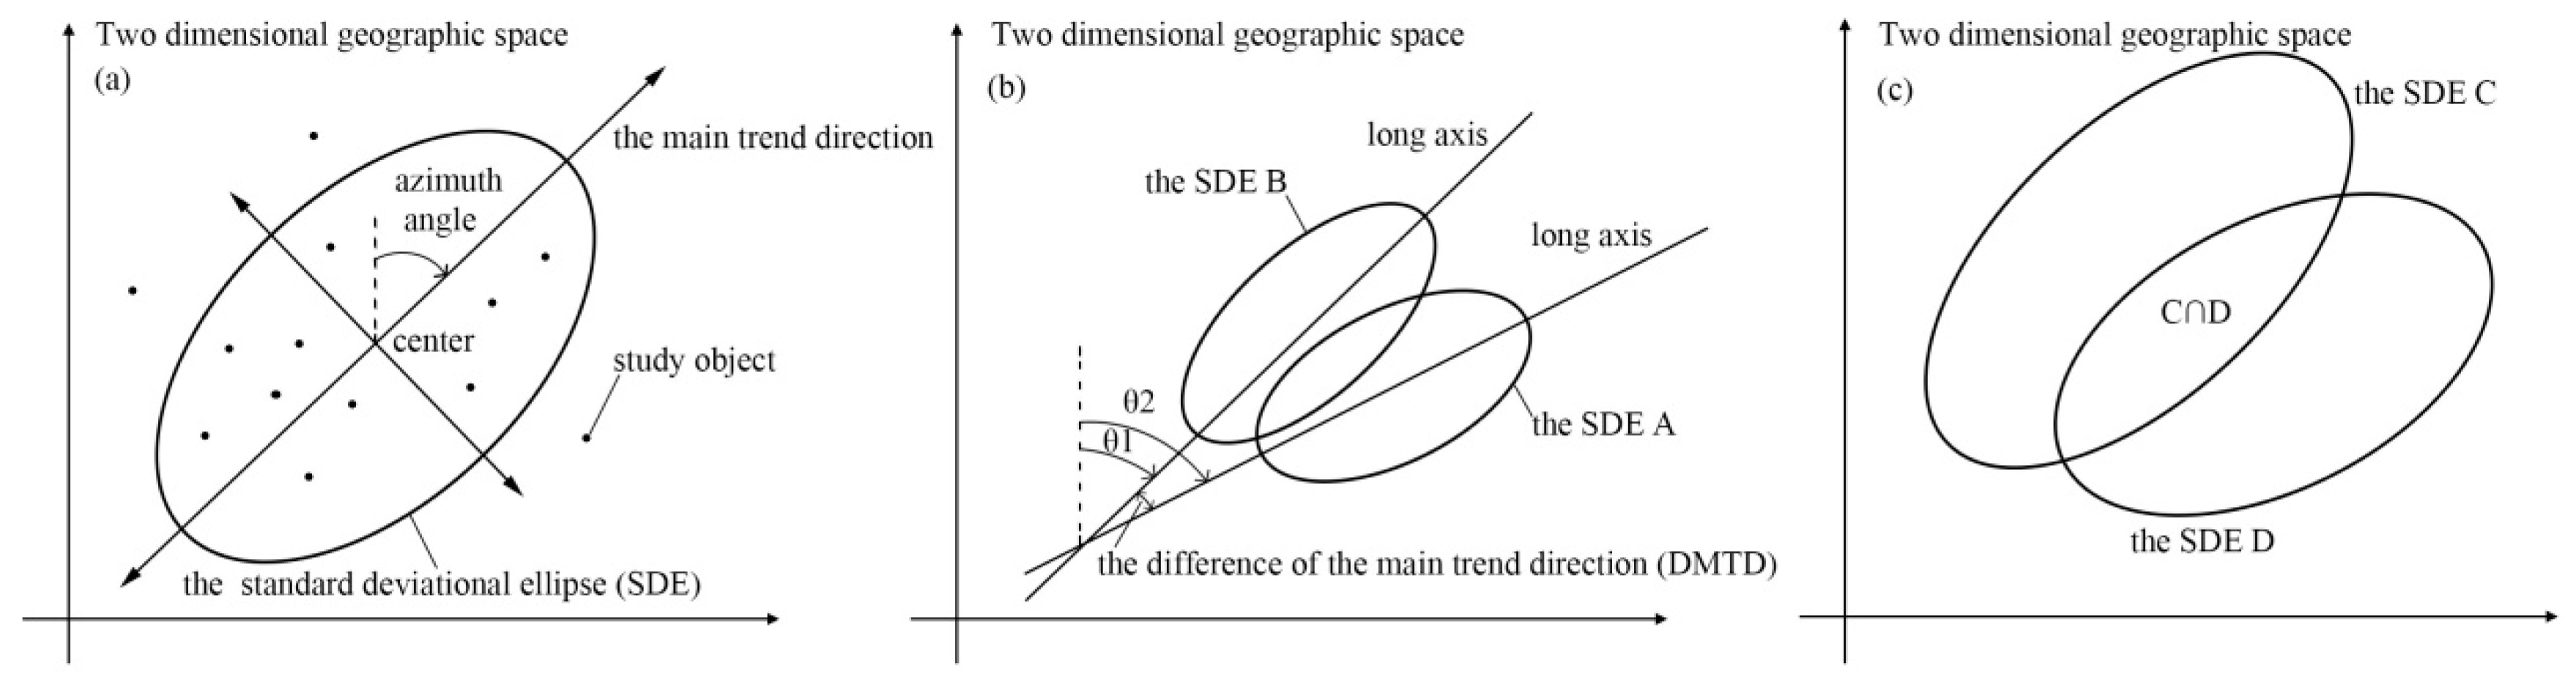
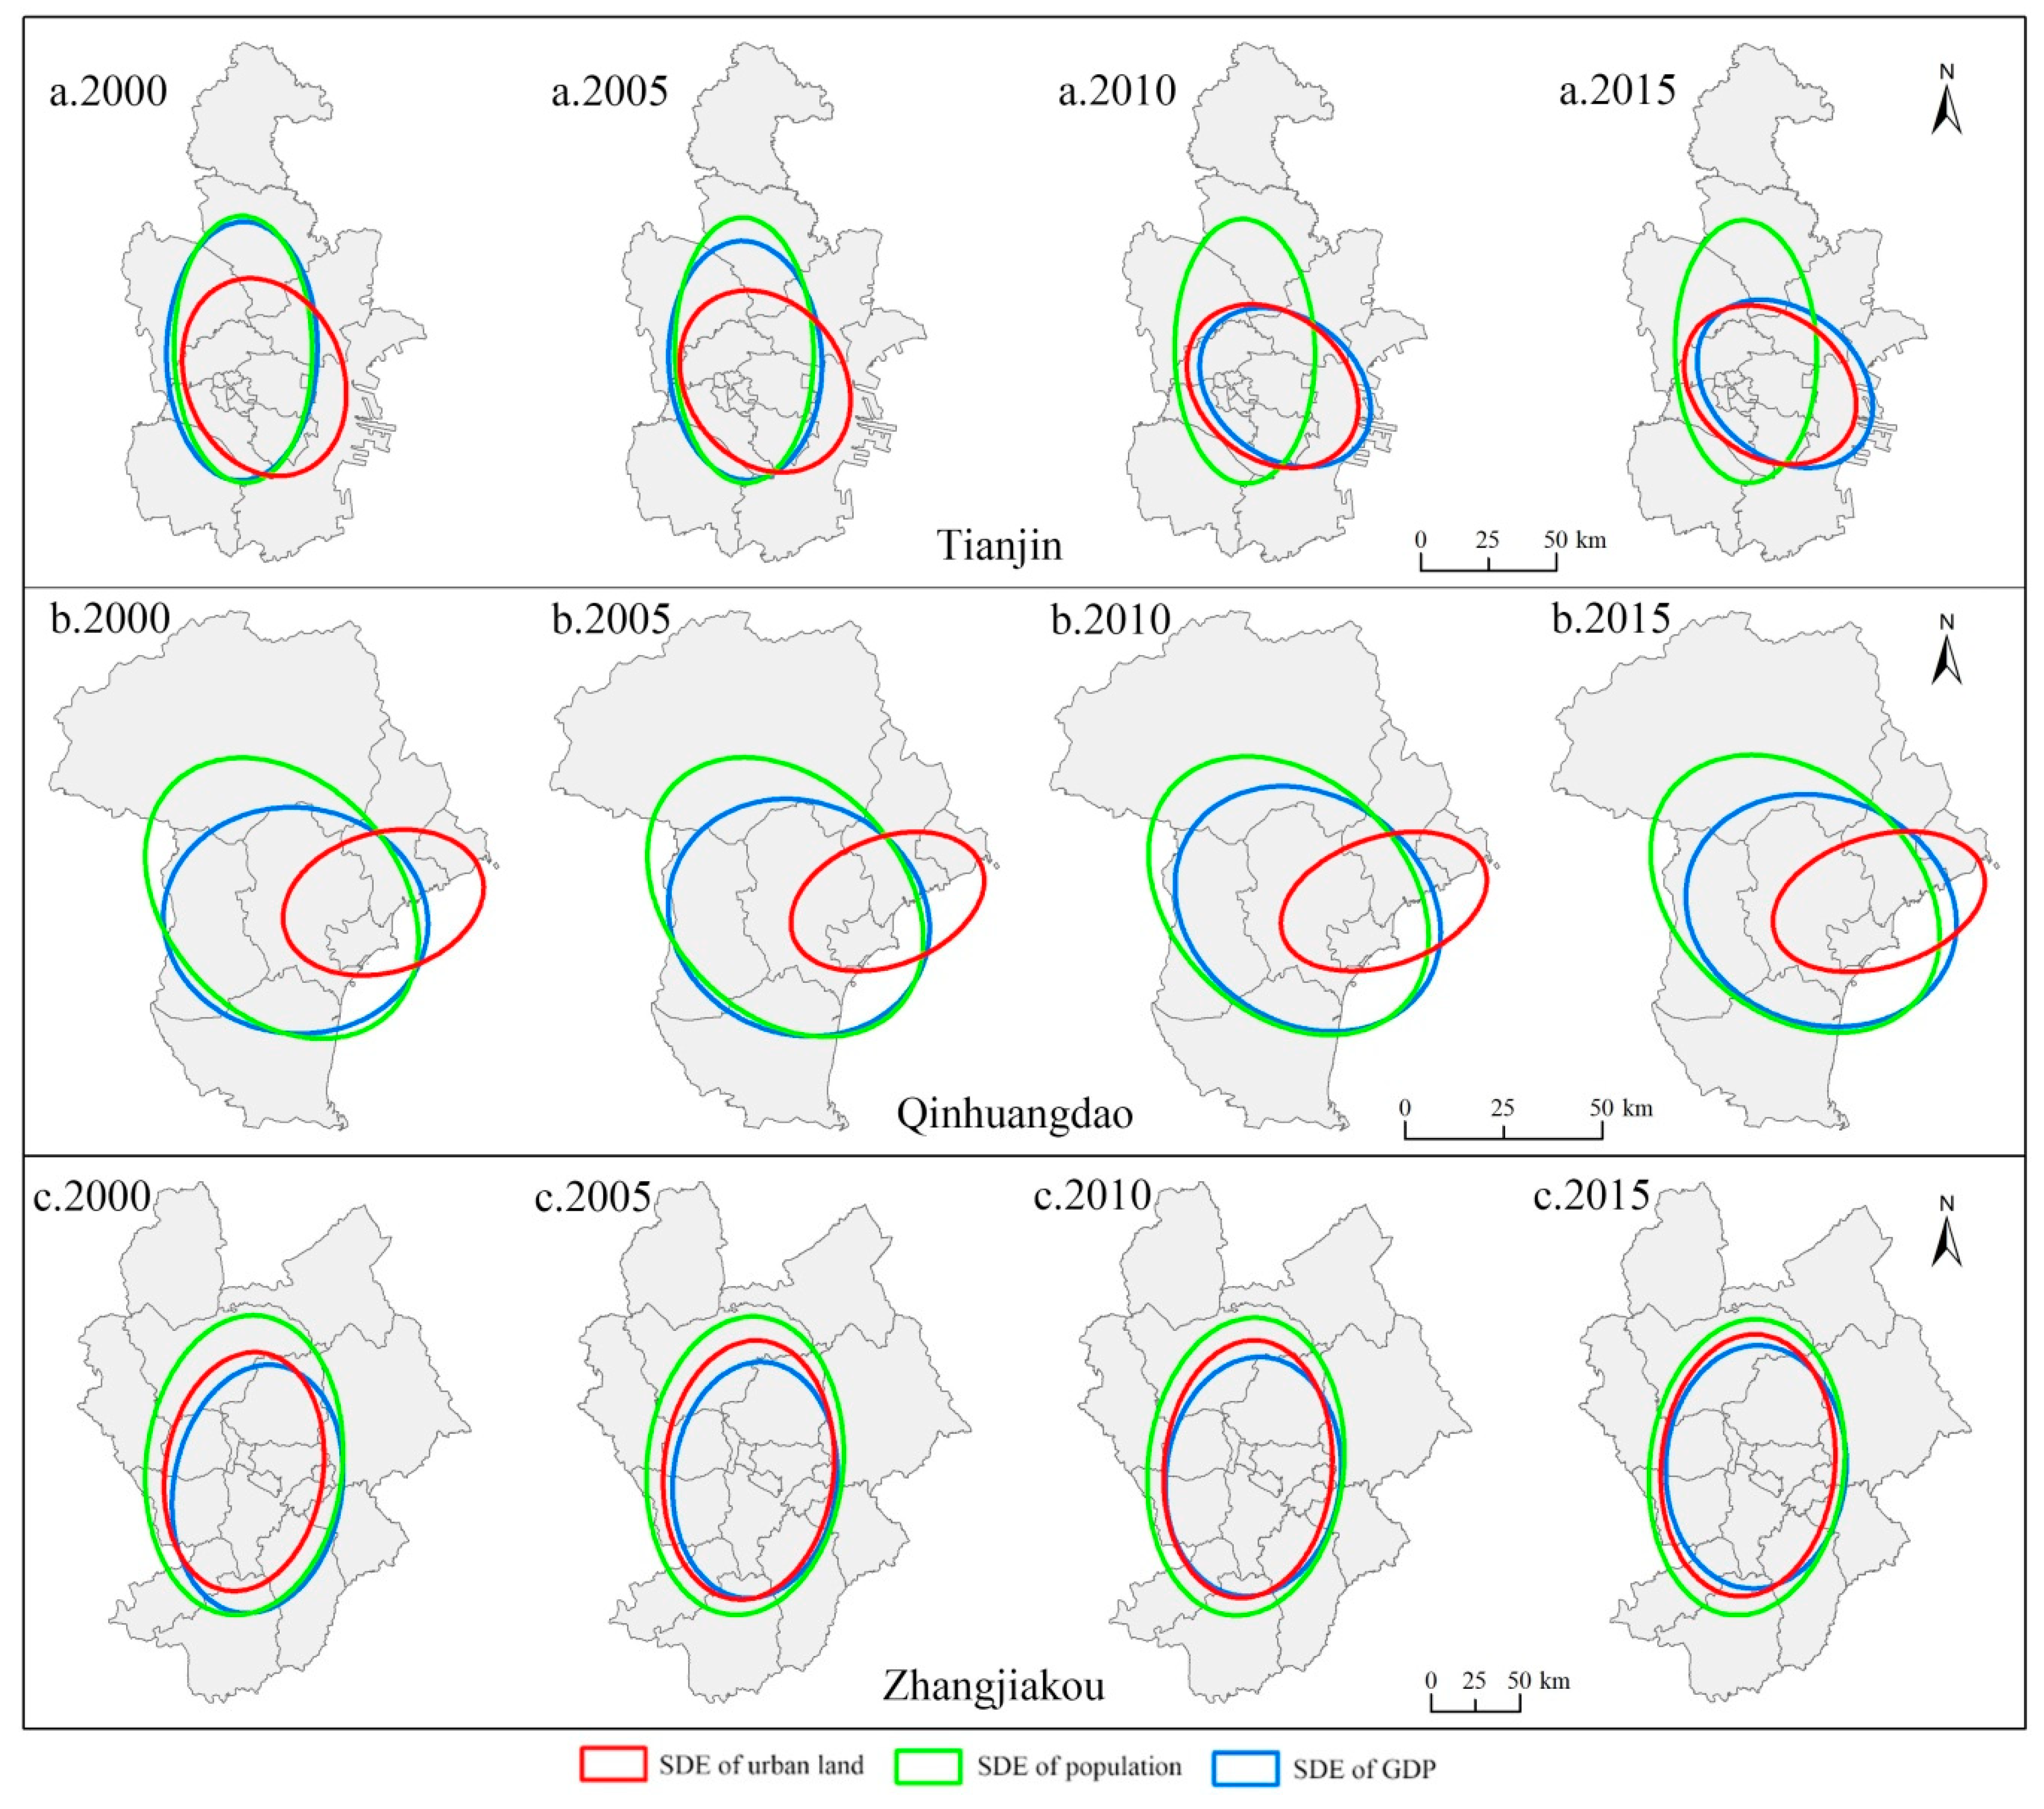
3.3.4. Standard Deviation Ellipse

The Standard Deviational Ellipse (SDE) is a classical method that reveals directional features of spatial distribution [55]. The spatial pattern and dominant direction of spatial elements can be measured well by the SDE. The center of the SDE represents the center of gravity of the urban land layout and its changes. The standard deviations of the long and short axes represent the concentration density of urban land, GDP, or population. The azimuth angle of the SDE reflects the main trend direction of their distribution [56]. It is the angle of rotation clockwise from north to the long axis of the SDE (Figure 3a). In this paper, we used the acute angle formed by the long axis of the two SDEs to represent the difference of its main trend direction (DMTD) (Figure 3b). The DMTD is a new method proposed by us to represent the difference of the main trend direction of the spatial distribution of geographical objects. The definition of DMTD is as follows:
D M T D = { θ 2 θ 1 i f   r e s u l t < 90 180 ( θ 2 θ 1 ) i f   r e s u l t > 90
where θ 2 and θ 1 are azimuth angles of the SDE A and the SDE B, respectively; the word “result” in the formula refers to the value of θ 2 minus θ 1 . Zhao et al. introduced the calculation method of azimuth angle in detail [57].
The spatial difference index (SDI) describes quantitatively the degree of spatial difference between different distributions (Figure 3c) [57]. The value of SDI is between 0 and 1. The greater the value of SDI, the greater the spatial difference is. The definition of SDI is as follows:
S D I = 1 A r e a ( S D E C S D E D ) A r e a ( S D E C S D E D )
where S D E C and S D E D are the SDE of C and D, respectively (Figure 3c). A r e a ( S D E C S D E D ) and A r e a ( S D E C S D E D ) refer to the area of the intersection or union of two ellipses, respectively.

4. Results

4.1. Temporal and Spatial Characteristics of Urban Expansion

4.1.1. The Expanding Characteristics of Cities with Different Administrative Position

In 2000, the total urban land area of BTH was about 3574 km2, and the cities with a built-up area of more than 200 km2 only included Beijing and Tianjin. In 2015, the total urban land area was about 6829 km2, and the cities with a built-up area greater than 200 km2 included Beijing, Tianjin, Shijiazhuang, Tangshan, and Baoding. Tianjin had the most significant urban expansion during 2000–2015. Its expansion area was 904 km2, accounting for nearly 40% of the total expansion area of BTH.
In Table 1, the annual expansion area of BTH first decreased slightly and then increased dramatically during 2000–2015. In the three monitoring intervals from 2000–2005, 2005–2010, and 2010–2015, the annual expansion area of counties, county-level cities, and prefecture-level cities decreased first and then increased, while the annual expansion area of megacities increased first and then decreased. Within the three monitoring intervals, the types with the largest annual expansion area and the largest contribution to urban land expansion are megacities. This indicates that, in BTH, the urban expansion speed of Beijing and Tianjin is always ahead of that of Hebei, and the polarization characteristics of urban expansion are prominent.
The annual expansion rate of BTH first decreased and then increased, and the decreased value was greater than the increased value. The annual expansion rate of counties, county-level cities, and prefecture-level cities decreased first and then increased, while that of megacities decreased the entire time. The annual expansion rate of megacities was higher than that of counties, county-level cities, and prefecture-level cities during 2000–2005 and 2005–2010. The annual expansion rate of counties was higher than that of county-level cities, prefecture-level cities, and megacities during 2010–2015.
The skewness coefficients of the annual expansion area and annual expansion rate are all greater than 0, and the mean value is greater than the median, indicating that the frequency distribution is all right-skewed (Table 2). In the distribution, the number of districts/counties below the mean is higher, and the number of districts/counties above the mean is lower. The heavy tail of the distribution is on the right, meaning that there is a large value at the right end. The degree of right deviation of the annual expansion area during 2000–2015 is greater than the annual expansion rate, indicating that the maximum value of the annual expansion area is far from the mean value.
The kurtosis coefficients of the annual expansion area and annual expansion rate are all greater than 3 in the three monitoring periods, indicating that the frequency distribution curves are all steeple-tailed compared with the normal distribution, and the data are concentrated in the peak center. The kurtosis coefficient of the annual expansion area during 2000–2015 is much higher than the annual expansion rate, and the annual expansion area distribution curve has a more obvious peak. The kurtosis coefficient of the annual expansion area during 2005–2010 reaches 98.9, because the annual expansion area of the Daxing district is much larger than that of other districts and counties. The kurtosis coefficients of the annual expansion area and annual expansion rate during 2010–2015 were close to each other.

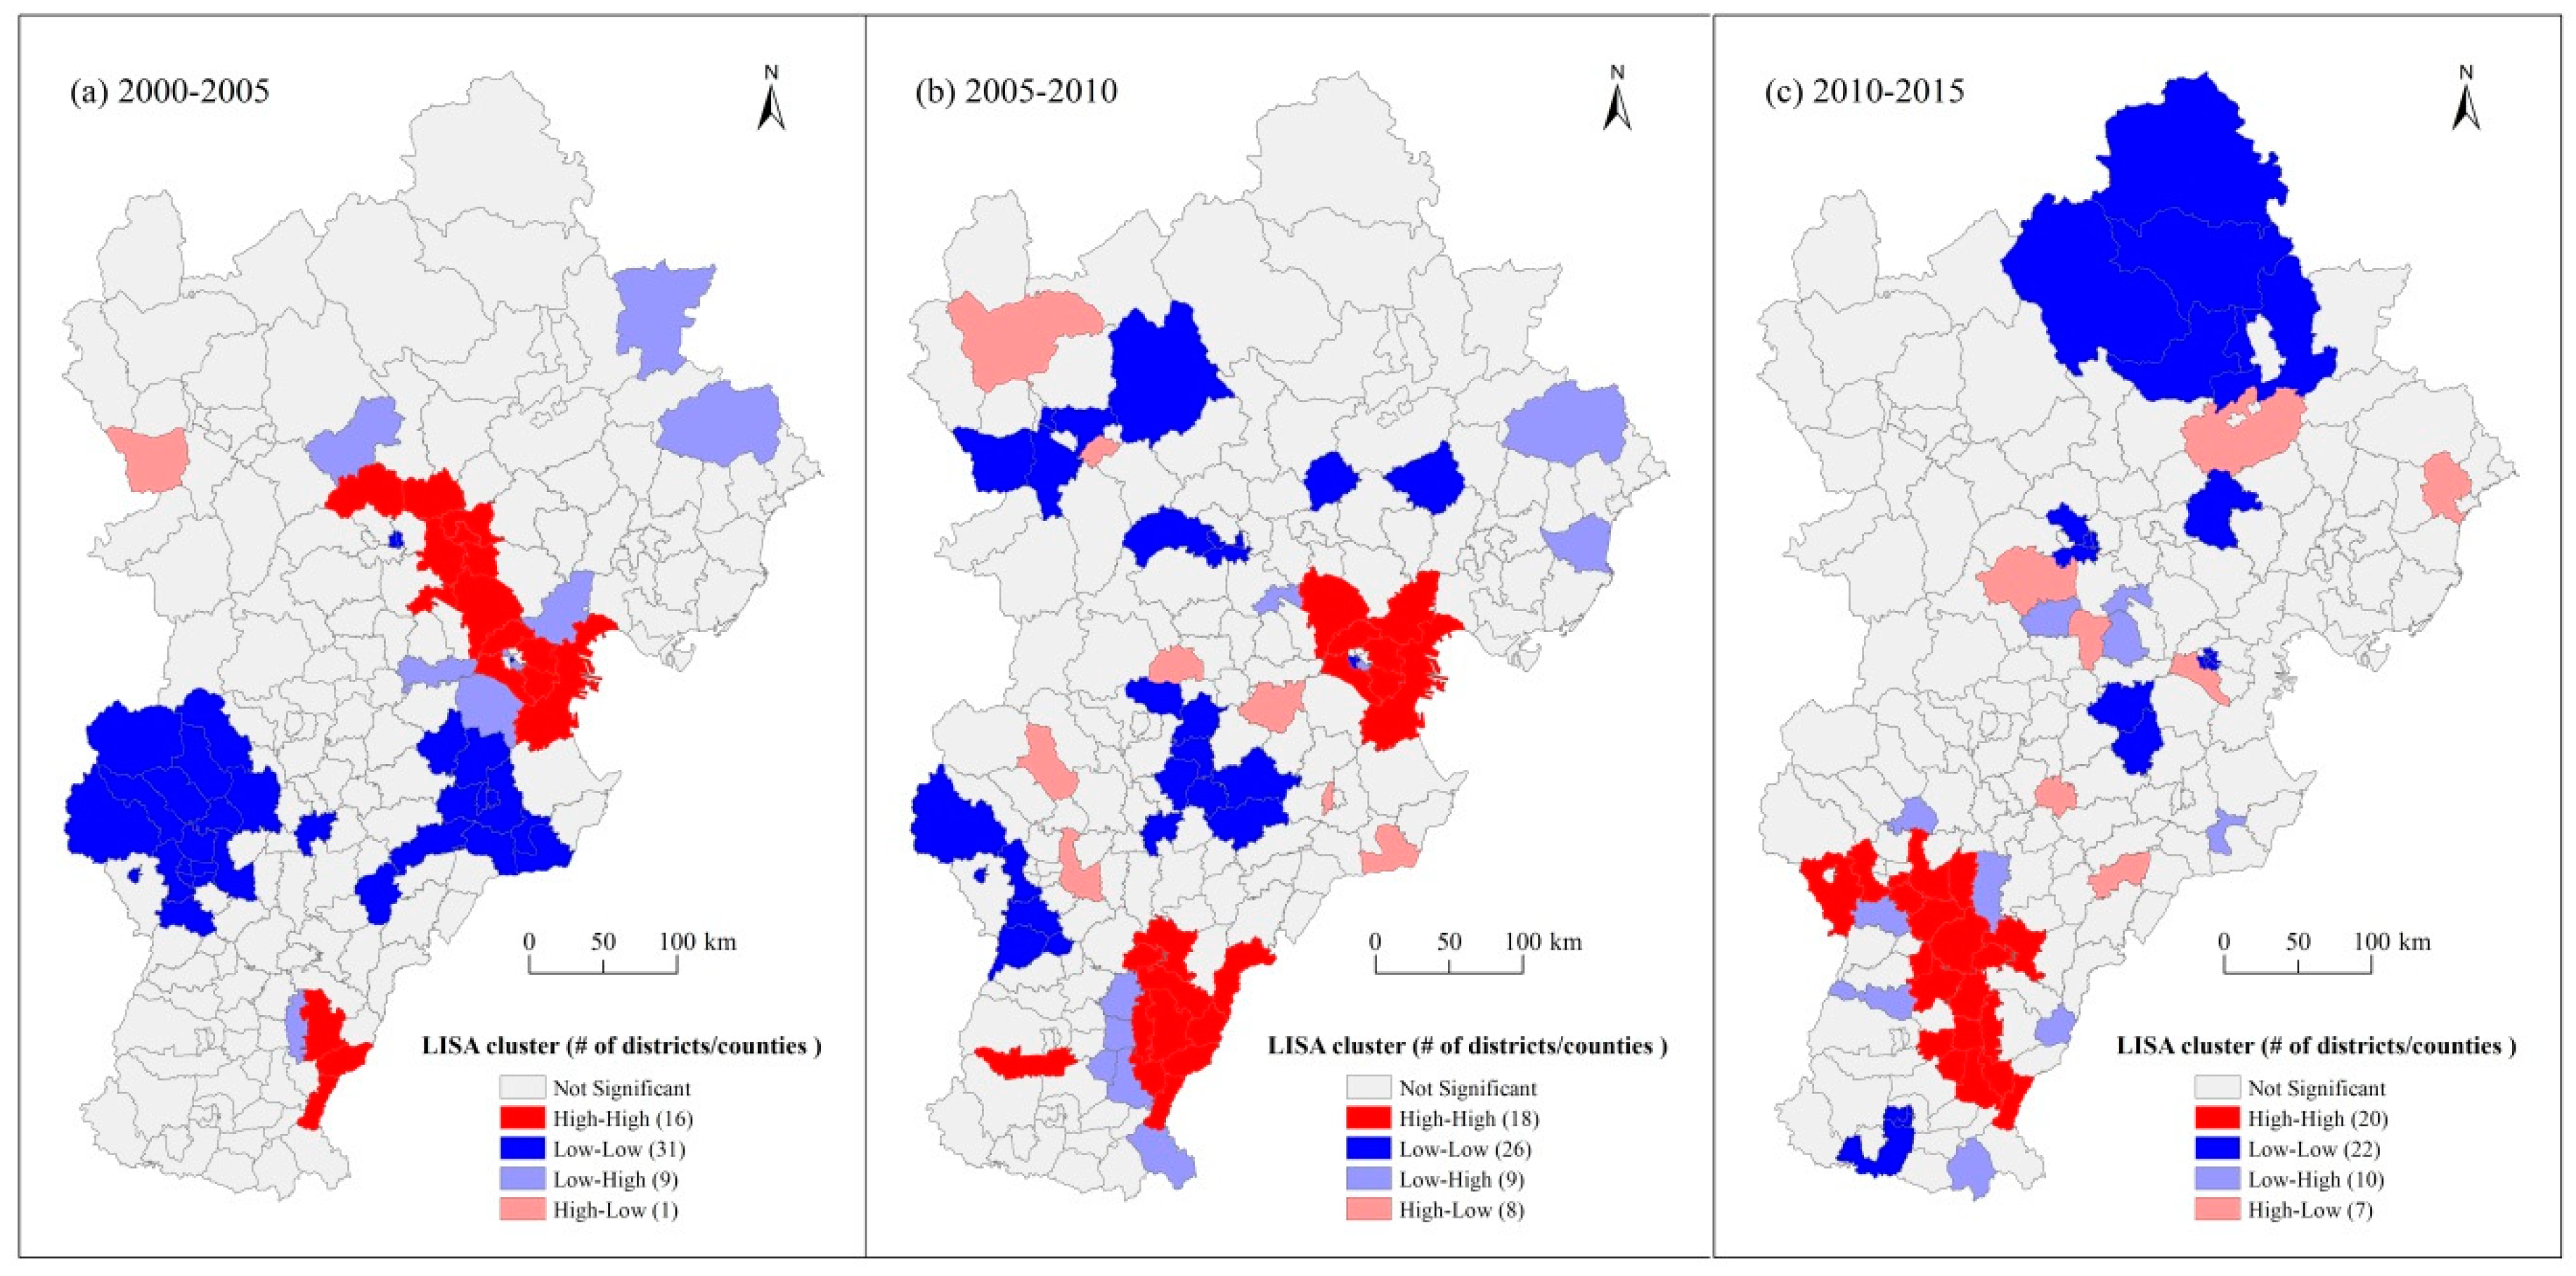
4.1.2. Characteristics of Urban Expansion Based on Spatial Autocorrelation

The global Moran’s I and Local Moran’s I of the annual expansion area and annual expansion rate in the three monitoring periods (2000–2005, 2005–2010, and 2010–2015) were calculated by using 202 districts/counties in BTH as spatial units. First, global Moran’s I was used to measure the overall spatial autocorrelation of urban expansion at the BTH level (Table 3). Local Moran’s I was then used to identify the spatial autocorrelation of urban expansion at the district/county level. We used a LISA map to show the spatial clustering characteristics of the annual urban expansion area (Figure 4) and the annual urban expansion rate (Figure 5).
(1)
Annual Urban Expansion Area.
The global Moran’s I of the annual urban expansion area for the three monitoring periods are 0.3199, 0.2674, and 0.3141, respectively (Table 3), which all passed the significance test under a 99% confidence degree. The distribution of the annual urban expansion area shows an obvious clustering characteristic, and the clustering characteristic first decreased and then increased. The spatial autocorrelation between districts/counties and adjacent districts/counties can be determined according to local Moran’s I. The characteristics are as follows: (1) The high–high clusters decreased from 23 to 15 and then increased to 17 in the three monitoring periods. The high–high clusters were mainly distributed in Beijing during 2000–2005, moved from Beijing to Tianjin during 2005–2010, and then moved back from Tianjin to Beijing during 2010–2015. The high–high clusters of Beijing and Tianjin showed a seesaw distribution pattern during 2000–2010 and formed a dumbbell distribution pattern during 2010–2015. The high–high clusters of Hebei were only significant in the municipal district of Baoding and the Shanhaiguan district of Qinhuangdao during 2000–2005 and in the Fengnan district of Tangshan from 2000 to 2010. The high–high clusters of Hebei were no longer significant during 2010–2015. (2) The low–low clusters were distributed in the south and west of Beijing and Tianjin. The low–low clusters significantly moved north to the 23 counties of the jurisdiction of Zhangjiakou and Chengde. In the south, there are only four counties in Cangzhou, Zanhuang in Shijiazhuang, and five counties in Handan. (3) The low–high outliers were distributed around the high–high clusters in Tianjin from 2000 to 2010, and it was mainly distributed in four districts/counties in the northwest of high–high clusters in Beijing from 2010 to 2015. The high–low outliers were only significant in Renqiu from 2010 to 2015.
(2)
Annual Urban Expansion Rate
The global Moran’s I of the annual urban expansion rate in the three monitoring periods were 0.1945, 0.2245, and 0.1217, respectively (Table 3), which all passed the significance test under a 99% confidence degree. The distribution of the annual urban expansion rate shows an obvious clustering characteristic, and the clustering characteristic first increased and then decreased. The spatial correlation between districts/counties and adjacent districts/counties can be determined according to local Moran’s I. The characteristics are as follows: (1) The high–high clusters increased from 16 to 18 and then to 20 in the three monitoring periods. The high–high clusters were distributed in 13 districts/counties between Beijing, Tianjin, and Langfang and in 3 counties in the southeast of Hebei. The high–high clusters have a significant movement in the southeast direction during 2005–2010. Beijing is no longer significant. The Ninghe district was added to Tianjin, and the high–high clusters of Southeastern Hebei increased from 3 to 10 counties. From 2010 to 2015, Tianjin was no longer significant. The high–high clusters of Hebei moved to the northwest, and the number increased from 10 to 20 districts/counties, which were located in the surrounding districts/counties of provincial road 234 and the Qingyin expressway. (2) The low–low clusters gradually moved from central and southern Hebei to the six counties in the north of Chengde during the three monitoring periods, and the second monitoring period was more dispersed. (3) The low–high outliers scattered in the periphery of high–high clusters. The distribution of high–low outliers was relatively scattered, and the common feature was that the annual urban expansion rate of a certain district/county was significantly higher than the weighted average of the surrounding districts/counties.

4.2. Types and Trends of Urban Expansion

The annual urban expansion area was classified into 1, 2, 3, and 4 levels. We refer to Levels 1 and 2 of the annual expansion area as “low speed” levels and to Levels 3 and 4 as “high speed” levels. Similarly, Levels 1 and 2 of the annual urban expansion rate are called “low speed” levels, and Levels 3 and 4 are called “high speed” levels. The combination of the annual urban expansion area and the annual urban expansion rate form Types A, B, C, and D (Figure 2). The combination types of Type A are 33, 34, 43, and 44. The level of the annual urban expansion area and the annual urban expansion rate are either 3 or 4. In this paper, Type A is called the “double high speed” of urban expansion. The combination types of B are 13 and 23, and the combination types of Type C are 32, 41, and 42. One of the two single indicators of the annual urban expansion area and the annual urban expansion rate is the “low speed” level, and the other is the “high speed” level. In this paper, Types B and C are called the “single high speed” of urban expansion. The combination types of Type D are 11, 12, 21, and 22, and the levels of both single indicators are 1 or 2. In this paper, Type D is called the “double low speed” of urban expansion.
The expansion types of Baoding and Langfang were Type A, Type D, and Type A during 2000–2005, 2005–2010, and 2010–2015, respectively (Figure 6). Their expansion processes were “double high speed,” “double low speed,” and “double high speed” and presented an obvious U-shaped trend. The expansion types of Beijing and Tangshan were Type A, Type C, and Type A during the three monitoring periods, respectively. Their expansion processes were “double high speed,” “single high speed,” and “double high speed” and presented a U-shaped trend. The expansion types of Handan were Type B, Type D, and Type A during the three monitoring periods, respectively. Their expansion processes were “single high speed,” “double low speed,” and “double high speed” and presented a U-shaped trend.
The expansion types of Shijiazhuang, Cangzhou, and Hengshui were Type D, Type D, and Type A, respectively, during the three monitoring periods. Their expansion processes were “double low speed,” “double low speed,” and “double high speed” and presented an obvious upward trend. The expansion types of Xingtai were Type B, Type A, and Type A during the three monitoring periods, respectively. Its expansion processes were “single high speed,” “double high speed,” and “double high speed” and presented an upward trend.
The expansion types of Tianjin were Type A, Type A, and Type C, respectively, during the three monitoring periods. Its expansion processes were “double high speed,” “double high speed,” and “single high speed”. The expansion types of Qinhuangdao were Type A, Type D, and Type D during the three monitoring periods, respectively. Its expansion processes were “double high speed,” “double low speed,” and “double low speed.” The expansion processes of Tianjin and Qinhuangdao presented a downward trend.
The expansion types of Zhangjiakou were Type D, Type D, and Type D during the three monitoring periods, respectively. Its expansion processes were “double low speed,” “double low speed,” and “double low speed” and presented a steady low speed trend. The expansion types of Chengde were Type D, Type B, and Type D during the three monitoring periods, respectively. Its expansion processes were “double low speed,” “single high speed,” and “double low speed” and presented an inverted U-shaped trend.
The distribution of the four expansion types was uneven in 13 cities during 2000–2015 (Table 4). Type A was the most important expansion type. Its area is 2264.26 km2, accounting for 69.56% of the total expansion area. Type A was distributed in 11 cities. Only Zhangjiakou and Chengde did not contain Type A. Type A includes Tianjin (675.93 km2), Beijing (585.80 km2), Baoding (181.56 km2), Langfang (151.03 km2), Tangshan (149.34 km2), Shijiazhuang (146.12 km2), Xingtai (138.54 km2), Handan (70.89 km2), Cangzhou (69.28 km2), Hengshui (48.62 km2), and Qinhuangdao (47.15 km2), according to the expansion area. The total area of Type A in Tianjin and Beijing accounted for up to 55.72% of the total area of Type A. Baoding, Langfang, and Tangshan, with a larger area of Type A, were distributed around Beijing and Tianjin. The Type A area of Shijiazhuang was in the middle of 11 cities. The total area of Type B was 318.44 km2, accounting for 9.78% of the total expansion area. It was distributed in Tianjin, Handan, Xingtai, and Chengde. Type C was the smallest expansion type. Its total area was 293.42 km2, accounting for 9.01% of the total area. Type C was only distributed in Beijing, Tangshan, and Handan. Type D was the expansion type second only to Type A, whose total area was 379.09 km2, accounting for 11.65% of the total expanded area. The area of Type D was only less than that of Type A. Its total area was 379.09 km2, accounting for 11.65% of the total expansion area. Type D was distributed in eight cities, and the distribution in these cities was relatively even.

4.3. Spatial Coevolution of Urban Land, GDP, and Population

4.3.1. The Difference of the Main Trend Direction of the Spatial Distribution

The difference of the main trend direction of urban land and GDP (UG) and that of urban land and population (UP) in the 13 cities of BTH are shown in Table 5. The UG and UP of Qinhuangdao were the largest among the 13 cities during 2000–2015 (UG was slightly smaller than Tianjin and Xingtai in 2000). This showed that Qinhuangdao has the biggest difference in the main trend direction of the spatial distribution of urban land, GDP, and population among the 13 cities (Figure 7b). The urban land in Qinhuangdao was mainly distributed in three coastal municipal districts, and the spatial distribution mainly presented an east (slightly north)–west (slightly south) pattern. The population of Qinhuangdao was relatively evenly distributed in all districts/counties, and the spatial distribution mainly presented a northwest–southeast pattern. Thus, the distribution of population in Qinhuangdao was close to that of administrative regions. The GDP distribution of Qinhuangdao was close to the population distribution. The difference was that the center of gravity of the GDP standard deviation ellipse was slightly southeast. This indicates that the main body of the GDP distribution was slightly southeast relative to population distribution. In 2000 and 2005, UG in Tianjin was larger, but its value was significantly smaller in 2010 and 2015 (Figure 7a). This indicates that, although there was a large difference between the main direction of the urban land distribution and the GDP distribution in 2000 and 2005, the two distributions were consistent in 2010 and 2015 in Tianjin. In 2000, 2005, 2010, and 2015, the UP value in Tianjin was 20.45, 35.55, 49.4, and 52.58, respectively. The UP in Tianjin increased during 2000–2015. This shows that the spatial distribution of urban land and population in Tianjin shows an increasing trend of difference in the main direction. The reasons are as follows. The spatial distribution of population in Tianjin maintained a north–south pattern during 2000–2015. In 2000, the spatial distribution of urban land in Tianjin mainly showed a pattern of north (slightly west)–south (slightly east). From 2000 to 2015, the long axis of the standard deviation ellipse of the urban land in Tianjin rotated counterclockwise and showed a northwest–southeast pattern in 2015. In other words, the spatial distribution direction of urban land in Tianjin in 2015 was consistent with the direction of the main traffic lines between Beijing and Tianjin. UG in Beijing increased from 2000 to 2015, indicating that the difference in the main direction of urban land and GDP spatial distribution was gradually increasing. The trend of UP in Beijing was similar to that of UG. Among all cities, Zhangjiakou’s UG and UP were always small, indicating that, from 2000 to 2015, the differences in the main direction of the spatial distribution of urban land, GDP, and population were always small in Zhangjiakou (Figure 7c). UG and UP in other cities fluctuated during 2000–2015.

4.3.2. The Inconsistency Degree of the Spatial Distribution

The spatial difference index was often used to measure the inconsistency degree of the spatial distribution of geographical objects. The spatial difference index of urban land and GDP (SDUG) and the spatial difference index of urban land and population (SDUP) in the 13 cities of BTH are shown in Table 6. From the changing trend of SDUG, only Beijing showed a continuous increase, Shijiazhuang and Xingtai showed a continuous decrease, and other cities showed a fluctuating change. In 2000, 2005, 2010, and 2015, the area of the standard deviation ellipse of Beijing’s GDP was 2318, 1083, 1048, and 1046 (km2), respectively. The ellipse area of GDP gradually decreased. The area of the standard deviation ellipse of urban land in Beijing gradually increased. The discrepancy between urban land and GDP has been increasing, so Beijing’s SDUG showed a continuous increase. In other words, the GDP standard deviation ellipse showed a significant contraction trend, because the GDP growth rate inside the ellipse was higher than that outside the ellipse. The concentration degree of Beijing’s GDP was higher than that of urban land. The row average value reflects the average characteristics of each city’s SDUG in 2000, 2005, 2010, and 2015. The bigger the row average value of SDUG, the more inconsistent the standard deviation ellipse of urban land is with that of GDP. The cities with a row average value of SDUG between 0 and 0.25 included Baoding, Cangzhou, Chengde, Handan, Hengshui, Shijiazhuang, and Zhangjiakou; cities between 0.25 and 0.5 included Beijing, Langfang, Tangshan, Tianjin, and Xingtai; only Qinhuangdao had a row average value of SDUG between 0.5 and 0.75. From the changing trend of SDUP, Beijing, Cangzhou, Handan, Shijiazhuang, Tangshan, and Xingtai showed a continuous decrease, while other cities showed fluctuations. The cities with a row average value of SDUP between 0 and 0.25 included Baoding, Beijing, Cangzhou, Chengde, Handan, Hengshui, and Shijiazhuang; cities between 0.25 and 0.5 included Langfang, Tangshan, Tianjin, Xingtai, and Zhangjiakou; only Qinhuangdao had a row average value of SDUP between 0.5 and 0.75.
The average column value of SDUG in 2000 was 0.2990, and that of SDUP was 0.3441. The average value of SDUG was lower than that of SDUP. In 2005, 2010, and 2015, the average value of SDUG was lower than that of SDUP. In the same year, the spatial distribution of GDP was closer to the distribution of urban land than the distribution of the population. From 2000 to 2015, the column mean values of SDUP and SDUP gradually decreased from 0.2990 and 0.3441 in 2000 to 0.2410 and 0.2848 in 2015, respectively. It showed that the spatial distribution characteristics of GDP and population tended to be close to the spatial distribution of urban land. This trend can also be verified by the year in which the SDUG or SDUP peak value of a single city appears. Most of the peaks in both indices occurred in 2000 or 2005, while fewer cities saw peaks in 2010 and 2015. The peak value of SDUG was 4 in 2000, 5 in 2005, 3 in 2010, and 1 in 2015. The peak value of SDUP was 8 in 2000, 3 in 2005, and 2 in 2010. No cities saw a peak in 2015.

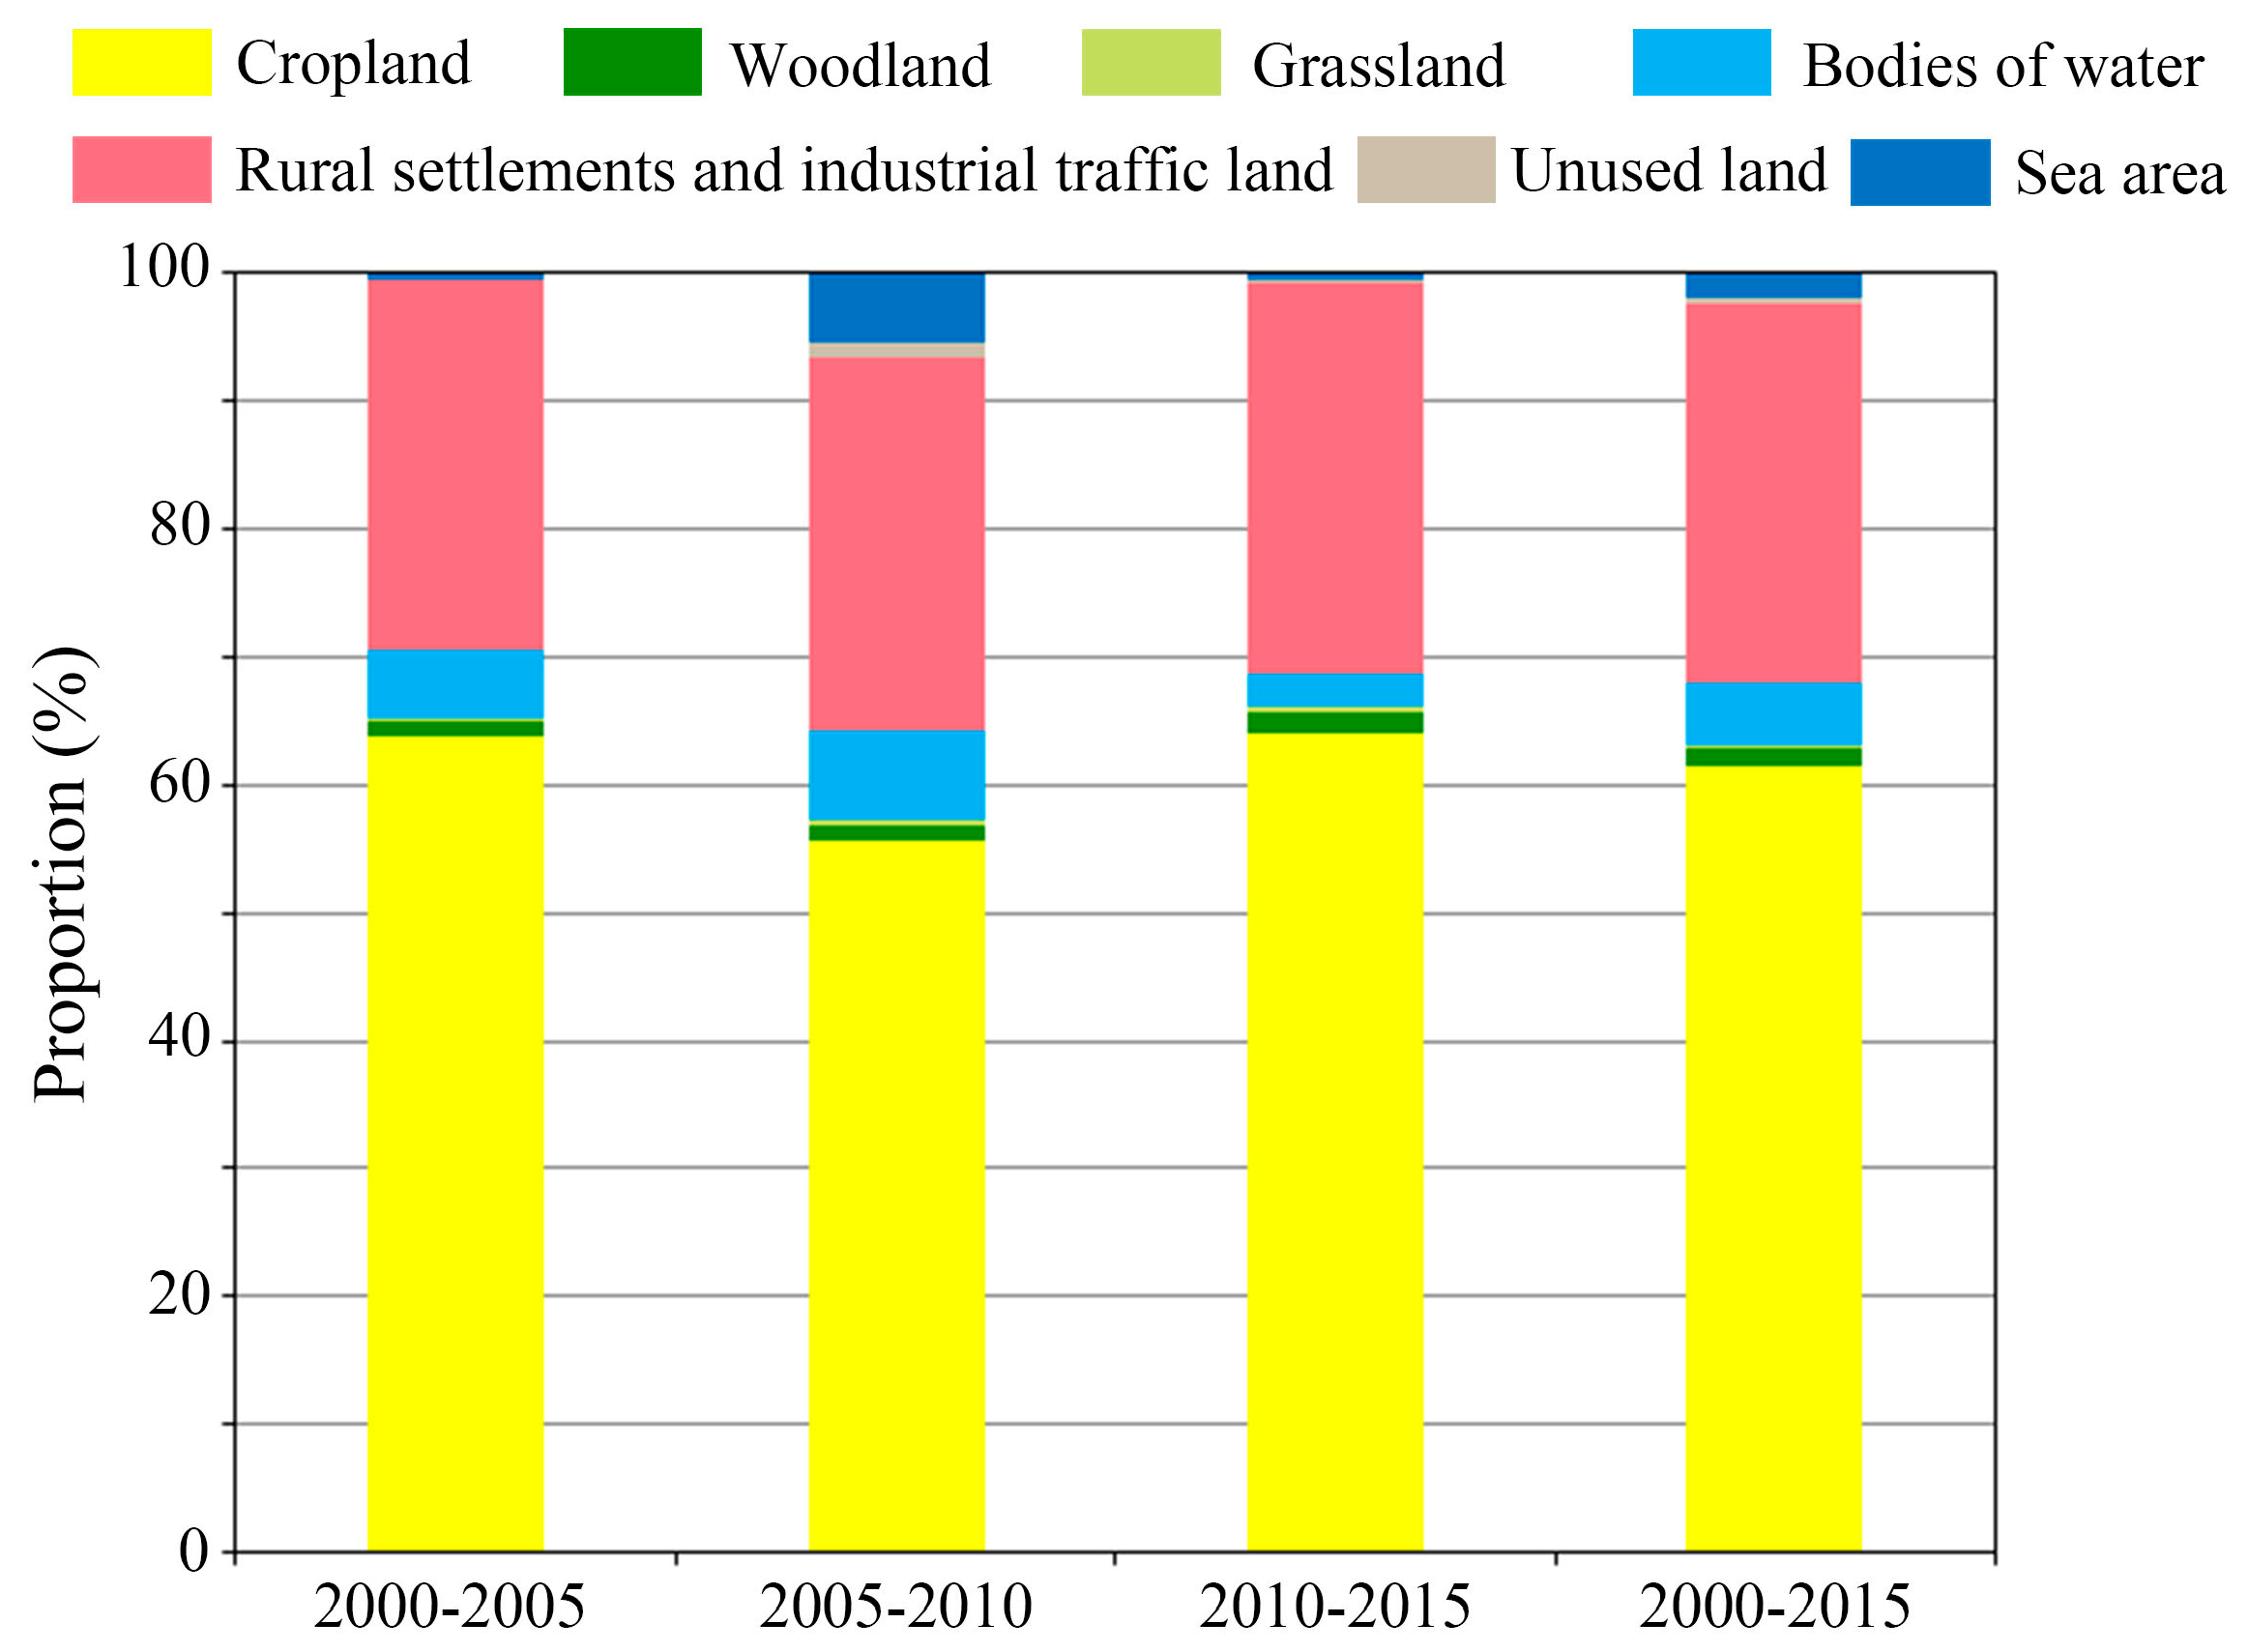
4.4. The Impact of Urban Expansion on Land Use

The area and proportion of land occupied by urban expansion during 2000–2015 are shown in Figure 8. Most of the districts/counties with large cropland area occupied by urban expansion were located in Beijing and Tianjin, as well as the surrounding districts/counties of Baoding, Shijiazhuang, Cangzhou, and Handan, and Qinghe county, Nangong city, and Weixian county in the east of Xingtai. The first five districts/counties with the largest cropland area occupied by urban expansion were the Binhai new district, Changping district, Xiqing district, Jinnan district, and Daxing district. The larger proportion of occupied cropland was concentrated in most counties in Zhangjiakou and some counties in Chengde. This shows that, although the expansion area of Zhangjiakou and Chengde counties was relatively small, the proportion of cropland occupied by expansion was relatively large. The urban expansion was mostly the occupation of cropland around the city. The districts/counties that occupy a large area of woodland included Beijing’s Mentougou, Changping, Qinhuangdao’s Haigang district, Zhangjiakou’s Xiahuayuan district, and Chengde’s Shuangluan district. The districts/counties that occupy a larger proportion of woodland were mostly located in Beijing, Chengde, and Qinhuangdao, and the largest proportion was Shijingshan district, Xiahuayuan district, and Mentougou district, respectively. The districts/counties that occupy more grassland were distributed in the north of BTH. These included the Mentougou district and Fangshan district in Beijing, the Qiaodong district and Qiaoxi district in Zhangjiakou; the Binhai new district in Tianjin; the Haigang district in Qinhuangdao; and Luanping and Kuancheng in Chengde. Most of the districts/counties that occupy a large proportion of grassland were located in Chengde and Zhangjiakou, such as Weichang county and Luanping county in Chengde and the Zhangbei county, the Qiaodong district, and the Qiaoxi district in Zhangjiakou. Most of the districts/counties occupying a large body of water area were located in Tianjin and Beijing, including the Binhai new district, Xiqing district, Fengtai district, and Daxing district. Most of the districts/counties that occupy a large proportion of bodies of water area were located in Tianjin, as well as Fengning and Chengde counties of Chengde City, and Huairou district of Beijing. The first five districts/counties with the largest proportion of bodies of water were the Hebei district, Hedong district, Hexi district, Binhai new district, and Xiqing district in Tianjin. Most of the districts/counties that occupy a large area of rural settlements and industrial traffic land (REIT) were located in Beijing, Tianjin, and Tangshan. Most of the districts/counties except Zhangjiakou and Chengde occupied a larger proportion of REIT. The districts/counties with a high proportion were concentrated in the 18 districts/counties around Tangshan and Beijing, the districts/counties around Shijiazhuang, the districts/counties around Xingtai, and Cangzhou’s municipal districts. The area and proportion of unused land were distributed in the Binhai new district, Yu county, and Xiahuayuan district. The sea area occupied by urban expansion of the Binhai new district reached 61.95 km2 during 2000–2015.
The proportion of different land occupied by urban expansion in BTH during the three periods (2000–2005, 2005–2010, and 2010–2015) is shown in Figure 9. Cropland was the first land source of urban expansion in each period. The proportion of cropland occupied by the expansion in the three periods from 2000 to 2015 was above 55%. The proportion of cropland occupied in the three periods decreased first and then increased, with the highest value occurring from 2010 to 2015 (64.08%). The proportion of woodland and grassland occupied was small, about 1.32% and 0.38%, respectively. Water bodies were the third land source of urban expansion, which comprised 5.48%, 7.01%, and 2.62% in the three periods, respectively. Rural settlements and industrial traffic land were the second land source of urban expansion in each period, with a proportion close to 1/3 and a small increasing trend. The proportion of unused land occupied was small and fluctuated. The proportion of occupied sea areas was similar from 2000 to 2005 and from 2010 to 2015, with 0.45% and 0.48%, respectively, reaching the peak value from 2005 to 2010 (5.33%).

5. Discussion

Since 2000, BTH, one of the three largest urban agglomerations in China, has experienced rapid urban expansion. The existing research [28,58] has mostly focused on the detailed dynamics of urban expansion in typical cities in BTH. Different from the former, this paper studied the urban expansion characteristics of the whole BTH at the regional, prefecture, and county levels. The UEA was most significant in the most economically developed cities in the region, which is consistent with the result of urban expansion in the Yangtze River Delta urban agglomeration [59]. The UEA and UER showed a right-skewed peak distribution, which also confirmed that Beijing and Tianjin were located at the top of the pyramid of urban expansion. From 2000 to 2015, the UEA of the megacities of BTH increased first and then decreased, which is consistent with the trend of Chongqing and Guangzhou, as well as Shanghai, Nanjing, and Hangzhou in the Yangtze River Delta [34,45]. China, which formally joined the World Trade Organization (WTO) in 2001, relied on public financing based on land finance for its economic development and accelerated urban expansion between 2000 and 2010. After 2010, to give full play to the leading role of large cities, the Chinese government carried out the policy of “strictly controlling large cities, developing small and medium-sized cities rationally, actively developing small towns, and promoting the coordinated development of large, medium and small cities and small towns” [60]. Under this macro policy, the UEA of the megacities of BTH slowed down from 2010 to 2015, while that of counties, county-level cities, and prefecture-level cities all increased. The urban land area of each administrative unit was more balanced, which is consistent with previous studies [61]. The UER was the annual urban expansion area divided by the initial urban land area, which reflected the change of urban expansion relative to its own scale. The urban land area of megacities had a large base, and the absolute expansion area shrunk after 2010. Therefore, the UER of the megacities of BTH gradually decreased from 2000 to 2015. This result was consistent with previous conclusions [45]. However, the urban land area of counties, county-level cities, and prefecture-level cities had a small initial scale, and the absolute expansion area became larger after 2005. Therefore, their annual urban expansion rate gradually increased. The UER of BTH gradually transitioned from the highest of megacities in 2000–2005 to the highest of counties in 2010–2015. Due to the differences in research objects (e.g., the research object of Meng et al. was urban land and rural residential land), research area and research period, and administrative division adjustment (e.g., the Binhai new district), the result of LISA clustering in this paper is partly consistent with the existing research. The high–high clusters of the UEA in Beijing from 2000 to 2005 in this paper are consistent with the research results of Meng et al. [62], but the distribution of low–low, high–low, and low–high is inconsistent. The high–high clusters of the UER in BTH during 2000–2005 and 2005–2010 in this paper are inconsistent with the research results of Wu et al. [63]. The possible reason is that Wu et al. did not divide Beijing and Tianjin into municipal districts, but treated them as a whole.
Different from the previous studies that usually use edge-expansion, infilling, and leapfrogging to define urban extension types, this paper provided a new method that combined absolute and relative speed to define urban extension types. When grading the single index after standardization, both Shi et al. and Yu et al. used −1, 0, and 1 as breakpoints for grading [40,46]. However, different data sets can have different distribution characteristics. In this paper, a quartile was used as the breakpoint value of classification. That is, the four grades were classified as Grade 1 (minimum, lower quartile), Grade 2 (lower quartile, median), Grade 3 (median, upper quartile), and Grade 4 (upper quartile, maximum). During 2000–2005, 2005–2010, and 2010–2015, the number of cities of Type A was 6, 2, and 9, and that of Type D was 5, 8, and 3 (Figure 6). Type A had a large number of cities in 2000–2005 and 2010–2015, while the number of cities in 2005–2010 was the lowest. Type D had the largest number of cities from 2005 to 2010. This indicates that the urban expansion was slow from 2005 to 2010, which may be related to the financial crisis that broke out during this period. From 2010 to 2015, the number of Type A was 9, indicating that, after 2010, most cities in BTH entered the high-speed period of urban expansion. In the three periods, the number of cities of Type B was 2, 1, and 0, and the number of cities of Type C was 0, 2, and 1. The urban area in the former period had a smaller initial size compared with that in the latter period. Therefore, Type B was distributed in the first two periods, while Type C was distributed in the second two periods.
Yu et al. quantitatively analyzed the relationship between urban land, GDP, and population of the six megacities (Beijing, etc.) through linear logarithm [46]. By comparing the difference of the standard deviation ellipse of urban land, GDP, and population, this paper explored the spatial evolution relationship of urban land, GDP, and population in the urbanization process of 13 cities in BTH. The SDUG in Beijing presented a monotonically increasing trend. The reason was that the area of the GDP’s standard deviation ellipse gradually decreased, while the area of the urban land’s standard deviation ellipse gradually increased. Therefore, the degree of inconsistency between the two ellipses increased. The GDP growth rate of the municipal districts in the central area (e.g., the Dongcheng district) was higher than that of the peripheral districts (e.g., the Huairou district). That is to say, the growth rate inside the ellipse was higher than the external growth rate. Therefore, the area of the GDP’s standard deviation ellipse gradually decreased. The central areas (e.g., the Dongcheng district and Xicheng district) were all built-up, and urban expansion was mostly distributed in the peripheral municipal districts. The increasing speed of urban land outside the ellipse was greater than that inside the ellipse, so the area of the urban land’s standard deviation ellipse gradually increased. The SDUG in other cities presented a monotonically decreasing trend or fluctuation.
From 2000 to 2015, BTH experienced large-scale urban expansion, and the land resources suitable for urban development gradually decreased [64]. In the expansion process, more than 55% of the new urban land came from cropland. The districts/counties that occupied more cropland were distributed in the south of Yanshan Mountain and the east of Taihang Mountain. The cropland in this area was the main producing area of winter wheat and corn in China. The relentless encroachment on cropland put enormous pressure on food security [65]. The woodland and grassland occupied by the expansion were mostly distributed in the west and north of Beijing, as well as Zhangjiakou and Chengde. Zhangjiakou and Chengde were the supporting areas for the ecological security of BTH, whose main ecological functions were water conservation, wind prevention, sand fixation, and biodiversity maintenance. Therefore, it was also an objective of land use management to strengthen the monitoring of the occupation of woodland, grassland, and water area in urban expansion.
In terms of the polycentric metropolis, London formed fringe cities on the main radiating axis, Paris formed corridor cities on the parallel axis of the Seine River [66], and Tokyo presented a “multi-center and multi-core” structure [67]. In the Tokyo metropolis, satellite cities at night are formed for residents who work in Tokyo during the day and commute in from neighboring cities. Beijing combined the characteristics of these three cities. Fringe cities include peripheral municipal districts (e.g., Pinggu district). The BTH develops along two axes—one is the direction of Beijing–Baoding–Shijiazhuang, the other is the direction of Beijing–Langfang–Tianjin. Many residents live in Zhuozhou, Yanjiao, and work in Beijing, commuting to and from their places of residence and work every day. In terms of urban expansion of metropolis, Tokyo is in the stage of sub-center and new city construction. New York is at the stage of developing a dense and stable polycentric structure. Shanghai is in the transition period from the expansion stage of the core area to the sub-center and new city construction stage [31]. The BTH is in the stage of core area expansion. In terms of the impact of urban expansion on land use, the BTH is similar to Pune. In the Pune metropolis, areas under the jurisdiction of municipal corporations are the largest contributors to urban expansion, as compared to semi-urban and suburban areas under the jurisdiction of village councils [32]. The difference is that the land source of urban expansion in BTH is mainly cropland, while that in Pune metropolis is mainly grassland, barren and agricultural land.

6. Conclusions

The adjustment and optimization of the urban land layout is an important part of the coordinated development of BTH. Understanding the detailed process of urban expansion is essential for natural resource managers to develop territorial spatial planning. This paper explored the spatiotemporal dynamics, types, and trends of urban expansion, the spatial coevolution of urban land, GDP, and population, and the impact of urban expansion on land use. Four conclusions were drawn: (1) From 2000 to 2015, the annual urban expansion area in Beijing and Tianjin has been ahead of that in Hebei, and the polarization characteristic of urban expansion was prominent. The annual urban expansion rate gradually shifted from the highest in megacities to the highest in counties. The high–high clusters of the annual urban expansion area presented an evolution from a “seesaw” pattern to a “dumbbell” pattern. The high–high clusters of the annual urban expansion rate moved first from Beijing to Tianjin and eventually to Hebei. (2) Type A was the main extension type. Between 2000 and 2005, nearly half of the cities were Type A. From 2005 to 2010, the urban expansion was slow (only two cities were Type A, and eight were Type D). From 2010 to 2015, the vast majority of cities entered the high-speed period of urban expansion (nine cities were Type A). The above is the conclusion based on the new method of defining urban expansion type proposed in this paper. From 2000 to 2015, the number of cities with “U-shaped,” “upward,” “downward,” “stable low speed,” and “inverted U-shaped” expansion trends was 5, 4, 2, 1, and 1, respectively. (3) In terms of the main trend direction of spatial distribution of urban land, GDP, and population, Qinhuangdao had the largest difference, followed by Tianjin, and Zhangjiakou had the smallest difference. The above is the conclusion based on the DTMD method proposed in this paper. In terms of spatial differentiation of the urban land and GDP, only Beijing showed a continuous increase, while other cities showed a decreasing trend or fluctuation change. In terms of the spatial differentiation of the urban land and population, nearly half of the cities showed a continuous decrease. In the same year, the spatial distribution of GDP was closer to the distribution of urban land than population. (4) From 2000 to 2015, cropland was the first source of urban expansion, accounting for 61.50% of the total urban expansion area. The districts/counties with large, occupied cropland area were mostly distributed in Beijing and Tianjin. Although the absolute area of cropland occupied in Zhangjiakou and Chengde was small, the proportion of cropland occupied by expansion was large, which indicates that the expansion of mountainous districts/counties mostly occupied the cropland around the city. Rural settlements and industrial traffic land were the second land source. The districts/counties that occupied more woodland and grassland were mostly distributed in Zhangjiakou and Chengde. The districts/counties that had more bodies of water were mainly distributed in Tianjin. The Binhai new district occupied more sea area. The research results can provide a data basis and empirical reference for territorial spatial planning.
The theoretical significance of the research results of this paper is to provide a theoretical basis for the optimization of the urban land layout in BTH urban agglomeration. The practical significance of this paper lies in that the government can guide its spatial distribution through urban land quota. According to the current layout characteristics of urban land and the objective needs of economic and social development, a newly added urban land quota can be put into urgently needed space from the perspective of the coordinated development of BTH. At the same time, policies can encourage each city to excavate the stock urban land and gradually make the environmental background of economic development become green. However, this paper also has some limitations. The time interval of urban land monitoring in this paper was five years, and the total urban expansion area in five years was not evenly distributed in each year. The urban expansion in this paper did not capture urban expansion in a given year or period (e.g., 2002–2004). High frequency monitoring, even once a year, can provide more detailed information about urban expansion. In addition, the last year of urban land in this paper was 2015, and this information has not been updated to 2020 at present. In future studies, the data of urban land use in 2020 will be added, and high-frequency monitoring will be carried out in key areas.
There are two ways of urban development—one is urban expansion, the other is “land redevelopment” or “brownfield development”. The former is to urbanize new areas, that is, to convert other types of land into urban land. The latter is the redevelopment of already developed urban land or brownfield. From the perspective of cropland protection, urban development should first focus on the land that has been changed by human beings, that is, the developed urban land. The definition of urban land in this paper comes from the Chinese Academy of Sciences [48]. The urban land data does not subdivide the land within the urban built-up areas. Future research can subdivide urban interior land into housing, retail, public facilities, industry, and other land types, and use a framework for path-dependent industrial land transition to study the process of urban land redevelopment [68]. In addition, evidence-informed strategies should be used to promote equitability in brownfields redevelopment [69]. That is to pay attention to residents and stakeholders to participate in the whole process of land redevelopment.

Author Contributions

Methodology, formal analysis, investigation, and original draft preparation, Z.T.; supervision, Z.Z.; review and editing, L.Z.; data preparation, X.W., X.Z., F.L., S.H., L.Y., and J.X. All authors have read and agreed to the published version of the manuscript.

Funding

This study was supported by the National Key R&D Program of China (2017YFE0104600) and Research on urban land expansion based on geographic information technology (XTXYYB007).

Institutional Review Board Statement

Not applicable.

Informed Consent Statement

Not applicable.

Data Availability Statement

The data presented in this study are available on request from the author ([email protected]). The data are not publicly available for free.

Acknowledgments

The authors thank all researchers involved in data acquisition, image registration, and urban lands delineation and verification. They were members and students in the land resources remote sensing research department, Aerospace Information Research Institute, Chinese Academy of Sciences.

Conflicts of Interest

The authors declare that there is no conflict of interest.

References

  1. Yang, S.; Wang, M.Y.; Wang, C. Revisiting and rethinking regional urbanization in Changjiang River Delta, China. Chin. Geogr. Sci. 2012, 22, 617–625. [Google Scholar] [CrossRef]
  2. Shi, L.; Zhang, Z.; Liu, F.; Zhao, X.; Liu, B.; Xu, J.; Hu, S. Spatial expansion remote sensing monitoring of special economic zones from 1973 to 2013. J. Remote Sens. 2015, 19, 1030–1039. [Google Scholar] [CrossRef]
  3. Zhu, J. A transitional institution for the emerging land market in urban China. Urban Stud. 2005, 42, 1369–1390. [Google Scholar] [CrossRef]
  4. Peng, J.; Tian, L.; Liu, Y.; Zhao, M.; Hu, Y.; Wu, J. Ecosystem services response to urbanization in metropolitan areas: Thresholds identification. Sci. Total Environ. 2017, 607–608, 706–714. [Google Scholar] [CrossRef]
  5. Liu, Y.; Yang, Y.; Li, Y.; Li, J. Conversion from rural settlements and arable land under rapid urbanization in Beijing during 1985–2010. J. Rural Stud. 2017, 51, 141–150. [Google Scholar] [CrossRef]
  6. Lin, B.; Zhu, J. Changes in urban air quality during urbanization in China. J. Clean. Prod. 2018, 188, 312–321. [Google Scholar] [CrossRef]
  7. Fan, Y.; Fang, C. A comprehensive insight into water pollution and driving forces in Western China—Case study of Qinghai. J. Clean. Prod. 2020, 274. [Google Scholar] [CrossRef]
  8. Ogle, J.; Delparte, D.; Sanger, H. Quantifying the sustainability of urban growth and form through time: An algorithmic analysis of a city’s development. Appl. Geogr. 2017, 88, 1–14. [Google Scholar] [CrossRef]
  9. Foley, J.A.; DeFries, R.; Asner, G.P.; Barford, C.; Bonan, G.; Carpenter, S.R.; Chapin, F.S.; Coe, M.T.; Daily, G.C.; Gibbs, H.K.; et al. Global Consequences of Land Use. Science 2005, 309, 570–574. [Google Scholar] [CrossRef] [Green Version]
  10. Xie, H.; Zhu, Z.; Wang, B.; Liu, G.; Zhai, Q. Does the Expansion of Urban Construction Land Promote Regional Economic Growth in China? Evidence from 108 Cities in the Yangtze River Economic Belt. Sustainability 2018, 10, 4073. [Google Scholar] [CrossRef] [Green Version]
  11. Gu, C.; Wei, Y.D.; Cook, I.G. Planning Beijing: Socialist city, transitional city, and global city. Urban Geogr. 2015, 36, 905–926. [Google Scholar] [CrossRef]
  12. Zeng, C.; Zhang, A.; Liu, L.; Liu, Y. Administrative restructuring and land-use intensity—A spatial explicit perspective. Land Use Policy 2017, 67, 190–199. [Google Scholar] [CrossRef]
  13. Zhao, X.; Xing, H.; Hu, R. The development experience and enlightenment of space planning in some European countries. Urban Rural Dev. 2018, 12, 74–77. [Google Scholar]
  14. Cai, Y.; Gao, Y.; Zhang, J.; He, T. The construction and enlightenment of American space planning system. Planners 2017, 33, 28–34. [Google Scholar]
  15. Yang, Y.; Liu, Y.; Li, Y.; Du, G. Quantifying spatio-temporal patterns of urban expansion in Beijing during 1985–2013 with rural-urban development transformation. Land Use Policy 2018, 74, 220–230. [Google Scholar] [CrossRef]
  16. Lin, Y.; Hu, Y.; Yu, J. Analysis of Shanghai Urban Expansion Based on Multi-temporal Remote Sensing Images. In Sustainable Development of Water and Environment; Springer: Berlin/Heidelberg, Germany, 2019; pp. 37–45. [Google Scholar]
  17. Xin, X.; Liu, B.; Di, K.; Zhu, Z.; Zhao, Z.; Liu, J.; Yue, Z.; Zhang, G. Monitoring urban expansion using time series of night-time light data: A case study in Wuhan, China. Int. J. Remote Sens. 2017, 38, 1–19. [Google Scholar] [CrossRef]
  18. Qian, Y.; Wu, Z. Study on Urban Expansion Using the Spatial and Temporal Dynamic Changes in the Impervious Surface in Nanjing. Sustainability 2019, 11, 933. [Google Scholar] [CrossRef] [Green Version]
  19. Wang, X.; Xiao, F.; Zhang, Y.; Yin, L.; Lesi, M.; Guo, B.; Zhao, Y.; Li, R. Thirty-year expansion of construction land in Xi’an: Spatial pattern and potential driving factors. Geol. J. 2018, 53, 309–321. [Google Scholar] [CrossRef]
  20. He, Y.; Dou, P.; Yan, H.; Zhang, L.; Yang, S. Quantifying the main urban area expansion of Guangzhou using Landsat imagery. Int. J. Remote Sens. 2018, 39, 7693–7717. [Google Scholar] [CrossRef]
  21. Sun, W.; Shan, J.; Wang, Z.; Wang, L.; Lu, D.; Jin, Z.; Yu, K. Geospatial Analysis of Urban Expansion Using Remote Sensing Methods and Data: A Case Study of Yangtze River Delta, China. Complexity 2020, 2020, 1–12. [Google Scholar] [CrossRef]
  22. Liu, L.; Liu, J.; Liu, Z.; Xu, X.; Wang, B. Analysis on the Spatio-Temporal Characteristics of Urban Expansion and the Complex Driving Mechanism: Taking the Pearl River Delta Urban Agglomeration as a Case. Complexity 2020, 2020, 1–12. [Google Scholar] [CrossRef]
  23. Wang, H.; Zhang, B.; Liu, Y.; Liu, Y.; Xu, S.; Zhao, Y.; Chen, Y.; Hong, S. Urban expansion patterns and their driving forces based on the center of gravity-GTWR model: A case study of the Beijing-Tianjin-Hebei urban agglomeration. J. Geogr. Sci. 2020, 30, 297–318. [Google Scholar] [CrossRef]
  24. Chen, L.; Ren, C.; Zhang, B.; Wang, Z.; Liu, M. Quantifying Urban Land Sprawl and its Driving Forces in Northeast China from 1990 to 2015. Sustainability 2018, 10, 188. [Google Scholar] [CrossRef] [Green Version]
  25. Zou, Y.; Peng, H.; Liu, G.; Yang, K.; Xie, Y.; Weng, Q. Monitoring Urban Clusters Expansion in the Middle Reaches of the Yangtze River, China, Using Time-Series Nighttime Light Images. Remote Sens. 2017, 9, 1007. [Google Scholar] [CrossRef] [Green Version]
  26. Feng, Y.; Wang, X.; Du, W.; Liu, J.; Li, Y. Spatiotemporal characteristics and driving forces of urban sprawl in China during 2003–2017. J. Clean. Prod. 2019, 241. [Google Scholar] [CrossRef]
  27. Chen, J.; Gao, J.; Chen, W. Urban land expansion and the transitional mechanisms in Nanjing, China. Habitat Int. 2016, 53, 274–283. [Google Scholar] [CrossRef]
  28. Zhang, Z.; Li, N.; Wang, X.; Liu, F.; Yang, L. A Comparative Study of Urban Expansion in Beijing, Tianjin and Tangshan from the 1970s to 2013. Remote Sens. 2016, 8, 496. [Google Scholar] [CrossRef] [Green Version]
  29. Hall, P.; Pain, K. The Polycentric Metropolis: Learning from Mega-city Regions in Europe. Int. J. Urban Reg. Res. 2007, 74, 384–385. [Google Scholar]
  30. Meijers, E.J.; Burger, M.J. Spatial Structure and Productivity in US Metropolitan Areas. Environ. Plan. A Econ. Space 2010, 42, 1383–1402. [Google Scholar] [CrossRef] [Green Version]
  31. Jiao, L.; Gong, C.; Xu, G.; Dong, T.; Zhang, B.; Li, Z. Urban expansion dynamics and urban forms in three metropolitan areas—Tokyo, New York, and Shanghai. Prog. Geogr. 2019, 38, 675–685. [Google Scholar] [CrossRef]
  32. Kantakumar, L.N.; Kumar, S.; Schneider, K. Spatiotemporal urban expansion in Pune metropolis, India using remote sensing. Habitat Int. 2016, 51, 11–22. [Google Scholar] [CrossRef]
  33. Shi, G.; Jiang, N.; Li, Y.; He, B. Analysis of the Dynamic Urban Expansion Based on Multi-Sourced Data from 1998 to 2013: A Case Study of Jiangsu Province. Sustainability 2018, 10, 3467. [Google Scholar] [CrossRef] [Green Version]
  34. Fang, C.; Zhao, S. A comparative study of spatiotemporal patterns of urban expansion in six major cities of the Yangtze River Delta from 1980 to 2015. Ecosyst. Health Sustain. 2018, 4, 95–114. [Google Scholar] [CrossRef] [Green Version]
  35. Huang, X.; Xia, J.; Xiao, R.; He, T. Urban expansion patterns of 291 Chinese cities, 1990–2015. Int. J. Digit. Earth 2017, 12, 62–77. [Google Scholar] [CrossRef]
  36. Xu, X.; Min, X. Quantifying spatiotemporal patterns of urban expansion in China using remote sensing data. Cities 2013, 35, 104–113. [Google Scholar] [CrossRef]
  37. Ma, Y.; Xu, R. Remote sensing monitoring and driving force analysis of urban expansion in Guangzhou City, China. Habitat Int. 2010, 34, 228–235. [Google Scholar] [CrossRef]
  38. Liu, J.; Zhang, Q.; Hu, Y. Regional differences of China’s urban expansion from late 20th to early 21st century based on remote sensing information. Chin. Geogr. Sci. 2012, 22, 1–14. [Google Scholar] [CrossRef]
  39. Peng, W.; Wang, G.; Zhou, J.; Zhao, J.; Yang, C. Studies on the temporal and spatial variations of urban expansion in Chengdu, western China, from 1978 to 2010. Sustain. Cities Soc. 2015, 17, 141–150. [Google Scholar] [CrossRef] [Green Version]
  40. Shi, L.; Taubenböck, H.; Zhang, Z.; Liu, F.; Wurm, M. Urbanization in China from the end of 1980s until 2010—Spatial dynamics and patterns of growth using EO-data. Int. J. Digital Earth 2017, 12, 78–94. [Google Scholar] [CrossRef]
  41. Li, J.; Liu, Y.; Yang, Y.; Liu, J. Spatial-temporal characteristics and driving factors of urban construction land in Beijing-Tianjin-Hebei region during 1985–2015. Geogr. Res. 2018, 37, 37–52. [Google Scholar] [CrossRef]
  42. Wang, Z.; Lu, C. Urban land expansion and its driving factors of mountain cities in China during 1990–2015. J. Geogr. Sci. 2018, 28, 1152–1166. [Google Scholar] [CrossRef] [Green Version]
  43. Yan, Y.; Ju, H.; Zhang, S.; Jiang, W. Spatiotemporal Patterns and Driving Forces of Urban Expansion in Coastal Areas: A Study on Urban Agglomeration in the Pearl River Delta, China. Sustainability 2019, 12, 191. [Google Scholar] [CrossRef] [Green Version]
  44. Tang, Z.; Zhang, Z.; Zuo, L.; Wang, X.; Hu, S.; Zhu, Z. Spatial Econometric Analysis of the Relationship between Urban Land and Regional Economic Development in the Beijing–Tianjin–Hebei Coordinated Development Region. Sustainability 2020, 12, 8451. [Google Scholar] [CrossRef]
  45. Fei, W.; Zhao, S. Urban land expansion in China’s six megacities from 1978 to 2015. Sci. Total Environ. 2019, 664, 60–71. [Google Scholar] [CrossRef] [PubMed]
  46. Yu, S.; Zhang, Z.; Liu, F.; Wang, X.; Hu, S. Assessing Interannual Urbanization of China’s Six Megacities Since 2000. Remote Sens. 2019, 11, 2138. [Google Scholar] [CrossRef] [Green Version]
  47. Li, G.; Li, F. Urban sprawl in China: Differences and socioeconomic drivers. Sci. Total Environ. 2019, 673, 367–377. [Google Scholar] [CrossRef]
  48. Zhang, Z.; Wang, X.; Zhao, X.; Liu, B.; Yi, L.; Zuo, L.; Wen, Q.; Liu, F.; Xu, J.; Hu, S. A 2010 update of National Land Use/Cover Database of China at 1:100000 scale using medium spatial resolution satellite images. Remote Sens. Environ. 2014, 149, 142–154. [Google Scholar] [CrossRef]
  49. Cli, A.D.; Ord, J.K. Spatial Processes, Models and Applications; Pion: London, UK, 1981. [Google Scholar]
  50. O’Sullivan, D.; Unwin, D.J. Geographic Information Analysis; John Wiley & Sons: Hoboken, NJ, USA, 2010. [Google Scholar]
  51. Fu, S.H.; Jha, P.; Gupta, P.C.; Kumar, R.; Dikshit, R.; Sinha, D. Geospatial analysis on the distributions of tobacco smoking and alcohol drinking in India. PLoS ONE 2014, 9, e102416. [Google Scholar] [CrossRef] [Green Version]
  52. Anselin, L. Local Indicators of Spatial Associationa—LISA. Geogr. Anal. 1995, 27, 93–115. [Google Scholar] [CrossRef]
  53. Pfeiffer, D.U.; Robinson, T.P.; Stevenson, M.; Stevens, K.B.; Clements, A.C.A. Spatial Analysis in Epidemiology; Oxford University Press: Oxford, UK, 2008. [Google Scholar]
  54. Anselin, L.; Syabri, I.; Kho, Y. GeoDa: An Introduction to Spatial Data Analysis. Geogr. Anal. 2006, 38, 5–22. [Google Scholar] [CrossRef]
  55. Qiao, K.; Zhu, W.; Hu, D.; Hao, M.; Chen, S.; Cao, S. Examining the distribution and dynamics of impervious surface in different function zones in Beijing. J. Geogr. Sci. 2018, 28, 669–684. [Google Scholar] [CrossRef] [Green Version]
  56. Zhong, Y.; Lin, A.; Zhou, Z. Evolution of the Pattern of Spatial Expansion of Urban Land Use in the Poyang Lake Ecological Economic Zone. Int. J. Environ. Res. Public Health 2019, 16, 117. [Google Scholar] [CrossRef] [PubMed] [Green Version]
  57. Zhao, L.; Zhao, Z. Dynamics of the economic spatial disparity in coastal area of China. World Reg. Stud. 2014, 23, 45–54. [Google Scholar]
  58. Wu, W.; Zhao, S.; Zhu, C.; Jiang, J. A comparative study of urban expansion in Beijing, Tianjin and Shijiazhuang over the past three decades. Landsc. Urban Plan. 2015, 134, 93–106. [Google Scholar] [CrossRef]
  59. Gao, X.; Liu, H.; Zhang, Y.; LV, Y.; LIu, X. Spatio-temporal patterns of urban expansion in the Yangtze River Delta Megalopolis from 1990 to 2010. J. Beijing Norm. Univ. (Narural Sci.) 2016, 52, 645–650. [Google Scholar]
  60. Li, Y.; Jia, L.; Wu, W.; Yan, J.; Liu, Y. Urbanization for rural sustainability—Rethinking China’s urbanization strategy. J. Clean. Prod. 2018, 178, 580–586. [Google Scholar] [CrossRef]
  61. Huang, Q.; He, C.; Gao, B.; Yang, Y.; Liu, Z.; Zhao, Y.; Dou, Y. Detecting the 20 year city-size dynamics in China with a rank clock approach and DMSP/OLS nighttime data. Landsc. Urban Plan. 2015, 137, 138–148. [Google Scholar] [CrossRef]
  62. Meng, D.; LI, X.; Xu, H.; Gong, H. The Spatial Expansion of Construction Land-use in Beijing-Tianjin-Hebei Metropolis Circle. J. Geo-Inf. Sci. 2013, 15, 289–296. [Google Scholar] [CrossRef]
  63. Wu, L.; Hou, X.; YU, L.; Di, X. Dynamics of Urban Expansion in Circum-Bohai Sea Region. Areal Res. Dev. 2012, 31, 74–79. [Google Scholar]
  64. Gao, B.; Huang, Q.; He, C.; Sun, Z.; Zhang, D. How does sprawl differ across cities in China? A multi-scale investigation using nighttime light and census data. Landsc. Urban Plan. 2016, 148, 89–98. [Google Scholar] [CrossRef]
  65. He, C.; Liu, Z.; Xu, M.; Ma, Q.; Dou, Y. Urban expansion brought stress to food security in China: Evidence from decreased cropland net primary productivity. Sci. Total Environ. 2017, 576, 660–670. [Google Scholar] [CrossRef] [PubMed]
  66. Xiang, J.; Xie, H. New Town Construction: From London, Paris to Beijing—Similarities and Differences in Multi-Centres Urban Problems. Plan. Stud. Beijing 2005, 3, 12–14. [Google Scholar]
  67. Chen, Y. The practice and exploration of space expansion mode of big cities abroad. J. Party Univ. Shijiazhuang City Comm. CPC 2015, 17, 18–22. [Google Scholar]
  68. Wang, T.; Kazak, J.; Han, Q.; de Vries, B. A framework for path-dependent industrial land transition analysis using vector data. Eur. Plan. Stud. 2019, 27, 1391–1412. [Google Scholar] [CrossRef]
  69. Lehigh, G.R.; Wells, E.C.; Diaz, D. Evidence-Informed strategies for promoting equitability in brownfields redevelopment. J. Environ. Manag. 2020, 261, 110150. [Google Scholar] [CrossRef] [PubMed]
Figure 1. (a) The location of the Beijing–Tianjin–Hebei coordinated development region (BTH) in China; (b) spatial distribution of urban expansion for BTH from 2000 to 2015; (ce) examples showing the dramatic urban expansion of BTH.
Sustainability 13 01579 g001
Figure 2. Measurement of urban expansion types; crossed out numbers are inexistent types among the 13 cities in BTH. UEA, annual urban expansion area; UER, annual urban expansion rate.
Sustainability 13 01579 g002
Figure 3. (a) The standard deviational ellipse (SDE), azimuth angle, and the main trend direction; (b) the difference of the main trend direction (DMTD); (c) the spatial difference index (SDI).
Sustainability 13 01579 g003
Figure 4. Local indicators of spatial association (LISA) cluster maps for annual urban expansion area at the dis-trict/county level during (a) 2000–2005, (b) 2005–2010 and (c) 2010–2015.
Sustainability 13 01579 g004
Figure 5. LISA cluster maps for the annual urban expansion rate at the district/county level during (a) 2000–2005, (b) 2005–2010 and (c) 2010–2015.
Sustainability 13 01579 g005
Figure 6. The expansion types of 13 cities in BTH during 2000–2015.
Sustainability 13 01579 g006
Figure 7. Examples of the standard deviation ellipse for urban land, GDP, and population during 2000–2015: (a) Tianjin, (b) Qinhuangdao, (c) Zhangjiakou.
Sustainability 13 01579 g007
Figure 8. The area and proportion of land occupied by urban expansion during 2000–2015.
Sustainability 13 01579 g008
Figure 9. The proportion of different land occupied by urban expansion for the 202 districts/counties in BTH during 2000–2015.
Sustainability 13 01579 g009
Table 1. Annual urban expansion area (UEA) and annual urban expansion rate (UER) for different administrative positions.
City Level2000–20052005–20102010–2015
UEAUERUEAUERUEAUER
Counties35.36 5.00 34.11 3.86 68.76 6.52
County-level cities16.08 4.85 12.03 2.92 27.73 5.87
Prefecture-level cities37.52 4.06 29.33 2.64 53.46 4.25
Megacities110.86 6.88 116.61 5.39 109.20 3.97
BTH199.82 5.59 192.07 4.20 259.15 4.68
Note: The units of UEA and UER are km2 and %, respectively.
Table 2. Statistical characteristics of annual expansion area and annual expansion rate.
Statistic2000–20052005–20102010–2015
UEAUERUEAUERUEAUER
Average0.99 5.74 0.95 3.92 1.28 6.10
Median0.30 3.03 0.33 2.39 0.62 4.28
Skewness coefficient5.31 2.84 9.02 3.76 3.55 2.93
Kurtosis coefficient34.70 10.74 98.90 24.09 16.24 14.89
Table 3. Global Moran’s I of the annual urban expansion area and annual urban expansion rate.
Statistic2000–20052005–20102010–2015
UEAUERUEAUERUEAUER
Global Moran’s I0.31990.19450.26740.22450.31410.1217
Z-score7.59654.62948.41255.59677.10942.8465
Table 4. Distribution of four urban expansion types in 13 cities.
CityType AType BType CType D
Baoding181.56 38.08
Beijing585.80 193.51
Cangzhou69.28 45.44
Chengde 14.95 24.56
Handan70.89 46.00 44.12
Hengshui48.62 44.47
Langfang151.03 39.04
Qinhuangdao47.15 53.14
Shijiazhuang146.12 69.15
Tangshan149.34 55.80
Tianjin675.93 228.09
Xingtai138.54 29.39
Zhangjiakou 65.20
Total2264.26318.44 293.42 379.09
Note: The unit of area is square kilometers.
Table 5. The difference of the main trend direction of urban land and GDP (UG) and that of urban land and population (UP).
City2000200520102015
UGUPUGUPUGUPUGUP
Baoding1.587.142.977.522.176.330.544.49
Beijing5.676.348.2111.9211.7813.7412.9414.35
Cangzhou15.715.73.7113.787.8213.674.949.62
Chengde0.928.930.5616.951.5617.061.1514.66
Handan0.676.411.355.730.146.54.342.2
Hengshui0.021.782.733.244.992.943.681.66
Langfang1.85.453.797.193.227.624.429.77
Qinhuangdao21.7964.2343.1467.2552.3163.2635.7858.06
Shijiazhuang1.284.111.584.041.254.941.354.59
Tangshan3.747.271.227.084.269.743.467.57
Tianjin22.3920.4534.0335.552.0649.44.652.58
Xingtai21.9719.275.86136.4413.960.0720.27
Zhangjiakou0.812.820.240.361.911.152.930.81
Note: The units of UG and UP are degree.
Table 6. The spatial difference index of urban land and GDP (SDUG) and that of urban land and population (SDUP).
City2000200520102015Row Average
SDUGSDUPSDUGSDUPSDUGSDUPSDUGSDUPSDUGSDUP
Baoding0.06020.22350.13480.27000.07070.24160.10370.21870.0923 0.2385
Beijing0.36120.31950.38390.20870.42770.17520.46570.14050.4096 0.2110
Cangzhou0.17700.22270.20910.18490.19380.15440.13140.11670.1778 0.1697
Chengde0.13190.23360.11740.22100.20060.23350.11370.23430.1409 0.2306
Handan0.18260.32980.20630.26830.24760.24510.24700.14470.2209 0.2470
Hengshui0.11790.18100.13870.20190.12070.19010.11370.16130.1228 0.1836
Langfang0.35710.35710.39030.56120.32450.56520.27440.50730.3366 0.4977
Qinhuangdao0.70770.77740.74400.79440.70490.76830.62830.73020.6962 0.7676
Shijiazhuang0.27300.28980.24130.23590.16000.21790.14430.20200.2046 0.2364
Tangshan0.43350.38990.44130.34960.44530.34840.39860.34070.4297 0.3571
Tianjin0.42590.42030.38940.44930.17520.53830.21520.52000.3014 0.4820
Xingtai0.39780.37190.24470.28350.20440.21260.15940.17530.2516 0.2608
Zhangjiakou0.26110.35720.16360.24720.11910.25860.13710.21100.1702 0.2685
Co_average0.29900.34410.29270.32890.26110.31920.24100.2848-
Note: Co_average refers to the column average, that is, the average of all cities in a given year. Row average refers to the average of a city over four years.
Publisher’s Note: MDPI stays neutral with regard to jurisdictional claims in published maps and institutional affiliations.

