Article

Prediction of Future Natural Suitable Areas for Rice under Representative Concentration Pathways (RCPs)

1
School of Geographic Science, Qinghai Normal University, Xining 810008, China
2
Faculty of Geographical Science, Beijing Normal University, Beijing 100875, China
3
Academy of Plateau Science and Sustainability, Xining 810008, China
*
Author to whom correspondence should be addressed.
Sustainability 2021, 13(3), 1580; https://0-doi-org.brum.beds.ac.uk/10.3390/su13031580
Submission received: 11 December 2020 / Revised: 24 January 2021 / Accepted: 26 January 2021 / Published: 2 February 2021

Abstract

:
Extreme temperature events, which are part of global climate change, are a growing threat to crop production, especially to such temperature-sensitive crops as rice. As a result, the traditional rice-growing areas are also likely to shift. The MaxEnt model was used for predicting the areas potentially suitable for rice in the short term (2016–2035) and in the medium term (2046–2065) and under two scenarios developed by the Intergovernmental Panel on Climate Change, namely representative concentration pathway (RCP) 4.5 (the intermediate scenario) and RCP 8.5 (sometimes referred to as the worst-case scenario). The predictions, on verification, were seen to be highly accurate: the AUC—area under the curve—value of the MaxEnt model was > 0.85. The model made the following predictions. (1) Areas highly suitable for rice crops will continue to be concentrated mainly in the current major rice-production areas, and areas only marginally suitable will be concentrated mainly in the rainforest region. (2) Overall, although the current pattern of the distribution of such areas would remain more or less unchanged, their extent will mainly decrease in the subtropics but increase in the tropics and in high-latitude regions. (3) The extent of such areas will decrease in the short term but increase in the medium term.

1. Introduction

The latest special report from the Intergovernmental Panel on Climate Change (IPCC), published in 2018 [1], estimates a 1.5 °C increase in global temperature in 2040 at the current rate of global warming. Such a rise has serious implications for rice cultivation: unless rice varieties adapted to higher temperatures are available, the areas suitable for rice are bound to shift in the future. Rice is the world’s second largest food crop, the staple food for over 50% of the world’s population [2,3], and if rice cultivation does not keep pace with changes in the temperature by relocating, rice production is bound to decrease substantially [4]. Therefore, to safeguard food security, we need to predict such changes in spatial terms and temporal terms, which can intuitively reflect the potential distribution of rice in different scenarios and for different periods, helping to reduce losses according to local conditions [5].
Two major studies on areas suitable for growing rice are by Liu et al. [6] and by Wang et al. [4], and both groups used the MaxEnt model. Liu et al. used the MaxEnt model to simulate the areas suitable for rice over the period 1980–2010. Based on the distribution probability provided by the model, the areas were graded for their suitability, and their interannual dynamics examined, but confined the study to China. Wang et al. used the MaxEnt model to screen the variables: through multiple-criteria decision analysis (MCDA), they obtained and analyzed the potential distribution of areas suitable for rice under four scenarios and for three periods. However, in that study MCDA proved to be highly subjective because they assigned equal weightings and equal ranges to all the variables. For this reason, further research is needed on areas suitable for rice under different representative concentration pathways (RCPs), which are different trajectories of the concentrations of greenhouse gases (GHGs) adopted by the IPCC to estimate future rise in global temperatures.
For researching the potential distribution of areas under different crops, two methods are widely used at present: MCDA and species distribution models (SDMs). MCDA uses spatial analysis involving overlaying of GIS (Geographic Information System) layers and evaluating whether a given area is suitable for a given crop by constraining the variables that affect the growth and yield of that crop [7,8,9]. The SDMs, which are based on the niche theory, relate known patterns of crop distribution to environmental variables to predict potential areas within the study area suitable for the target crop [10,11,12,13]. At present, MCDA is used less often than SDMs because the choice of the variables is subjective, and it is difficult to arrive at the appropriate weighting for each chosen variable; that is why SDMs are used more widely for analyzing the distribution of areas potentially suitable for different crops [14,15,16,17,18,19,20,21,22,23].
Among the many types of SDMs, the most widely used and better-performing model is MaxEnt [24,25,26], which is known to be good at predicting the distribution of different species as affected by climate change [20,21,22,23,27]—so long as the sampling is unbiased and the variables highly correlated to one another are avoided while collecting the data [19,28]. However, the importance of proper sampling and of selecting the optimized variables is often ignored in many studies that use SDMs.
The present study took care to optimize the selection of samples and of variables and used the MaxEnt model to predict the potential distribution of rice under two scenarios, namely RCP 4.5 and RCP 8.5, and for two terms, namely the short term (2016–2035) and the medium term (2046–2065). The specific objectives were (1) to analyze the distribution characteristics of areas suitable for rice cultivation during the two terms and under the two scenarios; (2) to elaborate the changes in potential global rice distribution under two climate-change scenarios; and (3) to offer a set of methods for selecting the sample and the variables for the MaxEnt model to reduce bias in sampling and to reduce the subjectivity and multi-collinearity in selecting variables.

2. Materials and Methods

Before the presentation of the materials and methods section, this paper proposed the following hypotheses: (1) In the next 50 years, the varieties and traits of the rice crop remain unchanged; (2) in the next 50 years, changes in soil and topography can be ignored.

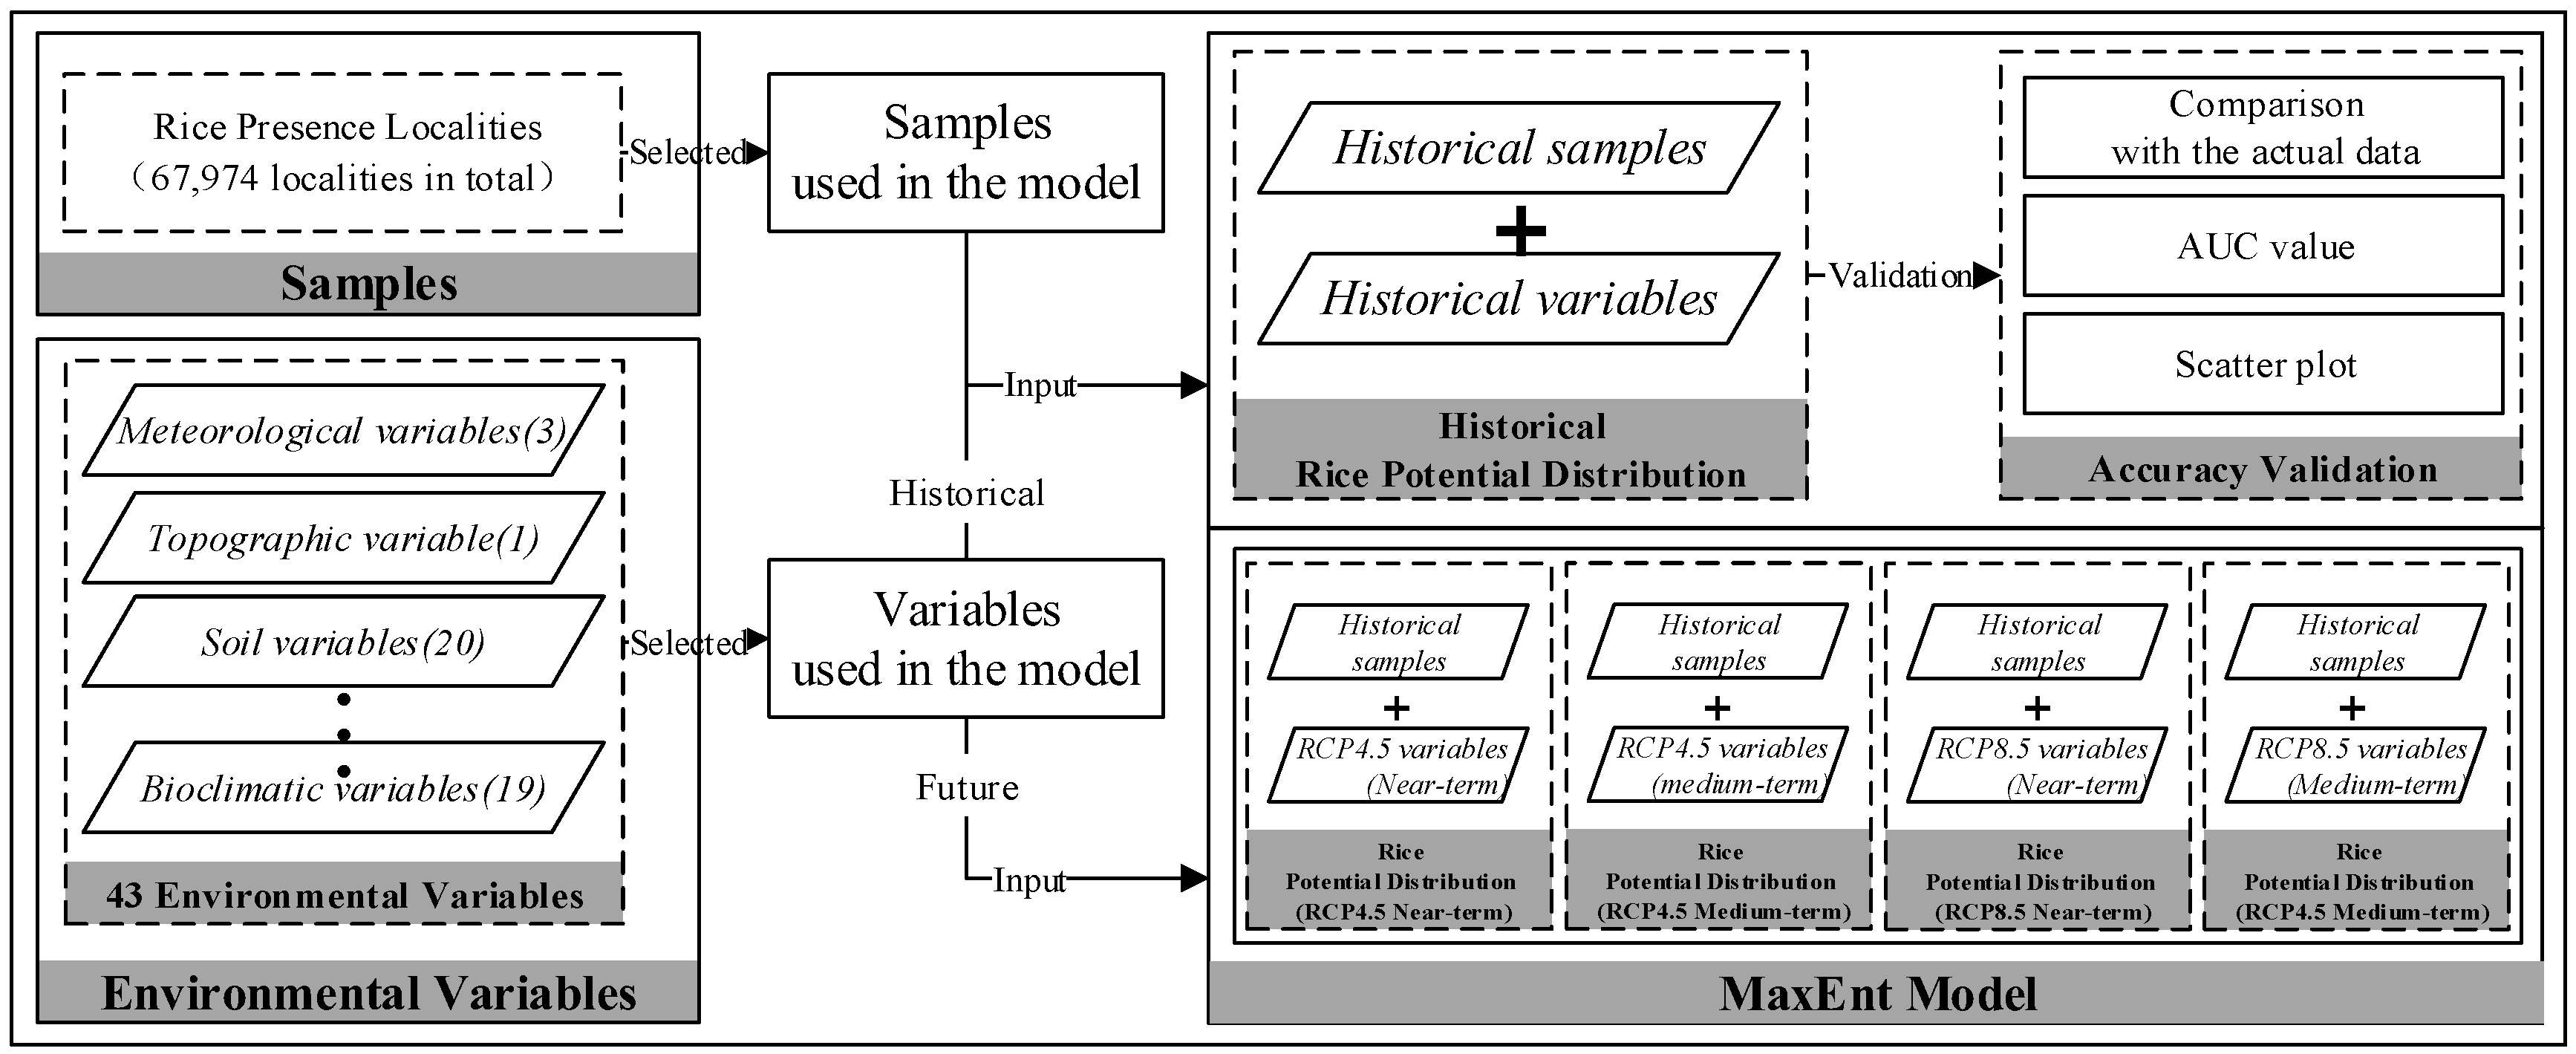
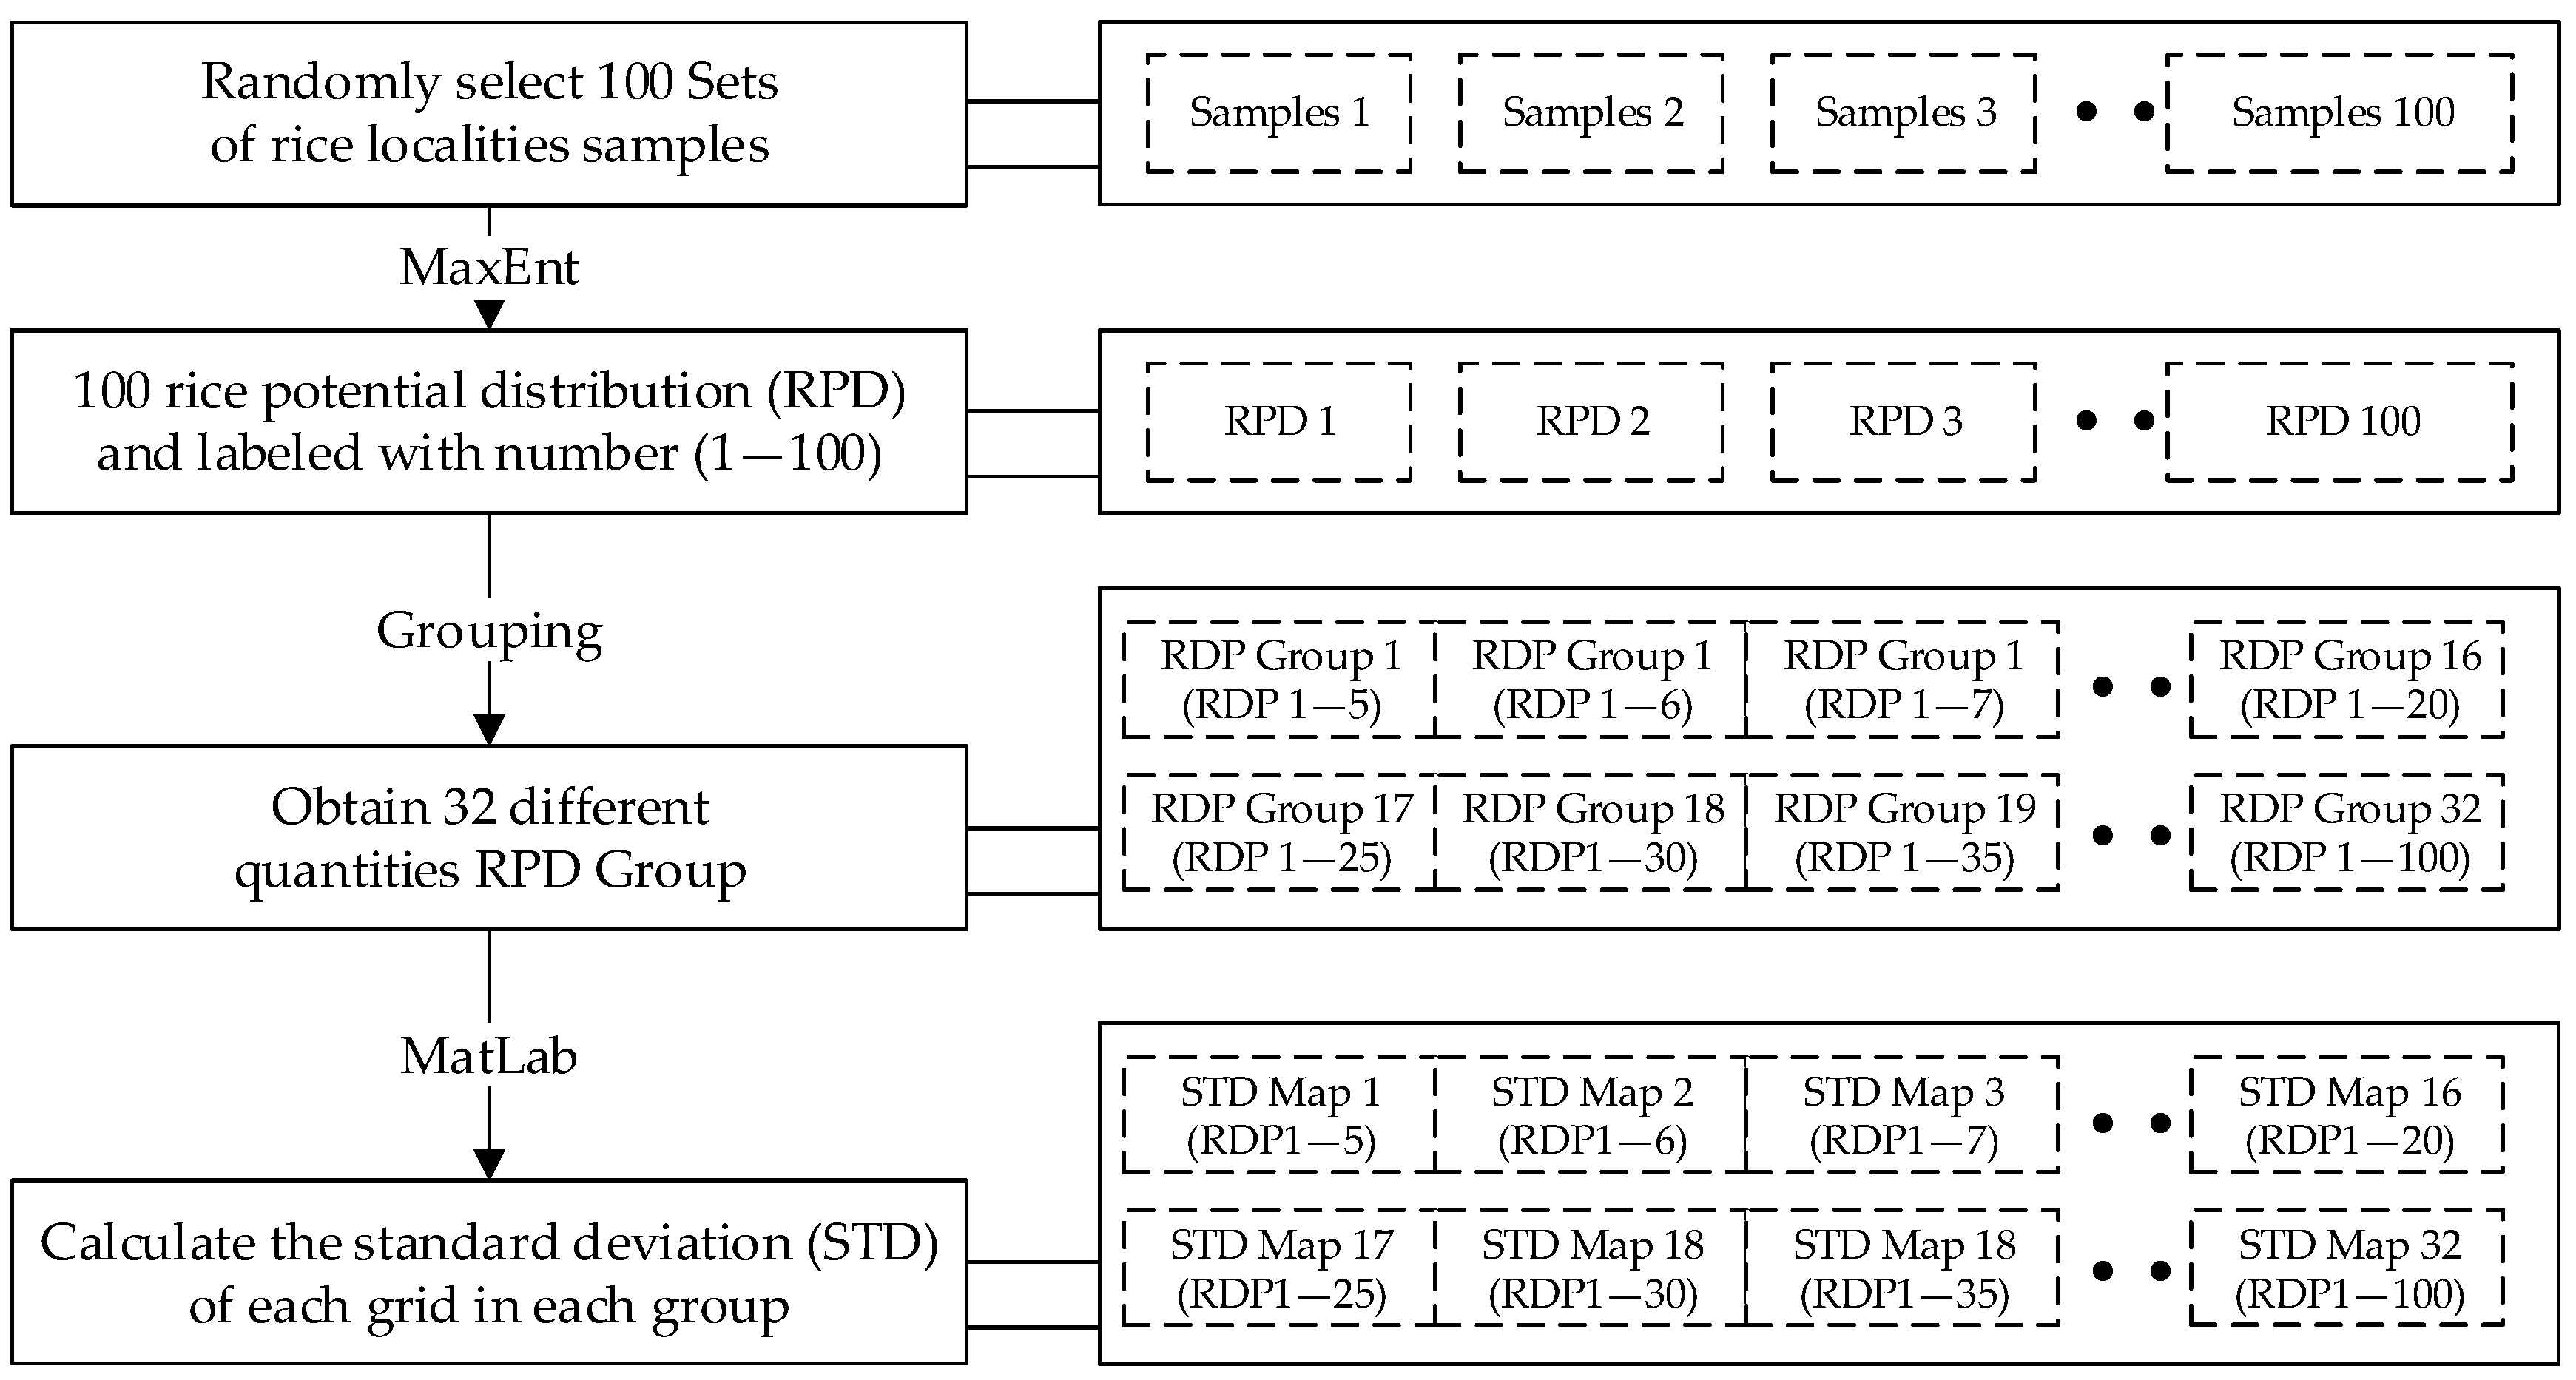
2.1. Basic Idea and Research Framework

In most of the earlier studies, variables were selected based on experience and from relevant literature: only a few studies used quantitative methods to select the variables [19,20,28,29,30,31]. For instance, to avoid multi-collinearity of variables, Qin et al. [20] eliminated from further models those variables that were highly correlated (Pearson’s correlation coefficient ≥ 0.85), and Yi et al. [19] selected the variables by using cross-correlations (Pearson’s correlation coefficient) and principal component analysis. However, these researchers did not consider whether the chosen variables played a major role in influencing the distribution of the target species.
In using MaxEnt for simulations, data on the samples and the chosen variables must be fed into the model. This process was divided into two parts: selecting the parameters that will form the inputs and testing the accuracy of the model by comparing the values predicted by the model with the existing data on the distribution of rice-growing areas. We used the area under the curve (AUC) value of the model and the actual distribution of rice-growing to test the accuracy of the model.
The overall research framework for the study is shown in Figure 1.

2.2. Data Collection

The data were divided into two categories: areas currently under rice and values of the chosen environmental variables. The latter included the global digital elevation model, global soil parameters, and global climate models. The spatial resolution of all the data was normalized to 0.25° × 0.25°. Table 1 lists the databases used in the present study along with some relevant details of each database. To reduce the error and the uncertainty between data from different climate models and to make the results more reliable, we used 21 types of climate model (Table 2).
Many studies have shown that integrating data from multiple models can eliminate uncertainty to some extent [32,33,34]. At present, the common integration method is to average the data from multiple models [35], and we did so for 21 climate models.

2.3. Methods

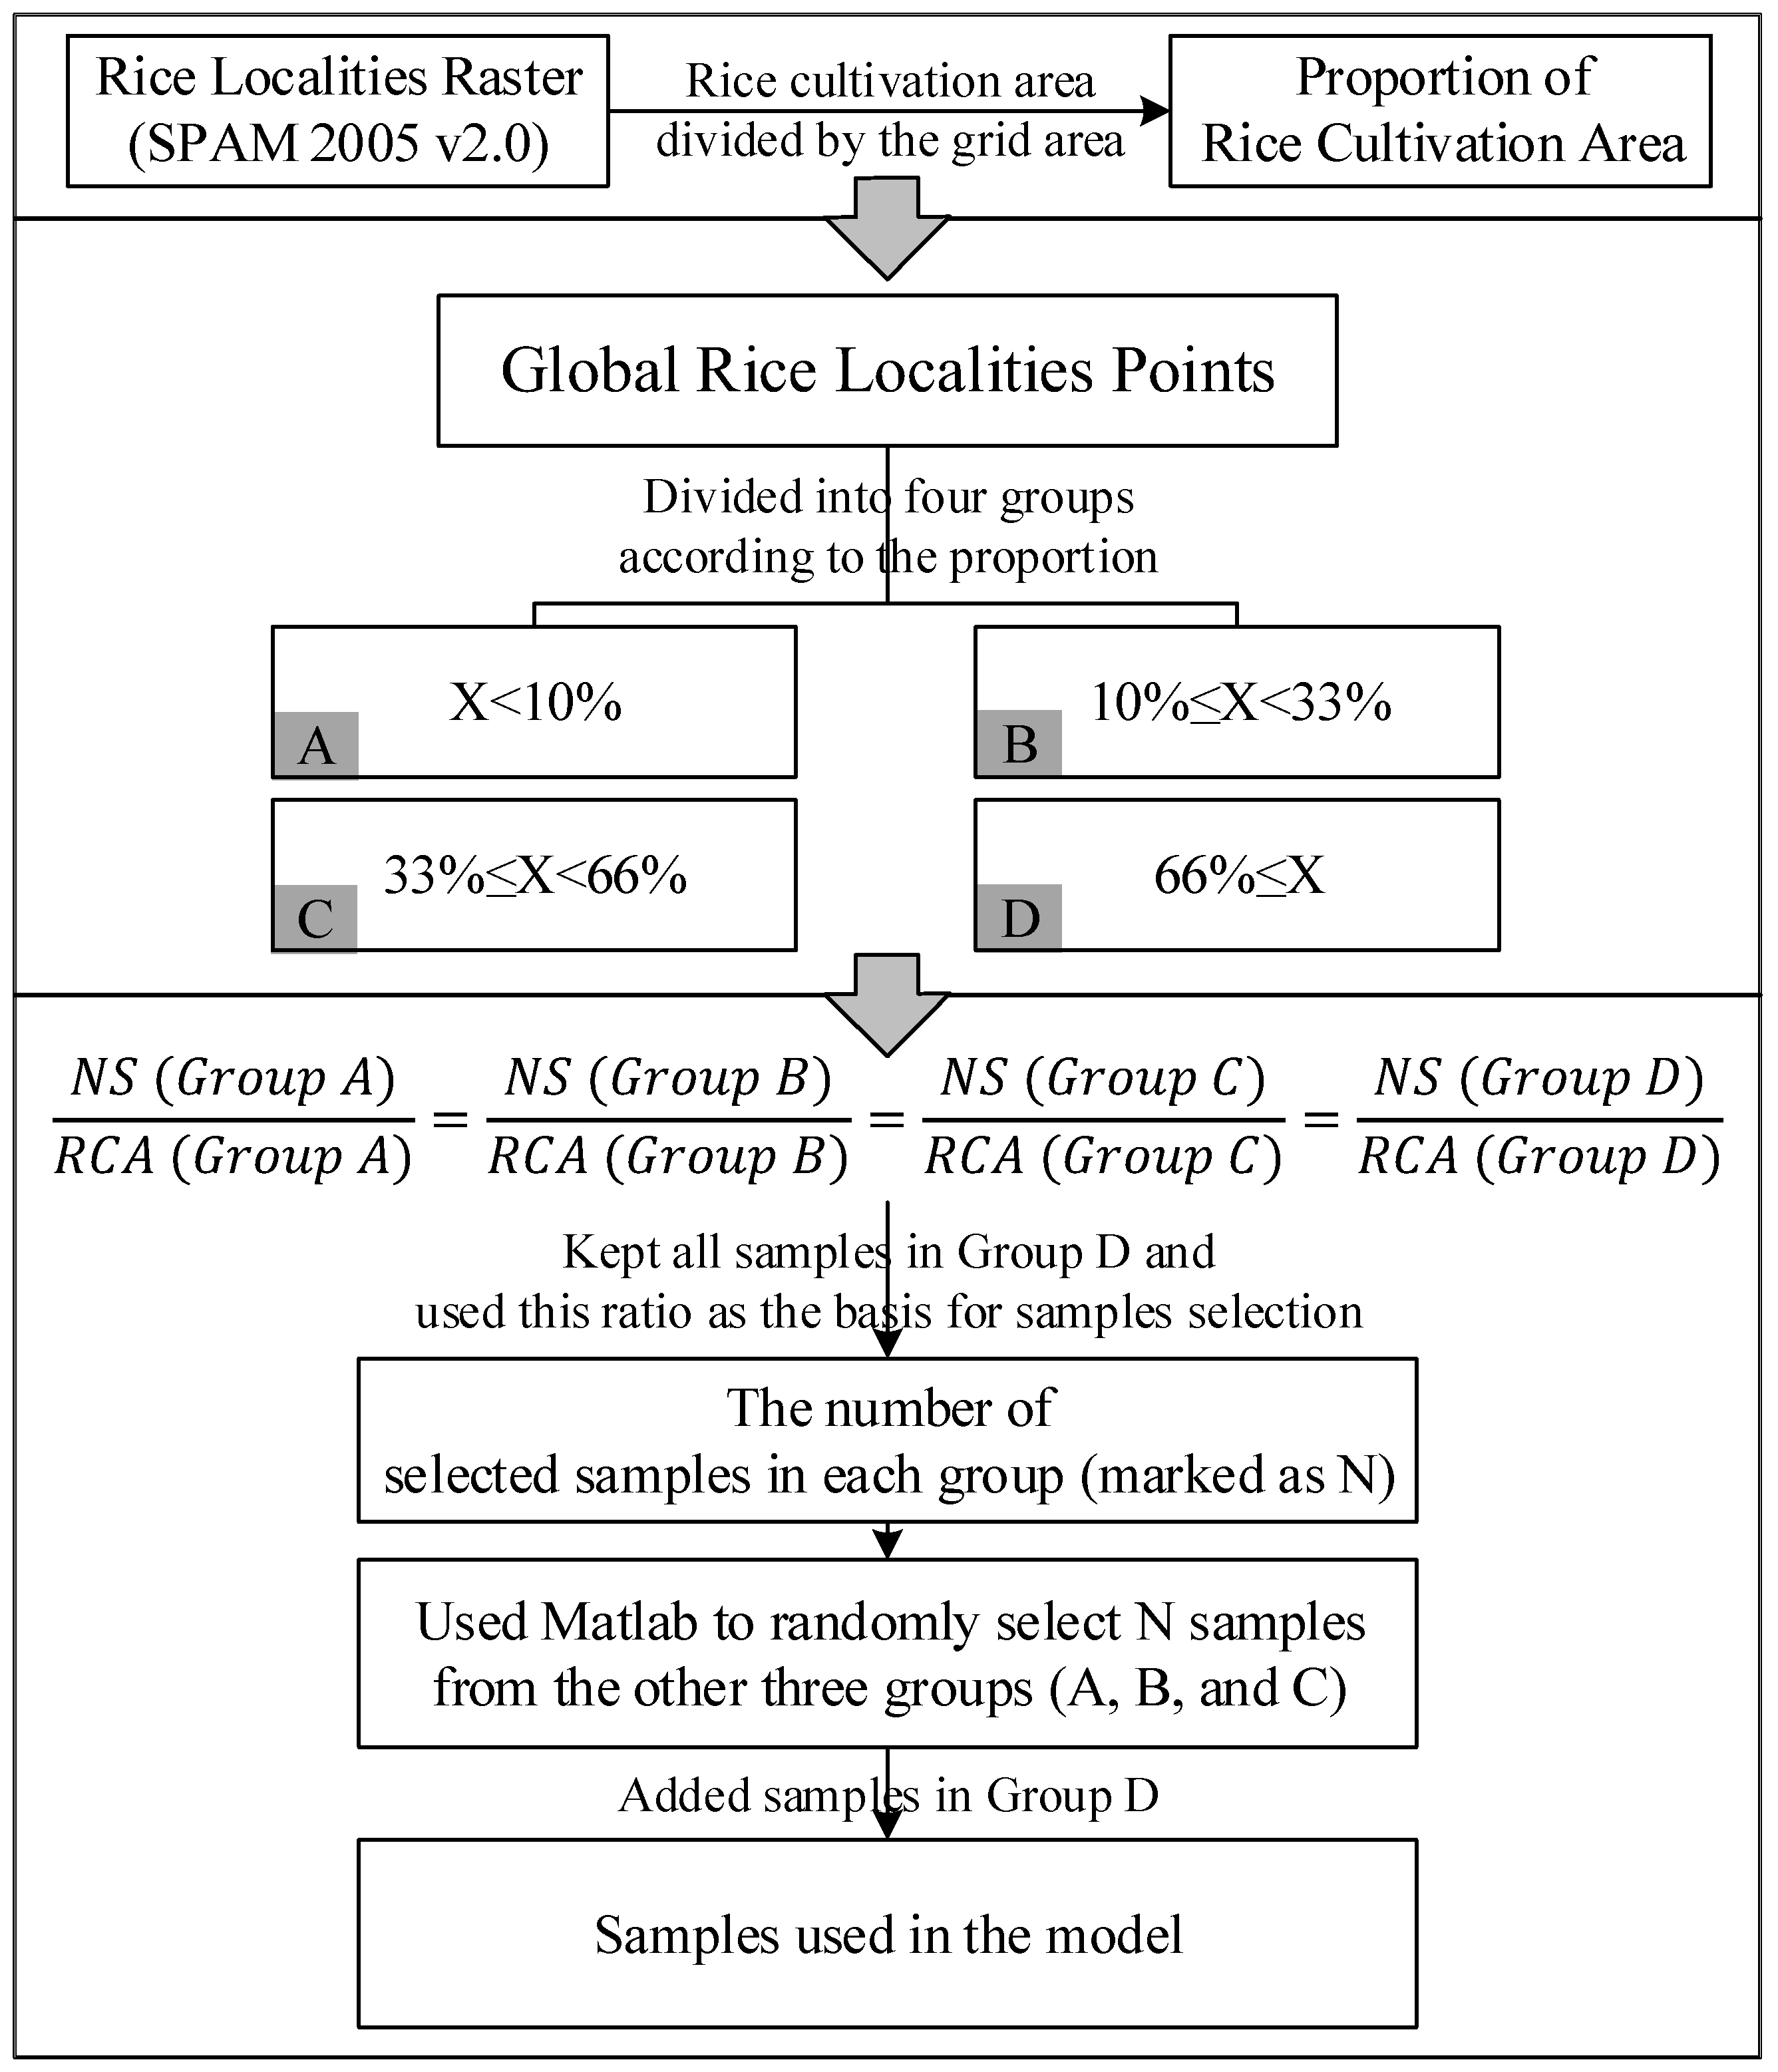
2.3.1. Data on Rice-Growing Areas

We converted the rice localities raster (obtained from the spatial production allocation model SPAM, 2005, ver. 2.0) into points and ended up with a total of 67,974 points. To ensure that the samples meet the requirements of suitable quantity, random distribution, and global representativeness [36,37,38] of the distribution of rice-growing areas, we used the following approach.
First, we obtained data on global grid areas and ascertained how many of the grids had at least some area under rice. Next, as defined by the IPCC [39], we divided the grids into four categories based on the proportion (percentage) of rice-growing area to the total grid area as follows: Group A, below 10%; Group B, 10% or more but less than 33%; Group C, 33% or more but less than 66%; and Group D, 66% or above. Based on the ratio between the total rice cultivation area and the number of samples in Group D (we chose Group D because it has the highest suitability, and the ratio was 62.02), we selected the number of samples from the other three groups so as to maintain the same ratio and used the random selection command in MATLAB for selection (the number of sampling points was increased by 1 for each 62.02 kha under rice; see Table 3). The sampling process is shown in detail in Figure 2.
By using this method, we obtained a total of 2228 samples. Although the figure accounted for only 3.3% of the total samples, it included 32.5% of the grids in which the area under rice was greater than 10% of the total (about 75% of the total area under rice). This sampling method not only covered the overall distribution pattern of rice but also represented the density of rice cultivation, because more samples came from areas with high density of rice cultivation. Compared to the earlier studies [29], 2228 meant a larger sample, which implied more reliable results.
To reduce the impact of random selection on the results, we selected 30 sets of samples at random (each with the total 2228 samples) and used the MaxEnt model to calculate the potential distribution of rice-growing areas in each set. The distribution of areas suitable for rice was averaged over the 30 sets to obtain the final result, and the standard deviation was calculated to reflect the degree of uncertainty associated with those results.

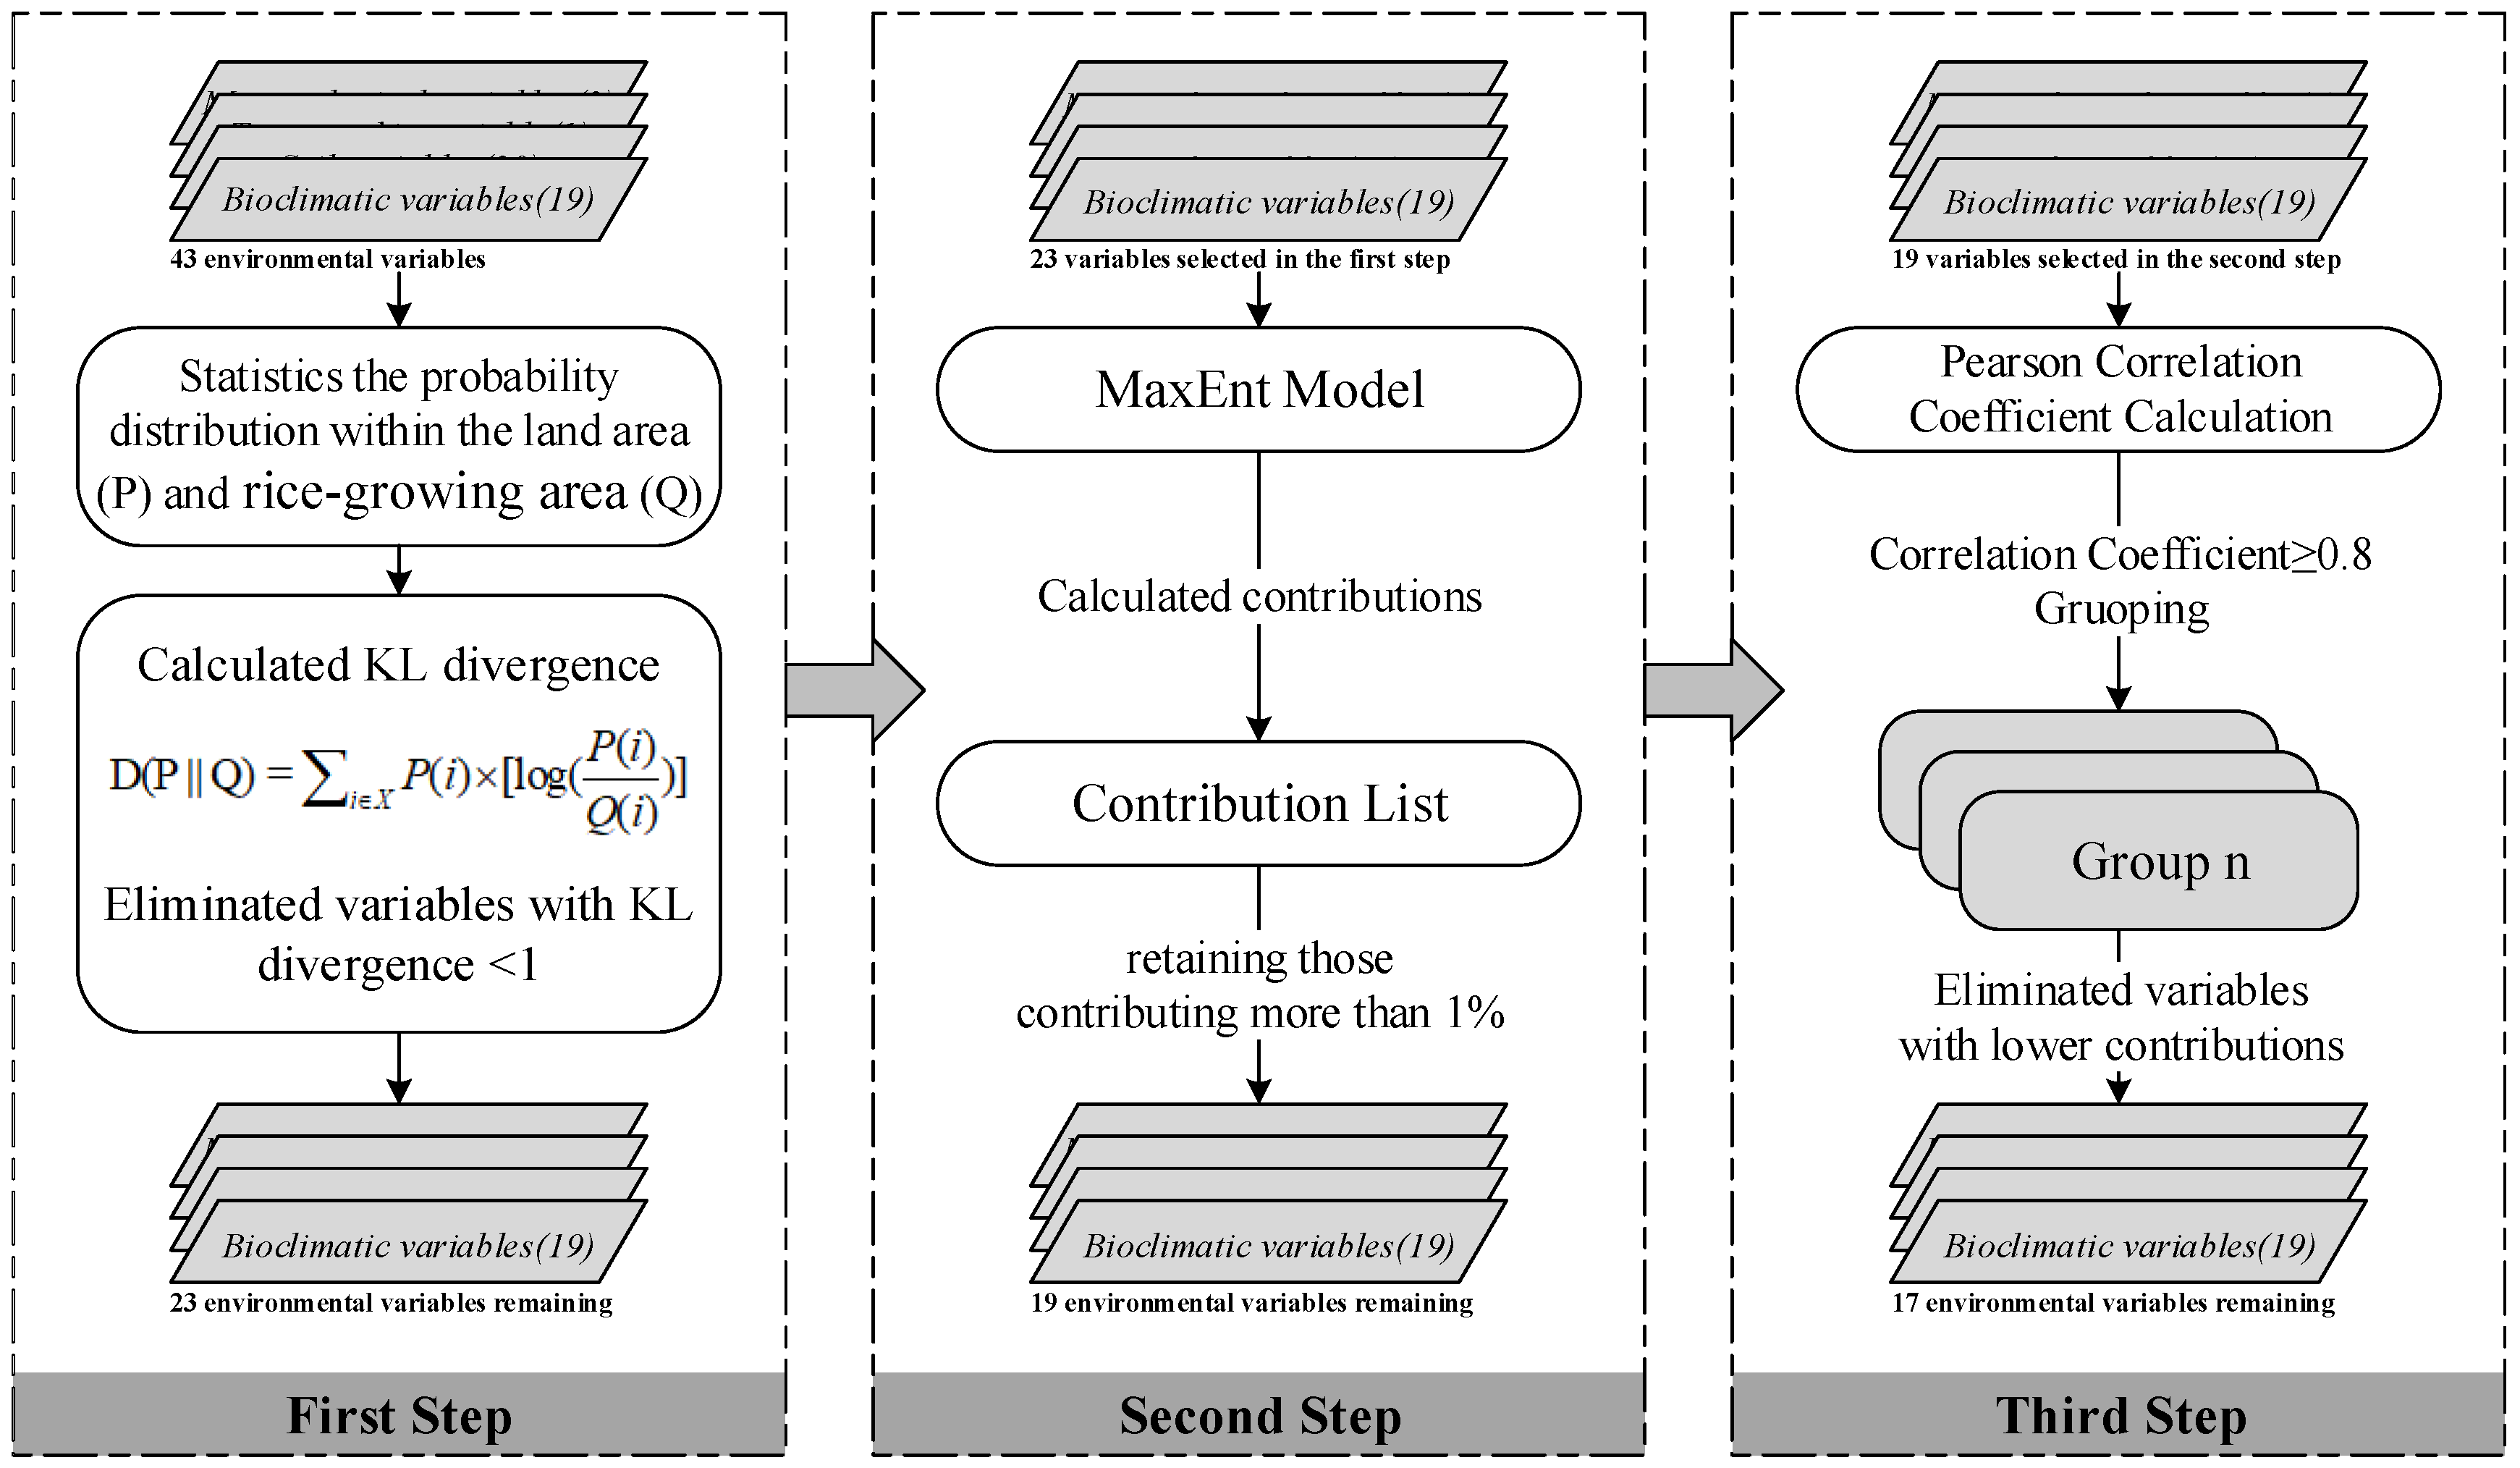
2.3.2. Environmental Variables

Based on earlier research [4,40,41,42,43,44,45,46], we selected topography, climate, and soil as the three most important factors affecting rice cultivation and accordingly collected data on elevation, 22 climate-related variables, and 20 soil-related variables for predicting the areas suitable for rice cultivation in the future. We also used the following methods to select the variables that have a great impact on the natural distribution of such areas. The selection process (Figure 3) was divided into three steps.
The first step consisted of estimating the probability distribution of each variable globally and within the rice-growing regions, denoted as P and Q, respectively, and calculating the Kullback–Leibler divergence (KL divergence) of P from Q (Equation (1)). That divergence is a measure of the difference between one probability distribution and another. If two distributions of a given variable are highly similar, that variable is assumed to be of little significance to the distribution of rice-growing areas. Accordingly, we eliminated all the variables with KL divergence below 1 and carried over the remaining ones to the next step.
The second step consisted of feeding the variables selected in the first step as inputs to the MaxEnt model and, through simulation, obtaining the extent of contribution of each of those variables, sorting them by the contribution, and retaining those contributing more than 1% to potential distribution simulation (as recommended by the IPCC [39]).
Because the variables that serve as inputs for the MaxEnt model should not be highly correlated, the third and the final step consisted of preparing a correlation matrix showing the correlation of each variable to each of the rest, placing all those with correlation coefficient ≥ 0.8 within one group, and finally choosing within the same group only those whose contributions were higher. Figure 3 shows the process of screening the variables and Table 4 lists the selected variables.

2.3.3. Application and Validation of the MaxEnt Model

MaxEnt combines the data on the presence of a given species within a grid with environmental variables representing different environmental gradients within that grid to judge whether the area is suitable for a particular species. The model determines how similar the environment of other regions is to the environment required by the species on a scale of 0 (most dissimilar) to 1 (most similar) and can therefore be used to predict the potential distribution of species and to provide corresponding estimates of the probability of that distribution [24,47,48,49].
Of the 2228 samples that served as inputs for the model, 75% were used for training the model and the remaining 25% for validation. We chose Cloglog as the output format, representing the probability (ranging from 0 to 1) of potential distribution. All the other parameters were set at their default values.
We also adopted the receiver operator characteristic (ROC) curve, a common method of validating the accuracy of MaxEnt, to assess its performance. The area under the ROC curve (referred to as AUC) is a threshold-independent measure of performance and ranges from 0 to 1, values greater than 0.75 being taken to mean that the model’s predictions are reliable and accurate [37,50]. The specific standards are as follows [51]: 0.50–0.60, failure; 0.61–0.70, poor; 0.71–0.80, fair; 0.81–0.90, good; and 0.91–1.00, excellent.
To test the accuracy of the predictions, the results of the simulation were compared to the actual data on the sowing and harvest of rice. The relevant equations were as follows:
Producer’s accuracy:
p a   =   100 % × r r r r + r n
User’s accuracy:
u a   =   100 % × r r r r + n r
Overall accuracy:
o a   =   100 % × r r + n n r r + n r + r n + n n
where rr refers to the situation in which the actual data and the results of the simulation both have a value of 1; rn, to that in which the value of the actual harvest data is 1 and that of the simulation is 0; nr, to that in which the value of the harvest data is 0 and that of the simulation result is 1; and nn, to that in which the value of both is 0 (1 means exist, 0 means none).
Finally, we drew the scatter plots, the horizontal axis for the predicted suitability for rice and the vertical axis for the fraction of past data on the area from which rice was harvested, and then used the scatter plots to assess the extent to which the predictions by the MaxEnt model matched the past data.

3. Results

3.1. Historical Rice Distribution and Accuracy of Rice Suitability Simulation

The present study considered an area as suitable for rice cultivation under natural conditions and used the probability of the distribution of such areas as indicators of their suitability for rice: the higher the probability, the greater the suitability. Based on the categories used by the IPCC and in earlier research on the topic, we classified the suitability into four groups as determined by the probability: If the distribution probability (P) was less than 1%, the area was considered unsuitable; if between 1% and 33%, moderately suitable; if greater than 33% but less than 66%, marginally suitable; and if greater than 66%, highly suitable. Next, we mapped the past distribution of land suitable for rice cultivation (the distribution based on the average probabilities indicated by the model) (Figure 4).
To evaluate the uncertainty caused by random sampling, we calculated the standard deviation of the results of the simulation (discussed later in Section 4). The average AUC value of the model was 0.859, indicating that the results of the model were highly reliable.
Compared with the past-rice cultivation, the values of producer’s accuracy, the user’s accuracy, and the overall accuracy are shown in Figure 5 and Table 5.
The overall range of areas predicted by the model as suitable for rice was wider than that of areas on which rice had been grown in the past (Figure 5). The difference was due to such socio-economic factors as cultivation history and eating habits, which affect the decision to grow rice on a given piece of land. The producer’s accuracy of each set of verification data exceeded 95%, indicating that the areas predicted to be suitable encompassed more than 95% of the actual area under rice. In general, the method of predicting potentially suitable areas proved highly accurate.
To verify the accuracy further, we drew the scatter plots, the horizontal axis for the predicted suitability for rice and the vertical axis for the fraction of past data on the area from which rice was harvested. The scatter plot of the fraction (ratio) of area under rice to the total area of the given grid (rice cultivation area/grid area) for each simulated distribution probability and that for the actual data are shown in Figure 6.
The predicted distribution probability was positively correlated to the past rice cultivation ratio: the higher the predicted probability, the higher was the corresponding ratio, which proved that the predictions were accurate.

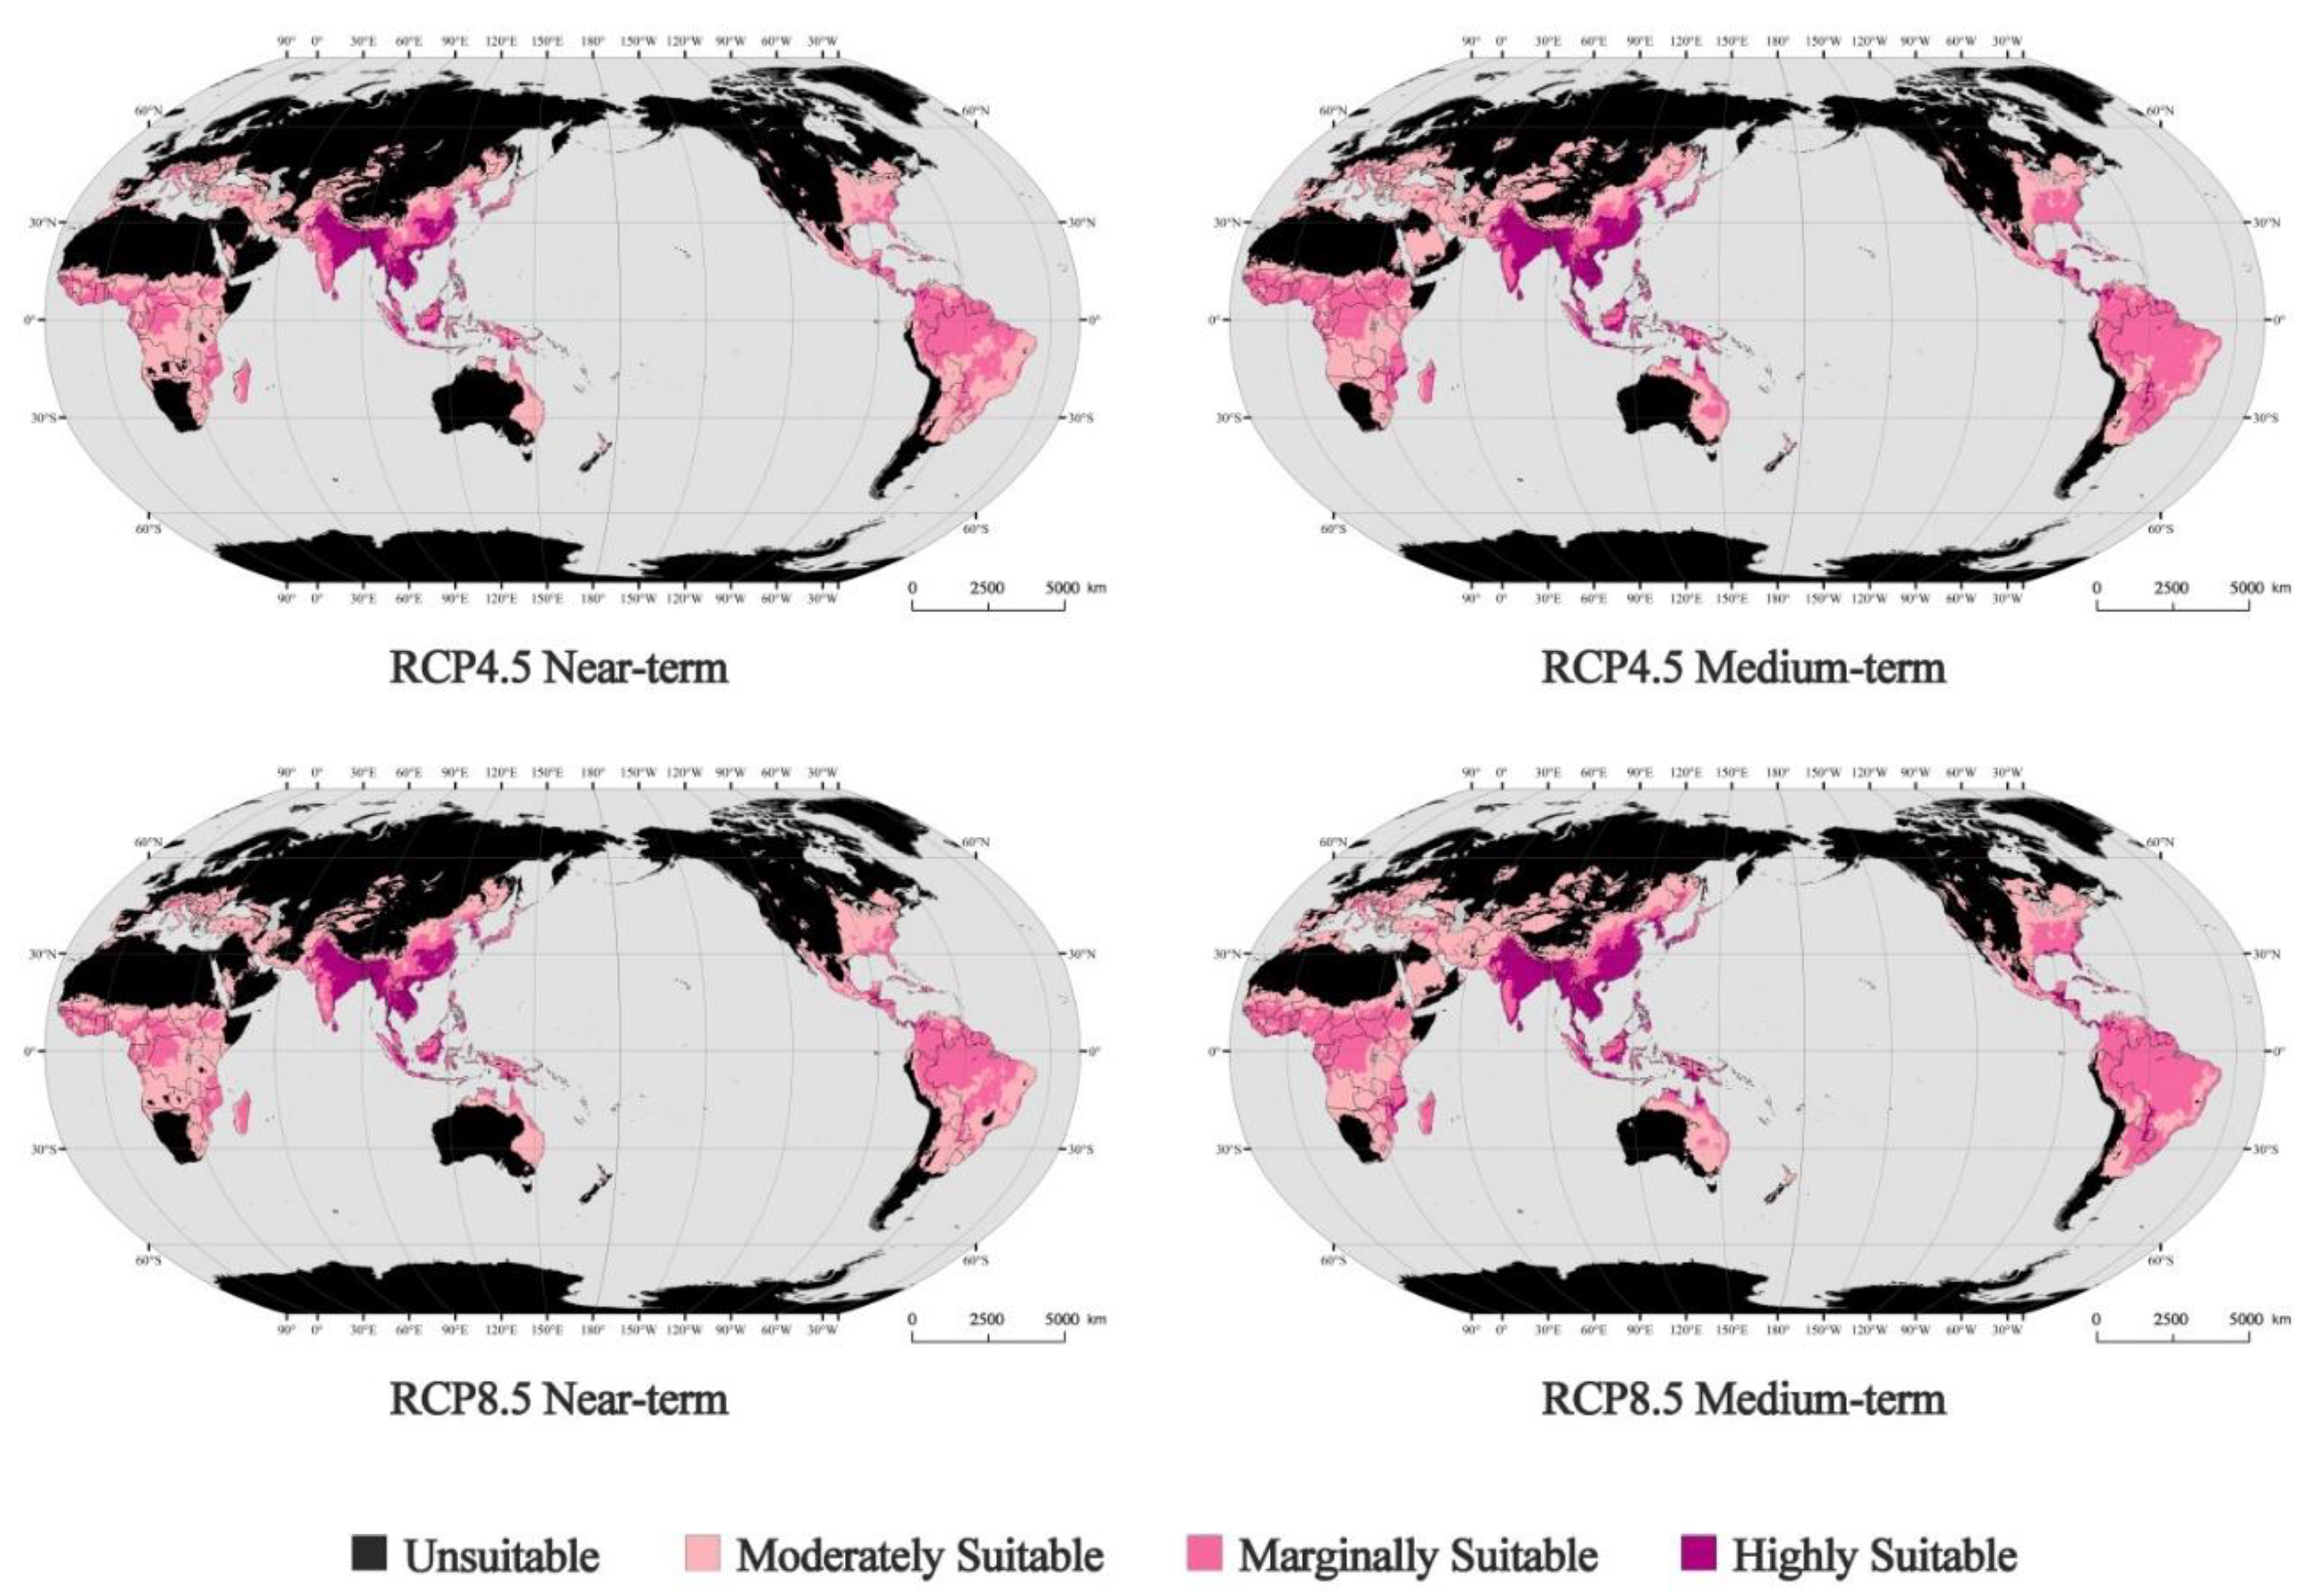
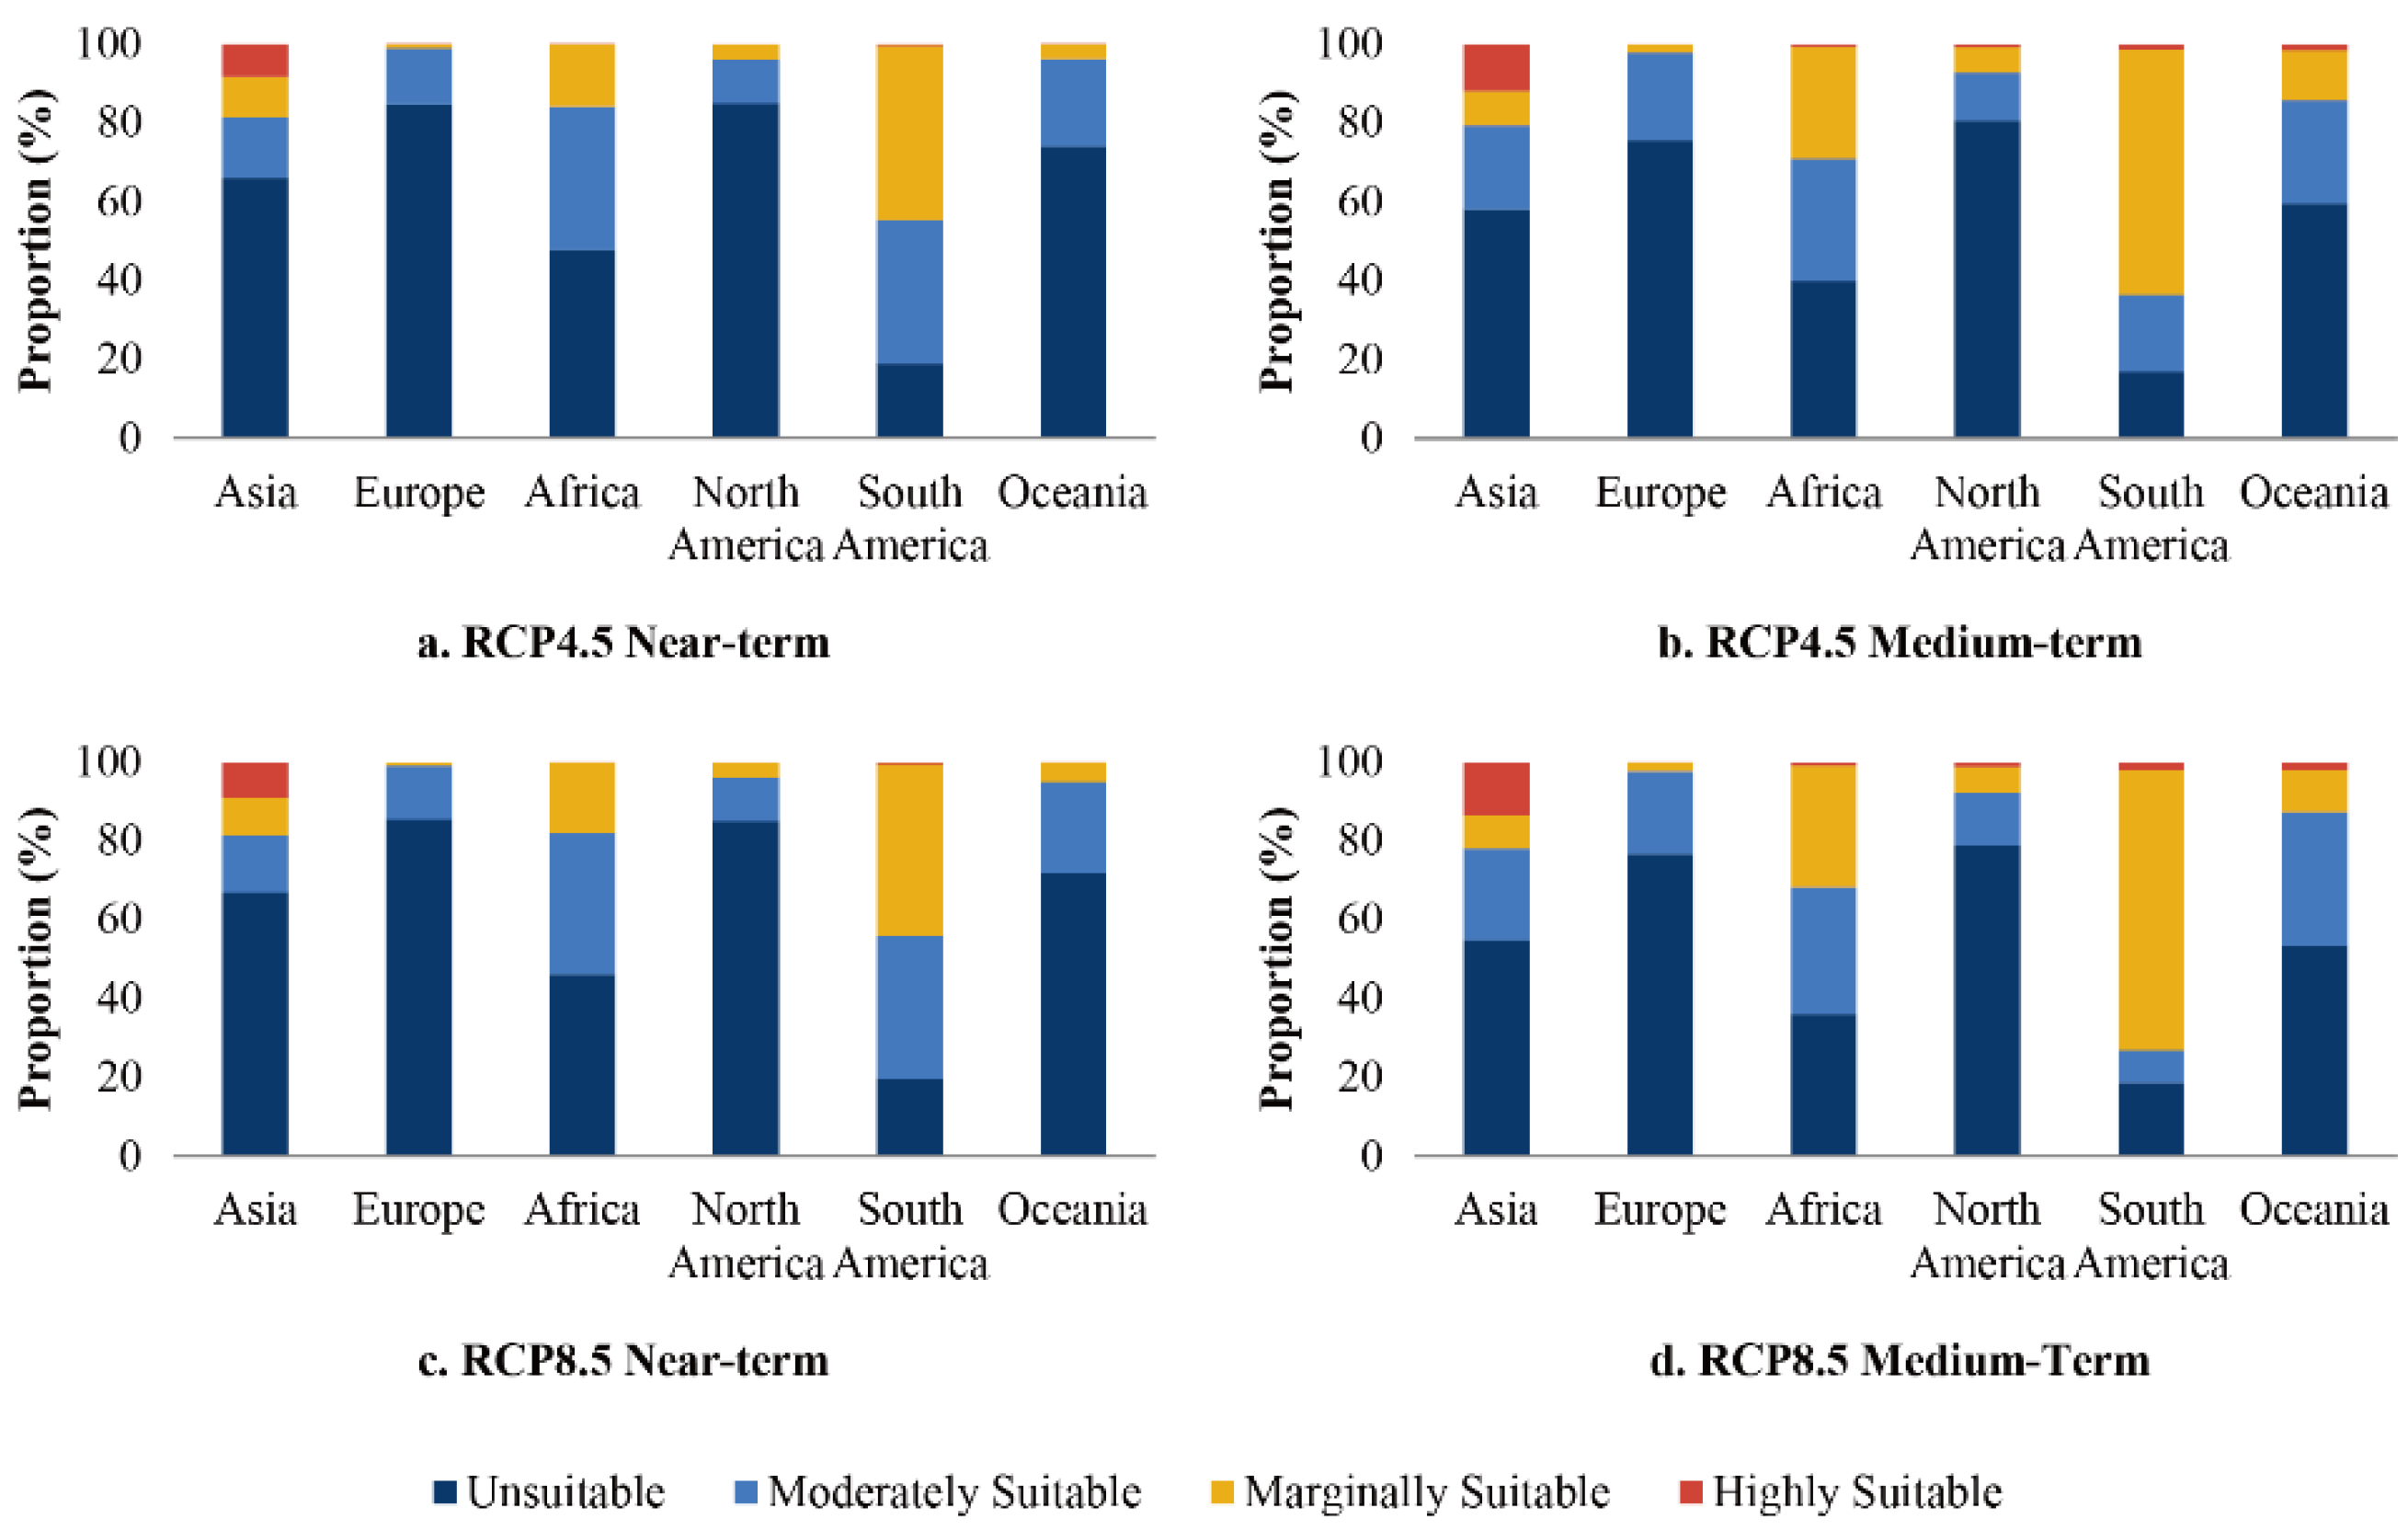
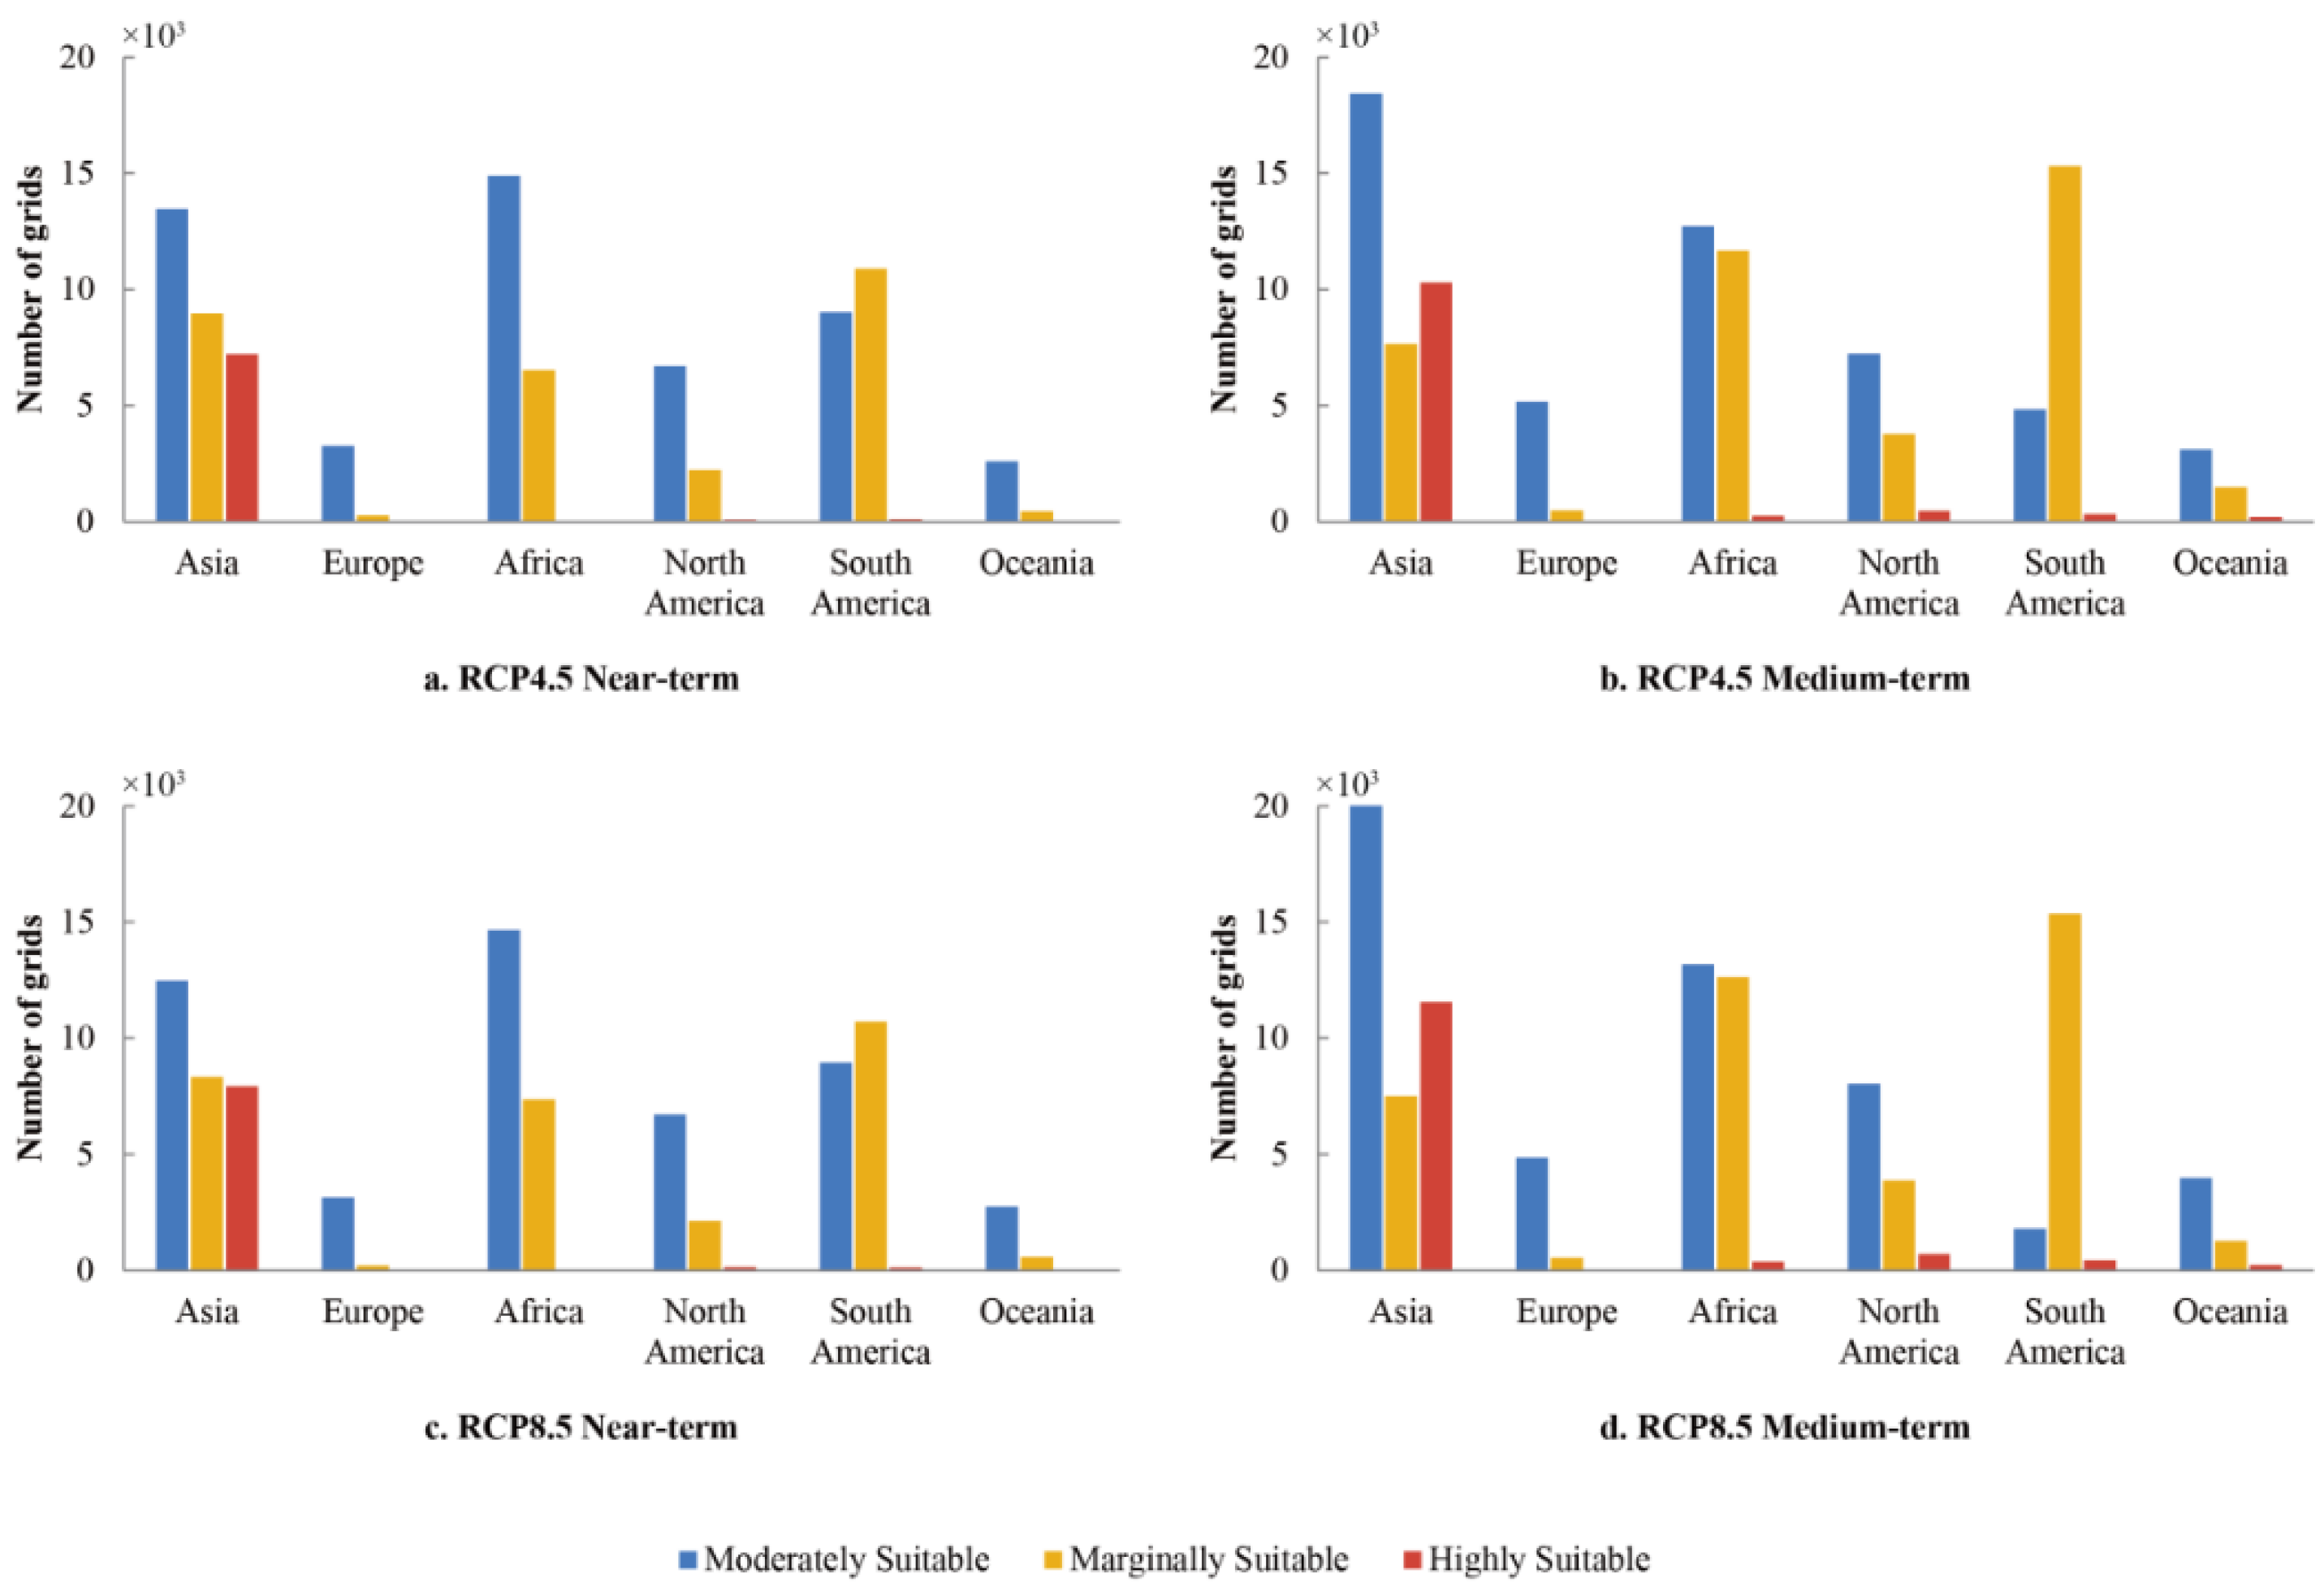
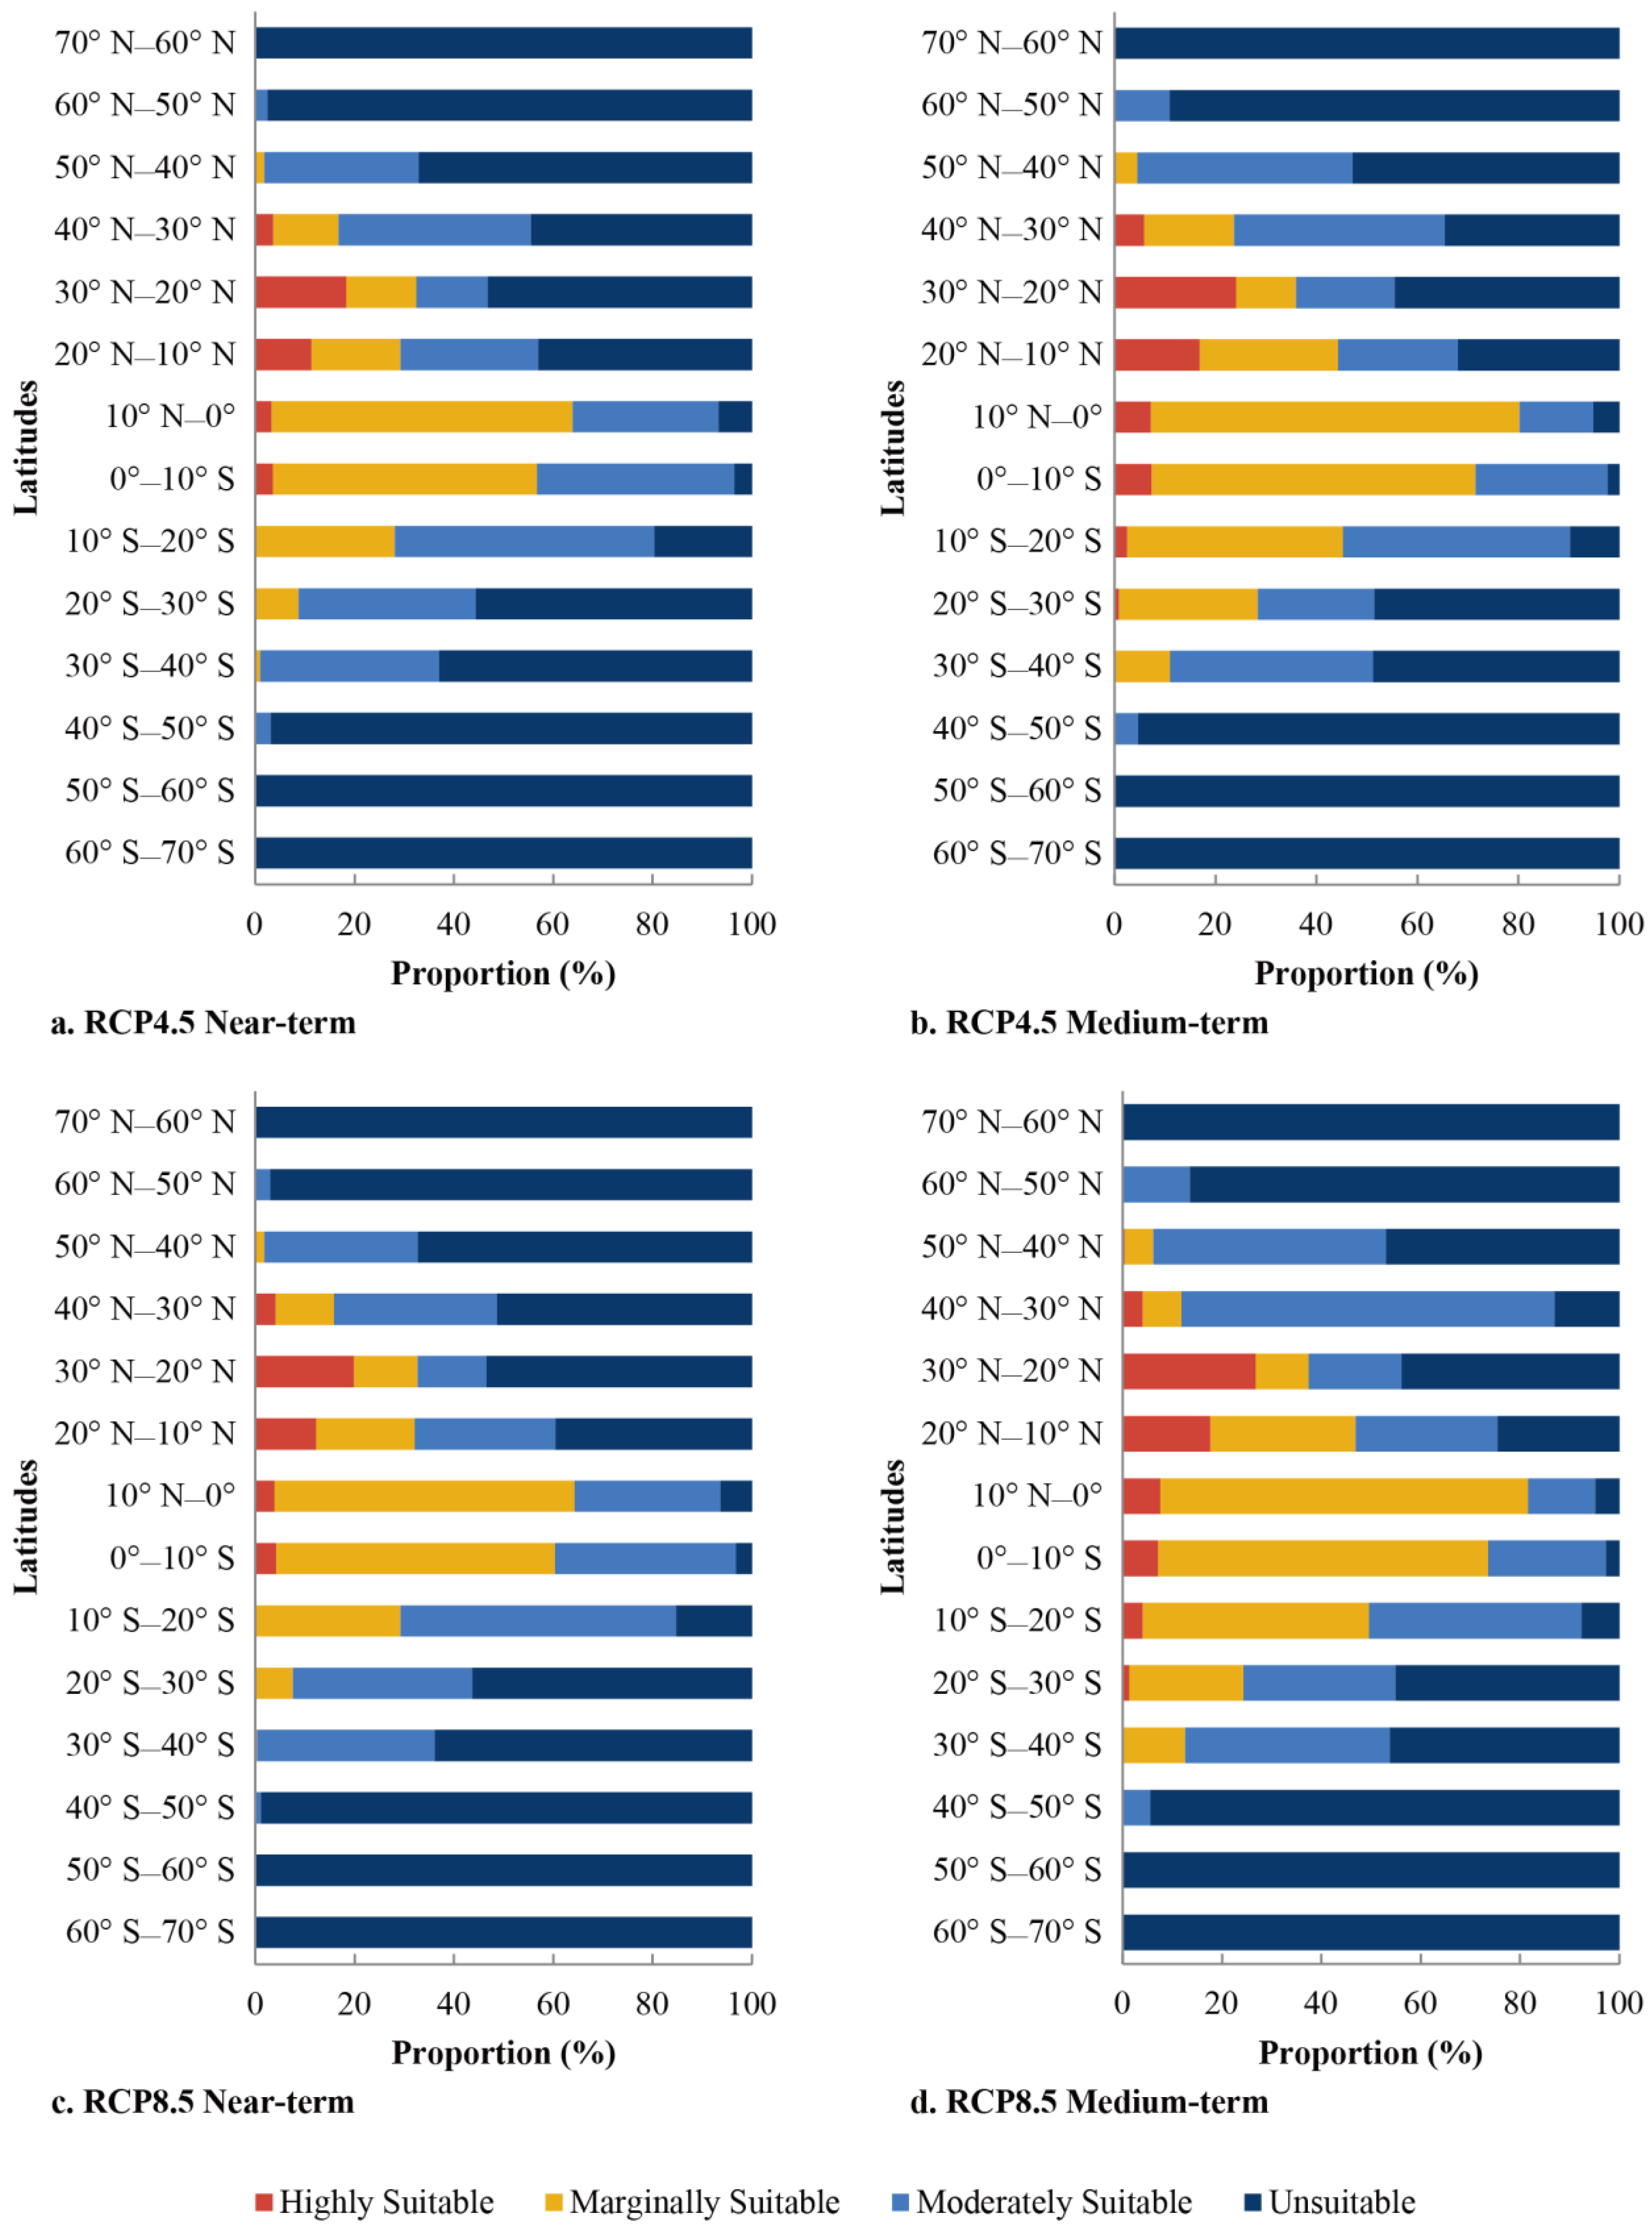
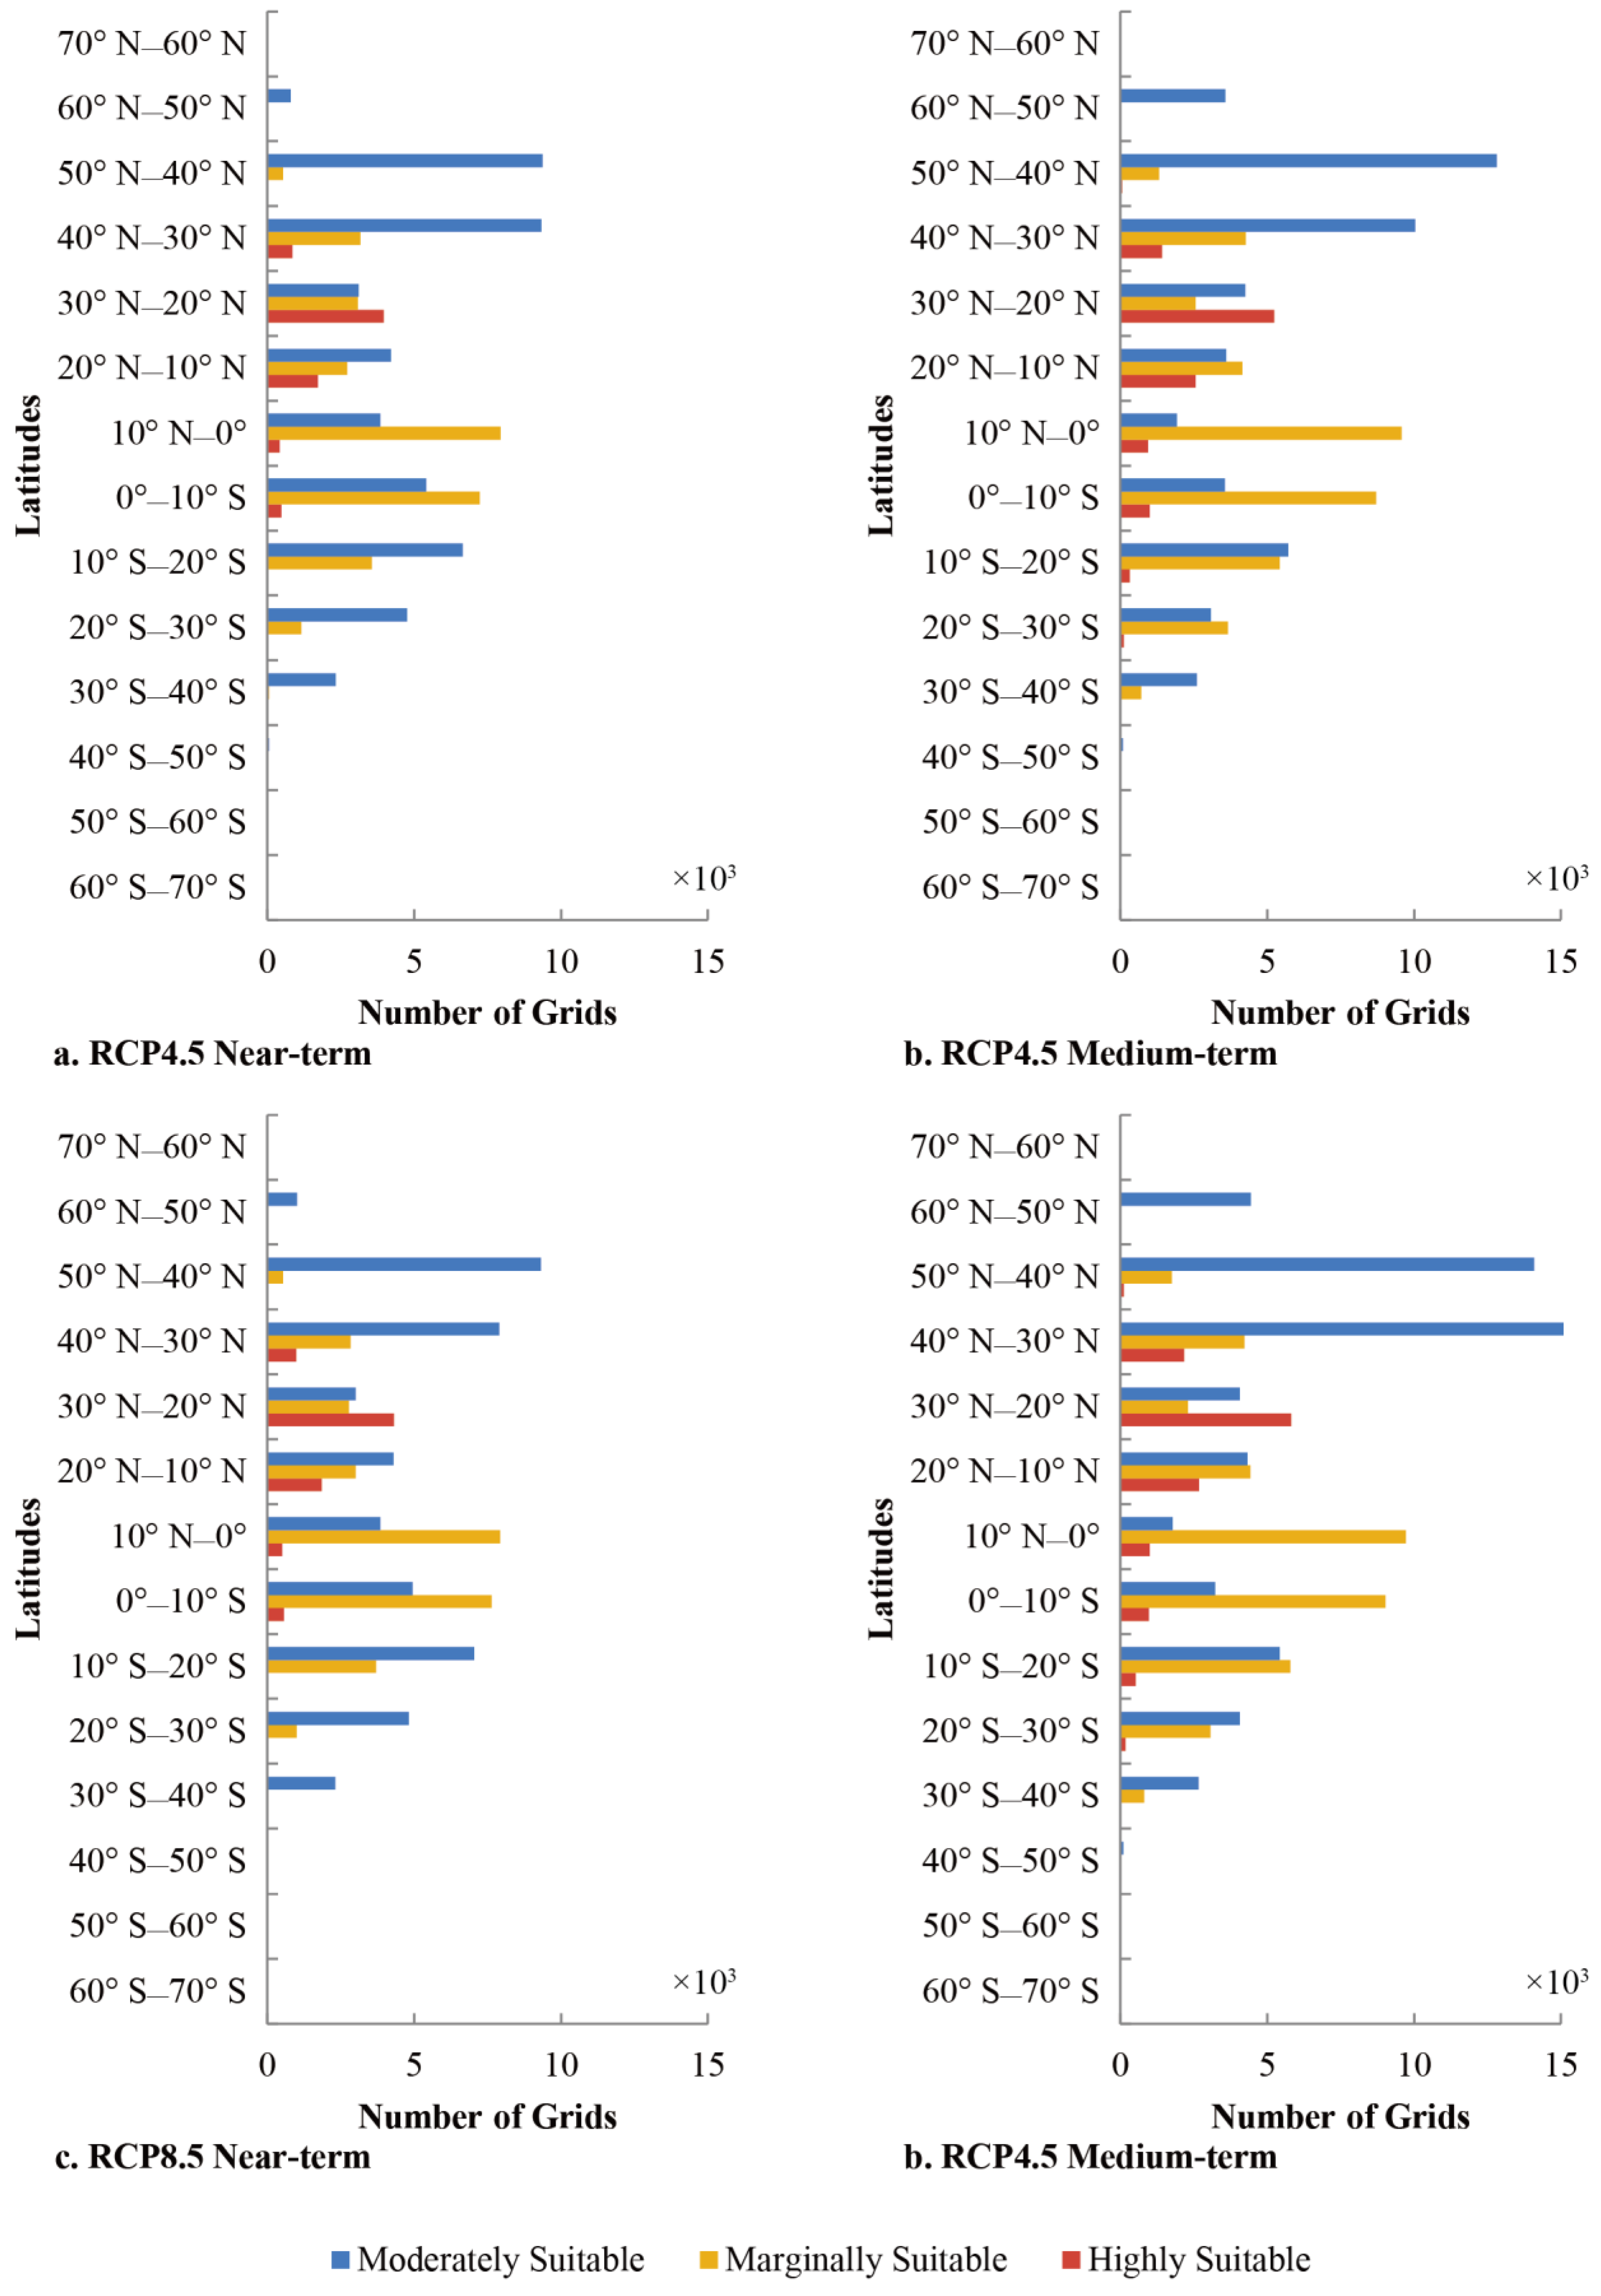
3.2. Potential Global Rice Distribution under Two Climate-Change Scenarios

We mapped the areas likely to be suitable for rice cultivation under two future scenarios (Figure 7). Besides, we have statistics on continents and latitudes for these two aspects (Figure A1, Figure A2, Figure A3 and Figure A4).
Under the climate-change scenarios, the areas suitable for rice were concentrated mostly in the tropics and the subtropics, the proportion of highly suitable areas being the highest between 10° N and 30° N. According to the statistics, tropical and subtropical regions accounted for 100% of the highly suitable areas, 97% of the moderately suitable areas, and 79% of the lowly suitable areas. Asia, South America, and Africa had the largest proportion of suitable areas, with Asia claiming nearly all (98%) of the highly suitable areas. The three continents together accounted for 91% of the moderately suitable areas and 80% of the lowly suitable areas.
The global distribution of suitable areas changed slightly with the scenario, and the overall pattern was consistent with the past distribution. For example, under RCP 4.5 in the medium term, the global extent of areas suitable for rice increased only by 2–10% of the present status, predicting that the overall pattern would change only slightly.

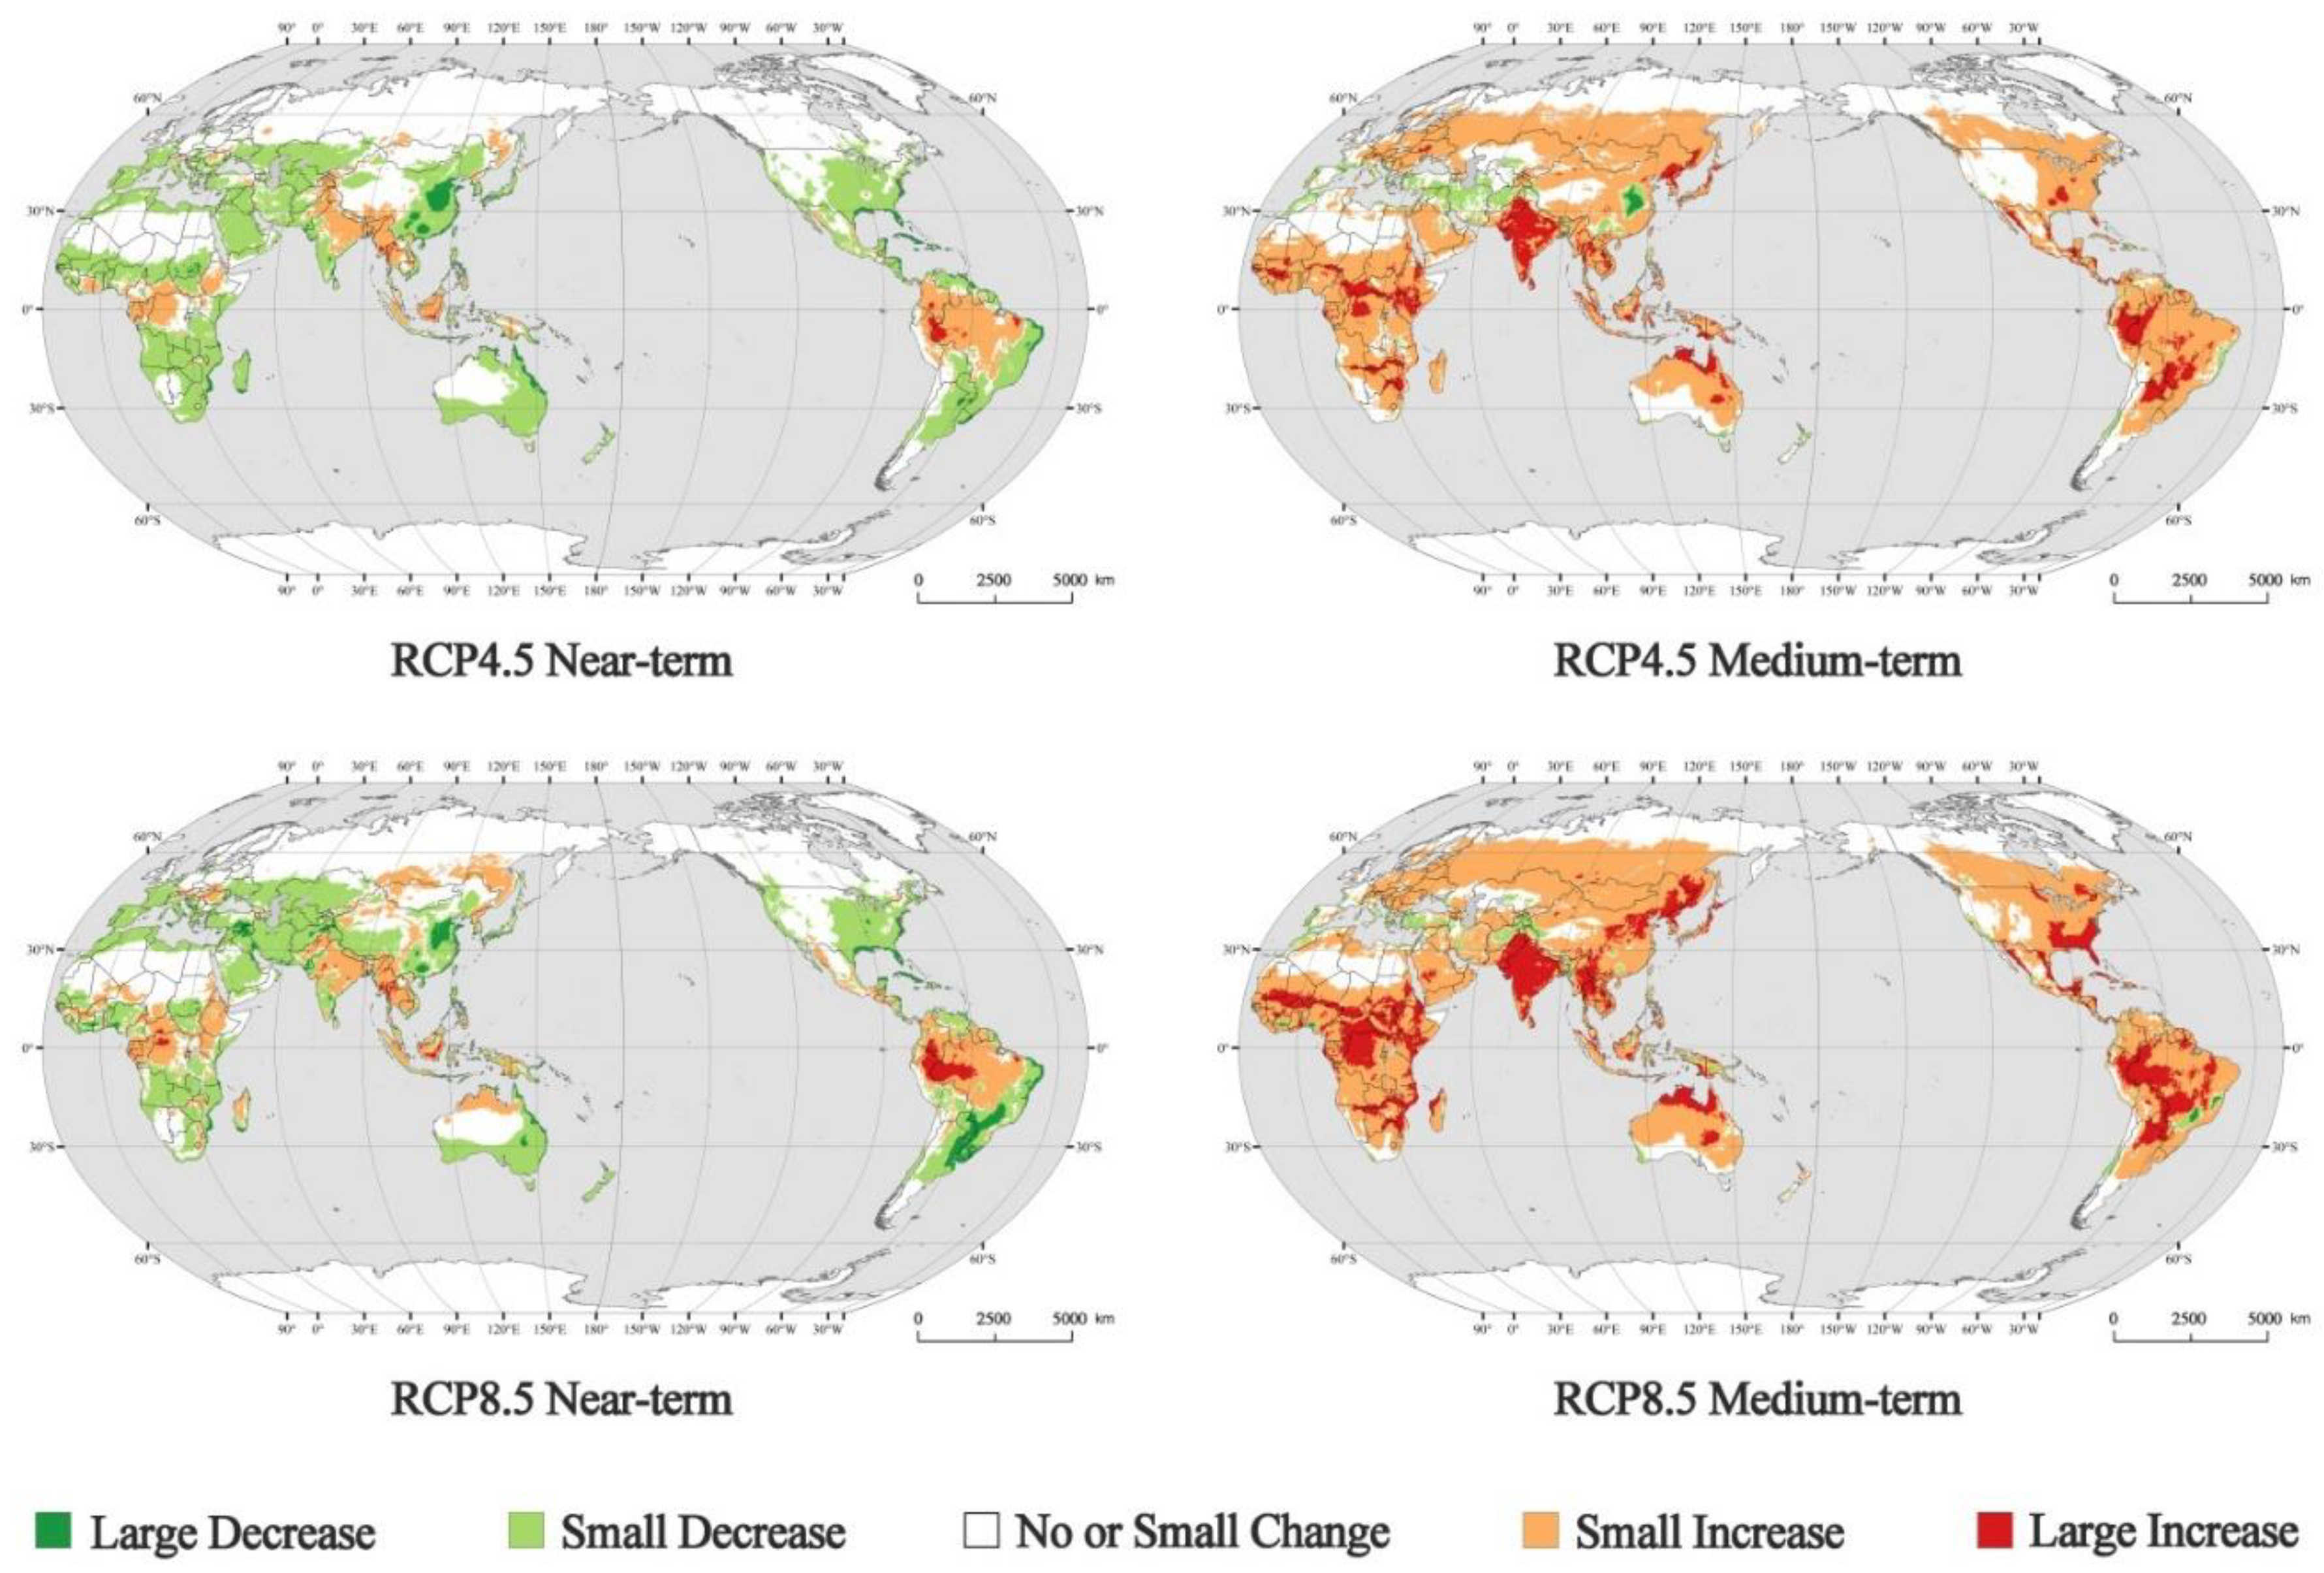
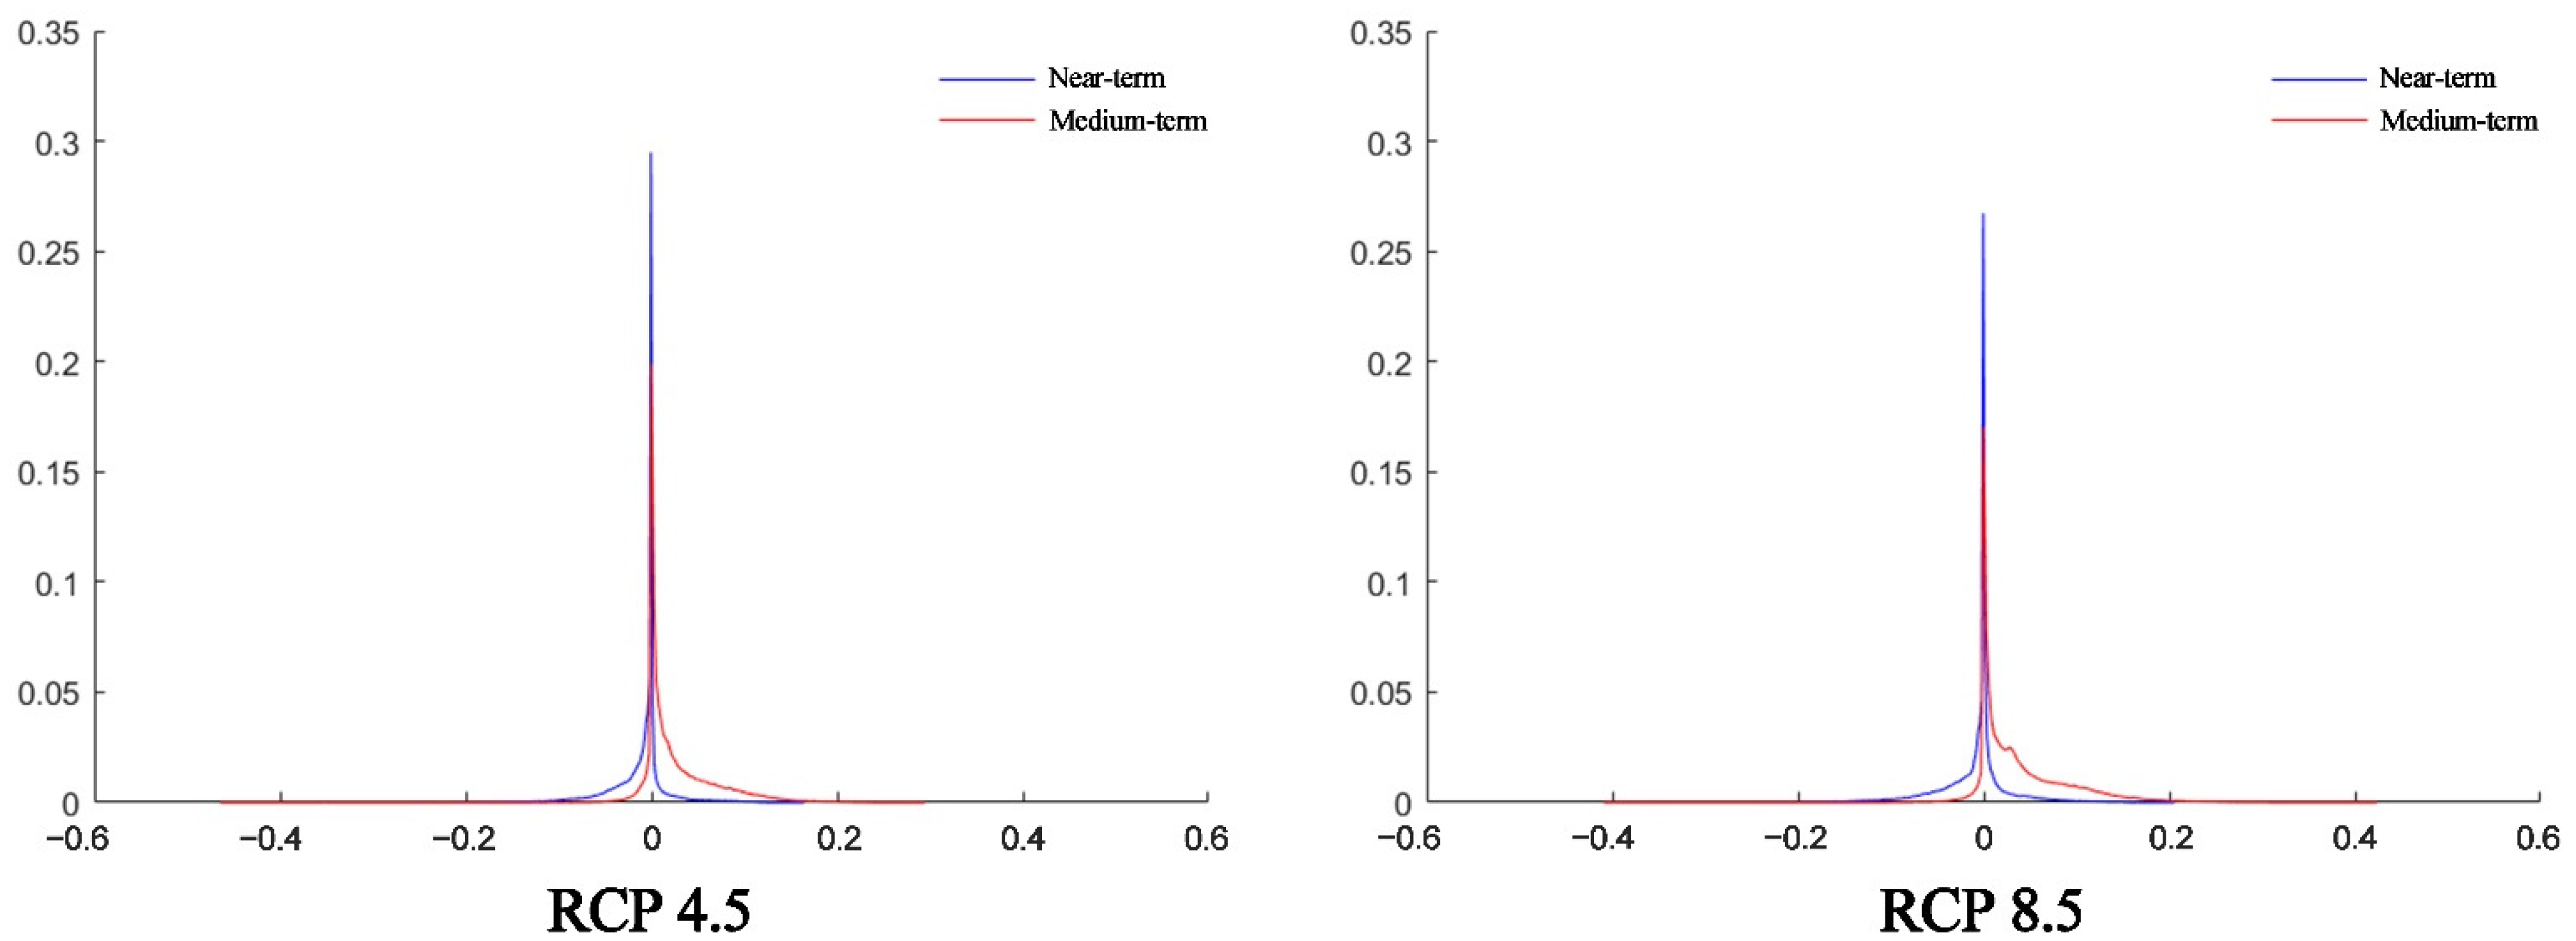
3.3. Changes in Potential Global Rice Distribution under Two Climate-Change Scenarios

In comparing the potential distribution of rice under each scenario with the past distribution (Figure 8), we divided the degree of change into five levels: large decrease (decrease greater than 10%), small decrease (decrease of 1% to 10%), no change or slight change (decrease or increase of less than 1%), small increase (increase of 1% to 10%), and large increase (increase greater than 10%).
Under the two scenarios, the extent of areas suitable for rice increased in the tropics and in high-latitude regions and decreased in the mid-latitude regions and in the subtropics.
As can be seen from Figure 8, the overall area decreased in the short term in both scenarios; whatever increase there was, it was mainly in South Asia, South East Asia, and in the tropical rainforest areas of Africa, such as the Congo basin and the Amazon plain. Further, but also in the short term, the areas suitable for rice increased in high-latitude regions such as southern Siberia under RCP 8.5.
In the medium term under both scenarios, the areas showed a clear increase, especially in high-latitude regions, although under RCP 4.5, the area decreased in West Asia (except the Arabian peninsula), especially in northern China, which showed a significant decrease, and the Indian peninsula, north-eastern China, and the Brazilian plateau showed a marked increase. Under RCP 8.5, the overall trend showed an increase, with the regions with steep increases being the same as those under RCP 4.5, although a few regions showed a decrease.
Under both RCP 4.5 and RCP 8.5, the proportions of areas with different degrees of suitability (Figure 9) showed that changes in the medium term were greater than those in the short term, although the direction of the change was different: a decrease in the short term and an increase in the medium term, with the extent of change being more under RCP 8.5.

4. Discussion

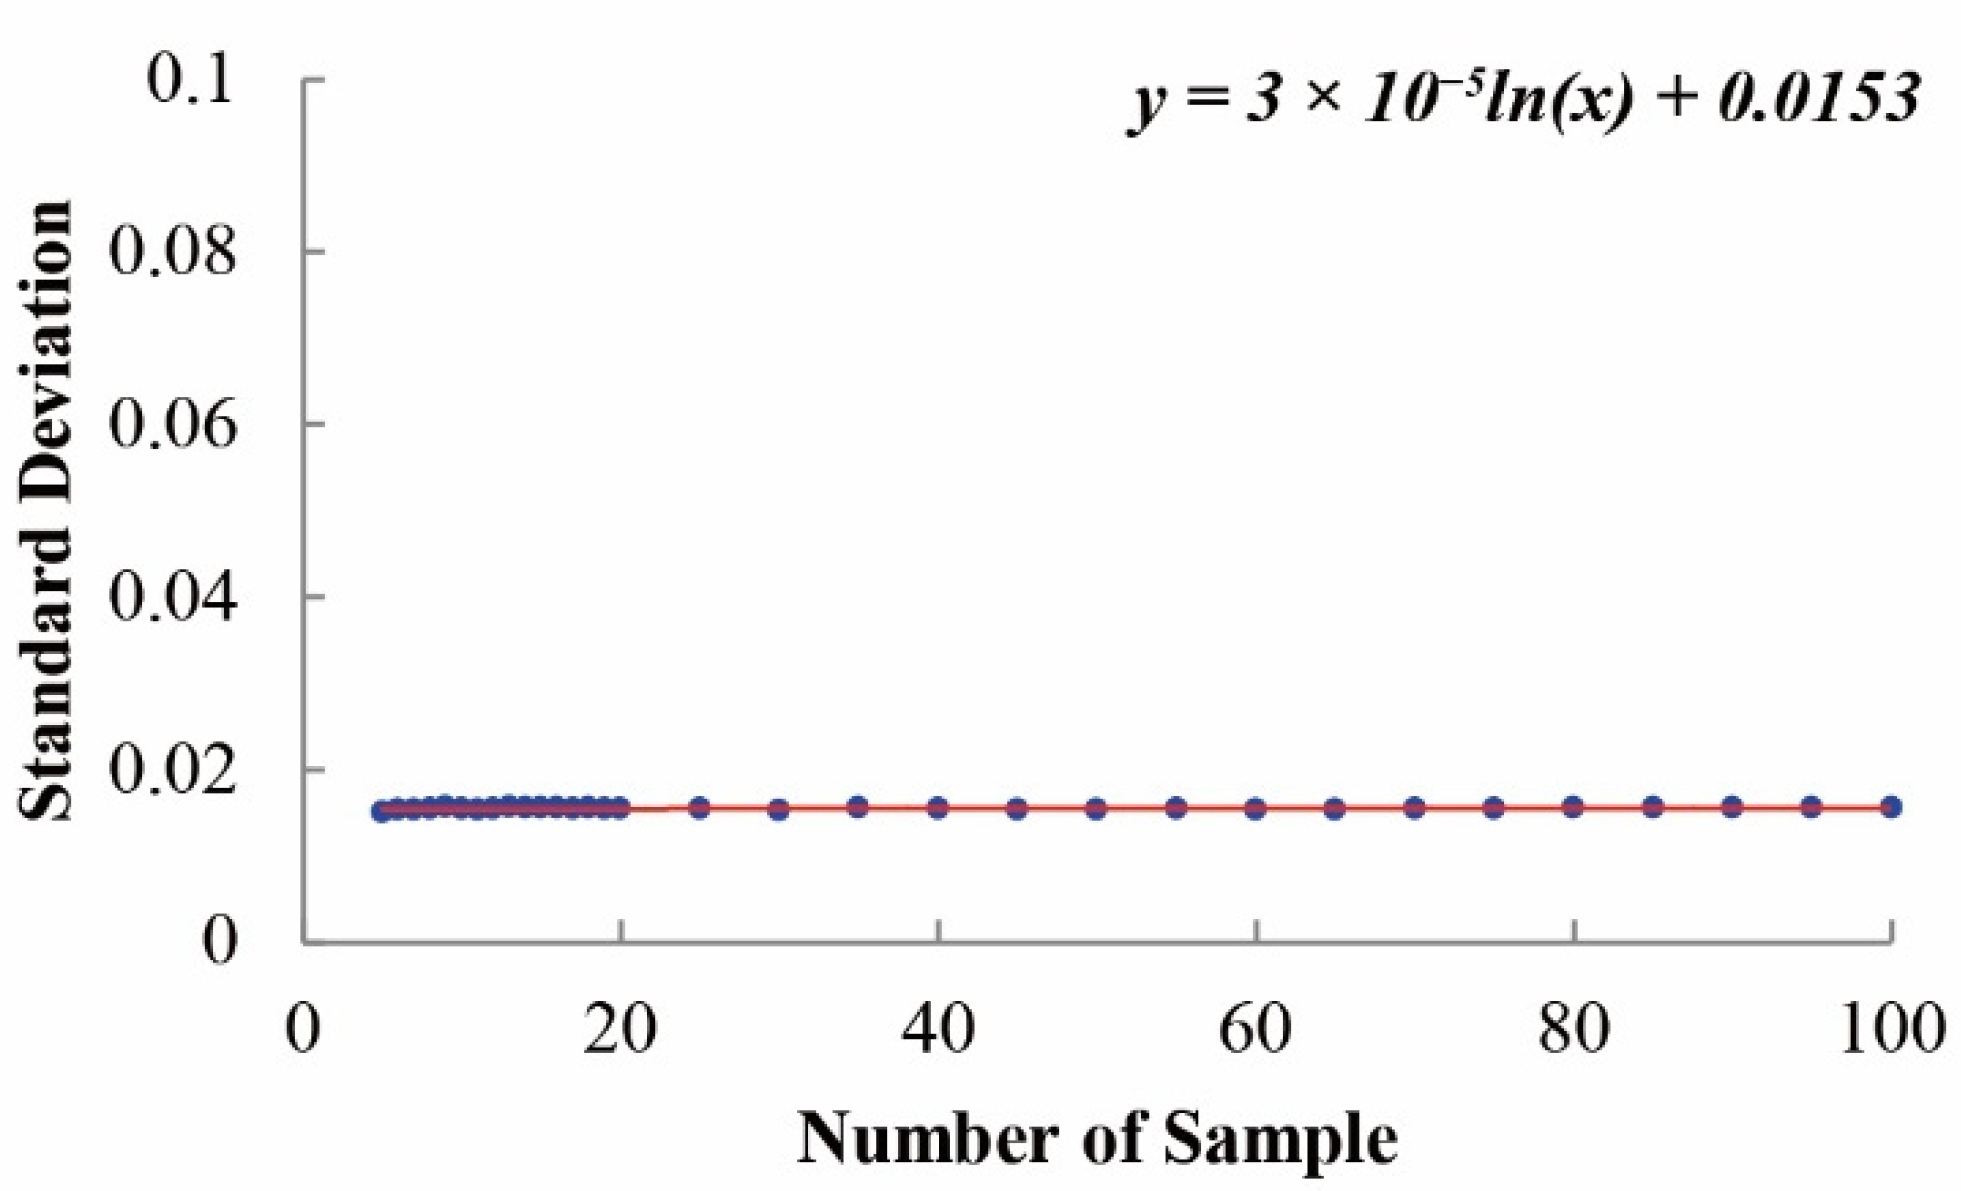
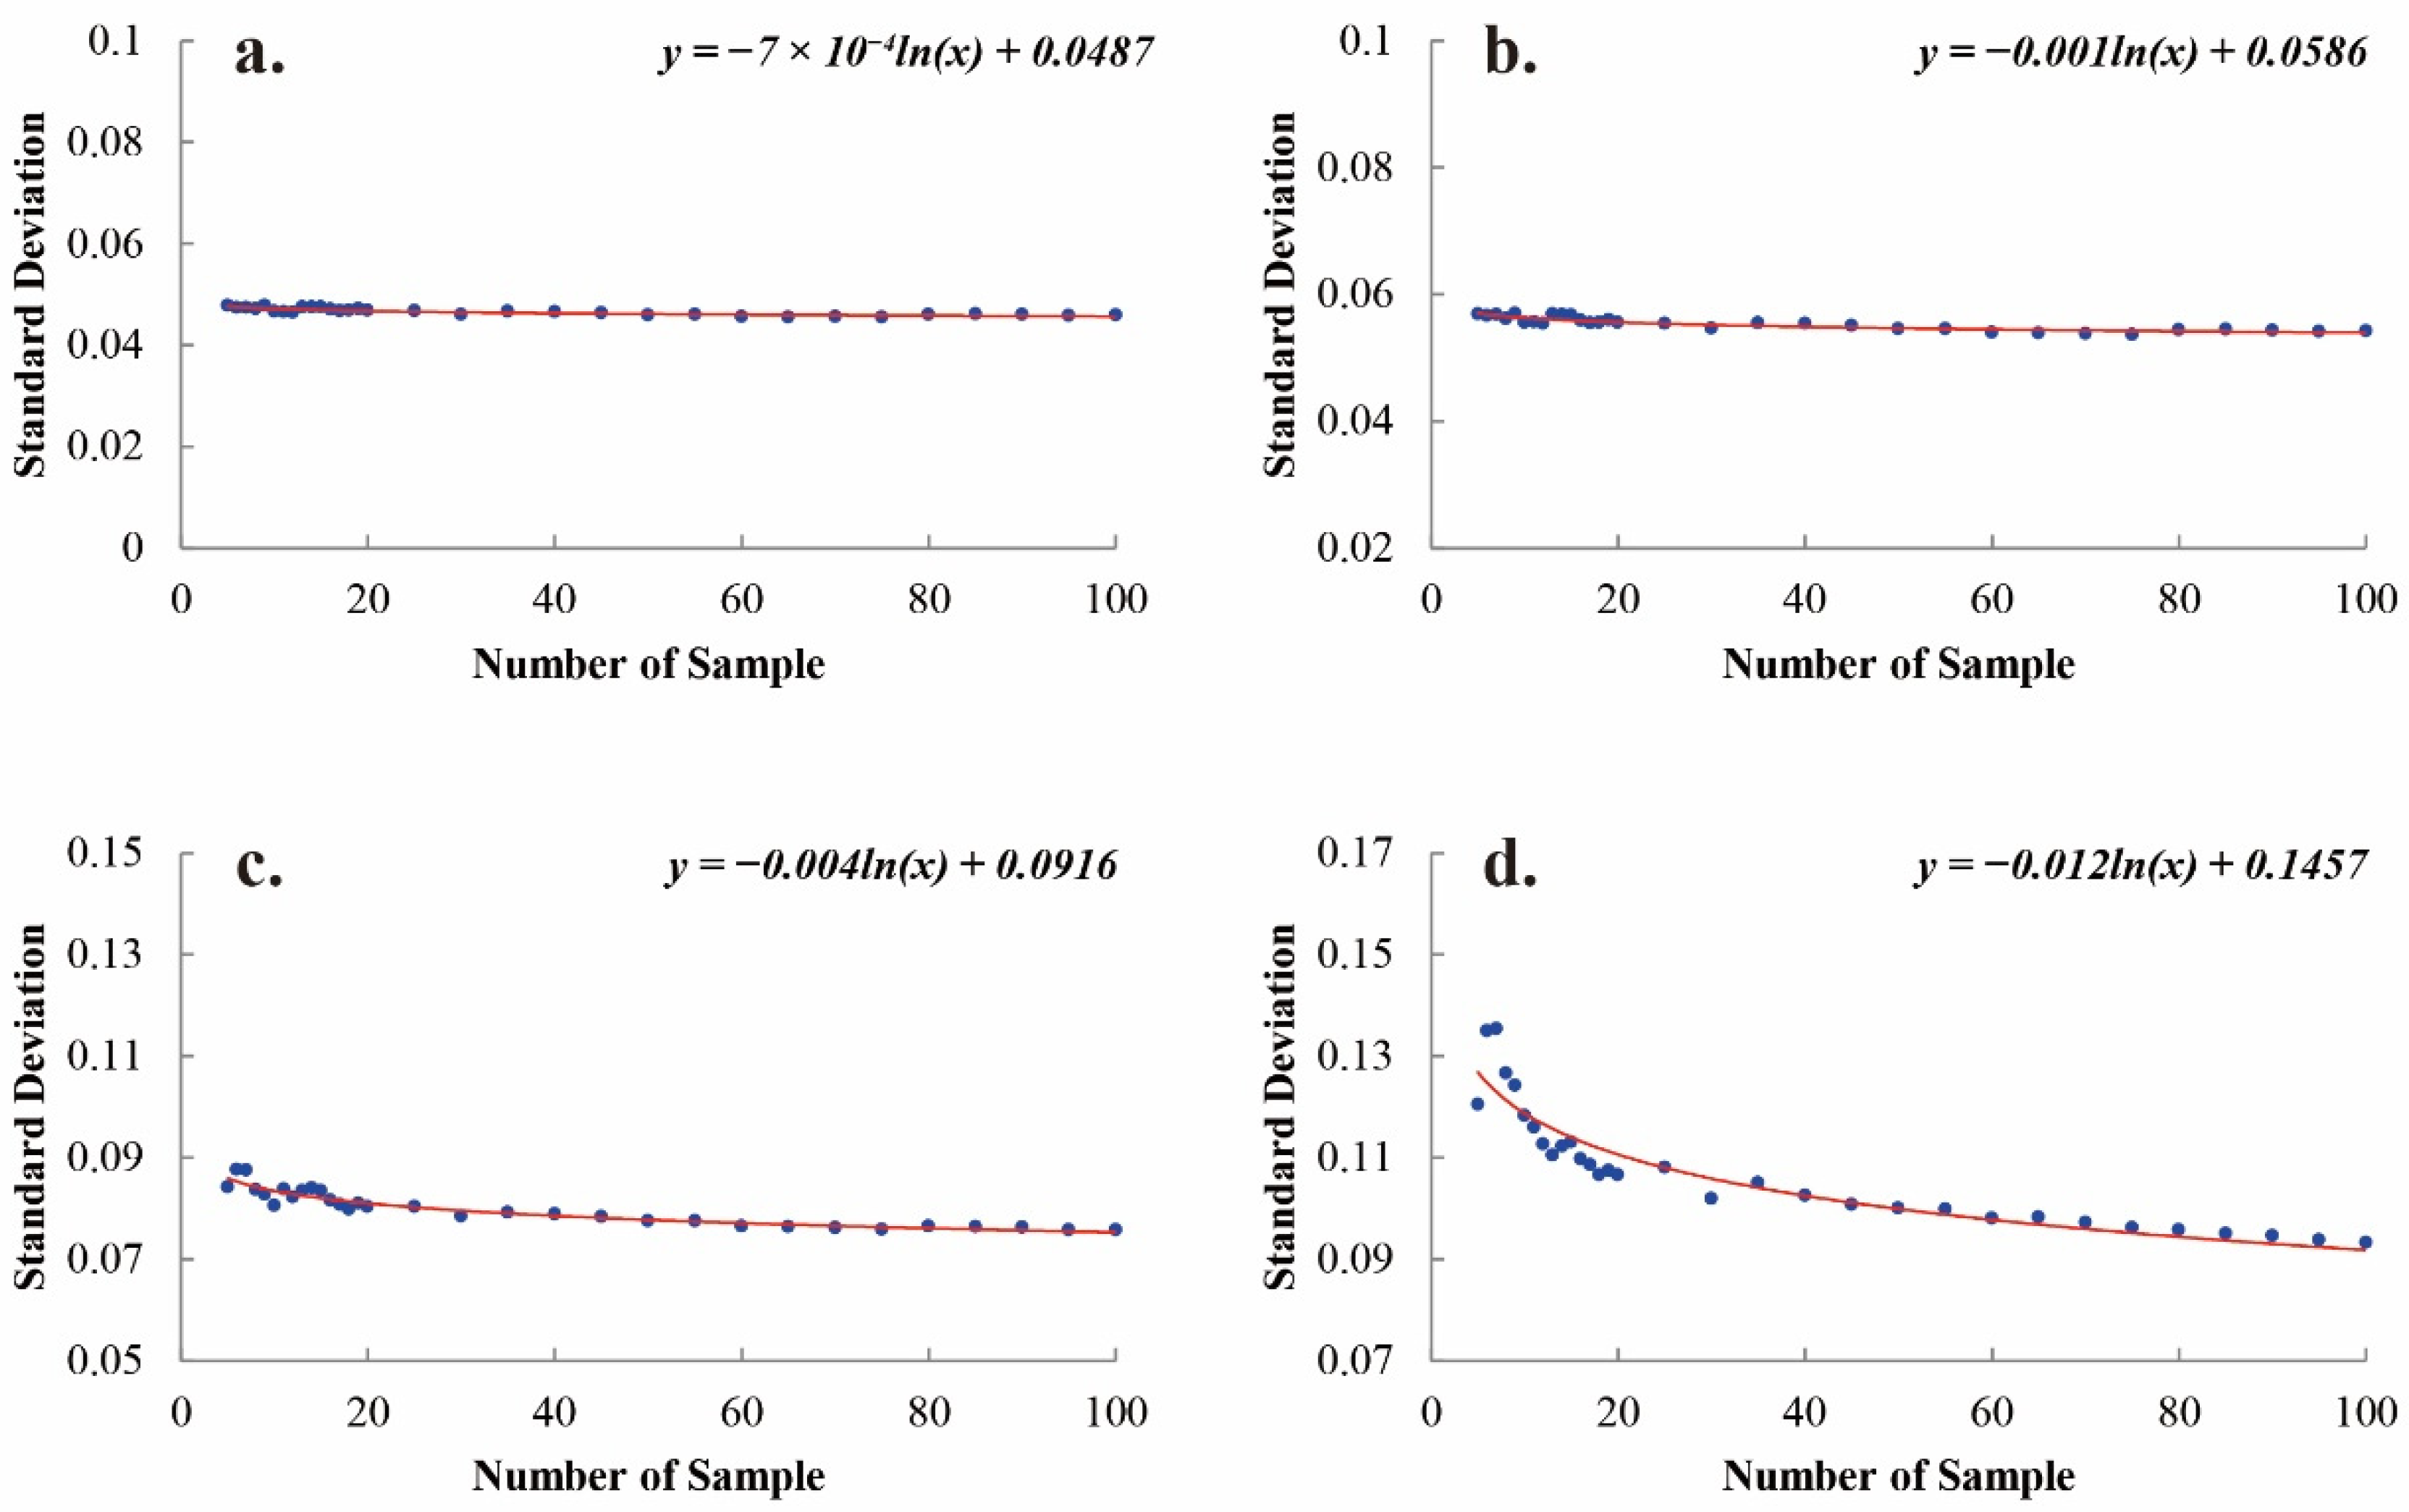
4.1. Preliminary Experiment with Random Samples

Using standard deviation as an indicator of uncertainty between results—the higher the standard deviation, the greater the uncertainty—100 sets of samples were selected at random and the sets were numbered from 1 to 100.
The results from these 100 simulations were divided into 32 groups. Because calculating the standard deviation requires a certain minimum sample size, the first group consisted of sets numbered 1 to 5, with a total of five simulations. The specific method of forming the groups is shown in Figure 10. We calculated the standard deviation for each of the 32 groups and thus ended up with 32 groups of standard deviations for every single grid.
For each group, the non-zero values were averaged (the zero values can be understood as blank areas), and the results are presented as a scatter plot (Figure 11). The size of the sample had little effect on the uncertainty of the results.
The standard deviations in each group were sorted in descending order and the average standard deviations in the top 10%, 5%, 1%, and 0.1% of each group were calculated to observe the variation among different sample group sizes (Figure 12).
From the average value of the standard deviations within the top 10%, 5%, 1%, and 0.1% of the groups into which the sampled had been divided, we found that although the sample size had little effect on the overall uncertainty, the number of sample groups influenced the degree of uncertainty in areas that showed huge fluctuations: when the sample was divided into more than 30 groups, the degree of uncertainty in the high-fluctuation areas decreased significantly. We therefore limited the number of groups to 30.

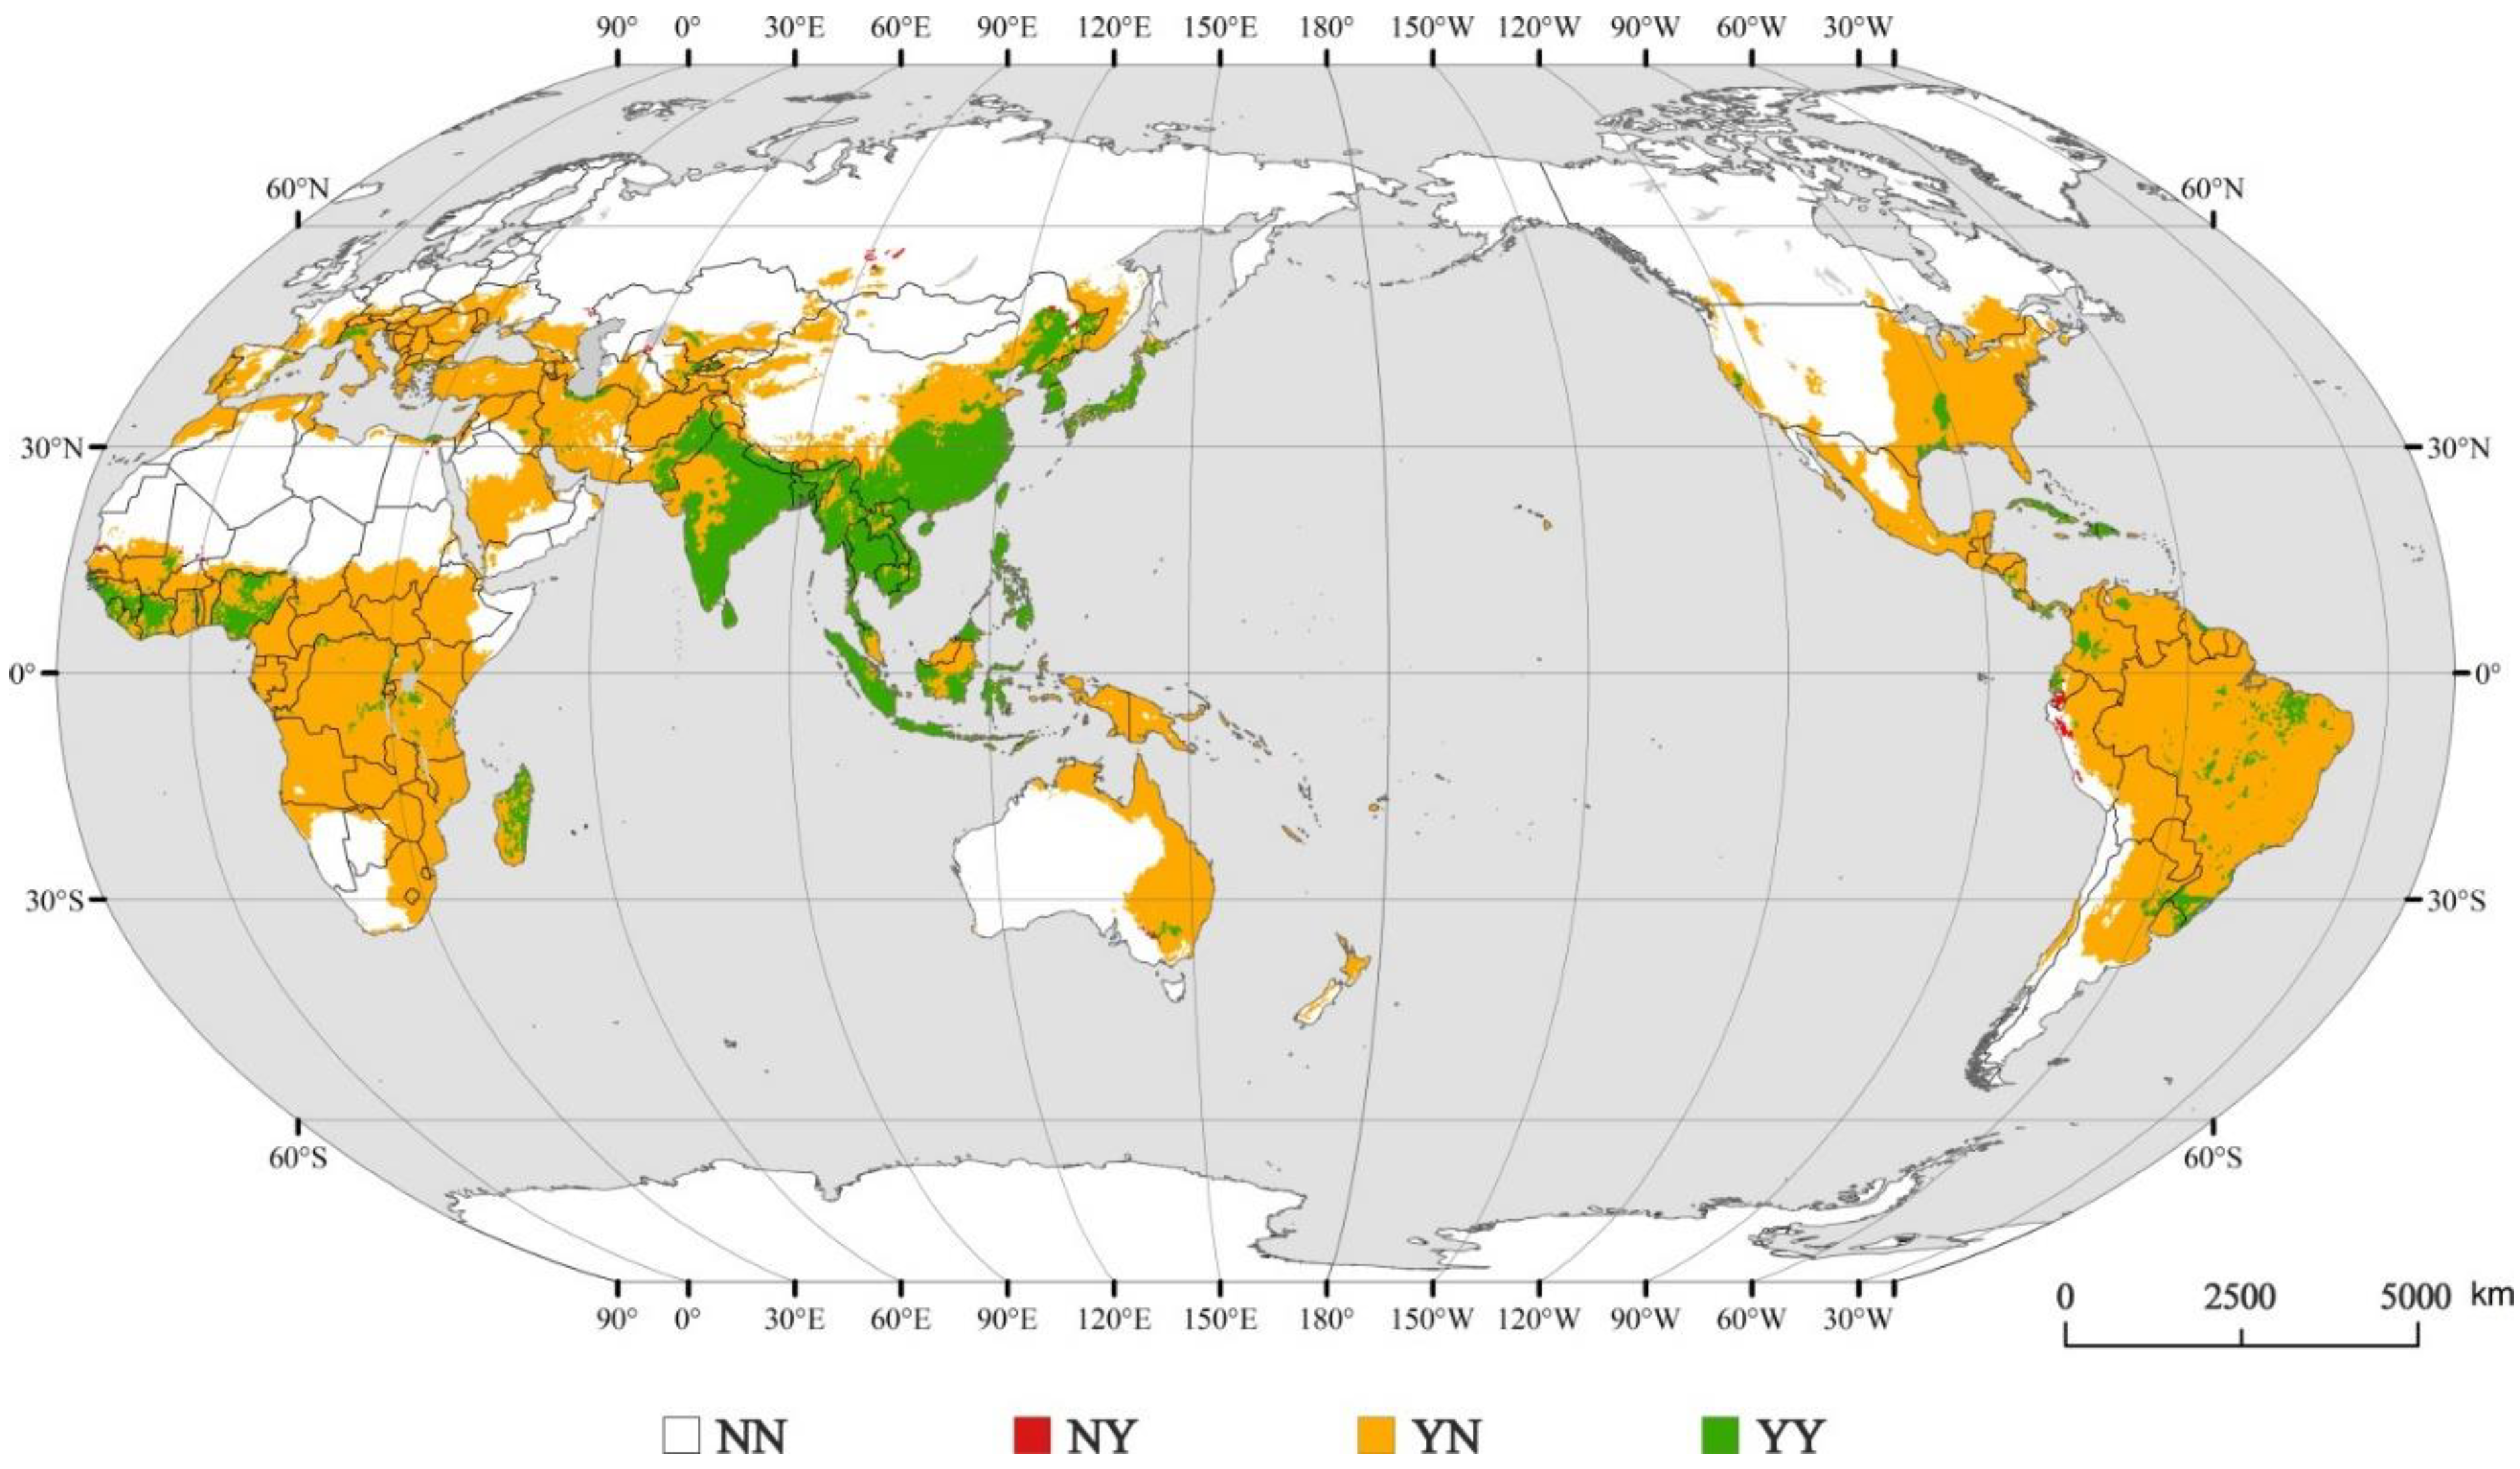
4.2. Verification from Multiple Sources

Liu et al. [6] used the MaxEnt model to identify areas suitable for rice in the past (1980–2010) and explored the characteristics of changes in the areas suitable for rice in China during that period. Comparing our results with those results, we found that although the present study does not highlight China’s Yangtze river basin as being particularly suitable, it does highlight the difference between northern and southern China in terms of their suitability for rice cultivation—a difference that matches the findings of Liu et al.
Wang et al. [4] used the MaxEnt model to select the variables: using MCDA, they obtained the potential distribution of rice under different scenarios and for different periods; on comparing our results with those by Wang et al., we noted the following differences.
(1)
The distribution of areas suitable for rice in rainforest regions is quite different: We found rainforest areas to be highly suitable whereas Wang and co-workers found those regions to be unsuitable for rice, because the researchers took into account land-use factors and excluded non-arable land from their results.
(2)
We found the Indian peninsula to be highly suitable in both the scenarios and in the short term as well as in the medium term whereas Wang and co-workers believe that the Indian peninsula will become unsuitable under some scenarios.
(3)
We found the mountainous areas in western United States to be unsuitable whereas Wang and co-workers found those areas to be not merely suitable but highly suitable. Moreover, the producer’s accuracy in the present study was higher than reported by Wang and co-workers.
Therefore, we believe that in the future the simulation method suggested in the present paper will supplement that of Wang and co-workers.

4.3. Limitation

In this paper, we focused on the impact of the environment variables on the potential distribution of rice. However, changes in socioeconomic variables, such as population and markets, which affect crop prices, demand, and planting willingness, and hence limit the area and distribution of crop cultivation [52,53,54], were marginally considered. Therefore, in order to make the predicted results more consistent with reality, a comprehensive multi-factor crop potential distribution prediction method is imperative.

5. Conclusions

(1)
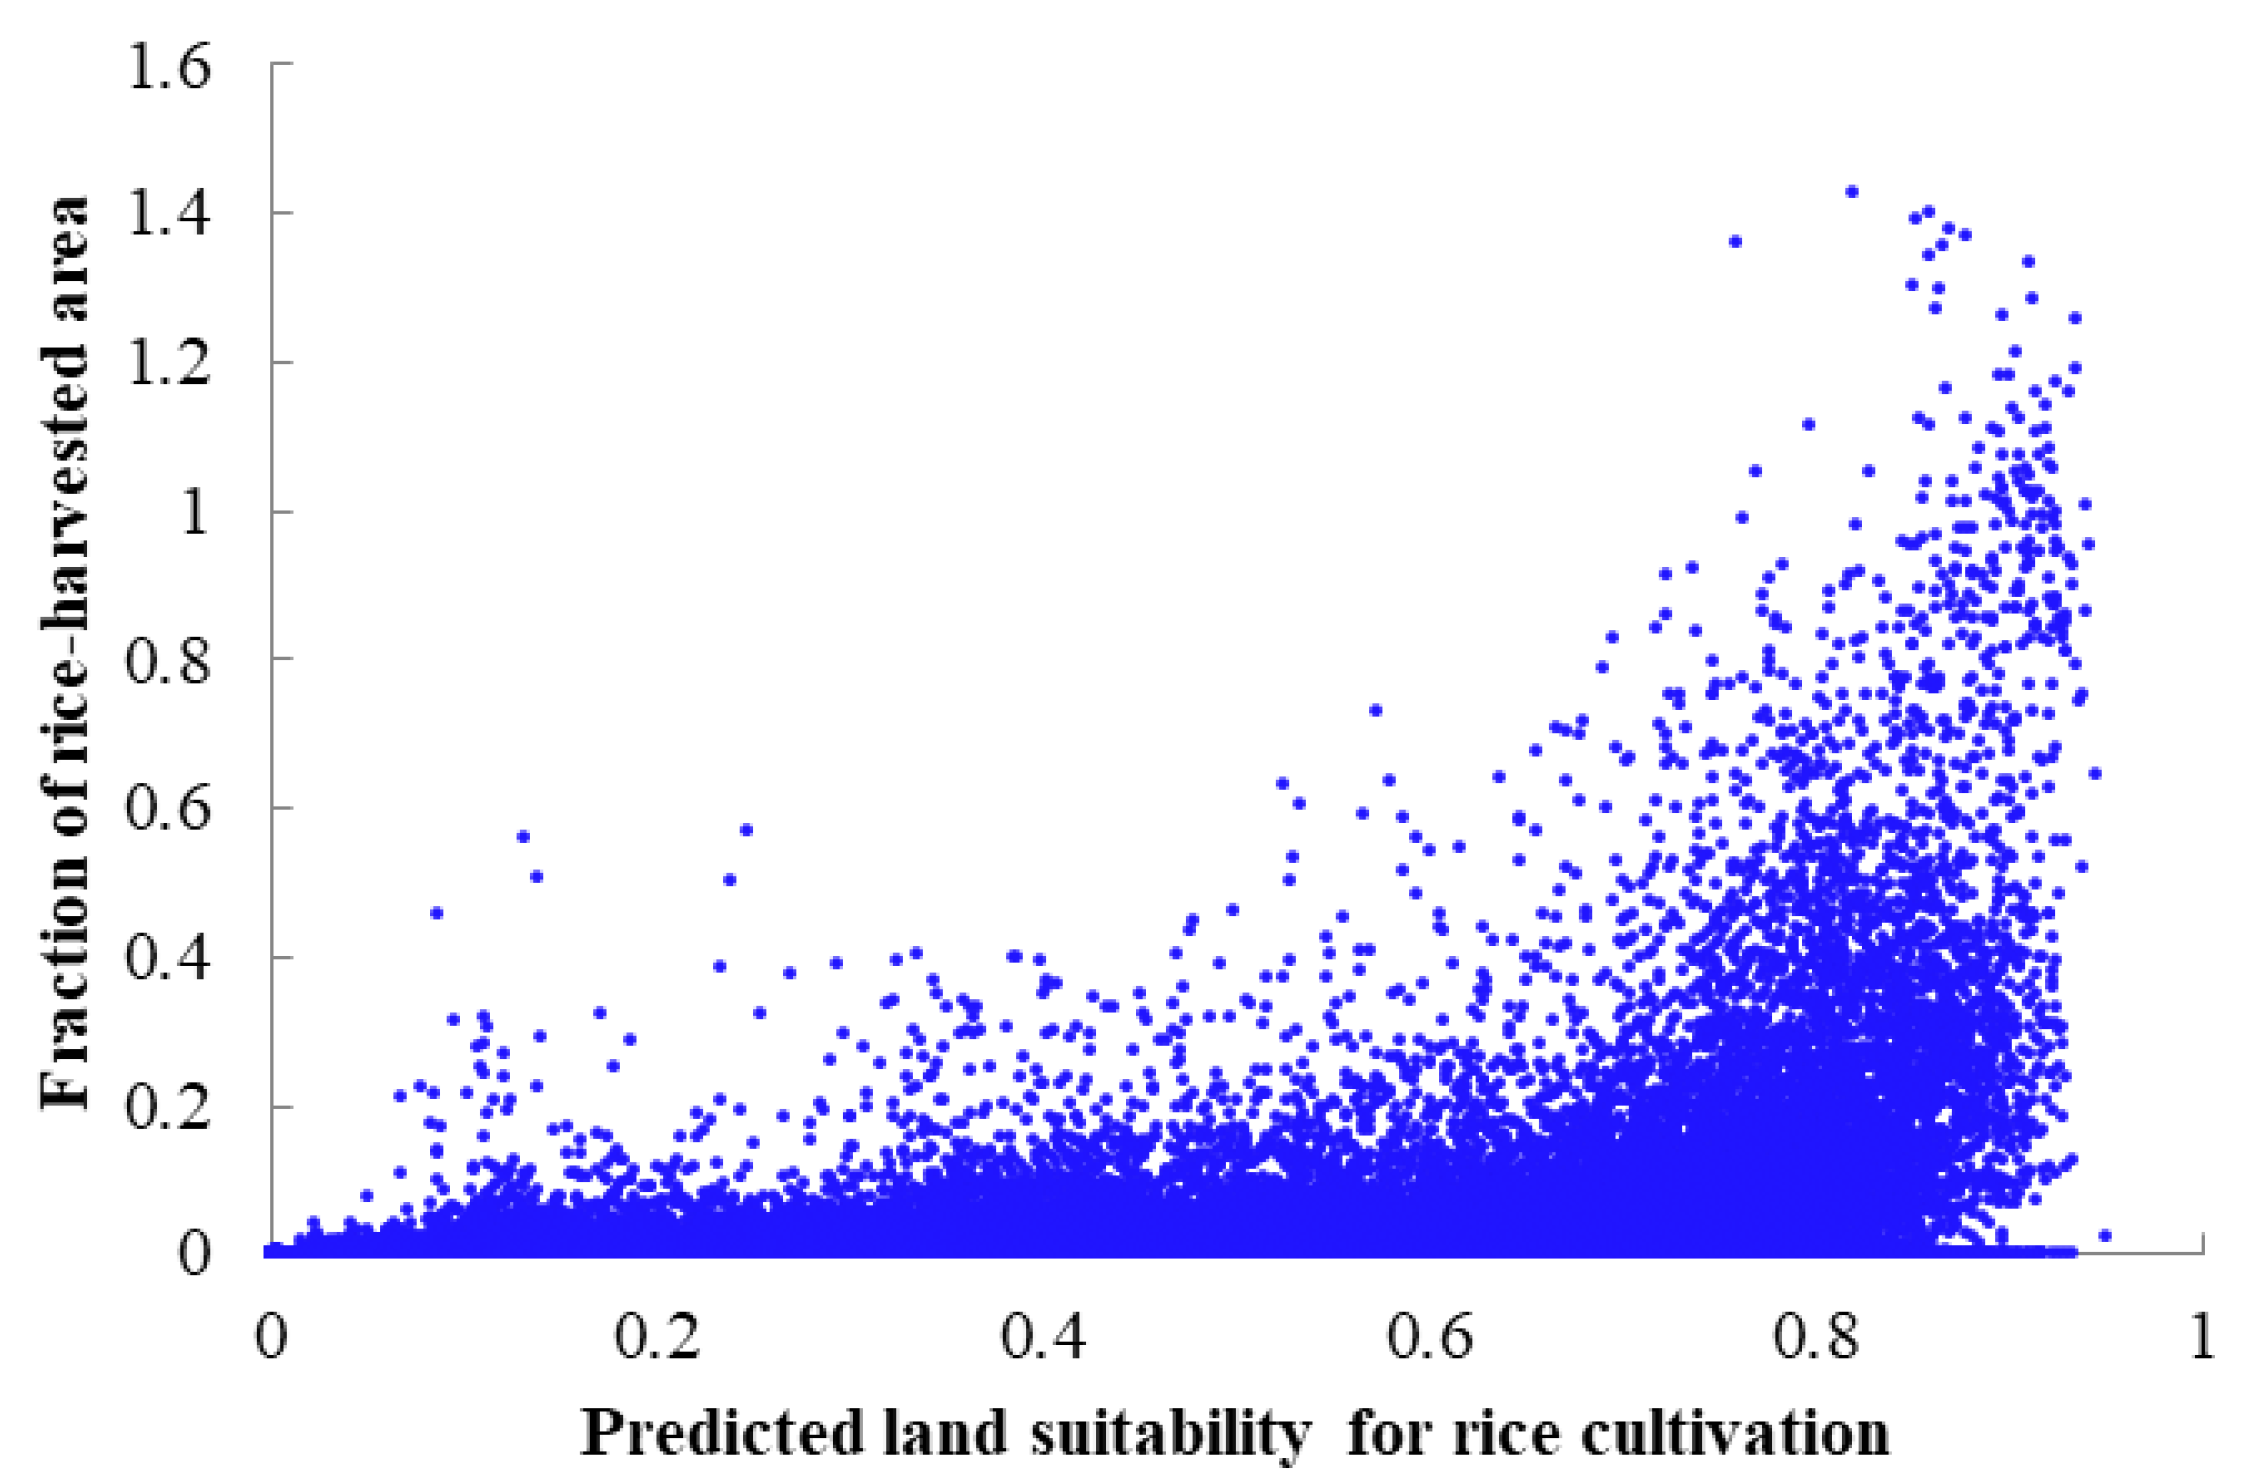
A set of multi-habitat variables and multi-sample point selection methods is proposed based on MaxEnt and other SDMs. To assess the accuracy of predictions, we compared them with past data using the AUC value and the scatter plot and found the predictions to be accurate and highly consistent with the past data. A clear positive correlation was noted between the distribution probability of areas suitable for rice as predicted and the ratio of area under rice to the total area of each grid in the past. These results confirm the usability and accuracy of the methods proposed in this paper.
(2)
Areas likely to be suitable for rice were estimated under two scenarios and in the short term and in the medium term.
  • Under both the climate-change scenarios, the main areas suitable for rice were concentrated in the tropics and the subtropics, accounting for 92% of the suitable area worldwide, and the largest proportion of highly suitable areas lay in the region from 10° N to 30° N, accounting for 77% of the total highly suitable area.
  • Under both the climate-change scenarios, Asia, South America, and Africa among the continents had the largest proportion (82%) of areas suitable for rice, and Asia accounted for the largest proportion (98%) of highly suitable areas.
  • Under both the climate-change scenarios, the distribution of rice cultivation in the world changed slightly, and the overall pattern was consistent with the past pattern.
(5)
Under both the climate-change scenarios, the areas suitable for rice increased in the tropics and in high-latitude regions and decreased in the mid-latitude regions including the subtropics. The areas decreased globally in the near term but increased in the medium term. The areas suitable for rice in high-latitude regions would increase significantly in the future, indicating that with the continuing impact of global warming, rice cultivation in the future would move towards higher latitudes.
In summary, according to the abovementioned changes, we have summarized two laws of future distribution and changes of rice: (1) The pattern of the distribution of suitable areas remains more or less unchanged under future scenarios; (2) the extent of suitable areas will decrease in the short term but increase in the medium term. This paper provides a set of multi-habitat variables and multi-sample point selection methods for SDMs. Based on that, the spatial distribution of global suitable area for rice under RCP scenarios is predicted, which is conducive to the research on rice disaster mitigation.
Further study should take more socioeconomic variables into considerations to improve the simulation accuracy of rice potential distributions (such as market supply and demand, farmers’ planting willingness, and residents’ eating habits).

Author Contributions

P.S. conducted the research, analyzed the data, and wrote the paper; A.Z. processed the data; R.W. did extensive updating of the manuscript; J.W. conceived the research and provided project support; Y.G. helped edit the paper; F.L. made suggestions to this paper. All authors have read and agreed to the published version of the manuscript.

Funding

This research was funded by the National Key Research and Development Program of China (Grant No. 2016YFA0602402) and the National Natural Science Foundation of China (Grant No. 41671501).

Institutional Review Board Statement

Not applicable.

Informed Consent Statement

Not applicable.

Data Availability Statement

Data sharing not applicable.

Conflicts of Interest

The authors declare no conflict of interest.

Appendix A

Figure A1. Proportion of areas suitable for rice, by grade, on each continent.
Sustainability 13 01580 g0a1
Figure A2. Total area suitable for rice, by grade, on each continent.
Sustainability 13 01580 g0a2
Figure A3. Proportion of areas suitable for rice at each latitude.
Sustainability 13 01580 g0a3
Figure A4. Total area suitable for rice at each latitude.
Sustainability 13 01580 g0a4

References

  1. Change, P.C. Global Warming of 1.5 °C; World Meteorological Organization: Geneva, Switzerland, 2018. [Google Scholar]
  2. Akinbile, C.; Akinlade, G.; Abolude, A. Trend analysis in climatic variables and impacts on rice yield in Nigeria. J. Water Clim. Chang. 2015, 6, 534–543. [Google Scholar] [CrossRef] [Green Version]
  3. Khush, G.S. Origin, dispersal, cultivation and variation of rice. Plant Mol. Biol. 1997, 35, 25–34. [Google Scholar] [CrossRef]
  4. Wang, R.; Jiang, Y.; Su, P.; Wang, J.A. Global Spatial Distributions of and Trends in Rice Exposure to High Temperature. Sustainability 2019, 11, 6271. [Google Scholar] [CrossRef] [Green Version]
  5. Fraser, S.A.; Wood, N.J.; Johnston, D.; Leonard, G.S.; Greening, P.D.; Rossetto, T. Variable population exposure and distributed travel speeds in least-cost tsunami evacuation modelling. Nat. Hazards Earth Syst. Sci. 2014, 14, 2975. [Google Scholar] [CrossRef] [Green Version]
  6. Liu, Z.; Yang, P.; Tang, H.; Wu, W.; Zhang, L.; Yu, Q.; Li, Z. Shifts in the extent and location of rice cropping areas match the climate change pattern in China during 1980–2010. Reg. Environ. Chang. 2015, 15, 919–929. [Google Scholar] [CrossRef]
  7. Mokarram, M.; Ghasemi, M.M.; Zarei, A.R. Evaluation of the soil fertility for corn production (Zea Mays) using the multiple-criteria decision analysis (MCDA). Model. Earth Syst. Environ. 2020, 6, 2251–2262. [Google Scholar] [CrossRef]
  8. Mendas, A.; Delali, A. Integration of MultiCriteria Decision Analysis in GIS to develop land suitability for agriculture: Application to durum wheat cultivation in the region of Mleta in Algeria. Comput. Electron. Agric. 2012, 83, 117–126. [Google Scholar] [CrossRef]
  9. Lane, A.; Jarvis, A. Changes in climate will modify the geography of crop suitability: Agricultural biodiversity can help with adaptation. SAT Ejornal 2007, 4, 1–11. [Google Scholar]
  10. Elith, J.; Leathwick, J.R. Species distribution models: Ecological explanation and prediction across space and time. Annu. Rev. Ecol. Evol. Syst. 2009, 40, 677–697. [Google Scholar]
  11. Guisan, A.; Thuiller, W. Predicting species distribution: Offering more than simple habitat models. Ecol. Lett. 2005, 8, 993–1009. [Google Scholar] [CrossRef]
  12. Araújo, M.B.; Cabeza, M.; Thuiller, W.; Hannah, L.; Williams, P.H. Would climate change drive species out of reserves? An assessment of existing reserve-selection methods. Glob. Chang. Biol. 2004, 10, 1618–1626. [Google Scholar] [CrossRef]
  13. Hao, T.; Arroita, G.G.; May, T.W.; Monfort, J.J.L.; Elith, J. Using species distribution models for Fungi. Fungal Biol. Rev. 2020, 34, 74–88. [Google Scholar] [CrossRef]
  14. Gardner, A.S.; Maclean, I.M.; Gaston, K.J. Climatic predictors of species distributions neglect biophysiologically meaningful variables. Divers. Distrib. 2019, 25, 1318–1333. [Google Scholar] [CrossRef] [Green Version]
  15. Runquist, R.D.B.; Lake, T.; Tiffin, P.; Moeller, D.A. Species distribution models throughout the invasion history of Palmer amaranth predict regions at risk of future invasion and reveal challenges with modeling rapidly shifting geographic ranges. Sci. Rep. 2019, 9, 2426. [Google Scholar] [CrossRef] [Green Version]
  16. Moudi, M.; Hosseinzadeh, M. Predicting the Potential Distribution of Jujube (Ziziphus jujuba Mill.) in Iran. ECOPERSIA 2019, 7, 195–201. [Google Scholar]
  17. Kogo, B.K.; Kumar, L.; Koech, R.; Kariyawasam, C.S. Modelling climate suitability for rainfed Maize cultivation in Kenya using a Maximum Entropy (MaxENT) approach. Agronomy 2019, 9, 727. [Google Scholar] [CrossRef] [Green Version]
  18. Thuiller, W.; Lavorel, S.; Araújo, M.B.; Sykes, M.T.; Prentice, I.C. Climate change threats to plant diversity in Europe. Proc. Natl. Acad. Sci. USA 2005, 102, 8245–8250. [Google Scholar] [CrossRef] [Green Version]
  19. Yi, Y.-j.; Cheng, X.; Yang, Z.-F.; Zhang, S.-H. Maxent modeling for predicting the potential distribution of endangered medicinal plant (H. riparia Lour) in Yunnan, China. Ecol. Eng. 2016, 92, 260–269. [Google Scholar] [CrossRef]
  20. Qin, A.; Liu, B.; Guo, Q.; Bussmann, R.W.; Ma, F.; Jian, Z.; Xu, G.; Pei, S. Maxent modeling for predicting impacts of climate change on the potential distribution of Thuja sutchuenensis Franch, an extremely endangered conifer from southwestern China. Glob. Ecol. Conserv. 2017, 10, 139–146. [Google Scholar] [CrossRef]
  21. Zhang, K.; Yao, L.; Meng, J.; Tao, J. Maxent modeling for predicting the potential geographical distribution of two peony species under climate change. Sci. Total Environ. 2018, 634, 1326–1334. [Google Scholar] [CrossRef]
  22. Remya, K.; Ramachandran, A.; Jayakumar, S. Predicting the current and future suitable habitat distribution of Myristica dactyloides Gaertn. using MaxEnt model in the Eastern Ghats, India. Ecol. Eng. 2015, 82, 184–188. [Google Scholar] [CrossRef]
  23. Khanum, R.; Mumtaz, A.; Kumar, S. Predicting impacts of climate change on medicinal asclepiads of Pakistan using Maxent modeling. Acta Oecol. 2013, 49, 23–31. [Google Scholar] [CrossRef]
  24. Phillips, S.J.; Anderson, R.P.; Schapire, R.E. Maximum entropy modeling of species geographic distributions. Ecol. Model. 2006, 190, 231–259. [Google Scholar] [CrossRef] [Green Version]
  25. Peterson, A.T.; Papeş, M.; Eaton, M. Transferability and model evaluation in ecological niche modeling: A comparison of GARP and Maxent. Ecography 2007, 30, 550–560. [Google Scholar] [CrossRef]
  26. Warren, D.L.; Seifert, S.N. Ecological niche modeling in Maxent: The importance of model complexity and the performance of model selection criteria. Ecol. Appl. 2011, 21, 335–342. [Google Scholar] [CrossRef] [Green Version]
  27. Kumar, P. Assessment of impact of climate change on Rhododendrons in Sikkim Himalayas using Maxent modelling: Limitations and challenges. Biodivers. Conserv. 2012, 21, 1251–1266. [Google Scholar] [CrossRef]
  28. Swant, S.S.; Kluza, D.A.; Cuddington, K.; Lyons, D.B. Potential distribution of emerald ash borer: What can we learn from ecological niche models using Maxent and GARP? For. Ecol. Manag. 2012, 281, 23–31. [Google Scholar] [CrossRef]
  29. Li, G.; Xu, G.; Guo, K.; Du, S. Mapping the global potential geographical distribution of black locust (Robinia pseudoacacia L.) using herbarium data and a maximum entropy model. Forests 2014, 5, 2773–2792. [Google Scholar] [CrossRef] [Green Version]
  30. Thapa, A.; Wu, R.; Hu, Y.; Nie, Y.; Singh, P.B.; Khatiwada, J.R.; Yan, L.; Gu, X.; Wei, F. Predicting the potential distribution of the endangered red panda across its entire range using MaxEnt modeling. Ecol. Evol. 2018, 8, 10542–10554. [Google Scholar] [CrossRef]
  31. Kumar, S.; Yee, W.L.; Neven, L.G. Mapping global potential risk of establishment of Rhagoletis pomonella (Diptera: Tephritidae) using MaxEnt and CLIMEX niche models. J. Econ. Entomol. 2016, 109, 2043–2053. [Google Scholar] [CrossRef]
  32. Ying, X.; Hai, X.C. Preliminary assessment of simulations of climate changes over China by CMIP5 multi-models. Atmos. Ocean. Sci. Lett. 2012, 5, 489–494. [Google Scholar] [CrossRef]
  33. Eyring, V.; Cox, P.M.; Flato, G.M.; Gleckler, P.J.; Abramowitz, G.; Caldwell, P.; Collins, W.D.; Gier, B.K.; Hall, A.D.; Hoffman, F.M. Taking climate model evaluation to the next level. Nat. Clim. Chang. 2019, 9, 102–110. [Google Scholar] [CrossRef] [Green Version]
  34. Kim, H.Y.; Ko, J.; Kang, S.; Tenhunen, J. Impacts of climate change on paddy rice yield in a temperate climate. Glob. Chang. Biol. 2013, 19, 548–562. [Google Scholar] [CrossRef] [PubMed]
  35. Stocker, T.F.; Qin, D.; Plattner, G.-K.; Tignor, M.; Allen, S.K.; Boschung, J.; Nauels, A.; Xia, Y.; Bex, V.; Midgley, P.M. Climate Change 2013. The Physical Science Basis. Working Group I Contribution to the Fifth Assessment Report of the Intergovernmental Panel on Climate Change-Abstract for Decision-Makers. In Changements Climatiques 2013. Les Elements Scientifiques. Contribution du Groupe de Travail I au Cinquieme Rapport D’evaluation du Groupe D’experts Intergouvernemental sur L’evolution du CLIMAT-Resume a L’intention des Decideurs; U.S. Department of Energy Office of Scientific and Technical Information: Oak Ridge, TN, USA, 2013. [Google Scholar]
  36. Fourcade, Y.; Engler, J.O.; Rödder, D.; Secondi, J. Mapping species distributions with MAXENT using a geographically biased sample of presence data: A performance assessment of methods for correcting sampling bias. PLoS ONE 2014, 9, e97122. [Google Scholar] [CrossRef] [PubMed] [Green Version]
  37. Phillips, S.J.; Dudík, M. Modeling of species distributions with Maxent: New extensions and a comprehensive evaluation. Ecography 2008, 31, 161–175. [Google Scholar] [CrossRef]
  38. Anderson, R.P.; Gonzalez, I., Jr. Species-specific tuning increases robustness to sampling bias in models of species distributions: An implementation with Maxent. Ecol. Model. 2011, 222, 2796–2811. [Google Scholar] [CrossRef]
  39. Manning, M.R. The treatment of uncertainties in the Fourth IPCC Assessment Report. Res. Adv. Clim. Chang. 2006, 2, 13. [Google Scholar]
  40. Lobell, D.B.; Sibley, A.; Monasterio, J.I.O. Extreme heat effects on wheat senescence in India. Nat. Clim. Chang. 2012, 2, 186–189. [Google Scholar] [CrossRef]
  41. Lobell, D.B.; Schlenker, W.; Roberts, J.C. Climate trends and global crop production since 1980. Science 2011, 333, 616–620. [Google Scholar] [CrossRef] [PubMed] [Green Version]
  42. Lobell, D.B.; Cassman, K.G.; Field, C.B. Crop yield gaps: Their importance, magnitudes, and causes. Annu. Rev. Environ. Resour. 2009, 34, 179–204. [Google Scholar] [CrossRef] [Green Version]
  43. Zeng, L.; Shannon, M.C. Salinity effects on seedling growth and yield components of rice. Crop Sci. 2000, 40, 996–1003. [Google Scholar] [CrossRef] [Green Version]
  44. Yoshida, S.; Parao, F. Climatic influence on yield and yield components of lowland rice in the tropics. Clim. Rice 1976, 20, 471–494. [Google Scholar]
  45. Wade, L.; Fukai, S.; Samson, B.; Ali, A.; Mazid, M. Rainfed lowland rice: Physical environment and cultivar requirements. Field Crops Res. 1999, 64, 3–12. [Google Scholar] [CrossRef]
  46. Kravchenko, A.N.; Bullock, D.G. Correlation of corn and soybean grain yield with topography and soil properties. Agron. J. 2000, 92, 75–83. [Google Scholar] [CrossRef]
  47. Yang, X.-Q.; Kushwaha, S.; Saran, S.; Xu, J.; Roy, P. Maxent modeling for predicting the potential distribution of medicinal plant, Justicia adhatoda L. in Lesser Himalayan foothills. Ecol. Eng. 2013, 51, 83–87. [Google Scholar] [CrossRef]
  48. Phillips, S.J. A brief tutorial on Maxent. AT T Res. 2005, 190, 231–259. [Google Scholar]
  49. Elith, J.; Phillips, S.J.; Hastie, T.; Dudík, M.; Chee, Y.E.; Yates, C.J. A statistical explanation of MaxEnt for ecologists. Divers. Distrib. 2011, 17, 43–57. [Google Scholar] [CrossRef]
  50. Elith, J.; Burgman, M. Predictions and their validation: Rare plants in the Central Highlands, Victoria, Australia. In Predicting Species Occurrences: Issues of Accuracy and Scale; Scott, J.M., Heglund, P.J., Morrison, M.L., Raphael, M.G., Wall, W.A., Samson, F.B., Eds.; Island Press: Covelo, CA, USA, 2002; pp. 303–314. [Google Scholar]
  51. Lobo, J.M.; Valverde, A.J.; Real, R. AUC: A misleading measure of the performance of predictive distribution models. Glob. Ecol. Biogeogr. 2008, 17, 145–151. [Google Scholar] [CrossRef]
  52. Fischer, G.; Shah, M.N.; Tubiello, F.; van Velhuizen, H. Socio-economic and climate change impacts on agriculture: An integrated assessment, 1990–2080. Philos. Trans. R. Soc. B Biol. Sci. 2005, 360, 2067–2083. [Google Scholar] [CrossRef]
  53. Yan, Y.; Zhao, J.; Deng, H.; Luo, Q. Predicting China’s cultivated land resources and supporting capacity in the twenty-first century. Int. J. Sustain. Dev. World Ecol. 2006, 13, 229–241. [Google Scholar] [CrossRef]
  54. Xiong, W.; Lin, E.; Xu, Y.; Ju, H.; Jiang, J.; Holman, I.; Li, Y. Future cereal production in China: The interaction of climate change, water availability and socio-economic scenarios. Glob. Environ. Chang. 2009, 19, 34–44. [Google Scholar] [CrossRef]
Figure 1. Research framework for the study.
Sustainability 13 01580 g001
Figure 2. Process of selecting samples. NS stands for number of samples; RCA stands for rice cultivation area.
Sustainability 13 01580 g002
Figure 3. Process of selecting variables.
Sustainability 13 01580 g003
Figure 4. Past distribution of land suitable for rice.
Sustainability 13 01580 g004
Figure 5. Spatial consistency between the areas predicted as suitable for rice cultivation and the past EARTHSTAT data on the areas from which rice was harvested. NN indicates that there is no potential rice distribution in the non-rice distribution area; NY indicates that there is potential rice distribution in the non-rice distribution area; YN indicates that there is no potential rice distribution in the rice distribution area; and YY indicates that there is potential rice distribution in the rice distribution area.
Sustainability 13 01580 g005
Figure 6. Correspondence between predictions and actual data with respect to areas suitable for rice cultivation.
Sustainability 13 01580 g006
Figure 7. Areas likely to be suitable for rice cultivation under two climate-change scenarios.
Sustainability 13 01580 g007
Figure 8. Potential distribution of areas suitable for rice in short term (2016–2035) and medium term (2046–2065) under two climate-change scenarios and past distribution.
Sustainability 13 01580 g008
Figure 9. Predicted and actual distribution of areas suitable for rice cultivation under two climate-change scenarios in short term (2016–2035) and medium term (2046–2065).
Sustainability 13 01580 g009
Figure 10. Method of forming groups based on standard deviation.
Sustainability 13 01580 g010
Figure 11. Standard deviation in groups of random samples.
Sustainability 13 01580 g011
Figure 12. Relationship between standard deviation and different groups from the sample; (a) Top 10% standard deviation; (b) top 5% standard deviation; (c) top 1% standard deviation; (d) top 0.1% standard deviation.
Sustainability 13 01580 g012
Table 1. Databases used in the study.
Data CategoryData NameTemporal ResolutionSpatial ResolutionSource
Environmental VariablesGlobal Digital Elevation Model Data20101 km × 1 kmUnited States Geological Survey (USGS)
https://topotools.cr.usgs.gov/gmted_viewer/
Global-Soil Parameter Data201230″ × 30″International Soil Reference and Information Centre (ISRIC)
http://www.isric.org
Climate Models Data1960 to 20990.25° × 0.25°https://cds.nccs.nasa.gov/nex-gddp/
Areas Currently under RiceFraction of Rice-harvested Area Data2000 or 20055′ × 5′(1) http://www.earthstat.org/harvested-area-yield-175-crops/
(2) http://mapspam.info/maps/
(3) http://www.uni-frankfurt.de/45218031/data_download
Table 2. Climate models used in the study.
Name of the Climate Model
ACCESS1-0GFDL-ESM2G *MPI-ESM-MR
CSIRO-MK3-6-0MIROC5CESM1-BGC
MIROC-ESMCanESM2IPSL-CM5A-LR *
BCC-CSM1-1GFDL-ESM2MMRI-CGCM3
GFDL-CM3MPI-ESM-LRCNRM-CM5
MIROC-ESM-CHEM *CCSM4IPSL-CM5A-MR
BNU-ESMINMCM4NorESM1-M *
* Wind speed used only these four models to calculate the changes between periods.
Table 3. Number of samples in each group of grids.
Proportion of Rice Cultivation Area (%)<1010–3333–66≥66Total
Number of grids62,8423717105436067,973
Rice-growing areas (kha)34,63447,59533,50622,327138,062
Number of samples5597685413602228
Table 4. Selected variables as input for the MaxEnt model.
Variables CategoryData NameVariablesContent
Climatic VariableNASA Earth Exchange Global Daily Downscaled Projections (NEX-GDDP)BIO1Annual Mean Temperature
BIO2Mean Diurnal Range
BIO3Isothermality (BIO2/BIO7) (* 100)
BIO5Max Temperature of Warmest Month
BIO8Mean Temperature of Wettest Quarter
BIO12Annual Precipitation
BIO18Precipitation of Warmest Quarter
WorldClim 2.0 variablesrdsSolar radiation
windWind speed
Soil VariableWISE derived soil properties (V1.2)CECSCation exchange capacity
CFRAGCoarse fragments % (>2 mm)
CNrtC/N ratio
GYPSGypsum content
ORGCOrganic carbon content
TAWCVolumetric water content (−33 to −1500 kPa, cm m−1)
TEBTotal exchangeable bases
Topographic VariableUnited States Geological Survey (USGS)DEM
(Digital Elevation Model)
Global Digital Elevation Model GMTED2010
Table 5. Accuracy of predictions made by the model of areas suitable for rice cultivation.
EarthstatMircaSpam_haSpam_phAverage
NN61.18%61.03%61.19%61.19%61.2%
NY31.63%31.22%32.09%32.42%31.8%
YN0.14%0.28%0.13%0.13%0.2%
YY7.05%7.46%6.59%6.26%6.8%
Producer’s accuracy98.1%96.3%98.1%98.0%97.6%
User’s accuracy18.2%19.3%17.0%16.2%17.7%
Overall accuracy68.2%68.5%67.8%67.5%68.0%
Publisher’s Note: MDPI stays neutral with regard to jurisdictional claims in published maps and institutional affiliations.

