
Designed to Be Noticed: A Reconceptualization of Carbon Food Labels as Warning Labels


School of Business Administration, Universidad Pontificia Comillas, 28015 Madrid, Spain
*
Author to whom correspondence should be addressed.
Sustainability 2021, 13(3), 1581; https://0-doi-org.brum.beds.ac.uk/10.3390/su13031581
Submission received: 23 November 2020
/
Revised: 28 January 2021
/
Accepted: 29 January 2021
/
Published: 2 February 2021
Abstract
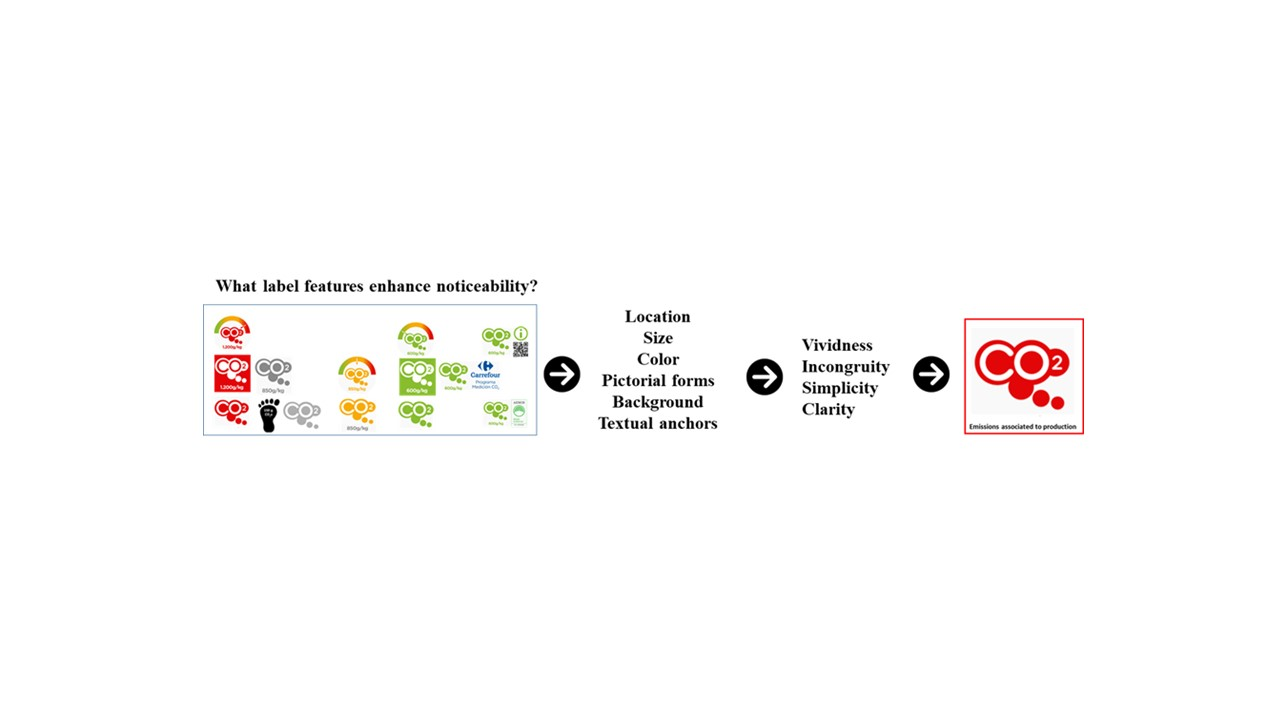
:Carbon labels are considered a fundamental tool for reducing emissions associated with grocery products. Although the prior literature has shown that both limited motivation and understanding of carbon labels explain the effectiveness of carbon labels, knowledge regarding how to improve the label design to increase noticeability is limited. Given the limited motivation of mainstream consumers to use carbon labels, this exploratory paper proposes that the label design should trigger bottom-up (or sensory-driven) attention mechanisms. Using grounded theory for the data collection and analysis of six focus groups, this study tests six features (i.e., location, size, color, icons, a colored background or border, and textual anchors) and identifies four design criteria (i.e., vividness, incongruity, simplicity, and clarity) that may increase label noticeability. The main conclusion of this qualitative study is that carbon labels are noticed when they are perceived as a cue of hazard. Based on this finding, we propose that carbon labels could be designed as warning labels; therefore, the insights already proven in the warning label literature should be applied to carbon label design to increase its noticeability and use.

1. Introduction
Most Europeans view climate change as the most important issue worldwide [1]. Policymakers have proposed urgent measures to reduce global greenhouse gases (GHGs) [2], which, according to Statista, reached a record level in 2019. In particular, the food industry is crucial in the transition to a low-carbon society since it accounts for 21% to 37% of global emissions [2]. Both producers and consumers need to assume responsibility to decarbonize this industry; the impact of food lifestyle choices can help limit global warming to the set goal of 1.5 degrees [3]. However, it is apparent that consumers are not shifting their food purchases to low-carbon products. The achievement of climate goals requires a greater awareness of low-carbon alternatives and greater motivation for food lifestyle changes [4].
To address these problems, the European Commission’s strategy [1] proposes investing in feasible technological solutions and aligning the actions of businesses, research, and civil societies. In the food-purchasing context, carbon labels are one such solution, i.e., a fundamental means of shifting consumer demand to low-carbon goods [5]. However, carbon labels have not been very effective in fulfilling this purpose [6,7] mainly due to the following two types of barriers: cognitive and motivational barriers. First, past studies have shown that consumers have difficulties understanding carbon labels [8,9,10]. Second, consumers are not motivated to use carbon labels because they do not perceive a clear benefit for themselves [10,11,12] or the environment [7,8,10]. In contrast to other sustainability labels, carbon labels do not provide information regarding private benefits for consumers [13]. For example, purchasing appliances with an energy efficiency label may provide financial savings for the consumer [14,15]. Similarly, consumers do not recognize any benefit for the environment in purchasing carbon food labels mainly because they erroneously believe that the food industry is low in emissions [10,16].
If consumers are not motivated then they are less likely to pay attention to carbon labels. This limited attention is aggravated by the context of grocery shopping, which is highly influenced by inertia, price consciousness, information overload, among others [13,17,18,19]. Moreover, grocery shopping is strongly guided by hard-coded (and difficult to change) heuristics [19,20].
Nevertheless, these cognitive and motivational barriers could be overcome by improving the design of carbon labels [11]. Most studies concerning carbon label design focused on improving the understanding of labels. Three design criteria have been found to be essential for this purpose. First, carbon labels must provide a frame of reference. Neutral labels [21] depicting the figure of emissions along with a pictorial symbol (such as those used in Australia, France, Japan, Thailand, the UK, and the US) [5] do not meet this criterion; the emissions score is difficult to decipher because consumers do not have a clear reference for what constitutes high or low emissions. Second, carbon labels must provide procedural knowledge [11], which is defined as comparability between products with regard to climate sustainability. While neutral labels provide declarative knowledge (the number of emissions), consumers do not know how to interpret such labels based on this (noncomparative) information [10,22]. Third, the labels must be simple as follows: the labels must provide sufficient information to be understandable while avoiding information overload [13,23]. This requirement represents a balance that is certainly difficult achieve despite the use of icons and colors [21]. Traffic-light or color-coded labels meet these three criteria and are, therefore, considered an optimal design for understanding labels. Indeed, color-coded labels have been systematically found to be preferred over neutral carbon labels [6,7,10,11,12,19,22]. For example, Spaargaren et al. [20] found that a color-coded label (but not a neutral label) shifted demand to lower-CO2 lunches in a university canteen, albeit the effect was small.
In contrast to these efforts to improve the label design to enhance understanding [12], the importance of designs aiming to enhance awareness or noticeability has been overlooked. To the best of our knowledge, only Brunner et al. [6] has addressed this issue; drawing from past work [24], these authors suggested that red-labelled products could attract more attention because individuals pay more frequent and sustained attention to negative information. Examining attention-grabbing designs is necessary as label awareness is a precondition for label use [25]. Therefore, attention-grabbing designs can increase the probability of label use [26]. According to information-processing theories, when motivation is limited, as it is the case for mainstream consumers regarding sustainability issues, bottom-up mechanisms (sensory-driven) work better than top-down (cognition-driven) mechanisms [27]. Thus, labels should be designed in a way that trigger bottom-up visual attention processes, i.e., those acting upon color, shape, size, and other features [27]. Given that climate concern is not a primary goal for mainstream consumers, we need to unveil which meanings or frames attached to carbon labels would trigger attention and the label design features that may uphold these frames.
This study aims to explore design features of labels that could increase the noticeability of carbon labels for consumers. Drawing from the literature concerning carbon and sustainable labels, as well as using a grounded theory approach, this paper unveils the potential relevance of some attention-grabbing features of label design based on participants’ perceptions and meanings attached to these different features. The insights of this paper are valuable to offer recommendations regarding the characteristics of carbon label designs that could better enhance label awareness to guide policymakers and producers’ decisions and to help in the planning of future quantitative studies in the field.
This paper contributes to the existing literature in two ways. First, this paper proposes to reconceptualize carbon labels as warning labels [28] since the findings suggest that carbon labels can be interpreted by (most) consumers as an alert regarding the health risks associated with emissions. Such a reconceptualization could be extended to other sustainability labels emphasizing risks rather than benefits. By understanding carbon labels as warning labels, the insights found in the warning labels literature can be applied to increase the noticeability of such labels. Second, this study underpins the relevance of some characteristics of carbon label designs other than traffic-color coding [29] that could enhance label noticeability for mainstream consumers having limited concerns about sustainability issues. Moreover, based on the findings, a new taxonomy of sustainable labels that differentiates between value-based labels (e.g., organic or fair-trade labels) and warning labels (e.g., carbon labels) is proposed.
2. Materials and Methods
2.1. Design and Data Collection
A grounded theory [30] approach was used as the aim of this research is to understand participants’ perceptions and meanings attached to different label features designs rather than to quantify or generalize the effect of these features on attitudes or intention to use by a (statistically) representative population. Indeed, a similar approach has been used in other studies investigating sustainable labels [17,18,31]. Furthermore, qualitative approaches have been widely used to study user/experience-centered designs [32,33,34]. In such research contexts, focus groups are particularly recommended [18].
This exploratory research was conducted during the months of February and March 2018 in Madrid, Spain. This is an appropriate context because, similarly to consumers in other European countries (e.g., France or the UK), Spanish consumers show moderate levels of concern regarding environmental issues [1] and Spain’s food industry does not use carbon labels or schemes. Combining the principles of similarity and dissimilarity, 54 participants representing mainstream food consumers were assigned to six focus groups according to their age and level of education. Based on the aim of this study, we purposively recruited mainstream consumers with moderate to low motivation regarding climate change [25]. In each group, variability was sought by including participants of different genders as well as different eco-social sensibilities (in each focus group, at least two of the participants collaborated with a non-government organization (NGO)). A demographic description of the participants is shown in Table 1. The participants were recruited with the aid of an external market research firm and were paid 30 euros for their participation.
Even though the intervention in the discussion was intended to be as spontaneous as possible, occasionally those less extroverted or active participants were encouraged to intervene to ensure that all interviewees participated throughout the different parts of the session.
The duration of each focus group was approximately 90 min. All focus groups were conducted on the university premises and moderated by the authors. After obtaining the participants’ written consent, the focus groups were recorded and transcribed.
2.2. Instruments Used for the Data Collection
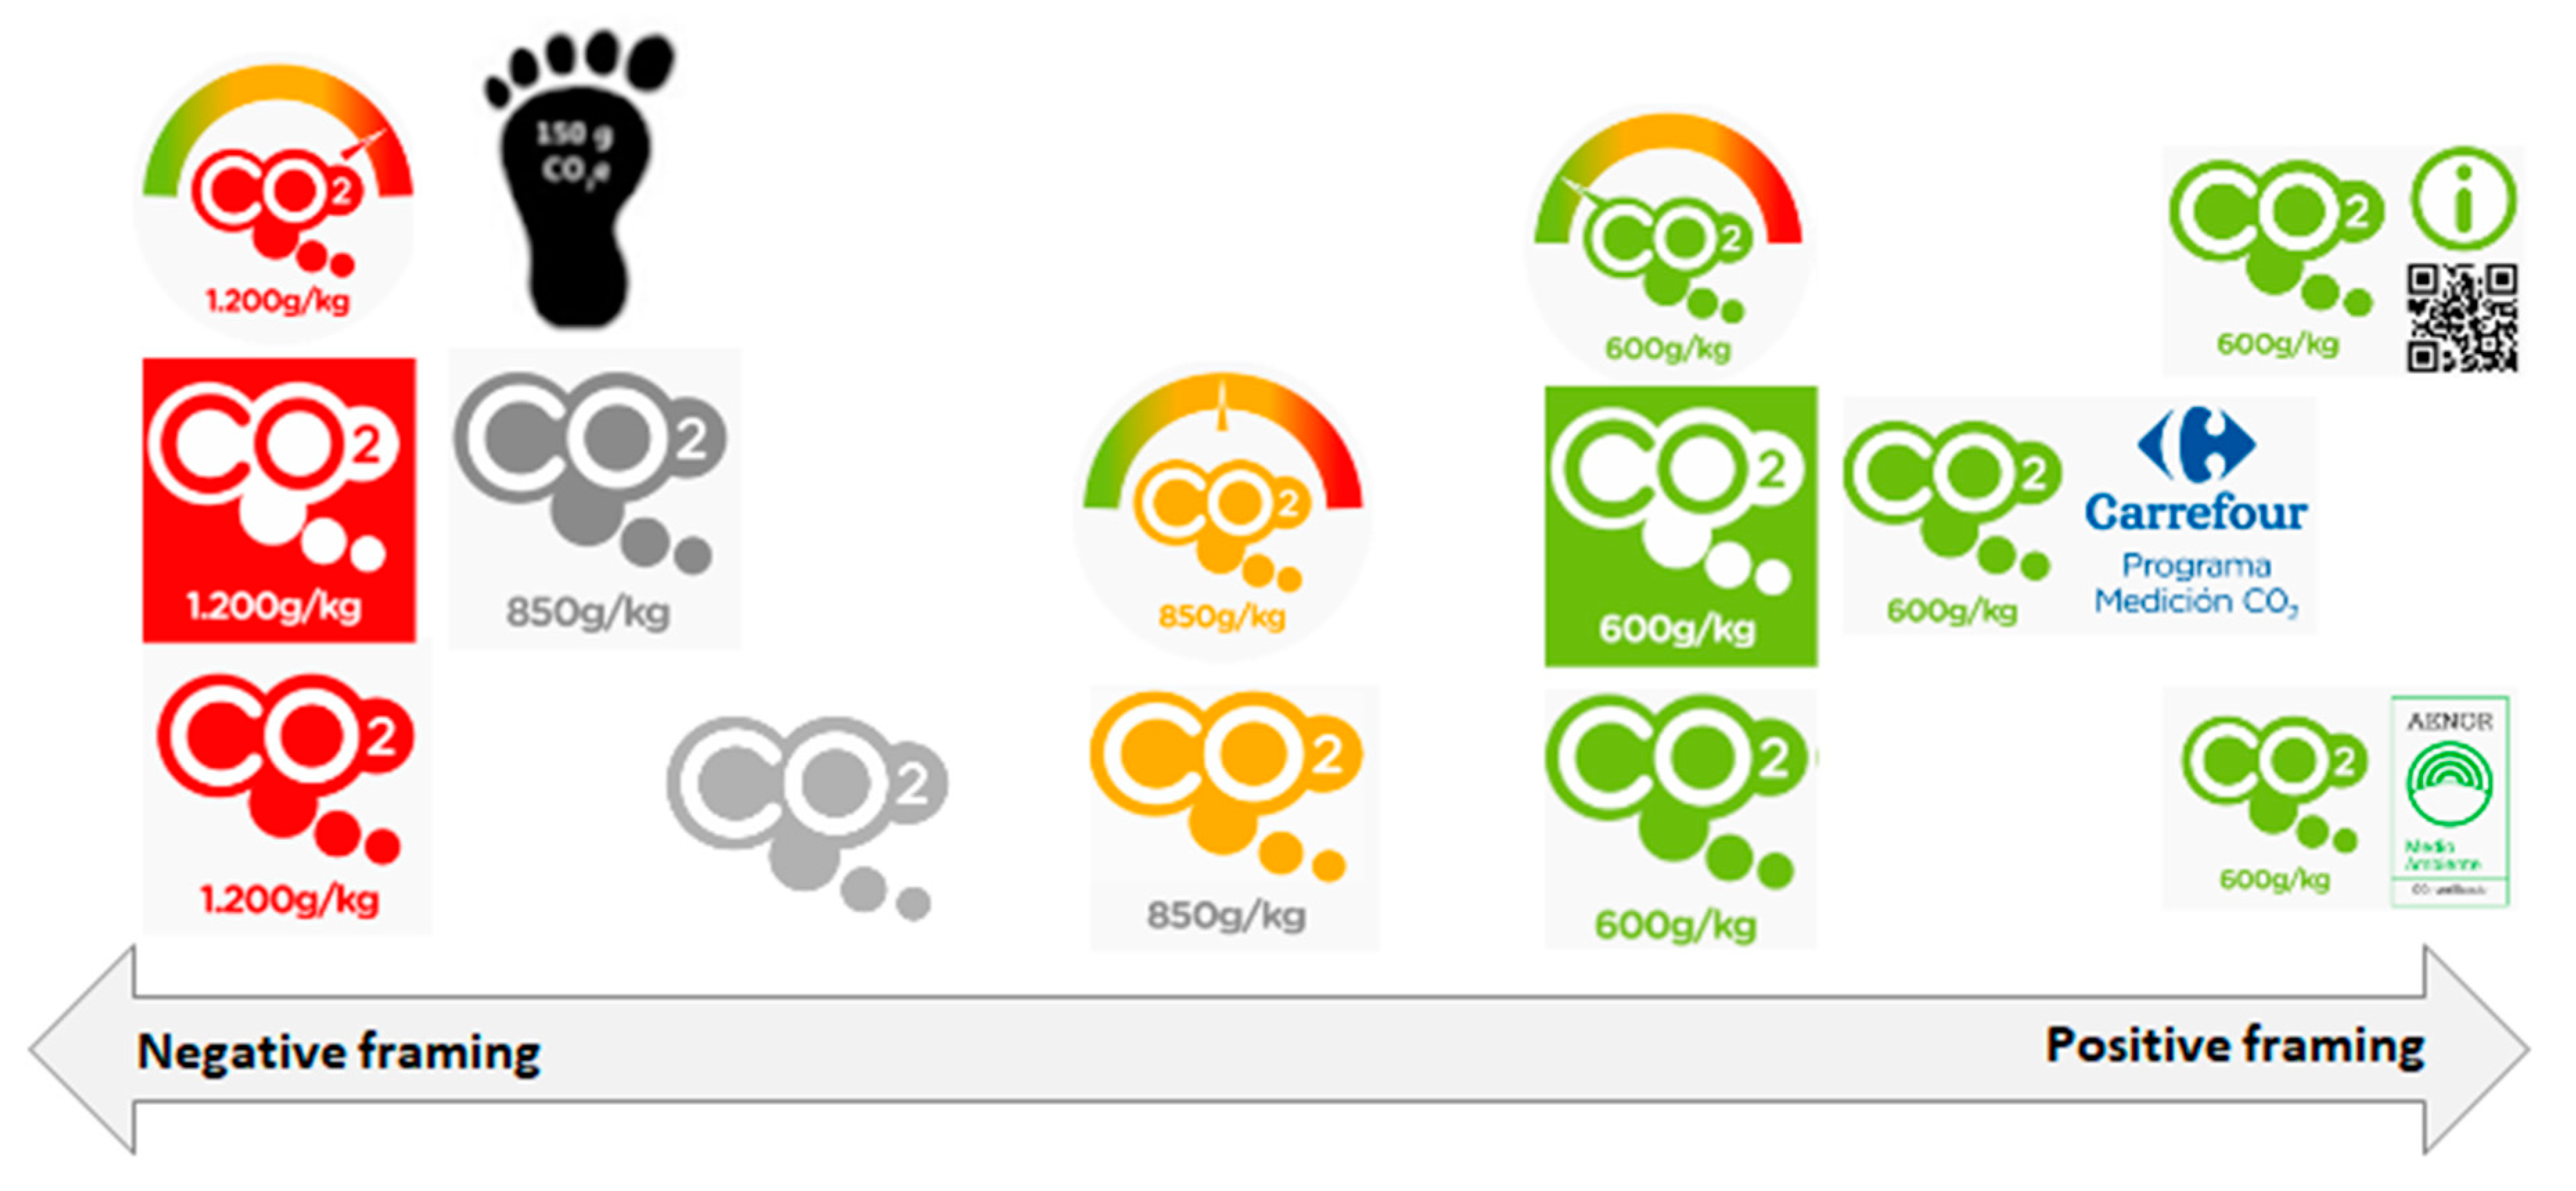
Different label designs were used as prompts for the discussion. Although the labels were purposefully designed for this study, their features are based on past inventories of carbon labels [5,21]. Altogether, these designs provided a comprehensive pool as different design features were represented (i.e., different types of colors, backgrounds, and shapes; icon and textual anchors, inter alia). The neutral label depicted the icon of a cloud instead of the footprint icon because in Spain, environmental problems are mostly related to air quality [35], and consumers are not familiar with the concept of a carbon “footprint”.
The conversation was structured in five parts. First, the participants were encouraged to describe their shopping habits for grocery products. Second, the participants were asked to describe their habits of reading labels and other on-packaging information. Third, the participants were shown a neutral carbon label and prompted to discuss the noticeability and meanings attributed to the label (Figure 1). To obtain more genuine answers and minimize social desirability bias, the neutral carbon label was presented to the interviewees before discussing environmental issues [36]. Fourth, the problems of climate change and emissions were raised, and the participants were encouraged to discuss the influence of these issues on their shopping habits. Finally, the participants were shown other designs of carbon labels features (see below); then, the discussion was oriented towards understanding the perceptions and meanings attached to each feature (see interview guide in Appendix A).
2.3. Data Analysis
The grounded theory three-step analytical procedure was followed [30]. First, the transcripts were coded to obtain the initial categories. Then, the properties of these categories were identified to understand their attention-grabbing role. For illustration, after identifying color as a key label feature, the analysis focused on understanding the participants’ perception of each color and the meanings attached to them Afterwards, the identified categories and properties were collapsed into a single core category as we realized that all features shared the following common characteristic: warning of a hazard. During the analysis, the literature concerning sustainable and warning label design was searched and reviewed to help refine the categories and to better understand the attention-grabbing process triggered by the label features [30].
3. Results
We first present the findings regarding the contextual factors surrounding grocery purchasing as they seem to affect the noticeability of product information and, more particularly, carbon emissions information. Then, we show that carbon emissions tend to be interpreted by participants as a health hazard, and this perception underpins label attention-grabbing. Finally, we unveil the features design of a carbon label that seem to contribute to increasing the perception of hazard and, thus, can trigger bottom-up awareness.
3.1. Context of Grocery Shopping
Grocery purchasing normally implies buying a significant number of goods in a limited amount of time [22], which is a process that demands managing information overload as food products display vast data [37]. When asked about habitual grocery shopping, most of our respondents seemed to be mainly guided by an “efficiency mindset”. Purchasing is understood as a routine process during which our respondents mostly buy “the same brand bought the last time” because the name of the brand is used as a heuristic to simplify decision making. In this context, the level of packaging consultation conducted by our informants (specially by the young ones) was very low [38]. This situation was illustrated by the following comment provided by a participant in FG2: “Well, I think you waste time also looking at those things... that is, people tend to go shopping as fast as they can, then you do not look at them”. Her statement shows that for some consumers, consulting the information on packaging adds minimal (or no) value; their main purchasing criterion was speed because their goal was to finish their grocery shopping as fast as possible. Within these time constraints, price and quality (a fluid term defined differently by the participants) were evaluated.
Additionally, our informants consulted the nutritional value of the product (as previously mentioned by [13,19,37,39]; more specifically, they intended to avoid unhealthy ingredients, such as chemicals or sugar, as illustrated in the following quotes:
It’s like when there’s... I do not know... you’re going to grab some pastries and you see “salt”. I do not take it (FG4).Sulphites... if that says sulphites, I will run away because I know they are bad. But yes, I am very interested in the ingredients (FG6).
Overall, and as expected, our participants’ food-shopping was limitedly guided by environmental issues. Although they acknowledged the existence of environmental problems, it was not reflected in greener food-shopping habits as noted by other studies [36]. Indeed, none of the respondents spontaneously mentioned environmental concerns as a major purchase selection criterion. In contrast, habits, price, availability, and nutritional attributes were the main factors guiding their purchase decisions. However, the analysis shows that some of the informants considered environmental aspects in their purchases as long as these directly or indirectly affected their health, which, as mentioned above, was among the most important purchase criteria. One participant stated the following:
I’m concerned about the planet... Yes, of course, but my primary concern is myself. Take pastries and cookies, for instance, [the content] of sugar is the first thing I check. Obviously, my health and my family’s and other people’s health are more important for me than the planet (FG6).
Furthermore, our findings confirm a lack of understanding of the issue covered by carbon labels [10,16] as they did not understand how food emissions are generated. Participants attributed carbon emissions to heavy industries, transportation, or energy, but not to the food sector. Their limited understanding compromises their motivation because prior knowledge of the problem is necessary for understanding the main benefit of carbon labels [13]. The following quote illustrates the participants’ confusion:
I do not fully understand it... what does this refer to?... Is that product better for the environment? Or in the manufacturing process... That the factory is non-polluting. It does not pollute. Or that it buys emission rights (FG4).
Therefore, because participants did not understand the impact of the food industry on climate change, they were not willing to change their food-related habits or consider the information in labels related to the ecological impact of food when buying groceries.
3.2. Perception of Risk
When the neutral CO2 label was shown to the participants, some of them misinterpreted the label as depicting “contamination”. Consistent with their self-centered concerns, the label was considered a cue that the product could be hazardous to their health rather than harmful to the environment. This misinterpretation stems from the consumers interpreting the CO2 icon as indicative of an attribute of the product or even an “ingredient” that could be harmful or pernicious to their health if ingested. The following quotes illustrate this confusion:
That it contains more CO2 or less of whatever (FG3).That maybe it has some kind of gas or something that is not good for your health (FG5).
Some respondents even proposed a “CO2-free” label to identify products with no “hazardous ingredients” without realizing that it was not possible to produce any products with zero emissions. The respondents’ demand for an emission-free label provides further evidence that most consumers do not understand the manufacturing processes of the food industry and their connection to carbon emissions. Mistakenly, the study participants understood the label as conveying information regarding pollution in the product rather than the emissions of the product as expressed in the following statements: “But let’s see, I do not think they would offer a contaminated product (FG5)”; “This is going to have a lot of preservatives” (FG3); and “It means it has been contaminated” (FG5). As a result of this framing, the consumers considered the product dangerous to their health and a product that should be avoided (“It means that you are buying a bomb” (FG4)).
A possible explanation for the association between the carbon label and health might be the participants’ frame of reference created by other eco-labels that already exist in the market that use a health frame to achieve their market positioning. For example, the organic label is the most popular environmental label for groceries [40]. Although this label only certifies whether the production processes follow certain rules with respect to the environment, numerous studies have corroborated that consumers perceive organic-labelled products as being better for their health [41,42,43]. The association between organic and healthiness is so well established that in Spain, for instance, it is by far the main reason for purchasing those products, whereas only 5% of consumers buying organic products mention environmental concerns as their main reason [44].
Although not entirely correct, consumers’ interpretation of the carbon label as a cue of health hazard increases their perception of risk. Consequently, the label attracted their attention because it conveys the idea of “danger” (FG4), which is not a message often found in a supermarket, much less in the food section. To better express his feelings regarding the ultimate perceived meaning of the label, one informant even interpreted the pictogram shown to the participants (“CO2” and cloud) as “skull and crossbones”, as follows:
This is a bit strange [...] why? [....] Because we’re not used to seeing a skull with an X saying “hey, this is poison”. They do not even put it in the rat poison! (FG6).
This interpretation seemed to increase the perception of hazard, which, in turn, increased respondents’ noticeability of the label since it activated important health-related goals. The following quote exemplified this effect; when this participant believed that the label referred to packaging, she was not motivated enough to consider it in a hypothetical purchase decision. In contrast, when she thought that the label referred to the product, she felt more motivated to use the label as a guiding criterion for her purchase.
If it refers to the food, yes, of course! I would try the green label regardless of the brand... But, if the CO2 refers to the packaging, I would honestly not care and would buy a red-labelled product (FG2).
An increased perception of hazards has been found to be a motivating factor in other domains [45]. In this study, by perceiving the label as a pollution cue, the emission score became a functional attribute; thus, what is usually depicted as another-centered beneficial attribute becomes a self-centered beneficial attribute, representing an important motivation for label use [11,12,19]. Indeed, this association with an internal benefit (healthiness) is a main driver of organic purchases [46,47].
3.3. Features that Enhance Consumers’ Label Noticeability and Their Perception of Risk
Based on the literature review, six features of labels were discussed among participants: location, size, color, pictorial forms or icons, background/border, and textual anchors. In this section, we present, for each feature, the design that seemed to enhance label noticeability in a supermarket context since they appeared to be relevant to activate or increase the perceived hazard.
The location of any label affects its noticeability. However, the preferred location for the label was not unanimous. On the one hand, location on the front of a package could attract more attention, as our respondents seldom consulted back-of-package information. As one participant acknowledged, “If you want it to be seen, put it in front where you can see it. Everything goes hidden on the back [shakes her head]…” (FG6). On the other hand, other participants suggested, as previously reported in the literature [48], that placing the label next to the expiration date or in the nutritional table would be best, as those were perceived to be the most-consulted pieces of information. Placing the label next to nutritional information could better activate consumers’ health-related goals and reinforce their interpretation of the carbon label as a cue of health hazard.
The size of the label was also a driver of noticeability. The informants reported that information on packaging is usually too small to attract their attention. Given the pace at which consumers choose products from store shelves, labels must be of sufficient size to be noted and read comfortably, especially by those with any form of visual impairment. Moreover, a reduced size may impinge on the understanding and credibility of the label because for participants a small label is interpreted as a lack of transparency on the part of the brand communicating the potential risk as the danger is barely noticeable.
Color is another feature that could enhance the noticeability of carbon labels along with the perception of risk. Our participants suggested that using incongruent and vivid colors seldom found on packaging, such as grey/black and red, would increase label noticeability [49,50,51]. However, respondents’ inferences regarding grey/black and red colors differed. First, the red color triggered univocal meanings, whereas they made distinct inferences regarding grey/black; some informants suggested that grey/black conveyed positive information (e.g., “it does not pollute”, “to me, natural and without artificial ingredients”, “respectful of the environment” or “care, environment”), whereas other inferred negative attributes (e.g., “pollution”, “smoke that comes from factories”, and “something artificial and harmful”). Therefore, the grey/black color became an ambiguous cue that could trigger positive or negative associations. This inconsistency could jeopardize the label’s effectiveness in increasing noticeability because it does not unambiguously communicate the idea of “hazard” and, therefore, does not raise univocal feelings of urgency and harm. Cues associated with negative information have a greater impact on the decision-making process, especially when decisions are made under time constraints or low motivation [24], as is the case in grocery purchasing, because negative framing has been proven to be more diagnostic, especially when there is uncertainty regarding the meaning of the label [13]. The color red was more uniformly interpreted as representative of danger; when presented with a red label, the participants spontaneously interpreted its meanings as “excess”, “noxious”,”, “stop”, and “watch out”, as follows:
Respondent: [Discussing the grey/black label] That does not pollute the environment because it is also grey. For me, this means that it does not pollute.Moderator: So, how would you communicate that it is associated with pollution?Respondent: Well, with a red color (FG6).
Then, in addition to being more univocally decoded, the red color seemed to increase the perception of hazard. When the red label was shown to the participants attributed risk-related meanings, such as “danger, danger” (FG6); “it contains more CO2 … so, I see a red label, and I would say “away from me” (FG3); “this is infected” (FG5); “this is going to have a lot of preservatives” (FG3); “it means that it has been contaminated somewhere” (FG5); and “it has more contamination” (FG2). These insights support Brunner et al.’s assertion (2018) that red-labelled products could attract more attention and be more effective in enhancing the noticeability of the label. Moreover, the red color increased the perception of health hazards associated with the product, as the following quote illustrates:
To me, there would be products that would hit me from the start if I see that they are marked as red... then, I’d say “Oh my gosh, what am I eating...?” [...] I see it more as a precautionary measure. That is, red means careful, that takes more CO2. Danger, yes, that is what I would think (FG3).
Similar to colors, pictorial forms can influence the noticeability and perception of risk. The “CO2” and cloud icon attract attention because they are novel stimuli not previously used in the grocery context. Their incongruity also increased the label’s noticeability as the participants attempted to make sense of these symbols (“It is rarely seen in food packaging… it would attract my attention. I would say ‘what is this’?” FG3). This finding is important because a greater elaboration of the message by the consumer has been associated with greater recall [52]. Despite the incongruity, the participants associated these icons with pollution (“It also suggests to me that something is related to pollution because of the cloud and CO2” FG2). However, unless the icon was accompanied by colored or textual anchors, the informants acknowledged being uncertain of whether the icon conveys positive or negative information (e.g., “Does it mean that it is environmentally friendly?”, FG2).
The respondents also noted that the label would be more noticeable on a colored background. Consistent with past research [45], they stated that adding a background to the label could help it stand out from the packaging and, consequently, become “more visible” (FG3). Additionally, adding a border to the label could increase its noticeability without compromising readability. According to the participants, a rectangular or circular border not only would help them delimit the pictogram (“CO2” and the cloud icon) and differentiate the label from the rest of the package but also allowed them to decode the label as a certification, which increased its credibility.
Finally, the use of textual anchors could play a twofold role by (1) increasing the perception of hazard and, therefore, working as an attention-grabber, and (2) facilitating the search and comprehension of the meaning of the label. However, the textual anchor should not compromise simplicity, which our participants confirmed to be a desired feature of labels. This apparent trade-off between comprehensibility and simplicity has previously been noted [19]. A clear and simple design prevents information overload and, according to the participants, is more easily noticed and understood. As one participant said, “The more you put on a label, the worse it is... if you put so many things, so much information... it [the package] ends up cluttered” (FG1).
More importantly, in addition to simplicity, the textual anchor could prevent their misinterpretation of the label while also maintaining the perception of hazard. As shown above, consumers’ perception of hazard is a consequence of their interpretation of the carbon label as an indicator of pollution in the product rather than of the product. Obviously, this interpretation is not entirely correct despite the indirect relationship between emissions and health-related issues [53]. To bridge the motivation gap, our data suggests that any text that reinforces the connection between CO2 and health issues would be effective. Yet, of course, the information provided by the label should not be misleading [13].
4. Discussion
This research shows that label design can help overcome some of the cognitive and motivational barriers to the use of carbon labels for mainstream consumers in grocery shopping. We unveiled the features design that could enhance carbon label noticeability and increase consumers’ motivation to use, as the label becomes a cue of the benefits for themselves. In particular, this study shows that, to be noticed, carbon label design could activate health-related goals and associate carbon labels with a health hazard. Based on the interpretation of carbon labels as cues of a hazard, we propose to reconceptualize carbon labels as warning labels, as previously suggested in other studies [13,54]. We provide evidence supporting this recommendation. The design features acknowledged by our informants to stimulate bottom-up attention are essentially those already shown to trigger bottom-up attention processes in warning labels [28,52]. In particular, our results show that location (in front or close to nutritional information), size (large), color (grey/black or red), icons associated with pollution by consumers (e.g., cloud or the CO2 icon), a colored background or a border, and textual anchors play special roles in enhancing the noticeability of the label; similar features have been found to drive attention towards warning labels [28,52]. Similarly, the four principles of carbon label design emerging from the findings (vividness, incongruity, simplicity, and clarity) have already been found to augment the noticeability of warning labels [45,49,51,52,55,56].
Our findings also help establish a taxonomy of environmental labels. Past scholars have treated all sustainable labels as belonging to the same set [36,57] or established typologies based on the certification process and awarder [58]. However, our research shows that environmental labels could be divided into two types depending on how they are intended to be used by consumers. Some labels follow an appetitive logic as they communicate/signal an attribute on the basis of which the product is expected to be chosen. In contrast, other labels follow an avoidance logic as they communicate/signal an attribute on the basis of which the product should be avoided/not chosen. We call the first type “value-based labels” and the second type “warning labels”. A value-based label is “a label that carries explicit value-laden messages relating to a product’s process and quality” [59] such that the labelled product is presented as superior to non-labelled goods. Thus, value-based labels encourage consumers to choose the product [60]. For example, organic, fair trade and vegan labels are value-based labels because the sustainability-related attribute is communicated in a way that attracts demand to the labelled product.
In contrast, warning labels are “conspicuous information vehicles that are attached to a product, designed as part of the packaging, or included in instruction manuals or promotional material that address the hazards associated with the use of the product” [28]. Although warning labels have usually been associated with hazards directly affecting the safety of the individual (e.g., tobacco, alcohol, and sugar), the notion of hazard could be extended to include social and environmental hazards (e.g., chemical components) [13]. In particular, carbon labels are conceptually similar to moderation/cessation warning labels informing consumers of the environmental and societal risks associated with the consumption of a product to shift demand away from the product [28].
Nonetheless, as a recent meta-analysis of warning-label studies [28] showed the design features of the label have a moderate effect on attention, but this effect diminishes as we progress along the stages of comprehension, recall, judgement, and behavior. This result implies that the cues proposed to be included in label design may indeed attract the attention of consumers, but they will not be sufficient to educate consumers into the emissions generated by food and/or ensure behavior change.
To influence decision-making, the cited meta-analysis showed the role of the following two contextual factors that have a moderate-to-large effect on behavior [28]: pre-activation promotional campaigns and social cues. Pre-activation promotional campaigns are communication campaigns related to the issue that are carried out off-package. These campaigns activate the message in the consumer’s mind before the purchase and greatly facilitate the effectiveness of the label. Therefore, the introduction of carbon labels in the supermarket should be preceded (and accompanied) by awareness-raising and educational campaigns so that consumers can understand the emissions associated with the production, transportation and commercialization of food and use labels as cues of this environmental hazard. The use of social cues in this domain remains unexamined, and future studies should determine whether the inclusion of social cues on- and off-package may increase the effectiveness of carbon labels.
The following third factor is not discussed in the case of warning labels but is nevertheless of fundamental importance in the context of carbon labels, i.e., institutional factors. It is apparent that the carbon footprint certification should not be a voluntary scheme. It is unlikely that a manufacturer will voluntarily decide to label their products with a label communicating a hazard [13]. Indeed, warning labels are usually compulsory, whereas carbon labels are not. Thus, our findings reinforce the calls for mandatory carbon labelling schemes in the food industry [61] to achieve the decarbonization objectives set by the European Union.
It should be noted that the research presented in this paper adopted a qualitative approach, both in terms of the type of data and the analysis of the data. As such, it did not seek to reflect the experiences of a (statistically) representative group of consumers. Instead, it aimed to explore the attention-grabbing features of label design as well as participants’ perceptions and meanings attached to these different features. However, our results show a certain degree of variability, especially in certain features (e.g., color or location). Future research could adopt a quantitative approach to test the influence of each feature design in label use in a comprehensive sample of consumers, capturing differences in environmental motivations and demographics. For this purpose, simulated shopping experiments would be most appropriate to isolate the influence of label design on consumer demand in close to real market conditions. Finally, given the context of the study, we propose future research directions. Considering that the context of this study is Spain, which is a country with moderate levels of environmental concerns, our label proposal could be extended to similar countries, such as Italy, the UK, and Portugal. Furthermore, future research could focus on examining whether and to what extent a label designed based on the results of this study may influence the sequential stages leading to label use (awareness, understanding, and credibility). In particular, future studies might examine how different consumer’s mindsets when grocery shopping may affect awareness of carbon labels. Additionally, further research could also examine the label features that attract attention in countries with higher levels of motivation and different frames of reference, such as Denmark and Switzerland, because these countries already have experience using carbon labels in the food industry.
Author Contributions
Conceptualization, C.V. and I.C.; methodology, V.L.; designing and conducting focus groups E.D., C.V., and V.L.; interview analysis, E.D. and I.C.; writing—original draft preparation, I.C. and V.L.; supervision, C.V.; project administration, E.D. All authors have read and agreed to the published version of the manuscripts.
Funding
This project was supported by a research grant awarded by the Chair of Environmental Ethics Fundación Tatiana Pérez de Guzmán El Bueno (Universidad de Alcalá).
Institutional Review Board Statement
Not applicable.
Informed Consent Statement
Informed consent was obtained from all subjects involved in the study.
Data Availability Statement
The data used to support the findings of this study are available from the corresponding author by request.
Acknowledgments
We gratefully acknowledge the support of Emilio Chuvieco in the labels design and the aid of Mario Burgui with the transcription of the recordings.
Conflicts of Interest
The authors declare no conflict of interest. The funders had no role in the design of the study; in the collection, analyses, or interpretation of data; in the writing of the manuscript, or in the decision to publish the results.
Appendix A

Table A1.
Interview guide.
| Part | Description |
|---|---|
| I | INTRODUCTION/PRESENTATION |
| Presentation of the interviewers and the study. Information on recording and confidentiality. Presentation of the participants | |
| II | WARM-UP: HABITS AND PURCHASING CRITERIA |
| Shopping habits | |
| |
| Ranking of purchase criteria | |
| |
| III | USE AND UNDERSTANDING OF FOOD LABELING |
| Awareness | |
| |
| Use | |
| |
| Understanding | |
| |
| Trust | |
| |
| IV | PRESENTATION OF THE BASIC LABEL |
Please take a couple of minutes and write down your ideas after seen this label.
| |
| V | INTRODUCTION TO ENVIRONMENTAL LABELING |
| Introduction | |
Now let us talk about the environment. Everyone says they care about the environment, but:
| |
| Carbon Footprint | |
A tool that is used to measure how much a product or person impacts on climate change is the carbon footprint:
| |
| VI | PRESENTATION OF THE STUDY AND LABELS PORTFOLIO |
Presentation of the goal of the study. Labels are shown one by one and same questions are made.
|
References
- European Commission. A Clean Planet for All. A European Strategic Long-Term Vision for a Prosperous, Modern, Competitive and Climate Neutral Economy. 2018. Available online: https://eur-lex.europa.eu/legal-content/EN/TXT/?uri=CELEX:52018DC0773 (accessed on 3 March 2020).
- 2IPCC. Climate Change and Land. 2019. Available online: https://www.ipcc.ch/site/assets/uploads/2019/08/4.-SPM_Approved_Microsite_FINAL.pdf (accessed on 3 March 2020).
- Rogelj, J.; Popp, A.; Calvin, K.V.; Luderer, G.; Emmerling, J.; Gernaat, D.; Fujimori, S.; Strefler, J.; Hasegawa, T.; Marangoni, G.; et al. Scenarios towards limiting global mean temperature increase below 1.5 °C. Nat. Clim. Chang. 2018, 8, 325–332. [Google Scholar] [CrossRef]
- De Boer, J.; De Witt, A.; Aiking, H. Help the climate, change your diet: A cross-sectional study on how to involve consumers in a transition to a low-carbon society. Appetite 2016, 98, 19–27. [Google Scholar] [CrossRef] [PubMed]
- Liu, T.; Wang, Q.; Su, B. A review of carbon labeling: Standards, implementation, and impact. Renew. Sustain. Energy Rev. 2016, 53, 68–79. [Google Scholar] [CrossRef]
- Brunner, F.; Kurz, V.; Bryngelsson, D.; Hedenus, F. Carbon label at a university restaurant—Label implementation and evaluation. Ecol. Econ. 2018, 146, 658–667. [Google Scholar] [CrossRef]
- Hornibrook, S.; May, C.; Fearne, A. Sustainable development and the consumer: Exploring the role of carbon labelling in retail supply chains. Bus. Strat. Environ. 2013, 24, 266–276. [Google Scholar] [CrossRef]
- Gadema, Z.; Oglethorpe, D. The use and usefulness of carbon labelling food: A policy perspective from a survey of UK supermarket shoppers. Food Policy 2011, 36, 815–822. [Google Scholar] [CrossRef]
- Upham, P.; Dendler, L.; Bleda, M. Carbon labelling of grocery products: Public perceptions and potential emissions reductions. J. Clean. Prod. 2011, 19, 348–355. [Google Scholar] [CrossRef]
- Hartikainen, H.; Roininen, T.; Katajajuuri, J.-M.; Pulkkinen, H. Finnish consumer perceptions of carbon footprints and carbon labelling of food products. J. Clean. Prod. 2014, 73, 285–293. [Google Scholar] [CrossRef]
- Gössling, S.; Buckley, R. Carbon labels in tourism: Persuasive communication? J. Clean. Prod. 2016, 111, 358–369. [Google Scholar] [CrossRef] [Green Version]
- Thøgersen, J.; Nielsen, K.S. A better carbon footprint label. J. Clean. Prod. 2016, 125, 86–94. [Google Scholar] [CrossRef] [Green Version]
- Cohen, M.A.; Viscusi, W.K. The role of information disclosure in climate mitigation policy. Clim. Chang. Econ. 2012, 3, 1–21. [Google Scholar] [CrossRef]
- Sammer, K.; Wüstenhagen, R. The influence of eco-labelling on consumer behaviour—Results of a discrete choice analysis for washing machines. Bus. Strat. Environ. 2006, 15, 185–199. [Google Scholar] [CrossRef] [Green Version]
- Shen, J.; Saijo, T. Does an energy efficiency label alter consumers’ purchasing decisions? A latent class approach based on a stated choice experiment in Shanghai. J. Environ. Manag. 2009, 90, 3561–3573. [Google Scholar] [CrossRef]
- Camilleri, A.R.; Larrick, R.P.; Hossain, S.; Patino-Echeverri, D. Consumers underestimate the emissions associated with food but are aided by labels. Nat. Clim. Chang. 2019, 9, 53–58. [Google Scholar] [CrossRef]
- Grunert, K.; Wills, J.M. A review of European research on consumer response to nutrition information on food labels. J. Public Health 2007, 15, 385–399. [Google Scholar] [CrossRef] [Green Version]
- Eldesouky, A.; Mesías, F.J.; Escribano, M. Perception of Spanish consumers towards environmentally friendly labelling in food. Int. J. Consum. Stud. 2019, 44, 64–76. [Google Scholar] [CrossRef]
- Röös, E.; Tjärnemo, H. Challenges of carbon labelling of food products: A consumer research perspective. Br. Food J. 2011, 113, 982–996. [Google Scholar] [CrossRef]
- Spaargaren, G.; Van Koppen, C.; Janssen, A.M.; Hendriksen, A.; Kolfschoten, C.J. Consumer responses to the carbon labelling of food: A real life experiment in a canteen practice. Sociol. Rural. 2013, 53, 432–453. [Google Scholar] [CrossRef]
- Meyerding, S.G.; Schaffmann, A.-L.; Lehberger, M. Consumer preferences for different designs of carbon footprint labelling on tomatoes in Germany—Does design matter? Sustainability 2019, 11, 1587. [Google Scholar] [CrossRef] [Green Version]
- Sharp, A.; Wheeler, M. Reducing householders’ grocery carbon emissions: Carbon literacy and carbon label preferences. Australas. Mark. J. (AMJ) 2013, 21, 240–249. [Google Scholar] [CrossRef]
- Banerjee, A.; Solomon, B.D. Eco-labeling for energy efficiency and sustainability: A meta-evaluation of US programs. Energy Policy 2003, 31, 109–123. [Google Scholar] [CrossRef]
- Grankvist, G.; Dahlstrand, U.; Biel, A. The impact of environmental labelling on consumer preference: Negative vs. positive labels. J. Consum. Policy 2004, 27, 213–230. [Google Scholar] [CrossRef]
- Redondo, R.; Martinez, C.V.; Bosch, I.C. The influence of social and environmental labels on purchasing: An information and systematic-heuristic processing approach. Innovate 2015, 25, 121. [Google Scholar] [CrossRef]
- Peschel, A.O.; Orquin, J.L.; Loose, S.M. Increasing consumers’ attention capture and food choice through bottom-up effects. Appetite 2019, 132, 1–7. [Google Scholar] [CrossRef]
- Van Loo, E.J.; Caputo, V.; Nayga, R.M.; Seo, H.-S.; Zhang, B.; Verbeke, W. Sustainability labels on coffee: Consumer preferences, willingness-to-pay and visual attention to attributes. Ecol. Econ. 2015, 118, 215–225. [Google Scholar] [CrossRef]
- Purmehdi, M.; Legoux, R.; Carrillat, F.A.; Sénécal, S. The effectiveness of warning labels for consumers: A meta-analytic investigation into their underlying process and contingencies. J. Public Policy Mark. 2017, 36, 36–53. [Google Scholar] [CrossRef]
- Vlaeminck, P.; Jiang, T.; Vranken, L. Food labeling and eco-friendly consumption: Experimental evidence from a Belgian supermarket. Ecol. Econ. 2014, 108, 180–190. [Google Scholar] [CrossRef]
- Strauss, A.; Corbin, J. Grounded Theory Methodology; SAGE Publications: Thousand Oaks, CA, USA, 1994; Volume 17. [Google Scholar]
- Wever, R.; Van Kuijk, J.; Boks, C. User-centred design for sustainable behaviour. Int. J. Sustain. Eng. 2008, 1, 9–20. [Google Scholar] [CrossRef]
- Blythe, M.; Wright, P.; McCarthy, J.; Bertelsen, O.W. Theory and method for experience centered design. In Proceedings of the CHI ‘06 Extended Abstracts on Human factors in Computing Systems, Montreal, QC, Canada, 22–27 April 2006; pp. 1691–1694. [Google Scholar] [CrossRef]
- Kwok, S.Y.; Harrison, D.; Malizia, A. Designing individualisation of eco information: A conceptual framework and design toolkit. Int. J. Sustain. Eng. 2017, 10, 302–312. [Google Scholar] [CrossRef]
- Wassink, I.; Kulyk, O.; Van Dijk, B.; Van Der Veer, G.C.; Van Der Vet, P. Applying a user-centered approach to interactive visualisation design. In Learning Representation for Multi-View Data Analysis; Springer Nature: Cham, Switzerland, 2008; pp. 175–199. [Google Scholar]
- CIS. Barómetro de Noviembre 2016. Estudio No. 3159. 2016. Available online: http://www.cis.es/cis/export/sites/default/-Archivos/Marginales/3140_3159/3159/Es3159mar.pdf (accessed on 5 March 2020).
- Grunert, K.G.; Hieke, S.; Wills, J. Sustainability labels on food products: Consumer motivation, understanding and use. Food Policy 2014, 44, 177–189. [Google Scholar] [CrossRef] [Green Version]
- Kimura, A.; Wada, Y.; Kamada, A.; Masuda, T.; Okamoto, M.; Goto, S.-I.; Tsuzuki, D.; Cai, D.; Oka, T.; Dan, I. Interactive effects of carbon footprint information and its accessibility on value and subjective qualities of food products. Appetite 2010, 55, 271–278. [Google Scholar] [CrossRef]
- Torma, G.; Aschemann-Witzel, J.; Thøgersen, J. I nudge myself: Exploring ‘self-nudging’ strategies to drive sustainable consumption behaviour. Int. J. Consum. Stud. 2017, 42, 141–154. [Google Scholar] [CrossRef]
- Grunert, K.G. Current issues in the understanding of consumer food choice. Trends Food Sci. Technol. 2002, 13, 275–285. [Google Scholar] [CrossRef]
- Nielsen. Battle of the Bulge and Nutrition Labels. Healthy Eating Trends Around the World. 2012. Available online: http://silvergroup.asia/wp-content/uploads/2012/02/Nielsen-Global-Food-Labeling-Report-Jan2012.pdf (accessed on 3 March 2020).
- Goetzke, B.; Nitzko, S.; Spiller, A. Consumption of organic and functional food. A matter of well-being and health? Appetite 2014, 77, 96–105. [Google Scholar] [CrossRef] [PubMed]
- Petrescu, D.C.; Petrescu-Mag, R.M. Organic food perception: Fad, or healthy and environmentally friendly? A case on Romanian consumers. Sustainability 2015, 7, 12017–12031. [Google Scholar] [CrossRef] [Green Version]
- Wier, M.; Jensen, K.O.; Andersen, L.M.; Millock, K. The character of demand in mature organic food markets: Great Britain and Denmark compared. Food Policy 2008, 33, 406–421. [Google Scholar] [CrossRef] [Green Version]
- Ministerio Agricultura, Alimentación y Medio Ambiente. Caracterización de Compradores de Productos Ecológicos en Canal Especializado. Available online: https://www.mapa.gob.es/es/alimentacion/temas/produccion-eco/estudiocaracterizacioncomercializacioncanalesventaespecializados_tcm30-379455.pdf (accessed on 13 March 2020).
- Wogalter, M.S.; Conzola, V.C.; Smith-Jackson, T.L. Research-based guidelines for warning design and evaluation. Appl. Ergon. 2002, 33, 219–230. [Google Scholar] [CrossRef]
- Aertsens, J.; Mondelaers, K.; Verbeke, W.; Buysse, J.; Van Huylenbroeck, G. The influence of subjective and objective knowledge on attitude, motivations and consumption of organic food. Br. Food J. 2011, 113, 1353–1378. [Google Scholar] [CrossRef]
- Chen, J.; Lobo, A. Organic food products in China: Determinants of consumers’ purchase intentions. Int. Rev. Retail Distrib. Consum. Res. 2012, 22, 293–314. [Google Scholar] [CrossRef]
- Quack, D.; Grießhammer, R.; Teufel, J. Requirements on Consumer Information about Product Carbon Footprint; Final Report; Commissioned by ANEC, the European Consumer Voice in Standardisation; AISBL: Brussels, Belgium, 2010; Available online: http://www.anec.eu/attachments/ANEC-R&T-2010-ENV-001final.pdf (accessed on 6 April 2020).
- Bzostek, J.A.; Wogalter, M.S. Measuring visual search time for a product warning label as a function of icon, color, column and vertical placement. In Proceedings of the Human Factors and Ergonomics Society Annual Meeting, Houston, TX, USA, 27 September–1 October 1999; SAGE Publications: Thousand Oaks, CA, USA, 1999; Volume 43, pp. 888–892. [Google Scholar]
- Laughery, K.R.; Vaubel, K.P.; Young, S.L.; Brelsford, J.W.; Rowe, A.L. Explicitness of consequence information in warnings. Saf. Sci. 1993, 16, 597–613. [Google Scholar] [CrossRef]
- Young, S.; Lovvoll, D.R. Intermediate Processing Stages: Methodological Considerations for Research on Warnings; Taylor & Francis: London, UK, 1999. [Google Scholar]
- Argo, J.J.; Main, K.J. Meta-analyses of the effectiveness of warning labels. J. Public Policy Mark. 2004, 23, 193–208. [Google Scholar] [CrossRef]
- Farooq, M.U.; Shahzad, U.; Sarwar, S.; Zaijun, L. The impact of carbon emission and forest activities on health outcomes: Empirical evidence from China. Environ. Sci. Pollut. Res. 2019, 26, 12894–12906. [Google Scholar] [CrossRef] [PubMed]
- Krause, R.M. Developing conditions for environmentally sustainable consumption: Drawing insight from anti-smoking policy. Int. J. Consum. Stud. 2009, 33, 285–292. [Google Scholar] [CrossRef]
- Laughery, K.R.; Young, S.L. An eye scan analysis of accessing product warning information. In Proceedings of the Human Factors Society Annual Meeting, San Francisco, CA, USA, 2–6 September 1991; Human Factors and Ergonomics Society: Santa Monica, CA, USA, 1991; Volume 35, pp. 585–589. [Google Scholar]
- Wogalter, M.S.; Desaulniers, D.R.; Brelsford, J.W. Consumer products: How are the hazards perceived? In Proceedings of the Human Factors Society Annual Meeting, New York, NY, USA, 19–22 October 1987; SAGE Publications: Thousand Oaks, CA, USA, 1987; Volume 31, pp. 615–619. [Google Scholar]
- Limnios, E.M.; Schilizzi, S.G.; Burton, M.; Ong, A.; Hynes, N. Willingness to pay for product ecological footprint: Organic vs non-organic consumers. Technol. Forecast. Soc. Chang. 2016, 111, 338–348. [Google Scholar] [CrossRef]
- Horne, R.E. Limits to labels: The role of eco-labels in the assessment of product sustainability and routes to sustainable consumption. Int. J. Consum. Stud. 2009, 33, 175–182. [Google Scholar] [CrossRef]
- McEachern, M.G.; Warnaby, G. Exploring the relationship between consumer knowledge and purchase behaviour of value-based labels. Int. J. Consum. Stud. 2008, 32, 414–426. [Google Scholar] [CrossRef]
- Heinzle, S.L.; Wüstenhagen, R. Dynamic adjustment of eco-labeling schemes and consumer choice—The revision of the EU energy label as a missed opportunity? Bus. Strat. Environ. 2011, 21, 60–70. [Google Scholar] [CrossRef] [Green Version]
- Wolfe, R.; Baddeley, S.; Cheng, P. Trade policy implications of carbon labels on food. Estey Cent. J. Int. Law Trade Policy 2012, 13, 59–93. Available online: http://ageconsearch.umn.edu/record/121942/files/baddeleychengwolfe13-1.pdf (accessed on 3 March 2020). [CrossRef]
Figure 1.
Pool of labels.

Table 1.
Description of participants. FG: focus group.
| Group | Age | Level of Education | Gender |
|---|---|---|---|
| FG1 | 18 to 35 years old | No university studies | 50% women |
| FG2 | 18 to 35 years old | University studies | 50% women |
| FG3 | 36 to 50 years old | No university studies | 50% women |
| FG4 | 36 to 50 years old | University studies | 50% women |
| FG5 | 51 up to 70 years old | Low-medium/low socioeconomic status | 70% women |
Publisher’s Note: MDPI stays neutral with regard to jurisdictional claims in published maps and institutional affiliations. |
© 2021 by the authors. Licensee MDPI, Basel, Switzerland. This article is an open access article distributed under the terms and conditions of the Creative Commons Attribution (CC BY) license (http://creativecommons.org/licenses/by/4.0/).
Share and Cite
MDPI and ACS Style
Carrero, I.; Valor, C.; Díaz, E.; Labajo, V. Designed to Be Noticed: A Reconceptualization of Carbon Food Labels as Warning Labels. Sustainability 2021, 13, 1581. https://0-doi-org.brum.beds.ac.uk/10.3390/su13031581
AMA Style
Carrero I, Valor C, Díaz E, Labajo V. Designed to Be Noticed: A Reconceptualization of Carbon Food Labels as Warning Labels. Sustainability. 2021; 13(3):1581. https://0-doi-org.brum.beds.ac.uk/10.3390/su13031581
Chicago/Turabian StyleCarrero, Isabel, Carmen Valor, Estela Díaz, and Victoria Labajo. 2021. "Designed to Be Noticed: A Reconceptualization of Carbon Food Labels as Warning Labels" Sustainability 13, no. 3: 1581. https://0-doi-org.brum.beds.ac.uk/10.3390/su13031581
Note that from the first issue of 2016, this journal uses article numbers instead of page numbers. See further details here.